World Sorghum Market - Global Grain Events Altuna, Toepfer, Sorghum.pdf · World Sorghum Market ......
18
World Sorghum Market Assessing the rapid growth of this market particularly in China · What is sorghum being used for? · Where are the main origins? · How big can this market get in the next few years?
-
Upload
hoangnguyet -
Category
Documents
-
view
216 -
download
2
Transcript of World Sorghum Market - Global Grain Events Altuna, Toepfer, Sorghum.pdf · World Sorghum Market ......
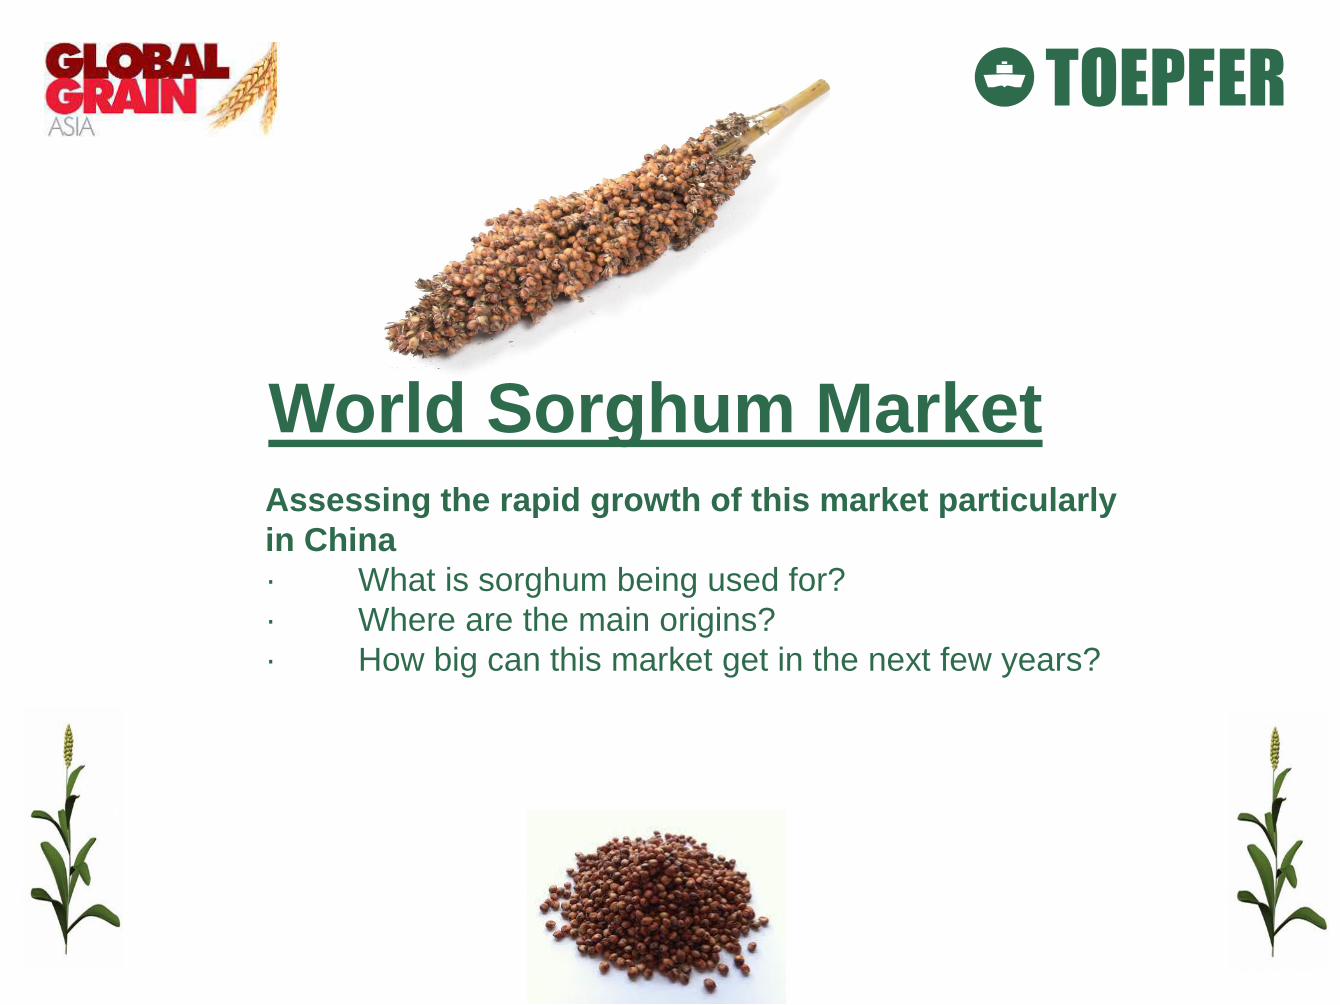
World Sorghum Market
Assessing the rapid growth of this market particularly
in China
· What is sorghum being used for?
· Where are the main origins?
· How big can this market get in the next few years?
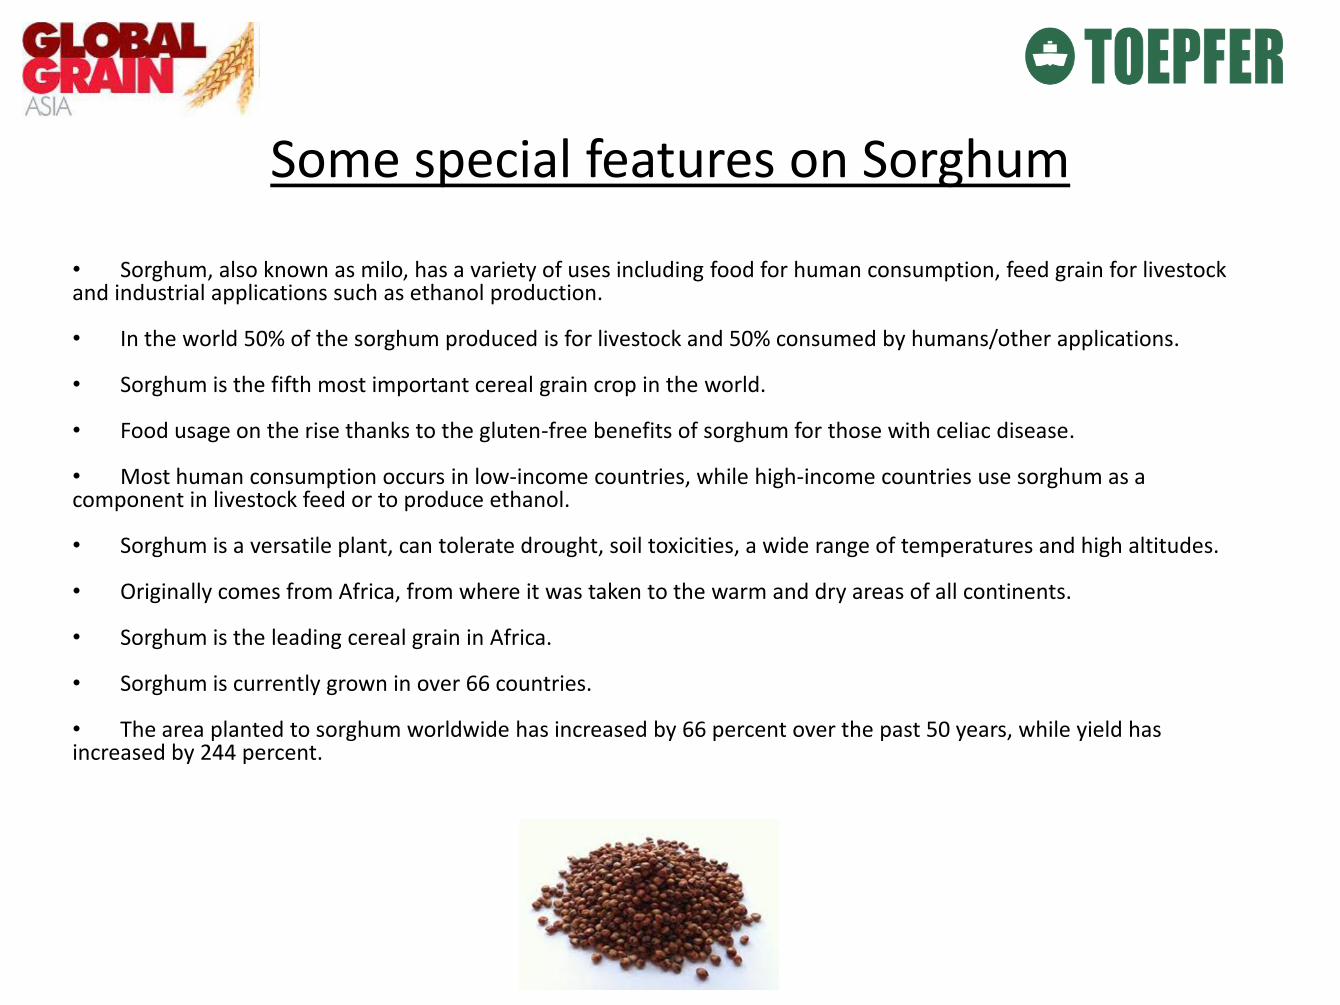
Some special features on Sorghum
• Sorghum, also known as milo, has a variety of uses including food for human consumption, feed grain for livestock and industrial applications such as ethanol production. • In the world 50% of the sorghum produced is for livestock and 50% consumed by humans/other applications.
• Sorghum is the fifth most important cereal grain crop in the world.
• Food usage on the rise thanks to the gluten-free benefits of sorghum for those with celiac disease. • Most human consumption occurs in low-income countries, while high-income countries use sorghum as a component in livestock feed or to produce ethanol. • Sorghum is a versatile plant, can tolerate drought, soil toxicities, a wide range of temperatures and high altitudes. • Originally comes from Africa, from where it was taken to the warm and dry areas of all continents. • Sorghum is the leading cereal grain in Africa. • Sorghum is currently grown in over 66 countries. • The area planted to sorghum worldwide has increased by 66 percent over the past 50 years, while yield has increased by 244 percent.
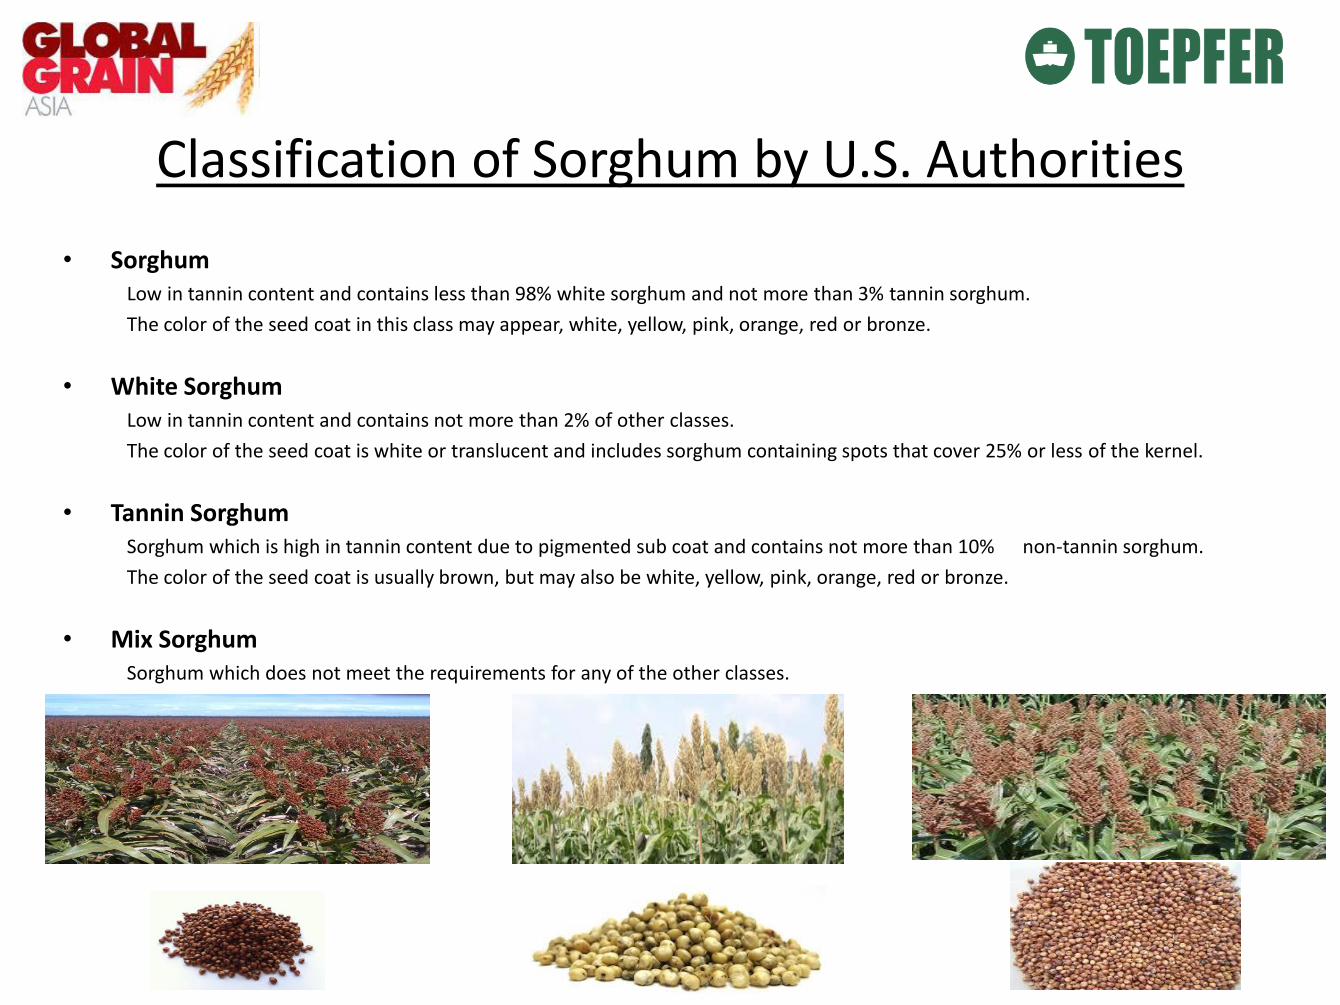
Classification of Sorghum by U.S. Authorities
• Sorghum Low in tannin content and contains less than 98% white sorghum and not more than 3% tannin sorghum.
The color of the seed coat in this class may appear, white, yellow, pink, orange, red or bronze.
• White Sorghum Low in tannin content and contains not more than 2% of other classes.
The color of the seed coat is white or translucent and includes sorghum containing spots that cover 25% or less of the kernel.
• Tannin Sorghum Sorghum which is high in tannin content due to pigmented sub coat and contains not more than 10% non-tannin sorghum.
The color of the seed coat is usually brown, but may also be white, yellow, pink, orange, red or bronze.
• Mix Sorghum Sorghum which does not meet the requirements for any of the other classes.
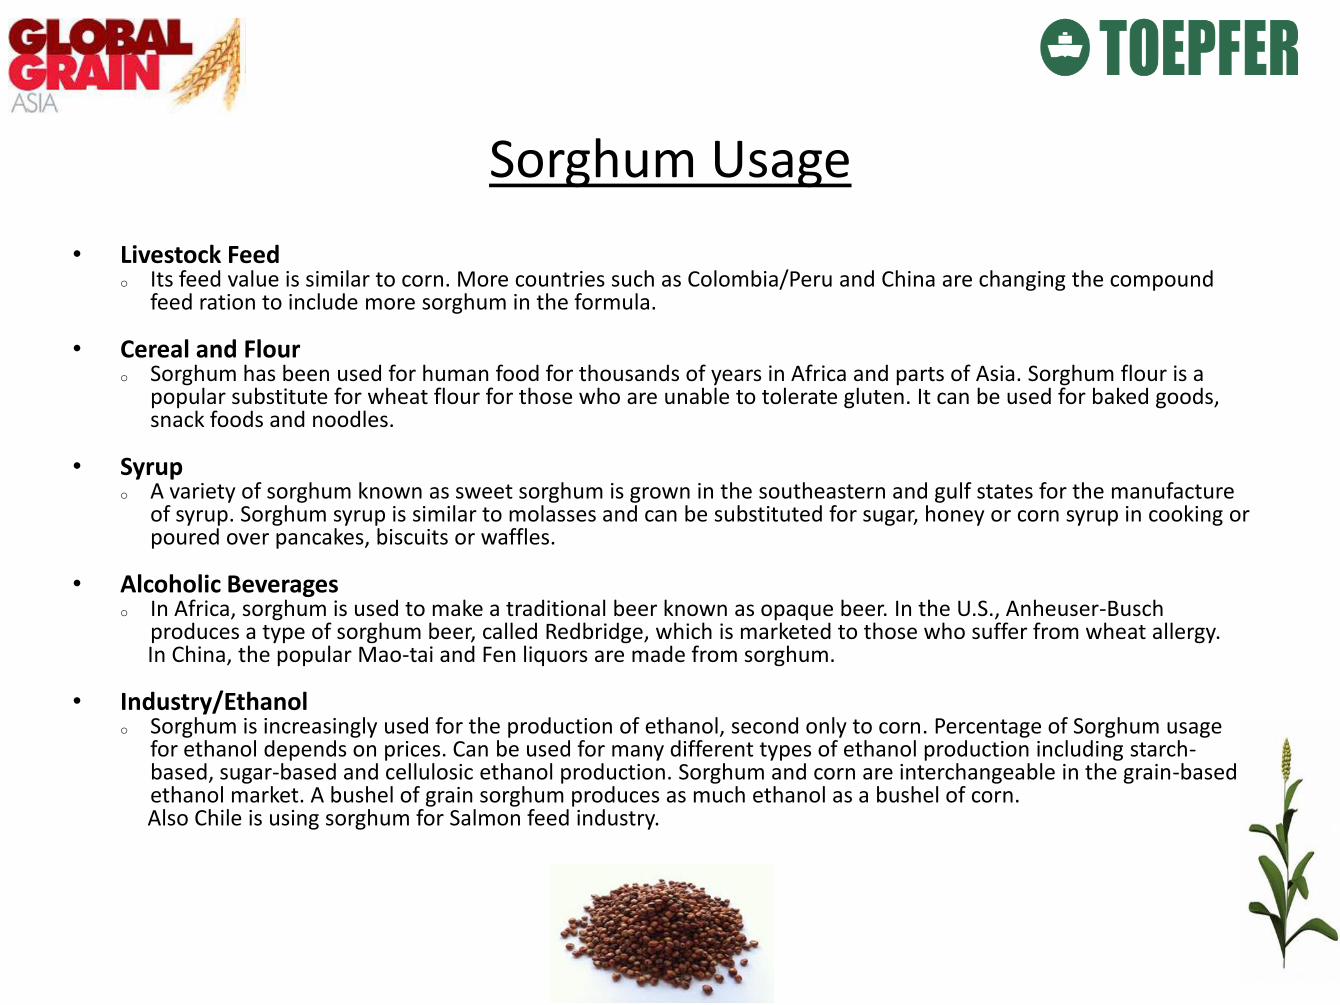
Sorghum Usage
• Livestock Feed o Its feed value is similar to corn. More countries such as Colombia/Peru and China are changing the compound
feed ration to include more sorghum in the formula.
• Cereal and Flour o Sorghum has been used for human food for thousands of years in Africa and parts of Asia. Sorghum flour is a
popular substitute for wheat flour for those who are unable to tolerate gluten. It can be used for baked goods, snack foods and noodles.
• Syrup o A variety of sorghum known as sweet sorghum is grown in the southeastern and gulf states for the manufacture
of syrup. Sorghum syrup is similar to molasses and can be substituted for sugar, honey or corn syrup in cooking or poured over pancakes, biscuits or waffles.
• Alcoholic Beverages o In Africa, sorghum is used to make a traditional beer known as opaque beer. In the U.S., Anheuser-Busch
produces a type of sorghum beer, called Redbridge, which is marketed to those who suffer from wheat allergy. In China, the popular Mao-tai and Fen liquors are made from sorghum.
• Industry/Ethanol
o Sorghum is increasingly used for the production of ethanol, second only to corn. Percentage of Sorghum usage for ethanol depends on prices. Can be used for many different types of ethanol production including starch-based, sugar-based and cellulosic ethanol production. Sorghum and corn are interchangeable in the grain-based ethanol market. A bushel of grain sorghum produces as much ethanol as a bushel of corn.
Also Chile is using sorghum for Salmon feed industry.
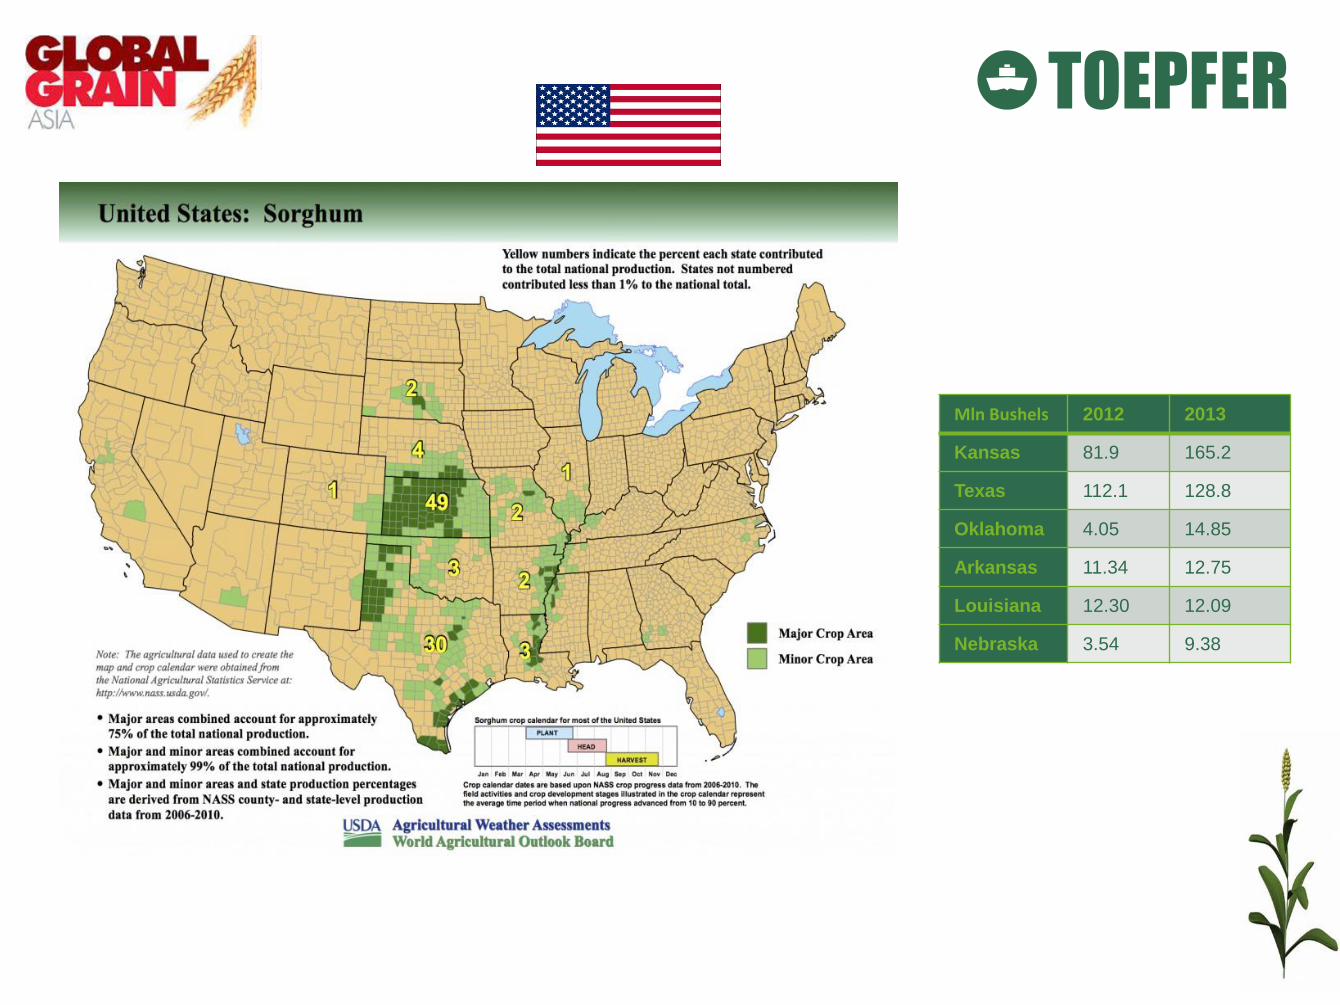
Mln Bushels 2012 2013
Kansas 81.9 165.2
Texas 112.1 128.8
Oklahoma 4.05 14.85
Arkansas 11.34 12.75
Louisiana 12.30 12.09
Nebraska 3.54 9.38
US Sorghum
• Areas planted o Historically, Kansas and Texas have been the top two sorghum-producing states. In 2012 the two states retained
their ranking as leading producers but switched places, harvesting 79 percent of the U.S. sorghum crop.
• Quality o U.S. #2 standard: o TW min 71 kg/hl o Damaged - max 5% (of which heat damage max 0.5%) o Broken - max 6% o Tannin-max 0.3%
• Logistics o Almost 99% of exports take place from Gulf (Galveston / Corpus Christi and Miss). Very limited sorghum goes
through West cost.
• Usage o Most of them is used for feeding livestock but also for ethanol industry demand is increasing, human
consumption in limited.
• Main destinations o Historically main destination was Mexico but in the last years African countries increased participation and
specially last year China was the first destination in the ranking. Chinese demand changed the S&D in US on sorghum because of quantity and also price involved. With the rally on International sorghum prices Mexico and other destinations switch consumption to other cheaper commodities.
• Potential o Acreage was almost unchanged during last years despite of this campaign US harvested this year the biggest crop in many year. Chinese demand will drive US potentiality, if China remains buying US sorghum prices would be very attractive for farmers to increase acreage.
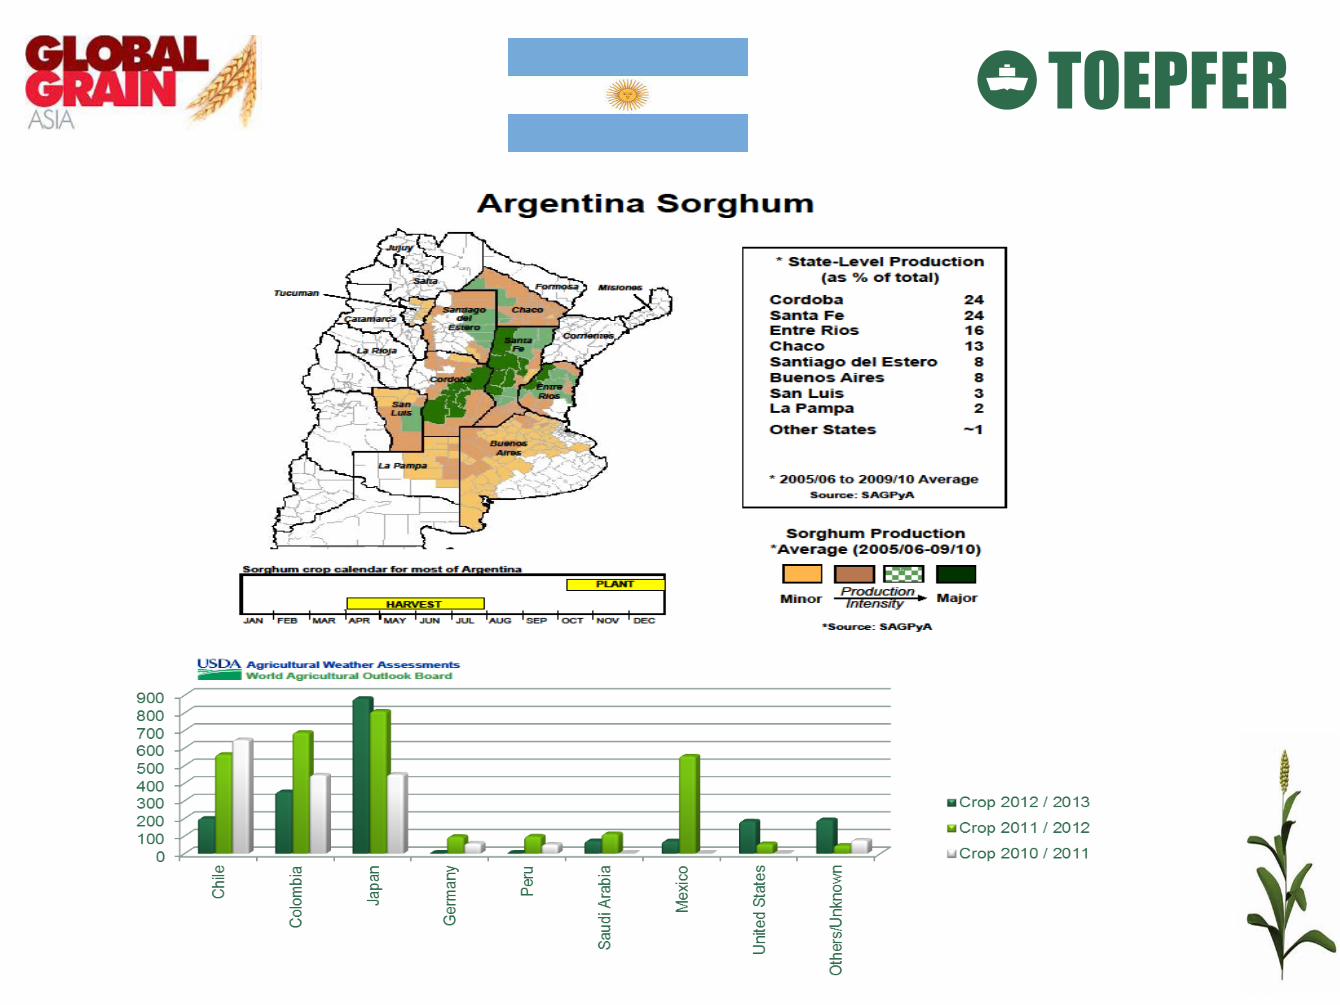
Argentine Sorghum
• Area planted o Sorghum seeding is located in northern crop area, where soil has less water reserves and rains accumulated.
• Quality
o Argentine sorghum nbr 2 specs below:- o Moisture – 15% max. o Damaged – 2% max. o F.Material - 3% max. o Broken – 5% max. o Tannin content max 1%
• Logistics
o Geographically Argentine sorghum exports are located in up river area, around 98% of exports are done through Rosario area. Only parcels are shipped in the south (Bahia Blanca).
• Usage o Compound feed is the main usage of this commodity. No usage for Ethanol industry for time being.
• Main destinations
o The sorghum trade is completely deregulated, no export quota but 20% export tax. Main destination Japan, Colombia/Peru exports jumped in last years. Chile use sorghum for Salmon industry. China and Argentina are under negotiations for Phytosanitary protocol which would be approved mid this year.
• Potential
o Acreage of 1mln ha has been stable during last years but farmers are considering to increase the acreage due to the fact is a non-regulated commodity and prices are very close to corn with much less investment needed.
If China approves Argentine sorghum local mkt would have a dramatic change but need to see what happen with other destinations such as Japan/Peru/Colombia.
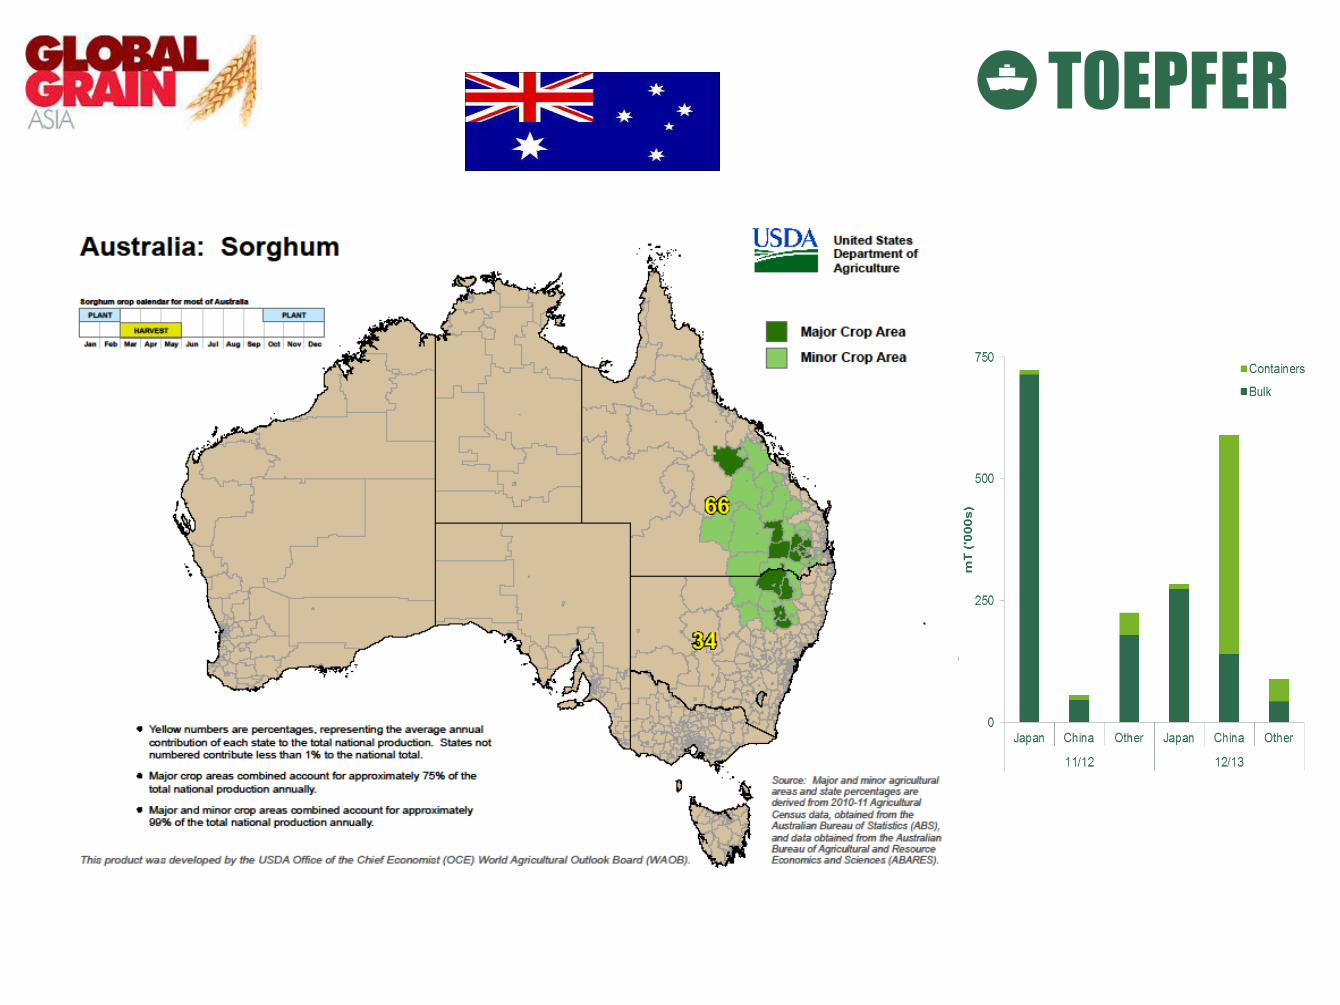
Australian Sorghum
• Area Planted o Almost 90% of the area is located in south Queensland/north New South Gales states.
• Quality o SORG 1 quality specs are as per GTA CSG-1, with the main receivable specs below:- o Moisture – 13.5% max. o Test weight – 71kg/hl min. o Screenings – 11% max. o Total Admixture (incl screenings, foreign material and trash) – 11% max. o Tannin content max 0.30%
• Usage o Domestic sorghum demand mainly derives from the poultry and beef industry. There is also some demand from
the biofuel industry, although this may not be a long-term demand point.
• Logistics o Almost all logistics done though BRISBANE/GEELONG/GLADSTNE/MACKAY/NEWCSTLE/PTKEMBLA.
• Main destinations o In a ‘normal year’ of 2-2.5mmT production, demand 50% from domestic consumers and 50% export homes. o The main export destinations are Japan, China (only in the last 2 years) and small volume to New Zealand.
• Potential
o Don’t have big potential on acreage increase, this campaign will be the lowest in many years due to dryness.
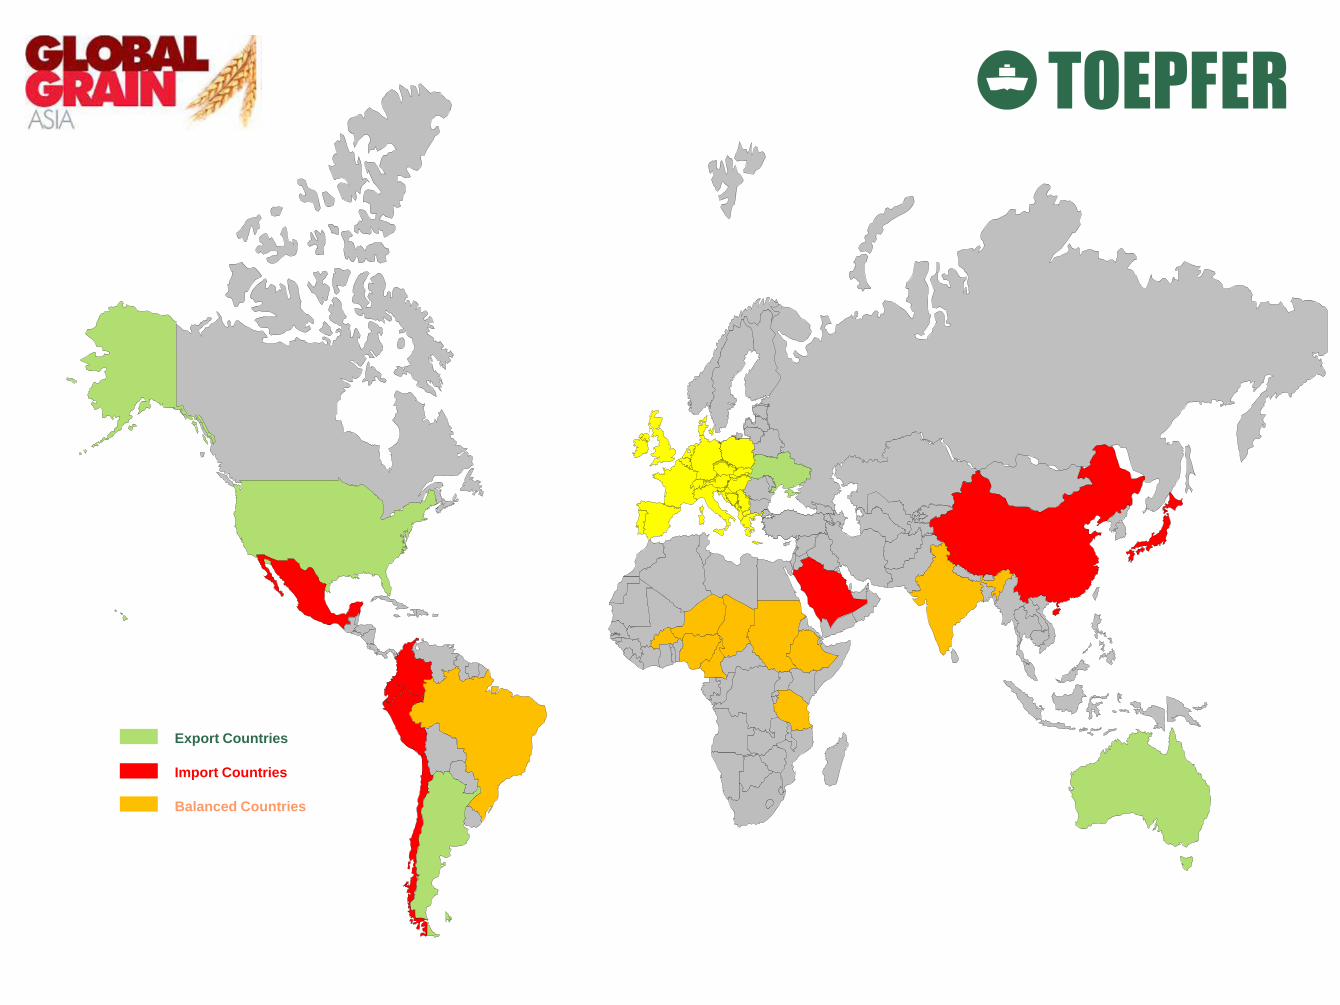
Export Countries
Import Countries
Balanced Countries
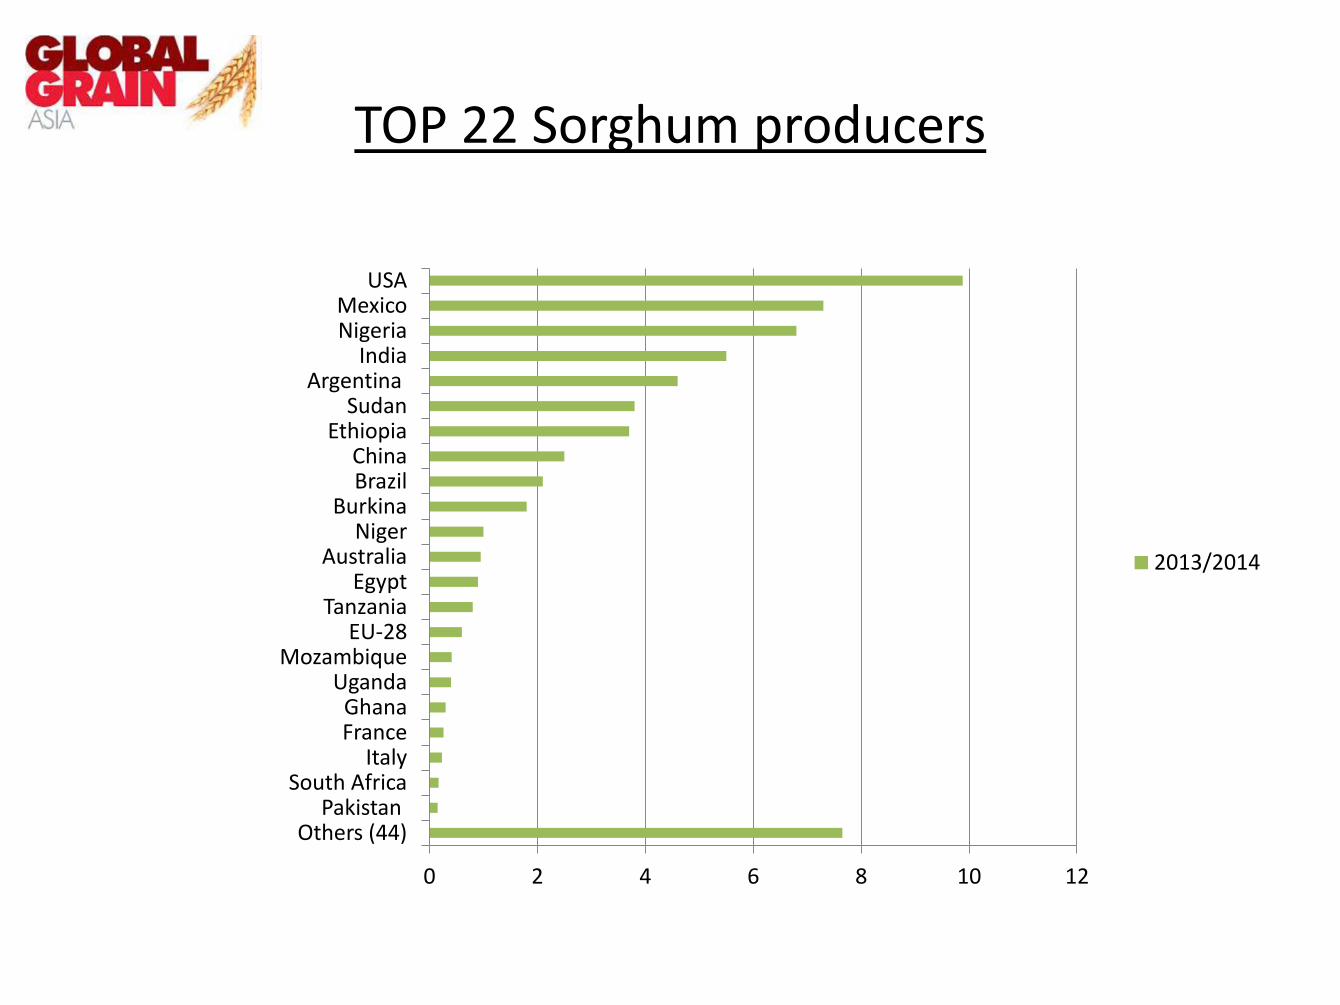
TOP 22 Sorghum producers
0 2 4 6 8 10 12
Others (44) Pakistan
South Africa Italy
France Ghana
Uganda Mozambique
EU-28 Tanzania
Egypt Australia
Niger Burkina
Brazil China
Ethiopia Sudan
Argentina India
Nigeria Mexico
USA
2013/2014
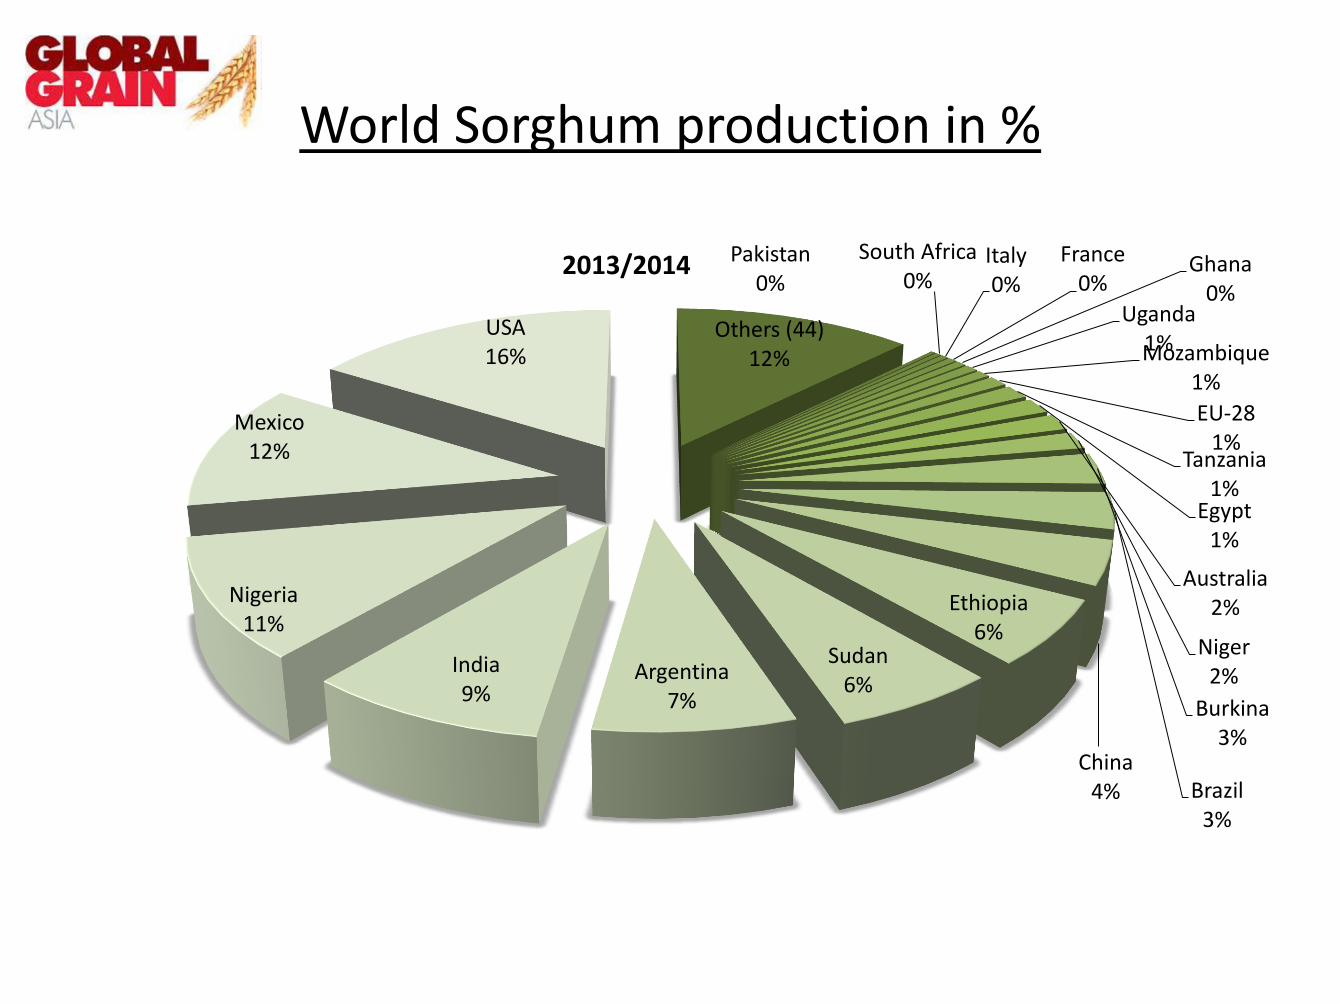
World Sorghum production in %
Others (44) 12%
Pakistan 0%
South Africa 0%
Italy 0%
France 0%
Ghana 0%
Uganda 1% Mozambique
1%
EU-28 1%
Tanzania 1%
Egypt 1%
Australia 2%
Niger 2%
Burkina 3%
Brazil 3%
China 4%
Ethiopia 6%
Sudan 6%
Argentina 7%
India 9%
Nigeria 11%
Mexico 12%
USA 16%
2013/2014
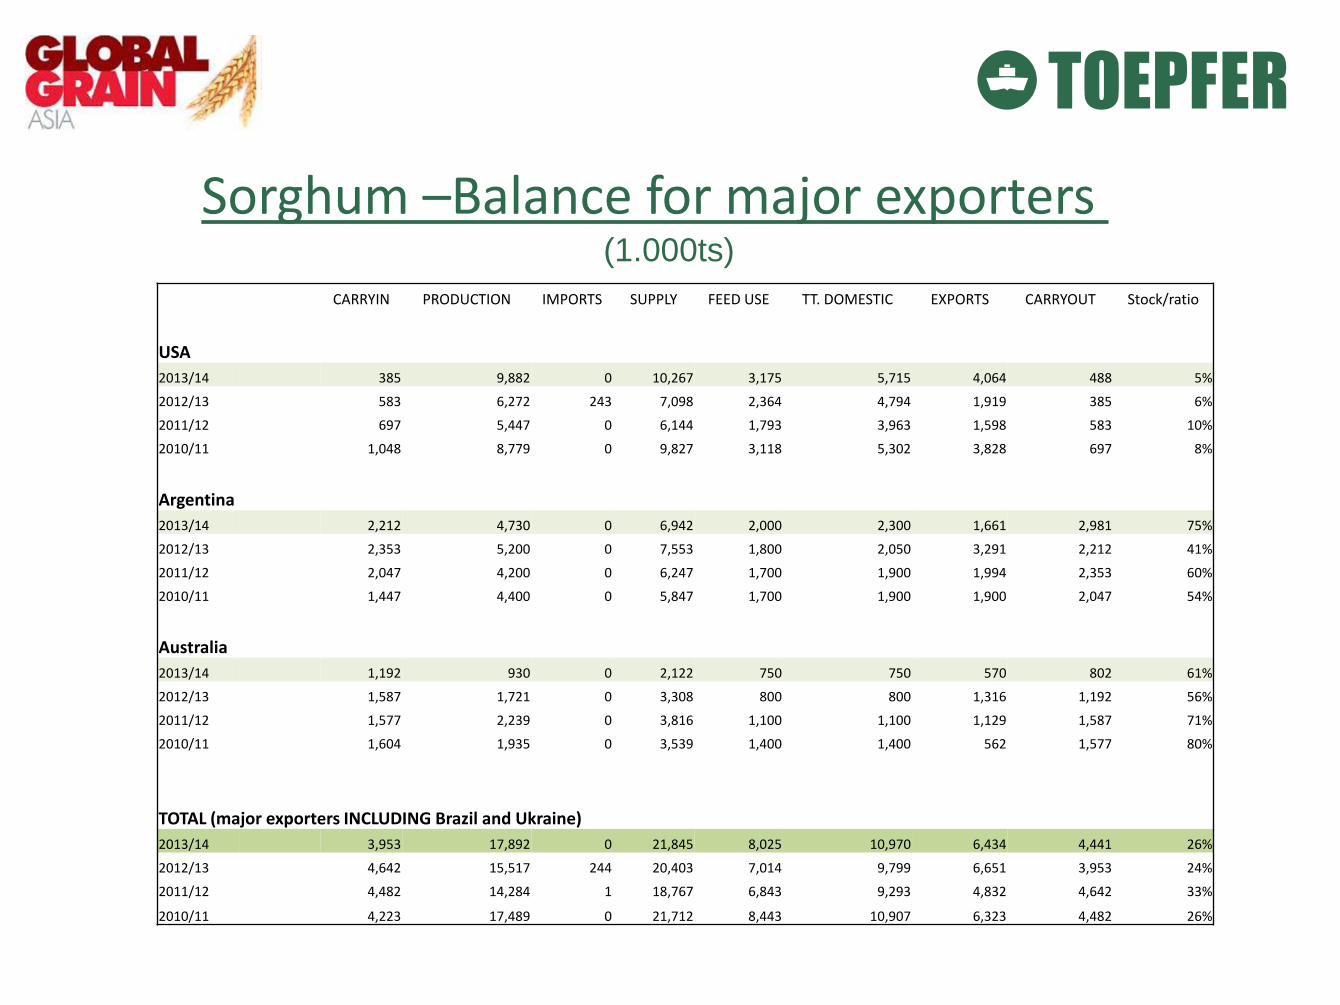
Sorghum –Balance for major exporters (1.000ts)
CARRYIN PRODUCTION IMPORTS SUPPLY FEED USE TT. DOMESTIC EXPORTS CARRYOUT Stock/ratio
USA
2013/14 385 9,882 0 10,267 3,175 5,715 4,064 488 5%
2012/13 583 6,272 243 7,098 2,364 4,794 1,919 385 6%
2011/12 697 5,447 0 6,144 1,793 3,963 1,598 583 10%
2010/11 1,048 8,779 0 9,827 3,118 5,302 3,828 697 8%
Argentina
2013/14 2,212 4,730 0 6,942 2,000 2,300 1,661 2,981 75%
2012/13 2,353 5,200 0 7,553 1,800 2,050 3,291 2,212 41%
2011/12 2,047 4,200 0 6,247 1,700 1,900 1,994 2,353 60%
2010/11 1,447 4,400 0 5,847 1,700 1,900 1,900 2,047 54%
Australia
2013/14 1,192 930 0 2,122 750 750 570 802 61%
2012/13 1,587 1,721 0 3,308 800 800 1,316 1,192 56%
2011/12 1,577 2,239 0 3,816 1,100 1,100 1,129 1,587 71%
2010/11 1,604 1,935 0 3,539 1,400 1,400 562 1,577 80%
TOTAL (major exporters INCLUDING Brazil and Ukraine)
2013/14 3,953 17,892 0 21,845 8,025 10,970 6,434 4,441 26%
2012/13 4,642 15,517 244 20,403 7,014 9,799 6,651 3,953 24%
2011/12 4,482 14,284 1 18,767 6,843 9,293 4,832 4,642 33%
2010/11 4,223 17,489 0 21,712 8,443 10,907 6,323 4,482 26%
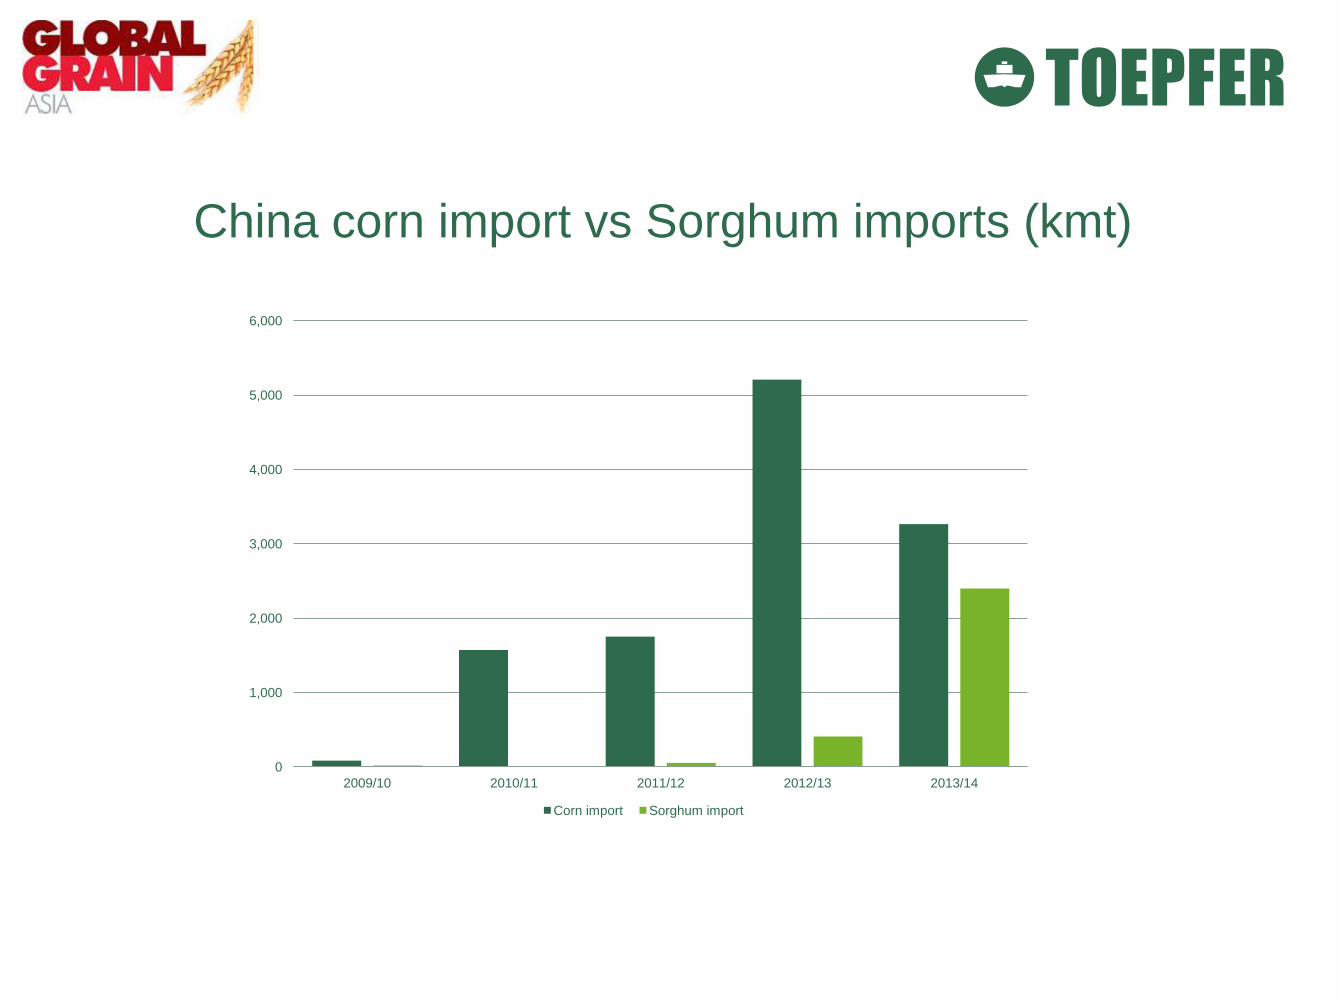
China corn import vs Sorghum imports (kmt)
0
1,000
2,000
3,000
4,000
5,000
6,000
2009/10 2010/11 2011/12 2012/13 2013/14
Corn import Sorghum import
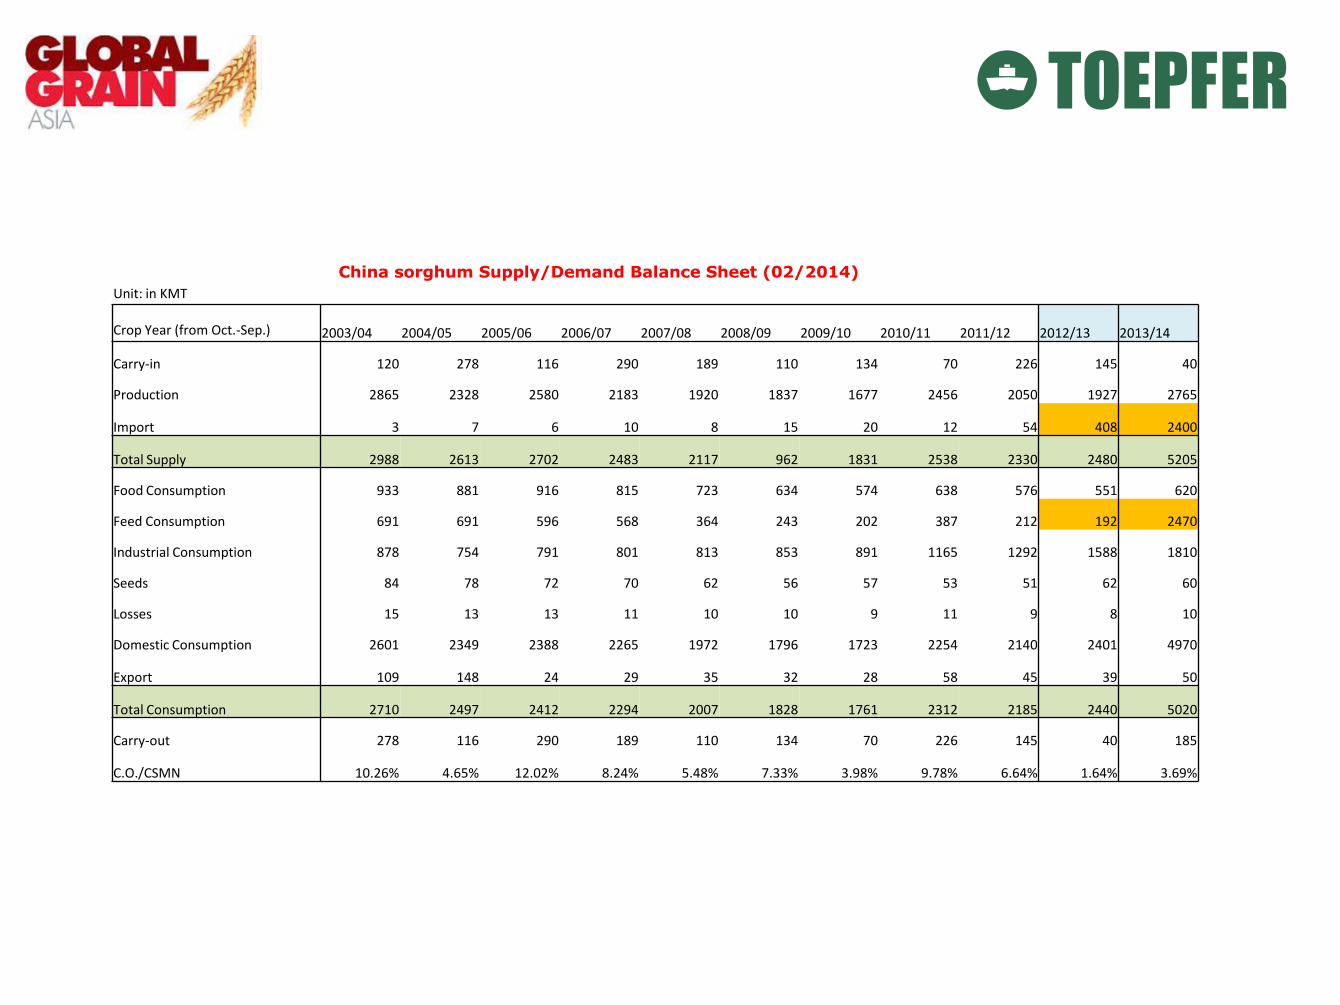
Unit: in KMT
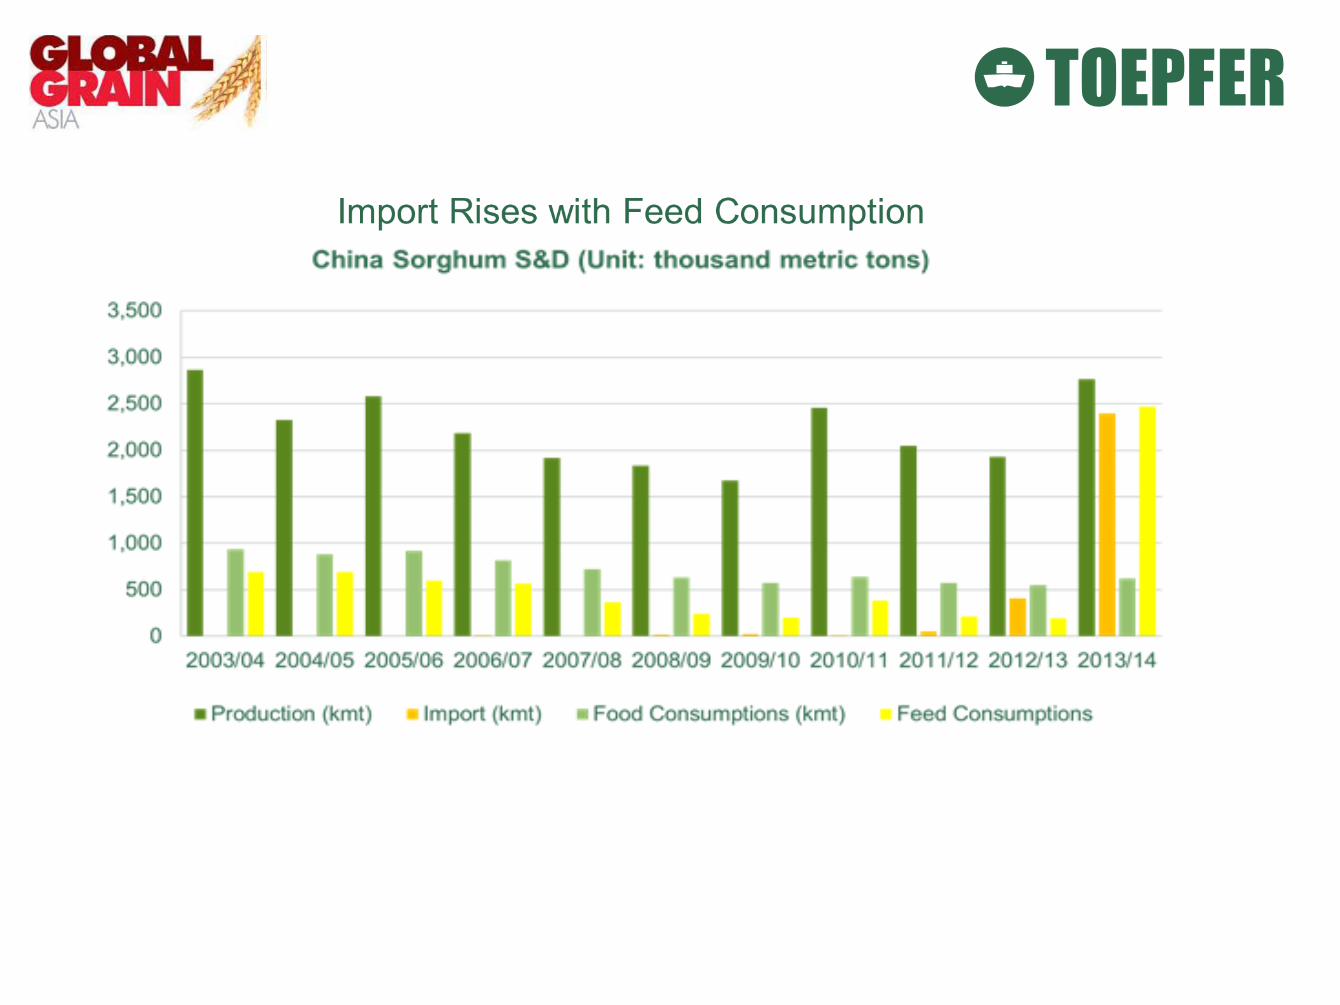
Crop Year (from Oct.-Sep.) 2003/04 2004/05 2005/06 2006/07 2007/08 2008/09 2009/10 2010/11 2011/12 2012/13 2013/14
Carry-in 120 278 116 290 189 110 134 70 226 145 40
Production 2865 2328 2580 2183 1920 1837 1677 2456 2050 1927 2765
Import 3 7 6 10 8 15 20 12 54 408 2400
Total Supply 2988 2613 2702 2483 2117 962 1831 2538 2330 2480 5205
Food Consumption 933 881 916 815 723 634 574 638 576 551 620
Feed Consumption 691 691 596 568 364 243 202 387 212 192 2470
Industrial Consumption 878 754 791 801 813 853 891 1165 1292 1588 1810
Seeds 84 78 72 70 62 56 57 53 51 62 60
Losses 15 13 13 11 10 10 9 11 9 8 10
Domestic Consumption 2601 2349 2388 2265 1972 1796 1723 2254 2140 2401 4970
Export 109 148 24 29 35 32 28 58 45 39 50
Total Consumption 2710 2497 2412 2294 2007 1828 1761 2312 2185 2440 5020
Carry-out 278 116 290 189 110 134 70 226 145 40 185
C.O./CSMN 10.26% 4.65% 12.02% 8.24% 5.48% 7.33% 3.98% 9.78% 6.64% 1.64% 3.69%
China sorghum Supply/Demand Balance Sheet (02/2014)
Final conclusions / Mkt View
• Supply
o Sorghum has huge potential acreage increase mainly in Argentina/US if prices continues supported as today. o If China/Argentina sign agreement on Sorghum local prices will jump and farmers would increase acreage. o US also shows some increase of acreages because of higher local prices. o Australia acreage increase is limited.
• Demand
o Chinese demand changed the S&D dramatically and will drive the mkt in the coming campaigns, reasons were 3: 1) Huge difference between sorghum import price vs local crop 2) Sorghum is NO-GMO stem (corn MIR162 issue). 3) China has NO IMPORT QUOTA on sorghum. o We expect demand for campaign 14/15 in China would be above 3mln ts, always if local crops remains
unchanged (could be more). o Due to high prices others destinations switched sorghum demand to others products such as corn
(Mexico/Colombia/Japan). o Question is if Chinese demand increase will compensate the drop on usage from others destinations. o Ethanol demand is also increasing in US and also China is considering to import more sorghum for Ethanol. o Don’t see any impact for countries that use Sorghum for food as they are self-sufficient (African Countries).
Thank you very much for your attention
Pablo Altuna Senior Group Manager Grains department – Toepfer International Asia Pte. Ltd.