World Political Map from : Color and line are used to represent political boundaries.
51
World Political Map from www.atlapedia.com: World Political Map from www.atlapedia.com: Color and line are used to represent political boundaries Color and line are used to represent political boundaries
-
date post
20-Dec-2015 -
Category
Documents
-
view
214 -
download
0
Transcript of World Political Map from : Color and line are used to represent political boundaries.

World Political Map from www.atlapedia.com:World Political Map from www.atlapedia.com:Color and line are used to represent political boundariesColor and line are used to represent political boundaries

PhysicalPhysical Map from www.atlapedia.com:Map from www.atlapedia.com:
3D3D contour and color indicates major landformscontour and color indicates major landforms

HistoricalHistorical ClimateClimate Map:Map:
Showing bodies of water and ice forms.Showing bodies of water and ice forms.

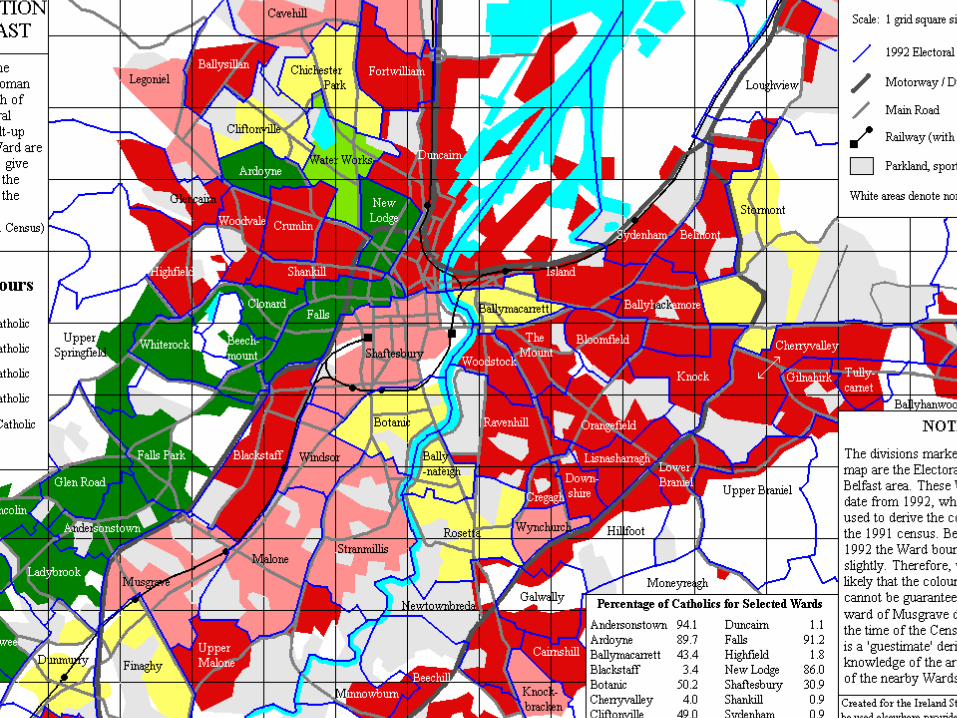
Antique PopulationAntique Population DistributionDistribution Map:Map:State and County boundaries drawn in and color coded by population range.State and County boundaries drawn in and color coded by population range.

TopographicalTopographical Map:Map:
Contour lines indicate changes in elevationContour lines indicate changes in elevation

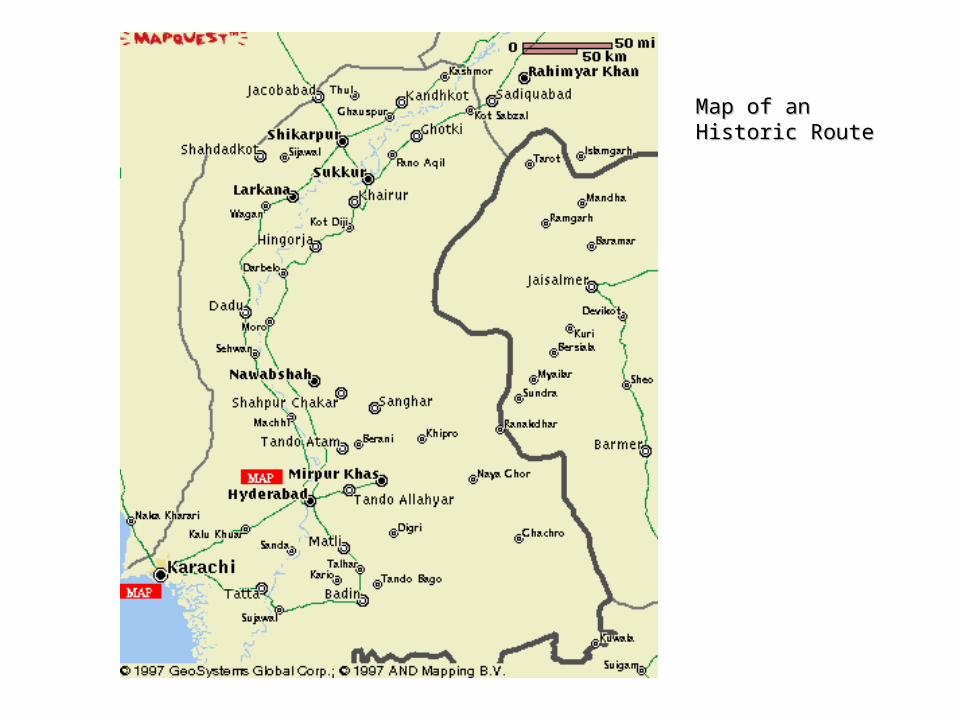
Map of an Historic Map of an Historic RouteRoute

KeyKey forfor MapMap ofof aa FictionalFictional Place:Place:
From a Tony Hillerman detective novel that takes place in the Southwest.From a Tony Hillerman detective novel that takes place in the Southwest.

Simple Timelines:Simple Timelines: MappingMapping EventsEvents OverOver TimeTime

SimultaneousSimultaneous SubjectSubject Timeline:Timeline:
This format allows the viewer to scan all of the major world leaders over time.This format allows the viewer to scan all of the major world leaders over time.

MappingMapping a Project Plan:a Project Plan:This schematic represents work flow and a timeline of events for a video game design teamThis schematic represents work flow and a timeline of events for a video game design team

MapsMaps ofof OrganizationalOrganizational Structure:Structure:This map shows the overlap of function of divisions within an organization.This map shows the overlap of function of divisions within an organization.
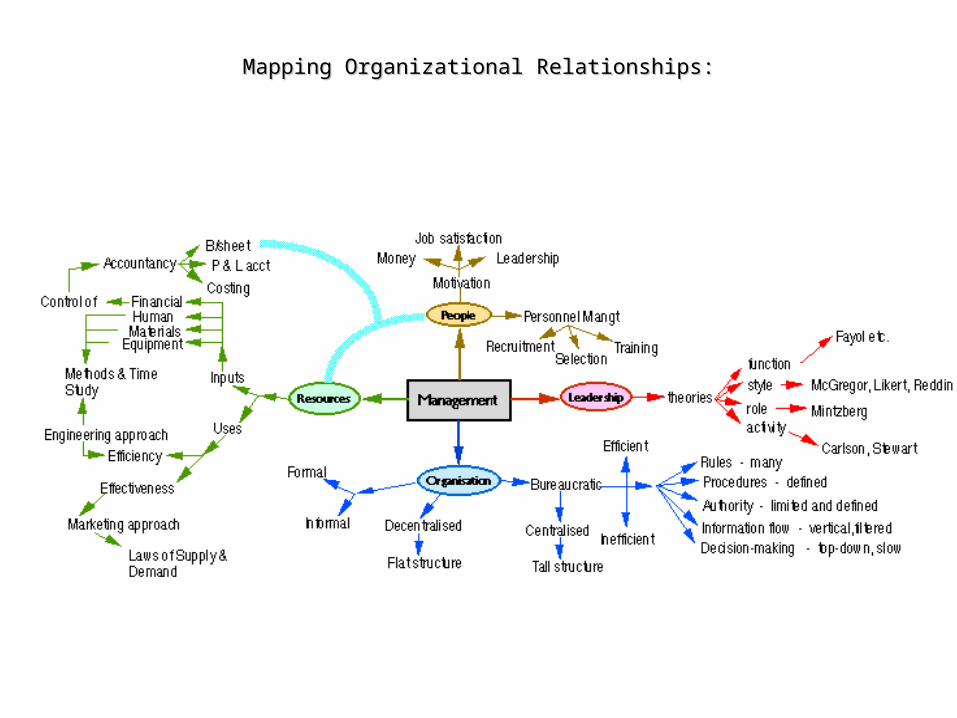
MappingMapping OrganizationalOrganizational Relationships:Relationships:

WebsiteWebsite Maps:Maps:This diagram maps the website for the Ndebele Project, showing relationships among and means This diagram maps the website for the Ndebele Project, showing relationships among and means
for navigating the areas of the site. for navigating the areas of the site.
The Ndebele Wallpainting Project Website
For Kids For Teachers
For EveryoneWho Wants
to Know More
How t o Use t he Cur r iculum Unit s
For 8- 12
For K- 3
Language Ar t s
M at hem at ics
Social St udies
Ar t s and Cult ur e
Language Ar t s
M at hem at ics
Social St udies
Ar t s and Cult ur e
Language Ar t s
M at hem at ics
Social St udies
Ar t s and Cult ur e
Resour ce Link 1
Resour ce Link 2
Resour ce Link 3
Resour ce Link 1
Resour ce Link 2
Resour ce Link 3
Resour ce Link 2
Resour ce Link 3
Resour ce Link 1
Resour ce Link 2
Resour ce Link 3
Resour ce Link 1
Resour ce Link 2
Resour ce Link 3
Resour ce Link 1
Resour ce Link 2
Resour ce Link 3
Resour ce Link 1
Resour ce Link 2
Resour ce Link 3
For 4- 7
Resour ce Link 1
Resour ce Link 2Resour ce
Link 3
Resour ce Link 1
Resour ce Link 2
Resour ce Link 1
Resour ce Link 3
Resour ce Link 1 Resour ce
Link 2
Resour ce Link 3
Resour ce Link 2
Resour ce Link 3
Resour ce Link 1
Resour ce Link 2
Resour ce Link 3
Resour ce Link 1
G am es
Mak e Art
Stories and Riddles
Am azing
f act s
Folkt ales f or older
r eader s
Folkt ales f or ear ly
r eader s
St am ping pat t er ns
Fr ee Dr aw
M ake your own sym bol
M indbender s
PuzzlesM at h G am es
Wor d G am es
Jum ble
Q uiz
Wor d Sear ch
Addit ion
M ult iplicat ion
G eom et r y
Links t o r elat ed sit es
Ar t s
Cult ur e
G eogr aphy
Puzzle O ne Puzzle t wo
Puzle Thr ee
Logic Pr oblem s
Concent r at ion
RiddlesTale 2
Tale 3
Tale 1
Tale 1
Tale 2
Tale 3
Riddle 1
Riddle 2
Riddle 3
Riddle 4
Riddle 5
G eogr aphy Fact s
Anim al Fact s
About t he Ndebele Wallpaint ing Pr oject
The Wall
G oes of f int o 26 sepapr at e links t hat people get t o by clicking on t he im age of t he sym bol f r om t he wall
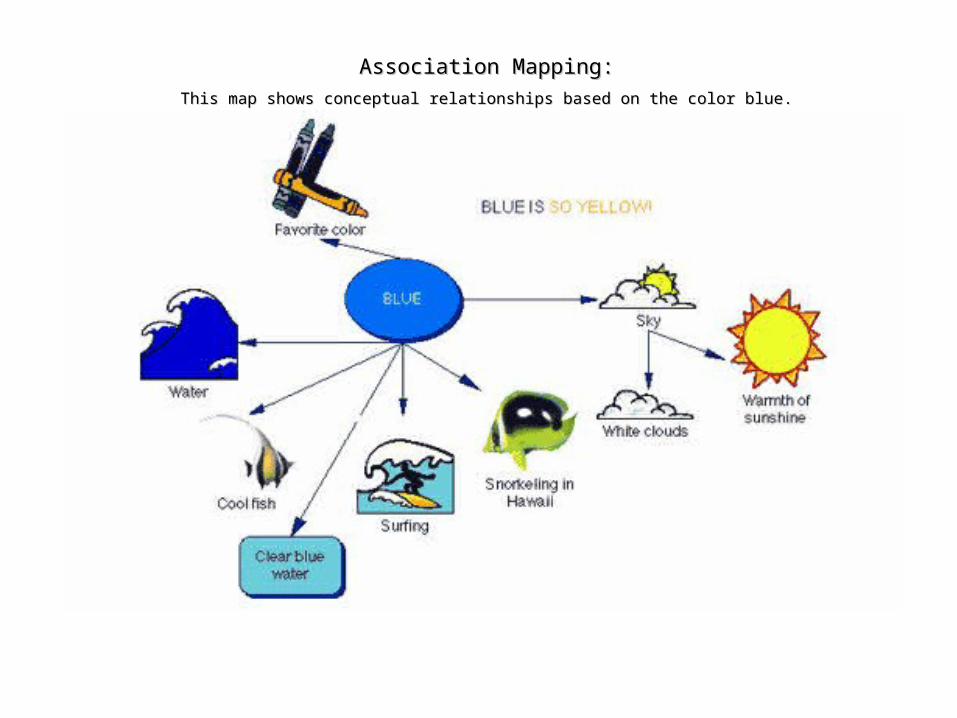
AssociationAssociation Mapping:Mapping:This map shows conceptual relationships based on the color blue.This map shows conceptual relationships based on the color blue.

Child’sChild’s ConceptConcept Map:Map:This map functions like an outline, from predominate associations to sub-associations.This map functions like an outline, from predominate associations to sub-associations.

MappingMapping CauseCause andand Effect:Effect:This schema shows the outcome of various actions on the environment, from the California Department This schema shows the outcome of various actions on the environment, from the California Department
of Natural Resources.of Natural Resources.

CharacterCharacter MappingMapping inin Literature:Literature:A graphic means of identifying characteristics and examples from literature.A graphic means of identifying characteristics and examples from literature.

MiddleMiddle SchoolSchool ConceptConcept Map:Map:Show categories and subcategories of knowledge on a subject.Show categories and subcategories of knowledge on a subject.

Concept Map of Concept Mapping!Concept Map of Concept Mapping!

StoryStory MapMap forfor Kids:Kids:Mapping the flow of events over time in a Mapping the flow of events over time in a narrativenarrative

This story started out in a farm. The kids were on their summer vacation. Having a very fun time. Until one day they found a U.F.O in the back yard! The door opened they never knew what to do because they were alone in the darkness. They saw a martian step out of it. They were about to run. But the alien said I will not hurt you. So then they went to space. Then they went to Andromeda. Then they went home.


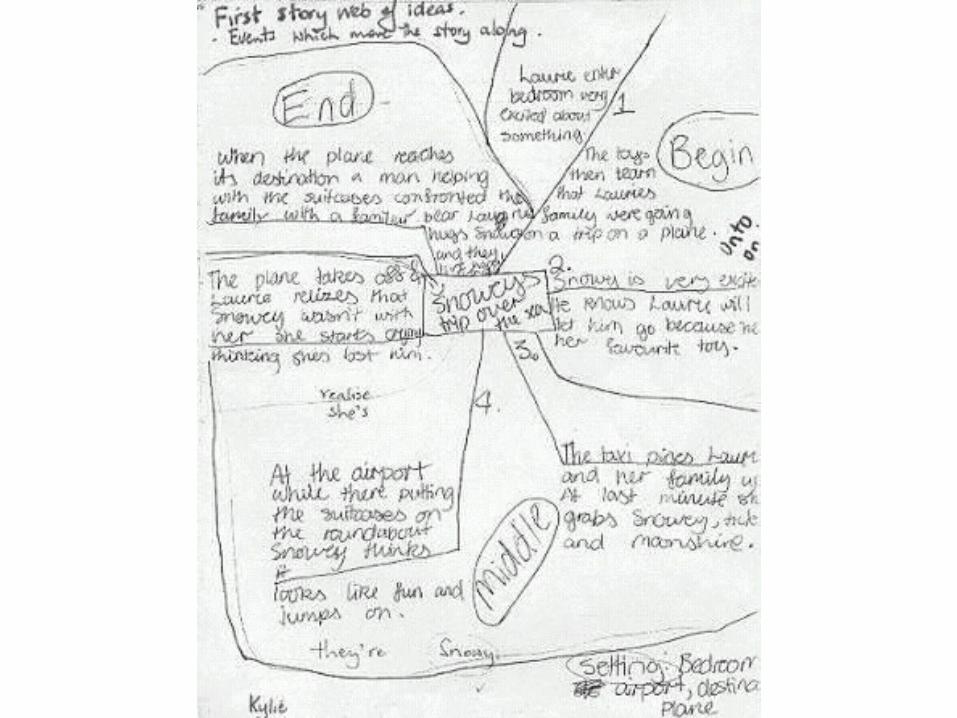
Child’s Story Map:Child’s Story Map:This one shows how important objects in the story helped move the narrative This one shows how important objects in the story helped move the narrative
along.along.

Narrative Map of the ThreeNarrative Map of the Three LittleLittle Pigs:Pigs:Illustrations, writing and arrows map the chain of events in the story.Illustrations, writing and arrows map the chain of events in the story.

www.thestoryboardartist.com: TV Storyboard Sample Page: Rubber Ducky: This spot was for Homeruns.com. The voice over at the end asks, "What would you do today if you
didn't have to go to the store?"
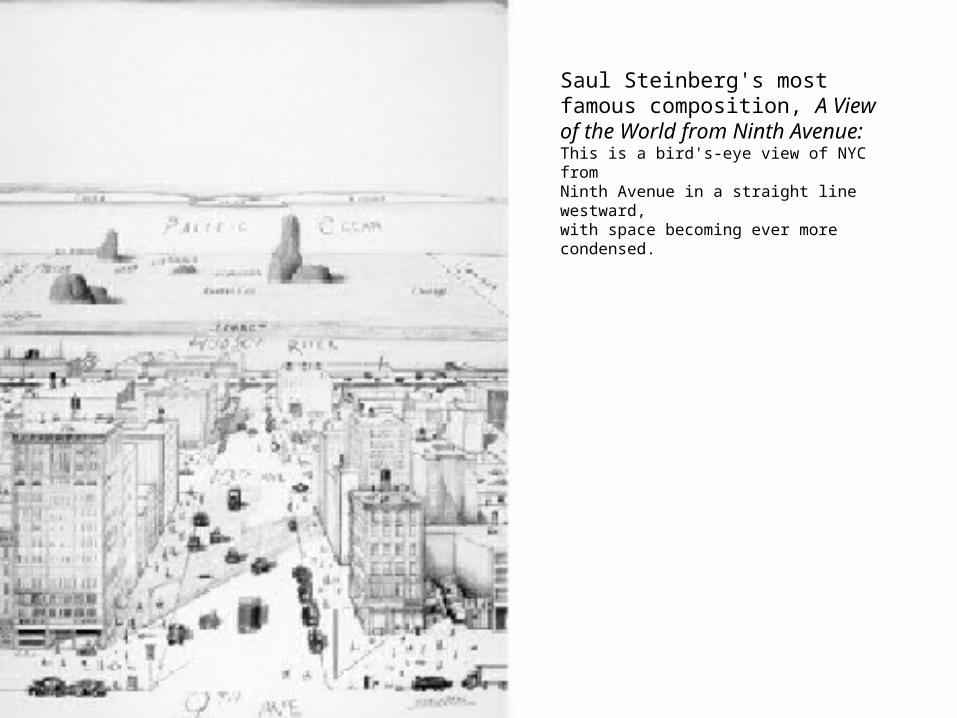
Saul Steinberg's most famous composition, A View of the World from Ninth Avenue:This is a bird's-eye view of NYC fromNinth Avenue in a straight line westward,with space becoming ever more condensed.

Saul SteinbergJerusalem, A View of the
World
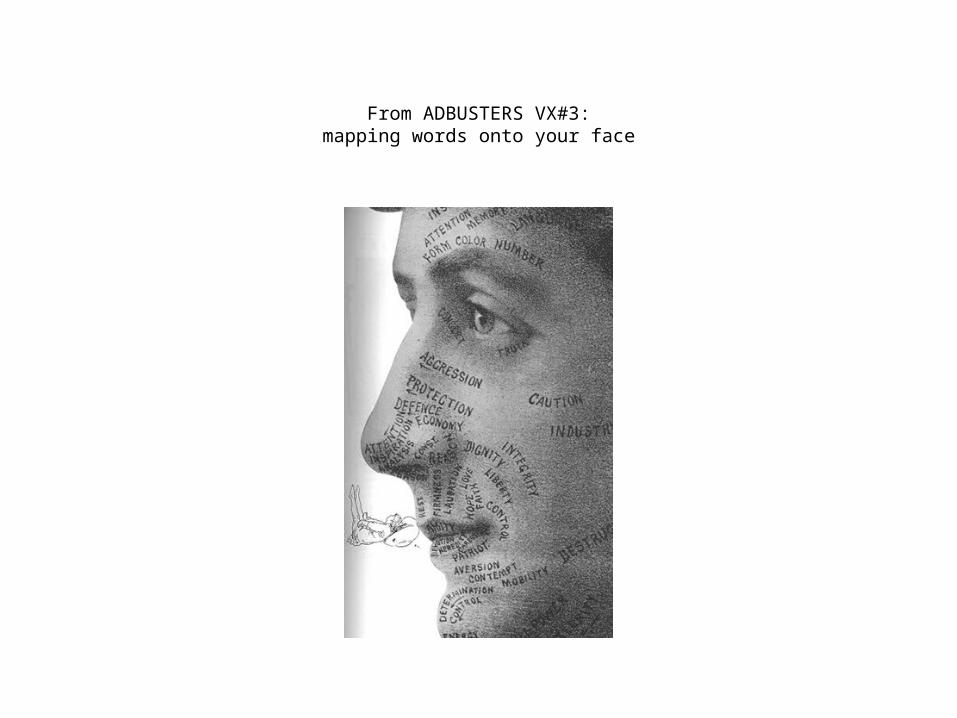
From ADBUSTERS VX#3:mapping words onto your face

From: Codex Espangliensis, by Guillermo Gomez Pena, Enrique Chagoya, and Felicia Rice
The interaction and class of times & cultures through mythological symbols and pop icons. The text reinvents history (an Aztec sailor named Europzin discovers a New World and names it
Europe).

From: Acme Novelty Library, by Chris Ware:An image of a man’s childhood home provides the space in which to map various memories.
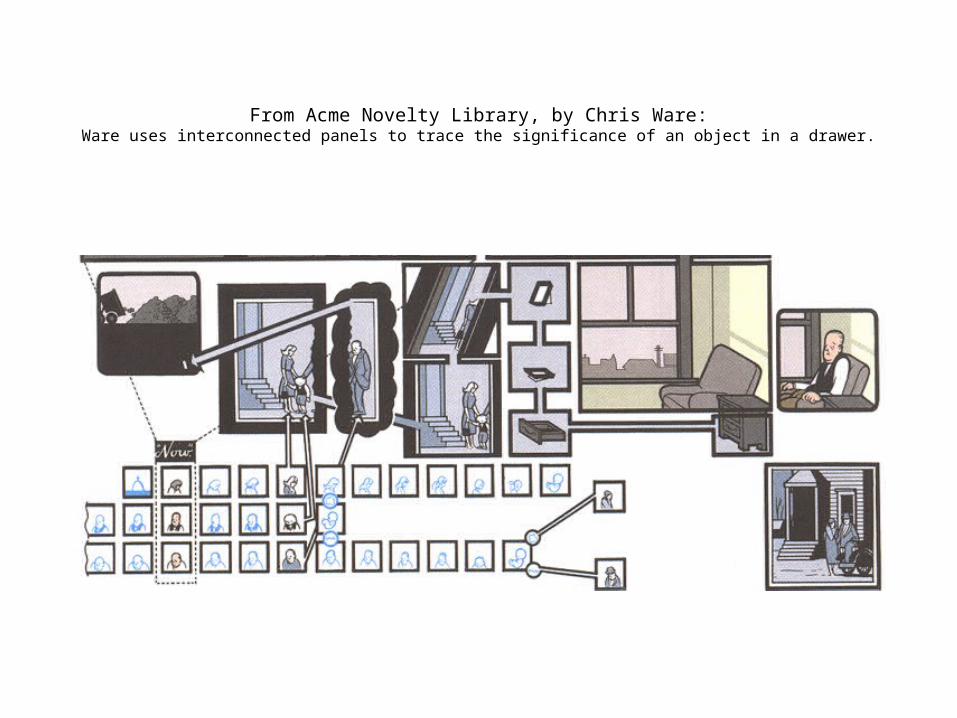
From Acme Novelty Library, by Chris Ware:Ware uses interconnected panels to trace the significance of an object in a drawer.

From: The Flight Into Egypt, by Timothy ElyEly uses cryptic symbols and glyphs over painted maps to explore
the sixteen mysterious weeks his father spent in Egypt.

From: Life in Hell, by Matt Groening

From: Life in Hell, by Matt Groening

From: Life in Hell, by Matt Groening

From: Life in Hell, by Matt Groening

From: Biological Ultrastructure, ed. By Patricia HarrisThis is just a real amusing model of photosynthesis. You might map your life or
yourself as a machine of some kind

Taken from: The Visual Representation of Quantitative InformationImagine different aspects of your life and experiences represented on such a graph.

Taken from: The Visual Representation of Quantitative InformationImagine different aspects of your life and experiences represented on such a graph.

Taken from: The Visual Representation of Quantitative InformationImagine different aspects of your life and experiences represented on such a graph.

From Acme Novelty Library, by Chris Ware:a single event extrapolated over the space of the page

From: Imagining Language, edited by Jed Rasula and Steve McCaffery:text and image arranged to form a larger symbolic structure
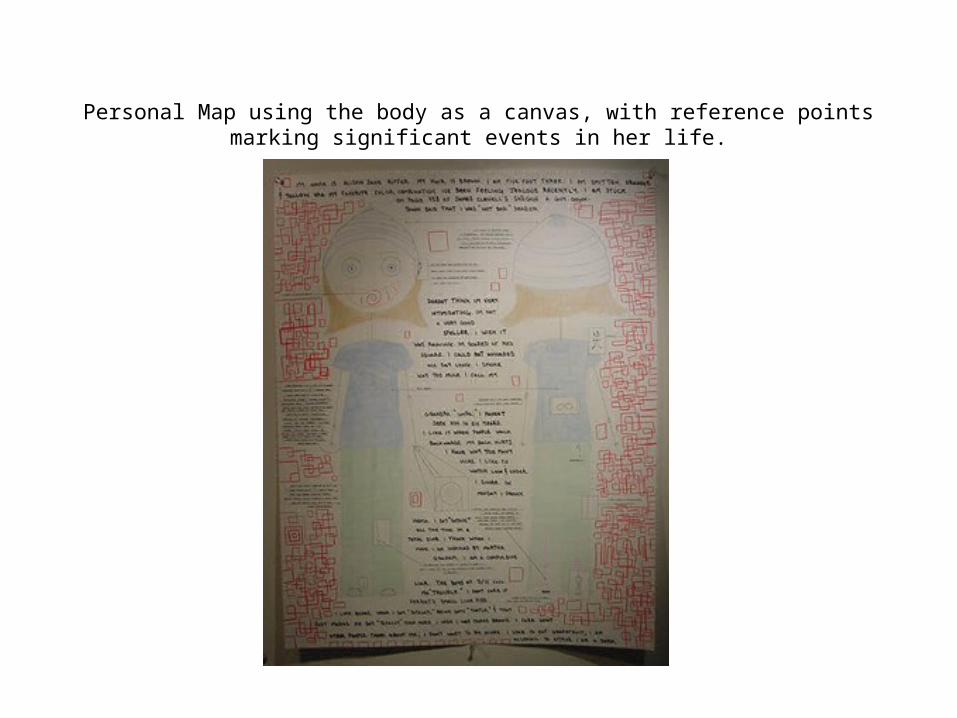
Personal Map using the body as a canvas, with reference points marking significant events in her life.

A Personal Map based on the cars the artist owned, with photos of the cars on one side and maps and writing of significant events that happened in and with the car on the other.

A Personal Map with a collage of important images for the phases of the artist’s life, and a painted wooden box with differently shaped cards inside. Each card is a different shape based on multiple personal identities.

A Personal Map based on the artist’s best friends and the emotions and events that they represent to her indicated with color and figure.

Personal Map done on transparent layers--the bottom layer is a literal geographic map with historic and personal events written over the areas where thye o0ccurred. A key on the right
margin helps the viewer understand his codes and symbols.

A personal map in a comic strip style format. The center panel is the cover for the book of comics if they were made into book form.