World Office Yield Spectrum › selected-international-research › ...World Office Yield Spectrum...
20
savills.com Savills World Research World Office Yield Spectrum 2H/2015
Transcript of World Office Yield Spectrum › selected-international-research › ...World Office Yield Spectrum...
savills.com Savills World Research
World Office Yield Spectrum2H/2015

AsiaPacific
Americas
Europe
Africa
55Offices
US,
M
exico & Caribbean
84Offices
Europe
125Offices
Asia Pacific
274Offices
Midd
le East & Africa
140Offices
Uni
ted
Kingdom & Ireland
UK, Ireland & Channel Islands EnglandIrelandJerseyScotlandWales
Asia Pacific AustraliaChinaHong KongIndiaIndonesiaJapanMacauMalaysiaMyanmarNew ZealandPhilippinesSingaporeSouth KoreaTaiwan
ThailandVietnam Continental Europe AustriaBelgiumCroatiaDenmark FinlandFranceGermanyGibraltarGreeceItaly
LuxembourgMonacoMontenegroNetherlandsNorwayPolandPortugal RussiaSpainSerbiaSwedenSwitzerland
Middle East & Africa BahrainKenyaMauritiusMozambiqueNamibiaOmanQatarSeychellesSouth AfricaUAEZambiaZimbabwe
Americas & CaribbeanAntigua & BarbudaBahamasBarbadosCayman IslandsGrenadaMexicoPanamaSt Kitts & NevisSt LuciaUS
Savills global presenceOver 600 owned and associate offices worldwide
World Office Yield Spectrum 2H/2015 | 3
Introduction
With investment capital becoming more global in its search for returns and diversification, the need for a standardised set of indicators to make sense of opportunities, risk and return expectations has become critical.
The Savills/Deakin University World Office Yield Spectrum is designed to fill a void in market knowledge.
For too long the global property investment community has been denied a credible, factual yields series which can be reliably used to compare ‘apples with apples.’ This world first publication is the culmination of over a year’s work by dozens of researchers in the Savills team.
Savills Research trusts you find this body of work useful, illuminating and of value to you in your endeavours. As always your thoughts, feedback and ideas are most welcome. Please feel free to contact your Savills representative with regard to this publication.
Methodology
Market YieldsThis yield is derived by capitalising current market rents (Net Face) against current capital values for office buildings. The Net Face rent is the rent payable by the tenant excluding both statutory and operating outgoings (recoverables) and includes the value of any incentive paid to the tenant by way of fitout, cash, rental rebate or rent free. The capital value is calculated to be for the office component only and excludes retail, excess car parking, signage, storage and other “non-office” sources of income.
Effective YieldsThis yield is derived by capitalising current market rents (Net Effective) against current capital values for office buildings. The Net Effective rent is the rent payable by the tenant excluding both statutory and operating outgoings (recoverables) and excludes the value of any incentive paid to the tenant by way of fitout, cash, rental rebate or rent free. The capital value is calculated to be for the office component only and excludes retail, excess car parking, signage, storage and other ‘non-office’ sources of income.
Weighted Average Cost of Capital (WACC)The WACC is derived by having reference to the rents described above, the rental growth outlook and the management fee recoverable from owning the building (in sum a proxy for equity) and the current cost of debt. Using a 30%/70% equity/debt split, a WACC is calculated.
Accretive PremiumsBy subtracting the effective and market yields derived above from the WACC we can calculate the ‘accretion’ inherent in each market using the metrics as described.
Market Risk PremiumsHaving reference to the market yield calculated above we subtract the risk free rate (10 year bond) then add the expected annual income growth rate to establish the ‘expected return for risk.’
Effective Risk PremiumsHaving reference to the effective yield calculated above we take that yield, subtract the risk free rate (10 year bond) then add the expected annual income growth rate to establish the ‘expected return for risk.’
4 | World Office Yield Spectrum 2H/2015
World Cities
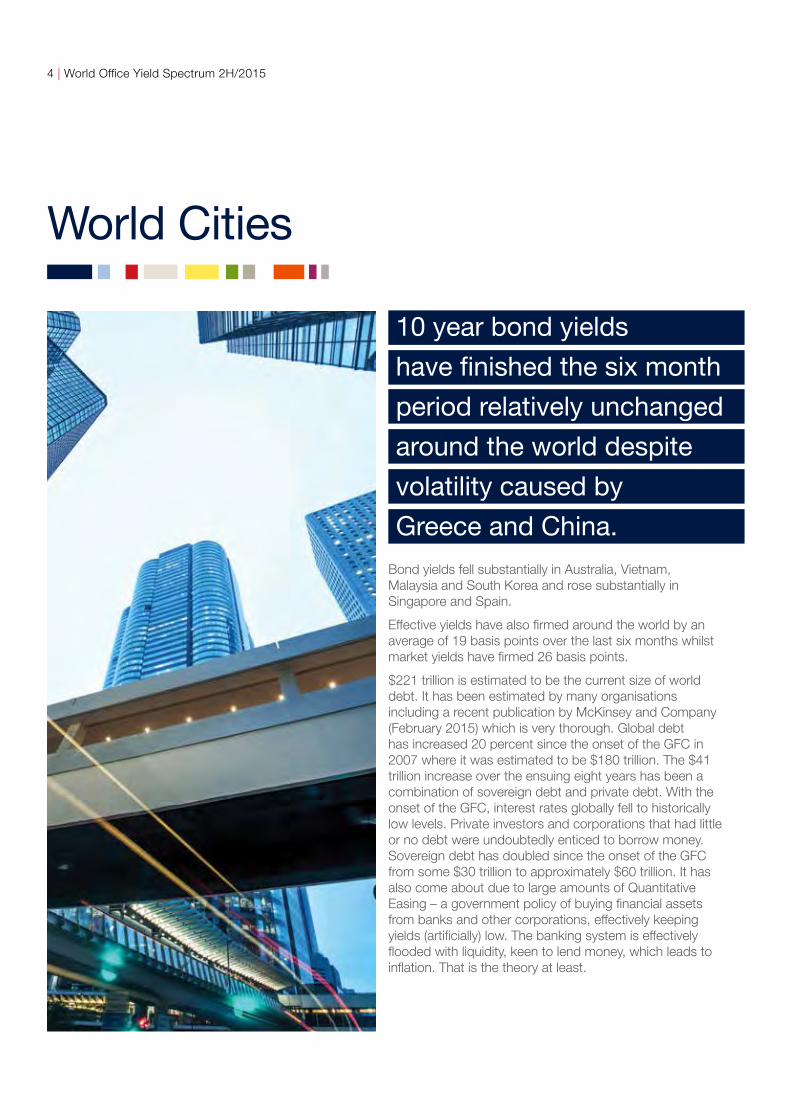
10 year bond yields
have finished the six month
period relatively unchanged
around the world despite
volatility caused by
Greece and China. Bond yields fell substantially in Australia, Vietnam, Malaysia and South Korea and rose substantially in Singapore and Spain.
Effective yields have also firmed around the world by an average of 19 basis points over the last six months whilst market yields have firmed 26 basis points.
$221 trillion is estimated to be the current size of world debt. It has been estimated by many organisations including a recent publication by McKinsey and Company (February 2015) which is very thorough. Global debt has increased 20 percent since the onset of the GFC in 2007 where it was estimated to be $180 trillion. The $41 trillion increase over the ensuing eight years has been a combination of sovereign debt and private debt. With the onset of the GFC, interest rates globally fell to historically low levels. Private investors and corporations that had little or no debt were undoubtedly enticed to borrow money. Sovereign debt has doubled since the onset of the GFC from some $30 trillion to approximately $60 trillion. It has also come about due to large amounts of Quantitative Easing – a government policy of buying financial assets from banks and other corporations, effectively keeping yields (artificially) low. The banking system is effectively flooded with liquidity, keen to lend money, which leads to inflation. That is the theory at least.

World Office Yield Spectrum 2H/2015 | 5
In any case, world debt is at unprecedented levels. If global interest rates were to rise, the amount of money paying interest would divert so much money from elsewhere in the economy, that it is quite possible a severe recession would ensue. Let’s remember, debt is rising, not going down. There are currently no plans, anywhere, to pay off debt.
So, in a highly leveraged world, the prospect of significantly higher interest rates seems unlikely. The ‘lower for longer’ scenario appears to have greater credibility than the ‘resumption of normal transmission’ scenario.
The recent devaluation of the Chinese currency raises the prospect of interest rate differentials being used to achieve currency and trade outcomes – this is sometimes referred to as ‘a currency war’. These policy changes have the potential to further delay a rise in US interest rates until 2016. Currency movements are playing a substantial role in global investment capital flows and play a prominent part in capital allocations to global property investment.
0%
1%
2%
3%
4%
5%
6%
7%
8%
9%
10%
World OfficeCBD Grade A Market Yields (%) by Region and City
Jun-15
Australia/NZ Asia Europe United StatesSource: Savills Research
0%
1%
2%
3%
4%
5%
6%
7%
8%
9%
10%
World OfficeCBD Grade A Effective Yields (%) by Region and City
Jun-15
Australia/NZ Asia Europe United StatesSource: Savills Research
World Office CBD Grade A Effective Yields (%) by Region and City June 2015
Source: Savills Research
Tony Crabb National Head – Research Australia
+61 (0) 422 221 604
0%
1%
2%
3%
4%
5%
6%
7%
8%
9%
10%
World OfficeCBD Grade A Market Yields (%) by Region and City
Jun-15
Australia/NZ Asia Europe United StatesSource: Savills Research
World Office CBD Grade A Market Yields (%) by Region and City June 2015
Source: Savills Research

6 | World Office Yield Spectrum 2H/2015

World Office Yield Spectrum 2H/2015 | 7
World Cities/CBD/Grade A Office
Market Yields June 2015 Effective Yields June 2015
Source: Savills Research
Source: Savills Research
Source: Savills Research Source: Savills Research
Source: Savills Research
Source: Savills Research
Market Yield Change December 2014–June 2015 Effective Yield Change December 2014–June 2015
Market Risk Premium June 2015 Effective Risk Premium June 2015
0%
2%
4%
6%
8%
10%
World OfficeTop Cities CBD Grade A Market Yields (%)
Jun-15
Source: Savills Research
0%
1%
2%
3%
4%
5%
6%
7%
8%
World OfficeTop Cities CBD Grade A Effective Yields (%)
Jun-15
Source: Savills Research
0%
1%
2%
3%
4%
5%
6%
7%
8%
World OfficeTop Cities CBD Grade A Market Risk Premium (%)
Jun-15
Source: Savills Research
0%
1%
2%
3%
4%
5%
6%
World OfficeTop Cities CBD Grade A Effective Risk Premium (%)
Jun-15
Source: Savills Research
-1 0%
-0.5%
0.0%
0.5%
1.0%
World OfficeTop Cities CBD Grade A Market Yield Change (%)
Dec-14 to Jun-15
-2.0%
-1.5%
-1.0%
Source: Savills Research
-1 0%
-0.5%
0.0%
0.5%
1.0%
World OfficeTop Cities CBD Grade A Effective Yield Change (%)
Dec-14 to Jun-15
-2.0%
-1.5%
-1.0%
Source: Savills Research
0%
1%
2%
3%
4%
5%
6%
7%
8%
World OfficeTop Cities CBD Grade A Market Risk Premium (%)
Jun-15
Source: Savills Research
0%
1%
2%
3%
4%
5%
6%
World OfficeTop Cities CBD Grade A Effective Risk Premium (%)
Jun-15
Source: Savills Research
0%
2%
4%
6%
8%
10%
World OfficeTop Cities CBD Grade A Market Yields (%)
Jun-15
Source: Savills Research
0%
1%
2%
3%
4%
5%
6%
7%
8%
World OfficeTop Cities CBD Grade A Effective Yields (%)
Jun-15
Source: Savills Research
8 | World Office Yield Spectrum 2H/2015
Australia
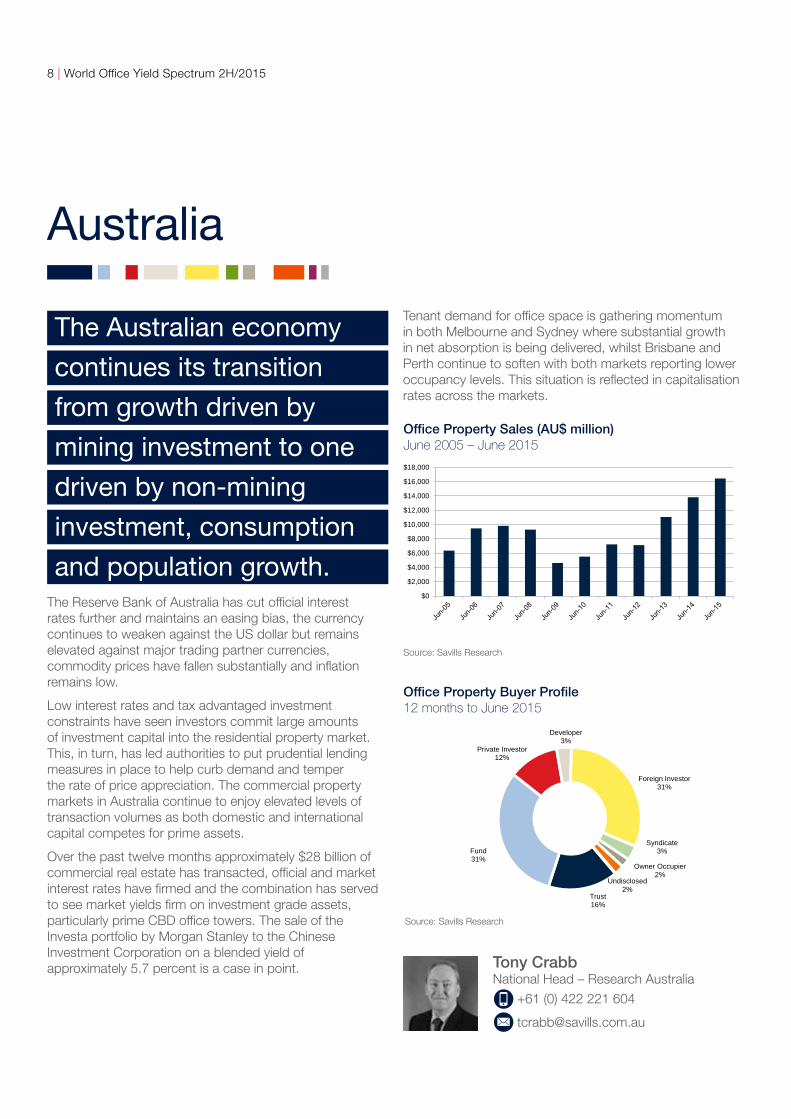
The Australian economy
continues its transition
from growth driven by
mining investment to one
driven by non-mining
investment, consumption
and population growth. The Reserve Bank of Australia has cut official interest rates further and maintains an easing bias, the currency continues to weaken against the US dollar but remains elevated against major trading partner currencies, commodity prices have fallen substantially and inflation remains low.
Low interest rates and tax advantaged investment constraints have seen investors commit large amounts of investment capital into the residential property market. This, in turn, has led authorities to put prudential lending measures in place to help curb demand and temper the rate of price appreciation. The commercial property markets in Australia continue to enjoy elevated levels of transaction volumes as both domestic and international capital competes for prime assets.
Over the past twelve months approximately $28 billion of commercial real estate has transacted, official and market interest rates have firmed and the combination has served to see market yields firm on investment grade assets, particularly prime CBD office towers. The sale of the Investa portfolio by Morgan Stanley to the Chinese Investment Corporation on a blended yield of approximately 5.7 percent is a case in point. Tony Crabb
National Head – Research Australia
+61 (0) 422 221 604
Tenant demand for office space is gathering momentum in both Melbourne and Sydney where substantial growth in net absorption is being delivered, whilst Brisbane and Perth continue to soften with both markets reporting lower occupancy levels. This situation is reflected in capitalisation rates across the markets.
$0
$2,000
$4,000
$6,000
$8,000
$10,000
$12,000
$14,000
$16,000
$18,000
Australian OfficeOffice Property Sales (AU$m)
Jun-05 to Jun-15
Source: Savills Research
Trust16%
Fund31%
Private Investor12%
Developer3%
Foreign Investor31%
Syndicate3%
Owner Occupier2%
Undisclosed2%
Australian OfficeOffice Property Buyer Profile (%)
12 months to Jun-15
Source: Savills Research
Office Property Sales (AU$ million) June 2005 – June 2015
Source: Savills Research
$0
$2,000
$4,000
$6,000
$8,000
$10,000
$12,000
$14,000
$16,000
$18,000
Australian OfficeOffice Property Sales (AU$m)
Jun-05 to Jun-15
Source: Savills Research
Trust16%
Fund31%
Private Investor12%
Developer3%
Foreign Investor31%
Syndicate3%
Owner Occupier2%
Undisclosed2%
Australian OfficeOffice Property Buyer Profile (%)
12 months to Jun-15
Source: Savills Research
Office Property Buyer Profile 12 months to June 2015
Source: Savills Research

World Office Yield Spectrum 2H/2015 | 9
Australia & New Zealand/CBD/Grade A Office
Market Yields June 2015 Effective Yields June 2015
Market Yield Change December 2014–June 2015 Effective Yield Change December 2014–June 2015
Market Risk Premium June 2015 Effective Risk Premium June 2015
0%
2%
4%
6%
8%
10%
World OfficeAustralia/New Zealand CBD Grade A Market Yields (%)
Jun-15
Source: Savills Research
0%
2%
4%
6%
8%
10%
World OfficeAustralia/New Zealand CBD Grade A Effective Yields (%)
Jun-15
Source: Savills Research
0%
1%
2%
3%
4%
5%
6%
7%
8%
World OfficeAustralia/New Zealand CBD Grade A Market Risk Premium (%)
Jun-15
Source: Savills Research
0%
1%
2%
3%
4%
5%
6%
World OfficeAustralia/New Zealand CBD Grade A Effective Risk Premium (%)
Jun-15
Source: Savills Research
0.0%
0.5%
1.0%
World OfficeAustralia/New Zealand CBD Grade A Market Yield Change (%)
Dec-14 to Jun-15
-1.0%
-0.5%
Source: Savills Research
0.0%
0.5%
1.0%
World OfficeAustralia/New Zealand CBD Grade A Effective Yield Change (%)
Dec-14 to Jun-15
-1.0%
-0.5%
Source: Savills Research
0%
1%
2%
3%
4%
5%
6%
7%
8%
World OfficeAustralia/New Zealand CBD Grade A Market Risk Premium (%)
Jun-15
Source: Savills Research
0%
1%
2%
3%
4%
5%
6%
World OfficeAustralia/New Zealand CBD Grade A Effective Risk Premium (%)
Jun-15
Source: Savills Research
0%
2%
4%
6%
8%
10%
World OfficeAustralia/New Zealand CBD Grade A Market Yields (%)
Jun-15
Source: Savills Research
0%
2%
4%
6%
8%
10%
World OfficeAustralia/New Zealand CBD Grade A Effective Yields (%)
Jun-15
Source: Savills Research
Source: Savills Research
Source: Savills Research
Source: Savills Research Source: Savills Research
Source: Savills Research
Source: Savills Research

10 | World Office Yield Spectrum 2H/2015
Asia
Asia has presented its
usual mixed picture over
the past six months. In Japan, the economy appeared to have revived after the consumption tax hike of April 2014 but growth remains tepid and the Bank of Japan’s 2 percent inflation target still seems some way off. Expectations of further stimulus persist.
In Korea, the Bank of Korea lowered the benchmark interest rate by 25 basis points to an historical low of 1.5 percent in June 2015. With a pronounced cap rate compression in the office market over recent quarters, investors are diversifying into other sectors including retail and logistics. In Taiwan, a new capital gains tax due to come into effect in January 2016 combined with other government cooling measures has taken transactions
Simon Smith Senior Director – Research Asia Pacific
+852 2842 4573
$0
$5,000
$10,000
$15,000
$20,000
$25,000
$30,000
Asian OfficeOffice Property Sales (US$m)
Mar-07 to Mar-15
Source: RCA/Savills Research
Trust30%
Fund17%
Private Investor19%
Foreign Investor20%
Owner Occupier14%
Asian OfficeOffice Property Buyer Profile (%)
12 months to Dec-14
Source: RCA/Savills Research
Office Property Sales (US$ million) March 2007 – March 2015
Source: RCA/Savills Research
$0
$5,000
$10,000
$15,000
$20,000
$25,000
$30,000
Asian OfficeOffice Property Sales (US$m)
Mar-07 to Mar-15
Source: RCA/Savills Research
Trust30%
Fund17%
Private Investor19%
Foreign Investor20%
Owner Occupier14%
Asian OfficeOffice Property Buyer Profile (%)
12 months to Dec-14
Source: RCA/Savills Research
Office Property Buyer Profile 12 months to December 2014
Source: RCA/Savills Research
volumes to new lows and prices are expected to fall further in the second half of 2015.
In Hong Kong, a revival in office leasing demand has resulted in rent rises, while values rose on higher volumes. It is still too early to tell what impact uncertainty in the mainland China equity markets will have on real estate investment sentiment.
In Singapore, concerns over the upcoming supply glut alongside already high prices and lower yields means that many investors are deferring decisions. Big ticket commercial asset transactions will determine whether investment sales this year perform in line with 2014.
A rapid reduction in interest rates to their lowest levels in over 25 years has resulted in a revival of the office investment market in China. Soft economic conditions and an unstable stock market lead many to believe the supportive measures will continue stoking expectations of further cap rate compression, despite historically high levels of new supply expected in the coming two years.

World Office Yield Spectrum 2H/2015 | 11
Asia/CBD/Grade A Office
Market Yields June 2015 Effective Yields June 2015
Market Yield Change December 2014-June 2015 Effective Yield Change December 2014-June 2015
Market Risk Premium June 2015 Effective Risk Premium June 2015
0%
2%
4%
6%
8%
10%
World OfficeAsian CBD Grade A Market Yields (%)
Jun-15
Source: Savills Research
0%
2%
4%
6%
8%
10%
World OfficeAsian CBD Grade A Effective Yields (%)
Jun-15
Source: Savills Research
0%
1%
2%
3%
4%
5%
6%
7%
8%
World OfficeAsian CBD Grade A Market Risk Premium (%)
Jun-15
Source: Savills Research
-1%
0%
1%
2%
3%
4%
5%
6%
World OfficeAsian CBD Grade A Effective Risk Premium (%)
Jun-15
Source: Savills Research
0.0%
0.5%
1.0%
World OfficeAsian CBD Grade A Market Yield Change (%)
Dec-14 to Jun-15
-1.0%
-0.5%
Source: Savills Research
0.0%
0.5%
1.0%
World OfficeAsian CBD Grade A Effective Yield Change (%)
Dec-14 to Jun-15
-1.0%
-0.5%
Source: Savills Research
0%
1%
2%
3%
4%
5%
6%
7%
8%
World OfficeAsian CBD Grade A Market Risk Premium (%)
Jun-15
Source: Savills Research
-1%
0%
1%
2%
3%
4%
5%
6%
World OfficeAsian CBD Grade A Effective Risk Premium (%)
Jun-15
Source: Savills Research
0%
2%
4%
6%
8%
10%
World OfficeAsian CBD Grade A Market Yields (%)
Jun-15
Source: Savills Research
0%
2%
4%
6%
8%
10%
World OfficeAsian CBD Grade A Effective Yields (%)
Jun-15
Source: Savills ResearchSource: Savills Research
Source: Savills Research
Source: Savills Research Source: Savills Research
Source: Savills Research
Source: Savills Research
12 | World Office Yield Spectrum 2H/2015
Europe
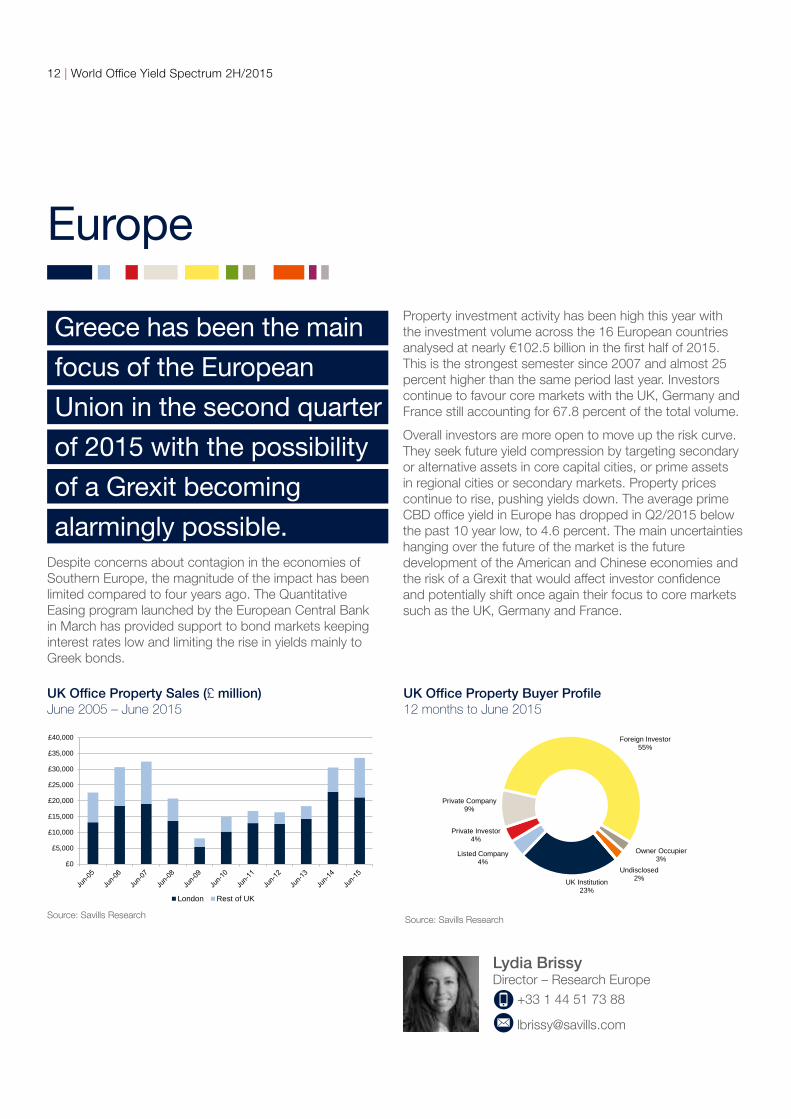
Greece has been the main
focus of the European
Union in the second quarter
of 2015 with the possibility
of a Grexit becoming
alarmingly possible.Despite concerns about contagion in the economies of Southern Europe, the magnitude of the impact has been limited compared to four years ago. The Quantitative Easing program launched by the European Central Bank in March has provided support to bond markets keeping interest rates low and limiting the rise in yields mainly to Greek bonds.
Lydia BrissyDirector – Research Europe
+33 1 44 51 73 88
Property investment activity has been high this year with the investment volume across the 16 European countries analysed at nearly €102.5 billion in the first half of 2015. This is the strongest semester since 2007 and almost 25 percent higher than the same period last year. Investors continue to favour core markets with the UK, Germany and France still accounting for 67.8 percent of the total volume.
Overall investors are more open to move up the risk curve. They seek future yield compression by targeting secondary or alternative assets in core capital cities, or prime assets in regional cities or secondary markets. Property prices continue to rise, pushing yields down. The average prime CBD office yield in Europe has dropped in Q2/2015 below the past 10 year low, to 4.6 percent. The main uncertainties hanging over the future of the market is the future development of the American and Chinese economies and the risk of a Grexit that would affect investor confidence and potentially shift once again their focus to core markets such as the UK, Germany and France.
£0
£5,000
£10,000
£15,000
£20,000
£25,000
£30,000
£35,000
£40,000
United Kingdom OfficeOffice Property Sales (£m)
Jun-05 to Jun-15
London Rest of UKSource: Savills Research
UK Institution23%
Listed Company4%
Private Investor4%
Private Company9%
Foreign Investor55%
Owner Occupier3%
Undisclosed2%
United Kingdom OfficeOffice Property Buyer Profile (%)
12 months to Jun-15
Source: Savills Research
UK Office Property Sales (£ million) June 2005 – June 2015
Source: Savills Research
UK Office Property Buyer Profile 12 months to June 2015
£0
£5,000
£10,000
£15,000
£20,000
£25,000
£30,000
£35,000
£40,000
United Kingdom OfficeOffice Property Sales (£m)
Jun-05 to Jun-15
London Rest of UKSource: Savills Research
UK Institution23%
Listed Company4%
Private Investor4%
Private Company9%
Foreign Investor55%
Owner Occupier3%
Undisclosed2%
United Kingdom OfficeOffice Property Buyer Profile (%)
12 months to Jun-15
Source: Savills Research
Source: Savills Research
World Office Yield Spectrum 2H/2015 | 13
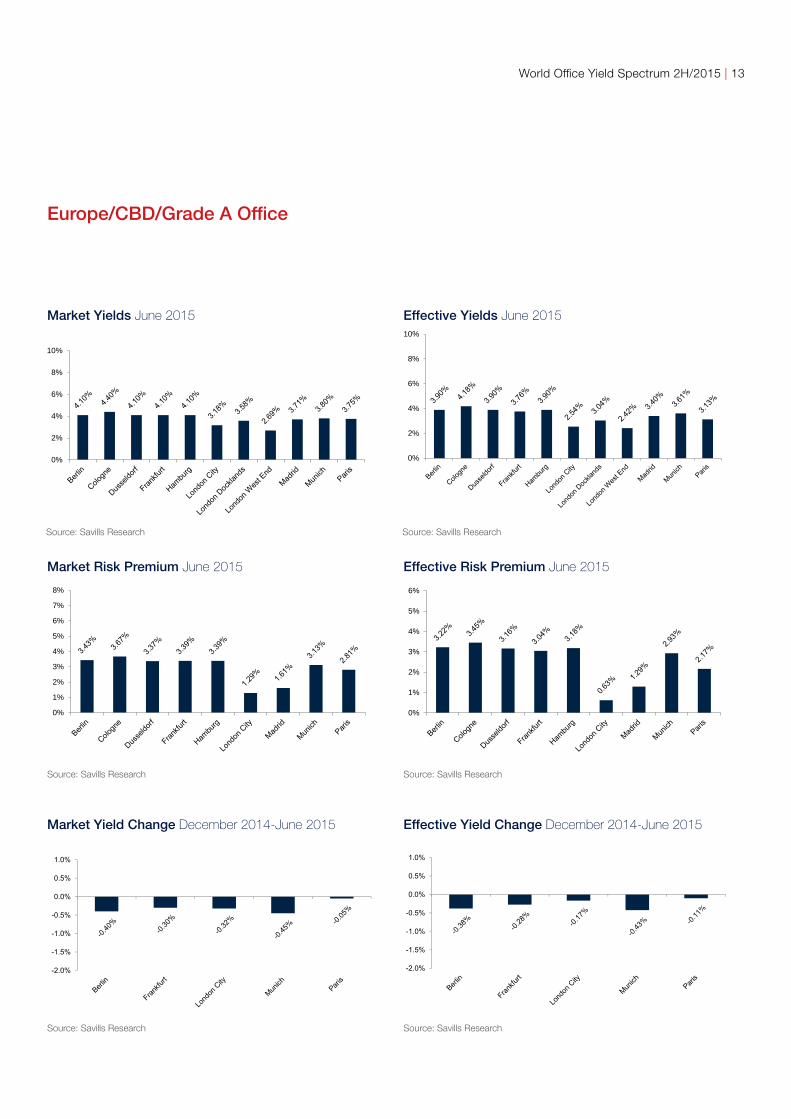
Europe/CBD/Grade A Office
Market Yields June 2015 Effective Yields June 2015
Market Yield Change December 2014-June 2015 Effective Yield Change December 2014-June 2015
Market Risk Premium June 2015 Effective Risk Premium June 2015
0%
2%
4%
6%
8%
10%
World OfficeEuropean CBD Grade A Market Yields (%)
Jun-15
Source: Savills Research
0%
2%
4%
6%
8%
10%
World OfficeEuropean CBD Grade A Effective Yields (%)
Jun-15
Source: Savills Research
0%
1%
2%
3%
4%
5%
6%
7%
8%
World OfficeEuropean CBD Grade A Market Risk Premium (%)
Jun-15
Source: Savills Research
0%
1%
2%
3%
4%
5%
6%
World OfficeEuropean CBD Grade A Effective Risk Premium (%)
Jun-15
Source: Savills Research
-1 0%
-0.5%
0.0%
0.5%
1.0%
World OfficeEuropean CBD Grade A Market Yield Change (%)
Dec-14 to Jun-15
-2.0%
-1.5%
-1.0%
Source: Savills Research
-1 0%
-0.5%
0.0%
0.5%
1.0%
World OfficeEuropean CBD Grade A Effective Yield Change (%)
Dec-14 to Jun-15
-2.0%
-1.5%
-1.0%
Source: Savills Research
0%
1%
2%
3%
4%
5%
6%
7%
8%
World OfficeEuropean CBD Grade A Market Risk Premium (%)
Jun-15
Source: Savills Research
0%
1%
2%
3%
4%
5%
6%
World OfficeEuropean CBD Grade A Effective Risk Premium (%)
Jun-15
Source: Savills Research
0%
2%
4%
6%
8%
10%
World OfficeEuropean CBD Grade A Market Yields (%)
Jun-15
Source: Savills Research
0%
2%
4%
6%
8%
10%
World OfficeEuropean CBD Grade A Effective Yields (%)
Jun-15
Source: Savills Research
Source: Savills Research
Source: Savills Research
Source: Savills Research Source: Savills Research
Source: Savills Research
Source: Savills Research
14 | World Office Yield Spectrum 2H/2015
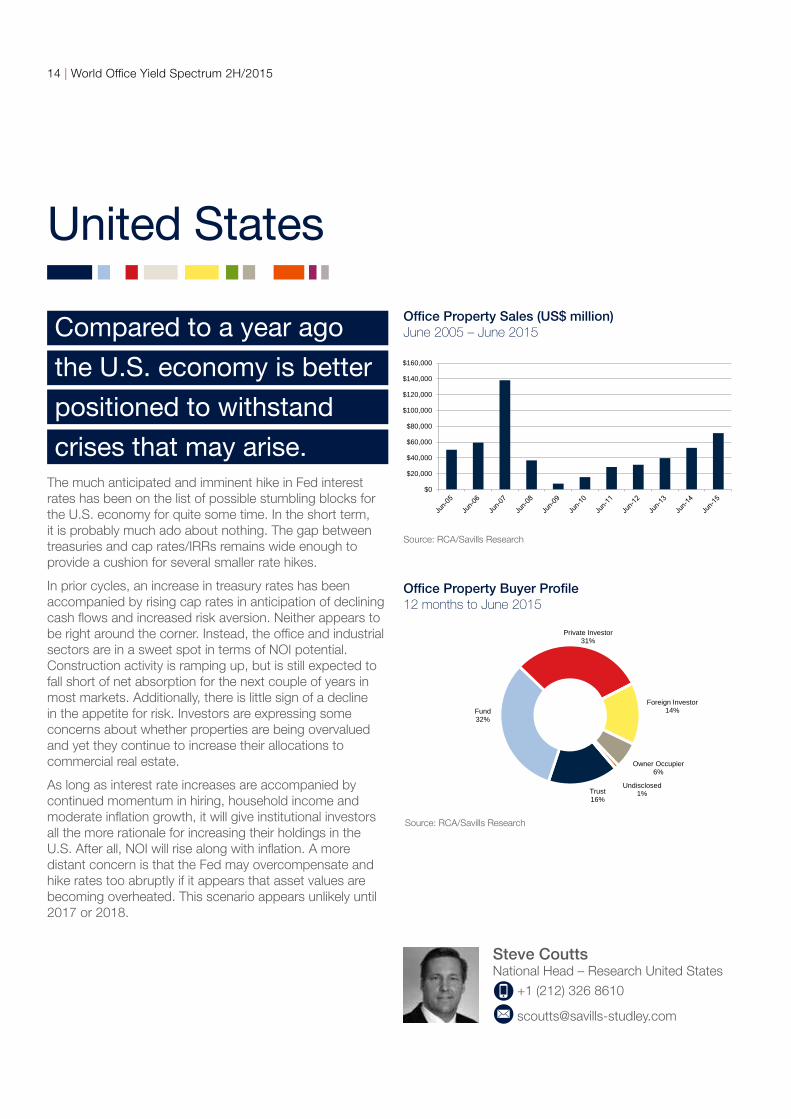
United States
Compared to a year ago
the U.S. economy is better
positioned to withstand
crises that may arise. The much anticipated and imminent hike in Fed interest rates has been on the list of possible stumbling blocks for the U.S. economy for quite some time. In the short term, it is probably much ado about nothing. The gap between treasuries and cap rates/IRRs remains wide enough to provide a cushion for several smaller rate hikes.
In prior cycles, an increase in treasury rates has been accompanied by rising cap rates in anticipation of declining cash flows and increased risk aversion. Neither appears to be right around the corner. Instead, the office and industrial sectors are in a sweet spot in terms of NOI potential. Construction activity is ramping up, but is still expected to fall short of net absorption for the next couple of years in most markets. Additionally, there is little sign of a decline in the appetite for risk. Investors are expressing some concerns about whether properties are being overvalued and yet they continue to increase their allocations to commercial real estate.
As long as interest rate increases are accompanied by continued momentum in hiring, household income and moderate inflation growth, it will give institutional investors all the more rationale for increasing their holdings in the U.S. After all, NOI will rise along with inflation. A more distant concern is that the Fed may overcompensate and hike rates too abruptly if it appears that asset values are becoming overheated. This scenario appears unlikely until 2017 or 2018.
Steve Coutts National Head – Research United States
+1 (212) 326 8610
$0
$20,000
$40,000
$60,000
$80,000
$100,000
$120,000
$140,000
$160,000
United States OfficeOffice Property Sales (US$m)
Jun-05 to Jun-15
Source: RCA / Savills Research
Trust16%
Fund32%
Private Investor31%
Foreign Investor14%
Owner Occupier6%
Undisclosed1%
United States OfficeOffice Property Buyer Profile (%)
12 months to Jun-15
Source: RCA/Savills Research
Office Property Sales (US$ million) June 2005 – June 2015
Source: RCA/Savills Research
Office Property Buyer Profile12 months to June 2015
$0
$20,000
$40,000
$60,000
$80,000
$100,000
$120,000
$140,000
$160,000
United States OfficeOffice Property Sales (US$m)
Jun-05 to Jun-15
Source: RCA / Savills Research
Trust16%
Fund32%
Private Investor31%
Foreign Investor14%
Owner Occupier6%
Undisclosed1%
United States OfficeOffice Property Buyer Profile (%)
12 months to Jun-15
Source: RCA/Savills Research
Source: RCA/Savills Research
World Office Yield Spectrum 2H/2015 | 15
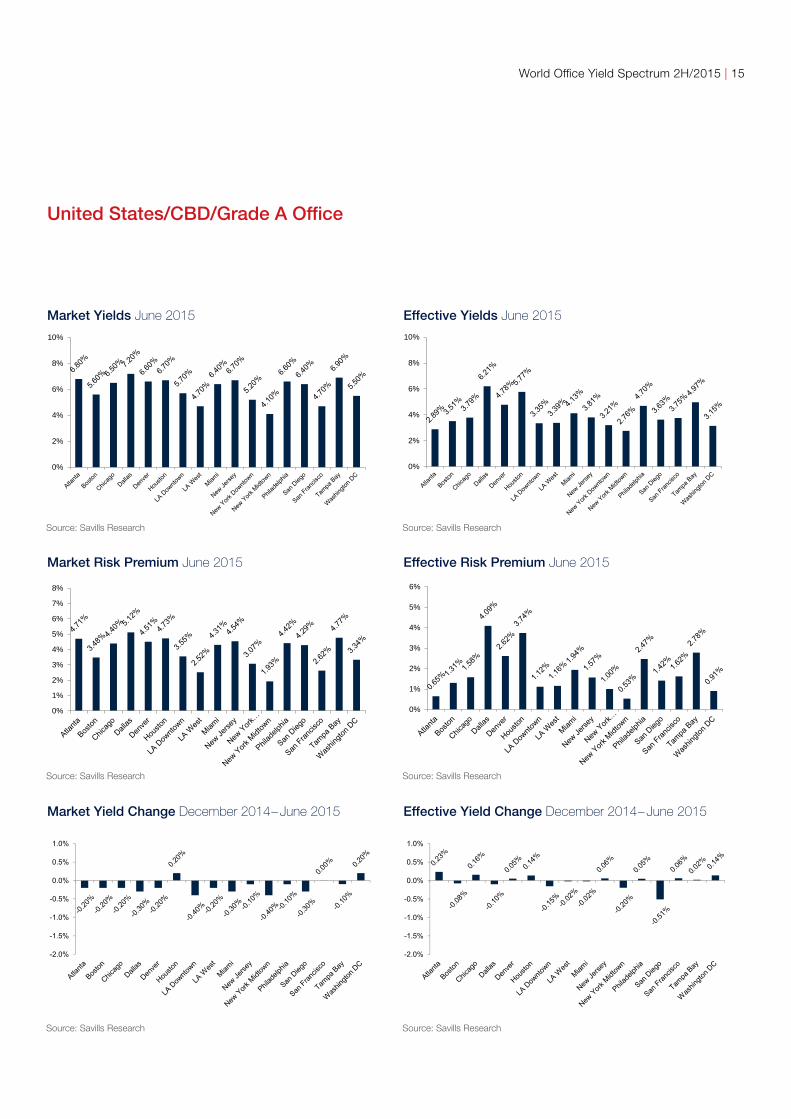
United States/CBD/Grade A Office
Market Yields June 2015 Effective Yields June 2015
Market Yield Change December 2014– June 2015 Effective Yield Change December 2014– June 2015
Market Risk Premium June 2015 Effective Risk Premium June 2015
0%
2%
4%
6%
8%
10%
World OfficeUnited States CBD Grade A Market Yields (%)
Jun-15
Source: Savills Research
0%
2%
4%
6%
8%
10%
World OfficeUnited States CBD Grade A Effective Yields (%)
Jun-15
Source: Savills Research
0%
1%
2%
3%
4%
5%
6%
7%
8%
World OfficeUnited States CBD Grade A Market Risk Premium (%)
Jun-15
Source: Savills Research
0%
1%
2%
3%
4%
5%
6%
World OfficeUnited States CBD Grade A Effective Risk Premium (%)
Jun-15
Source: Savills Research
-1 0%
-0.5%
0.0%
0.5%
1.0%
World OfficeUnited States CBD Grade A Market Yield Change (%)
Dec-14 to Jun-15
-2.0%
-1.5%
1.0%
Source: Savills Research
0%
2%
4%
6%
8%
10%
World OfficeUnited States CBD Grade A Market Yields (%)
Jun-15
Source: Savills Research
0%
2%
4%
6%
8%
10%
World OfficeUnited States CBD Grade A Effective Yields (%)
Jun-15
Source: Savills Research
0%
1%
2%
3%
4%
5%
6%
7%
8%
World OfficeUnited States CBD Grade A Market Risk Premium (%)
Jun-15
Source: Savills Research
0%
1%
2%
3%
4%
5%
6%
World OfficeUnited States CBD Grade A Effective Risk Premium (%)
Jun-15
Source: Savills Research
-1 0%
-0.5%
0.0%
0.5%
1.0%
World OfficeUnited States CBD Grade A Effective Yield Change (%)
Dec-14 to Jun-15
-2.0%
-1.5%
1.0%
Source: Savills Research
Source: Savills Research
Source: Savills Research
Source: Savills Research
Source: Savills Research
Source: Savills Research
Source: Savills Research


World Office Yield Spectrum 2H/2015 | 17
About
Savills With a rich heritage and a reputation for excellence that dates back to 1855, Savills is a leading global real estate provider listed on the London Stock Exchange.
Savills advises corporate, institutional and private clients, seeking to acquire, lease, develop or realise the value of prime residential and commercial property across the world’s key markets.
Savills is a company that leads rather than follows with more than 600 owned and associate offices throughout the UK, Europe, Americas, Asia Pacific, Africa and the Middle East. With more than 30,000 staff, we seek out people who possess that rare mix of entrepreneurial flair and rock solid integrity, and are focused on delivering clients with advice and expertise of the highest calibre.
A powerful combination of global connections and deep local knowledge provides Savills with an almost unparalleled ability to connect people and property.
Savills extensive Asia Pacific network spans 50 offices throughout Australia, New Zealand, China, Hong Kong, India, Indonesia, Japan, Korea, Macao, Malaysia, Myanmar, Philippines, Singapore, Taiwan, Thailand and Vietnam.
Savills offers the full spectrum of services from providing strategic advice to managing assets and projects and transacting deals. With a firmly embedded corporate culture that values initiative, innovation and integrity, clients receive outstanding service and can be assured of the utmost professionalism.
For advice that gives advantage, contact Savills.
Deakin University Through its agenda LIVE the future, Deakin aims to build the jobs of the future, using the opportunities of the digital age to widen access to education and make a difference to the communities it serves.
Deakin enjoys a reputation for being accessible, helpful and friendly. It has a longstanding record for its use of cutting-edge information technology while providing highly personalised experiences, whether in the cloud on Deakin’s media-rich campuses or through a combination of cloud and campus learning. Deakin has over 50,000 students, with a third choosing to study wholly in the cloud (online).
Deakin was awarded a 5-star rating by the prestigious university ranking organisation Quacquarelli Symonds (QS); the rating indicates Deakin is world-class in a broad range of areas, has cutting-edge facilities and is internationally renowned for its research and teaching. Deakin is in the top 50 of the QS ranking of the world’s universities under 50 years.
Deakin is now in the top 3 percent of the world’s universities in each of the three major international rankings including the prestigious Shanghai Jiao Tong Academic Ranking of World Universities (ARWU), Times Higher Education and QS World University Rankings. Established in 1974, Deakin was Victoria’s fourth university and the first in regional Victoria. In 2014 Deakin celebrated its 40th anniversary.
Deakin has been strengthened by a series of successful mergers with strong partners, each of whom has contributed significantly to our character and approach. Today, Deakin operates in a global, connected world with the digital economy influencing every aspect of our activities.
Tony Crabb National Head – Research Australia
+61 (0) 422 221 604
Professor Richard ReedChair in Property & Real Estate
+61 (0) 3 9251 7605
United Kingdom Simon HopeHead of GlobalCapital Markets+44 (0) 20 7409 [email protected]
Rasheed HassanDirector, Head ofCross Border Investment+44 (0) 20 7409 [email protected]
Ned BaringDirector, ResidentialCross Border Investment+44 (0) 20 7409 [email protected]
Cordea Savills Jon CrossfieldHead of Investment Mandates+44 (0) 207 409 [email protected]
Europe Tristam LarderDirector, European Investment+44 (0) 20 7409 [email protected]
Nick Hart Head of UK & European Shopping Centre Investment +44 (0) 207 409 [email protected]
Dirk Hoenig-OhnsorgDirector, Cross BorderInvestment+49 89 427 292 [email protected]
Asia Pacific Frank MarriottRegional Head,Capital Markets+852 2842 [email protected]
Middle EastHassan FarranDirector, Cross Border Investment+44 (0) 20 7409 [email protected]
AustralasiaPaul CraigManaging Director+61 (0) 8 9488 [email protected]
North AmericaRobert StammManaging Director+1 (949) 679 [email protected]
Guy Benn Director, Cross Border Investment+1 (212) 328 [email protected]
Savills Key Contacts
Cross Border Investment
Revisions: For technical reasons revisions were undertaken to the previous edition in the following markets: Vietnam, Singapore, Paris, the United States.
This information is general information only and is subject to change without notice. No representations or warranties of any nature whatsoever are given, intended or implied. Savills will not be liable for any omissions or errors. Savills will not be liable, including for negligence, for any direct, indirect, special, incidental or consequential losses or damages arising out of our in any way connected with use of any of this information. This information does not form part of or constitute an offer or contract. You should rely on your own enquiries about the accuracy of any information or materials. All images are only for illustrative purposes. This information must not be copied, reproduced or distributed without the prior written consent of Savills. ©Savills 2015
Worldwide Research
Asia PacificSimon SmithSenior Director, Research +852 2842 [email protected]
AustraliaTony CrabbNational Head, Research+61 (0) 422 221 [email protected]
ChinaJames MacdonaldDirector, China+8621 6391 [email protected]
Joan Wang Director+8610 5925 [email protected]
Dave Law Senior Associate Director +8628 8658 7120 [email protected]
Sam HeSenior Manager+8620 3892 [email protected]
Hong KongJack TongDirector, Research & Consultancy+852 2842 [email protected]
Ron MakAssistant Manager, Research & Consultancy+852 2842 [email protected]
IndonesiaAnton SitorusAssociate, Research & Consultancy+62 (21) 293 293 [email protected]
JapanHafiz IsmailResearch & Consultancy+81 (3) 5562 [email protected]
KoreaJoAnn Jieun Hong Director, Research & Consultancy+82 2 2124 4182 [email protected]
Jihea LeeSenior Manager, Research & Consultancy +82 (0) 2 2124 [email protected]
PhilippinesAntton NordbergHead of Research+63 (917) 599 44 [email protected]
SingaporeAlan CheongSenior Director, Research & Consultancy+65 6415 [email protected]
SpainGema de la Fuente Director, Research +34 91 310 10 16
TaiwanErin TingSenior Manager+886 (2) 8789 5828 [email protected]
VietnamTroy GriffithsDeputy Managing Director+84 (0) 933 276 [email protected]
EuropeMat OakleyHead of European Research+44 (0) 20 7409 [email protected]
Lydia BrissyEuropean Research Director+33 1 44 51 73 [email protected]
Eri MitsostergiouEuropean Research Director+31 20 301 [email protected]
FranceMarie Josée LopesHead of France Research+33 1 44 51 17 [email protected]
GermanyMatthias PinkHead of Germany Research+49 30 726 165 [email protected]
United StatesSteve CouttsNational Head Research United States+1 (212) 326 [email protected]
Keith DeCosterSenior Manager, U.S. Real Estate Analytics+1 (212) 326 [email protected]
Mike RoessleManager, U.S. Real Estate Analytics+1 (212) 326 [email protected]

savills.com Savills World Research