
By Mari Riess Jones The Dynamics of Attending and Scene Analysis.

18th WORLD EDITORS FORUM
63rd WORLD NEWSPAPER CONGRESS
Titel: World Press Trends 2011Speaker: Christoph Riess

www.wan-ifra.org
WORLD PRESS TRENDS 2011
Christoph Riess
© 2011 WAN-IFRA | 3
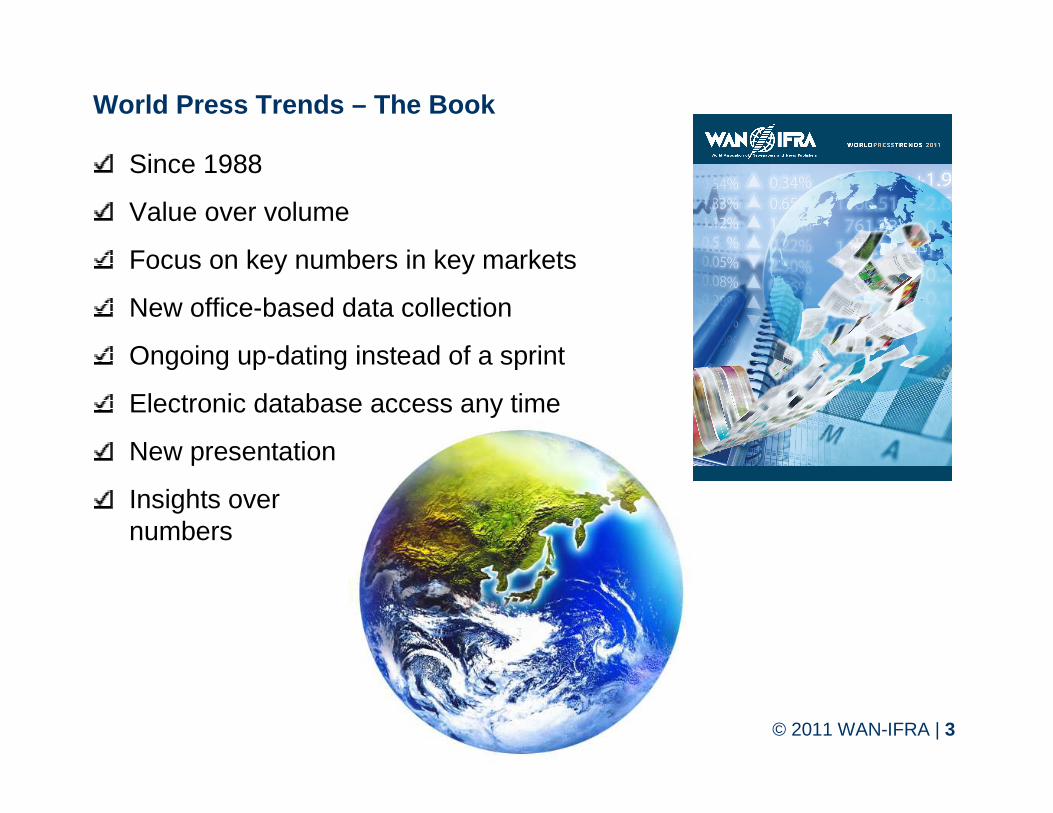
Since 1988
Value over volume
Focus on key numbers in key markets
New office-based data collection
Ongoing up-dating instead of a sprint
Electronic database access any time
New presentation
Insights overnumbers
World Press Trends – The Book
© 2011 WAN-IFRA | 4
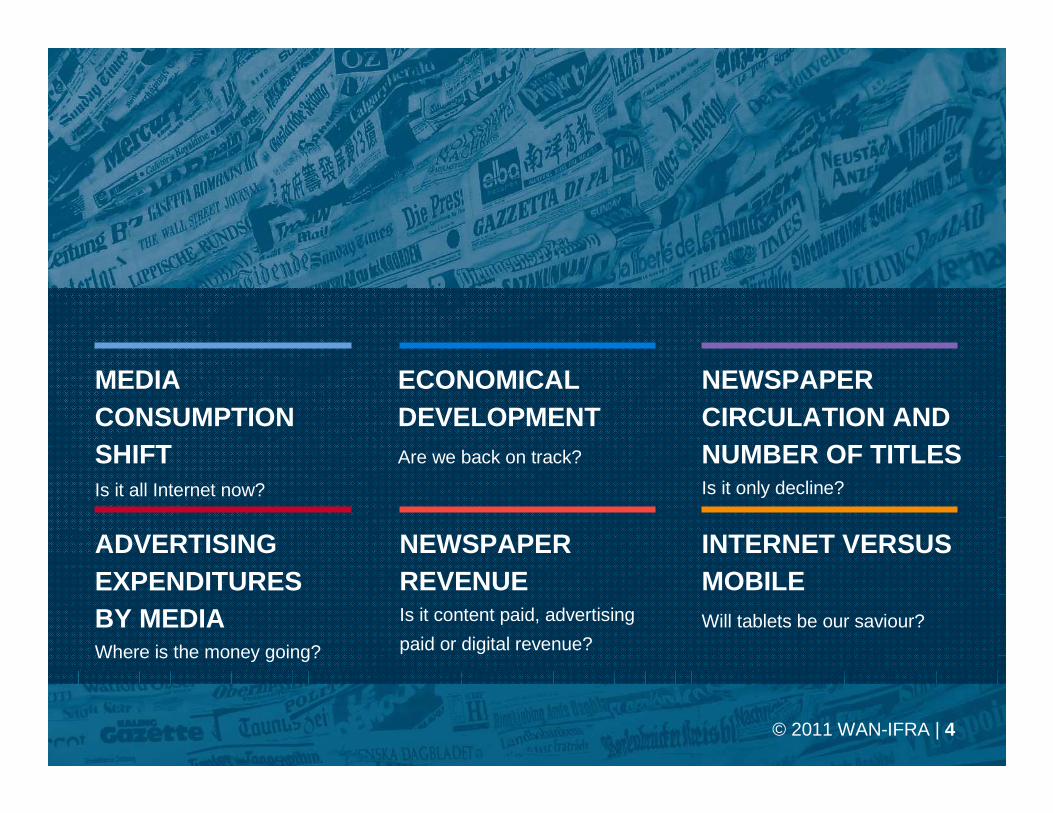
MEDIA CONSUMPTION SHIFTIs it all Internet now?
ADVERTISING EXPENDITURES BY MEDIAWhere is the money going?
ECONOMICAL DEVELOPMENTAre we back on track?
NEWSPAPER CIRCULATION AND NUMBER OF TITLESIs it only decline?
NEWSPAPER REVENUEIs it content paid, advertising
paid or digital revenue?
INTERNET VERSUS MOBILEWill tablets be our saviour?
© 2011 WAN-IFRA | 5
MEDIA CONSUMPTION SHIFTIs it all Internet now?
© 2011 WAN-IFRA | 6
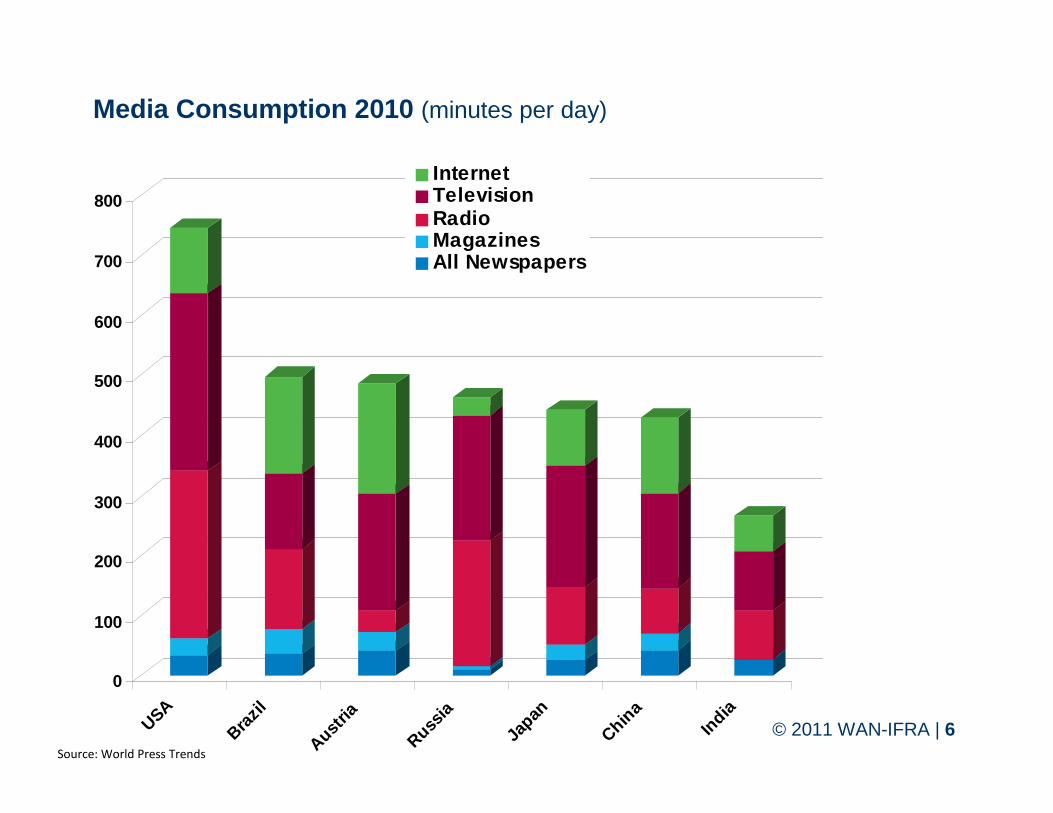
Media Consumption 2010 (minutes per day)
0
100
200
300
400
500
600
700
800
USA
Brazil
Austri
a
Russia
Japa
n
China
Ind ia
InternetTelevisionRadioMagazinesAll Newspapers
Source: World Press Trends
© 2011 WAN-IFRA | 7
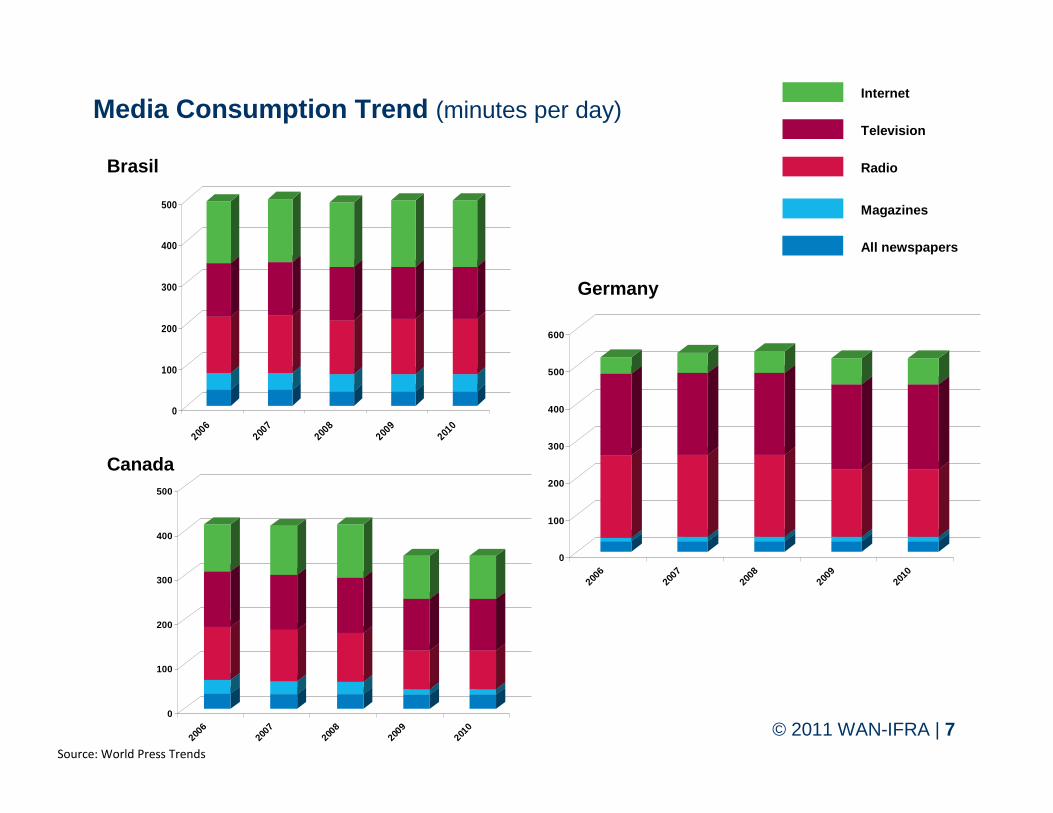
Internet
Television
Radio
Magazines
All newspapers
Canada
Germany
Media Consumption Trend (minutes per day)
0
100
200
300
400
500
2006
2007
2008
2009
2010
Brasil
0
100
200
300
400
500
2006
2007
2008
2009
2010
0
100
200
300
400
500
600
2006
2007
2008
2009
2010
Source: World Press Trends
© 2011 WAN-IFRA | 8
ECONOMICALDEVELOPMENTAre we back on track?
© 2011 WAN-IFRA | 9
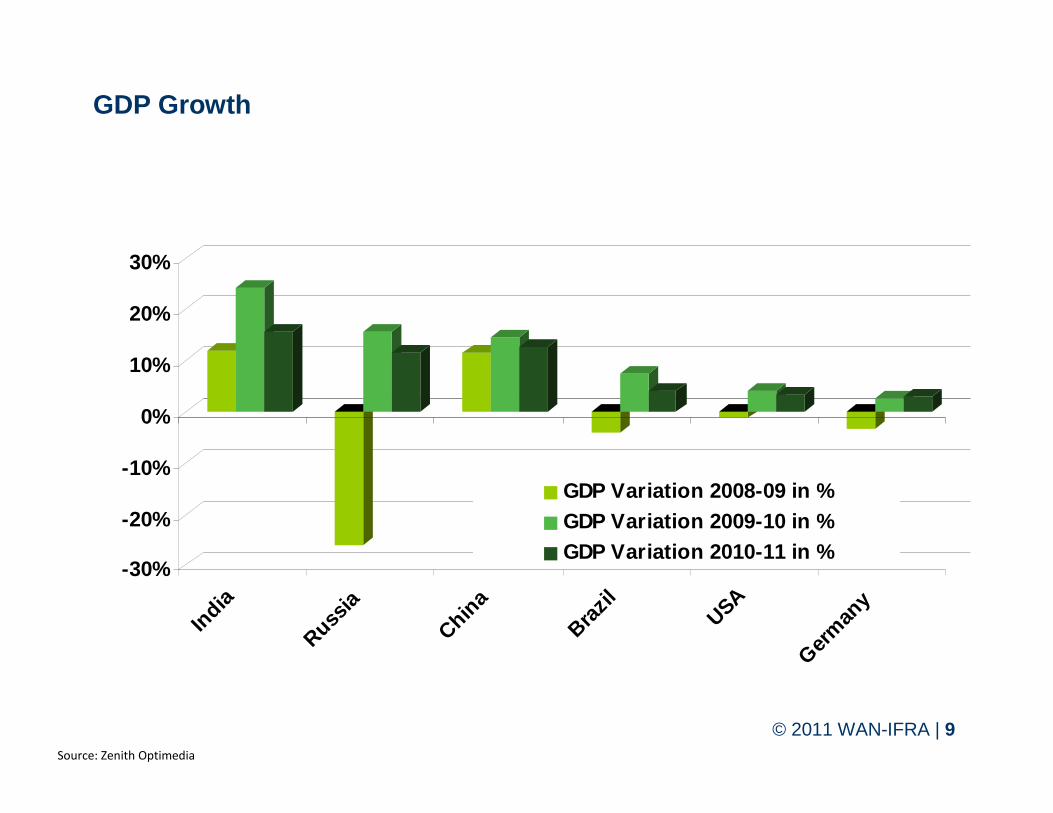
GDP Growth
-30%
-20%
-10%
0%
10%
20%
30%
Indi
a
Russ ia
China
Braz il
USA
Germ
any
GDP Variation 2008-09 in %GDP Variation 2009-10 in %GDP Variation 2010-11 in %
Source: Zenith Optimedia
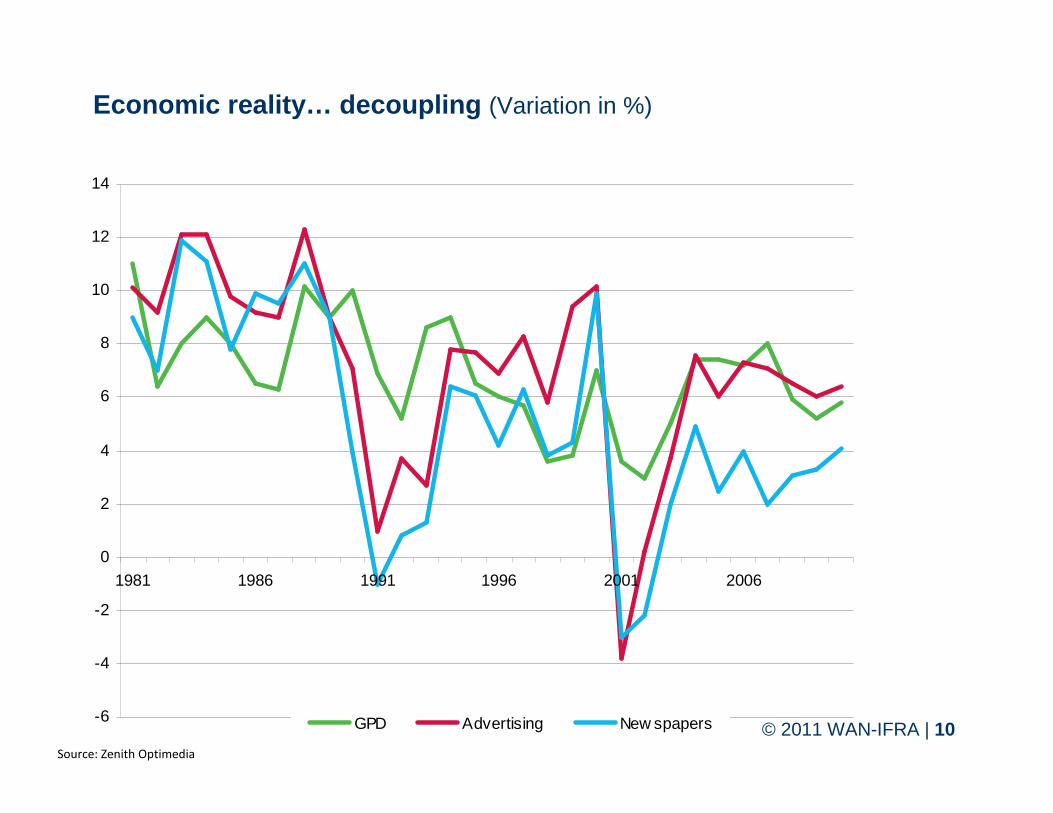
© 2011 WAN-IFRA | 10Need toSource: Zenith Optimedia
Economic reality… decoupling (Variation in %)
-6
-4
-2
0
2
4
6
8
10
12
14
1981 1986 1991 1996 2001 2006
GPD Advertising New spapers
© 2011 WAN-IFRA | 11
NEWSPAPER CIRCULATIONIs it only decline?
© 2011 WAN-IFRA | 12
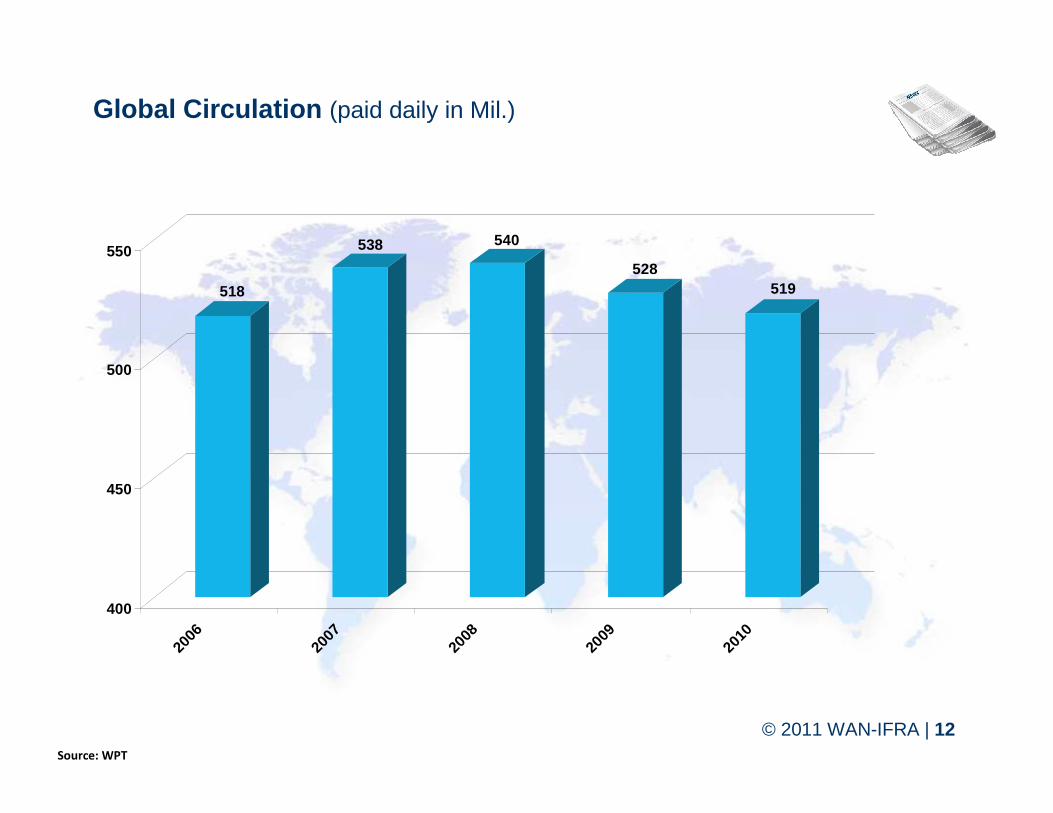
Global Circulation (paid daily in Mil.)
518
538 540
528519
400
450
500
550
2006
2007
2008
2009
2010
Source: WPT
© 2011 WAN-IFRA | 13
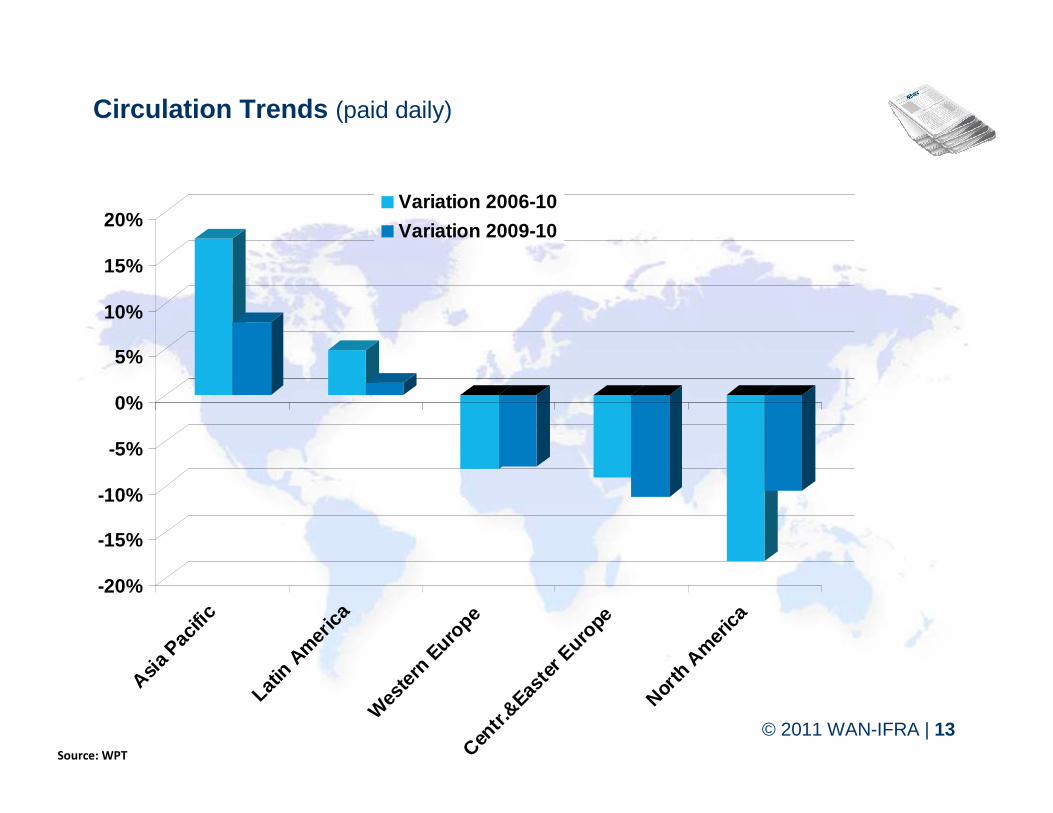
Circulation Trends (paid daily)
-20%
-15%
-10%
-5%
0%
5%
10%
15%
20%
Asia P
acifi
c
Lati n
Am
erica
Wes
tern
Eur
ope
Centr.
&Easte
r Eur
o pe
North
Am
erica
Variation 2006-10
Variation 2009-10
Source: WPT
© 2011 WAN-IFRA | 14
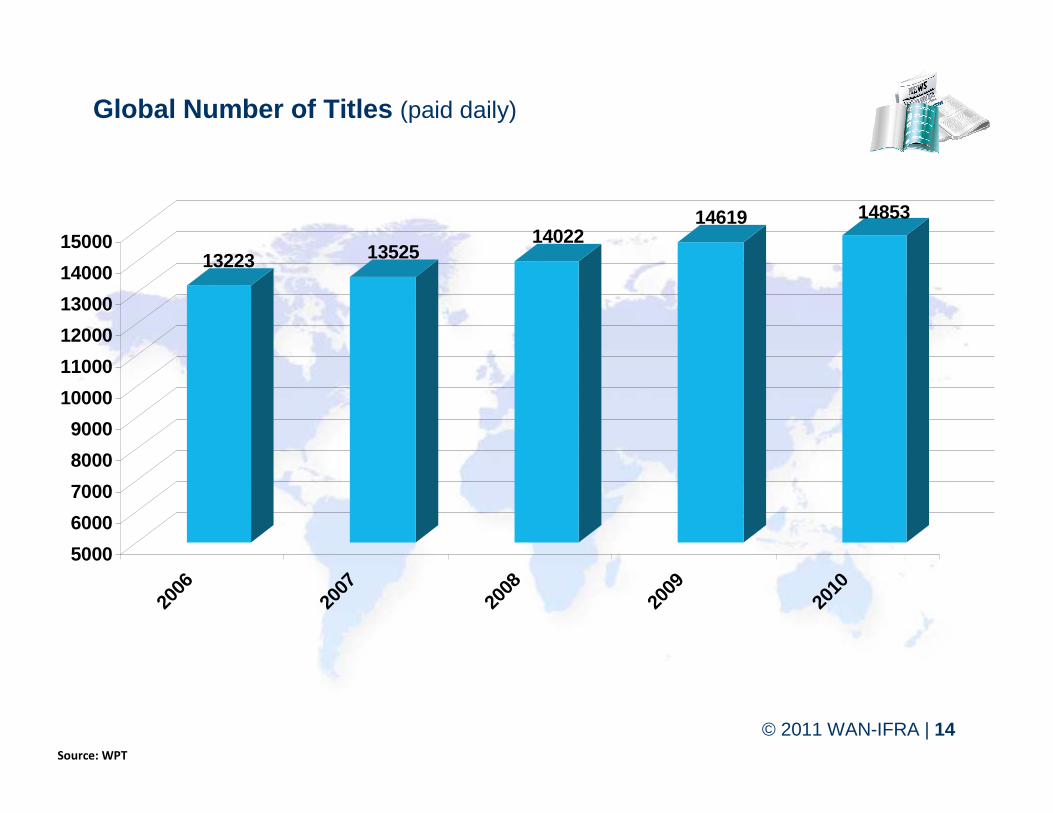
Global Number of Titles (paid daily)
Source: WPT
13223 1352514022
14619 14853
5000
6000
7000
8000
9000
10000
11000
12000
13000
14000
15000
2006
2007
2008
2009
2010
© 2011 WAN-IFRA | 15
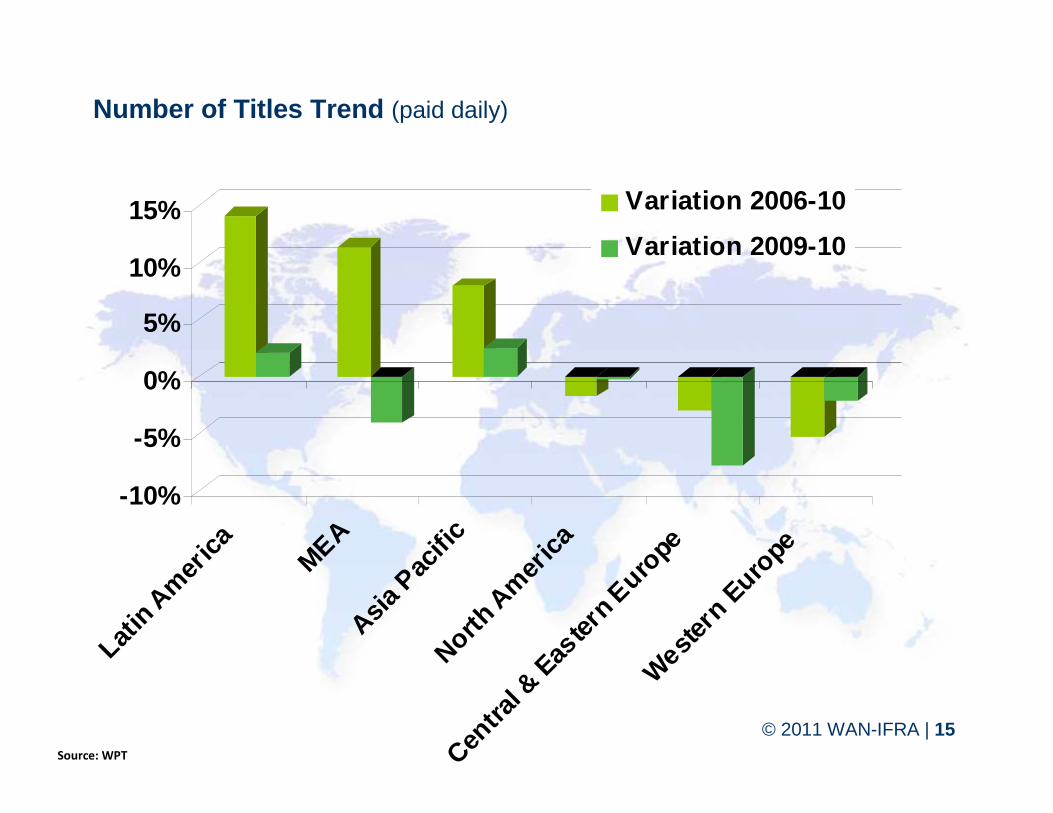
Number of Titles Trend (paid daily)
Source: WPT
-10%
-5%
0%
5%
10%
15%
Latin
Am
eric
a
MEAAsia
Pac
ific
North A
mer
ica
Centra
l & E
astern
Eur
o peW
estern
Eur
ope
Variation 2006-10
Variation 2009-10
© 2011 WAN-IFRA | 16
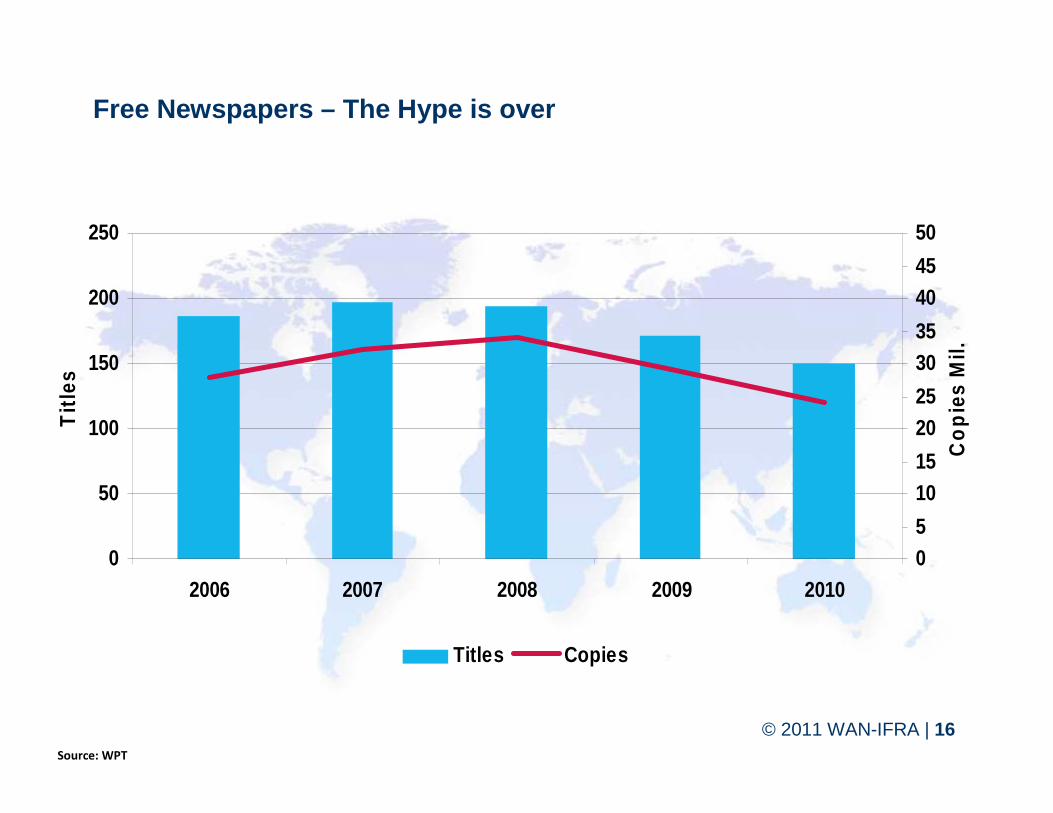
0
50
100
150
200
250
2006 2007 2008 2009 2010
Titl
es
05
1015
2025
3035
4045
50
Cop
ies
Mil.
Titles Copies
Source: WPT
Free Newspapers – The Hype is over
© 2011 WAN-IFRA | 17© 2011 WAN-IFRA | 17
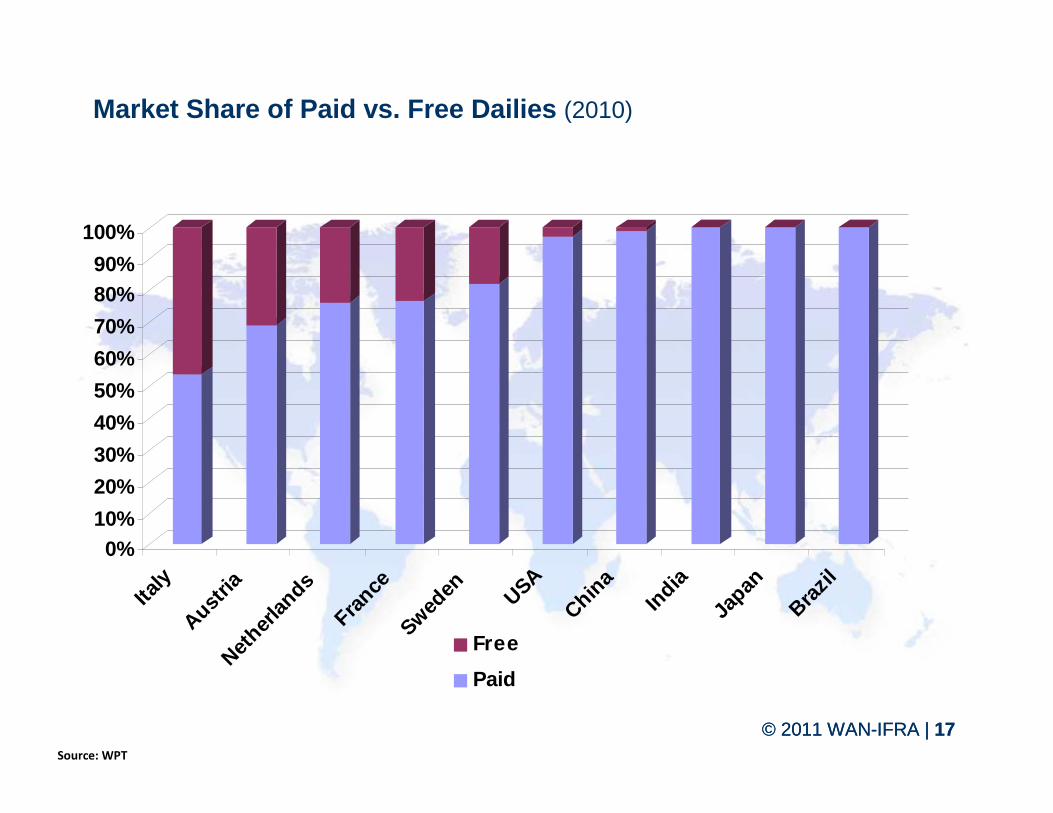
Market Share of Paid vs. Free Dailies (2010)
Source: WPT
0%10%
20%
30%
40%
50%
60%
70%
80%90%
100%
Italy
Austria
Nethe
r lands
France
Sweden USA
China
India
Japan
Brazil
Free
Paid
© 2011 WAN-IFRA | 18
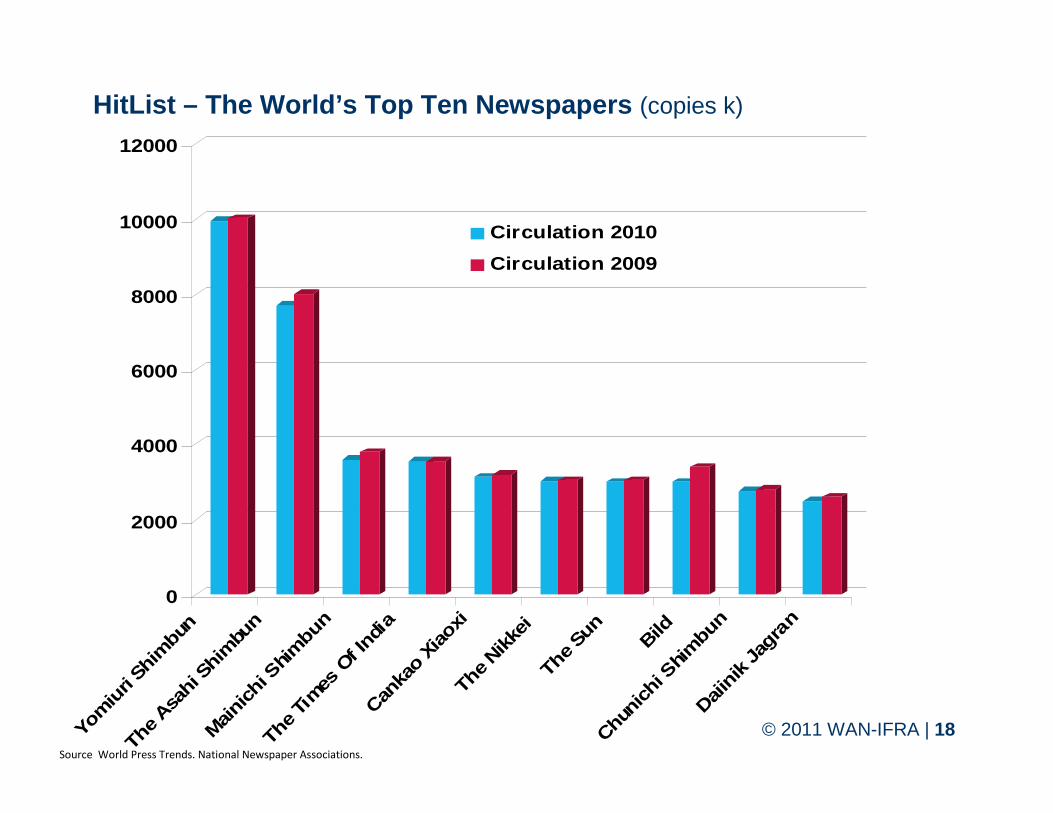
HitList – The World’s Top Ten Newspapers (copies k)
Source World Press Trends. National Newspaper Associations.
0
2000
4000
6000
8000
10000
12000
Yom
iuri
Shim
bun
The
Asahi
Shi
mbu
n
Main
ichi S
him
bun
The
Times
Of I
ndia
Canka
o Xi
aoxi
The
Nikkei
The
Sun
Bild
Chuni
chi S
him
bunDaii
nik
Jagr
anCirculation 2010
Circulation 2009
© 2011 WAN-IFRA | 19
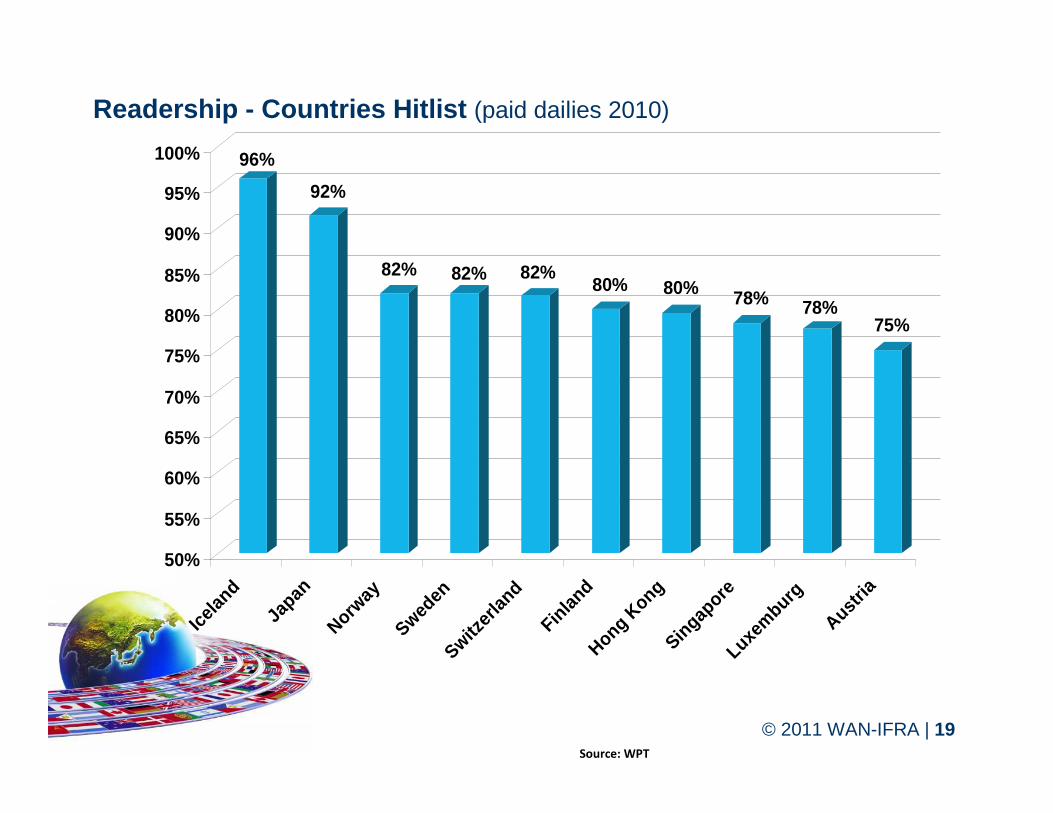
Readership - Countries Hitlist (paid dailies 2010)
96%
92%
82% 82% 82%80% 80% 78% 78%
75%
50%
55%
60%
65%
70%
75%
80%
85%
90%
95%
100%
Icelan
d
Japa
n
Norway
Sweden
Switzer
l and
Finlan
dHon
g Kon
gSing
apor
eLux
embu
rg
Austr i
a
Source: WPT
© 2011 WAN-IFRA | 20
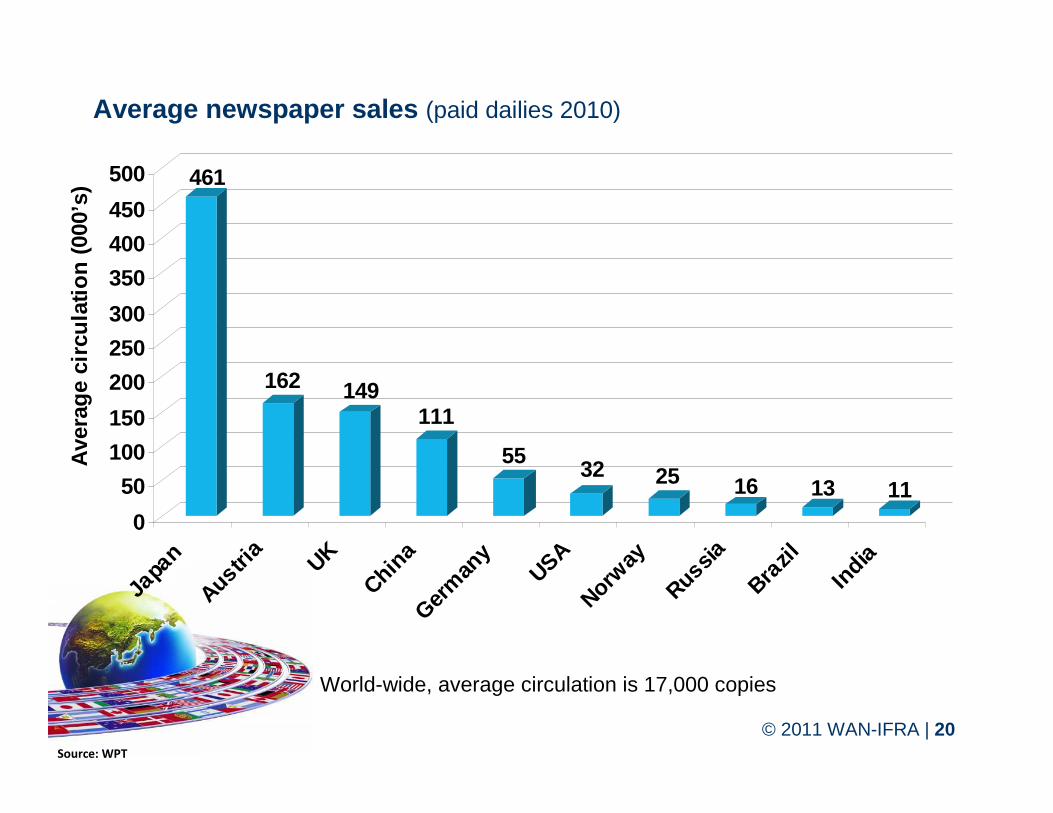
461
162 149111
5532 25 16 13 11
0
50
100
150
200
250
300
350
400
450
500
Japan
Austria
UK
China
Germ
any
USANor
way
Russia
Brazil
India
Ave
rage
circ
ulat
ion
(000
’s)
Source: WPT
World-wide, average circulation is 17,000 copies
Average newspaper sales (paid dailies 2010)
© 2011 WAN-IFRA | 21
ADVERTISING EXPENDITURES BY MEDIAWhere is the money going?
© 2011 WAN-IFRA | 22
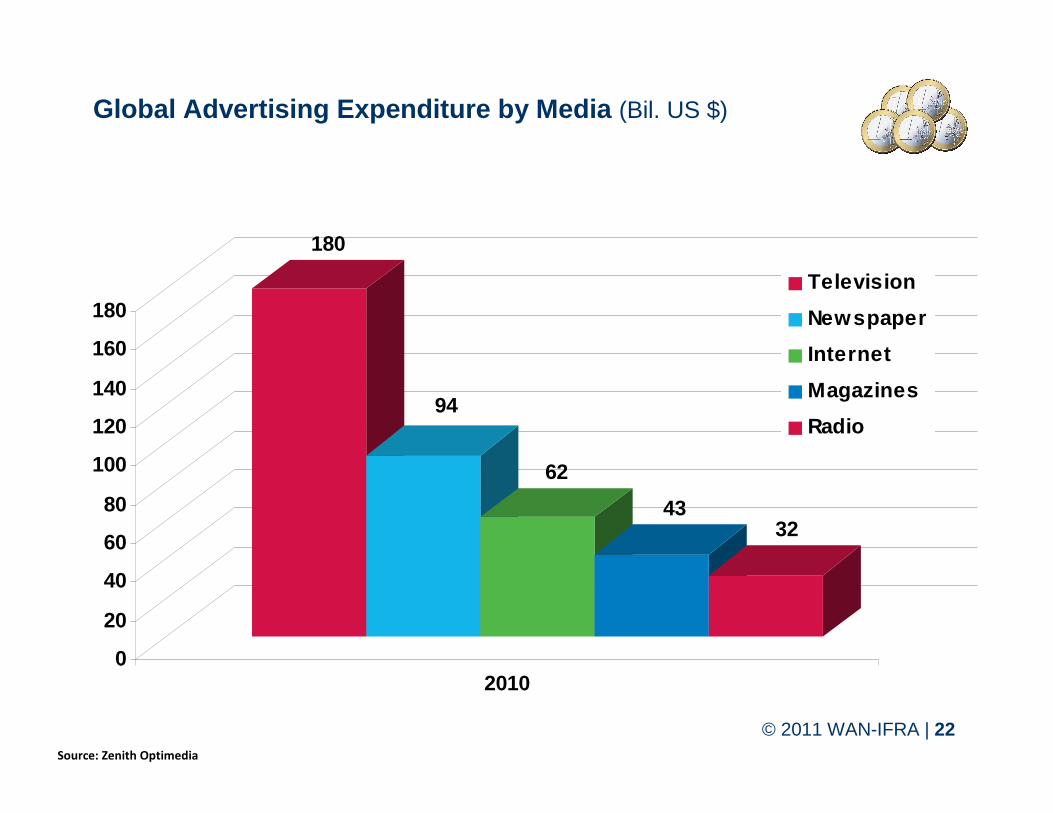
Global Advertising Expenditure by Media (Bil. US $)
180
94
62
4332
0
20
40
60
80
100
120
140
160
180
2010
Television
Newspaper
Internet
Magazines
Radio
Source: Zenith Optimedia
© 2011 WAN-IFRA | 23
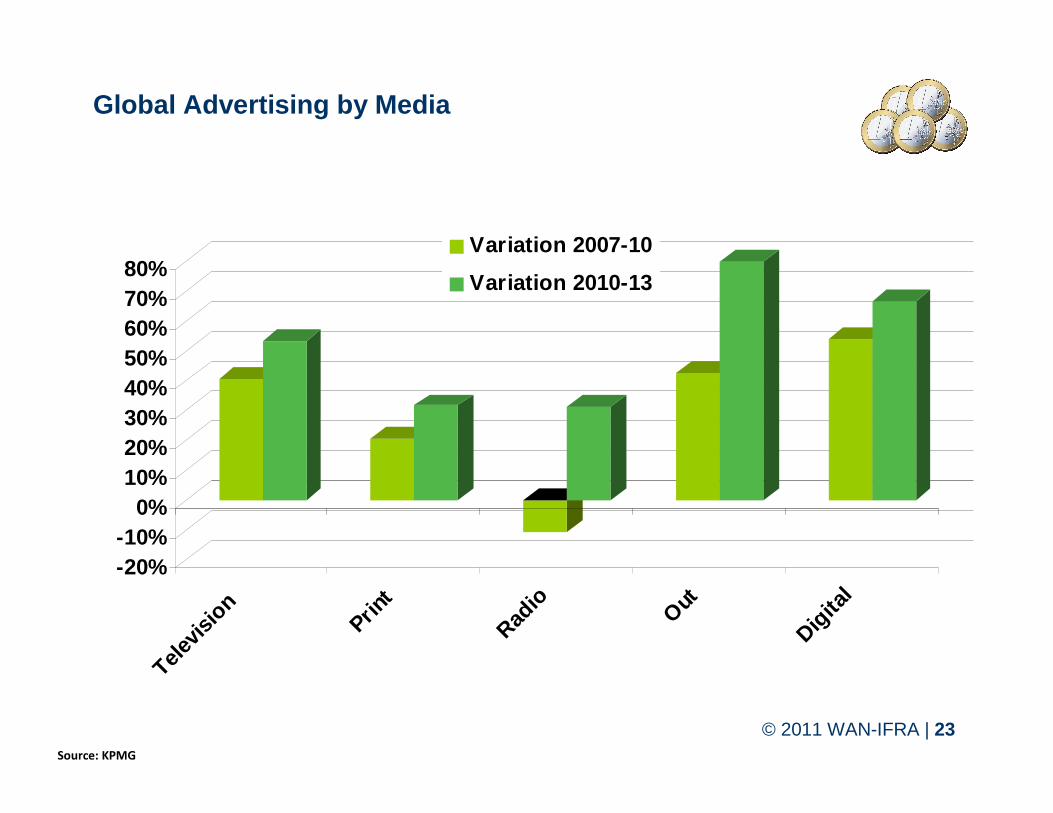
Global Advertising by Media
-20%-10%
0%10%20%30%40%50%60%70%80%
Televis
ion Print
Radio Out
Digita
l
Variation 2007-10
Variation 2010-13
Source: KPMG
© 2011 WAN-IFRA | 24
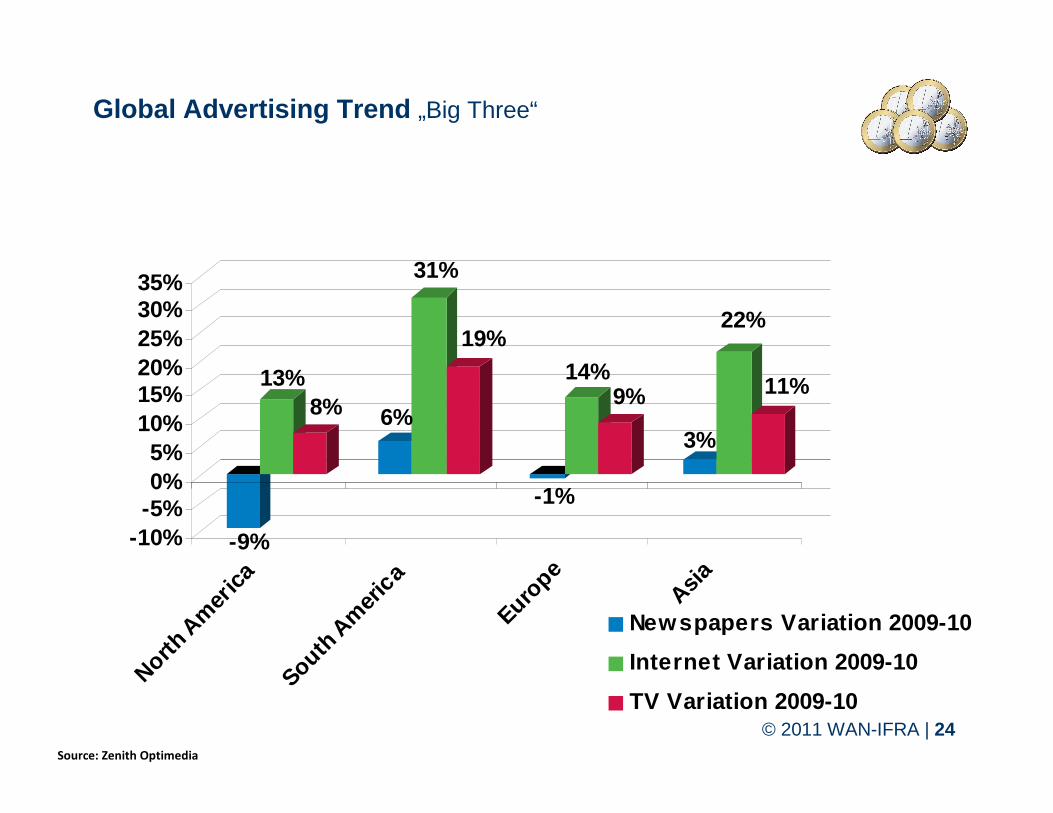
Global Advertising Trend „Big Three“
-9%
13%8% 6%
31%
19%
-1%
14%9%
3%
22%
11%
-10%-5%0%5%
10%15%20%25%30%35%
North A
mer
i ca
South
Am
eri c
a
Europ
e
Asia
Newspapers Variation 2009-10
Internet Variation 2009-10
TV Variation 2009-10
Source: Zenith Optimedia
© 2011 WAN-IFRA | 25
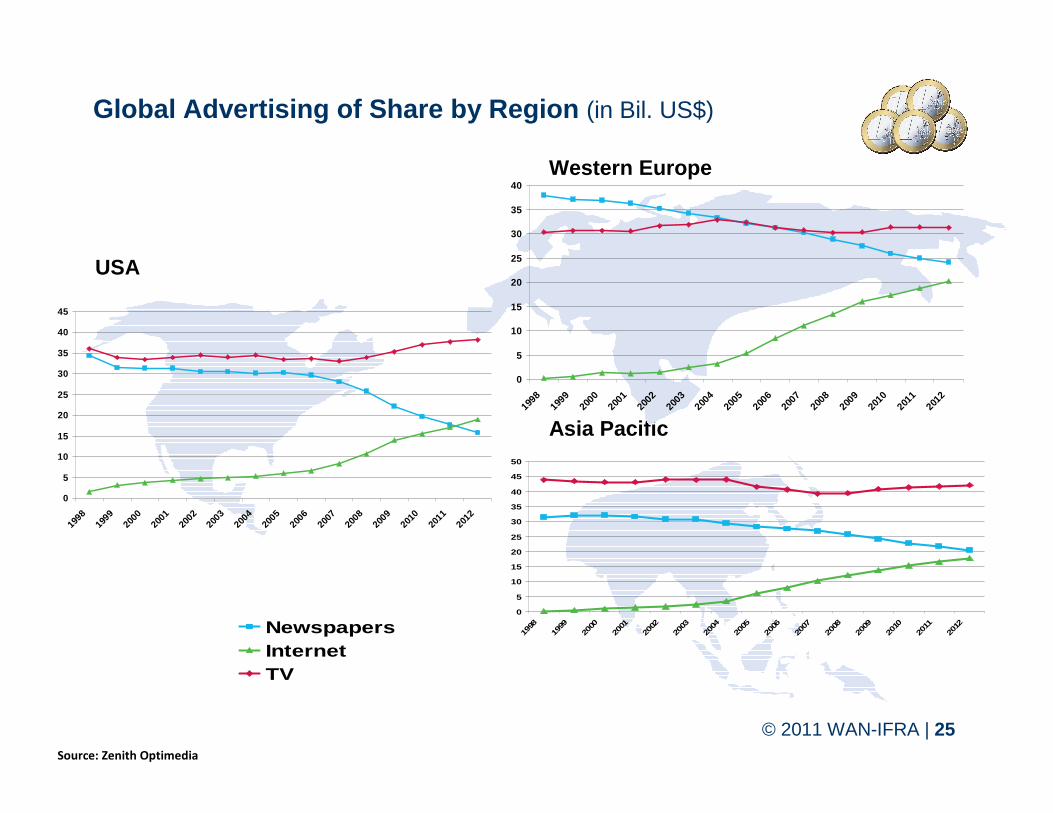
Global Advertising of Share by Region (in Bil. US$)
USA
Asia Pacific
Western Europe
Source: Zenith Optimedia
0
5
10
15
20
25
30
35
40
45
1998
1999
2000
2001
2002
2003
2004
2005
2006
2007
2008
2009
2010
2011
2012
0
5
10
15
20
25
30
35
40
1998
1999
2000
2001
2002
2003
2004
2005
2006
2007
2008
2009
2010
2011
2012
0
5
10
15
20
25
30
35
40
45
50
1998
1999
2000
2001
2002
2003
2004
2005
2006
2007
2008
2009
2010
2011
2012Newspapers
InternetTV

© 2011 WAN-IFRA | 26
NEWSPAPER REVENUEIs it content paid, advertising paid or digital revenue?
© 2011 WAN-IFRA | 27
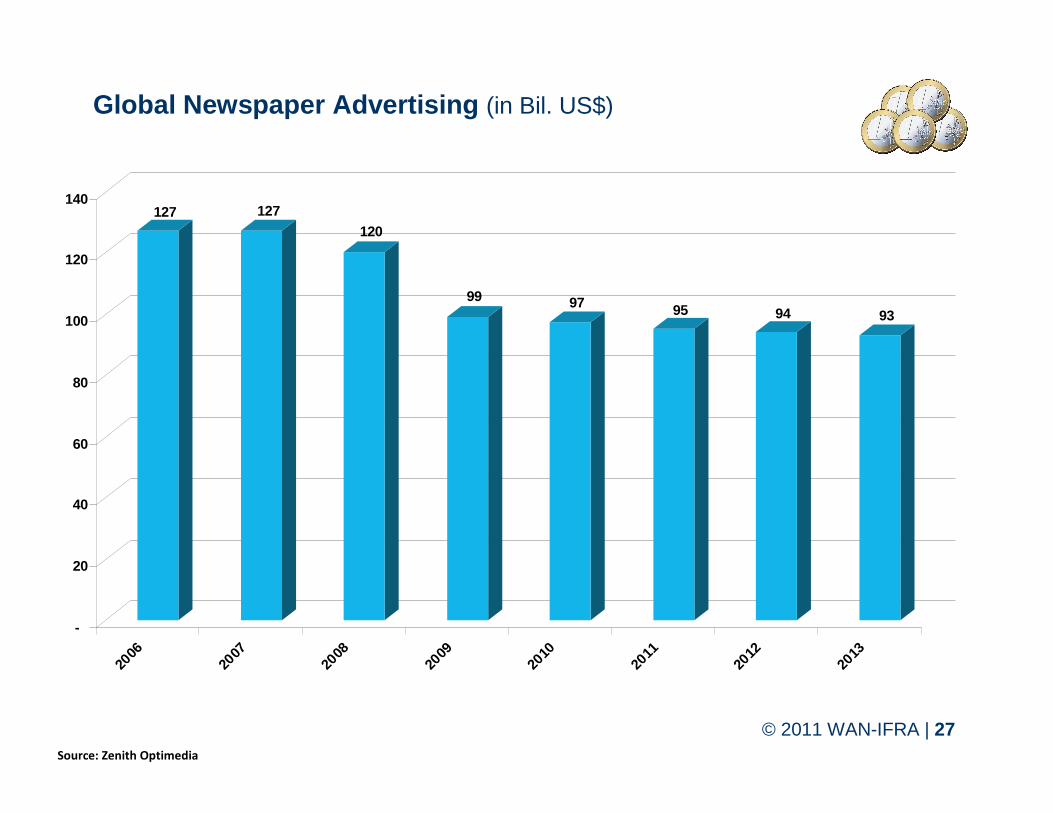
Global Newspaper Advertising (in Bil. US$)
Source: Zenith Optimedia
127 127120
99 97 95 94 93
-
20
40
60
80
100
120
140
2006
2007
2008
2009
2010
2011
2012
2013
© 2011 WAN-IFRA | 28
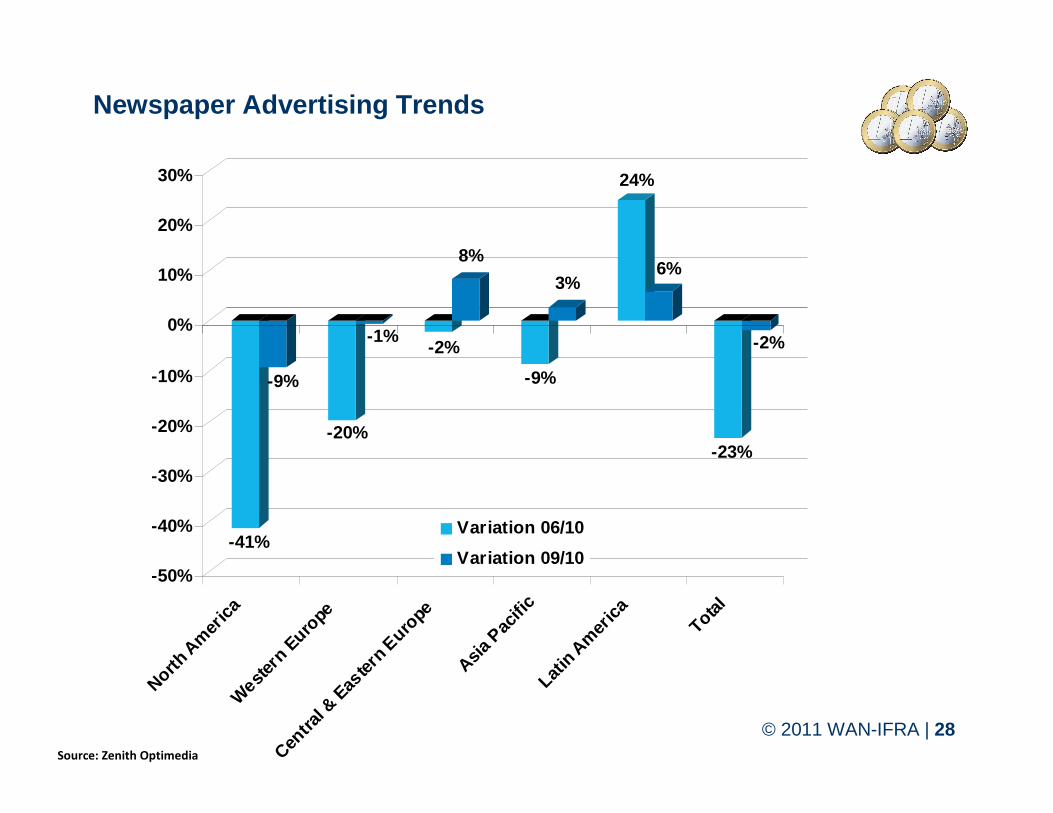
Newspaper Advertising Trends
Source: Zenith Optimedia
-41%
-9%
-20%
-1%-2%
8%
-9%
3%
24%
6%
-23%
-2%
-50%
-40%
-30%
-20%
-10%
0%
10%
20%
30%
North
Am
erica
Weste
rn E
urop
e
Centra
l & E
aster
n Eu
rope
Asia Pac
ific
Latin
Amer
ica
Total
Variation 06/10
Variation 09/10
© 2011 WAN-IFRA | 29
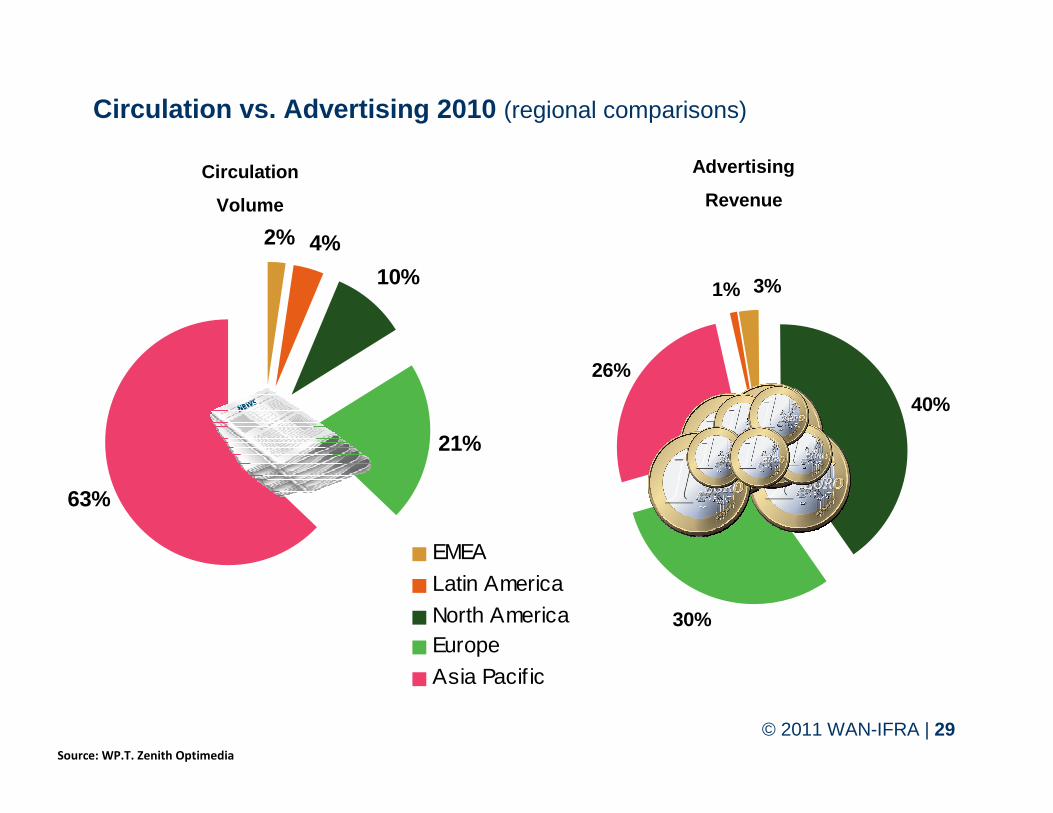
40%
30%
26%
1% 3%
2% 4%
10%
21%
63%
EMEA
Latin America
North AmericaEurope
Asia Pacif ic
Circulation
Volume
Advertising
Revenue
Circulation vs. Advertising 2010 (regional comparisons)
Source: WP.T. Zenith Optimedia

© 2011 WAN-IFRA | 30
Global Newspaper Revenue by Source US $(million)
Source PwC.
© 2011 WAN-IFRA | 31
INTERNET VERSUS MOBILEWill tablets be our saviour?
© 2011 WAN-IFRA | 32
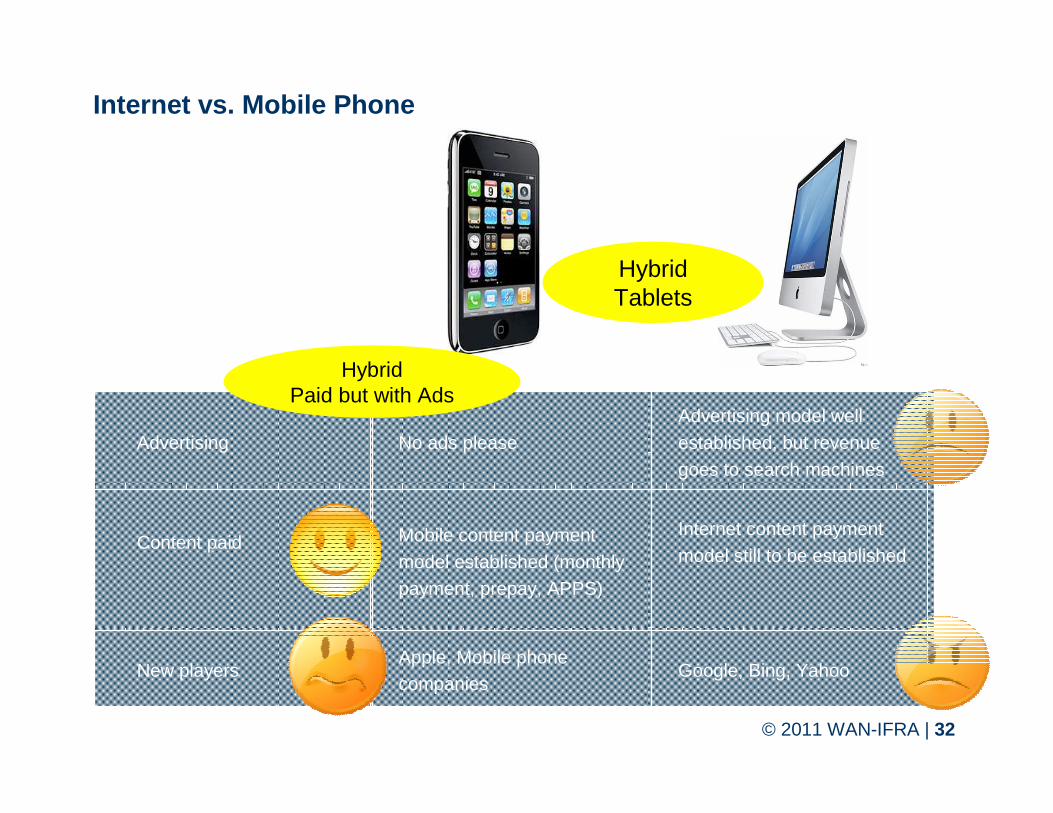
Advertising No ads please Advertising model well established, but revenue goes to search machines
Content paid Mobile content payment model established (monthly payment, prepay, APPS)
Internet content payment model still to be established
New playersApple, Mobile phone companies
Google, Bing, Yahoo
HybridPaid but with Ads
HybridTablets
Internet vs. Mobile Phone
© 2011 WAN-IFRA | 33
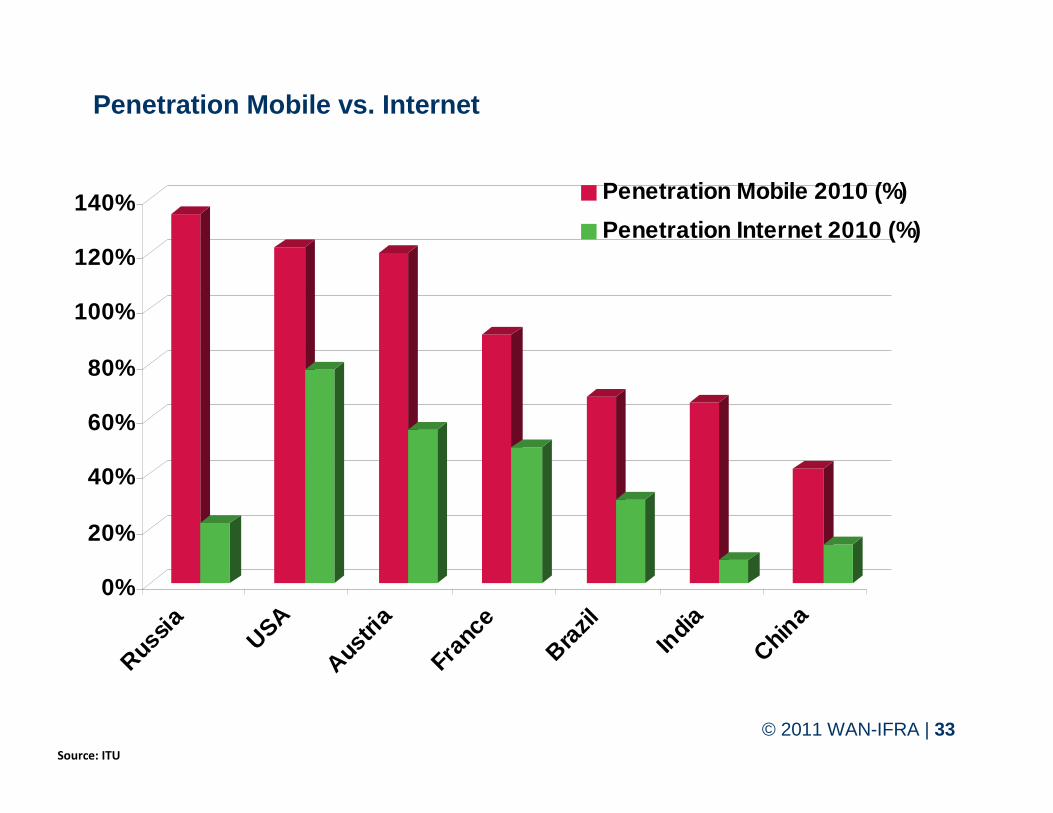
Penetration Mobile vs. Internet
0%
20%
40%
60%
80%
100%
120%
140%
Russia USA
Austria
France
Brazil
India
China
Penetration Mobile 2010 (%)
Penetration Internet 2010 (%)
Source: ITU
© 2011 WAN-IFRA | 34Source: CHISHOLM, COmscore
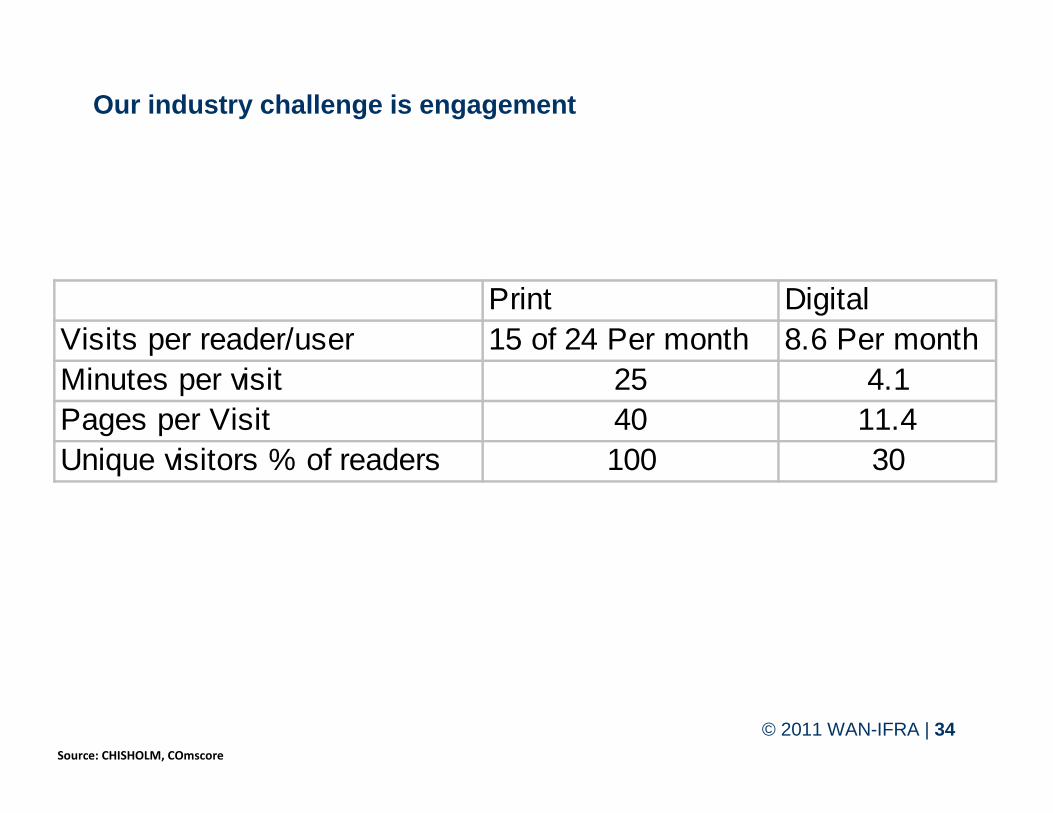
Print DigitalVisits per reader/user 15 of 24 Per month 8.6 Per monthMinutes per visit 25 4.1Pages per Visit 40 11.4Unique visitors % of readers 100 30
Our industry challenge is engagement
© 2011 WAN-IFRA | 35
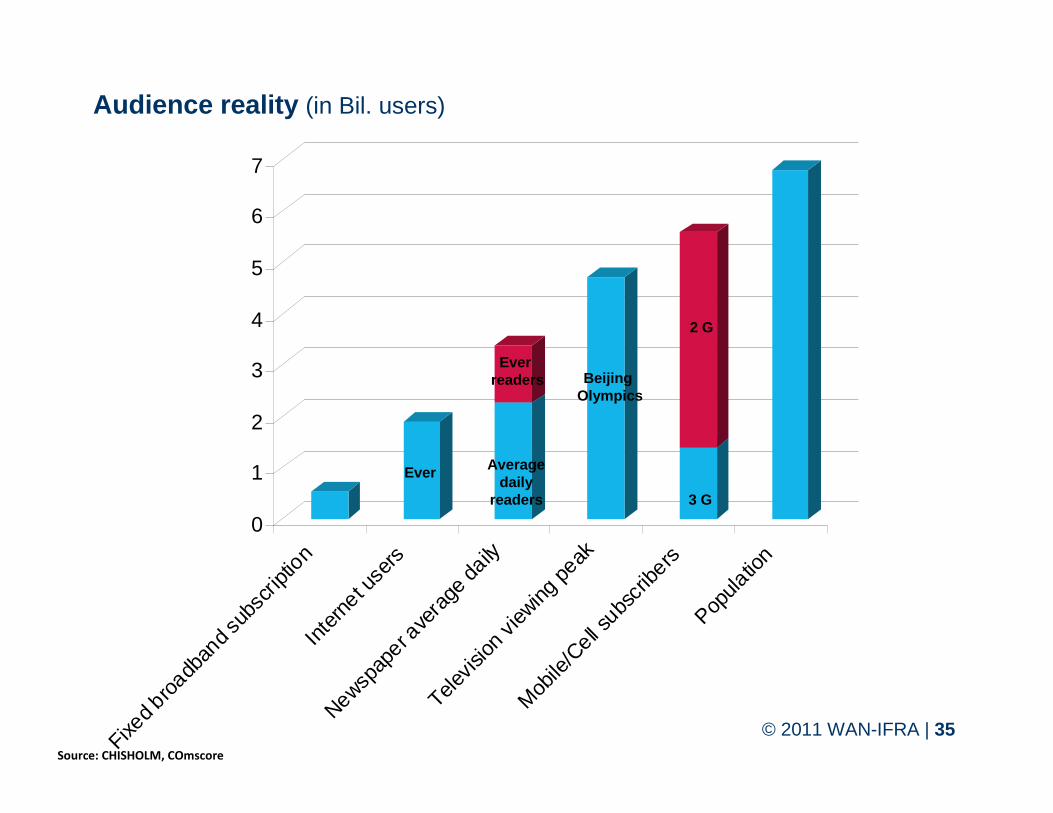
0
1
2
3
4
5
6
7
Fixed b
roadb
and s
ubsc
riptio
nIn
tern
et use
rs
Newspap
er ave
rage
daily
Televis
ion vi
ewing
peak
Mob
ile/C
ell subs
cribe
rsPop
ulatio
n
3 G
Ever readers
Averagedaily
readers
2 G
Beijing Olympics
Ever
Source: CHISHOLM, COmscore
Audience reality (in Bil. users)

© 2011 WAN-IFRA | 36© 2011 WAN-IFRA | 36
Search engines(Google, Bing)
Online news aggregators
(Digg and NetVibes)
Social Media(Twitter, Facebook)
Online news publishers
(publishing-report.com)
Mobile news actors:
(news as Mail: nypost.com)
Citizen journalism
(globalvoicesonline.org)
Social Media
© 2011 WAN-IFRA | 37
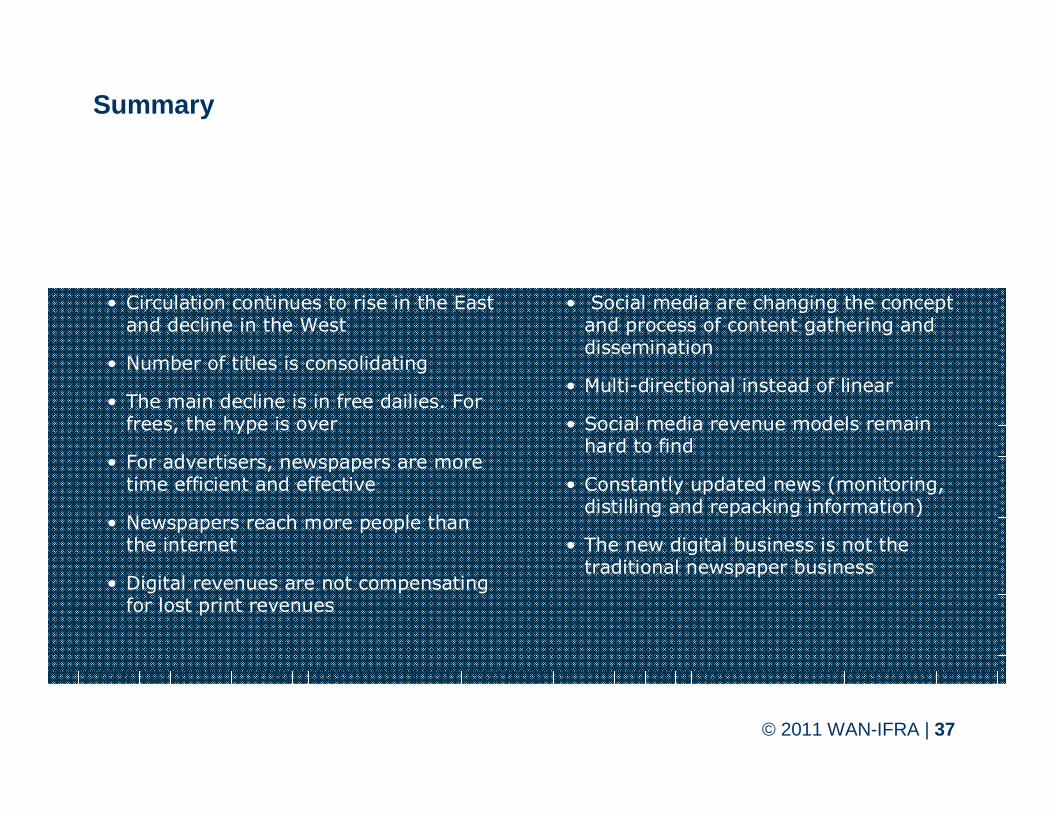
Summary
• Circulation continues to rise in the East and decline in the West
• Number of titles is consolidating
• The main decline is in free dailies. For frees, the hype is over
• For advertisers, newspapers are moretime efficient and effective
• Newspapers reach more people thanthe internet
• Digital revenues are not compensatingfor lost print revenues
• Social media are changing the concept and process of content gathering and dissemination
• Multi-directional instead of linear
• Social media revenue models remain hard to find
• Constantly updated news (monitoring, distilling and repacking information)
• The new digital business is not thetraditional newspaper business
© 2011 WAN-IFRA | 38
THANK YOU FOR YOUR ATTENTION.Christoph RiessCEO [email protected]. +49.6151.733-790
WAN-IFRA DarmstadtWashingtonplatz 164287 Darmstadt, GermanyTel. +49.6151.733-6
WAN-IFRA Paris96 bis rue Beaubourg75003 Paris, FranceTel. +33.147.4285-00


![arXiv:0812.2846v2 [astro-ph] 31 Aug 2009 · Perlmutter et al. 1999; Tonry et al. 2003; Riess et al. 2005; Astier et al. 2005; Riess et al. 2007; Wood-Vasey et al. 2007; Kowalski 2008).](https://static.fdocuments.us/doc/165x107/604f5b58c4862c50ab422156/arxiv08122846v2-astro-ph-31-aug-2009-perlmutter-et-al-1999-tonry-et-al-2003.jpg)