World Islamic Banking Competitiveness Report 2011-12.
110
-
Upload
omar-alami -
Category
Documents
-
view
223 -
download
1
description
The WIBC Competitiveness Report 2011-12 explores the key industry trends and the critical success factors guiding the global Islamic banking and finance industry to the next level of performance and growth.
Transcript of World Islamic Banking Competitiveness Report 2011-12.
A critical reference source for decision makers in the global Islamic � nance industry, providing strategic insights from Ernst & Young
Dear Banking & Finance Leader,
It is with great pleasure that we present to you the 8th annual edition of the World Islamic Banking Competitiveness Report 2011-12. This year’s original research project is developed in collaboration with leading global professional services and advisory fi rm, Ernst & Young. With a principal focus on “A Brave New World of Sustainable Growth”, the WIBC Competitiveness Report 2011-12 explores the key industry trends and the critical success factors guiding the global Islamic banking and fi nance industry to the next level of performance and growth.
The global Islamic fi nance industry has undergone major transformations in the last few years in its quest to boost international competitiveness and to build a sustainably profi table business model. There has been a focus on product innovation eff orts that aim to provide a more comprehensive array of Shari’ah-based products for the market. The global Islamic fi nance industry has also seen signifi cant developments in regulatory frameworks and Shari’ah standardization initiatives - making trans-jurisdictional market connectivity that much more achievable. However, both the challenge and the opportunity currently facing leading industry players is how will Islamic banks succeed in making the historical growth curve sustainable and profi table.
We would like to express our sincere gratitude to Ernst & Young and their world renowned Islamic Financial Services Team for investing their considerable talent and resources in developing the World Islamic Banking Competitiveness Report 2011-12. The Report is exclusively launched on-site at a special plenary session of the 18th Annual World Islamic Banking Conference (WIBC) where more than 1,200 industry leaders from over 50 countries gather to chart the future of Islamic fi nance.
Established as a critical reference resource for key industry players, thought leaders and policy makers in the global Islamic banking and fi nance industry, we hope that the analysis in this year’s Report will provide practical, constructive and valuable insights which will be useful in your own strategic planning activities and will assist your organization in its quest for success as the Islamic banking and fi nance industry enters the next phase of “Competing for Global Growth”. To fi nd out more on how your organization can play a part in this important research initiative in the future, please e-mail [email protected]
Yours sincerely,Yours sincerely,
David McLeanManaging DirectorThe 18th Annual World Islamic Banking ConferenceA MEGA Brand
A MEGA Brand: Shaping the Future of the Global Islamic Finance Industry Since 1993P.O. Box 72045, Dubai, UAE | t. +9714 343 1200 | f+971 4 343 6003MEGA Brands. MEGA Clients. Market Leaders.www.megaevents.net
18th Annual
World Islamic Banking Competitiveness Report 2011-12
‘A Brave New World of Sustainable Growth’
World Islamic Banking Competitiveness Report 2011-12
‘A Brave New World of Sustainable Growth’
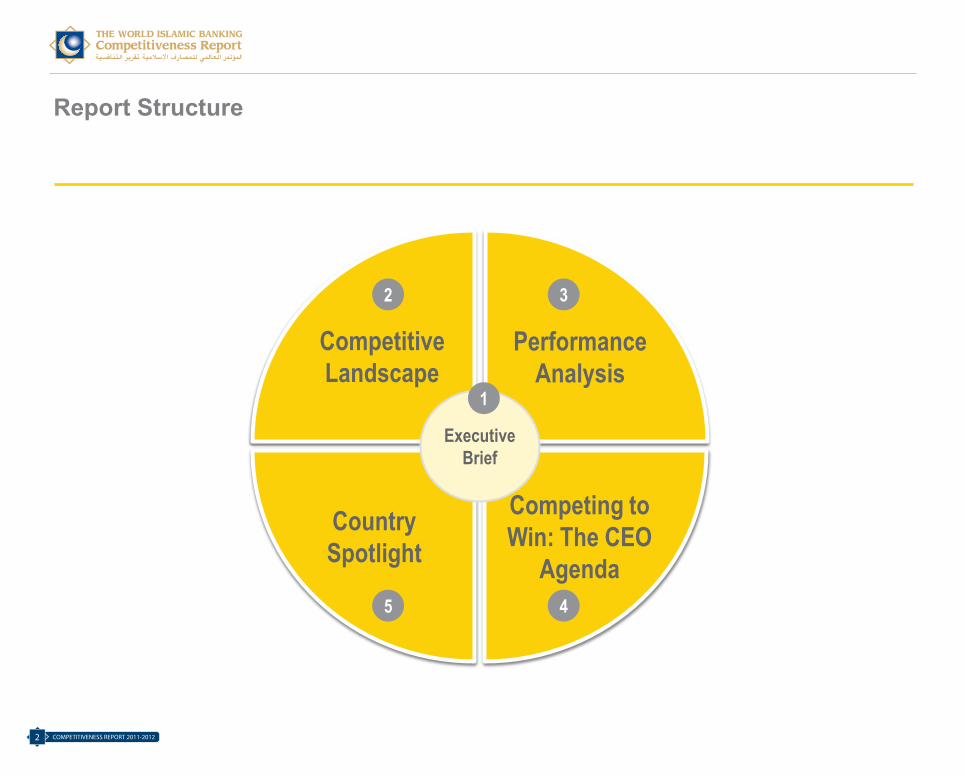
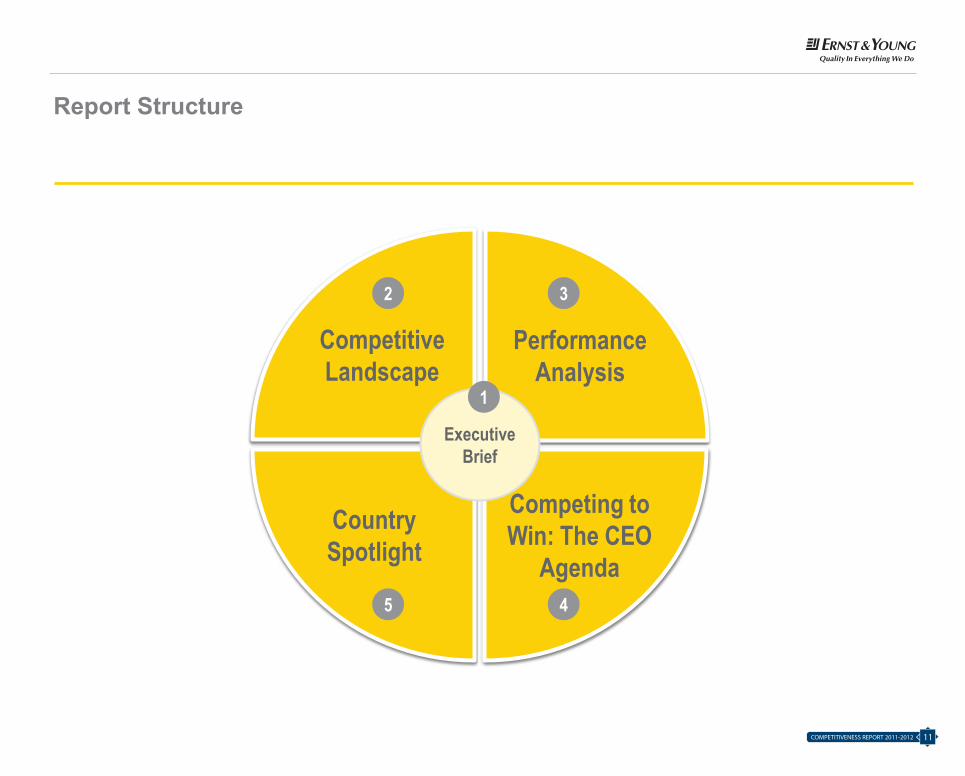
Report Structure
Performance Analysis
Competitive Landscape
Competing to Win: The CEO
Agenda
Country Spotlight
Executive Brief
1
2 3
5 4
COMPETITIVENESS REPORT 2011-20122

A Brave New World of Sustainable Growth
Dear Executive,
The global economy, and the financial markets, are at a turning point. Fast growth economies in Asia, Middle East, Africa, Latin America and Eastern Europe now form almost half of global GDP and, in 2010, they contributed 70% to overall global growth. These trends are accelerating. The dramatic developments over the past twelve months – including Arab Spring, Eurozone crises and Occupy Wall Street movement – provide further impetus for the growth of Islamic banking.
Industry forecast suggest Islamic banking assets with commercial banks globally, will reach $1.1 trillion in 2012 (2010: $826bn). Now would be the opportune time to consider establishing Islamic sovereign wealth funds to champion the growing internationalization of the industry. The iSWF will further facilitate businesses across OIC markets seeking to transform to Shari’a compliant system and also help deepen the Islamic capital market, in our view.
As for MENA, Islamic banking assets increased to $416bn in 2010, representing a five year CAGR of 20% compared to less than 9% for leading conventional banks. As new geographies open up to Islamic banking, the MENA Islamic banking industry is expected to more than double to $990bn by 2015. However, there are significant performance variations across markets. In 2010, average ROE of leading Islamic banks declined to 10%. Also, market valuations appear to be converging to that of regional conventional peers.
Our clients agree that business models needed to shape and sustain success in this new landscape are evolving in a fundamental way. Ensuring sustainable growth will require brave, meaningful and decisive Performance Improvement initiatives. Two key themes are starting to emerge:
► Excellence in banking operations – by transforming to a customer centric, efficient and scalable operating model, driven by an enhanced risk and technology orientation; and
► Product innovation – to strengthen the Shari’a differentiation and provide greater integration with the real economy
A worrying concern though is the absence of an enabling legislative, regulatory, tax and legal environment in most OIC markets, which adds to the cost and complexity of Islamic banking operation. Where there are guidelines and standards issued by industry infrastructure institutions, their reach and enforceability remains a concern. These must be addressed as priority.
Our award-winning global Islamic Finance Center of Excellence continues to work with a diverse range of financial institutions helping them realize the true potential of their business. We trust you will find this report useful.
Ashar M. NazimIslamic Financial Services LeaderErnst and Young
Imtiaz IbrahimSenior Director, Islamic Financial ServicesErnst and Young
Islamic Banking Competitiveness Report 2011-12
Page 3
3COMPETITIVENESS REPORT 2011-2012
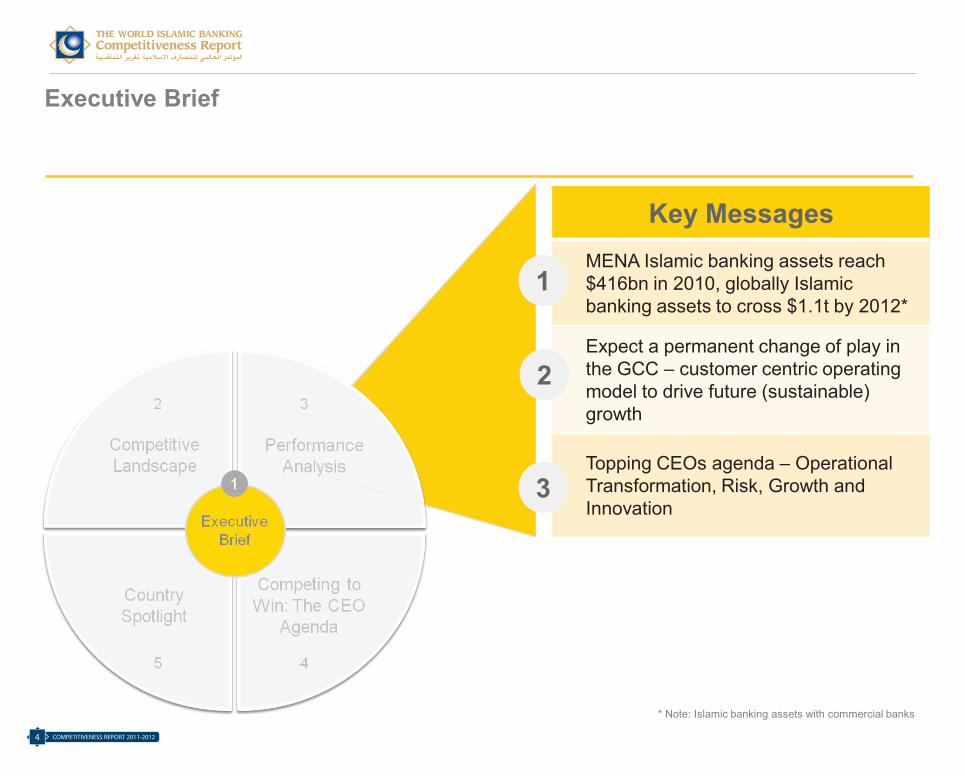
Key MessagesMENA Islamic banking assets reach $416bn in 2010, globally Islamic banking assets to cross $1.1t by 2012*
Expect a permanent change of play in the GCC – customer centric operating model to drive future (sustainable) growth
Topping CEOs agenda – Operational Transformation, Risk, Growth and Innovation
1
2
3
Executive Brief
Islamic Banking Competitiveness Report 2011-12
Page 4
* Note: Islamic banking assets with commercial banks
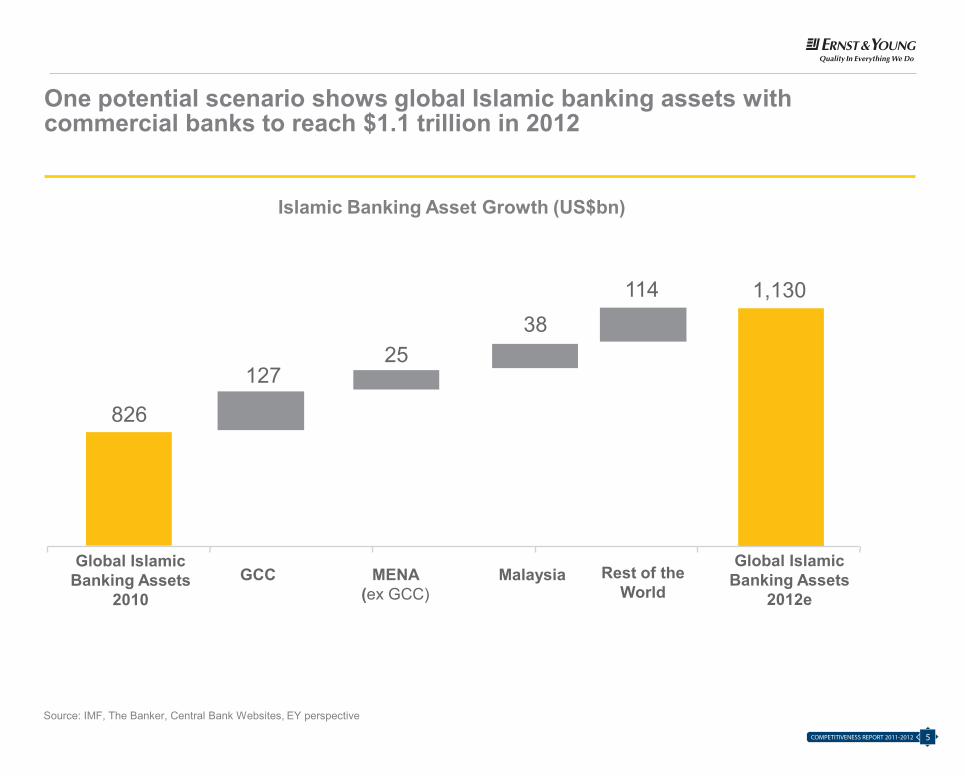
One potential scenario shows global Islamic banking assets with commercial banks to reach $1.1 trillion in 2012
Global Islamic Banking Assets
2010GCC MENA
(ex GCC)Malaysia Rest of the
World
Source: IMF, The Banker, Central Bank Websites, EY perspective
Islamic Banking Asset Growth (US$bn)
826
12725
38114 1,130
Global Islamic Banking Assets
2012e
Islamic Banking Competitiveness Report 2011-12
Page 5
COMPETITIVENESS REPORT 2011-20124
Key MessagesMENA Islamic banking assets reach $416bn in 2010, globally Islamic banking assets to cross $1.1t by 2012*
Expect a permanent change of play in the GCC – customer centric operating model to drive future (sustainable) growth
Topping CEOs agenda – Operational Transformation, Risk, Growth and Innovation
1
2
3
Executive Brief
Islamic Banking Competitiveness Report 2011-12
Page 4
* Note: Islamic banking assets with commercial banks
One potential scenario shows global Islamic banking assets with commercial banks to reach $1.1 trillion in 2012
Global Islamic Banking Assets
2010GCC MENA
(ex GCC)Malaysia Rest of the
World
Source: IMF, The Banker, Central Bank Websites, EY perspective
Islamic Banking Asset Growth (US$bn)
826
12725
38114 1,130
Global Islamic Banking Assets
2012e
Islamic Banking Competitiveness Report 2011-12
Page 5
5COMPETITIVENESS REPORT 2011-2012
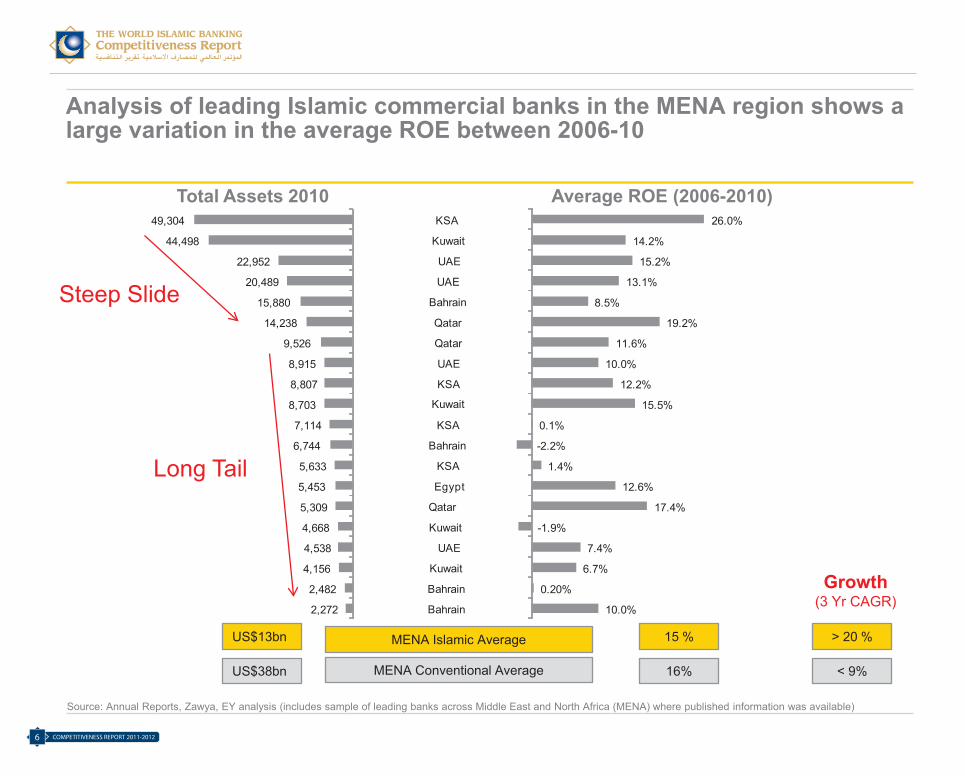
Analysis of leading Islamic commercial banks in the MENA region shows a large variation in the average ROE between 2006-10
Total Assets 2010 Average ROE (2006-2010)
Source: Annual Reports, Zawya, EY analysis (includes sample of leading banks across Middle East and North Africa (MENA) where published information was available)
MENA Conventional AverageUS$38bn 16%
MENA Islamic AverageUS$13bn 15 %
< 9%
> 20 %
Growth(3 Yr CAGR)
Steep Slide
Long Tail
Islamic Banking Competitiveness Report 2011-12
Page 6
10.0%
0.20%
6.7%
7.4%
-1.9%
17.4%
12.6%
1.4%
-2.2%
0.1%
15.5%
12.2%
10.0%
11.6%
19.2%
8.5%
13.1%
15.2%
14.2%
26.0%
Bahrain
Bahrain
Kuwait
UAE
Kuwait
Qatar
Egypt
KSA
Bahrain
KSA
KSA
UAE
Qatar
Qatar
Bahrain
UAE
UAE
Kuwait
KSA
2,272
2,482
4,156
4,538
4,668
5,309
5,453
5,633
6,744
7,114
8,703
8,807
8,915
9,526
14,238
15,880
20,489
22,952
44,498
49,304
Kuwait
COMPETITIVENESS REPORT 2011-20126
Analysis of leading Islamic commercial banks in the MENA region shows a large variation in the average ROE between 2006-10
Total Assets 2010 Average ROE (2006-2010)
Source: Annual Reports, Zawya, EY analysis (includes sample of leading banks across Middle East and North Africa (MENA) where published information was available)
MENA Conventional AverageUS$38bn 16%
MENA Islamic AverageUS$13bn 15 %
< 9%
> 20 %
Growth(3 Yr CAGR)
Steep Slide
Long Tail
Islamic Banking Competitiveness Report 2011-12
Page 6
10.0%
0.20%
6.7%
7.4%
-1.9%
17.4%
12.6%
1.4%
-2.2%
0.1%
15.5%
12.2%
10.0%
11.6%
19.2%
8.5%
13.1%
15.2%
14.2%
26.0%
Bahrain
Bahrain
Kuwait
UAE
Kuwait
Qatar
Egypt
KSA
Bahrain
KSA
KSA
UAE
Qatar
Qatar
Bahrain
UAE
UAE
Kuwait
KSA
2,272
2,482
4,156
4,538
4,668
5,309
5,453
5,633
6,744
7,114
8,703
8,807
8,915
9,526
14,238
15,880
20,489
22,952
44,498
49,304
Kuwait
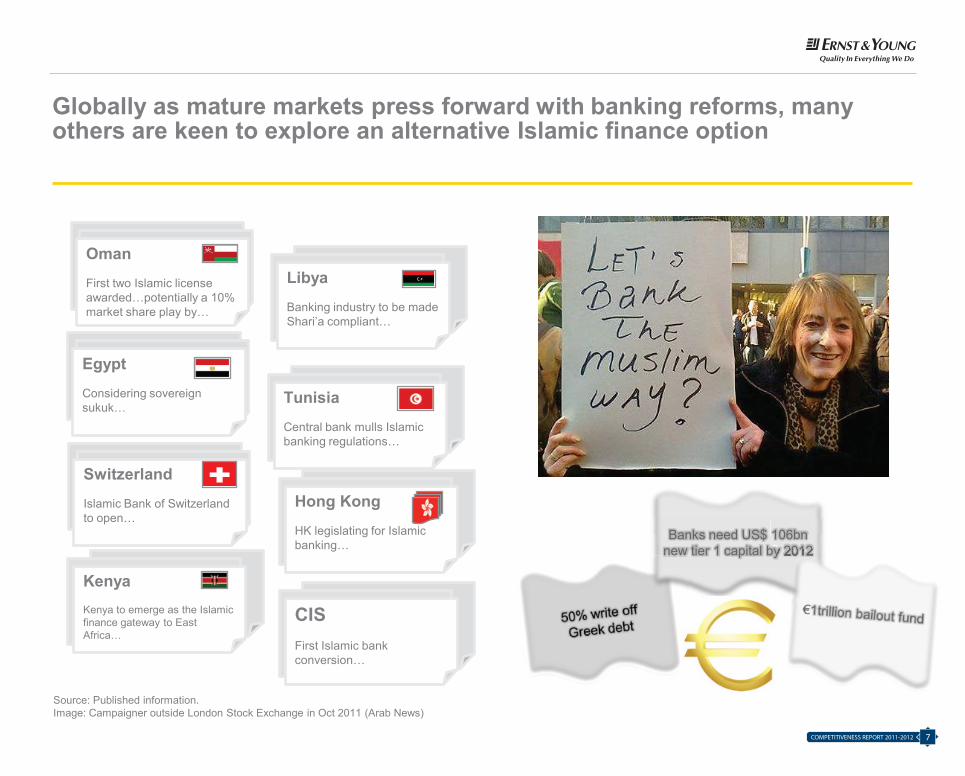
Libya
Banking industry to be made Shari’a compliant…
Oman
First two Islamic license awarded…potentially a 10% market share play by…
Tunisia
Central bank mulls Islamic banking regulations…
Egypt
Considering sovereign sukuk…
Hong Kong
HK legislating for Islamic banking…
Switzerland
Islamic Bank of Switzerland to open…
KenyaKenya to emerge as the Islamic finance gateway to East Africa…
CISFirst Islamic bank conversion…
Globally as mature markets press forward with banking reforms, many others are keen to explore an alternative Islamic finance option
Banks need US$ 106bn new tier 1 capital by 2012
Source: Published information.Image: Campaigner outside London Stock Exchange in Oct 2011 (Arab News)
by 20122012
Islamic Banking Competitiveness Report 2011-12
Page 7
7COMPETITIVENESS REPORT 2011-2012
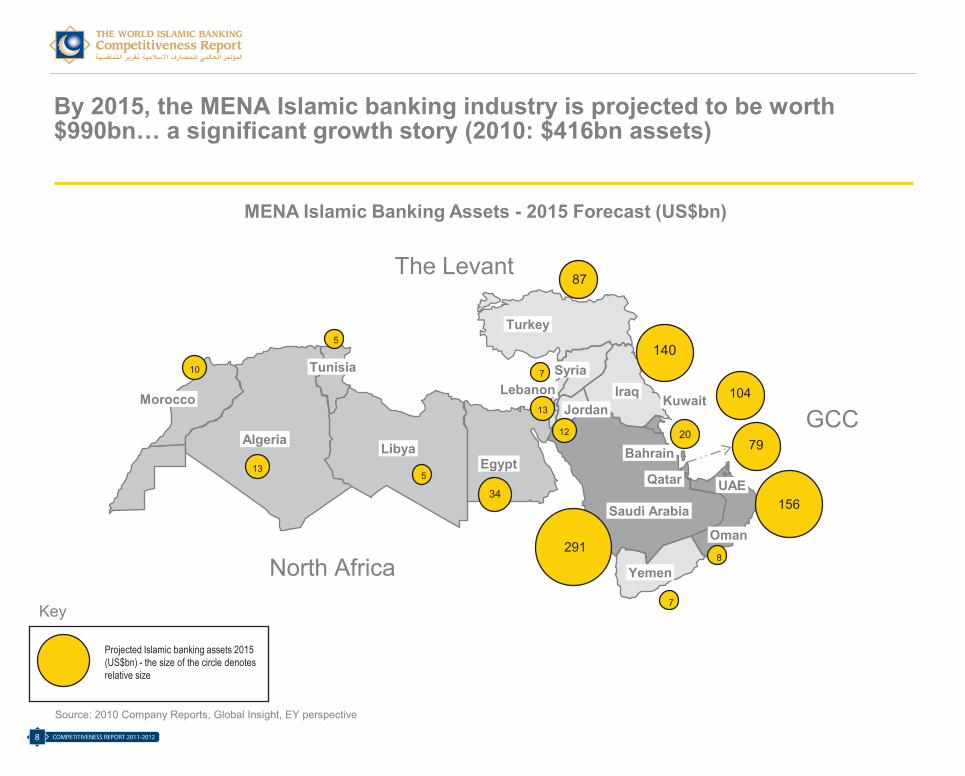
By 2015, the MENA Islamic banking industry is projected to be worth $990bn… a significant growth story (2010: $416bn assets)
MENA Islamic Banking Assets - 2015 Forecast (US$bn)
Saudi Arabia
Oman
UAEQatar
BahrainAlgeria
LibyaEgypt
Turkey
Tunisia
MoroccoLebanon
JordanIraq
Yemen
Syria
Kuwait
156
291
13
87
140
7920
104
GCC
North Africa
The Levant
7
7
5
34
12
13
10
8
5
Projected Islamic banking assets 2015 (US$bn) - the size of the circle denotes relative size
Key
Source: 2010 Company Reports, Global Insight, EY perspective
Islamic Banking Competitiveness Report 2011-12
Page 8
COMPETITIVENESS REPORT 2011-20128
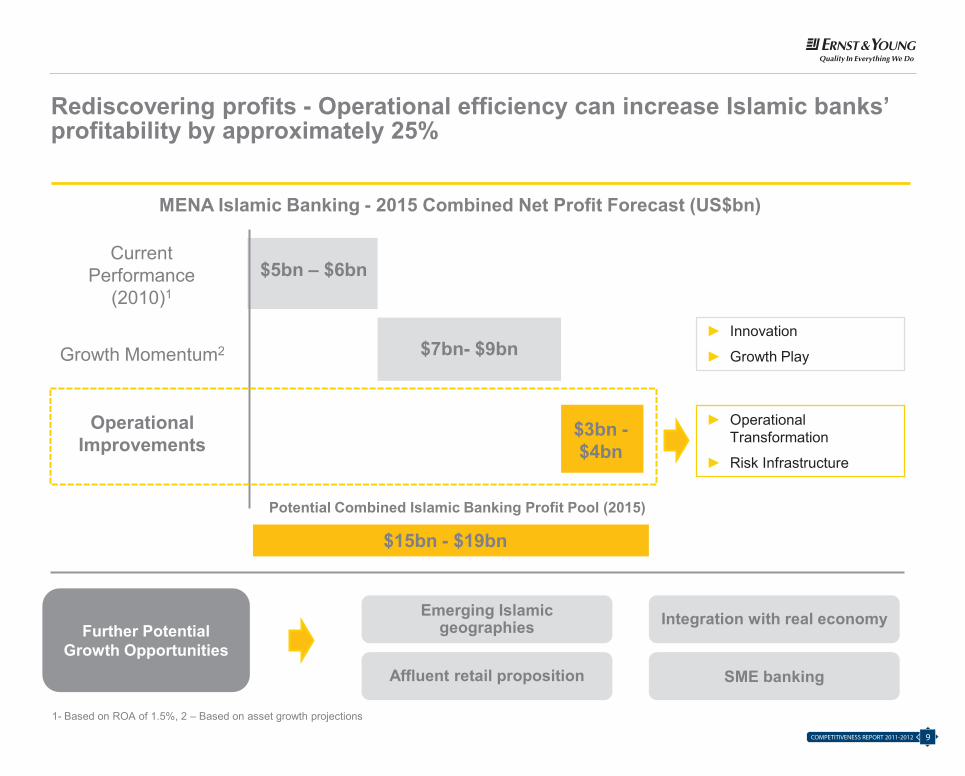
Rediscovering profits - Operational efficiency can increase Islamic banks’ profitability by approximately 25%
Current Performance
(2010)1
Growth Momentum2
Potential Combined Islamic Banking Profit Pool (2015)
Operational Improvements
$5bn – $6bn
MENA Islamic Banking - 2015 Combined Net Profit Forecast (US$bn)
$7bn- $9bn
$3bn -$4bn
$15bn - $19bn
1- Based on ROA of 1.5%, 2 – Based on asset growth projections
Emerging Islamic geographies
Affluent retail proposition
Integration with real economy
SME banking
Further Potential Growth Opportunities
► Operational Transformation
► Risk Infrastructure
► Innovation
► Growth Play
Islamic Banking Competitiveness Report 2011-12
Page 9
9COMPETITIVENESS REPORT 2011-2012
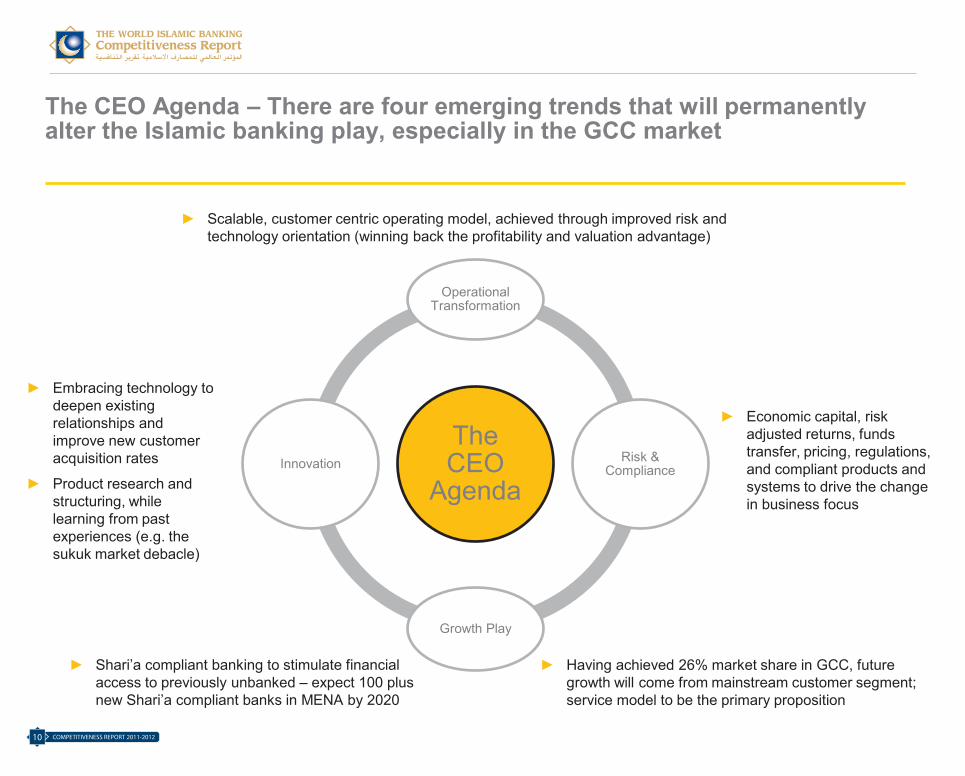
The CEO Agenda – There are four emerging trends that will permanently alter the Islamic banking play, especially in the GCC market
The CEO
Agenda
Operational Transformation
Risk & Compliance
Growth Play
Innovation
► Scalable, customer centric operating model, achieved through improved risk and technology orientation (winning back the profitability and valuation advantage)
► Economic capital, risk adjusted returns, funds transfer, pricing, regulations, and compliant products and systems to drive the change in business focus
► Shari’a compliant banking to stimulate financial access to previously unbanked – expect 100 plus new Shari’a compliant banks in MENA by 2020
► Embracing technology to deepen existing relationships and improve new customer acquisition rates
► Product research and structuring, while learning from past experiences (e.g. the sukuk market debacle)
► Having achieved 26% market share in GCC, future growth will come from mainstream customer segment; service model to be the primary proposition
Islamic Banking Competitiveness Report 2011-12
Page 10
COMPETITIVENESS REPORT 2011-201210
The CEO Agenda – There are four emerging trends that will permanently alter the Islamic banking play, especially in the GCC market
The CEO
Agenda
Operational Transformation
Risk & Compliance
Growth Play
Innovation
► Scalable, customer centric operating model, achieved through improved risk and technology orientation (winning back the profitability and valuation advantage)
► Economic capital, risk adjusted returns, funds transfer, pricing, regulations, and compliant products and systems to drive the change in business focus
► Shari’a compliant banking to stimulate financial access to previously unbanked – expect 100 plus new Shari’a compliant banks in MENA by 2020
► Embracing technology to deepen existing relationships and improve new customer acquisition rates
► Product research and structuring, while learning from past experiences (e.g. the sukuk market debacle)
► Having achieved 26% market share in GCC, future growth will come from mainstream customer segment; service model to be the primary proposition
Islamic Banking Competitiveness Report 2011-12
Page 10
Report Structure
Performance Analysis
Competitive Landscape
Competing to Win: The CEO
Agenda
Country Spotlight
Executive Brief
1
2 3
5 4
Islamic Banking Competitiveness Report 2011-12
Page 11
11COMPETITIVENESS REPORT 2011-2012
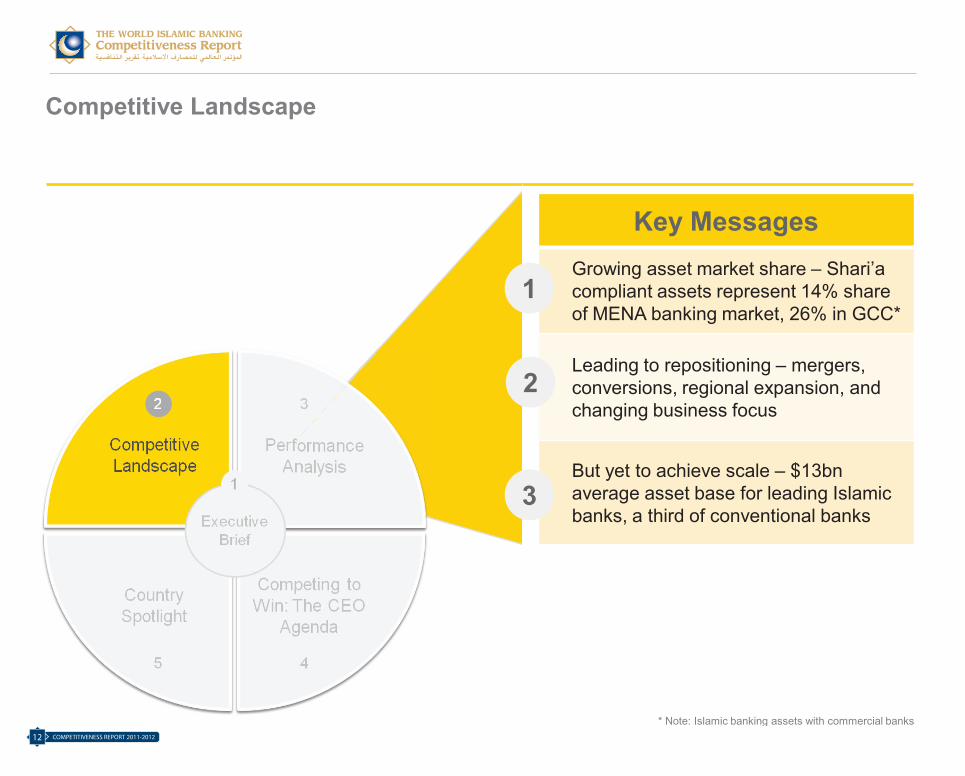
Key MessagesGrowing asset market share – Shari’a compliant assets represent 14% share of MENA banking market, 26% in GCC*
Leading to repositioning – mergers, conversions, regional expansion, and changing business focus
But yet to achieve scale – $13bnaverage asset base for leading Islamic banks, a third of conventional banks
1
2
3
Competitive Landscape
Islamic Banking Competitiveness Report 2011-12
Page 12
* Note: Islamic banking assets with commercial banks
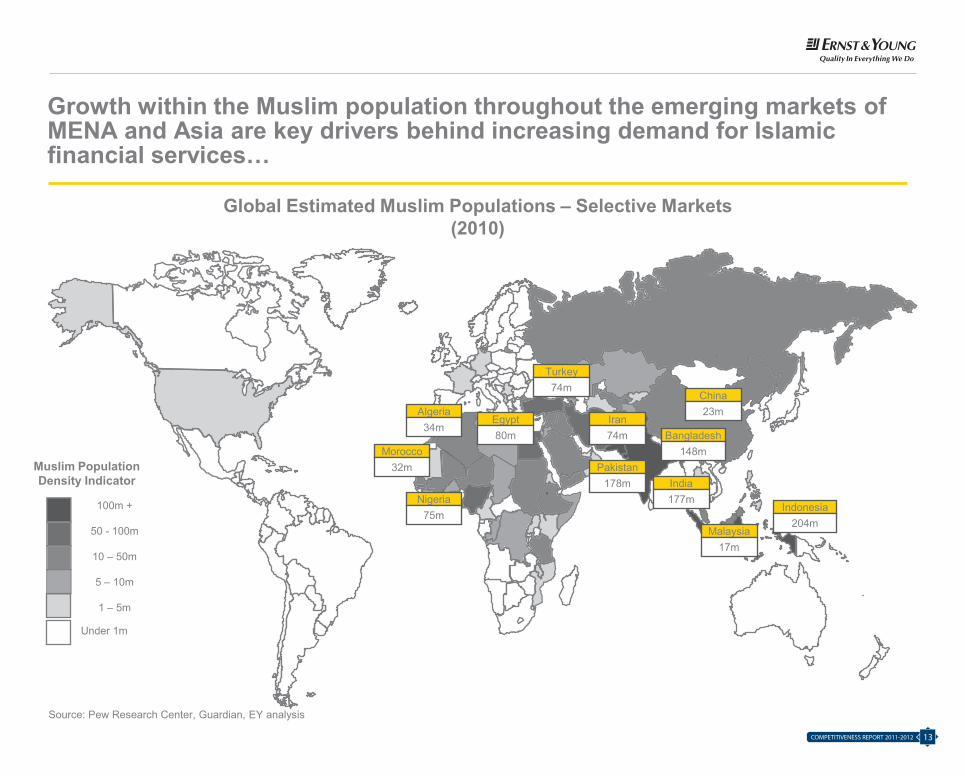
Growth within the Muslim population throughout the emerging markets of MENA and Asia are key drivers behind increasing demand for Islamic financial services…
Source: Pew Research Center, Guardian, EY analysis
100m +
50 - 100m
10 – 50m
5 – 10m
1 – 5m
Muslim Population Density Indicator India
177mIndonesia
204m
Pakistan178m
Bangladesh148m
Turkey74m
Egypt80m
Nigeria75m
Algeria34m
Morocco32m
Iran74m
Global Estimated Muslim Populations – Selective Markets (2010)
Under 1m
China23m
Malaysia17m
Islamic Banking Competitiveness Report 2011-12
Page 13
COMPETITIVENESS REPORT 2011-201212
Growth within the Muslim population throughout the emerging markets of MENA and Asia are key drivers behind increasing demand for Islamic financial services…
Source: Pew Research Center, Guardian, EY analysis
100m +
50 - 100m
10 – 50m
5 – 10m
1 – 5m
Muslim Population Density Indicator India
177mIndonesia
204m
Pakistan178m
Bangladesh148m
Turkey74m
Egypt80m
Nigeria75m
Algeria34m
Morocco32m
Iran74m
Global Estimated Muslim Populations – Selective Markets (2010)
Under 1m
China23m
Malaysia17m
Islamic Banking Competitiveness Report 2011-12
Page 13
13COMPETITIVENESS REPORT 2011-2012
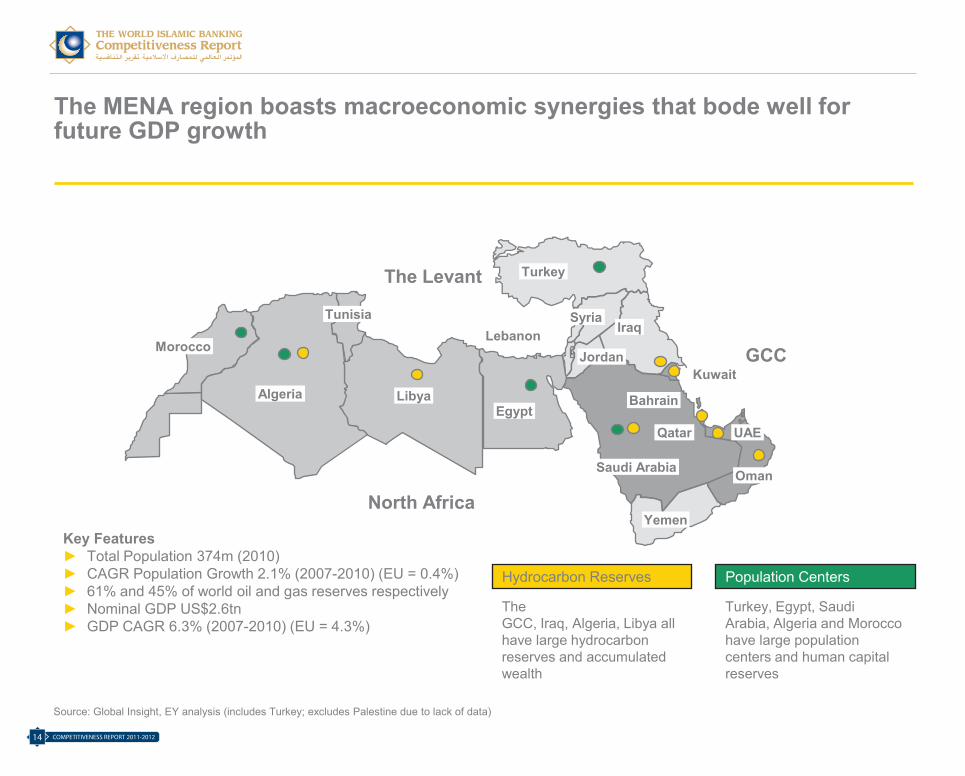
The MENA region boasts macroeconomic synergies that bode well for future GDP growth
Source: Global Insight, EY analysis (includes Turkey; excludes Palestine due to lack of data)
Key Features► Total Population 374m (2010)► CAGR Population Growth 2.1% (2007-2010) (EU = 0.4%)► 61% and 45% of world oil and gas reserves respectively ► Nominal GDP US$2.6tn► GDP CAGR 6.3% (2007-2010) (EU = 4.3%)
Hydrocarbon Reserves Population Centers
The GCC, Iraq, Algeria, Libya all have large hydrocarbon reserves and accumulated wealth
Turkey, Egypt, Saudi Arabia, Algeria and Morocco have large population centers and human capital reserves
Saudi Arabia Oman
UAE
Kuwait
Qatar
BahrainAlgeria LibyaEgypt
Turkey
Tunisia
MoroccoLebanon
Jordan
Iraq
Yemen
GCC
North Africa
The Levant
Syria
Islamic Banking Competitiveness Report 2011-12
Page 14
COMPETITIVENESS REPORT 2011-201214
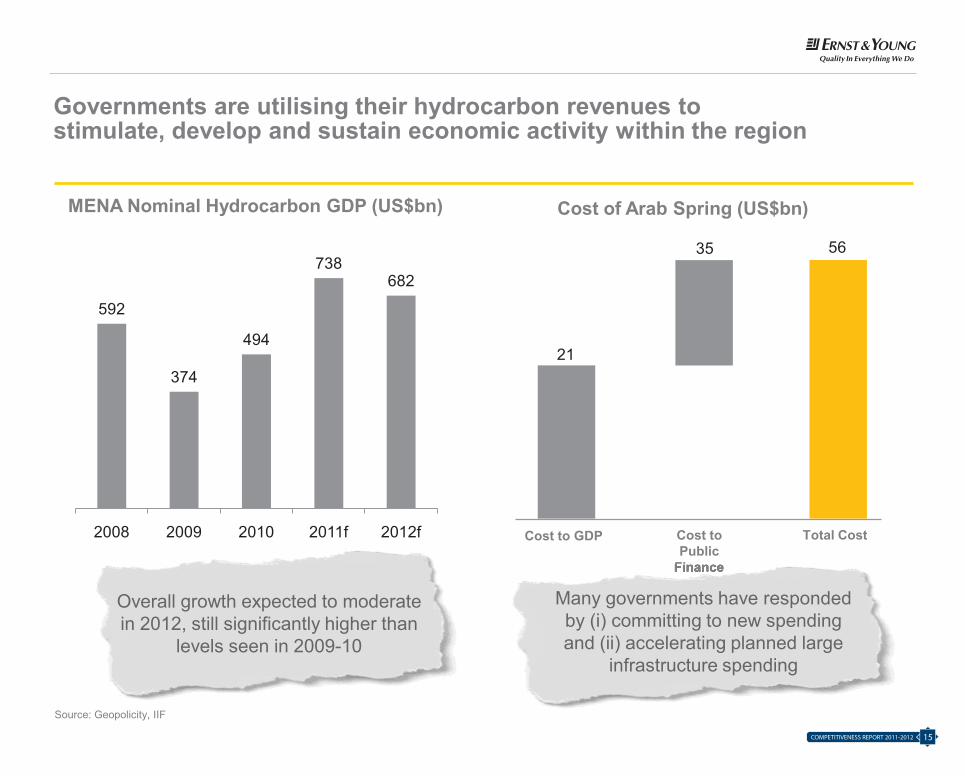
Governments are utilising their hydrocarbon revenues to stimulate, develop and sustain economic activity within the region
MENA Nominal Hydrocarbon GDP (US$bn) Cost of Arab Spring (US$bn)
592
374
494
738682
2008 2009 2010 2011f 2012f
Source: Geopolicity, IIF
21
Cost to GDP Cost to Public
Finance
Total Cost
35 56
Overall growth expected to moderate in 2012, still significantly higher than
levels seen in 2009-10
Finance
Many governments have responded by (i) committing to new spending and (ii) accelerating planned large
infrastructure spending
Islamic Banking Competitiveness Report 2011-12
Page 15
15COMPETITIVENESS REPORT 2011-2012
0%
100%
200%
300%
400%
500%
600%
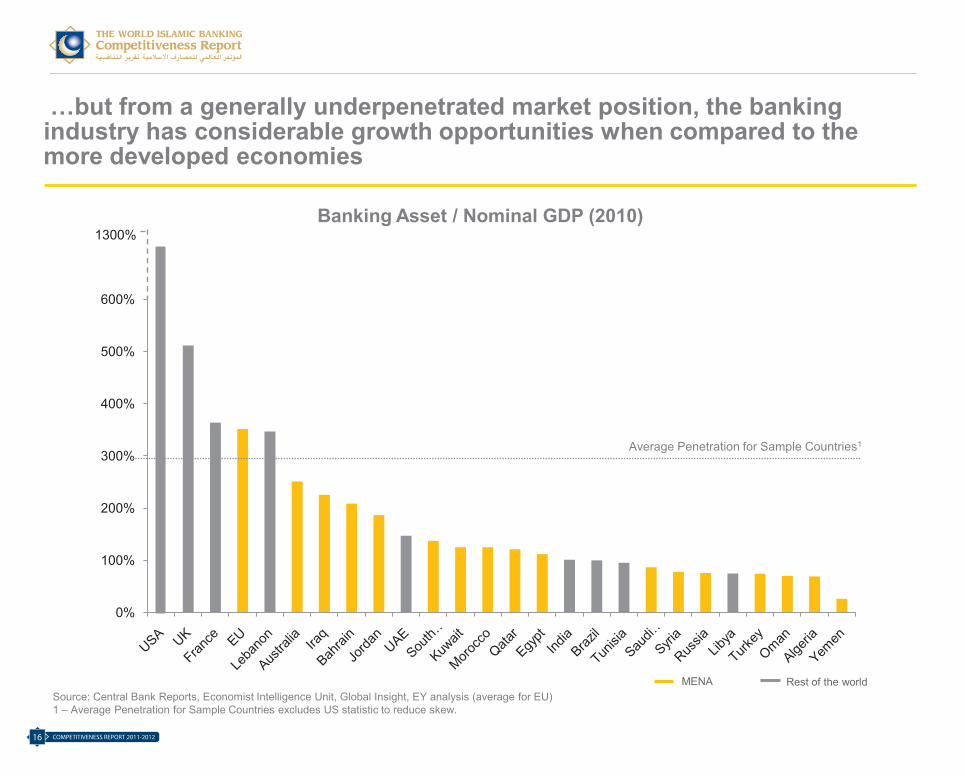
…but from a generally underpenetrated market position, the banking industry has considerable growth opportunities when compared to the more developed economies
Banking Asset / Nominal GDP (2010)
Average Penetration for Sample Countries1
Source: Central Bank Reports, Economist Intelligence Unit, Global Insight, EY analysis (average for EU)1 – Average Penetration for Sample Countries excludes US statistic to reduce skew.
MENA Rest of the world
1300%
Islamic Banking Competitiveness Report 2011-12
Page 16
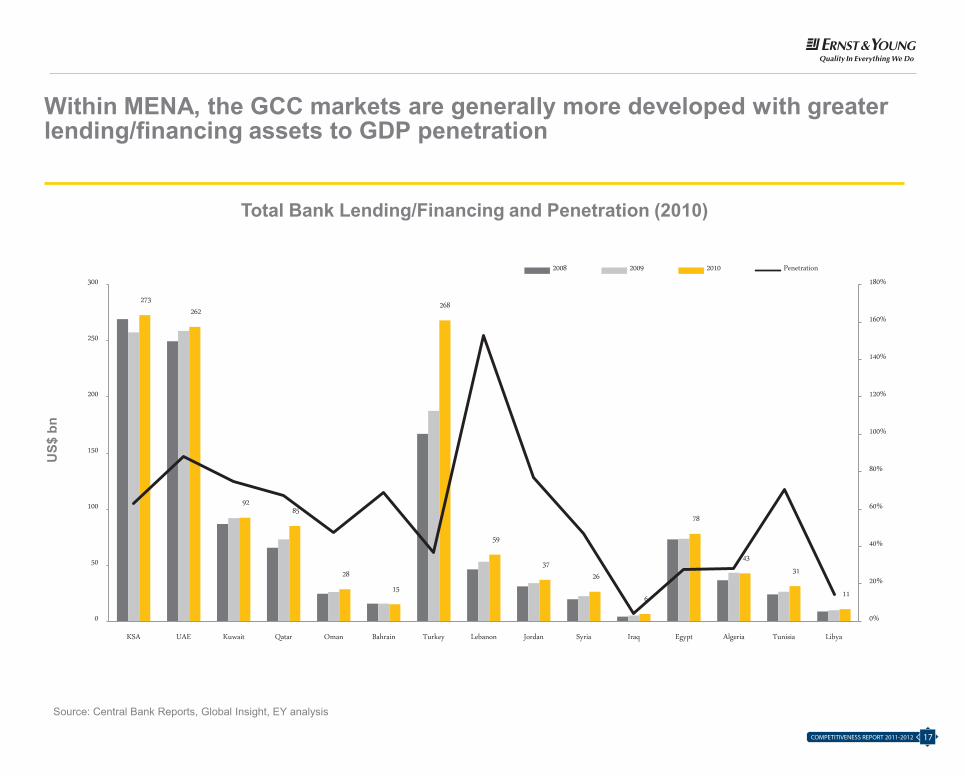
Within MENA, the GCC markets are generally more developed with greater lending/financing assets to GDP penetration
Total Bank Lending/Financing and Penetration (2010)
Source: Central Bank Reports, Global Insight, EY analysis
273 262
92 85
28
15
268
59
37 26
6
78
43
31
11
0%
20%
40%
60%
80%
100%
120%
140%
160%
180%
0
50
100
150
200
250
300
KSA UAE Kuwait Qatar Oman Bahrain Turkey Lebanon Jordan Syria Iraq Egypt Algeria Tunisia Libya
2008 2009 2010 Penetration
US$
bn
Islamic Banking Competitiveness Report 2011-12
Page 17
0%
100%
200%
300%
400%
500%
600%
…but from a generally underpenetrated market position, the banking industry has considerable growth opportunities when compared to the more developed economies
Banking Asset / Nominal GDP (2010)
Average Penetration for Sample Countries1
Source: Central Bank Reports, Economist Intelligence Unit, Global Insight, EY analysis (average for EU)1 – Average Penetration for Sample Countries excludes US statistic to reduce skew.
MENA Rest of the world
1300%
Islamic Banking Competitiveness Report 2011-12
Page 16
COMPETITIVENESS REPORT 2011-201216
Within MENA, the GCC markets are generally more developed with greater lending/financing assets to GDP penetration
Total Bank Lending/Financing and Penetration (2010)
Source: Central Bank Reports, Global Insight, EY analysis
273 262
92 85
28
15
268
59
37 26
6
78
43
31
11
0%
20%
40%
60%
80%
100%
120%
140%
160%
180%
0
50
100
150
200
250
300
KSA UAE Kuwait Qatar Oman Bahrain Turkey Lebanon Jordan Syria Iraq Egypt Algeria Tunisia Libya
2008 2009 2010 Penetration
US$
bn
Islamic Banking Competitiveness Report 2011-12
Page 17
17COMPETITIVENESS REPORT 2011-2012
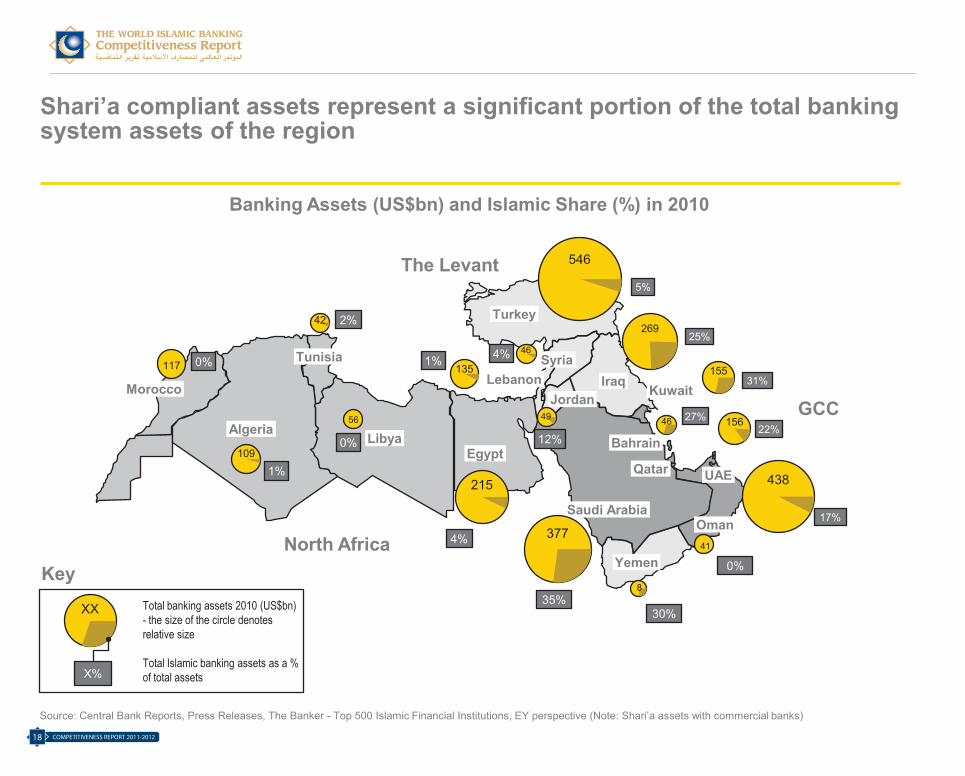
Shari’a compliant assets represent a significant portion of the total banking system assets of the region
Banking Assets (US$bn) and Islamic Share (%) in 2010
Total banking assets 2010 (US$bn) - the size of the circle denotes relative size
Total Islamic banking assets as a % of total assets
Saudi ArabiaOman
UAEQatar
BahrainAlgeria
LibyaEgypt
Turkey
Tunisia
MoroccoLebanon
JordanIraq
Yemen
Syria
Kuwait
17%
438
XX
X%
Key
30%
8 35%
3774%
215
2%
1%109
1%
5%
546
25%269
22%15627%46
31%155
56
117
12%
49
4%135
42
46
0%
0%
Source: Central Bank Reports, Press Releases, The Banker - Top 500 Islamic Financial Institutions, EY perspective (Note: Shari’a assets with commercial banks)
41
0%
GCC
North Africa
The Levant
Islamic Banking Competitiveness Report 2011-12
Page 18
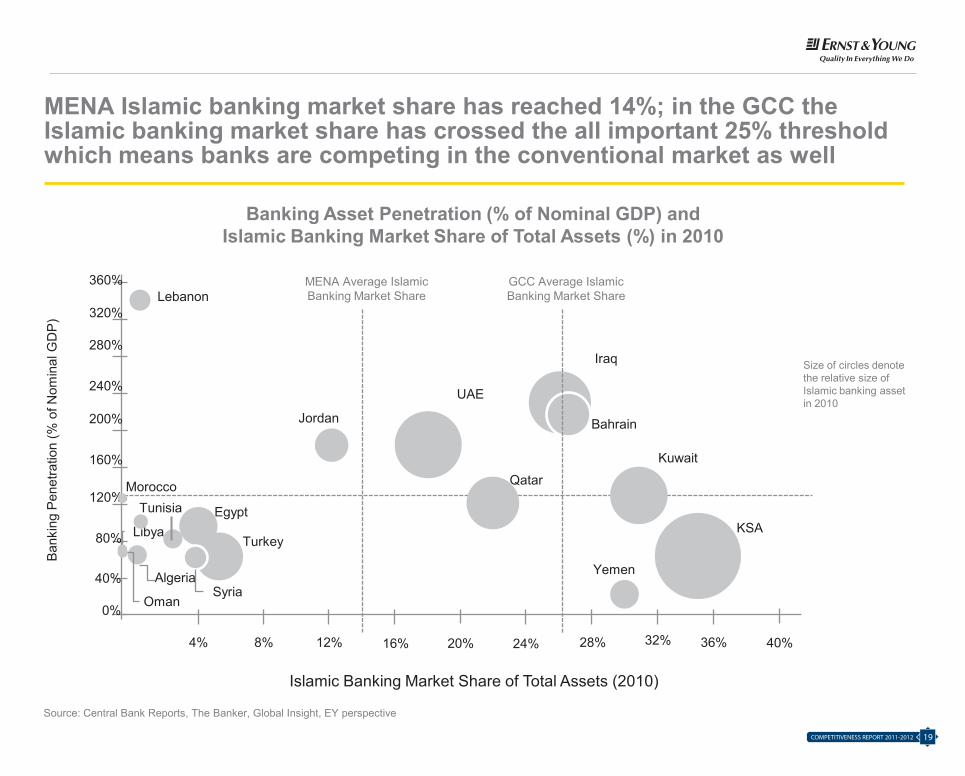
MENA Islamic banking market share has reached 14%; in the GCC the Islamic banking market share has crossed the all important 25% threshold which means banks are competing in the conventional market as well
Size of circles denote the relative size of Islamic banking asset in 2010
Banking Asset Penetration (% of Nominal GDP) and Islamic Banking Market Share of Total Assets (%) in 2010
0%
80%
120%
160%
200%
240%
280%
320%
360% MENA Average Islamic Banking Market Share
Islamic Banking Market Share of Total Assets (2010)
Bank
ing
Pene
tratio
n (%
of N
omin
al G
DP)
40%
4% 8% 12% 20% 28% 36%32%24% 40%16%
UAE
KSA
Iraq
Qatar
Kuwait
Turkey
Bahrain
Egypt
Jordan
Yemen
Lebanon
Tunisia
AlgeriaSyria
Libya
Morocco
Oman
Source: Central Bank Reports, The Banker, Global Insight, EY perspective
GCC Average Islamic Banking Market Share
Islamic Banking Competitiveness Report 2011-12
Page 19
COMPETITIVENESS REPORT 2011-201218
Shari’a compliant assets represent a significant portion of the total banking system assets of the region
Banking Assets (US$bn) and Islamic Share (%) in 2010
Total banking assets 2010 (US$bn) - the size of the circle denotes relative size
Total Islamic banking assets as a % of total assets
Saudi ArabiaOman
UAEQatar
BahrainAlgeria
LibyaEgypt
Turkey
Tunisia
MoroccoLebanon
JordanIraq
Yemen
Syria
Kuwait
17%
438
XX
X%
Key
30%
8 35%
3774%
215
2%
1%109
1%
5%
546
25%269
22%15627%46
31%155
56
117
12%
49
4%135
42
46
0%
0%
Source: Central Bank Reports, Press Releases, The Banker - Top 500 Islamic Financial Institutions, EY perspective (Note: Shari’a assets with commercial banks)
41
0%
GCC
North Africa
The Levant
Islamic Banking Competitiveness Report 2011-12
Page 18
MENA Islamic banking market share has reached 14%; in the GCC the Islamic banking market share has crossed the all important 25% threshold which means banks are competing in the conventional market as well
Size of circles denote the relative size of Islamic banking asset in 2010
Banking Asset Penetration (% of Nominal GDP) and Islamic Banking Market Share of Total Assets (%) in 2010
0%
80%
120%
160%
200%
240%
280%
320%
360% MENA Average Islamic Banking Market Share
Islamic Banking Market Share of Total Assets (2010)
Bank
ing
Pene
tratio
n (%
of N
omin
al G
DP)
40%
4% 8% 12% 20% 28% 36%32%24% 40%16%
UAE
KSA
Iraq
Qatar
Kuwait
Turkey
Bahrain
Egypt
Jordan
Yemen
Lebanon
Tunisia
AlgeriaSyria
Libya
Morocco
Oman
Source: Central Bank Reports, The Banker, Global Insight, EY perspective
GCC Average Islamic Banking Market Share
Islamic Banking Competitiveness Report 2011-12
Page 19
19COMPETITIVENESS REPORT 2011-2012
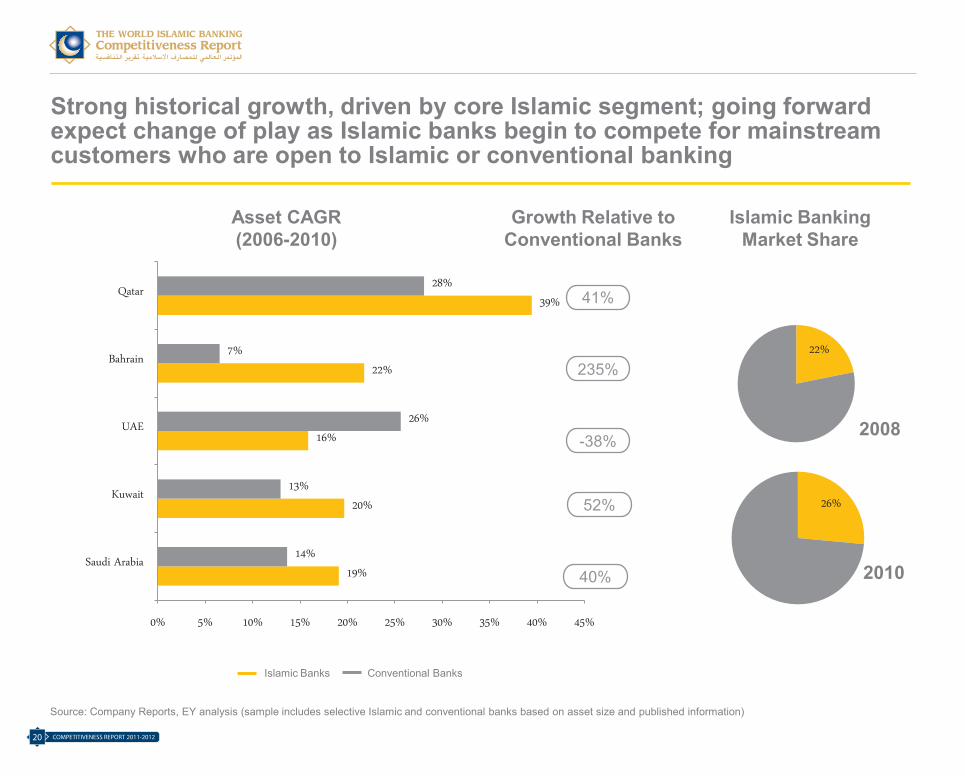
Strong historical growth, driven by core Islamic segment; going forward expect change of play as Islamic banks begin to compete for mainstream customers who are open to Islamic or conventional banking
Source: Company Reports, EY analysis (sample includes selective Islamic and conventional banks based on asset size and published information)
19%
20%
16%
22%
39%
14%
13%
26%
7%
28%
0% 5% 10% 15% 20% 25% 30% 35% 40% 45%
Saudi Arabia
Kuwait
UAE
Bahrain
Qatar
Islamic Banks Conventional Banks
41%
235%
-38%
52%
40%
22%
26%
2008
2010
Asset CAGR (2006-2010)
Islamic Banking Market Share
Growth Relative to Conventional Banks
Islamic Banking Competitiveness Report 2011-12
Page 20
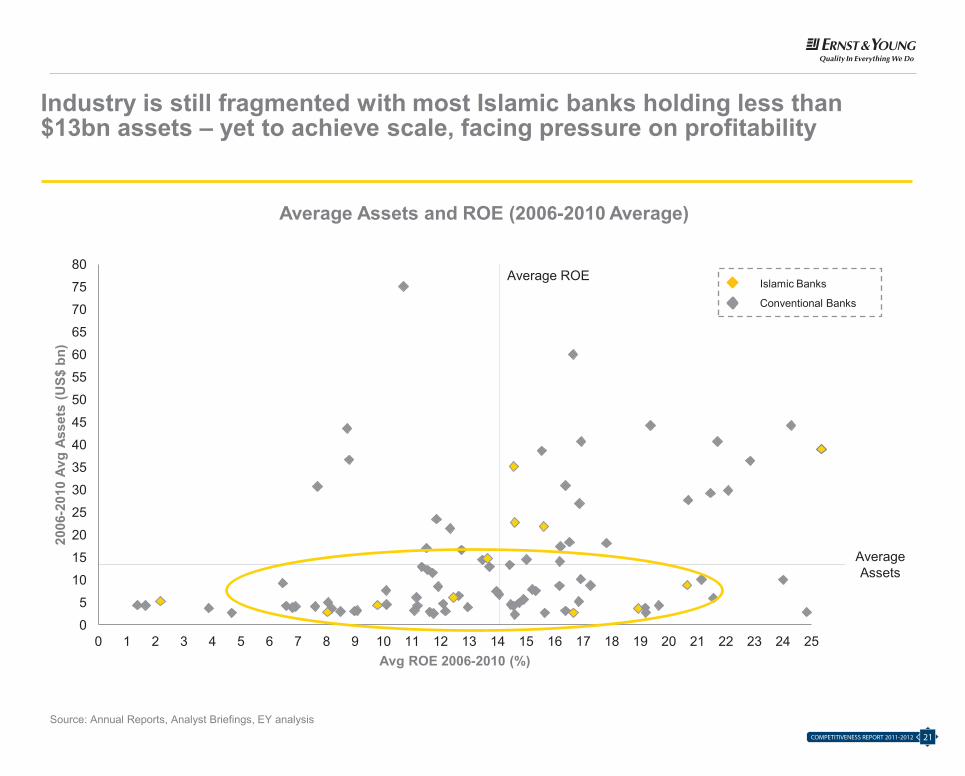
Industry is still fragmented with most Islamic banks holding less than $13bn assets – yet to achieve scale, facing pressure on profitability
Source: Annual Reports, Analyst Briefings, EY analysis
Average Assets and ROE (2006-2010 Average)
0
5
10
15
20
25
30
35
40
45
50
55
60
65
70
75
80
0 1 2 3 4 5 6 7 8 9 10 11 12 13 14 15 16 17 18 19 20 21 22 23 24 25
2006
-201
0 Av
g As
sets
(US$
bn)
Avg ROE 2006-2010 (%)
Average ROE
Average Assets
Islamic Banks
Conventional Banks
Islamic Banking Competitiveness Report 2011-12
Page 21
COMPETITIVENESS REPORT 2011-201220
Industry is still fragmented with most Islamic banks holding less than $13bn assets – yet to achieve scale, facing pressure on profitability
Source: Annual Reports, Analyst Briefings, EY analysis
Average Assets and ROE (2006-2010 Average)
0
5
10
15
20
25
30
35
40
45
50
55
60
65
70
75
80
0 1 2 3 4 5 6 7 8 9 10 11 12 13 14 15 16 17 18 19 20 21 22 23 24 25
2006
-201
0 Av
g As
sets
(US$
bn)
Avg ROE 2006-2010 (%)
Average ROE
Average Assets
Islamic Banks
Conventional Banks
Islamic Banking Competitiveness Report 2011-12
Page 21
21COMPETITIVENESS REPORT 2011-2012
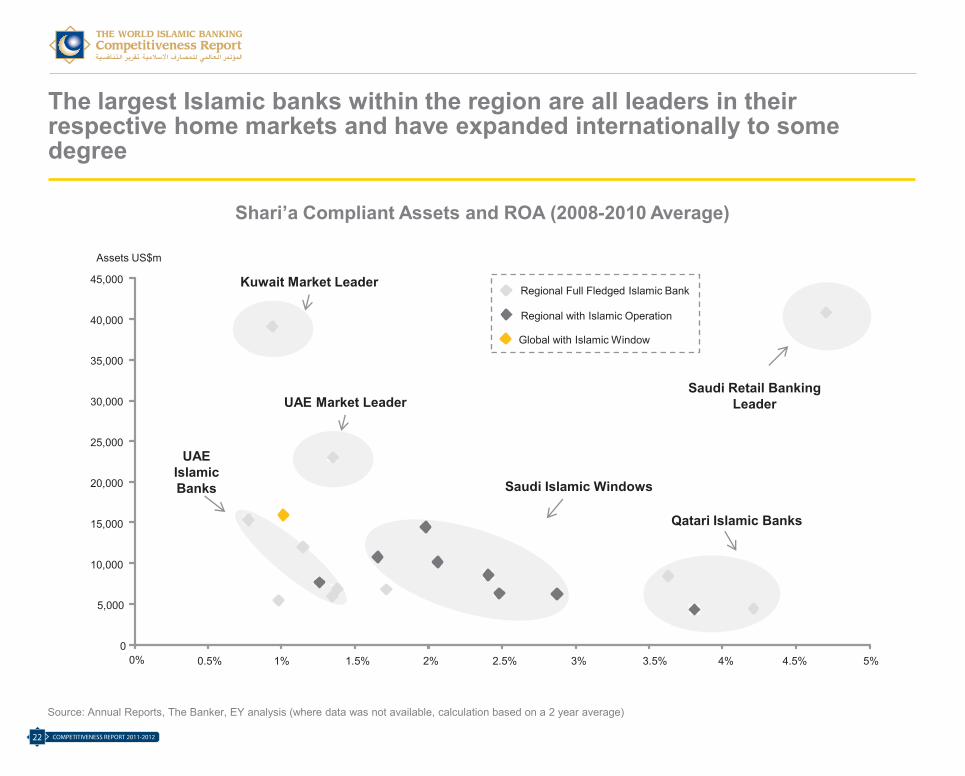
The largest Islamic banks within the region are all leaders in their respective home markets and have expanded internationally to some degree
Source: Annual Reports, The Banker, EY analysis (where data was not available, calculation based on a 2 year average)
Shari’a Compliant Assets and ROA (2008-2010 Average)
0
5,000
10,000
15,000
20,000
25,000
30,000
35,000
40,000
45,000
0% 0.5% 1% 1.5% 2% 2.5% 3% 3.5% 4% 4.5% 5%
Regional Full Fledged Islamic Bank
Regional with Islamic Operation
Global with Islamic Window
Assets US$m
Saudi Retail Banking Leader
Saudi Islamic Windows
Qatari Islamic Banks
UAE Market Leader
UAE Islamic Banks
Islamic Banking Competitiveness Report 2011-12
Page 22
Kuwait Market Leader
COMPETITIVENESS REPORT 2011-201222
The largest Islamic banks within the region are all leaders in their respective home markets and have expanded internationally to some degree
Source: Annual Reports, The Banker, EY analysis (where data was not available, calculation based on a 2 year average)
Shari’a Compliant Assets and ROA (2008-2010 Average)
0
5,000
10,000
15,000
20,000
25,000
30,000
35,000
40,000
45,000
0% 0.5% 1% 1.5% 2% 2.5% 3% 3.5% 4% 4.5% 5%
Regional Full Fledged Islamic Bank
Regional with Islamic Operation
Global with Islamic Window
Assets US$m
Saudi Retail Banking Leader
Saudi Islamic Windows
Qatari Islamic Banks
UAE Market Leader
UAE Islamic Banks
Islamic Banking Competitiveness Report 2011-12
Page 22
Kuwait Market Leader
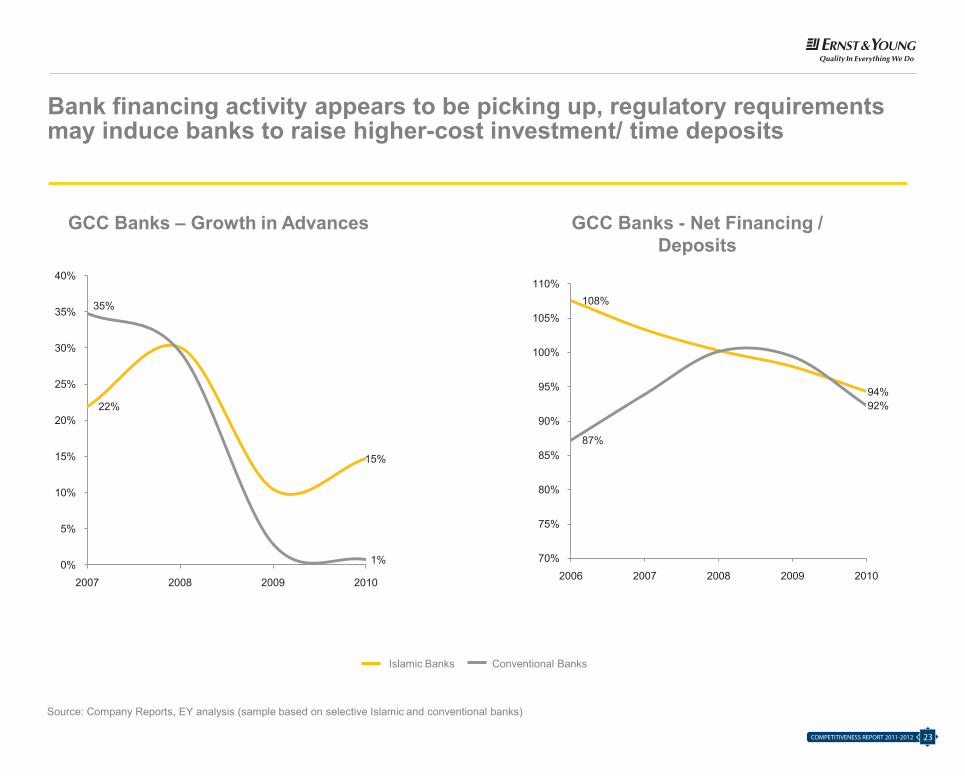
Bank financing activity appears to be picking up, regulatory requirements may induce banks to raise higher-cost investment/ time deposits
Islamic Banks Conventional Banks
Source: Company Reports, EY analysis (sample based on selective Islamic and conventional banks)
GCC Banks – Growth in Advances
22%
15%
35%
1%0%
5%
10%
15%
20%
25%
30%
35%
40%
2007 2008 2009 2010
GCC Banks - Net Financing / Deposits
108%
94%
87%
92%
70%
75%
80%
85%
90%
95%
100%
105%
110%
2006 2007 2008 2009 2010
Islamic Banking Competitiveness Report 2011-12
Page 23
23COMPETITIVENESS REPORT 2011-2012
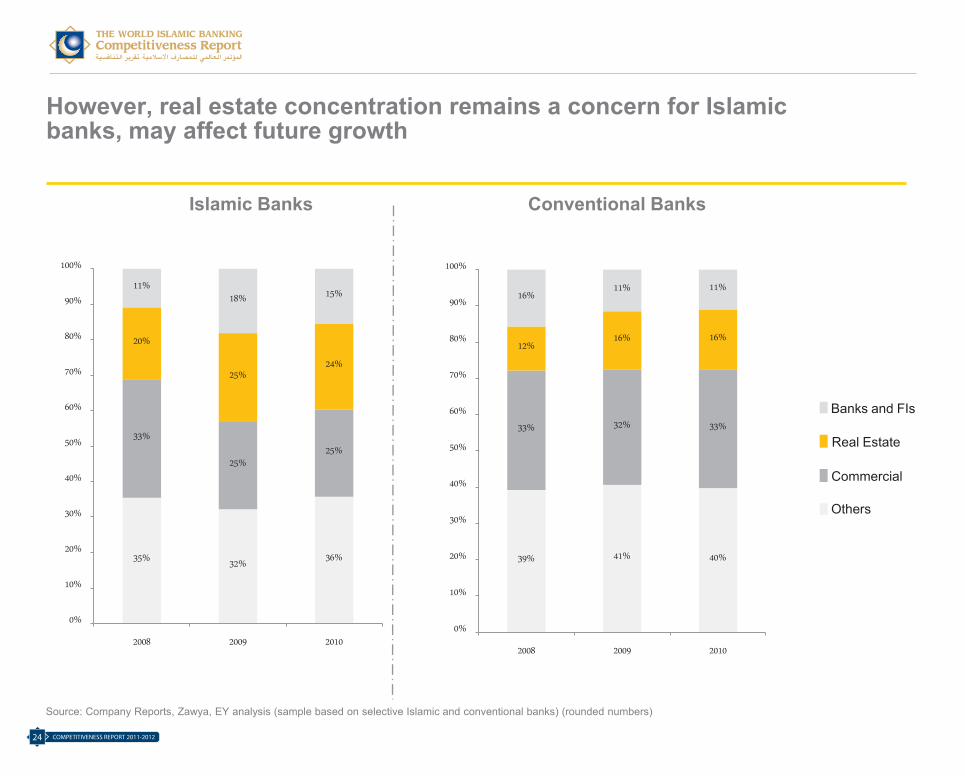
However, real estate concentration remains a concern for Islamic banks, may affect future growth
Conventional BanksIslamic Banks
Banks and FIs
Real Estate
Commercial
Others
35% 32%36%
33%
25%25%
20%
25%24%
11%18% 15%
0%
10%
20%
30%
40%
50%
60%
70%
80%
90%
100%
2008 2009 2010
Source: Company Reports, Zawya, EY analysis (sample based on selective Islamic and conventional banks) (rounded numbers)
39% 41% 40%
33% 32% 33%
12%16% 16%
16%11% 11%
0%
10%
20%
30%
40%
50%
60%
70%
80%
90%
100%
2008 2009 2010
Islamic Banking Competitiveness Report 2011-12
Page 24
COMPETITIVENESS REPORT 2011-201224
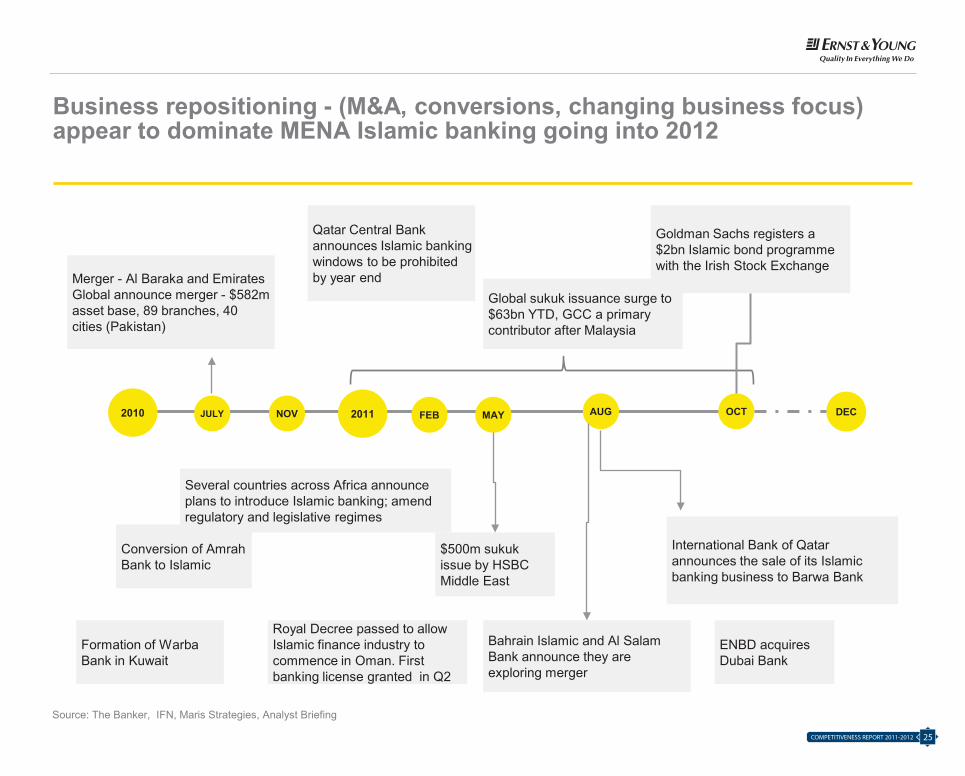
Business repositioning - (M&A, conversions, changing business focus) appear to dominate MENA Islamic banking going into 2012
Bahrain Islamic and Al Salam Bank announce they are exploring merger
Goldman Sachs registers a $2bn Islamic bond programme with the Irish Stock Exchange
Global sukuk issuance surge to $63bn YTD, GCC a primary contributor after Malaysia
Qatar Central Bank announces Islamic banking windows to be prohibited by year end
$500m sukuk issue by HSBC Middle East
Merger - Al Baraka and Emirates Global announce merger - $582m asset base, 89 branches, 40 cities (Pakistan)
International Bank of Qatar announces the sale of its Islamic banking business to Barwa Bank
DECOCTMAYFEBNOVJULY2010 AUG
Source: The Banker, IFN, Maris Strategies, Analyst Briefing
2011
ENBD acquires Dubai Bank
Conversion of AmrahBank to Islamic
Royal Decree passed to allow Islamic finance industry to commence in Oman. First banking license granted in Q2
Formation of WarbaBank in Kuwait
Several countries across Africa announce plans to introduce Islamic banking; amend regulatory and legislative regimes
Islamic Banking Competitiveness Report 2011-12
Page 25
25COMPETITIVENESS REPORT 2011-2012

Report Structure
Performance Analysis
Competitive Landscape
Competing to Win: The CEO
Agenda
Country Spotlight
Executive Brief
1
2 3
5 4
Islamic Banking Competitiveness Report 2011-12
Page 26
COMPETITIVENESS REPORT 2011-201226
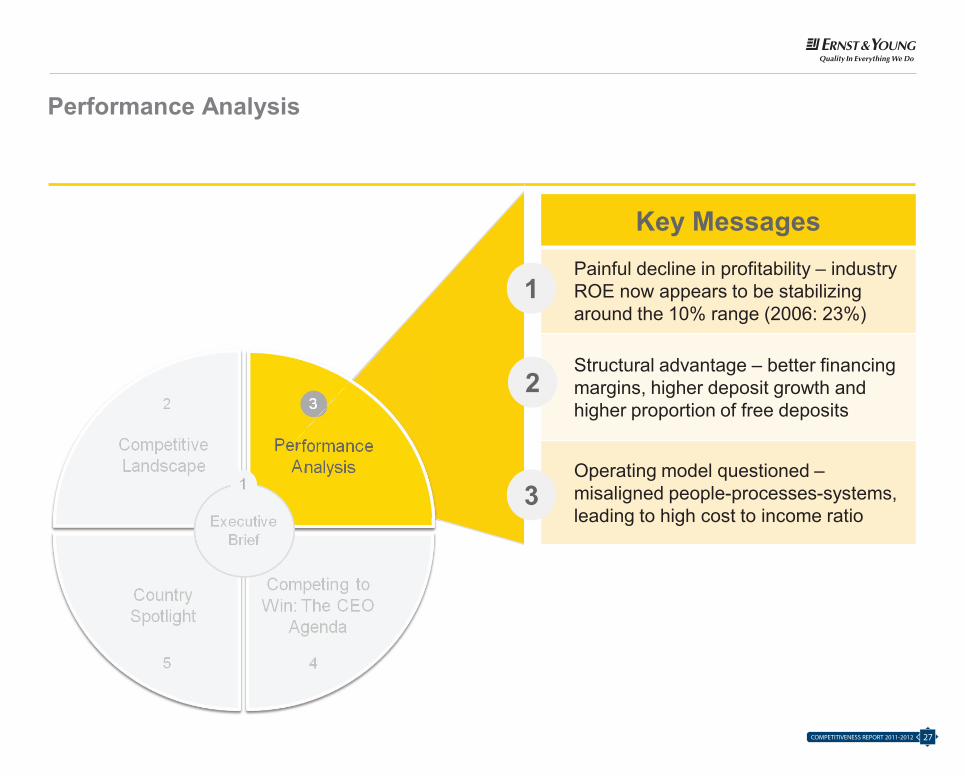
Key MessagesPainful decline in profitability – industry ROE now appears to be stabilizing around the 10% range (2006: 23%)
Structural advantage – better financing margins, higher deposit growth and higher proportion of free deposits
Operating model questioned –misaligned people-processes-systems, leading to high cost to income ratio
1
2
3
Performance Analysis
Islamic Banking Competitiveness Report 2011-12
Page 27
27COMPETITIVENESS REPORT 2011-2012
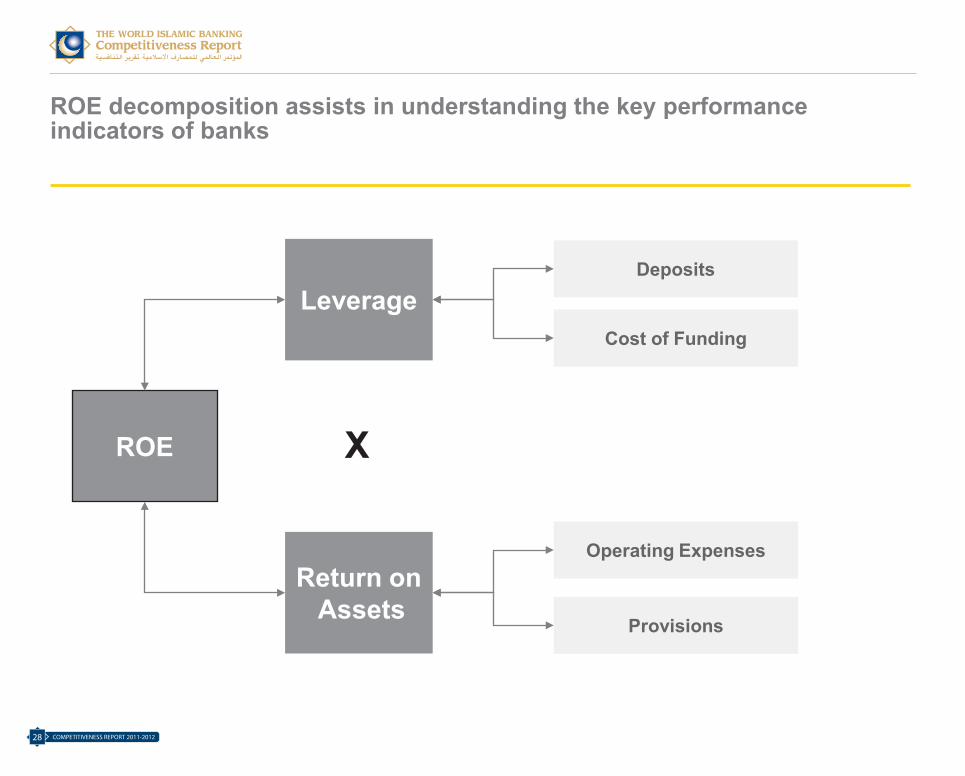
ROE decomposition assists in understanding the key performance indicators of banks
ROE
Leverage
Return on Assets
Deposits
Cost of Funding
Operating Expenses
Provisions
X
Islamic Banking Competitiveness Report 2011-12
Page 28
COMPETITIVENESS REPORT 2011-201228
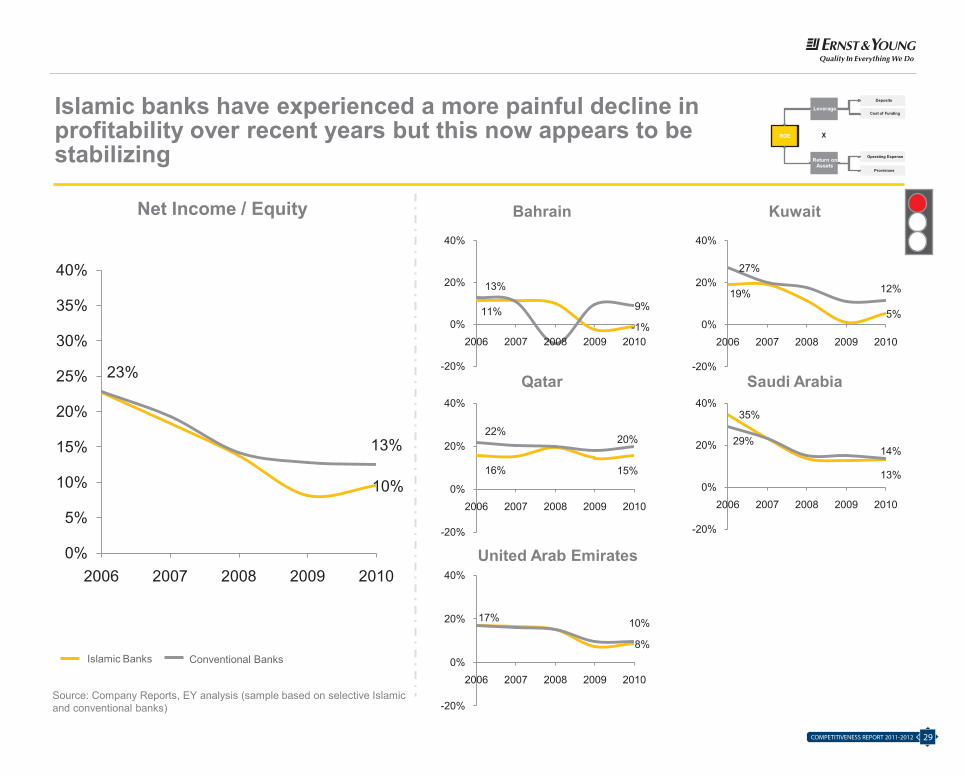
Islamic banks have experienced a more painful decline in profitability over recent years but this now appears to be stabilizing
Bahrain Kuwait
Qatar Saudi Arabia
United Arab Emirates
Net Income / Equity
ROE
Leverage
Return on Assets
Deposits
Cost of Funding
Operating Expense
Provisions
X
23%
10%
13%
0%
5%
10%
15%
20%
25%
30%
35%
40%
2006 2007 2008 2009 2010
11%-1%
13%
9%
-20%
0%
20%
40%
2006 2007 2008 2009 2010
19%
5%
27%
12%
-20%
0%
20%
40%
2006 2007 2008 2009 2010
16% 15%
22%20%
-20%
0%
20%
40%
2006 2007 2008 2009 2010
35%
13%
29%14%
-20%
0%
20%
40%
2006 2007 2008 2009 2010
17%
8%
10%
-20%
0%
20%
40%
2006 2007 2008 2009 2010
Islamic Banks Conventional Banks
Source: Company Reports, EY analysis (sample based on selective Islamic and conventional banks)
Islamic Banking Competitiveness Report 2011-12
Page 29
29COMPETITIVENESS REPORT 2011-2012
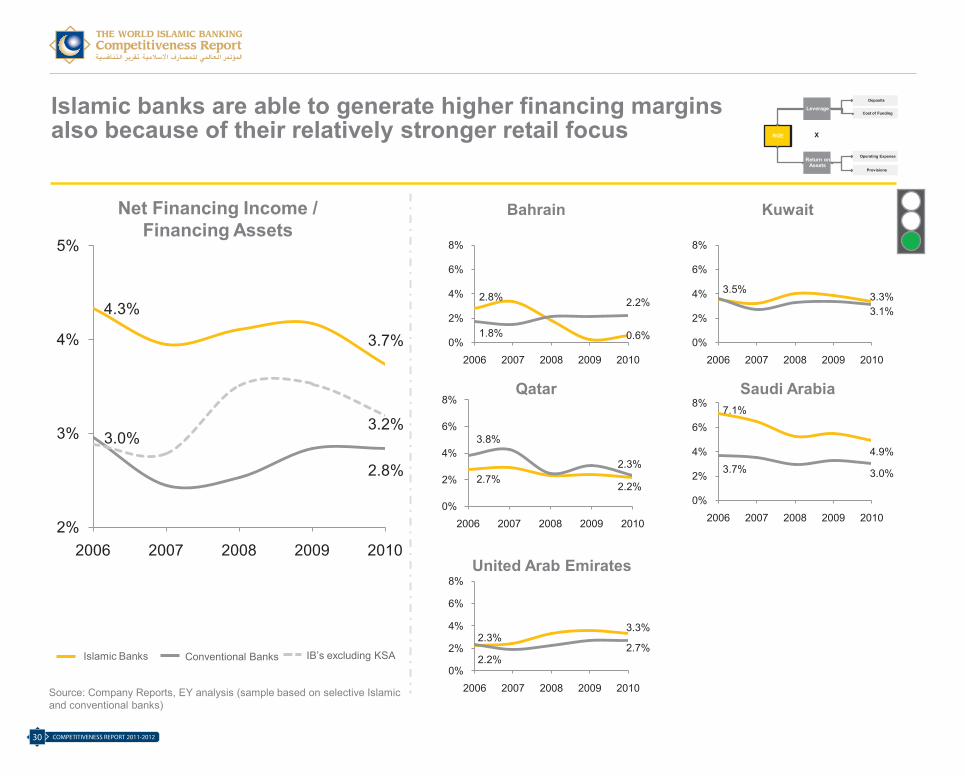
2.8%
0.6%1.8%
2.2%
0%
2%
4%
6%
8%
2006 2007 2008 2009 2010
Islamic banks are able to generate higher financing margins also because of their relatively stronger retail focus
Bahrain Kuwait
Qatar Saudi Arabia
United Arab Emirates
Islamic Banks Conventional Banks
Net Financing Income / Financing Assets
ROE
Leverage
Return on Assets
Deposits
Cost of Funding
Operating Expense
Provisions
X
4.3%
3.7%
3.0%
2.8%
3.2%
2%
3%
4%
5%
2006 2007 2008 2009 2010
3.5%3.3%3.1%
0%
2%
4%
6%
8%
2006 2007 2008 2009 2010
2.7%2.2%
3.8%
2.3%
0%
2%
4%
6%
8%
2006 2007 2008 2009 2010
7.1%
4.9%3.7% 3.0%
0%
2%
4%
6%
8%
2006 2007 2008 2009 2010
2.2%
3.3%2.3%
2.7%
0%
2%
4%
6%
8%
2006 2007 2008 2009 2010
IB’s excluding KSA
Source: Company Reports, EY analysis (sample based on selective Islamic and conventional banks)
Islamic Banking Competitiveness Report 2011-12
Page 30
COMPETITIVENESS REPORT 2011-201230
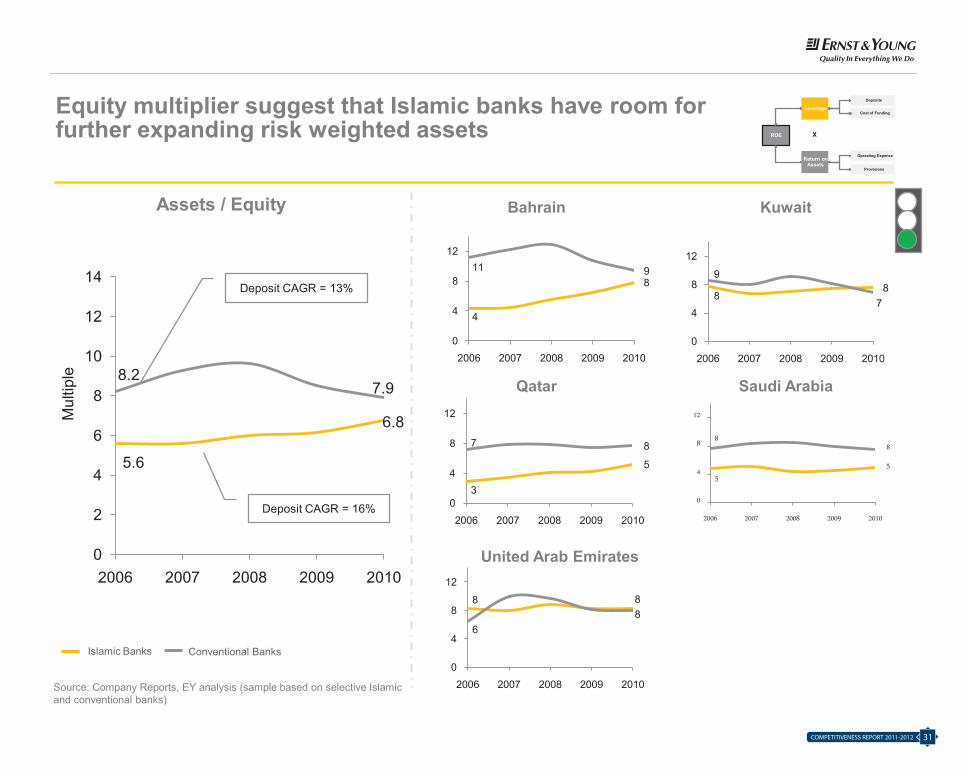
Equity multiplier suggest that Islamic banks have room for further expanding risk weighted assets
Bahrain Kuwait
Qatar Saudi Arabia
United Arab Emirates
Assets / Equity
ROE
Leverage
Return on Assets
Deposits
Cost of Funding
Operating Expense
Provisions
X
5.6
6.8
8.27.9
0
2
4
6
8
10
12
14
2006 2007 2008 2009 2010
Deposit CAGR = 13%
Deposit CAGR = 16%
4
811 9
0
4
8
12
2006 2007 2008 2009 2010
88
9
7
0
4
8
12
2006 2007 2008 2009 2010
3
5
7 8
0
4
8
12
2006 2007 2008 2009 2010
5
5
88
0
4
8
12
2006 2007 2008 2009 2010
8 8
68
0
4
8
12
2006 2007 2008 2009 2010
Islamic Banks Conventional Banks
Source: Company Reports, EY analysis (sample based on selective Islamic and conventional banks)
Mul
tiple
Islamic Banking Competitiveness Report 2011-12
Page 31
31COMPETITIVENESS REPORT 2011-2012
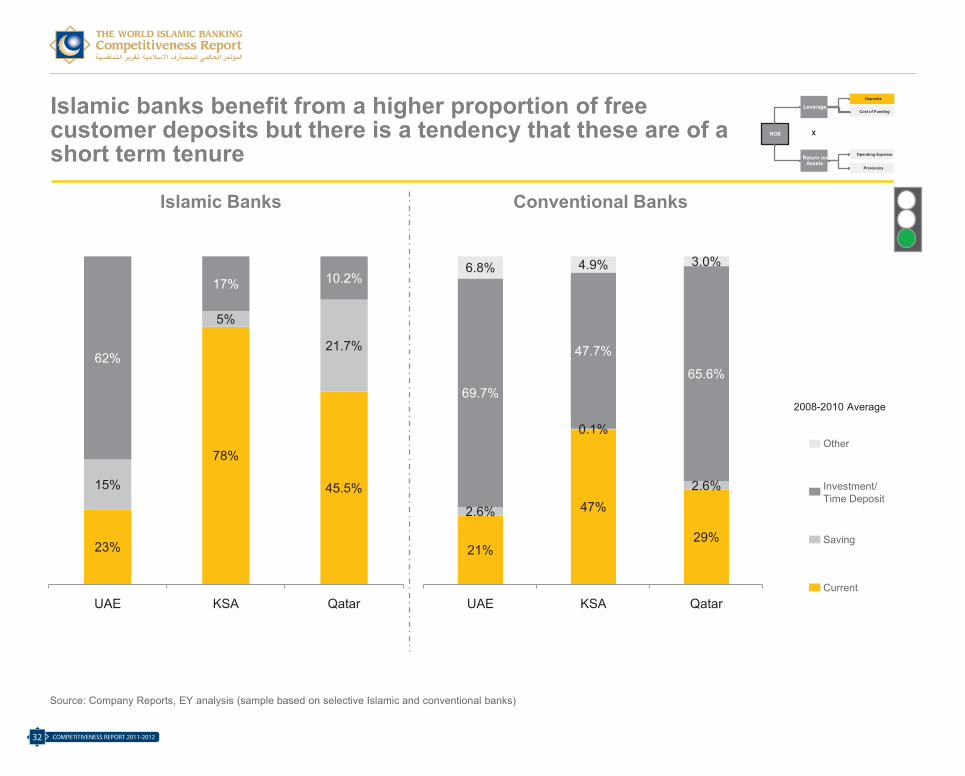
Islamic banks benefit from a higher proportion of free customer deposits but there is a tendency that these are of a short term tenure
Source: Company Reports, EY analysis (sample based on selective Islamic and conventional banks)
Islamic Banks Conventional Banks
Other
Investment/ Time Deposit
Saving
Current
21%
47%
29%
2.6%
0.1%
2.6%
69.7%
47.7%
65.6%
6.8% 4.9% 3.0%
UAE KSA Qatar
ROE
Leverage
Return on Assets
Deposits
Cost of Funding
Operating Expense
Provisions
X
2008-2010 Average
23%
78%
45.5%15%
5%
21.7%62%
17% 10.2%
UAE KSA Qatar
Islamic Banking Competitiveness Report 2011-12
Page 32
COMPETITIVENESS REPORT 2011-201232
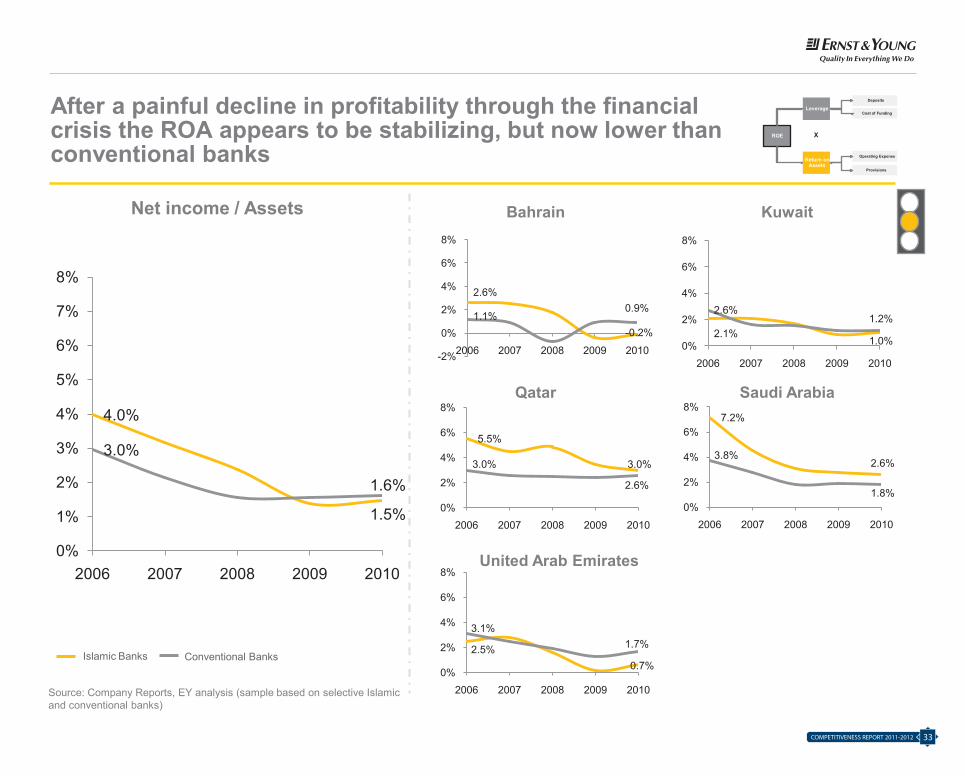
5.5%
3.0%3.0%
2.6%
0%
2%
4%
6%
8%
2006 2007 2008 2009 2010
2.6%
-0.2%1.1%
0.9%
-2%
0%
2%
4%
6%
8%
2006 2007 2008 2009 2010
After a painful decline in profitability through the financial crisis the ROA appears to be stabilizing, but now lower than conventional banks
Bahrain Kuwait
Qatar Saudi Arabia
United Arab Emirates
Net income / Assets
ROE
Leverage
Return on Assets
Deposits
Cost of Funding
Operating Expense
Provisions
X
4.0%
1.5%
3.0%
1.6%
0%
1%
2%
3%
4%
5%
6%
7%
8%
2006 2007 2008 2009 2010
2.1%1.0%
2.6%1.2%
0%
2%
4%
6%
8%
2006 2007 2008 2009 2010
7.2%
2.6%3.8%
1.8%0%
2%
4%
6%
8%
2006 2007 2008 2009 2010
2.5%0.7%
3.1%1.7%
0%
2%
4%
6%
8%
2006 2007 2008 2009 2010
Islamic Banks Conventional Banks
Source: Company Reports, EY analysis (sample based on selective Islamic and conventional banks)
Islamic Banking Competitiveness Report 2011-12
Page 33
33COMPETITIVENESS REPORT 2011-2012
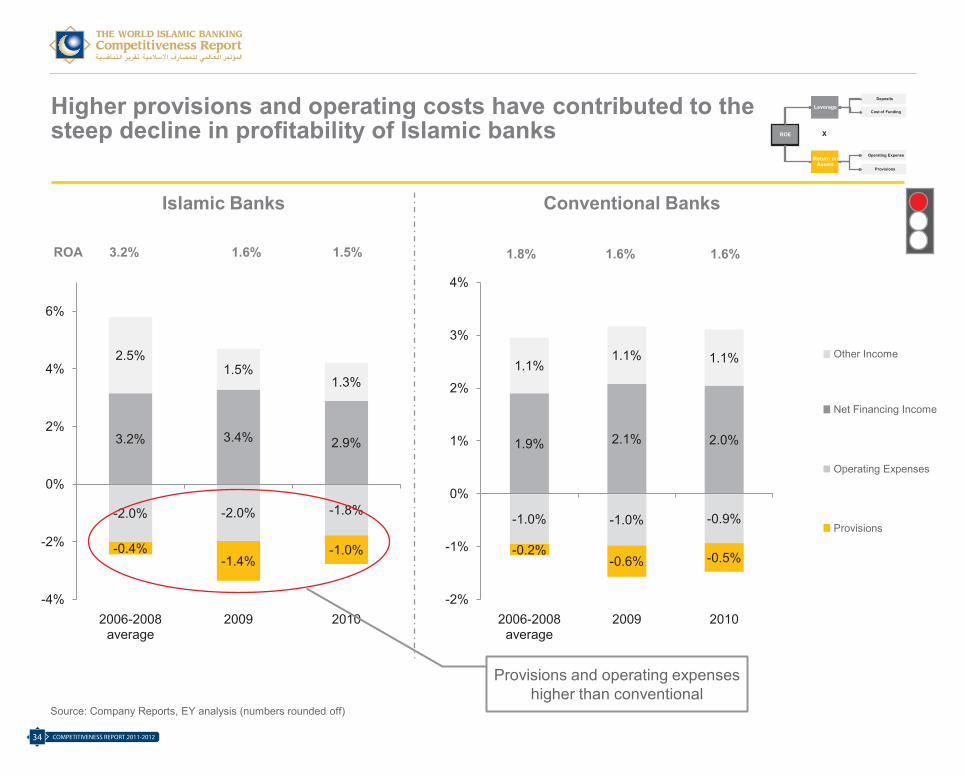
Higher provisions and operating costs have contributed to the steep decline in profitability of Islamic banks
ROA 3.2% 1.6% 1.5% 1.8% 1.6% 1.6%
Source: Company Reports, EY analysis (numbers rounded off)
Provisions
Operating Expenses
Other Income
Net Financing Income
Islamic Banks Conventional Banks
ROE
Leverage
Return on Assets
Deposits
Cost of Funding
Operating Expense
Provisions
X
3.2% 3.4% 2.9%
2.5%1.5%
1.3%
-2.0% -2.0% -1.8%
-0.4%-1.4%
-1.0%
-4%
-2%
0%
2%
4%
6%
2006-2008 average
2009 2010
1.9% 2.1% 2.0%
1.1%1.1% 1.1%
-1.0% -1.0% -0.9%
-0.2%-0.6% -0.5%
-2%
-1%
0%
1%
2%
3%
4%
2006-2008 average
2009 2010
Provisions and operating expenses higher than conventional
Islamic Banking Competitiveness Report 2011-12
Page 34
COMPETITIVENESS REPORT 2011-201234
Higher provisions and operating costs have contributed to the steep decline in profitability of Islamic banks
ROA 3.2% 1.6% 1.5% 1.8% 1.6% 1.6%
Source: Company Reports, EY analysis (numbers rounded off)
Provisions
Operating Expenses
Other Income
Net Financing Income
Islamic Banks Conventional Banks
ROE
Leverage
Return on Assets
Deposits
Cost of Funding
Operating Expense
Provisions
X
3.2% 3.4% 2.9%
2.5%1.5%
1.3%
-2.0% -2.0% -1.8%
-0.4%-1.4%
-1.0%
-4%
-2%
0%
2%
4%
6%
2006-2008 average
2009 2010
1.9% 2.1% 2.0%
1.1%1.1% 1.1%
-1.0% -1.0% -0.9%
-0.2%-0.6% -0.5%
-2%
-1%
0%
1%
2%
3%
4%
2006-2008 average
2009 2010
Provisions and operating expenses higher than conventional
Islamic Banking Competitiveness Report 2011-12
Page 34
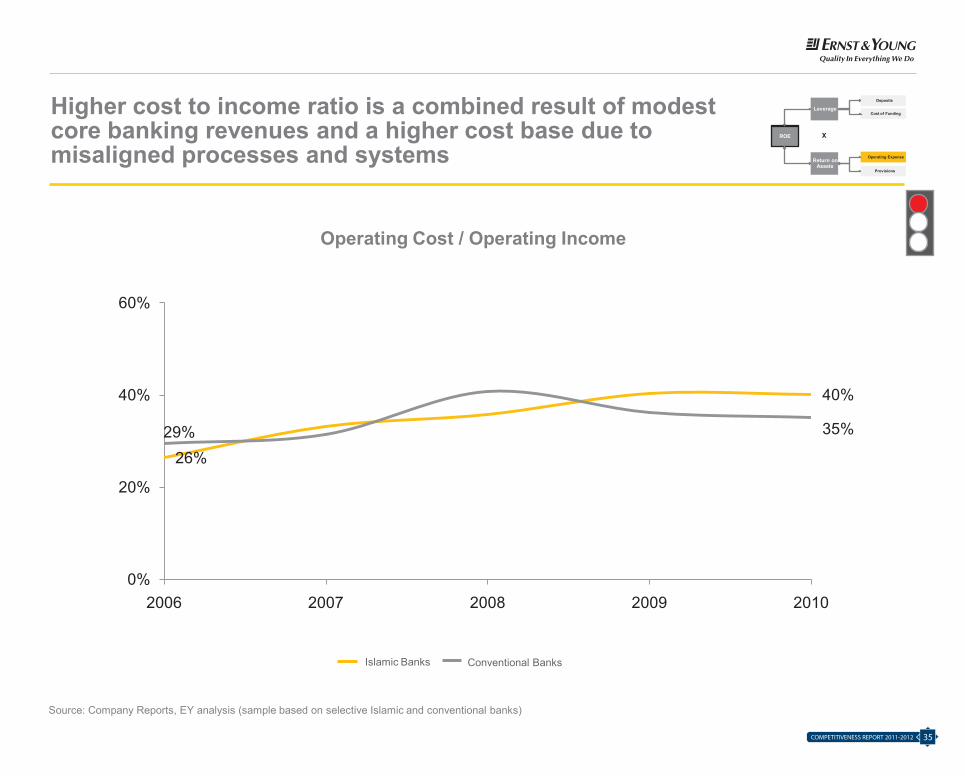
Higher cost to income ratio is a combined result of modest core banking revenues and a higher cost base due to misaligned processes and systems
Operating Cost / Operating Income
ROE
Leverage
Return on Assets
Deposits
Cost of Funding
Operating Expense
Provisions
X
26%
40%
29% 35%
0%
20%
40%
60%
2006 2007 2008 2009 2010
Islamic Banks Conventional Banks
Source: Company Reports, EY analysis (sample based on selective Islamic and conventional banks)
Islamic Banking Competitiveness Report 2011-12
Page 35
35COMPETITIVENESS REPORT 2011-2012
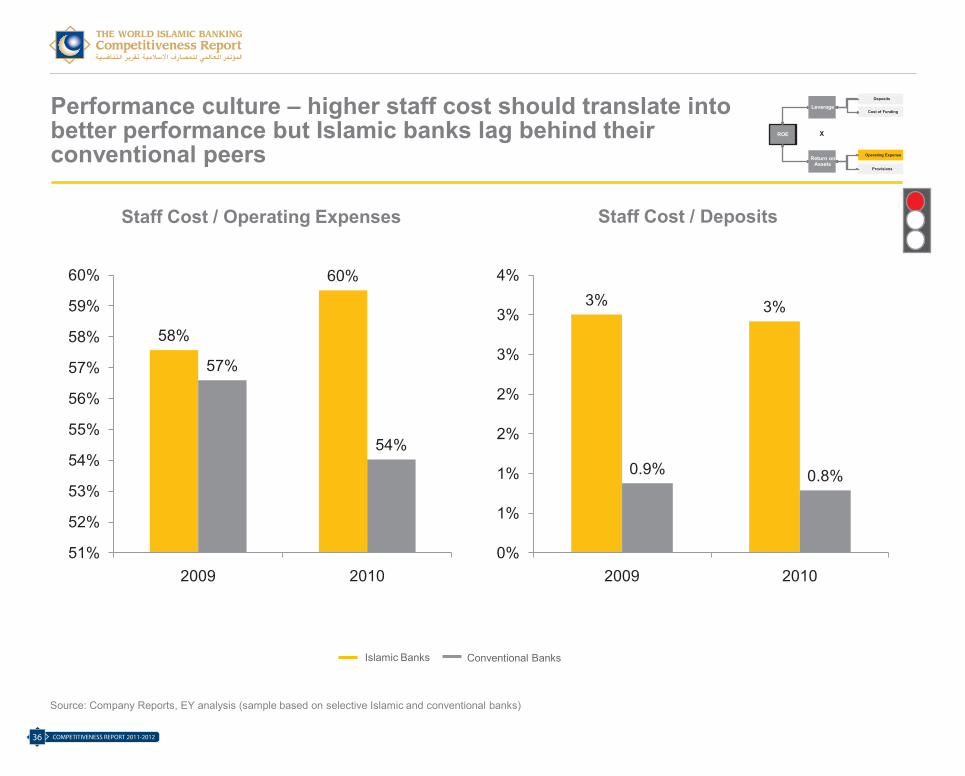
Performance culture – higher staff cost should translate into better performance but Islamic banks lag behind their conventional peers
ROE
Leverage
Return on Assets
Deposits
Cost of Funding
Operating Expense
Provisions
X
58%
60%
57%
54%
51%
52%
53%
54%
55%
56%
57%
58%
59%
60%
2009 2010
3% 3%
0.9% 0.8%
0%
1%
1%
2%
2%
3%
3%
4%
2009 2010
Staff Cost / Operating Expenses Staff Cost / Deposits
Source: Company Reports, EY analysis (sample based on selective Islamic and conventional banks)
Islamic Banks Conventional Banks
Islamic Banking Competitiveness Report 2011-12
Page 36
COMPETITIVENESS REPORT 2011-201236
2.0%1.5%
1.3%
2.2%
0%
2%
4%
6%
2006 2007 2008 2009 2010
2.1%
3.8%
1.3%1.4%
0%
2%
4%
6%
2006 2007 2008 2009 2010
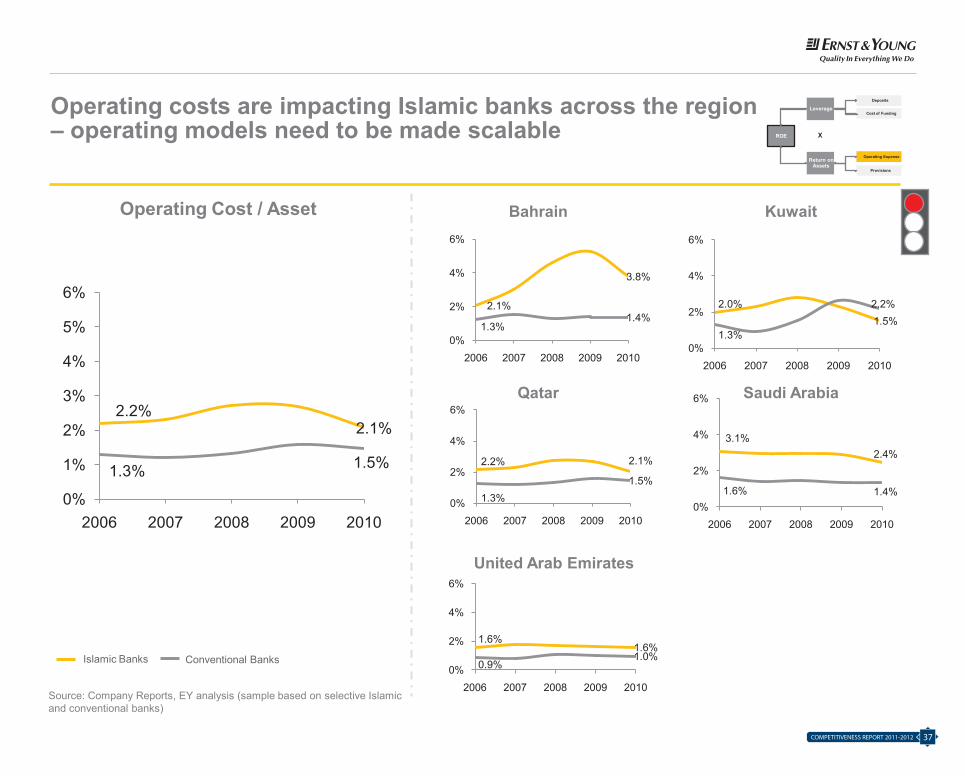
Operating costs are impacting Islamic banks across the region – operating models need to be made scalable
Bahrain Kuwait
Qatar Saudi Arabia
United Arab Emirates
Operating Cost / Asset
ROE
Leverage
Return on Assets
Deposits
Cost of Funding
Operating Expense
Provisions
X
2.2%2.1%
1.3% 1.5%
0%
1%
2%
3%
4%
5%
6%
2006 2007 2008 2009 2010
2.2% 2.1%
1.3%1.5%
0%
2%
4%
6%
2006 2007 2008 2009 2010
3.1%2.4%
1.6% 1.4%0%
2%
4%
6%
2006 2007 2008 2009 2010
1.6%1.6%
0.9%1.0%
0%
2%
4%
6%
2006 2007 2008 2009 2010
Islamic Banks Conventional Banks
Source: Company Reports, EY analysis (sample based on selective Islamic and conventional banks)
Islamic Banking Competitiveness Report 2011-12
Page 37
37COMPETITIVENESS REPORT 2011-2012
2%
18%
5% 16%
-10%
10%
30%
50%
2006 2007 2008 2009 2010
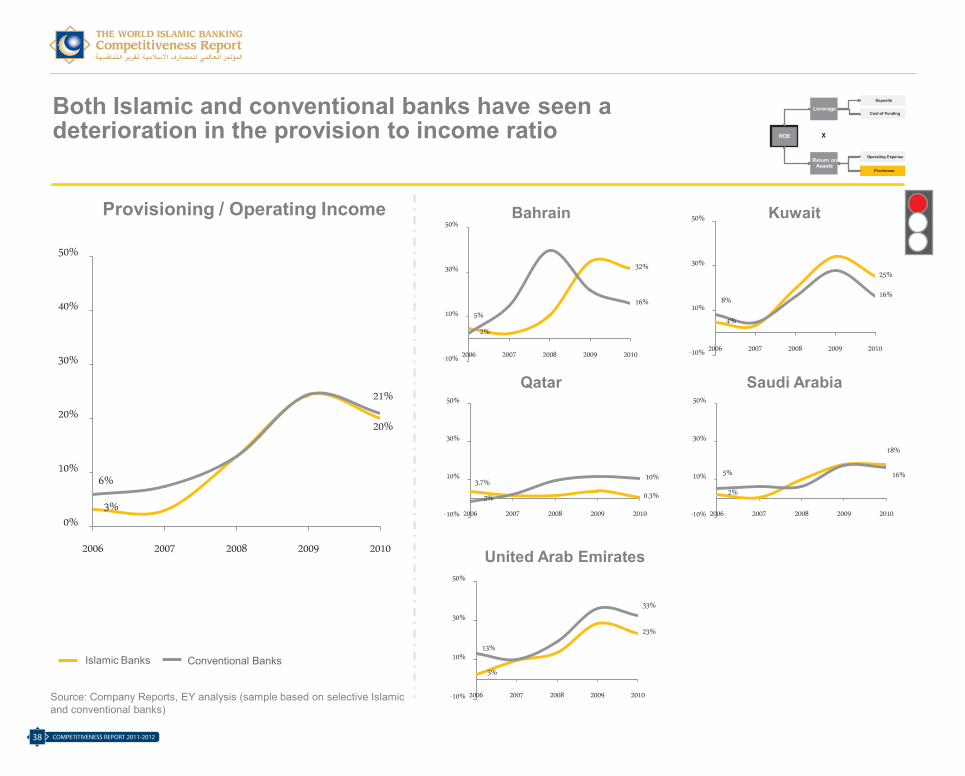
Both Islamic and conventional banks have seen a deterioration in the provision to income ratio
Bahrain Kuwait
Qatar Saudi Arabia
United Arab Emirates
Provisioning / Operating Income
ROE
Leverage
Return on Assets
Deposits
Cost of Funding
Operating Expense
Provisions
X
3%
20%
6%
21%
0%
10%
20%
30%
40%
50%
2006 2007 2008 2009 2010
5%
32%
2%
16%
-10%
10%
30%
50%
2006 2007 2008 2009 2010
4%
25%
8%16%
-10%
10%
30%
50%
2006 2007 2008 2009 2010
3.7%
0.3%-2%
10%
-10%
10%
30%
50%
2006 2007 2008 2009 2010
3%
23%
13%
33%
-10%
10%
30%
50%
2006 2007 2008 2009 2010
Islamic Banks Conventional Banks
Source: Company Reports, EY analysis (sample based on selective Islamic and conventional banks)
Islamic Banking Competitiveness Report 2011-12
Page 38
COMPETITIVENESS REPORT 2011-201238
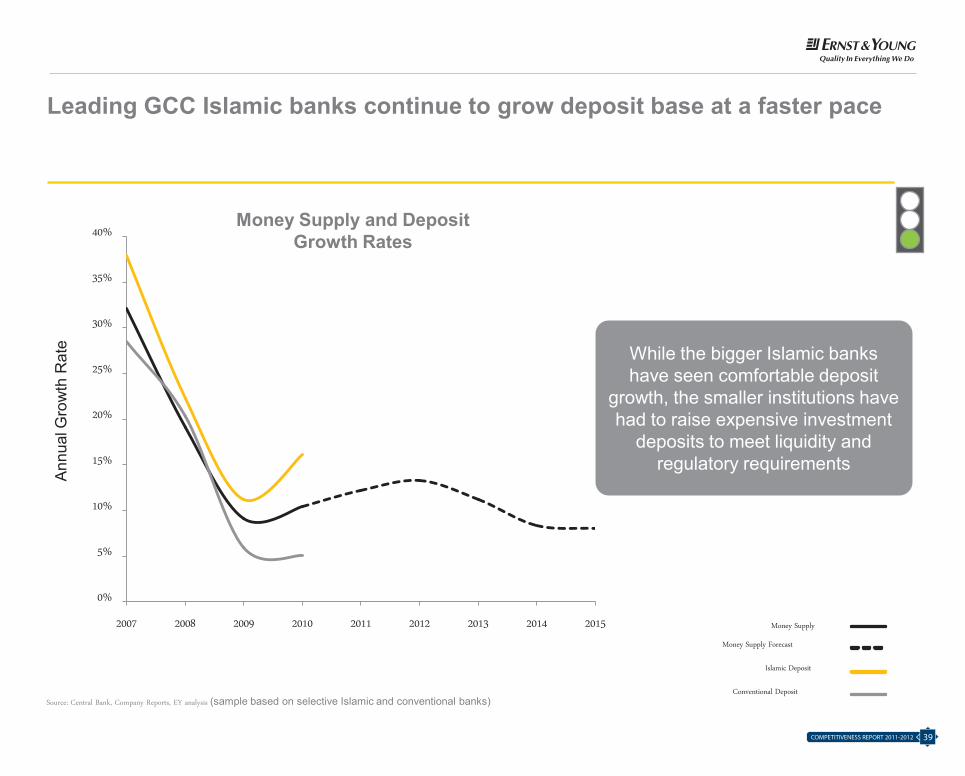
Leading GCC Islamic banks continue to grow deposit base at a faster pace
Money Supply
Islamic Deposit
Conventional Deposit
Money Supply Forecast
0%
5%
10%
15%
20%
25%
30%
35%
40%
2007 2008 2009 2010 2011 2012 2013 2014 2015
Source: Central Bank, Company Reports, EY analysis (sample based on selective Islamic and conventional banks)
Money Supply and Deposit Growth Rates
Ann
ual G
row
th R
ate While the bigger Islamic banks
have seen comfortable deposit growth, the smaller institutions have had to raise expensive investment
deposits to meet liquidity and regulatory requirements
Islamic Banking Competitiveness Report 2011-12
Page 39
39COMPETITIVENESS REPORT 2011-2012
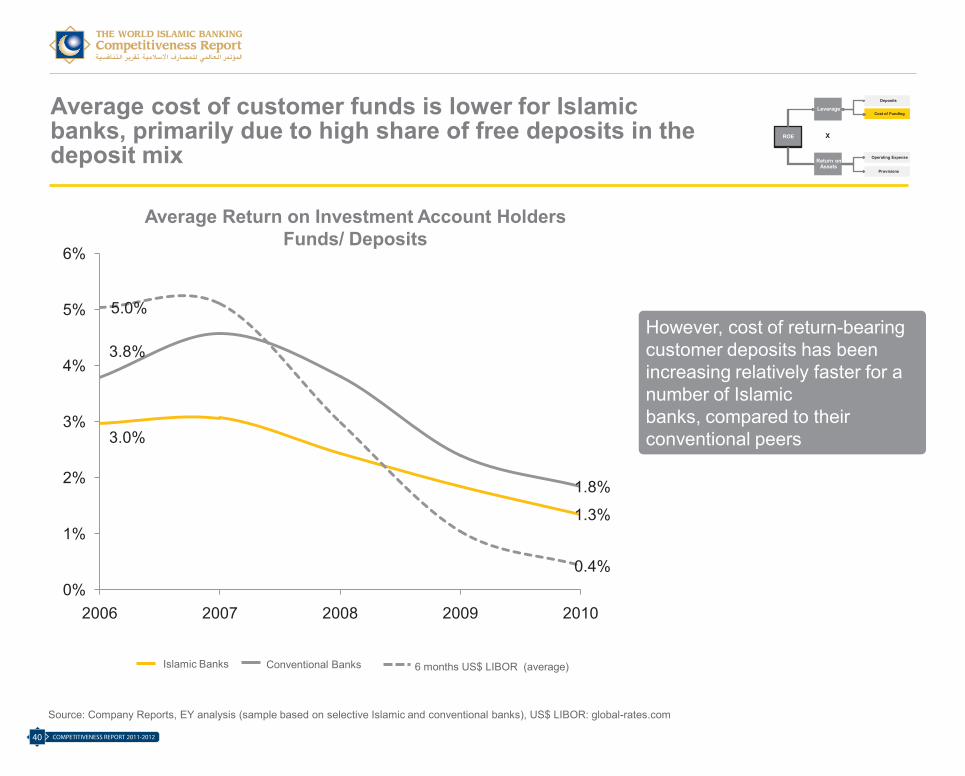
Average cost of customer funds is lower for Islamic banks, primarily due to high share of free deposits in the deposit mix
Average Return on Investment Account Holders Funds/ Deposits
ROE
Leverage
Return on Assets
Deposits
Cost of Funding
Operating Expense
Provisions
X
3.0%
1.3%
3.8%
1.8%
5.0%
0.4%0%
1%
2%
3%
4%
5%
6%
2006 2007 2008 2009 2010
Islamic Banks Conventional Banks
Source: Company Reports, EY analysis (sample based on selective Islamic and conventional banks), US$ LIBOR: global-rates.com
6 months US$ LIBOR (average)
However, cost of return-bearing customer deposits has been increasing relatively faster for a number of Islamic banks, compared to their conventional peers
Islamic Banking Competitiveness Report 2011-12
Page 40
COMPETITIVENESS REPORT 2011-201240
Average cost of customer funds is lower for Islamic banks, primarily due to high share of free deposits in the deposit mix
Average Return on Investment Account Holders Funds/ Deposits
ROE
Leverage
Return on Assets
Deposits
Cost of Funding
Operating Expense
Provisions
X
3.0%
1.3%
3.8%
1.8%
5.0%
0.4%0%
1%
2%
3%
4%
5%
6%
2006 2007 2008 2009 2010
Islamic Banks Conventional Banks
Source: Company Reports, EY analysis (sample based on selective Islamic and conventional banks), US$ LIBOR: global-rates.com
6 months US$ LIBOR (average)
However, cost of return-bearing customer deposits has been increasing relatively faster for a number of Islamic banks, compared to their conventional peers
Islamic Banking Competitiveness Report 2011-12
Page 40
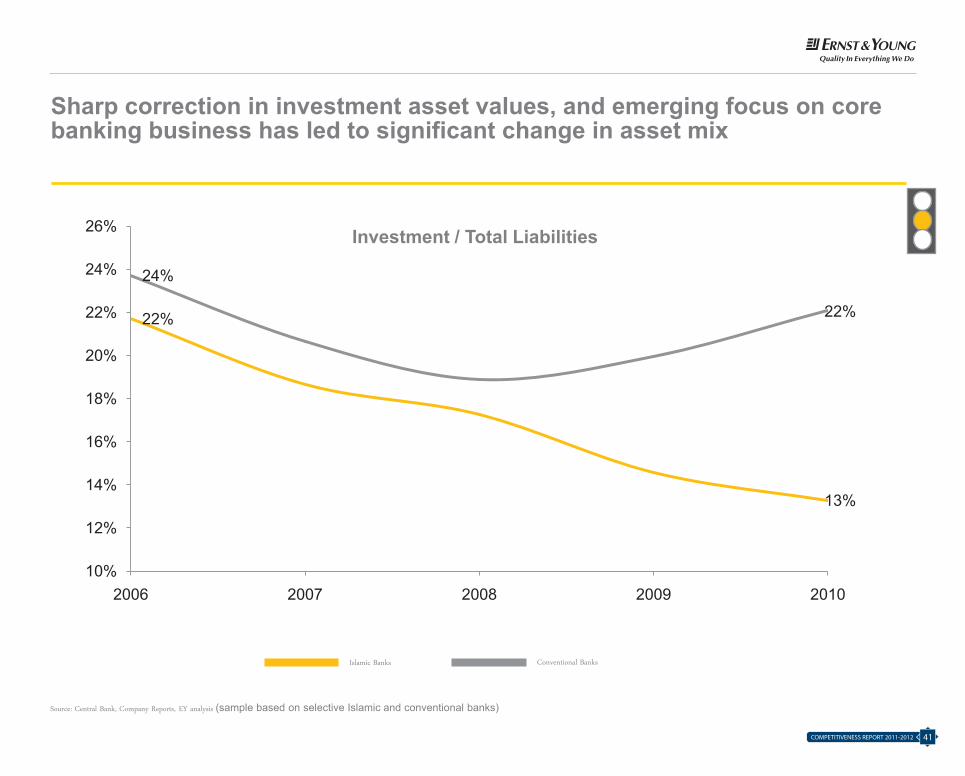
Sharp correction in investment asset values, and emerging focus on core banking business has led to significant change in asset mix
Source: Central Bank, Company Reports, EY analysis (sample based on selective Islamic and conventional banks)
Islamic Banks Conventional Banks
22%
13%
24%
22%
10%
12%
14%
16%
18%
20%
22%
24%
26%
2006 2007 2008 2009 2010
Investment / Total Liabilities
Islamic Banking Competitiveness Report 2011-12
Page 41
41COMPETITIVENESS REPORT 2011-2012
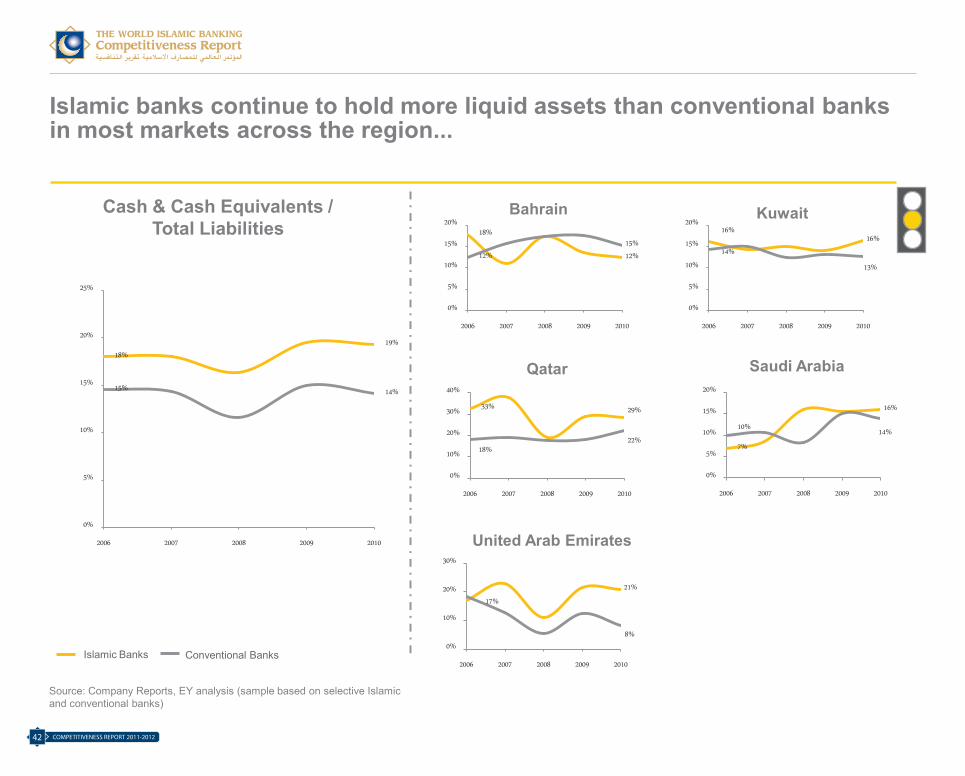
Islamic banks continue to hold more liquid assets than conventional banks in most markets across the region...
Saudi Arabia
United Arab Emirates
Kuwait
Qatar
BahrainCash & Cash Equivalents / Total Liabilities
7%
16%
10%14%
0%
5%
10%
15%
20%
2006 2007 2008 2009 2010
18%
19%
15% 14%
0%
5%
10%
15%
20%
25%
2006 2007 2008 2009 2010
17%
21%
8%0%
10%
20%
30%
2006 2007 2008 2009 2010
18%
12%12%
15%
0%
5%
10%
15%
20%
2006 2007 2008 2009 2010
16%16%
14%
13%
0%
5%
10%
15%
20%
2006 2007 2008 2009 2010
33% 29%
18%22%
0%
10%
20%
30%
40%
2006 2007 2008 2009 2010
Islamic Banks Conventional Banks
Source: Company Reports, EY analysis (sample based on selective Islamic and conventional banks)
Islamic Banking Competitiveness Report 2011-12
Page 42
COMPETITIVENESS REPORT 2011-201242
Islamic banks continue to hold more liquid assets than conventional banks in most markets across the region...
Saudi Arabia
United Arab Emirates
Kuwait
Qatar
BahrainCash & Cash Equivalents / Total Liabilities
7%
16%
10%14%
0%
5%
10%
15%
20%
2006 2007 2008 2009 2010
18%
19%
15% 14%
0%
5%
10%
15%
20%
25%
2006 2007 2008 2009 2010
17%
21%
8%0%
10%
20%
30%
2006 2007 2008 2009 2010
18%
12%12%
15%
0%
5%
10%
15%
20%
2006 2007 2008 2009 2010
16%16%
14%
13%
0%
5%
10%
15%
20%
2006 2007 2008 2009 2010
33% 29%
18%22%
0%
10%
20%
30%
40%
2006 2007 2008 2009 2010
Islamic Banks Conventional Banks
Source: Company Reports, EY analysis (sample based on selective Islamic and conventional banks)
Islamic Banking Competitiveness Report 2011-12
Page 42
Islamic Banks Conventional Banks
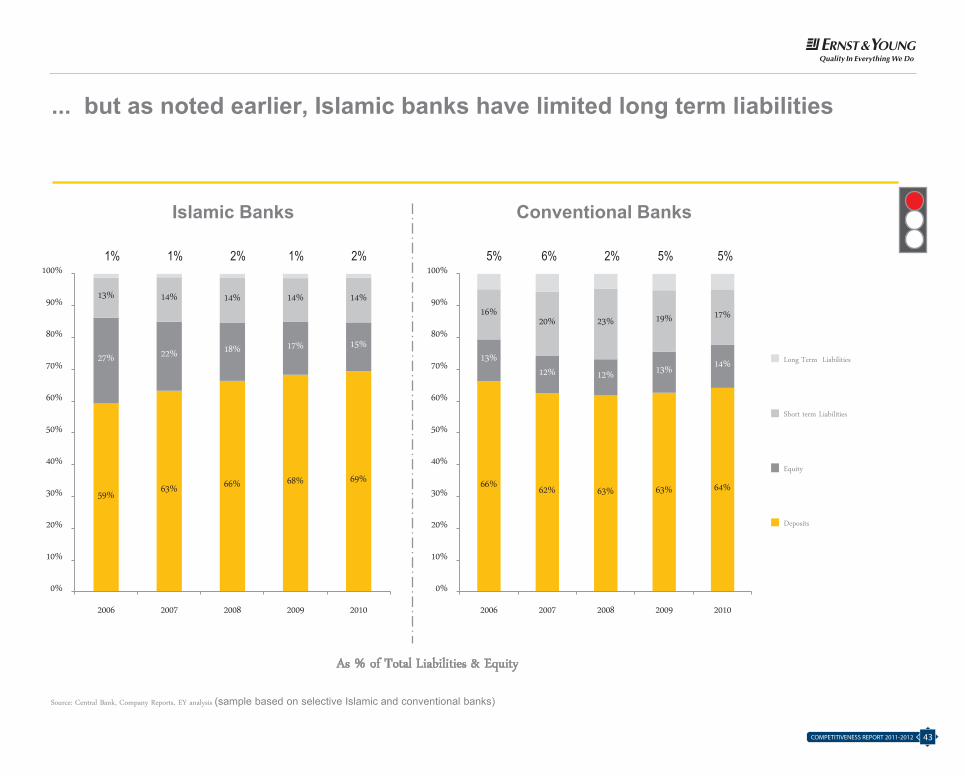
... but as noted earlier, Islamic banks have limited long term liabilities
Long Term Liabilities
Short term Liabilities
Equity
Deposits
59%63% 66% 68% 69%
27% 22% 18% 17% 15%
13% 14% 14% 14% 14%
0%
10%
20%
30%
40%
50%
60%
70%
80%
90%
100%
2006 2007 2008 2009 2010
66% 62% 63% 63% 64%
13%12% 12% 13% 14%
16%20% 23% 19% 17%
0%
10%
20%
30%
40%
50%
60%
70%
80%
90%
100%
2006 2007 2008 2009 2010
Source: Central Bank, Company Reports, EY analysis (sample based on selective Islamic and conventional banks)
As % of Total Liabilities & Equity
1% 1% 2% 1% 2% 5% 6% 2% 5% 5%
Islamic Banking Competitiveness Report 2011-12
Page 43
43COMPETITIVENESS REPORT 2011-2012
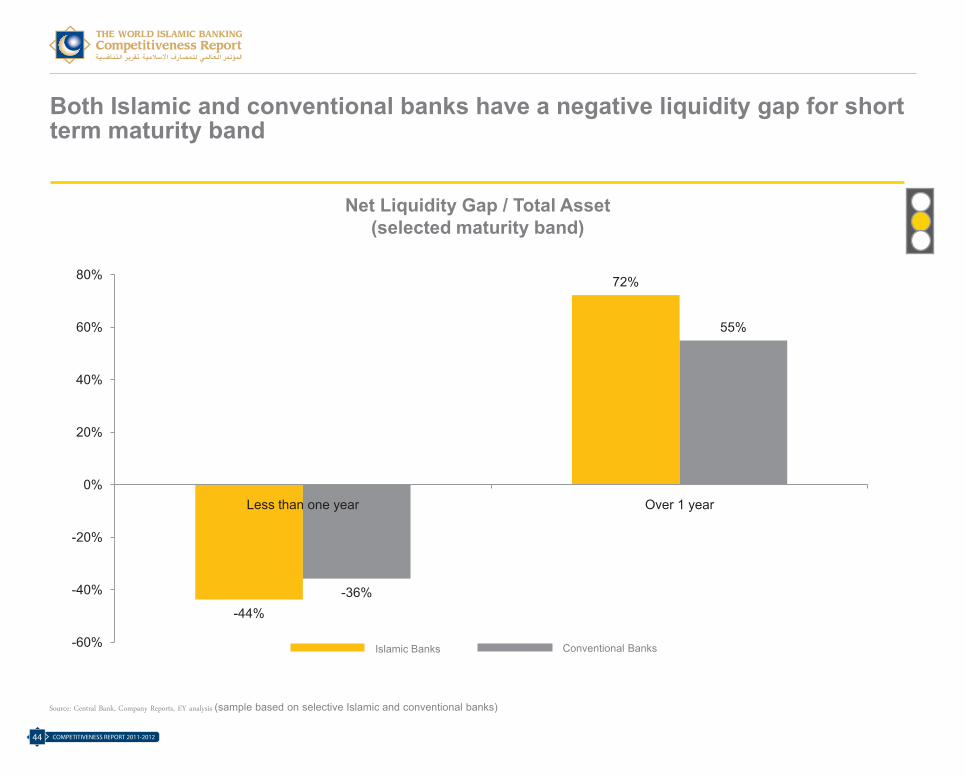
Both Islamic and conventional banks have a negative liquidity gap for short term maturity band
-44%
72%
-36%
55%
-60%
-40%
-20%
0%
20%
40%
60%
80%
Less than one year Over 1 year
Net Liquidity Gap / Total Asset (selected maturity band)
Islamic Banks Conventional Banks
Source: Central Bank, Company Reports, EY analysis (sample based on selective Islamic and conventional banks)
Islamic Banking Competitiveness Report 2011-12
Page 44
COMPETITIVENESS REPORT 2011-201244
Both Islamic and conventional banks have a negative liquidity gap for short term maturity band
-44%
72%
-36%
55%
-60%
-40%
-20%
0%
20%
40%
60%
80%
Less than one year Over 1 year
Net Liquidity Gap / Total Asset (selected maturity band)
Islamic Banks Conventional Banks
Source: Central Bank, Company Reports, EY analysis (sample based on selective Islamic and conventional banks)
Islamic Banking Competitiveness Report 2011-12
Page 44
Report Structure
Performance Analysis
Competitive Landscape
Competing to Win: The CEO
Agenda
Country Spotlight
Executive Brief
1
2 3
5 4
Islamic Banking Competitiveness Report 2011-12
Page 45
45COMPETITIVENESS REPORT 2011-2012
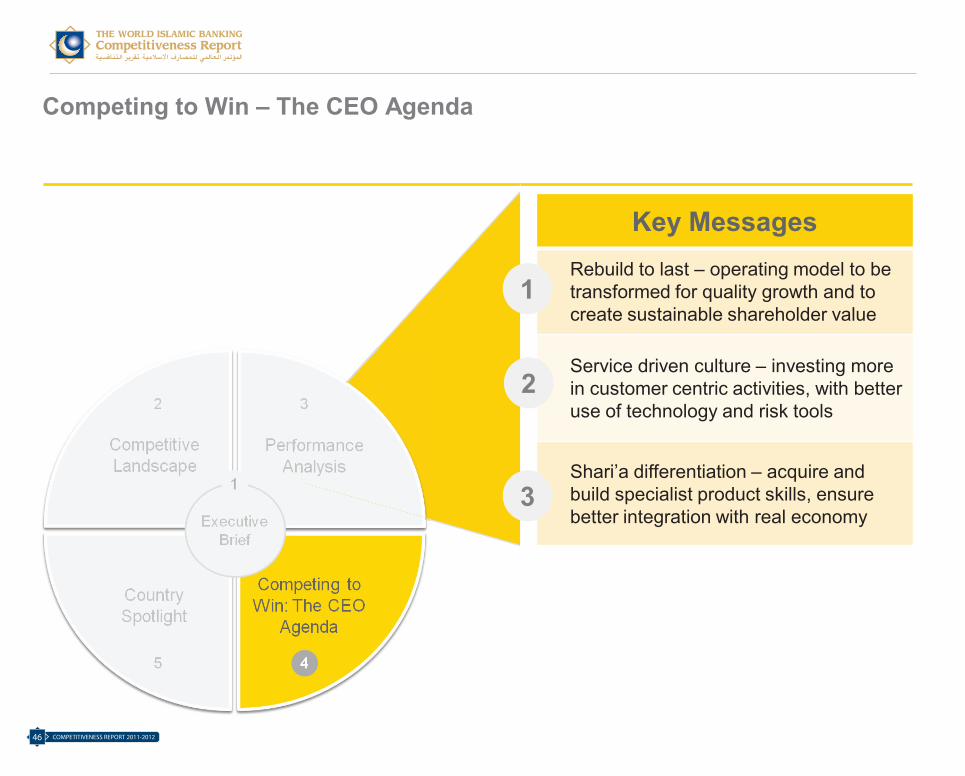
Key MessagesRebuild to last – operating model to be transformed for quality growth and to create sustainable shareholder value
Service driven culture – investing more in customer centric activities, with better use of technology and risk tools
Shari’a differentiation – acquire and build specialist product skills, ensure better integration with real economy
1
2
3
Competing to Win – The CEO Agenda
Islamic Banking Competitiveness Report 2011-12
Page 46
COMPETITIVENESS REPORT 2011-201246
Key MessagesRebuild to last – operating model to be transformed for quality growth and to create sustainable shareholder value
Service driven culture – investing more in customer centric activities, with better use of technology and risk tools
Shari’a differentiation – acquire and build specialist product skills, ensure better integration with real economy
1
2
3
Competing to Win – The CEO Agenda
Islamic Banking Competitiveness Report 2011-12
Page 46
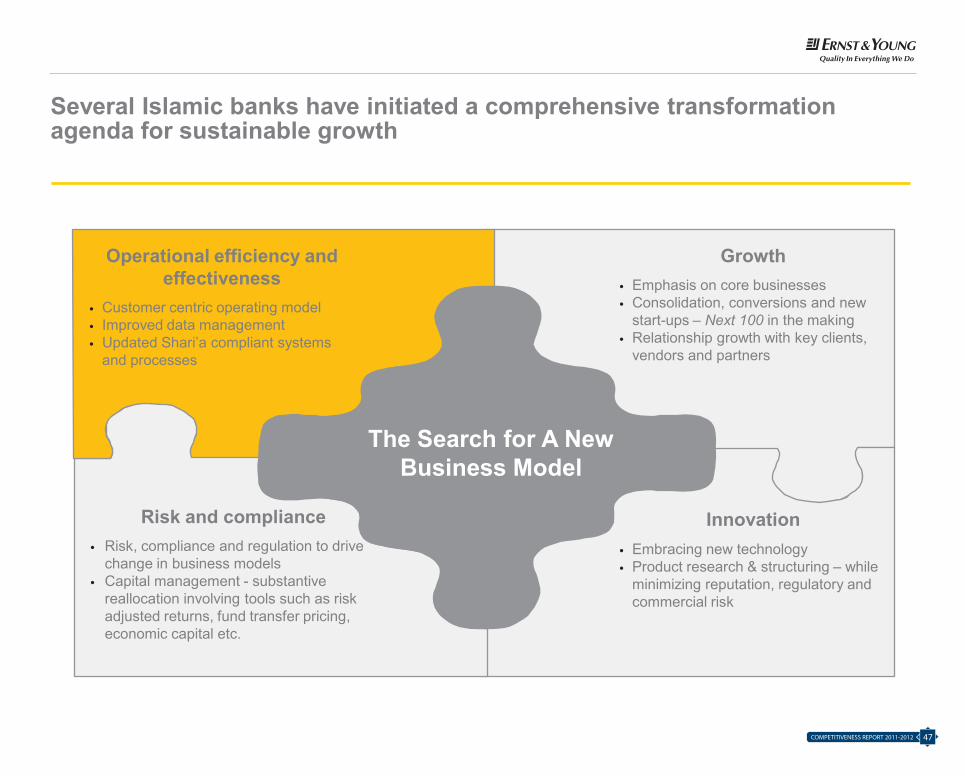
Several Islamic banks have initiated a comprehensive transformation agenda for sustainable growth
Risk and compliance • Risk, compliance and regulation to drive
change in business models• Capital management - substantive
reallocation involving tools such as risk adjusted returns, fund transfer pricing, economic capital etc.
The Search for A New Business Model
Operational efficiency and effectiveness
• Customer centric operating model• Improved data management • Updated Shari’a compliant systems
and processes
Innovation• Embracing new technology• Product research & structuring – while
minimizing reputation, regulatory and commercial risk
Growth• Emphasis on core businesses• Consolidation, conversions and new
start-ups – Next 100 in the making• Relationship growth with key clients,
vendors and partners
Islamic Banking Competitiveness Report 2011-12
Page 47
47COMPETITIVENESS REPORT 2011-2012
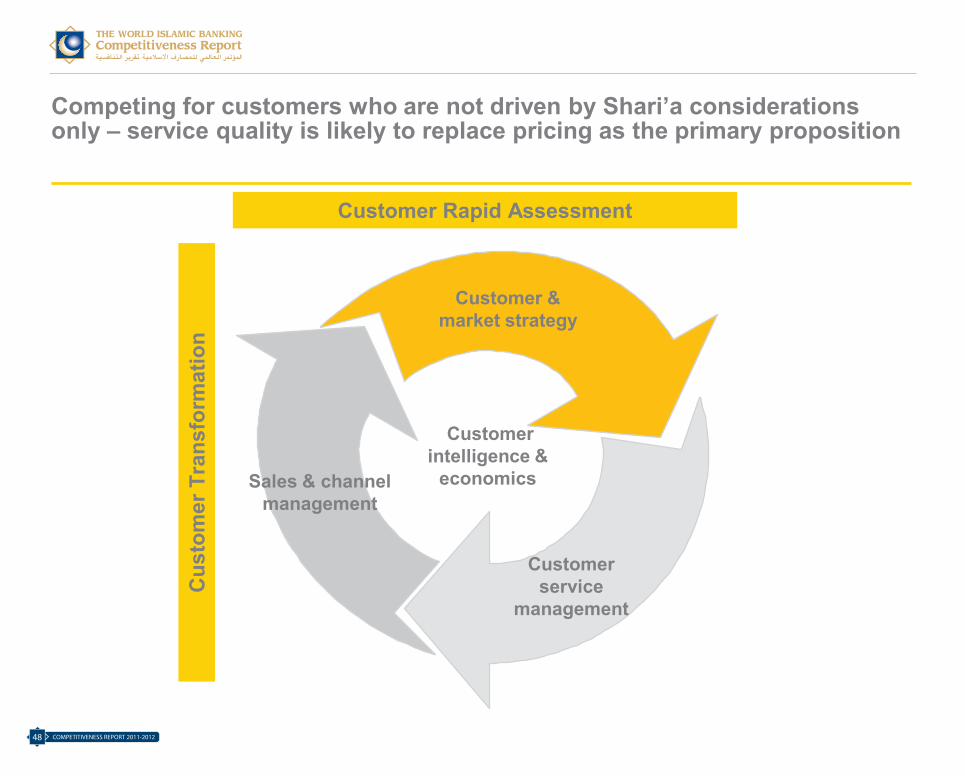
Competing for customers who are not driven by Shari’a considerations only – service quality is likely to replace pricing as the primary proposition
Sales & channel management
Customer & market strategy
Customer service
management
Customer intelligence &
economics
Customer Rapid AssessmentC
usto
mer
Tra
nsfo
rmat
ion
Islamic Banking Competitiveness Report 2011-12
Page 48
COMPETITIVENESS REPORT 2011-201248
Competing for customers who are not driven by Shari’a considerations only – service quality is likely to replace pricing as the primary proposition
Sales & channel management
Customer & market strategy
Customer service
management
Customer intelligence &
economics
Customer Rapid Assessment
Cus
tom
er T
rans
form
atio
n
Islamic Banking Competitiveness Report 2011-12
Page 48
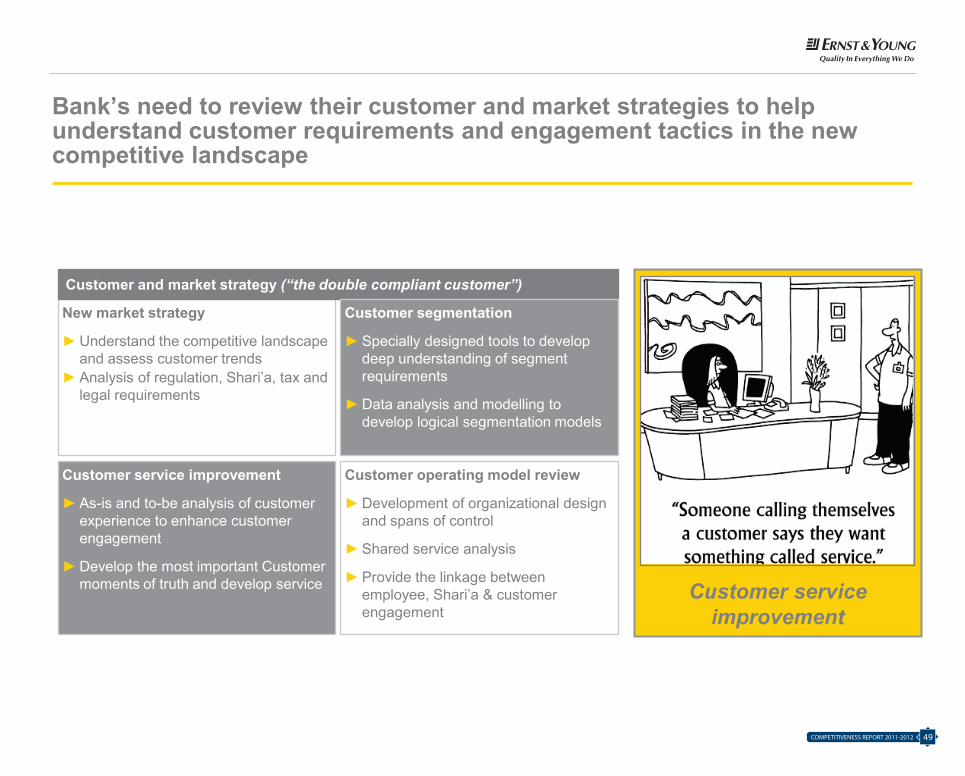
New market strategy
►Understand the competitive landscape and assess customer trends
►Analysis of regulation, Shari’a, tax and legal requirements
Customer and market strategy (“the double compliant customer”)
Customer segmentation
►Specially designed tools to develop deep understanding of segment requirements
►Data analysis and modelling to develop logical segmentation models
Customer service improvement
►As-is and to-be analysis of customer experience to enhance customer engagement
►Develop the most important Customer moments of truth and develop service
Customer operating model review
►Development of organizational design and spans of control
►Shared service analysis
►Provide the linkage between employee, Shari’a & customer engagement
Customer service improvement
Bank’s need to review their customer and market strategies to help understand customer requirements and engagement tactics in the new competitive landscape
Islamic Banking Competitiveness Report 2011-12
Page 49
49COMPETITIVENESS REPORT 2011-2012
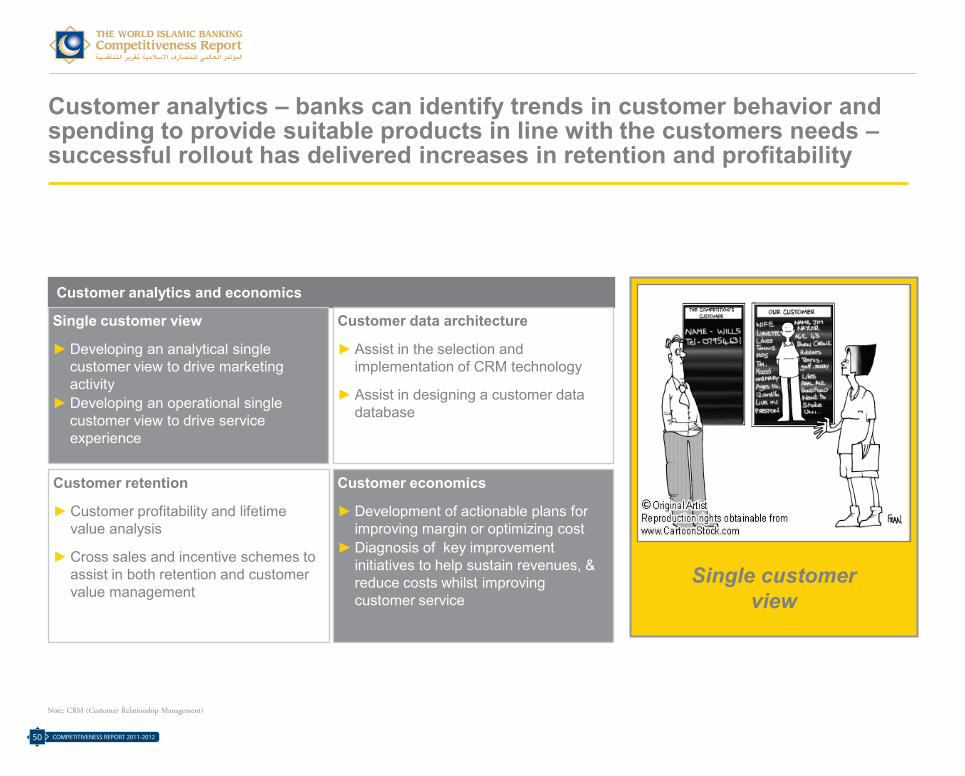
Single customer view
Customer analytics and economics
Single customer view
►Developing an analytical single customer view to drive marketing activity
►Developing an operational single customer view to drive service experience
Customer data architecture
►Assist in the selection and implementation of CRM technology
►Assist in designing a customer data database
Customer retention
►Customer profitability and lifetime value analysis
►Cross sales and incentive schemes to assist in both retention and customer value management
Customer economics
►Development of actionable plans for improving margin or optimizing cost
►Diagnosis of key improvement initiatives to help sustain revenues, & reduce costs whilst improving customer service
Note: CRM (Customer Relationship Management)
Customer analytics – banks can identify trends in customer behavior and spending to provide suitable products in line with the customers needs –successful rollout has delivered increases in retention and profitability
Islamic Banking Competitiveness Report 2011-12
Page 50
COMPETITIVENESS REPORT 2011-201250
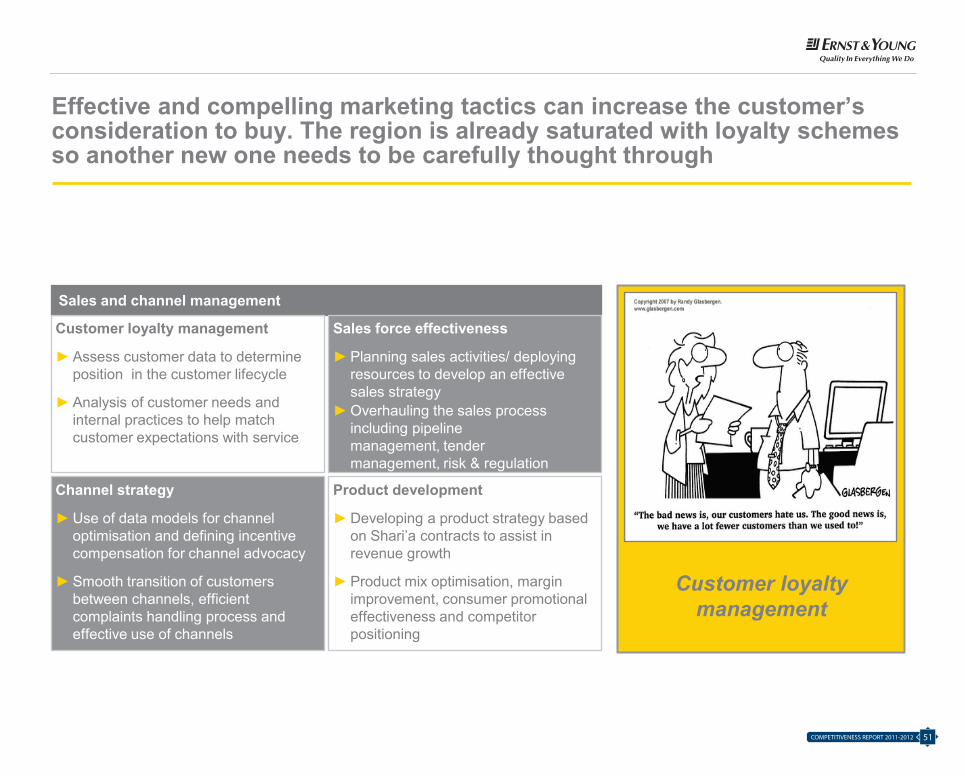
Customer loyalty management
Sales and channel management
Customer loyalty management
►Assess customer data to determine position in the customer lifecycle
►Analysis of customer needs and internal practices to help match customer expectations with service
Sales force effectiveness
►Planning sales activities/ deploying resources to develop an effective sales strategy
►Overhauling the sales process including pipeline management, tender management, risk & regulation
Channel strategy
►Use of data models for channel optimisation and defining incentive compensation for channel advocacy
►Smooth transition of customers between channels, efficient complaints handling process and effective use of channels
Product development
►Developing a product strategy based on Shari’a contracts to assist in revenue growth
►Product mix optimisation, margin improvement, consumer promotional effectiveness and competitor positioning
Effective and compelling marketing tactics can increase the customer’s consideration to buy. The region is already saturated with loyalty schemes so another new one needs to be carefully thought through
Islamic Banking Competitiveness Report 2011-12
Page 51
51COMPETITIVENESS REPORT 2011-2012
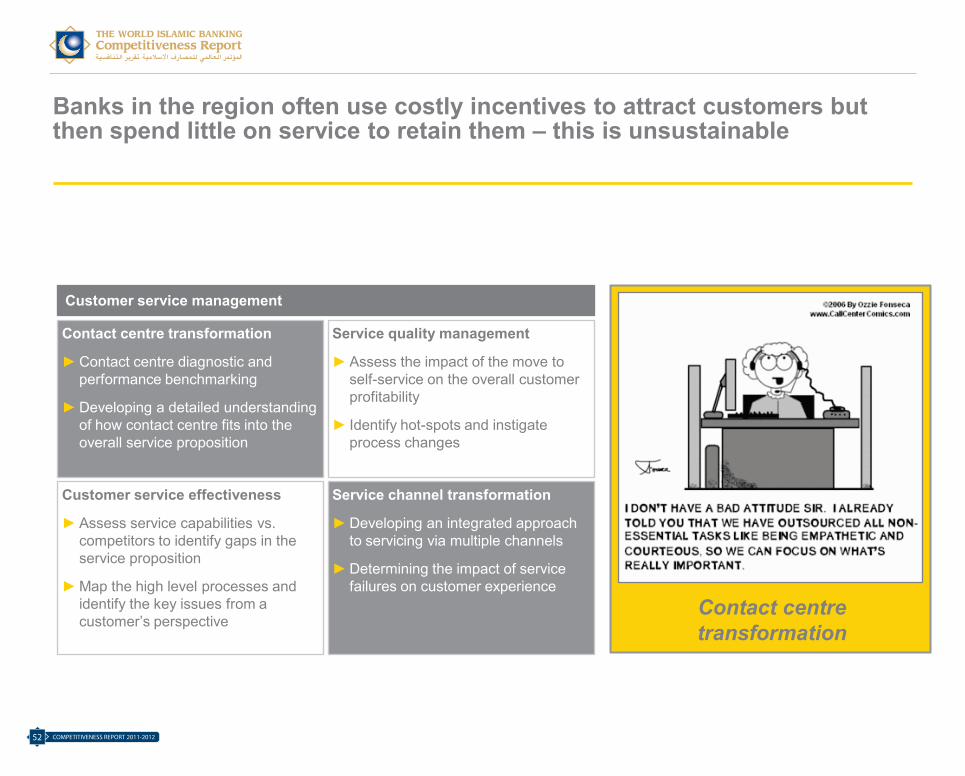
Customer service management
Contact centre transformation
►Contact centre diagnostic and performance benchmarking
►Developing a detailed understanding of how contact centre fits into the overall service proposition
Service quality management
►Assess the impact of the move to self-service on the overall customer profitability
► Identify hot-spots and instigate process changes
Customer service effectiveness
►Assess service capabilities vs. competitors to identify gaps in the service proposition
►Map the high level processes and identify the key issues from a customer’s perspective
Service channel transformation
►Developing an integrated approach to servicing via multiple channels
►Determining the impact of service failures on customer experience
Contact centre transformation
Banks in the region often use costly incentives to attract customers but then spend little on service to retain them – this is unsustainable
Islamic Banking Competitiveness Report 2011-12
Page 52
COMPETITIVENESS REPORT 2011-201252
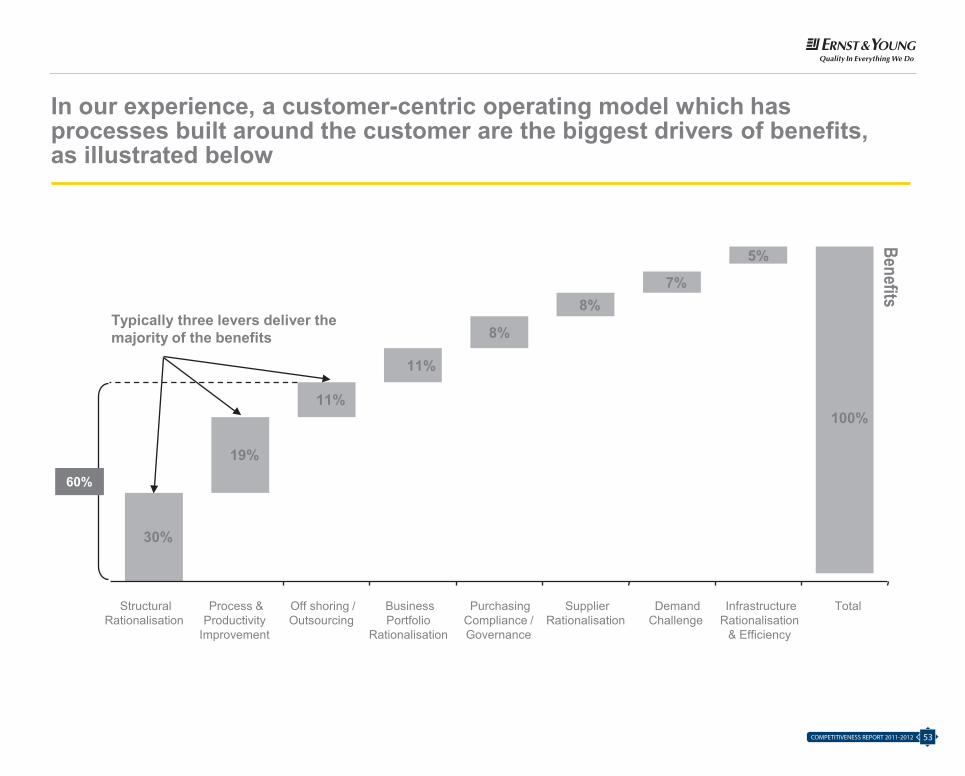
60%
30%
19%
11%
11%
8%
8%7%
5%
100%
Benefits
Typically three levers deliver the majority of the benefits
Structural Rationalisation
Process & Productivity
Improvement
Off shoring / Outsourcing
Business Portfolio
Rationalisation
Purchasing Compliance / Governance
Supplier Rationalisation
Demand Challenge
Infrastructure Rationalisation
& Efficiency
Total
In our experience, a customer-centric operating model which has processes built around the customer are the biggest drivers of benefits, as illustrated below
Islamic Banking Competitiveness Report 2011-12
Page 53
53COMPETITIVENESS REPORT 2011-2012
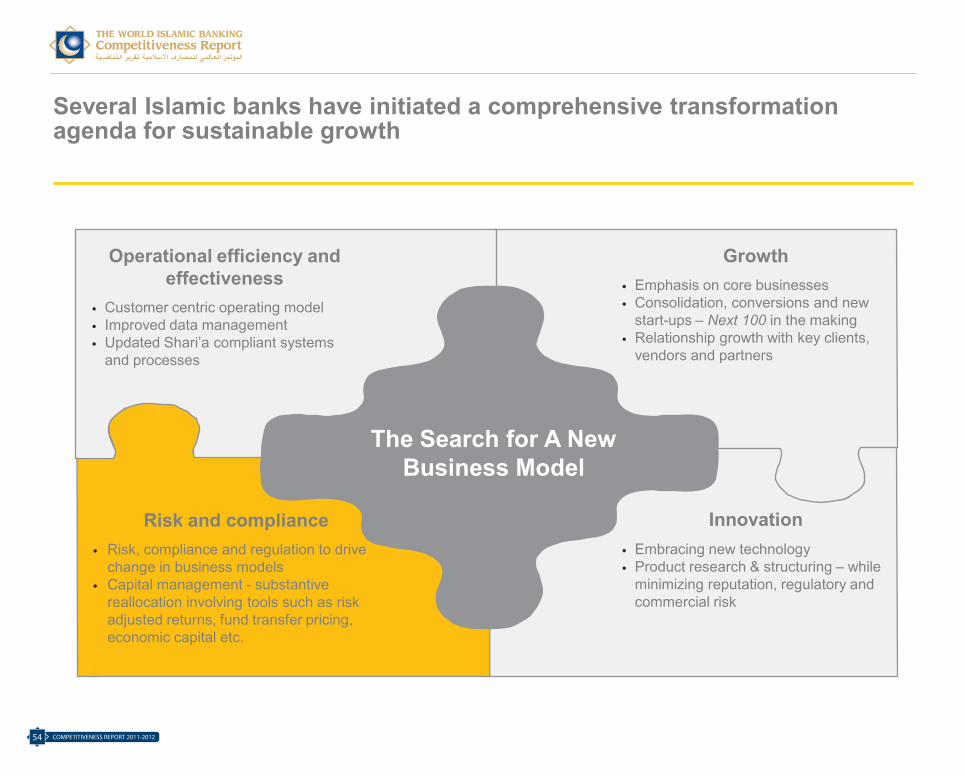
Several Islamic banks have initiated a comprehensive transformation agenda for sustainable growth
Risk and compliance • Risk, compliance and regulation to drive
change in business models• Capital management - substantive
reallocation involving tools such as risk adjusted returns, fund transfer pricing, economic capital etc.
The Search for A New Business Model
Operational efficiency and effectiveness
• Customer centric operating model• Improved data management • Updated Shari’a compliant systems
and processes
Innovation• Embracing new technology• Product research & structuring – while
minimizing reputation, regulatory and commercial risk
Growth• Emphasis on core businesses• Consolidation, conversions and new
start-ups – Next 100 in the making• Relationship growth with key clients,
vendors and partners
Islamic Banking Competitiveness Report 2011-12
Page 54
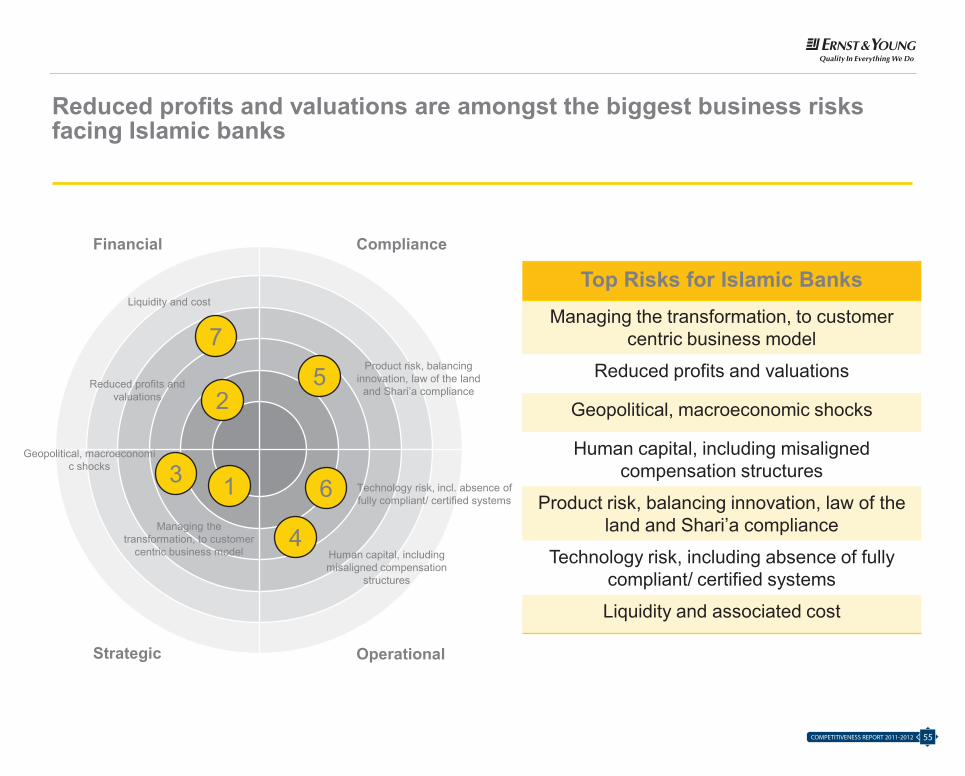
Reduced profits and valuations are amongst the biggest business risks facing Islamic banks
Top Risks for Islamic BanksManaging the transformation, to customer
centric business model
Reduced profits and valuations
Geopolitical, macroeconomic shocks
Human capital, including misaligned compensation structures
Product risk, balancing innovation, law of the land and Shari’a compliance
Technology risk, including absence of fully compliant/ certified systems
Liquidity and associated cost
Financial Compliance
Strategic Operational
5
Technology risk, incl. absence of fully compliant/ certified systems
Liquidity and cost
3
2
1
7
6
4
Product risk, balancing innovation, law of the land
and Shari’a compliance
Human capital, including misaligned compensation
structures
Reduced profits and valuations
Managing the transformation, to customer
centric business model
Geopolitical, macroeconomic shocks
Islamic Banking Competitiveness Report 2011-12
Page 55
COMPETITIVENESS REPORT 2011-201254
Reduced profits and valuations are amongst the biggest business risks facing Islamic banks
Top Risks for Islamic BanksManaging the transformation, to customer
centric business model
Reduced profits and valuations
Geopolitical, macroeconomic shocks
Human capital, including misaligned compensation structures
Product risk, balancing innovation, law of the land and Shari’a compliance
Technology risk, including absence of fully compliant/ certified systems
Liquidity and associated cost
Financial Compliance
Strategic Operational
5
Technology risk, incl. absence of fully compliant/ certified systems
Liquidity and cost
3
2
1
7
6
4
Product risk, balancing innovation, law of the land
and Shari’a compliance
Human capital, including misaligned compensation
structures
Reduced profits and valuations
Managing the transformation, to customer
centric business model
Geopolitical, macroeconomic shocks
Islamic Banking Competitiveness Report 2011-12
Page 55
55COMPETITIVENESS REPORT 2011-2012
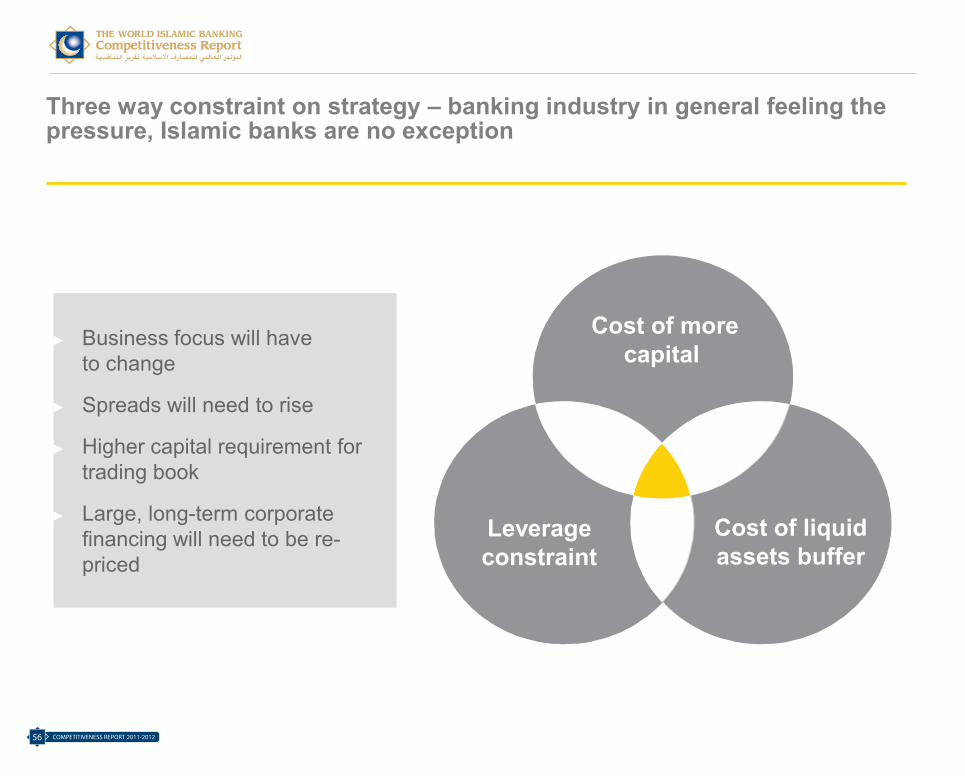
Three way constraint on strategy – banking industry in general feeling the pressure, Islamic banks are no exception
Cost of more capital
Cost of liquid assets buffer
Leverageconstraint
► Business focus will have to change
► Spreads will need to rise
► Higher capital requirement for trading book
► Large, long-term corporate financing will need to be re-priced
Islamic Banking Competitiveness Report 2011-12
Page 56
COMPETITIVENESS REPORT 2011-201256
Three way constraint on strategy – banking industry in general feeling the pressure, Islamic banks are no exception
Cost of more capital
Cost of liquid assets buffer
Leverageconstraint
► Business focus will have to change
► Spreads will need to rise
► Higher capital requirement for trading book
► Large, long-term corporate financing will need to be re-priced
Islamic Banking Competitiveness Report 2011-12
Page 56
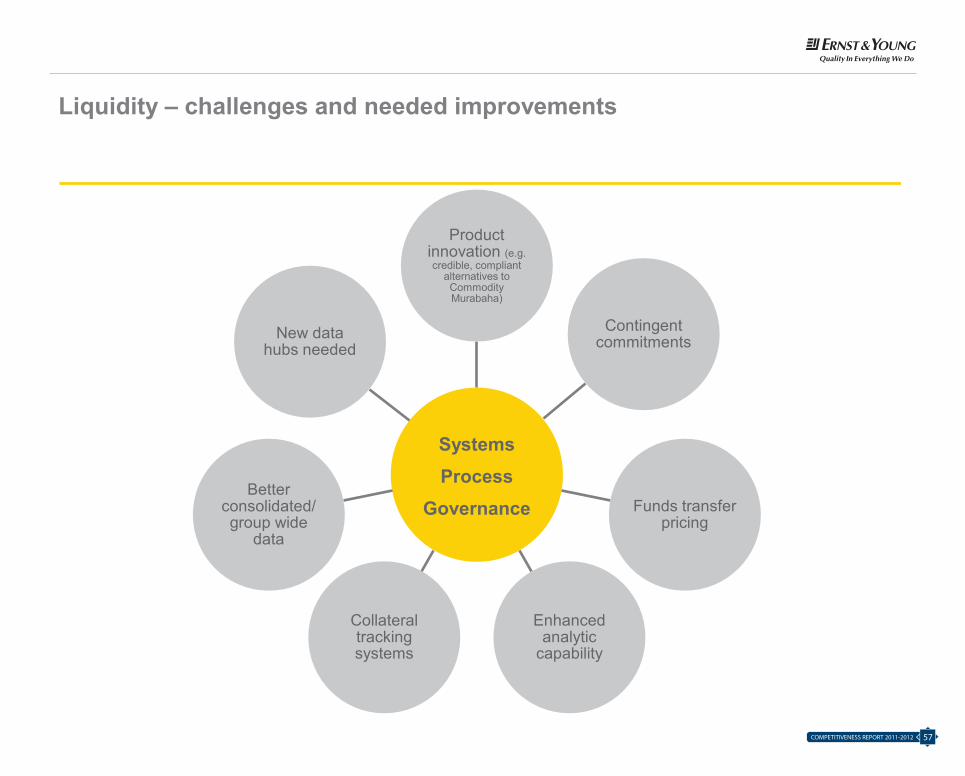
Liquidity – challenges and needed improvements
Systems Process
Governance
Product innovation (e.g. credible, compliant
alternatives to Commodity Murabaha)
Contingent commitments
Funds transfer pricing
Enhanced analytic
capability
Collateral tracking systems
Better consolidated/ group wide
data
New data hubs needed
Islamic Banking Competitiveness Report 2011-12
Page 57
57COMPETITIVENESS REPORT 2011-2012
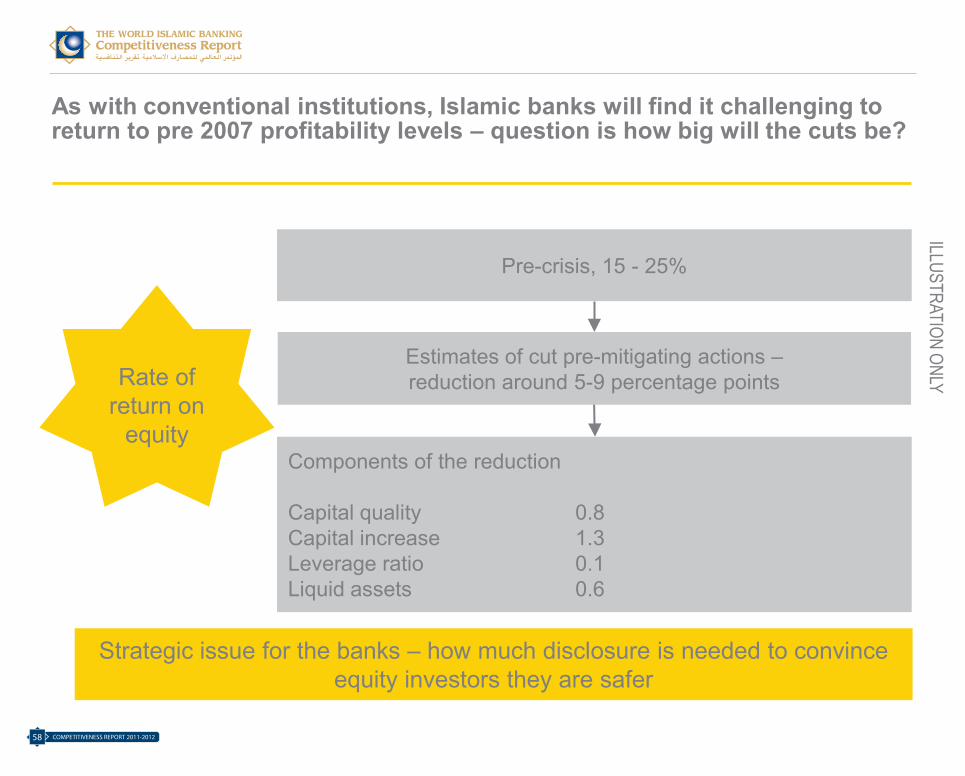
As with conventional institutions, Islamic banks will find it challenging to return to pre 2007 profitability levels – question is how big will the cuts be?
Pre-crisis, 15 - 25%
Estimates of cut pre-mitigating actions –reduction around 5-9 percentage points
Components of the reduction
Capital quality 0.8 Capital increase 1.3Leverage ratio 0.1Liquid assets 0.6
Strategic issue for the banks – how much disclosure is needed to convince equity investors they are safer
Rate of return on
equity
ILLUSTRATION ONLY
Islamic Banking Competitiveness Report 2011-12
Page 58
COMPETITIVENESS REPORT 2011-201258
As with conventional institutions, Islamic banks will find it challenging to return to pre 2007 profitability levels – question is how big will the cuts be?
Pre-crisis, 15 - 25%
Estimates of cut pre-mitigating actions –reduction around 5-9 percentage points
Components of the reduction
Capital quality 0.8 Capital increase 1.3Leverage ratio 0.1Liquid assets 0.6
Strategic issue for the banks – how much disclosure is needed to convince equity investors they are safer
Rate of return on
equity
ILLUSTRATION ONLY
Islamic Banking Competitiveness Report 2011-12
Page 58
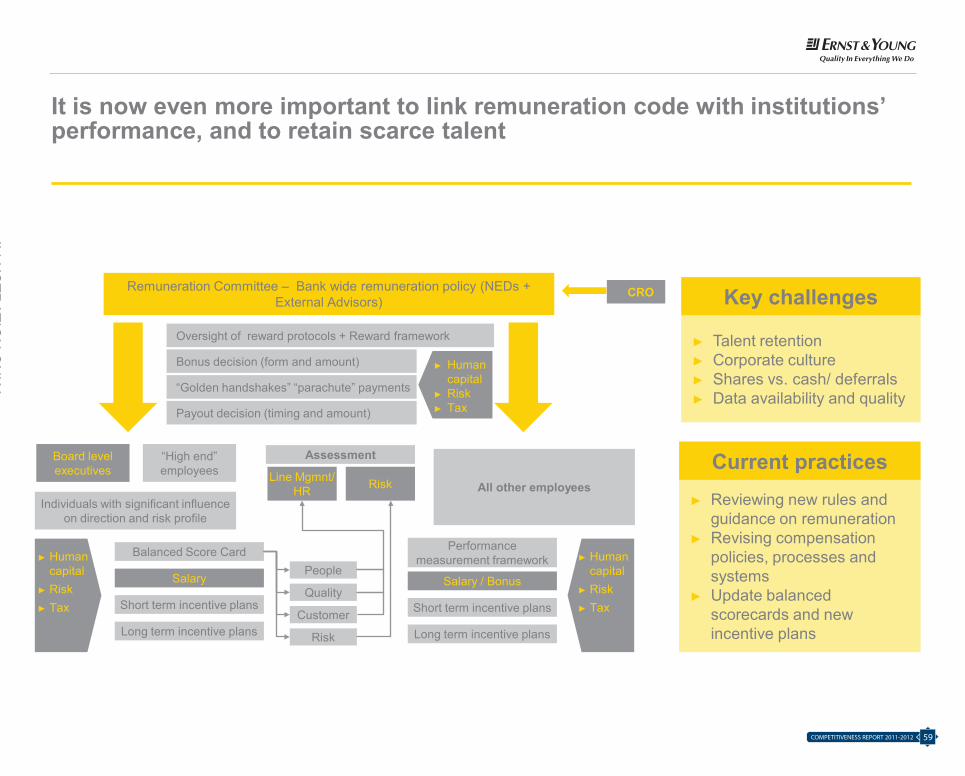
It is now even more important to link remuneration code with institutions’ performance, and to retain scarce talent
Key challenges
► Talent retention► Corporate culture► Shares vs. cash/ deferrals► Data availability and quality
Current practices► Reviewing new rules and
guidance on remuneration► Revising compensation
policies, processes and systems
► Update balanced scorecards and new incentive plans
Remuneration Committee – Bank wide remuneration policy (NEDs + External Advisors)
Oversight of reward protocols + Reward framework
Bonus decision (form and amount)
“Golden handshakes” “parachute” payments
Payout decision (timing and amount)
► Human capital
► Risk► Tax
CRO
Board level executives Line Mgmnt/
HR Risk
“High end” employees
Individuals with significant influence on direction and risk profile
All other employees
Assessment
► Human capital
► Risk► Tax
Balanced Score Card
Salary
Short term incentive plans
Long term incentive plans
► Human capital
► Risk► Tax
People
Quality
Customer
Risk
Performance measurement framework
Salary / Bonus
Short term incentive plans
Long term incentive plans
Islamic Banking Competitiveness Report 2011-12
Page 59
59COMPETITIVENESS REPORT 2011-2012
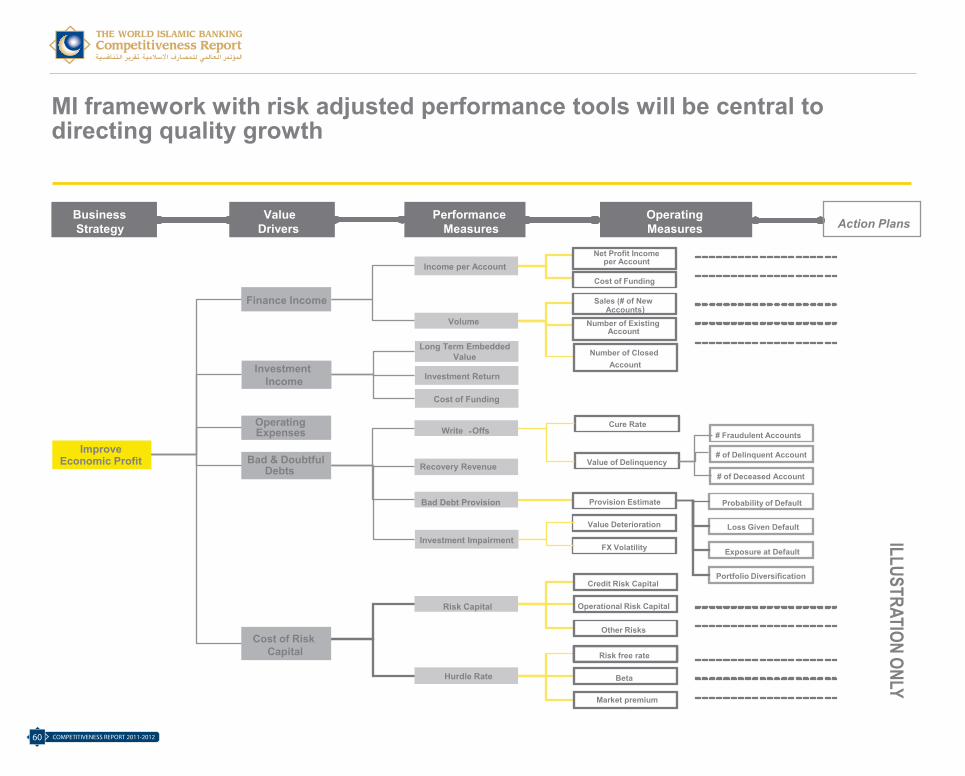
MI framework with risk adjusted performance tools will be central to directing quality growth
ValueDrivers
PerformanceMeasures
OperatingMeasures Action Plans
Business Strategy
ImproveEconomic Profit
Finance Income
Operating
Bad & Doubtful Debts
Cost of Risk Capital
Income per Account
Volume
Write -Offs
Recovery Revenue
Hurdle Rate
Risk Capital
Bad Debt Provision
Credit Risk Capital
Operational Risk Capital
Other Risks
Risk free rate
Beta
Market premium
Sales (# of New Accounts)
Number of Existing Account
Number of Closed Account
Net Profit Incomeper Account
Cost of Funding
Cure Rate
Value of Delinquency
Provision Estimate Probability of Default
Loss Given Default
Exposure at Default
Portfolio Diversification
# Fraudulent Accounts
# of Delinquent Account
# of Deceased Account
Expenses
InvestmentIncome
Long Term Embedded Value
Investment Return
Cost of Funding
Investment Impairment
Value Deterioration
FX Volatility
ILLUSTRATION ONLY
Islamic Banking Competitiveness Report 2011-12
Page 60
COMPETITIVENESS REPORT 2011-201260
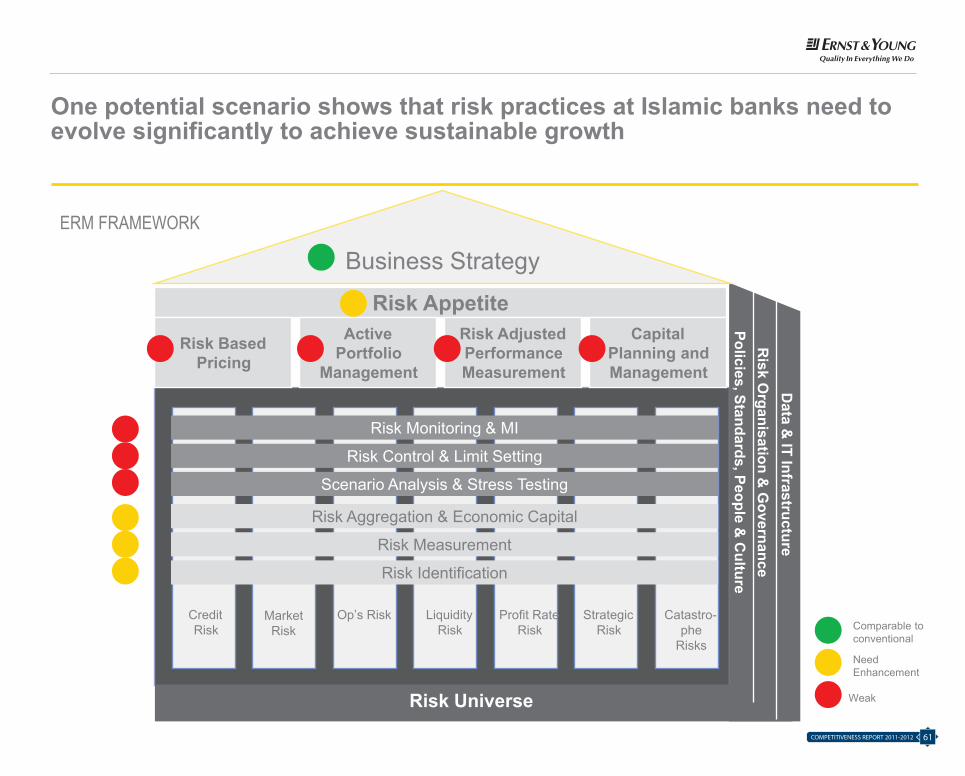
One potential scenario shows that risk practices at Islamic banks need to evolve significantly to achieve sustainable growth
Business Strategy
Policies, Standards, People & C
ultureR
isk Organisation &
Governance
Data &
IT Infrastructure
Risk Appetite
Risk Universe
Liquidity Risk
Op’s Risk StrategicRisk
Credit Risk
MarketRisk
Profit Rate Risk
Catastro-phe
Risks
Risk Based Pricing
Active Portfolio
Management
Capital Planning and Management
Risk Adjusted Performance Measurement
Risk Monitoring & MI
Risk Control & Limit Setting
Scenario Analysis & Stress Testing
Risk Aggregation & Economic Capital
Risk Measurement
Risk Identification
Comparable to conventional
Need Enhancement
Weak
ERM FRAMEWORK
Islamic Banking Competitiveness Report 2011-12
Page 61
61COMPETITIVENESS REPORT 2011-2012

Several Islamic banks have initiated a comprehensive transformation agenda for sustainable growth
Risk and compliance • Risk, compliance and regulation to drive
change in business models• Capital management - substantive
reallocation involving tools such as risk adjusted returns, fund transfer pricing, economic capital etc.
The Search for A New Business Model
Operational efficiency and effectiveness
• Customer centric operating model• Improved data management • Updated Shari’a compliant systems
and processes
Innovation• Embracing new technology• Product research & structuring – while
minimizing reputation, regulatory and commercial risk
Growth• Emphasis on core businesses• Consolidation, conversions and new
start-ups – Next 100 in the making• Relationship growth with key clients,
vendors and partners
Islamic Banking Competitiveness Report 2011-12
Page 62
COMPETITIVENESS REPORT 2011-201262
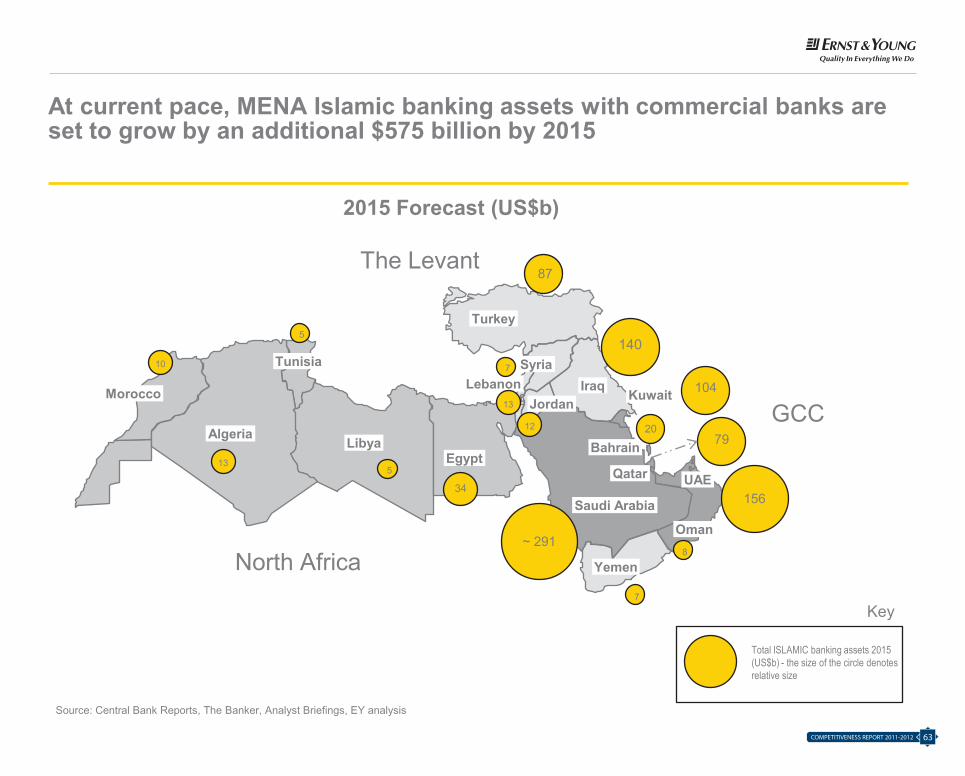
At current pace, MENA Islamic banking assets with commercial banks are set to grow by an additional $575 billion by 2015
2015 Forecast (US$b)
Source: Central Bank Reports, The Banker, Analyst Briefings, EY analysis
Saudi Arabia
Oman
UAEQatar
BahrainAlgeria
LibyaEgypt
Turkey
Tunisia
MoroccoLebanon
JordanIraq
Yemen
Syria
Kuwait
156
~ 291
13
87
140
7920
104
GCC
North Africa
The Levant
7
7
5
34
12
13
10
8
5
Total ISLAMIC banking assets 2015 (US$b) - the size of the circle denotes relative size
Key
Islamic Banking Competitiveness Report 2011-12
Page 63
63COMPETITIVENESS REPORT 2011-2012
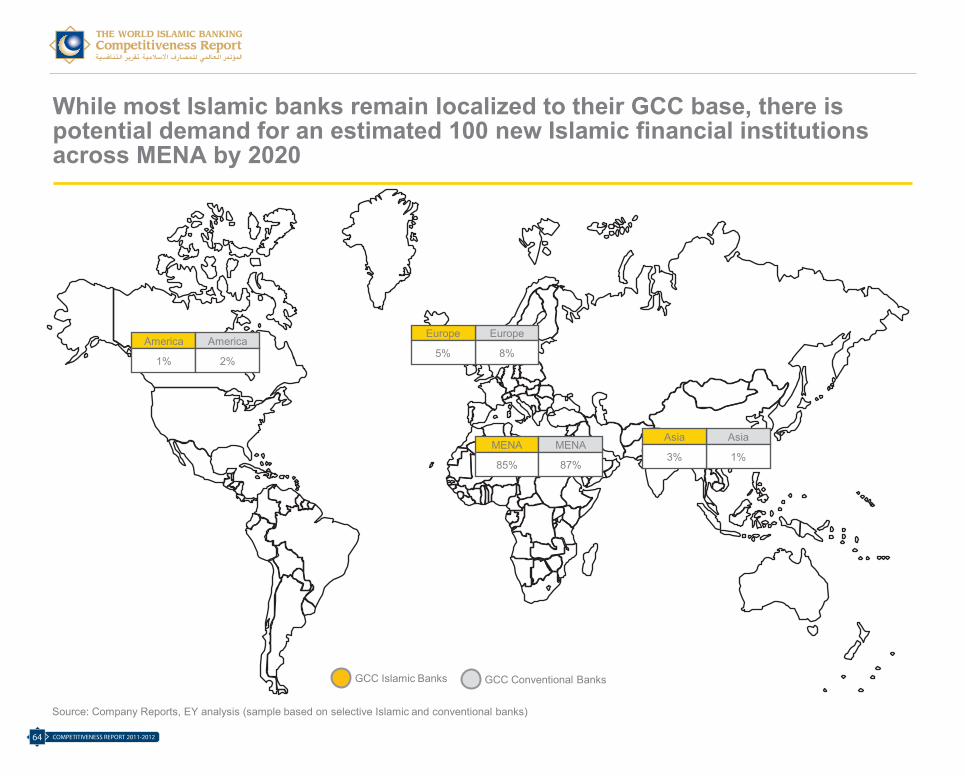
While most Islamic banks remain localized to their GCC base, there is potential demand for an estimated 100 new Islamic financial institutions across MENA by 2020
GCC Islamic Banks GCC Conventional Banks
America
1%
America
2%
Europe
8%
Europe
5%
Asia
1%
Asia
3%MENA
85%
MENA
87%
Source: Company Reports, EY analysis (sample based on selective Islamic and conventional banks)
Islamic Banking Competitiveness Report 2011-12
Page 64
COMPETITIVENESS REPORT 2011-201264
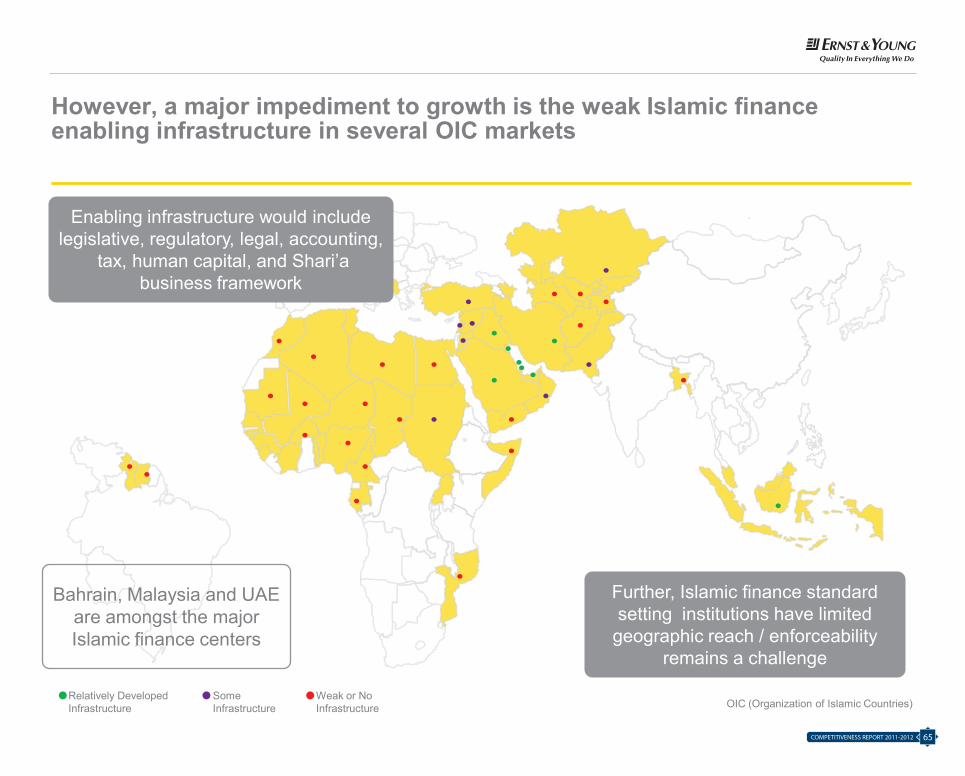
However, a major impediment to growth is the weak Islamic finance enabling infrastructure in several OIC markets
Relatively Developed Infrastructure
Some Infrastructure
Weak or No Infrastructure OIC (Organization of Islamic Countries)
Enabling infrastructure would include legislative, regulatory, legal, accounting,
tax, human capital, and Shari’a business framework
Further, Islamic finance standard setting institutions have limited
geographic reach / enforceability remains a challenge
Bahrain, Malaysia and UAEare amongst the major Islamic finance centers
Islamic Banking Competitiveness Report 2011-12
Page 65
65COMPETITIVENESS REPORT 2011-2012
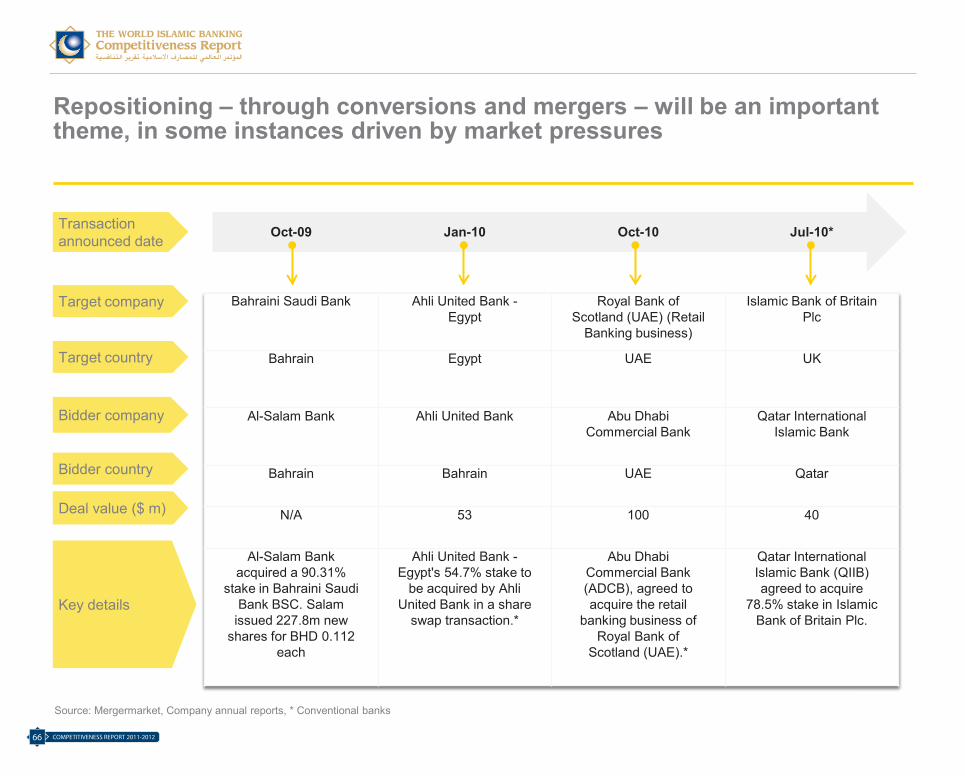
Repositioning – through conversions and mergers – will be an important theme, in some instances driven by market pressures
Bahraini Saudi Bank Ahli United Bank -Egypt
Royal Bank of Scotland (UAE) (Retail
Banking business)
Islamic Bank of Britain Plc
Bahrain Egypt UAE UK
Al-Salam Bank Ahli United Bank Abu Dhabi Commercial Bank
Qatar International Islamic Bank
Bahrain Bahrain UAE Qatar
N/A 53 100 40
Al-Salam Bank acquired a 90.31%
stake in Bahraini Saudi Bank BSC. Salam
issued 227.8m new shares for BHD 0.112
each
Ahli United Bank -Egypt's 54.7% stake to
be acquired by Ahli United Bank in a share
swap transaction.*
Abu Dhabi Commercial Bank (ADCB), agreed to acquire the retail
banking business of Royal Bank of
Scotland (UAE).*
Qatar International Islamic Bank (QIIB) agreed to acquire
78.5% stake in Islamic Bank of Britain Plc.
Oct-09 Jan-10 Oct-10 Jul-10*Transaction announced date
Target company
Target country
Bidder company
Bidder country
Deal value ($ m)
Key details
Source: Mergermarket, Company annual reports, * Conventional banks
Islamic Banking Competitiveness Report 2011-12
Page 66
COMPETITIVENESS REPORT 2011-201266

In GCC, the pricing multiples of Islamic banks have converged over recent months – now broadly in line with conventional banks
Average P/E of Banks in GCC – Sep 2011 Average P/BV of Banks in GCC – Sep 2011
N/A
15.2
8.5
13.0
N/A
N/A
20.7
11.1
6.8
11.5
16.3
10.1
12.212.8
0
4
8
12
16
20
24
(tim
es)
Islamic Conventional
Avg. Islamic Avg. conventional
N/A
3.4
0.8
1.8
N/A
N/A
2.1
1.4
0.9
1.9
1.4 1.6
2.0
1.6
0
1
2
3
4
(tim
es)
Islamic Conventional
Avg. Islamic Avg. conventional
Banks include all listed retail banks excluding those having P/E of less than 0 or greater than 30; UAE banks include Dubai & Abu Dhabi based banks only; N/A – No bank with P/E within specified range in the respective country; Source: Bloomberg, OneSource & EY perspective
Islamic Banking Competitiveness Report 2011-12
Page 67
67COMPETITIVENESS REPORT 2011-2012
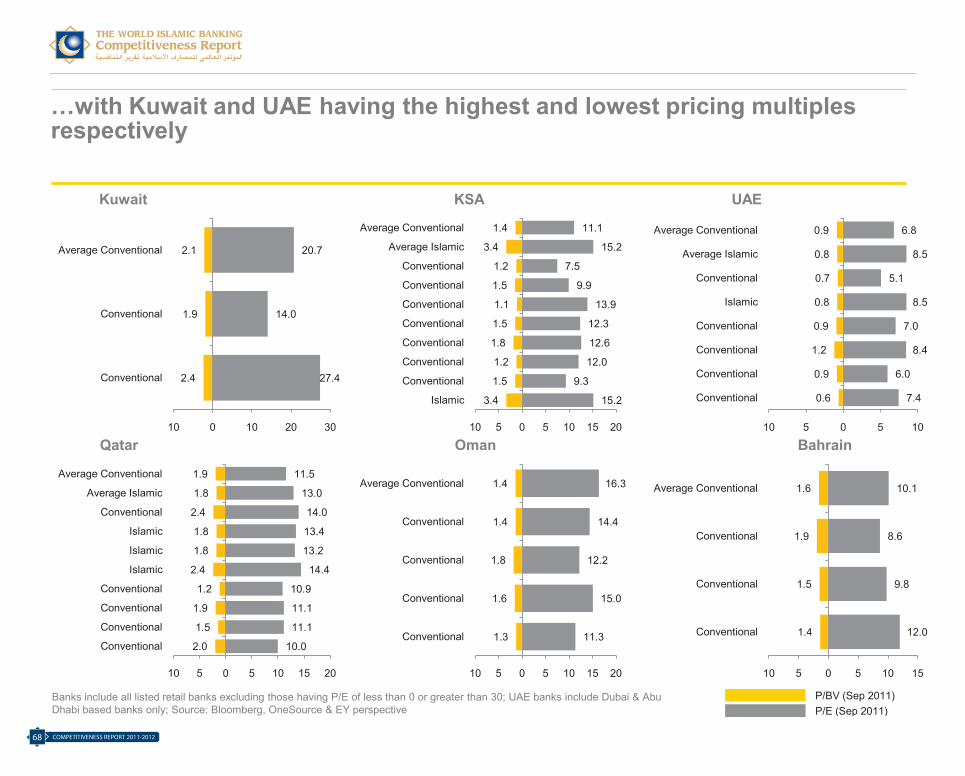
…with Kuwait and UAE having the highest and lowest pricing multiples respectively
Kuwait KSA UAE
Qatar Oman Bahrain
P/BV (Sep 2011)P/E (Sep 2011)
Banks include all listed retail banks excluding those having P/E of less than 0 or greater than 30; UAE banks include Dubai & Abu Dhabi based banks only; Source: Bloomberg, OneSource & EY perspective
Islamic Banking Competitiveness Report 2011-12
Page 68
27.4
14.0
20.7
2.4
1.9
2.1
10 0 10 20 30
Conventional
Conventional
Average Conventional
15.2
9.3
12.0
12.6
12.3
13.9
9.9
7.5
15.2
11.1
3.4
1.5
1.2
1.8
1.5
1.1
1.5
1.2
3.4
1.4
10 5 0 5 10 15 20
Islamic
Conventional
Conventional
Conventional
Conventional
Conventional
Conventional
Conventional
Average Islamic
Average Conventional
7.4
6.0
8.4
7.0
8.5
5.1
8.5
6.8
0.6
0.9
1.2
0.9
0.8
0.7
0.8
0.9
10 5 0 5 10
Conventional
Conventional
Conventional
Conventional
Islamic
Conventional
Average Islamic
Average Conventional
11.3
15.0
12.2
14.4
16.3
1.3
1.6
1.8
1.4
1.4
10 5 0 5 10 15 20
Conventional
Conventional
Conventional
Conventional
Average Conventional
12.0
9.8
8.6
10.1
1.4
1.5
1.9
1.6
10 5 0 5 10 15
Conventional
Conventional
Conventional
Average Conventional
10.0
11.1
11.1
10.9
14.4
13.2
13.4
14.0
13.0
11.5
2.0
1.5
1.9
1.2
2.4
1.8
1.8
2.4
1.8
1.9
10 5 0 5 10 15 20
Conventional
Conventional
Conventional
Conventional
Islamic
Islamic
Islamic
Conventional
Average Islamic
Average Conventional
COMPETITIVENESS REPORT 2011-201268
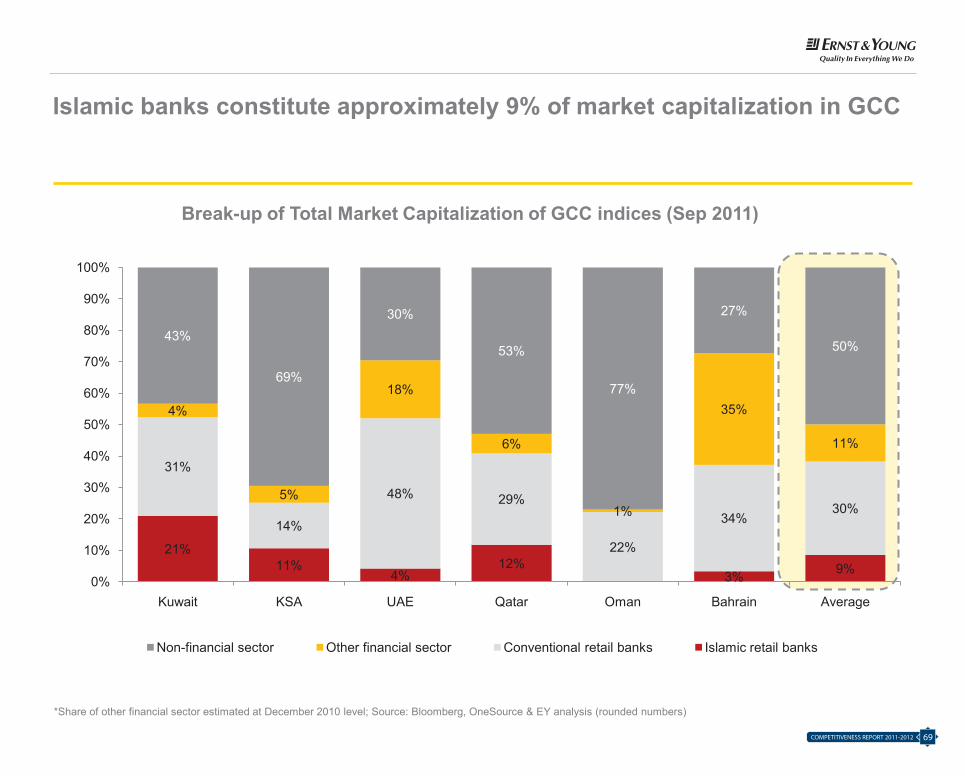
…with Kuwait and UAE having the highest and lowest pricing multiples respectively
Kuwait KSA UAE
Qatar Oman Bahrain
P/BV (Sep 2011)P/E (Sep 2011)
Banks include all listed retail banks excluding those having P/E of less than 0 or greater than 30; UAE banks include Dubai & Abu Dhabi based banks only; Source: Bloomberg, OneSource & EY perspective
Islamic Banking Competitiveness Report 2011-12
Page 68
27.4
14.0
20.7
2.4
1.9
2.1
10 0 10 20 30
Conventional
Conventional
Average Conventional
15.2
9.3
12.0
12.6
12.3
13.9
9.9
7.5
15.2
11.1
3.4
1.5
1.2
1.8
1.5
1.1
1.5
1.2
3.4
1.4
10 5 0 5 10 15 20
Islamic
Conventional
Conventional
Conventional
Conventional
Conventional
Conventional
Conventional
Average Islamic
Average Conventional
7.4
6.0
8.4
7.0
8.5
5.1
8.5
6.8
0.6
0.9
1.2
0.9
0.8
0.7
0.8
0.9
10 5 0 5 10
Conventional
Conventional
Conventional
Conventional
Islamic
Conventional
Average Islamic
Average Conventional
11.3
15.0
12.2
14.4
16.3
1.3
1.6
1.8
1.4
1.4
10 5 0 5 10 15 20
Conventional
Conventional
Conventional
Conventional
Average Conventional
12.0
9.8
8.6
10.1
1.4
1.5
1.9
1.6
10 5 0 5 10 15
Conventional
Conventional
Conventional
Average Conventional
10.0
11.1
11.1
10.9
14.4
13.2
13.4
14.0
13.0
11.5
2.0
1.5
1.9
1.2
2.4
1.8
1.8
2.4
1.8
1.9
10 5 0 5 10 15 20
Conventional
Conventional
Conventional
Conventional
Islamic
Islamic
Islamic
Conventional
Average Islamic
Average Conventional
Islamic banks constitute approximately 9% of market capitalization in GCC
*Share of other financial sector estimated at December 2010 level; Source: Bloomberg, OneSource & EY analysis (rounded numbers)
Break-up of Total Market Capitalization of GCC indices (Sep 2011)
21%11%
4%12%
3% 9%
31%
14%
48% 29%
22%
34%30%
4%
5%
18%
6%
1%
35%
11%
43%
69%
30%
53%
77%
27%
50%
0%
10%
20%
30%
40%
50%
60%
70%
80%
90%
100%
Kuwait KSA UAE Qatar Oman Bahrain Average
Non-financial sector Other financial sector Conventional retail banks Islamic retail banks
Islamic Banking Competitiveness Report 2011-12
Page 69
69COMPETITIVENESS REPORT 2011-2012
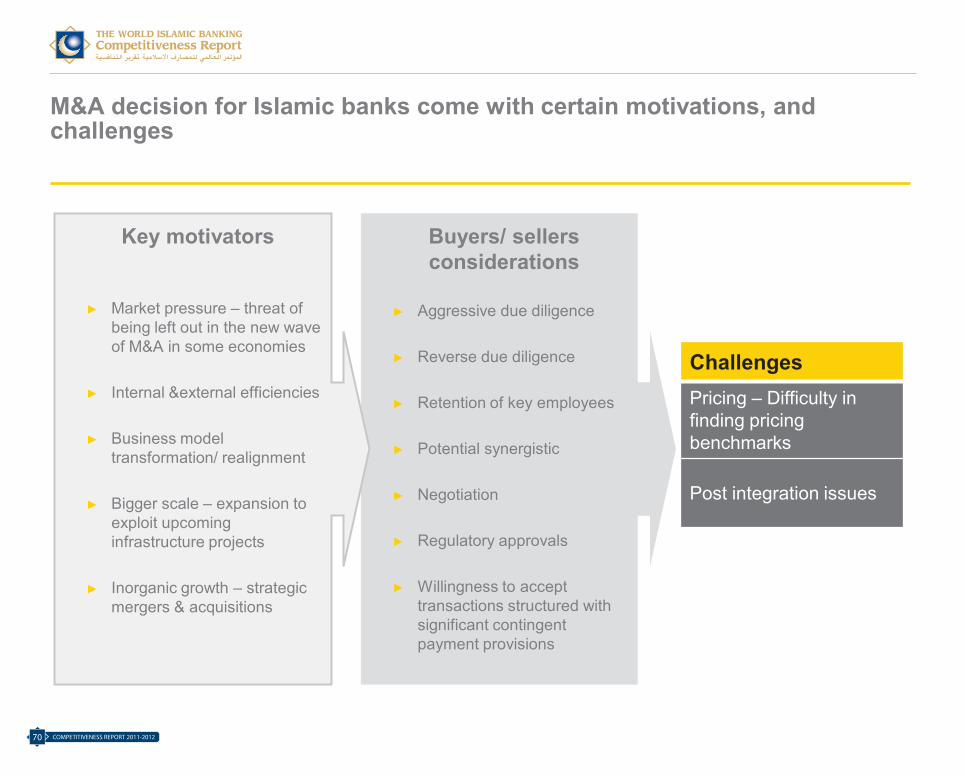
M&A decision for Islamic banks come with certain motivations, and challenges
Buyers/ sellers considerations
► Aggressive due diligence
► Reverse due diligence
► Retention of key employees
► Potential synergistic
► Negotiation
► Regulatory approvals
► Willingness to accept transactions structured with significant contingent payment provisions
Key motivators
► Market pressure – threat of being left out in the new wave of M&A in some economies
► Internal &external efficiencies
► Business model transformation/ realignment
► Bigger scale – expansion to exploit upcoming infrastructure projects
► Inorganic growth – strategic mergers & acquisitions
ChallengesPricing – Difficulty in finding pricing benchmarks
Post integration issues
Islamic Banking Competitiveness Report 2011-12
Page 70
COMPETITIVENESS REPORT 2011-201270
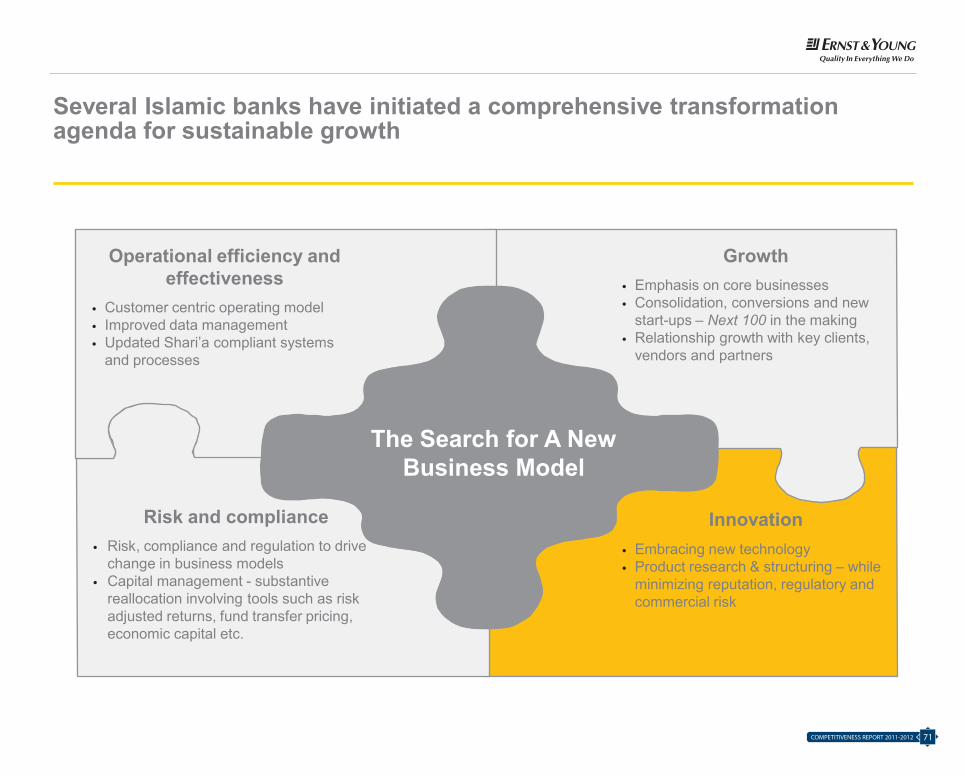
Several Islamic banks have initiated a comprehensive transformation agenda for sustainable growth
Risk and compliance • Risk, compliance and regulation to drive
change in business models• Capital management - substantive
reallocation involving tools such as risk adjusted returns, fund transfer pricing, economic capital etc.
The Search for A New Business Model
Operational efficiency and effectiveness
• Customer centric operating model• Improved data management • Updated Shari’a compliant systems
and processes
Innovation• Embracing new technology• Product research & structuring – while
minimizing reputation, regulatory and commercial risk
Growth• Emphasis on core businesses• Consolidation, conversions and new
start-ups – Next 100 in the making• Relationship growth with key clients,
vendors and partners
Islamic Banking Competitiveness Report 2011-12
Page 71
71COMPETITIVENESS REPORT 2011-2012
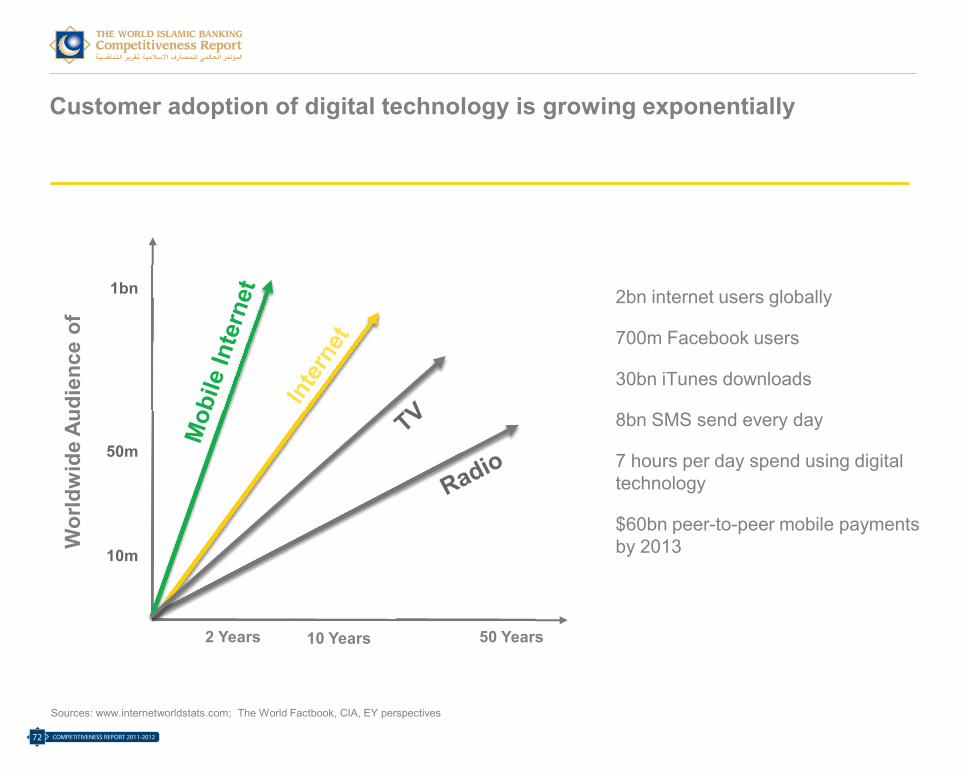
Customer adoption of digital technology is growing exponentially
1bn
10m
50m
10 Years2 Years 50 Years
Wor
ldw
ide
Audi
ence
of
2bn internet users globally
700m Facebook users
30bn iTunes downloads
8bn SMS send every day
7 hours per day spend using digital technology
$60bn peer-to-peer mobile payments by 2013
Islamic Banking Competitiveness Report 2011-12
Page 72
Sources: www.internetworldstats.com; The World Factbook, CIA, EY perspectives
COMPETITIVENESS REPORT 2011-201272
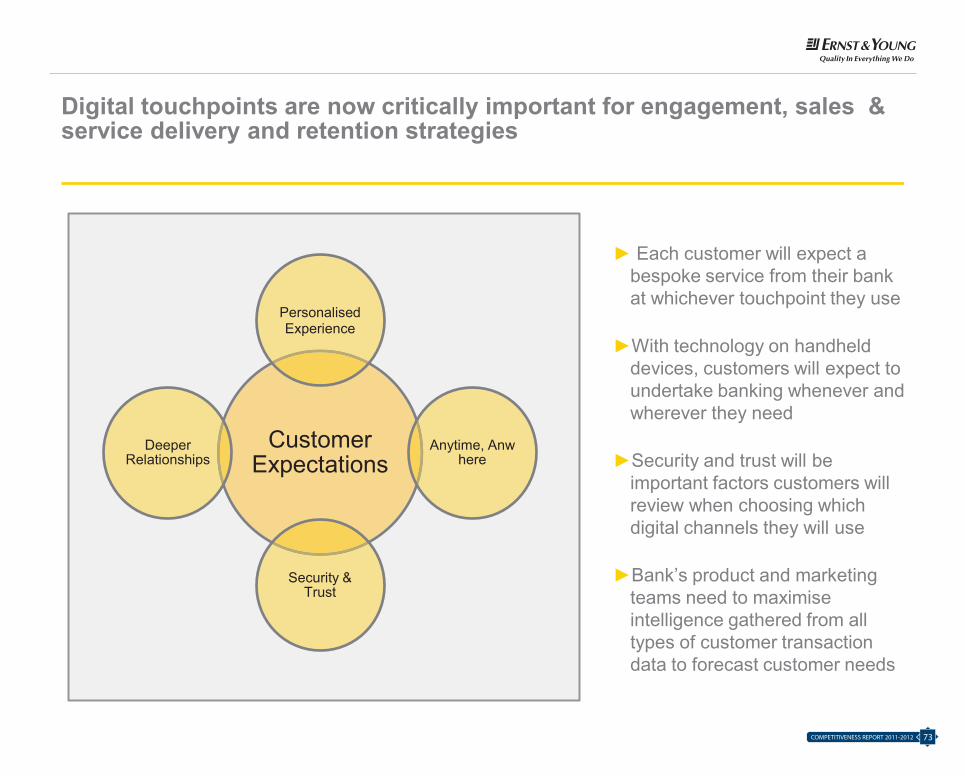
Customer adoption of digital technology is growing exponentially
1bn
10m
50m
10 Years2 Years 50 Years
Wor
ldw
ide
Audi
ence
of
2bn internet users globally
700m Facebook users
30bn iTunes downloads
8bn SMS send every day
7 hours per day spend using digital technology
$60bn peer-to-peer mobile payments by 2013
Islamic Banking Competitiveness Report 2011-12
Page 72
Sources: www.internetworldstats.com; The World Factbook, CIA, EY perspectives
Digital touchpoints are now critically important for engagement, sales & service delivery and retention strategies
Customer Expectations
PersonalisedExperience
Anytime, Anwhere
Security & Trust
Deeper Relationships
► Each customer will expect a bespoke service from their bank at whichever touchpoint they use
►With technology on handheld devices, customers will expect to undertake banking whenever and wherever they need
►Security and trust will be important factors customers will review when choosing which digital channels they will use
►Bank’s product and marketing teams need to maximiseintelligence gathered from all types of customer transaction data to forecast customer needs
Islamic Banking Competitiveness Report 2011-12
Page 73
73COMPETITIVENESS REPORT 2011-2012
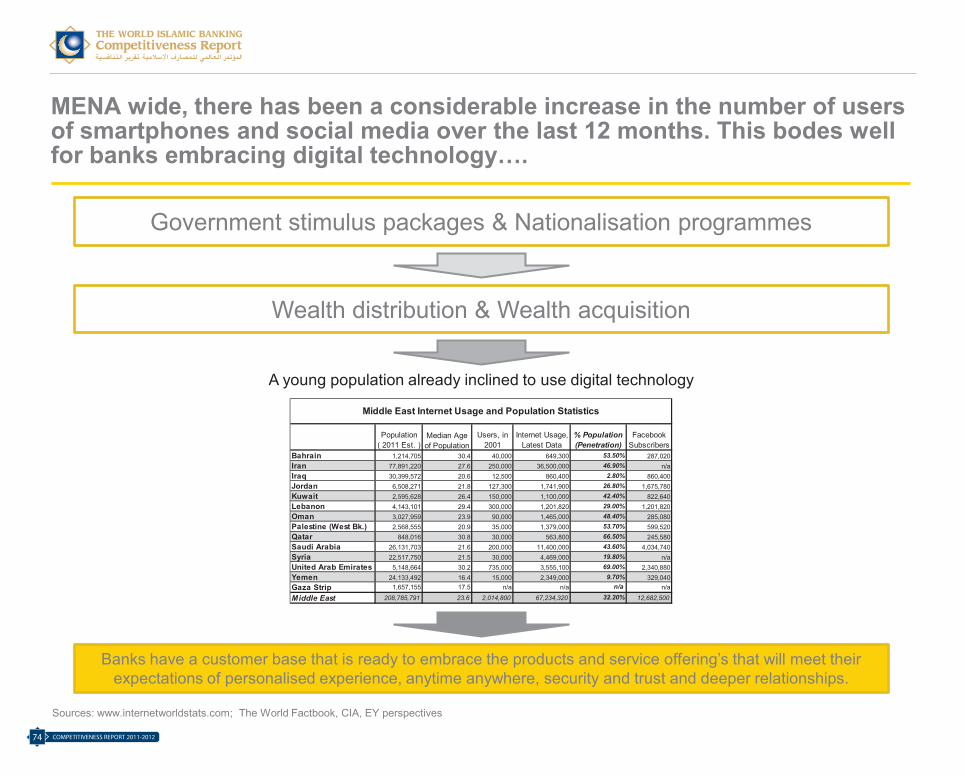
MENA wide, there has been a considerable increase in the number of users of smartphones and social media over the last 12 months. This bodes well for banks embracing digital technology….
Islamic Banking Competitiveness Report 2011-12
Page 74
Sources: www.internetworldstats.com; The World Factbook, CIA, EY perspectives
Population Users, in Internet Usage, % Population Facebook( 2011 Est. ) 2001 Latest Data (Penetration) Subscribers
Bahrain 1,214,705 30.4 40,000 649,300 53.50% 287,020Iran 77,891,220 27.6 250,000 36,500,000 46.90% n/aIraq 30,399,572 20.6 12,500 860,400 2.80% 860,400Jordan 6,508,271 21.8 127,300 1,741,900 26.80% 1,675,780Kuwait 2,595,628 26.4 150,000 1,100,000 42.40% 822,640Lebanon 4,143,101 29.4 300,000 1,201,820 29.00% 1,201,820Oman 3,027,959 23.9 90,000 1,465,000 48.40% 285,080Palestine (West Bk.) 2,568,555 20.9 35,000 1,379,000 53.70% 599,520Qatar 848,016 30.8 30,000 563,800 66.50% 245,580Saudi Arabia 26,131,703 21.6 200,000 11,400,000 43.60% 4,034,740Syria 22,517,750 21.5 30,000 4,469,000 19.80% n/aUnited Arab Emirates 5,148,664 30.2 735,000 3,555,100 69.00% 2,340,880Yemen 24,133,492 16.4 15,000 2,349,000 9.70% 329,040Gaza Strip 1,657,155 17.5 n/a n/a n/a n/a
Middle East 208,785,791 23.6 2,014,800 67,234,320 32.20% 12,682,500
Middle East Internet Usage and Population Statistics
Median Age of Population
Government stimulus packages & Nationalisation programmes
Wealth distribution & Wealth acquisition
A young population already inclined to use digital technology
Banks have a customer base that is ready to embrace the products and service offering’s that will meet their expectations of personalised experience, anytime anywhere, security and trust and deeper relationships.
COMPETITIVENESS REPORT 2011-201274
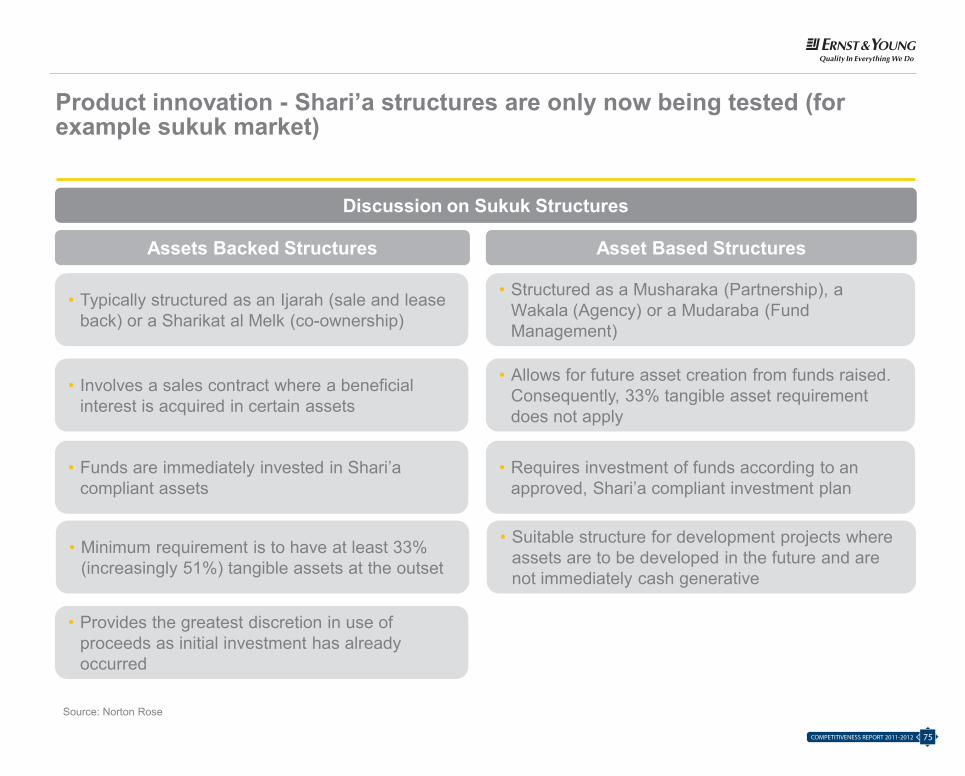
MENA wide, there has been a considerable increase in the number of users of smartphones and social media over the last 12 months. This bodes well for banks embracing digital technology….
Islamic Banking Competitiveness Report 2011-12
Page 74
Sources: www.internetworldstats.com; The World Factbook, CIA, EY perspectives
Population Users, in Internet Usage, % Population Facebook( 2011 Est. ) 2001 Latest Data (Penetration) Subscribers
Bahrain 1,214,705 30.4 40,000 649,300 53.50% 287,020Iran 77,891,220 27.6 250,000 36,500,000 46.90% n/aIraq 30,399,572 20.6 12,500 860,400 2.80% 860,400Jordan 6,508,271 21.8 127,300 1,741,900 26.80% 1,675,780Kuwait 2,595,628 26.4 150,000 1,100,000 42.40% 822,640Lebanon 4,143,101 29.4 300,000 1,201,820 29.00% 1,201,820Oman 3,027,959 23.9 90,000 1,465,000 48.40% 285,080Palestine (West Bk.) 2,568,555 20.9 35,000 1,379,000 53.70% 599,520Qatar 848,016 30.8 30,000 563,800 66.50% 245,580Saudi Arabia 26,131,703 21.6 200,000 11,400,000 43.60% 4,034,740Syria 22,517,750 21.5 30,000 4,469,000 19.80% n/aUnited Arab Emirates 5,148,664 30.2 735,000 3,555,100 69.00% 2,340,880Yemen 24,133,492 16.4 15,000 2,349,000 9.70% 329,040Gaza Strip 1,657,155 17.5 n/a n/a n/a n/a
Middle East 208,785,791 23.6 2,014,800 67,234,320 32.20% 12,682,500
Middle East Internet Usage and Population Statistics
Median Age of Population
Government stimulus packages & Nationalisation programmes
Wealth distribution & Wealth acquisition
A young population already inclined to use digital technology
Banks have a customer base that is ready to embrace the products and service offering’s that will meet their expectations of personalised experience, anytime anywhere, security and trust and deeper relationships.
Product innovation - Shari’a structures are only now being tested (for example sukuk market)
Asset Based Structures
• Structured as a Musharaka (Partnership), a Wakala (Agency) or a Mudaraba (Fund Management)
• Allows for future asset creation from funds raised. Consequently, 33% tangible asset requirement does not apply
• Requires investment of funds according to an approved, Shari’a compliant investment plan
• Suitable structure for development projects where assets are to be developed in the future and are not immediately cash generative
Assets Backed Structures
• Typically structured as an Ijarah (sale and lease back) or a Sharikat al Melk (co-ownership)
• Involves a sales contract where a beneficial interest is acquired in certain assets
• Funds are immediately invested in Shari’a compliant assets
• Minimum requirement is to have at least 33% (increasingly 51%) tangible assets at the outset
Discussion on Sukuk Structures
• Provides the greatest discretion in use of proceeds as initial investment has already occurred
Source: Norton Rose
Islamic Banking Competitiveness Report 2011-12
Page 75
75COMPETITIVENESS REPORT 2011-2012
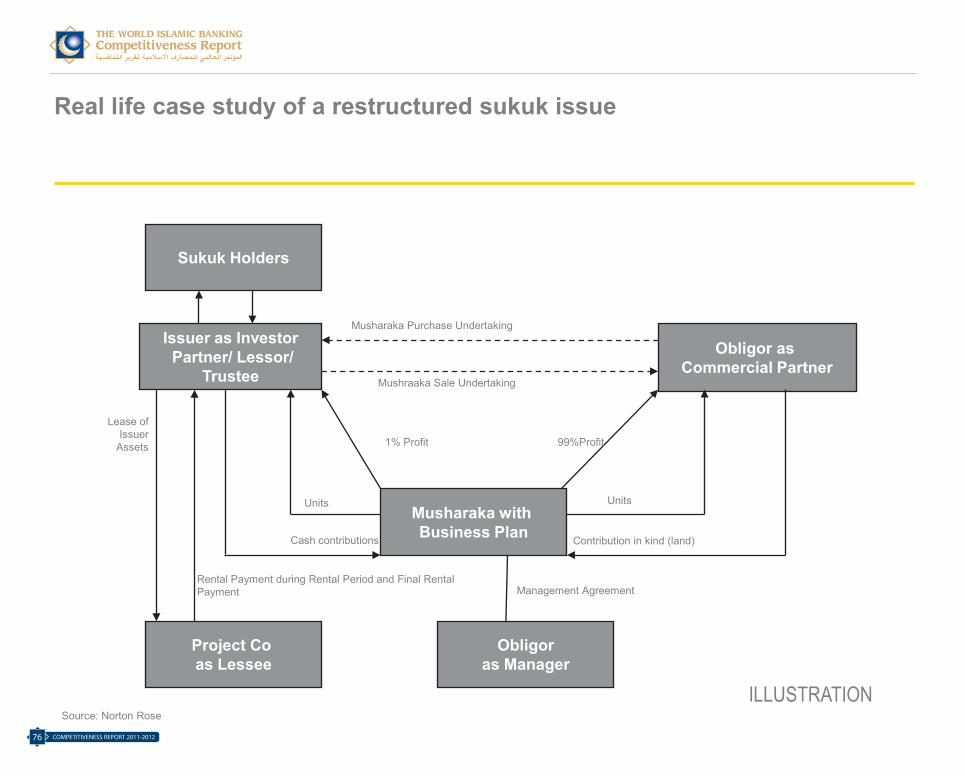
Real life case study of a restructured sukuk issue
Sukuk Holders
Issuer as InvestorPartner/ Lessor/
Trustee
Obligor as Commercial Partner
Musharaka with Business Plan
Project Co as Lessee
Obligoras Manager
Musharaka Purchase Undertaking
Mushraaka Sale Undertaking
Contribution in kind (land)
Units
99%Profit1% Profit
Management AgreementRental Payment during Rental Period and Final Rental Payment
Cash contributions
Units
Lease of Issuer
Assets
Source: Norton RoseILLUSTRATION
Islamic Banking Competitiveness Report 2011-12
Page 76
COMPETITIVENESS REPORT 2011-201276
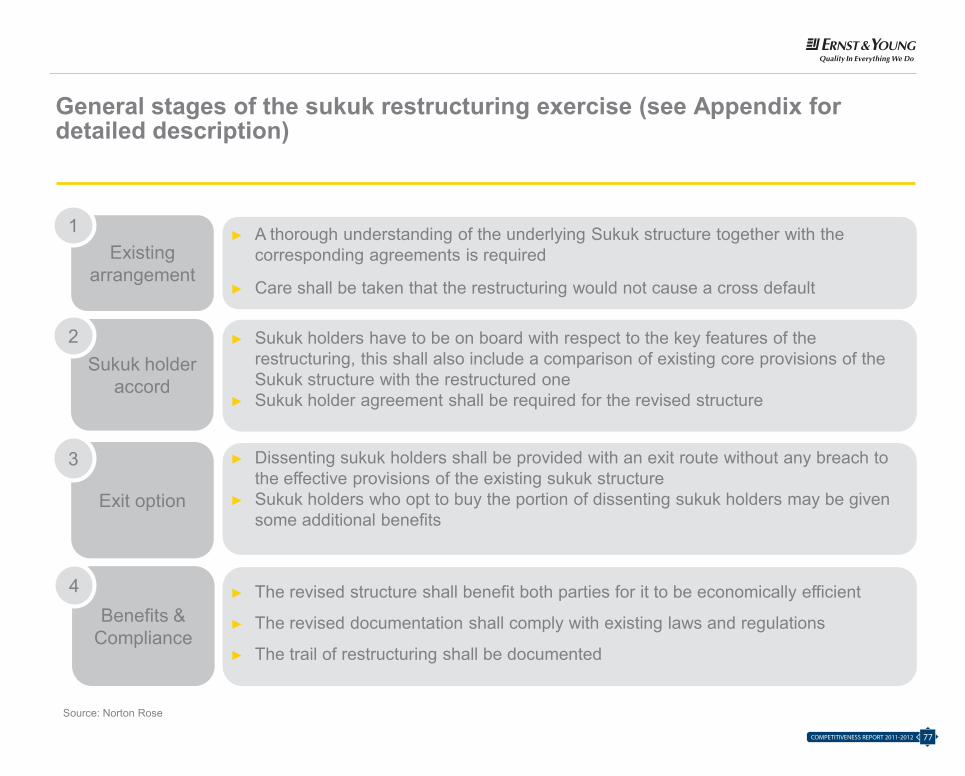
General stages of the sukuk restructuring exercise (see Appendix for detailed description)
► A thorough understanding of the underlying Sukuk structure together with the corresponding agreements is required
► Care shall be taken that the restructuring would not cause a cross default
Existing arrangement
1
► Sukuk holders have to be on board with respect to the key features of the restructuring, this shall also include a comparison of existing core provisions of the Sukuk structure with the restructured one
► Sukuk holder agreement shall be required for the revised structure
Sukuk holder accord
2
► Dissenting sukuk holders shall be provided with an exit route without any breach to the effective provisions of the existing sukuk structure
► Sukuk holders who opt to buy the portion of dissenting sukuk holders may be given some additional benefits
Exit option
3
► The revised structure shall benefit both parties for it to be economically efficient
► The revised documentation shall comply with existing laws and regulations
► The trail of restructuring shall be documented
Benefits & Compliance
4
Source: Norton Rose
Islamic Banking Competitiveness Report 2011-12
Page 77
77COMPETITIVENESS REPORT 2011-2012
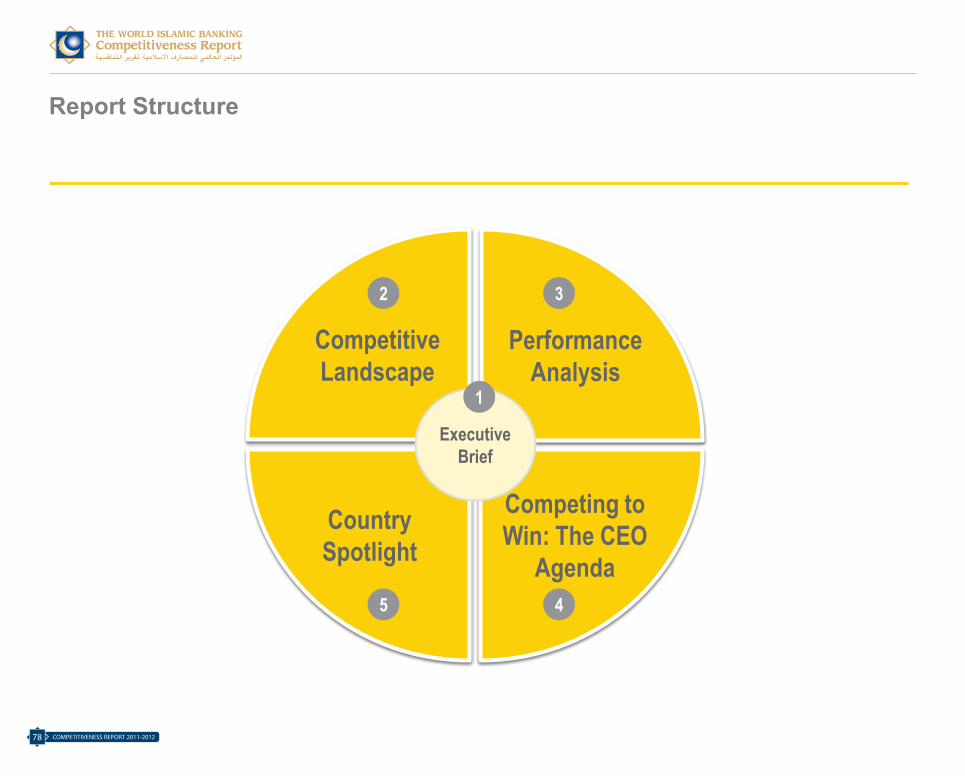
Report Structure
Performance Analysis
Competitive Landscape
Competing to Win: The CEO
Agenda
Country Spotlight
Executive Brief
1
2 3
5 4
Islamic Banking Competitiveness Report 2011-12
Page 78
COMPETITIVENESS REPORT 2011-201278
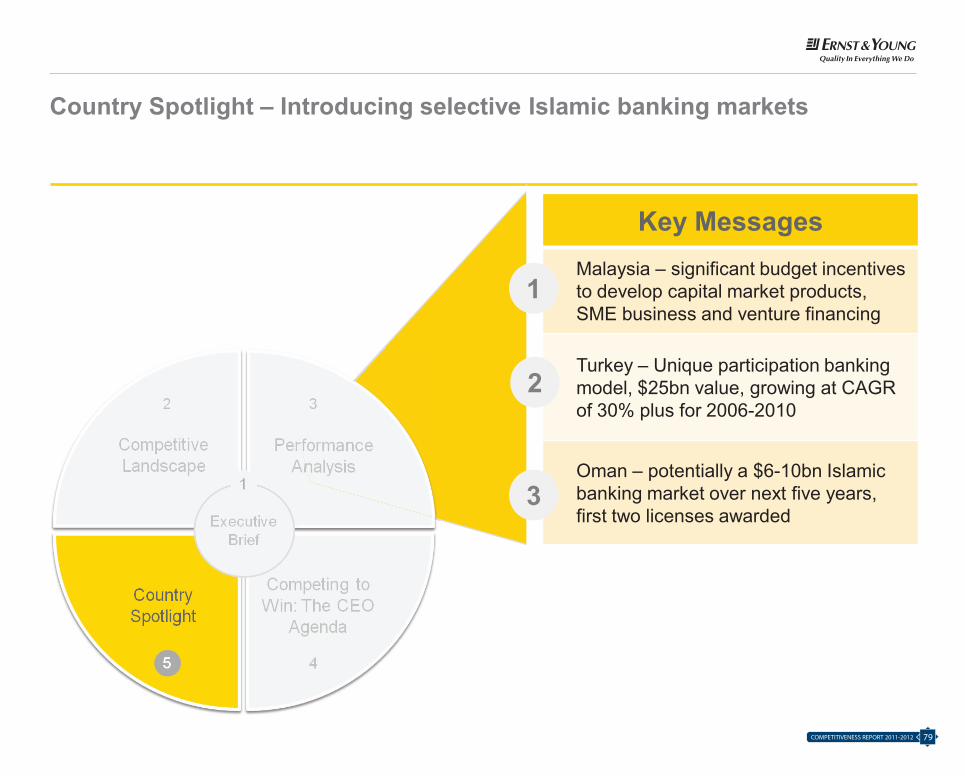
Key MessagesMalaysia – significant budget incentives to develop capital market products, SME business and venture financing
Turkey – Unique participation banking model, $25bn value, growing at CAGR of 30% plus for 2006-2010
Oman – potentially a $6-10bn Islamic banking market over next five years, first two licenses awarded
1
2
3
Country Spotlight – Introducing selective Islamic banking markets
Islamic Banking Competitiveness Report 2011-12
Page 79
79COMPETITIVENESS REPORT 2011-2012

Country focus - Salient features
Malaysia Turkey Oman
Banking Parameters► Total banking assets 2010: US$505bn
CAGR (06-10): 9.1%► Islamic banking market share 2010: 17.3%► Total banking deposits 2010: US$ 360bn
and CAGR [06-10]– 9.5%► Banking asset penetration 2010: 220%► Deposit penetration 2010 : 156%
Banking Parameters► Total banking assets 2010: US$ 652bn
CAGR (06-10): 25%► Islamic banking market share 2010: 4.3%► Total banking deposits for 2010: US$
399bn and CAGR [06-10] – 25%► Banking asset penetration 2010: 85%► Deposit penetration 2010: 52%
Banking Parameters► Total banking assets 2010: US$41bn
CAGR (08-10): 6.6%► Islamic banking market share 2010: 0%► Total banking deposits 2010: US$27bn
CAGR (06-10): 22%► Banking asset penetration 2010: 70%► Deposit penetration 2010: 47%
Islamic finance commentary► Regulators recognise the profit and loss
sharing concept of Islamic banks► There are currently 17 Islamic banks and
four international Islamic banks► Conventional banks are encouraged by
the Central Bank to establish Islamic windows
► Various incentives (legal & tax) are provided by the government (e.g. up to 100% foreign equity ownership for Islamic banks
Islamic finance commentary► Turkey has a total of 49 banks, and 4 of
them are Participation Banks► Currently a law is in place which
recognises the participation features of Islamic banks
► Total number of branches of Participation Banks has increased by 8% in 2010 to reach 607
Islamic finance commentary► Royal Decree to introduce Islamic banking► Central Bank of Oman expected to allow
full Islamic banks and Islamic windows, new regulatory regime for Islamic banking business expected
► Two licenses awarded for full Islamic banks; most conventional banks expected to compete for Shari’a banking business through window operation
Islamic Banking Competitiveness Report 2011-12
Page 80
COMPETITIVENESS REPORT 2011-201280
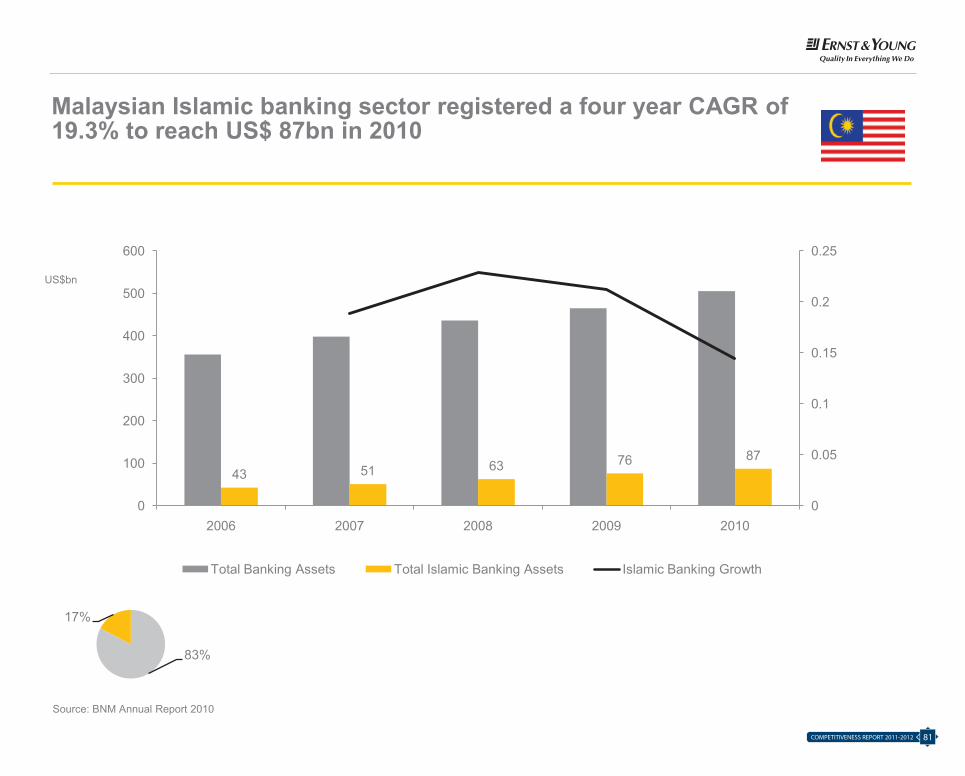
Malaysian Islamic banking sector registered a four year CAGR of 19.3% to reach US$ 87bn in 2010
43 51 63 76 87
0
0.05
0.1
0.15
0.2
0.25
0
100
200
300
400
500
600
2006 2007 2008 2009 2010
Total Banking Assets Total Islamic Banking Assets Islamic Banking Growth
83%
17%
US$bn
Source: BNM Annual Report 2010
Islamic Banking Competitiveness Report 2011-12
Page 81
81COMPETITIVENESS REPORT 2011-2012
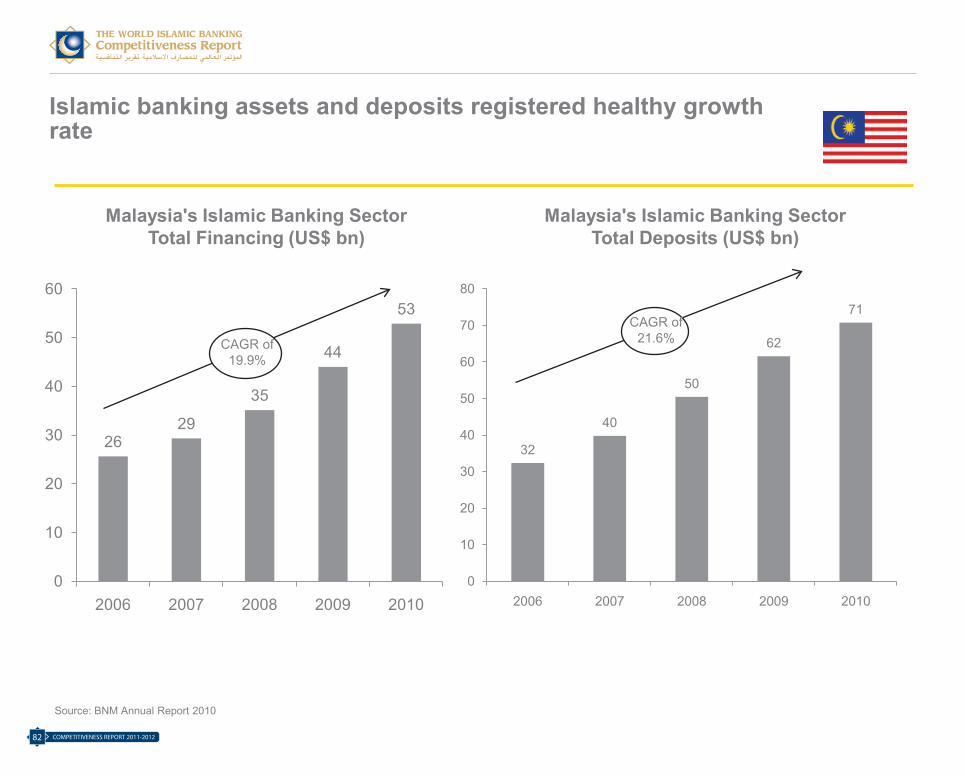
Islamic banking assets and deposits registered healthy growth rate
2629
35
44
53
0
10
20
30
40
50
60
2006 2007 2008 2009 2010
CAGR of 19.9%
Malaysia's Islamic Banking Sector Total Financing (US$ bn)
32
40
50
62
71
0
10
20
30
40
50
60
70
80
2006 2007 2008 2009 2010
CAGR of 21.6%
Malaysia's Islamic Banking Sector Total Deposits (US$ bn)
Source: BNM Annual Report 2010
Islamic Banking Competitiveness Report 2011-12
Page 82
COMPETITIVENESS REPORT 2011-201282
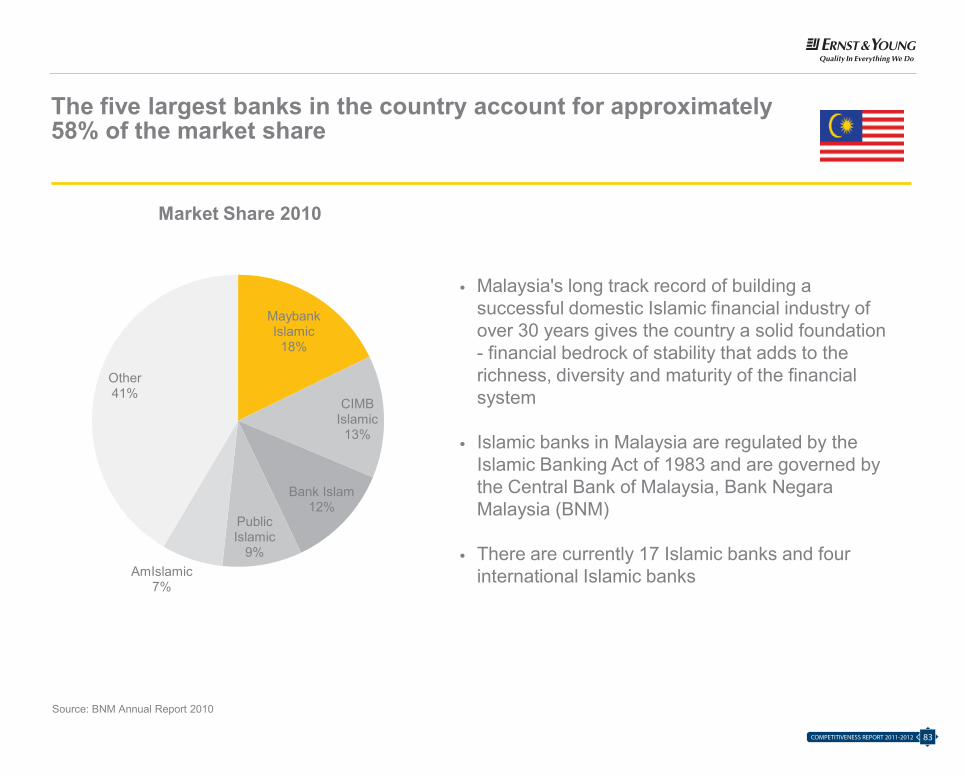
The five largest banks in the country account for approximately 58% of the market share
Market Share 2010
Maybank Islamic
18%
CIMB Islamic
13%
Bank Islam12%
Public Islamic
9%AmIslamic
7%
Other41%
• Malaysia's long track record of building a successful domestic Islamic financial industry of over 30 years gives the country a solid foundation - financial bedrock of stability that adds to the richness, diversity and maturity of the financial system
• Islamic banks in Malaysia are regulated by the Islamic Banking Act of 1983 and are governed by the Central Bank of Malaysia, Bank Negara Malaysia (BNM)
• There are currently 17 Islamic banks and four international Islamic banks
Source: BNM Annual Report 2010
Islamic Banking Competitiveness Report 2011-12
Page 83
83COMPETITIVENESS REPORT 2011-2012
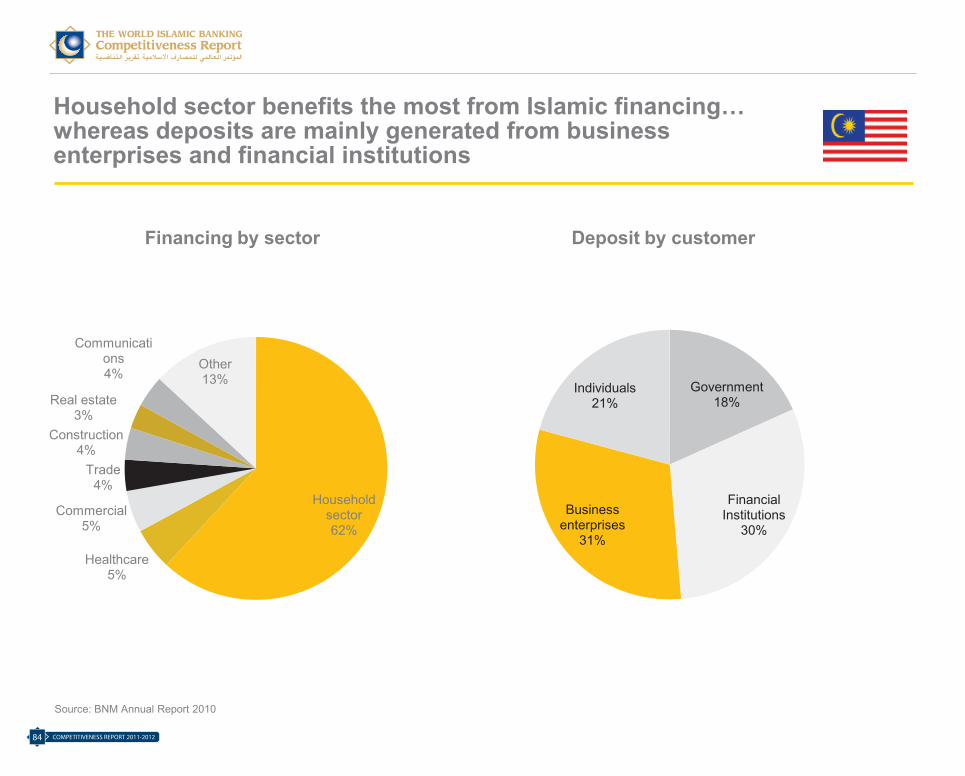
Household sector benefits the most from Islamic financing… whereas deposits are mainly generated from business enterprises and financial institutions
Financing by sector Deposit by customer
Source: BNM Annual Report 2010
Household sector62%
Healthcare5%
Commercial5%
Trade4%
Construction4%
Real estate3%
Communications4%
Other13% Government
18%
Financial Institutions
30%Business
enterprises31%
Individuals21%
Islamic Banking Competitiveness Report 2011-12
Page 84
COMPETITIVENESS REPORT 2011-201284
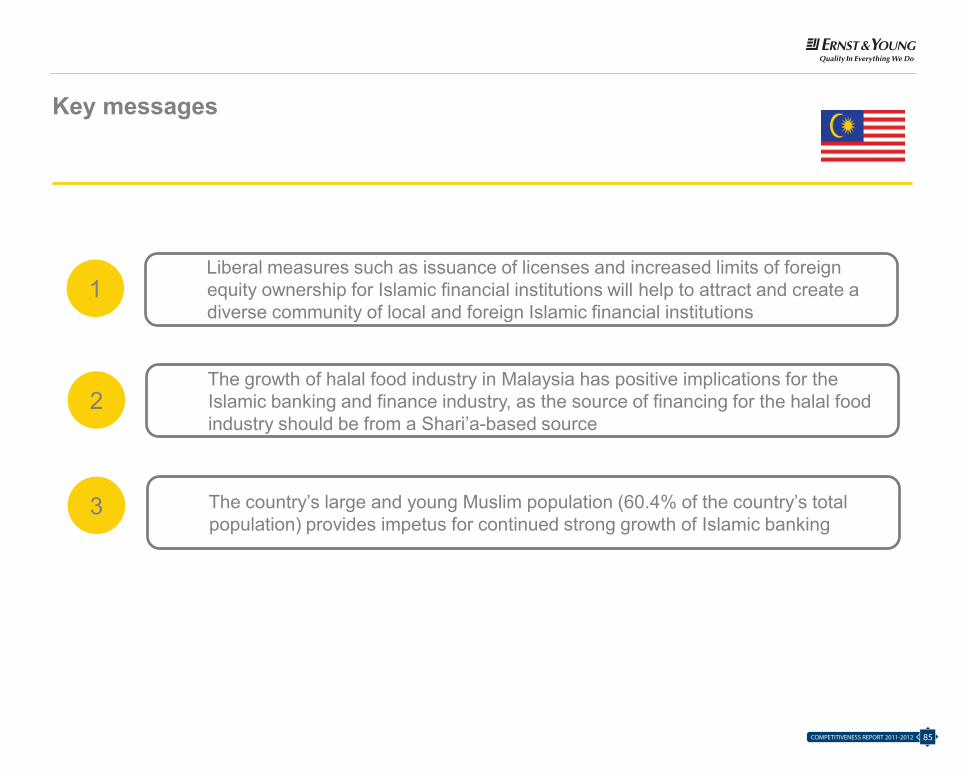
Key messages
Liberal measures such as issuance of licenses and increased limits of foreign equity ownership for Islamic financial institutions will help to attract and create a diverse community of local and foreign Islamic financial institutions
1
The growth of halal food industry in Malaysia has positive implications for the Islamic banking and finance industry, as the source of financing for the halal food industry should be from a Shari’a-based source
2
The country’s large and young Muslim population (60.4% of the country’s total population) provides impetus for continued strong growth of Islamic banking
3
Islamic Banking Competitiveness Report 2011-12
Page 85
85COMPETITIVENESS REPORT 2011-2012
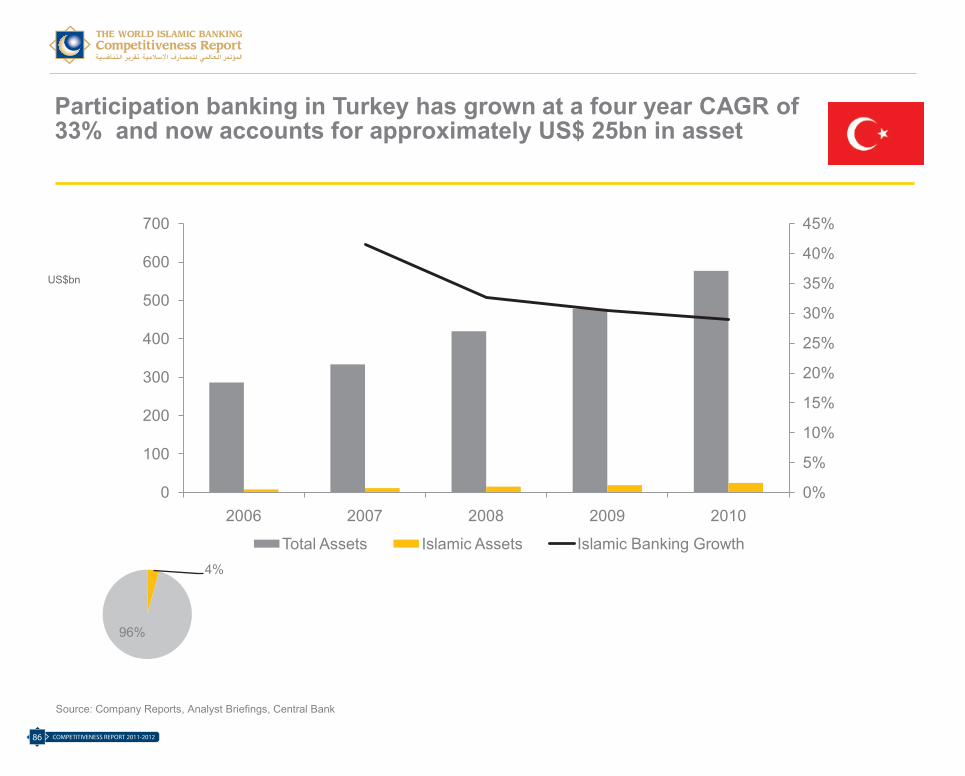
Participation banking in Turkey has grown at a four year CAGR of 33% and now accounts for approximately US$ 25bn in asset
US$bn
Source: Company Reports, Analyst Briefings, Central Bank
0%
5%
10%
15%
20%
25%
30%
35%
40%
45%
0
100
200
300
400
500
600
700
2006 2007 2008 2009 2010
Total Assets Islamic Assets Islamic Banking Growth4%
96%
Islamic Banking Competitiveness Report 2011-12
Page 86
COMPETITIVENESS REPORT 2011-201286
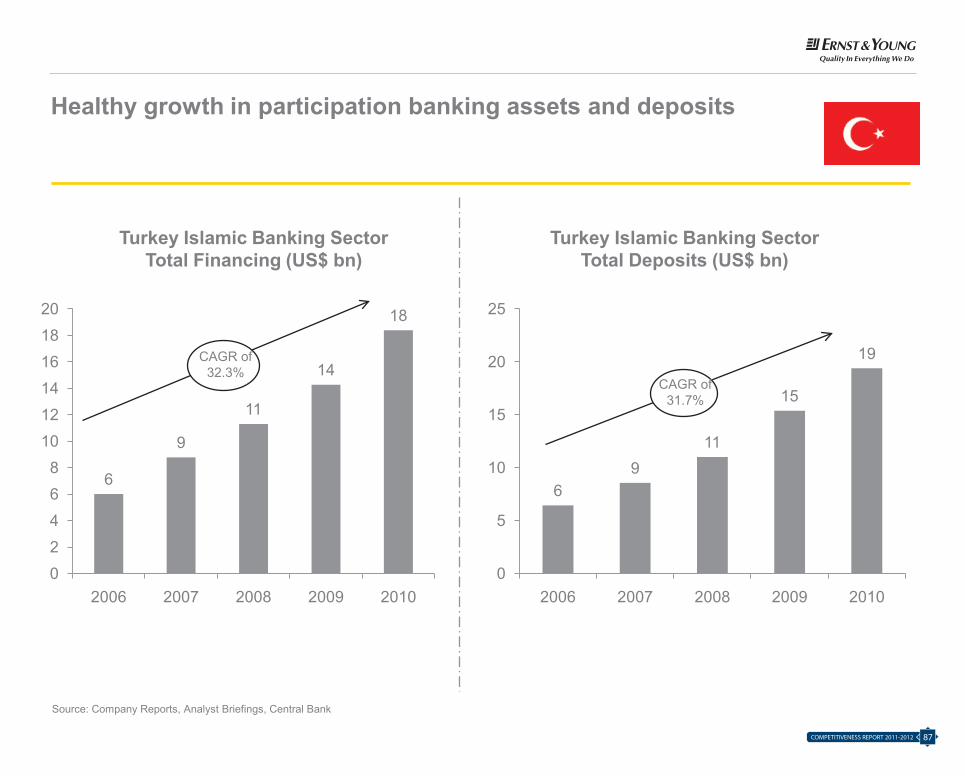
Healthy growth in participation banking assets and deposits
CAGR of 32.3%
Turkey Islamic Banking Sector Total Financing (US$ bn)
CAGR of 31.7%
Turkey Islamic Banking Sector Total Deposits (US$ bn)
69
11
15
19
0
5
10
15
20
25
2006 2007 2008 2009 2010
6
9
11
14
18
02468
101214161820
2006 2007 2008 2009 2010
Source: Company Reports, Analyst Briefings, Central Bank
Islamic Banking Competitiveness Report 2011-12
Page 87
87COMPETITIVENESS REPORT 2011-2012

Participation branches increased by approximately 8% in 2007 alone
0
100
200
300
400
500
600
700
0
2,000
4,000
6,000
8,000
10,000
12,000
14,000
2005 2006 2007 2008 2009 2010
BranchesEmployees
Employees Branches
0%
1%
2%
3%
4%
5%
6%
7%
2005 2006 2007 2008 2009 2010
Total Assets Funds Collected Funds Invested
Employees and Branches Market Share
Source: Company Reports, Analyst Briefings, Central Bank
Islamic Banking Competitiveness Report 2011-12
Page 88
COMPETITIVENESS REPORT 2011-201288
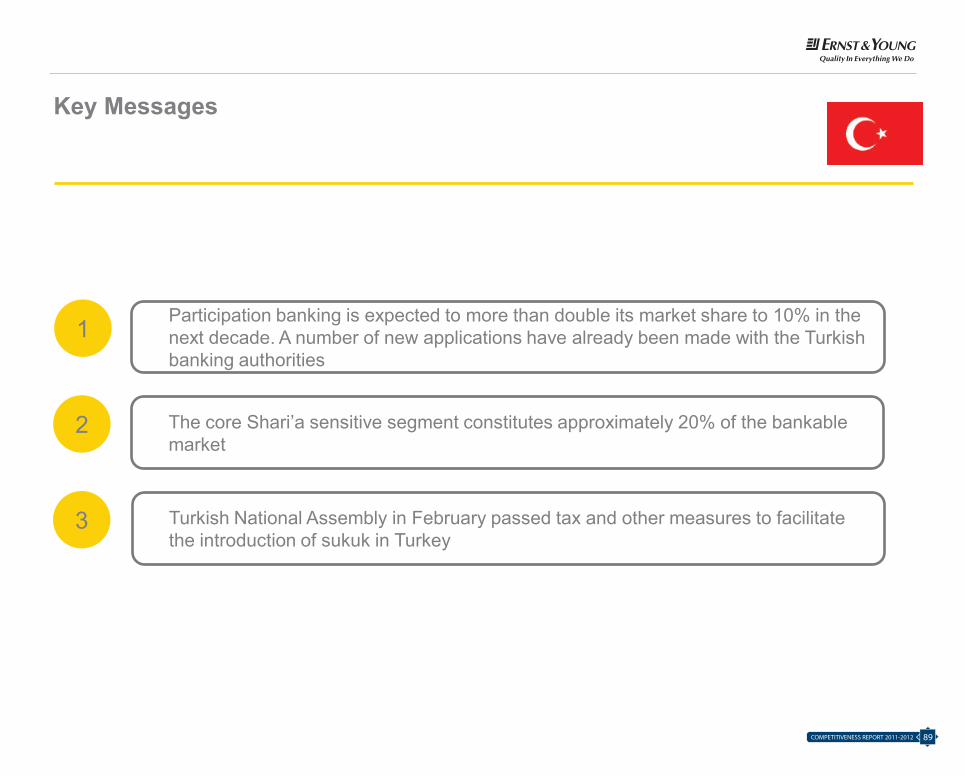
Key Messages
1 Participation banking is expected to more than double its market share to 10% in the next decade. A number of new applications have already been made with the Turkish banking authorities
2 The core Shari’a sensitive segment constitutes approximately 20% of the bankable market
3 Turkish National Assembly in February passed tax and other measures to facilitate the introduction of sukuk in Turkey
Islamic Banking Competitiveness Report 2011-12
Page 89
89COMPETITIVENESS REPORT 2011-2012

With the exception of 2009, Oman’s banking sector has seen steady growth in total assets, deposits, credit and net profits between 2005 and 2010
Omani Banks – Key Indicators (2004-2010)
0
50
100
150
200
250
300
0
2,000
4,000
6,000
8,000
10,000
12,000
14,000
16,000
18,000
2004 2005 2006 2007 2008 2009 2010
Total assets Total deposits Total credit Net Profit
Source: Company Reports, Analyst Briefings, Central Bank
Islamic Banking Competitiveness Report 2011-12
Page 90
COMPETITIVENESS REPORT 2011-201290
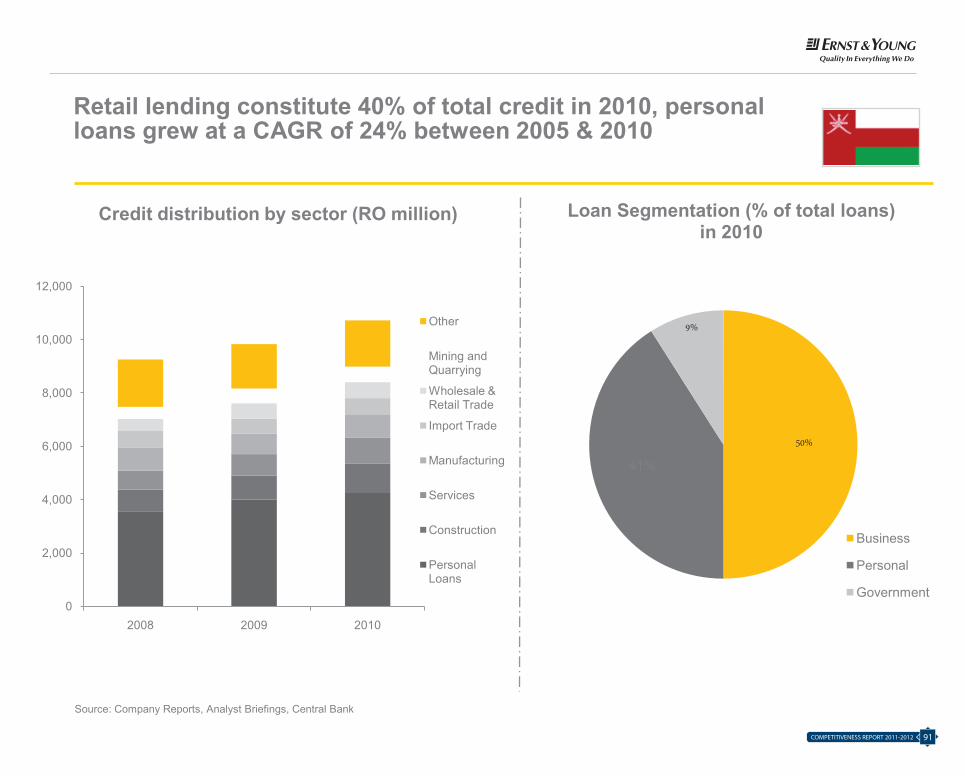
Retail lending constitute 40% of total credit in 2010, personal loans grew at a CAGR of 24% between 2005 & 2010
0
2,000
4,000
6,000
8,000
10,000
12,000
2008 2009 2010
Other
Mining and Quarrying
Wholesale & Retail Trade
Import Trade
Manufacturing
Services
Construction
Personal Loans
Credit distribution by sector (RO million)
50%
41%
9%
Loan Segmentation (% of total loans) in 2010
Business
Personal
Government
Source: Company Reports, Analyst Briefings, Central Bank
Islamic Banking Competitiveness Report 2011-12
Page 91
91COMPETITIVENESS REPORT 2011-2012
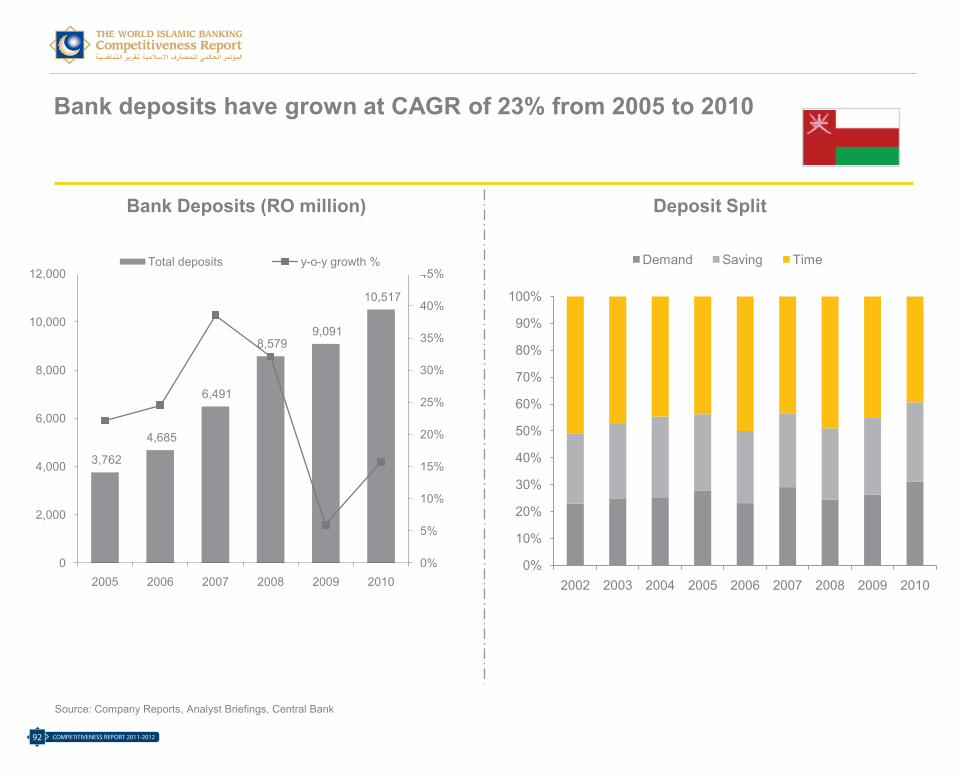
Bank deposits have grown at CAGR of 23% from 2005 to 2010
Bank Deposits (RO million) Deposit Split
0%
10%
20%
30%
40%
50%
60%
70%
80%
90%
100%
2002 2003 2004 2005 2006 2007 2008 2009 2010
Demand Saving Time
3,762
4,685
6,491
8,579 9,091
10,517
0%
5%
10%
15%
20%
25%
30%
35%
40%
45%
0
2,000
4,000
6,000
8,000
10,000
12,000
2005 2006 2007 2008 2009 2010
Total deposits y-o-y growth %
Source: Company Reports, Analyst Briefings, Central Bank
Islamic Banking Competitiveness Report 2011-12
Page 92
COMPETITIVENESS REPORT 2011-201292
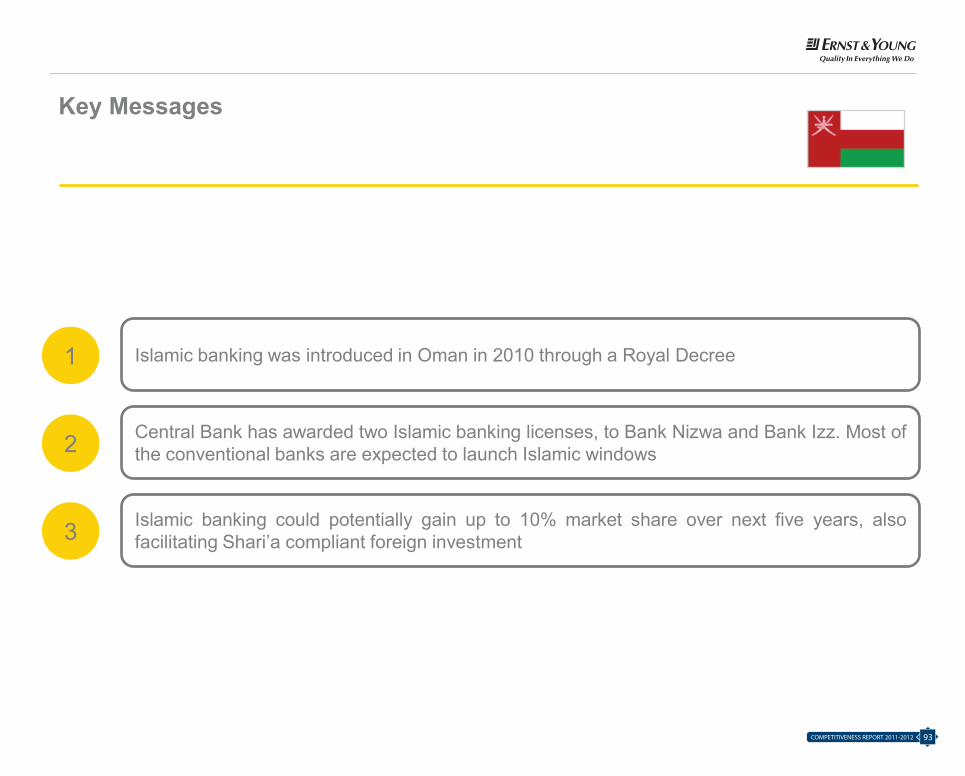
Bank deposits have grown at CAGR of 23% from 2005 to 2010
Bank Deposits (RO million) Deposit Split
0%
10%
20%
30%
40%
50%
60%
70%
80%
90%
100%
2002 2003 2004 2005 2006 2007 2008 2009 2010
Demand Saving Time
3,762
4,685
6,491
8,579 9,091
10,517
0%
5%
10%
15%
20%
25%
30%
35%
40%
45%
0
2,000
4,000
6,000
8,000
10,000
12,000
2005 2006 2007 2008 2009 2010
Total deposits y-o-y growth %
Source: Company Reports, Analyst Briefings, Central Bank
Islamic Banking Competitiveness Report 2011-12
Page 92
Key Messages
1
2
3
Central Bank has awarded two Islamic banking licenses, to Bank Nizwa and Bank Izz. Most ofthe conventional banks are expected to launch Islamic windows
Islamic banking could potentially gain up to 10% market share over next five years, alsofacilitating Shari’a compliant foreign investment
Islamic banking was introduced in Oman in 2010 through a Royal Decree
Islamic Banking Competitiveness Report 2011-12
Page 93
93COMPETITIVENESS REPORT 2011-2012

Appendices
Islamic Banking Competitiveness Report 2011-12
Page 94
COMPETITIVENESS REPORT 2011-201294
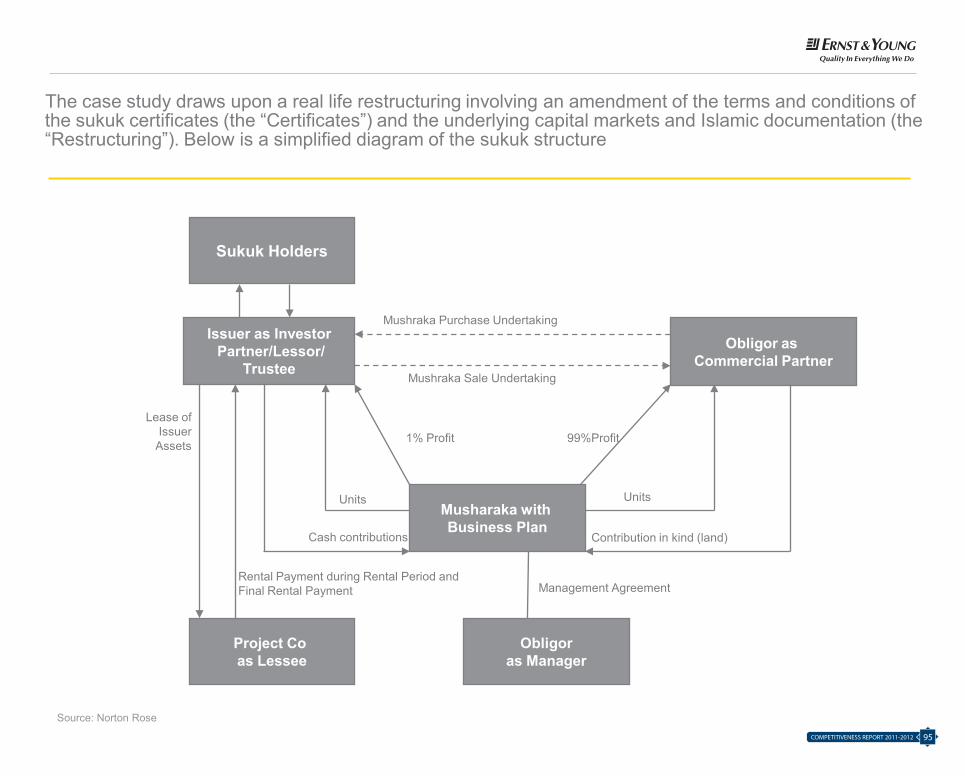
The case study draws upon a real life restructuring involving an amendment of the terms and conditions of the sukuk certificates (the “Certificates”) and the underlying capital markets and Islamic documentation (the “Restructuring”). Below is a simplified diagram of the sukuk structure
Sukuk Holders
Issuer as InvestorPartner/Lessor/
Trustee
Obligor as Commercial Partner
Musharaka with Business Plan
Project Co as Lessee
Obligoras Manager
Mushraka Purchase Undertaking
Mushraka Sale Undertaking
Contribution in kind (land)
Units
99%Profit1% Profit
Management AgreementRental Payment during Rental Period and Final Rental Payment
Cash contributions
Units
Lease of Issuer
Assets
Source: Norton Rose
Islamic Banking Competitiveness Report 2011-12
Page 95
95COMPETITIVENESS REPORT 2011-2012
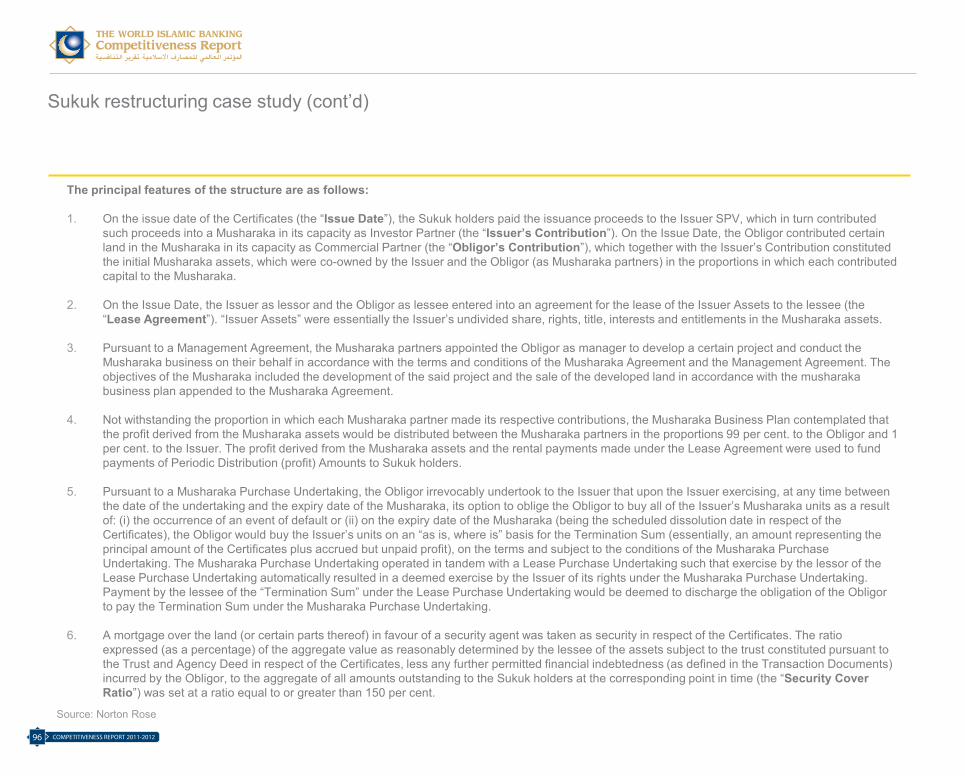
Sukuk restructuring case study (cont’d)
The principal features of the structure are as follows:
1. On the issue date of the Certificates (the “Issue Date”), the Sukuk holders paid the issuance proceeds to the Issuer SPV, which in turn contributed such proceeds into a Musharaka in its capacity as Investor Partner (the “Issuer’s Contribution”). On the Issue Date, the Obligor contributed certain land in the Musharaka in its capacity as Commercial Partner (the “Obligor’s Contribution”), which together with the Issuer’s Contribution constituted the initial Musharaka assets, which were co-owned by the Issuer and the Obligor (as Musharaka partners) in the proportions in which each contributed capital to the Musharaka.
2. On the Issue Date, the Issuer as lessor and the Obligor as lessee entered into an agreement for the lease of the Issuer Assets to the lessee (the “Lease Agreement”). “Issuer Assets” were essentially the Issuer’s undivided share, rights, title, interests and entitlements in the Musharaka assets.
3. Pursuant to a Management Agreement, the Musharaka partners appointed the Obligor as manager to develop a certain project and conduct the Musharaka business on their behalf in accordance with the terms and conditions of the Musharaka Agreement and the Management Agreement. The objectives of the Musharaka included the development of the said project and the sale of the developed land in accordance with the musharakabusiness plan appended to the Musharaka Agreement.
4. Not withstanding the proportion in which each Musharaka partner made its respective contributions, the Musharaka Business Plan contemplated that the profit derived from the Musharaka assets would be distributed between the Musharaka partners in the proportions 99 per cent. to the Obligor and 1 per cent. to the Issuer. The profit derived from the Musharaka assets and the rental payments made under the Lease Agreement were used to fund payments of Periodic Distribution (profit) Amounts to Sukuk holders.
5. Pursuant to a Musharaka Purchase Undertaking, the Obligor irrevocably undertook to the Issuer that upon the Issuer exercising, at any time between the date of the undertaking and the expiry date of the Musharaka, its option to oblige the Obligor to buy all of the Issuer’s Musharaka units as a result of: (i) the occurrence of an event of default or (ii) on the expiry date of the Musharaka (being the scheduled dissolution date in respect of the Certificates), the Obligor would buy the Issuer’s units on an “as is, where is” basis for the Termination Sum (essentially, an amount representing the principal amount of the Certificates plus accrued but unpaid profit), on the terms and subject to the conditions of the Musharaka Purchase Undertaking. The Musharaka Purchase Undertaking operated in tandem with a Lease Purchase Undertaking such that exercise by the lessor of the Lease Purchase Undertaking automatically resulted in a deemed exercise by the Issuer of its rights under the Musharaka Purchase Undertaking. Payment by the lessee of the “Termination Sum” under the Lease Purchase Undertaking would be deemed to discharge the obligation of the Obligor to pay the Termination Sum under the Musharaka Purchase Undertaking.
6. A mortgage over the land (or certain parts thereof) in favour of a security agent was taken as security in respect of the Certificates. The ratio expressed (as a percentage) of the aggregate value as reasonably determined by the lessee of the assets subject to the trust constituted pursuant to the Trust and Agency Deed in respect of the Certificates, less any further permitted financial indebtedness (as defined in the Transaction Documents) incurred by the Obligor, to the aggregate of all amounts outstanding to the Sukuk holders at the corresponding point in time (the “Security Cover Ratio”) was set at a ratio equal to or greater than 150 per cent.
Source: Norton Rose
Islamic Banking Competitiveness Report 2011-12
Page 96
COMPETITIVENESS REPORT 2011-201296
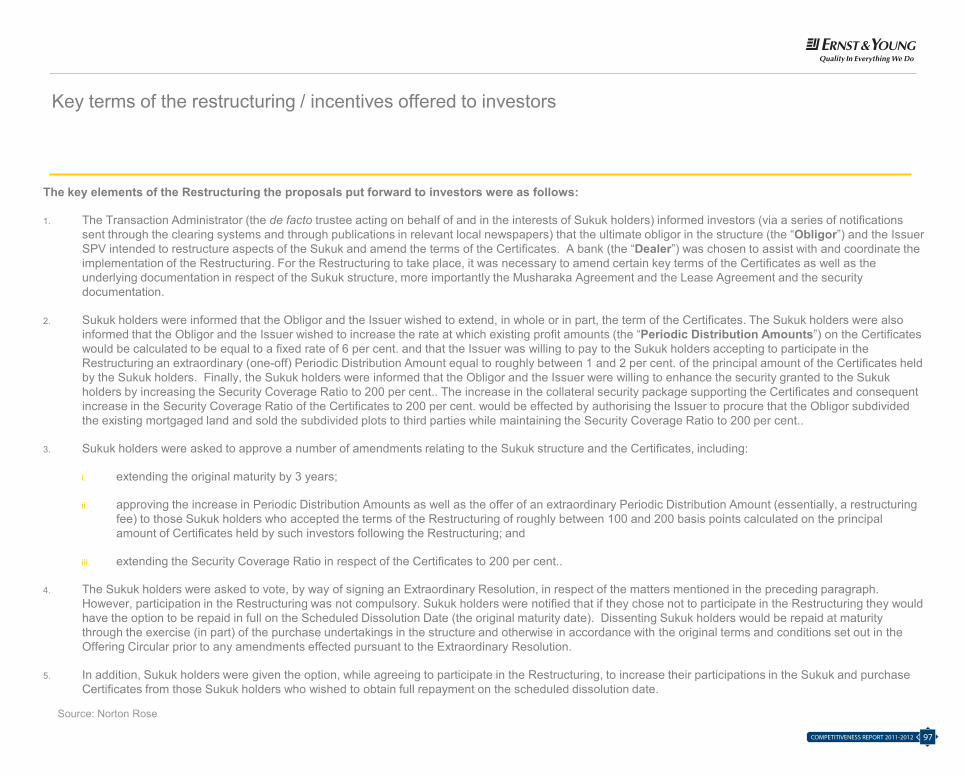
Key terms of the restructuring / incentives offered to investors
The key elements of the Restructuring the proposals put forward to investors were as follows:
1. The Transaction Administrator (the de facto trustee acting on behalf of and in the interests of Sukuk holders) informed investors (via a series of notifications sent through the clearing systems and through publications in relevant local newspapers) that the ultimate obligor in the structure (the “Obligor”) and the Issuer SPV intended to restructure aspects of the Sukuk and amend the terms of the Certificates. A bank (the “Dealer”) was chosen to assist with and coordinate the implementation of the Restructuring. For the Restructuring to take place, it was necessary to amend certain key terms of the Certificates as well as the underlying documentation in respect of the Sukuk structure, more importantly the Musharaka Agreement and the Lease Agreement and the security documentation.
2. Sukuk holders were informed that the Obligor and the Issuer wished to extend, in whole or in part, the term of the Certificates. The Sukuk holders were also informed that the Obligor and the Issuer wished to increase the rate at which existing profit amounts (the “Periodic Distribution Amounts”) on the Certificates would be calculated to be equal to a fixed rate of 6 per cent. and that the Issuer was willing to pay to the Sukuk holders accepting to participate in the Restructuring an extraordinary (one-off) Periodic Distribution Amount equal to roughly between 1 and 2 per cent. of the principal amount of the Certificates held by the Sukuk holders. Finally, the Sukuk holders were informed that the Obligor and the Issuer were willing to enhance the security granted to the Sukukholders by increasing the Security Coverage Ratio to 200 per cent.. The increase in the collateral security package supporting the Certificates and consequent increase in the Security Coverage Ratio of the Certificates to 200 per cent. would be effected by authorising the Issuer to procure that the Obligor subdivided the existing mortgaged land and sold the subdivided plots to third parties while maintaining the Security Coverage Ratio to 200 per cent..
3. Sukuk holders were asked to approve a number of amendments relating to the Sukuk structure and the Certificates, including:
i. extending the original maturity by 3 years;
ii. approving the increase in Periodic Distribution Amounts as well as the offer of an extraordinary Periodic Distribution Amount (essentially, a restructuring fee) to those Sukuk holders who accepted the terms of the Restructuring of roughly between 100 and 200 basis points calculated on the principal amount of Certificates held by such investors following the Restructuring; and
iii. extending the Security Coverage Ratio in respect of the Certificates to 200 per cent..
4. The Sukuk holders were asked to vote, by way of signing an Extraordinary Resolution, in respect of the matters mentioned in the preceding paragraph. However, participation in the Restructuring was not compulsory. Sukuk holders were notified that if they chose not to participate in the Restructuring they would have the option to be repaid in full on the Scheduled Dissolution Date (the original maturity date). Dissenting Sukuk holders would be repaid at maturity through the exercise (in part) of the purchase undertakings in the structure and otherwise in accordance with the original terms and conditions set out in the Offering Circular prior to any amendments effected pursuant to the Extraordinary Resolution.
5. In addition, Sukuk holders were given the option, while agreeing to participate in the Restructuring, to increase their participations in the Sukuk and purchase Certificates from those Sukuk holders who wished to obtain full repayment on the scheduled dissolution date.
Source: Norton Rose
Islamic Banking Competitiveness Report 2011-12
Page 97
97COMPETITIVENESS REPORT 2011-2012
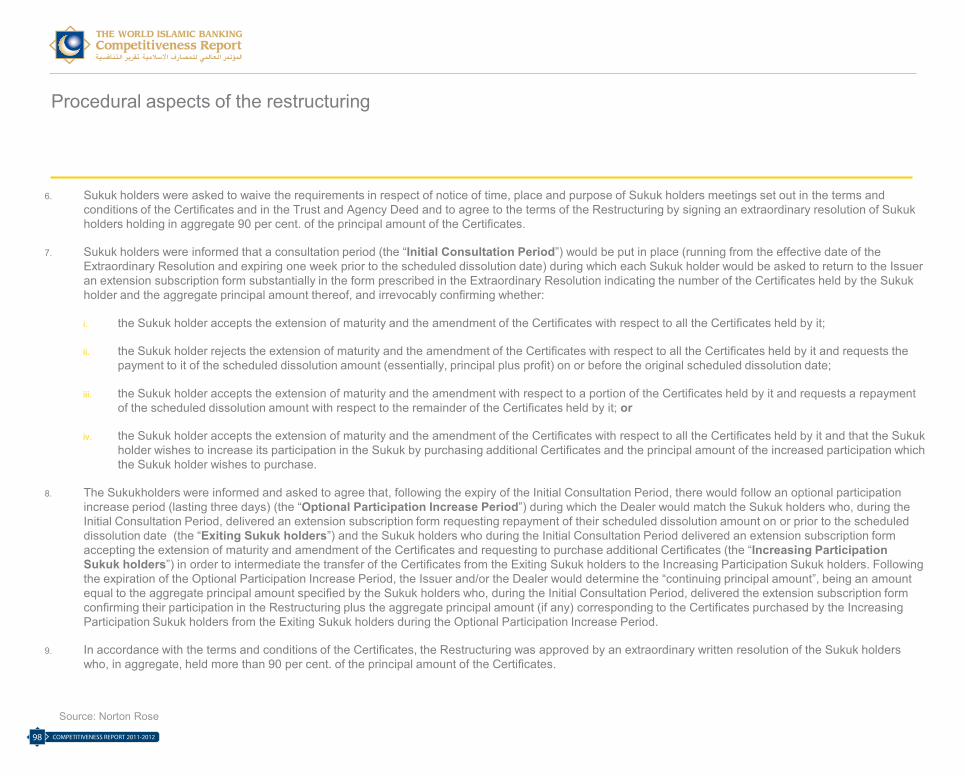
Procedural aspects of the restructuring
6. Sukuk holders were asked to waive the requirements in respect of notice of time, place and purpose of Sukuk holders meetings set out in the terms and conditions of the Certificates and in the Trust and Agency Deed and to agree to the terms of the Restructuring by signing an extraordinary resolution of Sukukholders holding in aggregate 90 per cent. of the principal amount of the Certificates.
7. Sukuk holders were informed that a consultation period (the “Initial Consultation Period”) would be put in place (running from the effective date of the Extraordinary Resolution and expiring one week prior to the scheduled dissolution date) during which each Sukuk holder would be asked to return to the Issuer an extension subscription form substantially in the form prescribed in the Extraordinary Resolution indicating the number of the Certificates held by the Sukukholder and the aggregate principal amount thereof, and irrevocably confirming whether:
i. the Sukuk holder accepts the extension of maturity and the amendment of the Certificates with respect to all the Certificates held by it;
ii. the Sukuk holder rejects the extension of maturity and the amendment of the Certificates with respect to all the Certificates held by it and requests the payment to it of the scheduled dissolution amount (essentially, principal plus profit) on or before the original scheduled dissolution date;
iii. the Sukuk holder accepts the extension of maturity and the amendment with respect to a portion of the Certificates held by it and requests a repayment of the scheduled dissolution amount with respect to the remainder of the Certificates held by it; or
iv. the Sukuk holder accepts the extension of maturity and the amendment of the Certificates with respect to all the Certificates held by it and that the Sukukholder wishes to increase its participation in the Sukuk by purchasing additional Certificates and the principal amount of the increased participation which the Sukuk holder wishes to purchase.
8. The Sukukholders were informed and asked to agree that, following the expiry of the Initial Consultation Period, there would follow an optional participation increase period (lasting three days) (the “Optional Participation Increase Period”) during which the Dealer would match the Sukuk holders who, during the Initial Consultation Period, delivered an extension subscription form requesting repayment of their scheduled dissolution amount on or prior to the scheduled dissolution date (the “Exiting Sukuk holders”) and the Sukuk holders who during the Initial Consultation Period delivered an extension subscription form accepting the extension of maturity and amendment of the Certificates and requesting to purchase additional Certificates (the “Increasing Participation Sukuk holders”) in order to intermediate the transfer of the Certificates from the Exiting Sukuk holders to the Increasing Participation Sukuk holders. Following the expiration of the Optional Participation Increase Period, the Issuer and/or the Dealer would determine the “continuing principal amount”, being an amount equal to the aggregate principal amount specified by the Sukuk holders who, during the Initial Consultation Period, delivered the extension subscription form confirming their participation in the Restructuring plus the aggregate principal amount (if any) corresponding to the Certificates purchased by the Increasing Participation Sukuk holders from the Exiting Sukuk holders during the Optional Participation Increase Period.
9. In accordance with the terms and conditions of the Certificates, the Restructuring was approved by an extraordinary written resolution of the Sukuk holders who, in aggregate, held more than 90 per cent. of the principal amount of the Certificates.
Source: Norton Rose
Islamic Banking Competitiveness Report 2011-12
Page 98
COMPETITIVENESS REPORT 2011-201298
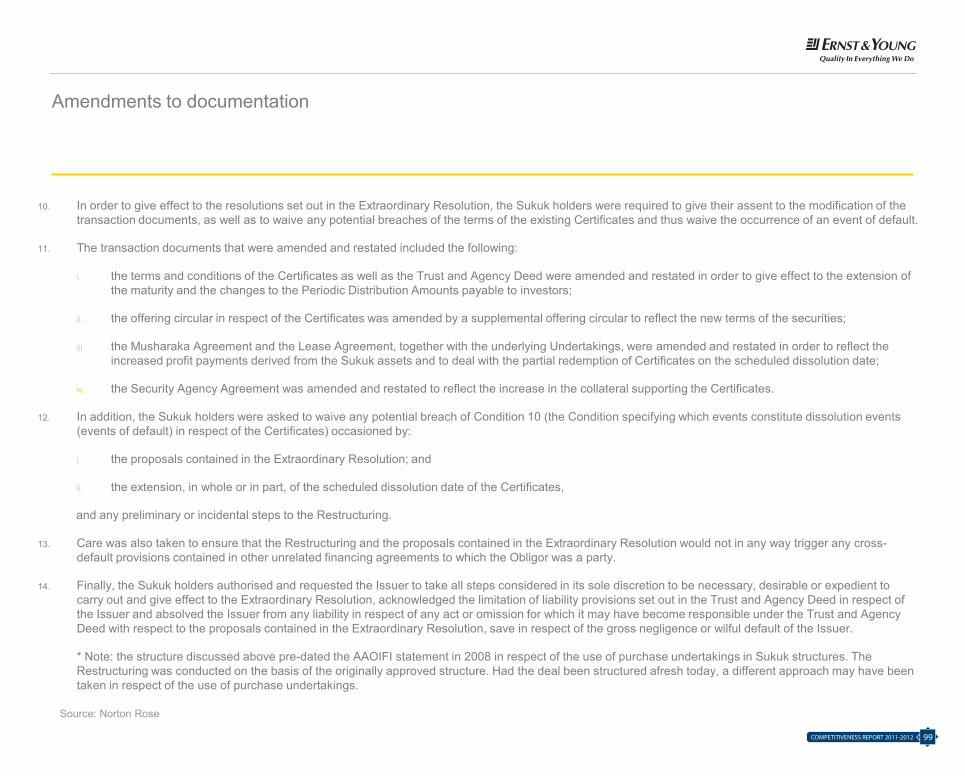
Procedural aspects of the restructuring
6. Sukuk holders were asked to waive the requirements in respect of notice of time, place and purpose of Sukuk holders meetings set out in the terms and conditions of the Certificates and in the Trust and Agency Deed and to agree to the terms of the Restructuring by signing an extraordinary resolution of Sukukholders holding in aggregate 90 per cent. of the principal amount of the Certificates.
7. Sukuk holders were informed that a consultation period (the “Initial Consultation Period”) would be put in place (running from the effective date of the Extraordinary Resolution and expiring one week prior to the scheduled dissolution date) during which each Sukuk holder would be asked to return to the Issuer an extension subscription form substantially in the form prescribed in the Extraordinary Resolution indicating the number of the Certificates held by the Sukukholder and the aggregate principal amount thereof, and irrevocably confirming whether:
i. the Sukuk holder accepts the extension of maturity and the amendment of the Certificates with respect to all the Certificates held by it;
ii. the Sukuk holder rejects the extension of maturity and the amendment of the Certificates with respect to all the Certificates held by it and requests the payment to it of the scheduled dissolution amount (essentially, principal plus profit) on or before the original scheduled dissolution date;
iii. the Sukuk holder accepts the extension of maturity and the amendment with respect to a portion of the Certificates held by it and requests a repayment of the scheduled dissolution amount with respect to the remainder of the Certificates held by it; or
iv. the Sukuk holder accepts the extension of maturity and the amendment of the Certificates with respect to all the Certificates held by it and that the Sukukholder wishes to increase its participation in the Sukuk by purchasing additional Certificates and the principal amount of the increased participation which the Sukuk holder wishes to purchase.
8. The Sukukholders were informed and asked to agree that, following the expiry of the Initial Consultation Period, there would follow an optional participation increase period (lasting three days) (the “Optional Participation Increase Period”) during which the Dealer would match the Sukuk holders who, during the Initial Consultation Period, delivered an extension subscription form requesting repayment of their scheduled dissolution amount on or prior to the scheduled dissolution date (the “Exiting Sukuk holders”) and the Sukuk holders who during the Initial Consultation Period delivered an extension subscription form accepting the extension of maturity and amendment of the Certificates and requesting to purchase additional Certificates (the “Increasing Participation Sukuk holders”) in order to intermediate the transfer of the Certificates from the Exiting Sukuk holders to the Increasing Participation Sukuk holders. Following the expiration of the Optional Participation Increase Period, the Issuer and/or the Dealer would determine the “continuing principal amount”, being an amount equal to the aggregate principal amount specified by the Sukuk holders who, during the Initial Consultation Period, delivered the extension subscription form confirming their participation in the Restructuring plus the aggregate principal amount (if any) corresponding to the Certificates purchased by the Increasing Participation Sukuk holders from the Exiting Sukuk holders during the Optional Participation Increase Period.
9. In accordance with the terms and conditions of the Certificates, the Restructuring was approved by an extraordinary written resolution of the Sukuk holders who, in aggregate, held more than 90 per cent. of the principal amount of the Certificates.
Source: Norton Rose
Islamic Banking Competitiveness Report 2011-12
Page 98
Amendments to documentation
10. In order to give effect to the resolutions set out in the Extraordinary Resolution, the Sukuk holders were required to give their assent to the modification of the transaction documents, as well as to waive any potential breaches of the terms of the existing Certificates and thus waive the occurrence of an event of default.
11. The transaction documents that were amended and restated included the following:
i. the terms and conditions of the Certificates as well as the Trust and Agency Deed were amended and restated in order to give effect to the extension of the maturity and the changes to the Periodic Distribution Amounts payable to investors;
ii. the offering circular in respect of the Certificates was amended by a supplemental offering circular to reflect the new terms of the securities;
iii. the Musharaka Agreement and the Lease Agreement, together with the underlying Undertakings, were amended and restated in order to reflect theincreased profit payments derived from the Sukuk assets and to deal with the partial redemption of Certificates on the scheduled dissolution date;
iv. the Security Agency Agreement was amended and restated to reflect the increase in the collateral supporting the Certificates.
12. In addition, the Sukuk holders were asked to waive any potential breach of Condition 10 (the Condition specifying which events constitute dissolution events(events of default) in respect of the Certificates) occasioned by:
i. the proposals contained in the Extraordinary Resolution; and
ii. the extension, in whole or in part, of the scheduled dissolution date of the Certificates,
and any preliminary or incidental steps to the Restructuring.
13. Care was also taken to ensure that the Restructuring and the proposals contained in the Extraordinary Resolution would not in any way trigger any cross-default provisions contained in other unrelated financing agreements to which the Obligor was a party.
14. Finally, the Sukuk holders authorised and requested the Issuer to take all steps considered in its sole discretion to be necessary, desirable or expedient to carry out and give effect to the Extraordinary Resolution, acknowledged the limitation of liability provisions set out in the Trust and Agency Deed in respect of the Issuer and absolved the Issuer from any liability in respect of any act or omission for which it may have become responsible under the Trust and Agency Deed with respect to the proposals contained in the Extraordinary Resolution, save in respect of the gross negligence or wilful default of the Issuer.
* Note: the structure discussed above pre-dated the AAOIFI statement in 2008 in respect of the use of purchase undertakings in Sukuk structures. The Restructuring was conducted on the basis of the originally approved structure. Had the deal been structured afresh today, a different approach may have been taken in respect of the use of purchase undertakings.
Source: Norton Rose
Islamic Banking Competitiveness Report 2011-12
Page 99
99COMPETITIVENESS REPORT 2011-2012
Performance Analysis
Competitive Landscape
Competing to Win: The CEO
Agenda
Country Spotlight
Executive Brief
Team, Sources & Contributors
Islamic Banking Competitiveness Report 2011-12
Page 100
COMPETITIVENESS REPORT 2011-2012100
Ernst & Young Leadership
Ashar NazimIslamic Finance [email protected]
Abid [email protected]
Sohaib [email protected]
Shahid [email protected]
Mustafa [email protected]
Islamic Financial ServicesCenter of Excellence
MENA Executives
Tariq SadiqAdvisory Leader
Noor AbidAssurance Leader
Sherif El-KilanyTax Leader
Phil GandierTAS Leader
Gordon Bennie FS Leader
Andrew BarstowFS Advisory Leader
Maged FanousPartner, Kuwait
Robert AbboudPartner, Qatar
Fawad LaiquePartner, Saudi Arabia
Nader RahimiPartner, Bahrain
Imtiaz IbrahimSenior Director, Bahrain
Sameer AbdiPartner, Qatar
Islamic Banking Competitiveness Report 2011-12
Page 101
101COMPETITIVENESS REPORT 2011-2012
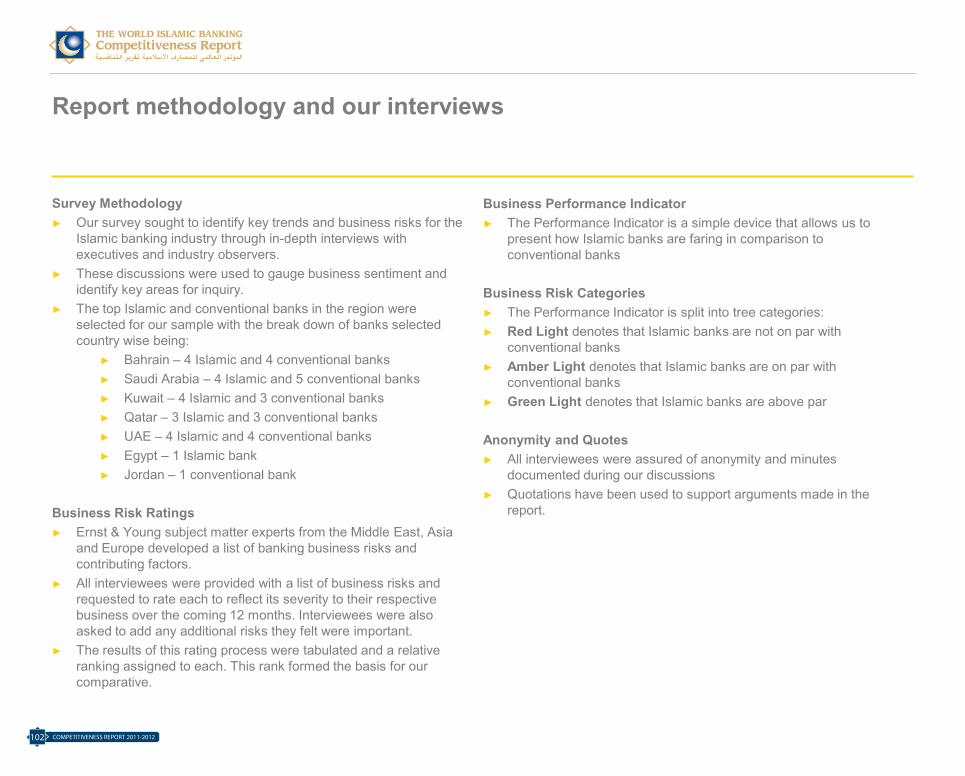
Report methodology and our interviews
Survey Methodology► Our survey sought to identify key trends and business risks for the
Islamic banking industry through in-depth interviews with executives and industry observers.
► These discussions were used to gauge business sentiment and identify key areas for inquiry.
► The top Islamic and conventional banks in the region were selected for our sample with the break down of banks selected country wise being:
► Bahrain – 4 Islamic and 4 conventional banks► Saudi Arabia – 4 Islamic and 5 conventional banks► Kuwait – 4 Islamic and 3 conventional banks► Qatar – 3 Islamic and 3 conventional banks► UAE – 4 Islamic and 4 conventional banks► Egypt – 1 Islamic bank► Jordan – 1 conventional bank
Business Risk Ratings► Ernst & Young subject matter experts from the Middle East, Asia
and Europe developed a list of banking business risks and contributing factors.
► All interviewees were provided with a list of business risks and requested to rate each to reflect its severity to their respective business over the coming 12 months. Interviewees were also asked to add any additional risks they felt were important.
► The results of this rating process were tabulated and a relative ranking assigned to each. This rank formed the basis for our comparative.
Business Performance Indicator► The Performance Indicator is a simple device that allows us to
present how Islamic banks are faring in comparison to conventional banks
Business Risk Categories► The Performance Indicator is split into tree categories: ► Red Light denotes that Islamic banks are not on par with
conventional banks► Amber Light denotes that Islamic banks are on par with
conventional banks► Green Light denotes that Islamic banks are above par
Anonymity and Quotes► All interviewees were assured of anonymity and minutes
documented during our discussions► Quotations have been used to support arguments made in the
report.
Islamic Banking Competitiveness Report 2011-12
Page 102
COMPETITIVENESS REPORT 2011-2012102
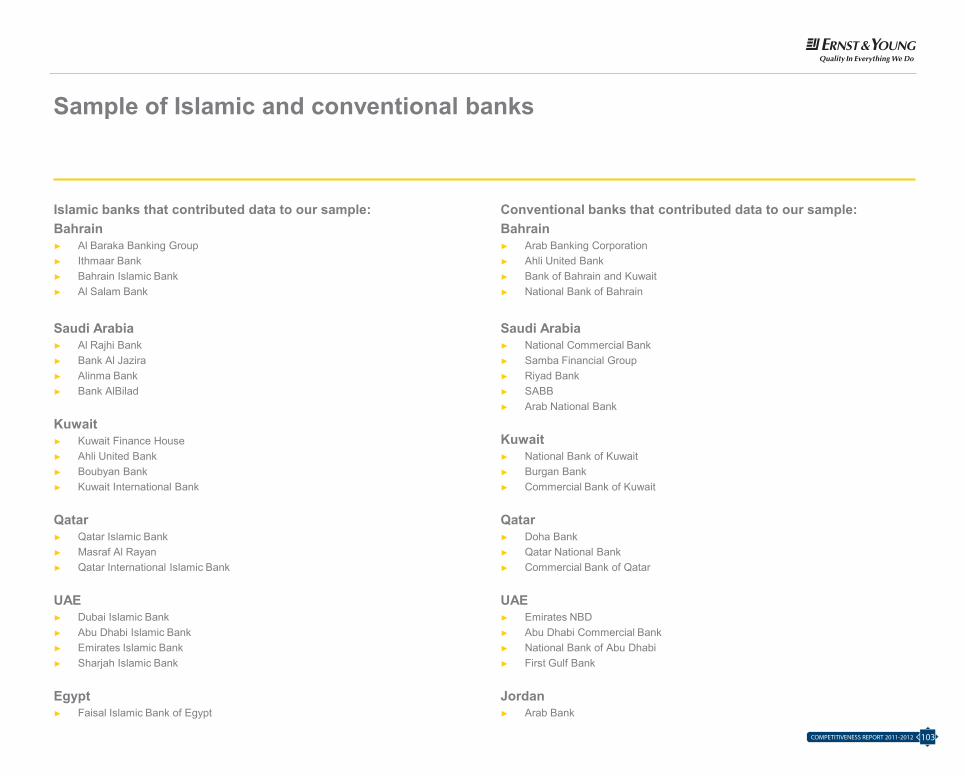
Sample of Islamic and conventional banks
Islamic banks that contributed data to our sample:Bahrain► Al Baraka Banking Group► Ithmaar Bank► Bahrain Islamic Bank► Al Salam Bank
Saudi Arabia► Al Rajhi Bank► Bank Al Jazira► Alinma Bank► Bank AlBilad
Kuwait► Kuwait Finance House► Ahli United Bank► Boubyan Bank► Kuwait International Bank
Qatar► Qatar Islamic Bank► Masraf Al Rayan► Qatar International Islamic Bank
UAE► Dubai Islamic Bank► Abu Dhabi Islamic Bank► Emirates Islamic Bank► Sharjah Islamic Bank
Egypt► Faisal Islamic Bank of Egypt
Conventional banks that contributed data to our sample:Bahrain► Arab Banking Corporation► Ahli United Bank► Bank of Bahrain and Kuwait► National Bank of Bahrain
Saudi Arabia► National Commercial Bank► Samba Financial Group► Riyad Bank► SABB► Arab National Bank
Kuwait► National Bank of Kuwait► Burgan Bank► Commercial Bank of Kuwait
Qatar► Doha Bank► Qatar National Bank► Commercial Bank of Qatar
UAE► Emirates NBD► Abu Dhabi Commercial Bank► National Bank of Abu Dhabi► First Gulf Bank
Jordan► Arab Bank
Islamic Banking Competitiveness Report 2011-12
Page 103
103COMPETITIVENESS REPORT 2011-2012
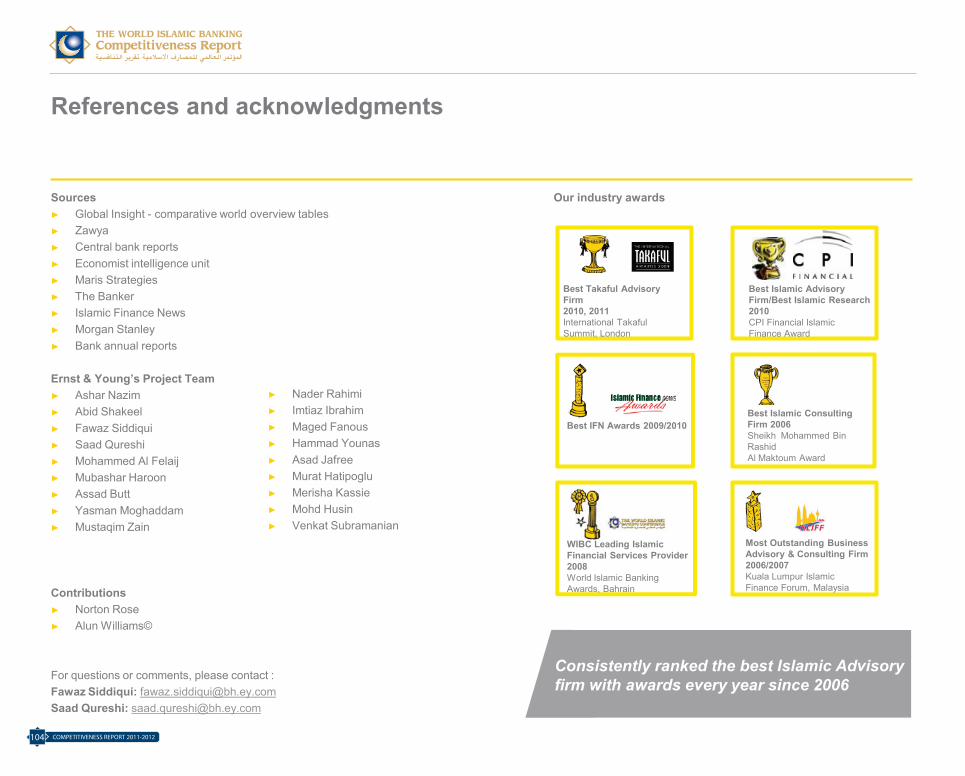
References and acknowledgments
Sources► Global Insight - comparative world overview tables ► Zawya► Central bank reports► Economist intelligence unit► Maris Strategies► The Banker► Islamic Finance News► Morgan Stanley► Bank annual reports
Ernst & Young’s Project Team► Ashar Nazim► Abid Shakeel► Fawaz Siddiqui► Saad Qureshi► Mohammed Al Felaij► Mubashar Haroon► Assad Butt► Yasman Moghaddam► Mustaqim Zain
Contributions► Norton Rose► Alun Williams©
For questions or comments, please contact :Fawaz Siddiqui: [email protected] Qureshi: [email protected]
Our industry awards
Consistently ranked the best Islamic Advisory firm with awards every year since 2006
Best Islamic Advisory Firm/Best Islamic Research 2010CPI Financial Islamic Finance Award
Best Takaful Advisory Firm 2010, 2011International Takaful Summit, London
Best IFN Awards 2009/2010Best Islamic Consulting Firm 2006Sheikh Mohammed Bin Rashid Al Maktoum Award
WIBC Leading Islamic Financial Services Provider 2008World Islamic Banking Awards, Bahrain
Most Outstanding Business Advisory & Consulting Firm 2006/2007Kuala Lumpur Islamic Finance Forum, Malaysia
► Nader Rahimi► Imtiaz Ibrahim► Maged Fanous► Hammad Younas► Asad Jafree► Murat Hatipoglu► Merisha Kassie► Mohd Husin► Venkat Subramanian
Islamic Banking Competitiveness Report 2011-12
Page 104
COMPETITIVENESS REPORT 2011-2012104
Ernst & Young
Assurance Tax Transactions Advisory
About Ernst & Young
Ernst & Young is a global leader in assurance, tax, transaction and advisory services. Worldwide, our 144,000 people are united by our shared values and an unwavering commitment to quality. We make a difference by helping our people, our clients and our wider communities achieve their potential.
The Middle East practice of Ernst & Young has been operating in the region since 1923. For over 85 years, we have evolved to meet the legal and commercial developments of the region. Across the Middle East, we have over 4,200 people united across 20 offices and 15 Arab countries, sharing the same values and an unwavering commitment to quality. We make a difference by helping our people, our clients and our wider communities achieve their potential.
© 2011 Ernst & Young.
All rights reserved.
www.ey.com
This publication contains information in summary form and is therefore intended for general guidance only. It is not intended to be a substitute for detailed research or the exercise of professional judgment. Neither EYGM Limited nor any other member of the global Ernst & Young organization can accept any responsibility for loss occasioned to any person acting or refraining from action as a result of any material in this publication. On any specific matter, reference should be made to the appropriate advisor.
Ernst & Young refers to the global organization of member firms of Ernst & Young Global Limited, each of which is a separate legal entity. Ernst & Young Global Limited, a UK company limited by guarantee, does not provide services to clients.
Islamic Banking Competitiveness Report 2011-12
Page 105
105COMPETITIVENESS REPORT 2011-2012

COMPETITIVENESS REPORT 2011-2012106
A MEGA Brand: Shaping the Future of the Global Islamic Finance Industry Since 1993P.O. Box 72045, Dubai, UAE | t. +9714 343 1200 | f+971 4 343 6003 MEGA Brands. MEGA Clients. Market Leaders. www.megaevents.net
MEGA: Shaping the Future of the Global Islamic Finance Industry Since 1993
2 Decades of Supporting the Market Leaders
MEGA is the leading international information firm focused on achieving business results for the Islamic banking & finance industry since 1993. Our exclusive focus on Islamic finance has enabled us to create significant value for the leading players in the Islamic banking, finance and investment markets. The portfolio of MEGA brands represents the landmark industry conferences and our clients are the leading players in the international financial markets.
Partnering with Governments and the Industry Thought Leaders
Our Strategic Partners are world leaders in their respective fields and include key government finance and regulatory agencies such as the Central Bank of Bahrain, Dubai International Financial Centre, UK Trade & Investment, the Monetary Authority of Singapore and the Economic Development Board of Bahrain. These and our other strategic alliances with international thought leaders including Ernst & Young and global strategy advisory firm McKinsey & Company further strengthen MEGA’s brand leadership position by providing original new research insights on the Islamic finance industry worldwide.
Investing in Our Brands: Number 1 in Each of Our Markets
MEGA continues to grow its portfolio of Islamic finance brands to further extend our leadership position across the Banking, Takaful, Funds, Capital Markets, and Project Finance segments. Each brand is successfully developed over many years in order to further cement its number 1 position in its respective market.
In 1994 we founded the World Islamic Banking Conference (WIBC), which at the time was one of the first conferences in the world to focus on this nascent industry. That first year we had 120 pioneering delegates and one sponsor. Today, fast approaching 2 decades later and with more than 1,200 delegates from over 50 countries attending the conference each year, WIBC is an iconic brand internationally recognised as the world’s largest gathering of Islamic finance leaders.
A World Stage: Genuinely Global Dialogues
MEGA brands have a genuinely global reach across the Islamic finance industry. An initiative to further broaden this international representation ‘The World Comes to WIBC’ was launched at WIBC 2007 and has grown to now feature a British Pavilion led by UKTI and comprising 18 British-based banks. 2008 saw us further extending this programme to Asia, in partnership with the Monetary Authority of Singapore, which resulted in a high-profile Singapore delegation led by the MAS Governor. A number of leading international Islamic banking groups also now convene their annual board meetings along the sidelines of WIBC.
Understanding Client Needs & Delivering Long-Term Value
MEGA’s leadership position has come as a result of our relentless focus on the constantly changing needs of our clients as the Islamic finance industry has grown and matured. Whether it be the challenges of launching a new bank, a new investment fund, an innovative new retail financial product or raising corporate profile in a key target market, we ensure that our offerings are closely aligned to the immediate business priorities of our clients. Then we make sure that we deliver on our promises and that is why the market leaders come back and work with us year after year. Our genuine value creation is highlighted by our long-term relationship with Ernst & Young who have worked with us continuously since the inception of the World Islamic Banking Conference 18 years ago - and who are also now our partners across the portfolio of MEGA brands.
19 Years of shaping the future of the global Islamic finance industry
19 Years of gathering industry thought leaders in dynamic debate
19 Years of bringing together more than 1,200 international industry leaders
19 Years of successfully working with the market leaders
19 Years of delivering a one-of-a-kind spectacle to the Islamic finance industry
1,200 Industry leaders. 50+ Countries. 1 Gathering: WIBC 2012The World’s Largest Annual Gathering of Islamic Finance Leaders
WIBC: 19 Years of Market Leadership
In collaboration with
WIBC is a MEGA BrandMEGA Brands. MEGA Clients. Market Leaders. | Shaping the Future of the Global Islamic Finance Industry Since 1993
To participate in this prestigious event contact: [email protected] | t:+971 4 343 1200 | f:+971 4 343 6003 | P.O. Box 72045, Dubai | www.megaevents.net/Islamic_banking
© 2011The World Islamic Banking Competitiveness Report is documented for the World Islamic Banking Conference.No part of this document may be republished, distributed, retransmitted, cited or quoted without the prior written permission from MEGA or Ernst & Young.
WIBC is a MEGA BrandShaping the Future of the Global Islamic Finance Industry Since 1993P.O. Box 72045, Dubai | t:+971 4 343 1200 | f:+971 4 343 6003www.megaevents.netMEGA Brands. MEGA Clients. Market Leaders.
MEGA BRANDS. MEGA CLIENTS. MARKET LEADERS.MEGA is the market leading business information firm focused on achieving business results for the global Islamic banking & finance industry since 1993.The portfolio of MEGA brands represents the landmark industry conferences and our clients are the leading players in the international financial markets.


![World Islamic Banking Competitiveness Report 2014–15 · PDF file6 World Islamic Banking Competitiveness Report 2014–15. HYjla[ahYlagf ZYfcaf_ Ykk]lk oal` [gee]j[aYd ZYfck ... ZYfcaf_](https://static.fdocuments.us/doc/165x107/5a7bbab77f8b9a66798c4385/world-islamic-banking-competitiveness-report-201415-world-islamic-banking-competitiveness.jpg)