Corporate Investors q4 1011 PDF IFRS Consol Financials March 2011
2
This is a jo int publication of the European Commission's Joint Research Centre (JRC), the European Commission’s science and
knowledge service and the Organisation for Economic Co -operation and Deve lopment (OECD). The scientific output expressed does
not imply a policy position of the European Commission nor the Organisation for Economic Co -operation and Deve lopment (OECD).
Ne ither the European Commission nor the Organisation for Economic Co-operation and Deve lopment (OECD) nor any person acting
on behalf of these are responsible for the use that might be made of this publication. The opinions expressed and arguments
employed in the present report do not necessarily reflect the official views of the European Commission or Organisation for Economic
Co-operation and Deve lopment (OECD) or of the governments of its member countries. This document and any map included here in
are without pre judice to the status of or sovere ignty over any territory, to the de limitation of international frontie rs and boundaries
and to the name of any territory, city or area.
Acknowledgments: The authors are grateful to Alessandra Colecchia (OECD), Fernando Hervás Soriano (JRC), Alexander Tübke (JRC), and Giuditta De Prato (JRC) for providing input and feedback throughout the development of the report. Contact information
European Commission Joint Research Centre Directorate Growth & Innovation Address: Edificio Expo. c/ Inca Garcilaso, 3. E-41092 Seville (Spain) E-mail: [email protected] Te l.: +34 954488318 Fax: +34 954488300 http ://www.ec.europa.eu/jrc
Contact information
Organisation for Economic Co-operation and Development (OECD) Directorate for Science, Technology and Innovation Address: 2, rue André Pascal 75775 Paris CEDEX 16 (France) Te l : 33(0)1 45 24 18 00 www.oecd.org/sti
EU Science Hub
https://ec.europa.eu/jrc
JRC117068
EUR 29831 EN
Print ISBN 978-92-76-09670-2 ISSN 1018-5593 doi:10.2760/16575
PDF ISBN 978-92-76-09669-6 ISSN 1831-9424 doi:10.2760/472704
Luxembourg: Publications Office of the European Union, 2019 © European Union / OECD 2019
The reuse policy of the European Commission is implemented by the Commission Decision 2011/833/EU of 12 December 2011 on the reuse of Commission documents (OJ L 330, 14.12.2011, p . 39). Except otherwise noted, the reuse of this document is authorised under a Creative Commons Attribution 4.0 International (CC BY 4.0) licence (https://creativecommons.org/licenses/by/4.0/). This means that reuse is allowed provided appropriate credit is given and any changes made are indicated.
How to cite this work: Dernis H., Gkotsis P., Grassano N., Nakazato S., Squicciarin i M., van Beuzekom B.,Vezzani A. (2019). World
Corporate Top R&D investors: Shaping the Future of Technologies and of AI . A jo int JRC and OECD report. EUR 29831 EN, Publications Office of the European Union, Luxembourg, 2019, ISBN 978-92-76-09670-2 , doi:10.2760/16575, JRC117068
Printed in Spain
1
Foreword
In modern societies, innovation and new technologies are key to growth and development
and to achieving more inclusive economies and societies. In the past decades, the
development and adoption of new technologies across all sectors of the economy has been
characterised by unprecedented speed, scale and scope of technological change. Some of
these new technologies are so pervasive that they have the potential to affect every part of
economies and societies. Artificial Intelligence (AI) is one such general purpose technology
that seems set to play a key role in almost every aspect of our lives.
While very widespread and deep, ongoing changes are nevertheless difficult to f ully
understand. The prospect for opportunities seems huge but so do the challenges, and there is
the risk that the future may bring undesirable consequences - at least for some parts of society
- if technological change is not steered towards enabling inc lusive and sustainable outcomes,
nor follows internationally agreed ethical principles. AI is a typical example of a technology
having the potential to profoundly improve our lives but also to create or widen disparities.
Understanding the role of all players involved in and leading technological change, also in the
private sector, is key to better understand ongoing and future developments and to steer them
in a direction that enhances society.
This report brings together data on patents, trademarks and sc ientific publications of the
world’s top corporate R&D investors to shed light on the role of these key players in shaping
the future of technologies, and of AI in particular. As for the two previous editions, this work
results from the collaborative effort of the Joint Research Centre of the European Commission
(EC-JRC) and the Organisation for Economic Co-operation and Development (OECD), two
organisations committed to providing solid data and analysis in support of evidence-based
policy making.
The target audience of this report is quite diverse: from the scientific community to industry
representatives, from practitioners to policy makers. Its aim is to provide a useful source of
data and analysis to all those interested in getting a better understanding of the scientific and
technological activities of key industry players, particularly in the field of AI. Most of the data
underlying the analysis presented in the report are made publicly available, in an effort to spur
further analysis.
Vladimir Šucha Andrew W. Wyckoff Director General, Joint Research Centre
European Commission Director
Directorate for Science, Technology and Innovation
Organisation for Economic Co-operation and Development
2
Table of Contents Foreword ....................................................................................................................... 1
Highlights ...................................................................................................................... 3
1. Introduction............................................................................................................... 7
2. The anatomy of innovative activities .........................................................................11
2.1 The corporate structure and geographical distribution of top R&D investors ............11
2.2 Data and information used to assess the scientific and innovative output of top
corporate R&D investors ..............................................................................................13
2.3 Innovative output: the industrial perspective .........................................................17
2.4 Innovative output: the geographical perspective ...................................................20
3. On the shoulders of the giants: R&D investors 2012 vs 2016 .....................................24
3.1 Sectoral and geographical dynamics of top R&D investors ....................................24
3.2 The changing landscape of innovative activities ...................................................27
3.3 The new members of the ‘club’ ...........................................................................31
4. The variety of innovation activities ............................................................................36
4.1 Concentration of innovative competences by top R&D investors ............................36
4.2 Top competence areas by sector ........................................................................40
4.3 The digital competences of top R&D investors .....................................................44
5. Shaping AI development: The role of Top R&D investors ..........................................47
5.1 Top innovators in Artificial Intelligence.................................................................47
5.2 Innovative activities in AI: the industrial perspective .............................................51
5.3 Innovative activities in AI: the geographical perspective .......................................54
6. Organising innovation to mould the future ................................................................57
6.1 Leading the knowledge generation process .........................................................57
6.2 Bundling competences ......................................................................................60
6.3 The AI at work ..................................................................................................63
6.4 Organising the innovation network ......................................................................66
What’s next? .................................................................................................................69
References....................................................................................................................70
Appendix ......................................................................................................................73
Annex A - List of sectors, ISIC rev. 4 ..........................................................................73
Annex B - Definition of the ICT sector .......................................................................74
Annex C - Linking company data to IP data: a matching approach ................................75
Annex D - List of technological fields for patents.........................................................76
Annex E - List of Goods and Services for Trademarks ...................................................77
Annex F - List of All Science Journal Classification (ASJC) fields .....................................78
Annex G - Definition of ICT-related patents, designs and trademarks ..............................79
Annex H – Top two goods and services registered by sector, ISIC rev.4, 2014-16 ...............81

3
Highlights
#1 In 2016, top corporate R&D investors' headquarters and subsidiaries appear concentrated geographically. China, Germany,
the United Kingdom and the United States rank among the top five locations in terms of number of both headquarters and subsidiaries
#2 Companies in medium and high-tech sectors account for significant shares of the total workforce of top R&D investors, notably in ‘Computer and electronics’, ‘Transport equipment’ and ‘Machinery’
#3 ‘Computers and electronics’ and ‘Transport equipment’ appear among the top 5 sectors in terms of number of companies, R&D investment, patents, trademarks and scientific publications
#4 The top 2 000 corporate R&D investors own almost two thirds of
patents filed at the largest 5 IP offices worldwide; basic and applied research in AI represent a key area of their innovation activities
#5 In 2016, a large proportion of top patent and trademark owners are headquartered in Asian economies, while companies
based in the United States and in Europe lead in terms of scientific publications
#6 The degree of technological diversification varies across sectors, with firms in ‘IT services’ and ‘Telecommunications’ that
emerge among the most specialized
#7 Top 50 performers in terms of basic research, applied research, and products and services developments differ:
‘Computers and electronics’, ‘Machinery’ and ‘Wood and paper’ emerge as technological development-oriented sectors
‘Electricity, gas and steam’, ‘Pharmaceuticals’, and ‘Transport services’ are relatively more science oriented

4
#8 More than 80% of patents owned by ‘Scientific R&D’ sector protect technologies relating to Pharmaceuticals and Biotechnology,
suggesting a growing importance of (highly) specialised suppliers in medical sector. This is mainly driven by companies located in the
United States
#9 The distribution of registered trademarks confirms the
importance of developing digital related products for a wide spectrum of sectors
#10 The scientific publications of top corporate R&D investors focus on Engineering, Computer Science and Medicine
#11 Firms in business and transport services are among those
developing more radical inventions, whereas companies in ‘Pharmaceuticals’ produce a substantial number of highly-cited articles
#12 Compared to the year 2012, in 2016 pharmaceutical
companies increase their presence among the top 2000 corporate R&D investors, whereas the shares of companies in ‘Computers and
electronics’ decreases
#13 A marked increase emerges when comparing the number of
patents filed by corporate R&D investors in the ‘Transport equipment’ in 2012-14 and 2014-16, which suggesting a potential technological upgrading of the sector
#14 Compared to 2012, Japan and China appear to have broadened the number of technological fields in which they are
specializing, thus approaching the greater technological diversification exhibited by Europe and the United States
#15 Companies in ICT sector are responsible for most of the AI-related technological developments of top corporate R&D investors
worldwide: Most of these firms are located in Japan, China and Korea

5
#16 When it comes to Artificial Intelligence, top corporate R&D investors headquartered in Europe rank relatively higher in terms of
basic research than in terms of applied research and innovation or product and service development
#17 The development of AI-related patents is concentrated in few sectors: almost 50% of AI patents are filed by companies in 'Computers and electronics'. Services sectors also account for high shares of AI related patents
#18 ‘IT Services’ and 'Computers and electronics' account for about 70% of AI-related trademarks, while AI-related publications are
more evenly distributed across sectors
#19 AI–related scientific developments, measured in terms of scientific publications, are more widespread across sectors than applied research (patents) and product/service development (trademarks).
#20 'Transport equipment' companies appear particularly active when it comes to advancing the science base related to AI
#21 AI is associated with multiple technological fields, which
signals both its pervasiveness and its potential prominent impact. This is especially the case of scientific publications
#22 Patents, trademarks and scientific publications tell different stories about the geographical contribution to AI:
Patents in AI are mostly developed by inventors located in Asia
In terms of AI-related trademarks, Asian economies lose ground compared to the United States and the EU-28
Authors located in the United States produce the bulk of AI articles published by top corporate R&D investors

6
#23 International collaborations appear more common in publications than in patents. Furthermore, patents and publications
related to AI seem to rely on relatively larger (international) networks of authors or inventors than in the developments occurring in other scientific and technological fields
#24 The ‘Computer & electronic’ sector is the only one where international collaboration related to the development of AI
technologies is less frequent than for other technologies. In the ‘Other business services’, the share of AI-related patents developed by
international teams of inventors is particularly high
nnn
7
Introduction
1. Introduction
Artificial Intelligence (AI) is gaining
visibility on the agenda of businesses and
policy makers alike. The fast evolution of
digital technologies and their widespread
adoption has modified the way we interact,
generate new knowledge and organise
economies and societies. Mobility, cloud
computing, social networking, sensor-nets
and big data analytics are only some of the
forms that the digital economy is taking and
that are already part of our daily lives.
Machines performing human-like cognitive
functions (e.g. learning, understanding,
reasoning and interacting) – the core of what
is understood as artificial intelligence – have
the potential to further revolutionise our
economies and to contribute to tackle global
challenges related to health, transport and
the environment, among others (OECD,
2017).
While most seem to agree or understand
what AI is or does, and the term was already
coined in 1950, clearly delimiting its
boundaries is t an easy task. Measuring AI is
still in its infancy and different researchers
and institutions have recently proposed a
number of measurement frameworks (see,
for example, WIPO 2019, IPO 2019) which
differ along a number of dimensions. The
present report relies on the experimental
measurement framework developed by the
OECD in collaboration with the Max Plank
Institute and the OECD-led IP Statistics Task
Force (see Baruffaldi et al., 2019), which
proposes an operational definition of AI
encompassing both core developments and
key applications.
Recent advances in the field have in fact
fuelled the development of AI-related
applications, transforming all sectors, both
Information and Communication
Technologies (ICT) - and non-ICT ones, and
creating value that many are trying to
appropriate (Baruffaldi et al, 2019). AI is by
many considered as a technology that may
bring about a major technological shift like
the one triggered by the World Wide Web
(WIPO 2019, Craglia et al., 2018). As such,
AI is not only expected to have an impact on
the (technological) competitiveness of
economic actors, but also to change the way
people think, act and interact among each
other and with machines (Gomez et al.,
2018).
While discussing the possible impact of AI
on economies and societies is urgent, it
remains outside the scope of the present
work. Here the focus is on understanding the
role that top corporate R&D investors – which
represent key actors in the innovation space -
are playing in the development and use of
new technologies. In particular, the analysis
first offers a general view of the broad
technological and scientific knowledge
generated by these companies, to gradually
narrow down its focus and investigate top
corporate R&D investors’ innovative activities
related to AI.
This report builds on information related to
the sample of the 2000 world’s top R&D
investors in 2016 (Hernández et al., 2017).
These data are linked to other data related to
patents, trademarks and scientific
publications belonging to these companies,
to explore the new science, technologies and
products introduced by world leading
corporations in key markets. These are:
China, Europe, Japan, Korea and the United
States in the case of patents; Europe, Japan
and the United States in the case of
trademarks; the whole body of scientific
publications from the Elsevier’s Scopus®
database.
This report, in its third edition, is a result
of the long-lasting collaboration between the
Joint Research Centre (JRC) of the
European Commission (EC) and the
Organisation for Economic Co-operation and
Development (OECD). It reflects their joint
effort to provide up-to-date comparable data
and state-of-the-art indicators and analysis in
support of an evidence-base related to key
policy issues. The first-time data and
statistics on the innovation output of the
world's top corporate R&D investors
presented here aim to help shedding light on
the innovative strategies of top R&D
investors worldwide, and the way they
contribute to shape the development of future
technologies.
8
Introduction
The publicly available database
accompanying this report is meant to allow
for further analysis in support of evidence-
based industrial and innovation policies (see
What’s next section at the end of this report).
Some key stylised facts are already
presented in this introductory part of the
report, to set the scene.
World business R&D investments
are highly concentrated in a
relatively small number of
companies
In 2016, the top 2 000 R&D investors
companies worldwide accounted for
EUR 742 billion total annual R&D investment,
corresponding to more than 90 % of the total
business R&D investment of OECD
economies plus Argentina, China, Romania,
the Russian Federation, Singapore, South
Africa, and Chinese Taipei (the vast majority
of the world's business-funded R&D). In other
words, world business R&D investments are
very highly concentrated in a small number of
firms. Moreover, innovation activities also
appear concentrated within the sample of top
R&D investors.
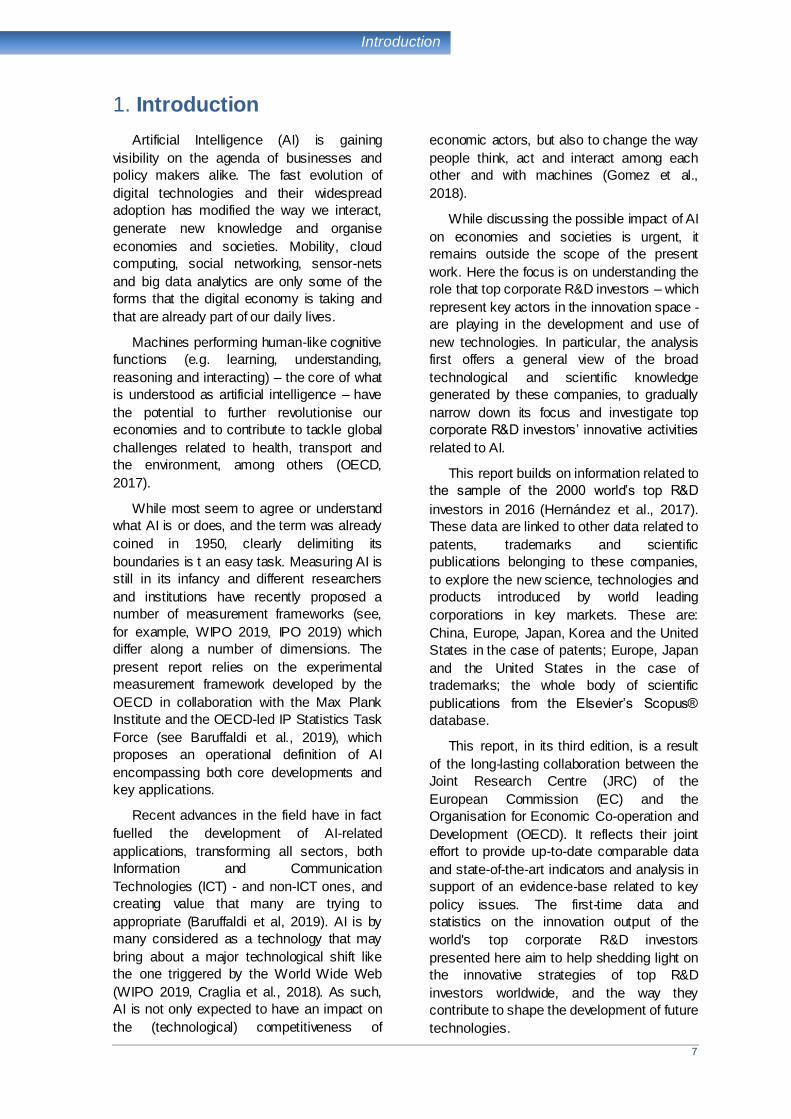
Figure 1.1 shows the cumulative share of
R&D investment, patents, scientific
publications and registered trademarks of top
corporate R&D investors ranked following
their investment in R&D. The cumulative
share of R&D investment increases sharply
until the 250th position. R&D investment,
patents and scientific publications follow
similar patterns, while trademarks appear
less concentrated within the sample. The top
250 firms account for about 72 % of total
R&D investment of the sample, 71 % of
publications, 65 % of patents and only 42 %
of registered trademarks.
Figure 1.1. R&D investment, publications and IP bundle
of the world’s top R&D investors, 2014-16 Cumulative percentage shares within the top 2000 R&D companies
Note: Data relate to companies in the top 2 000 corporate R&D sample, ranked by R&D investment in 2016. The IP
bundle refers to the number of patents and trademarks f iled in 2014-16, and owned by the top R&D companies, and the number of scientif ic articles are those published by authors aff iliated in the top R&D companies during the same time-period, using fractional counts. See Box 2.1 for further details on the coverage.
Source: JRC-OECD, COR&DIP© database v.2., 2019.
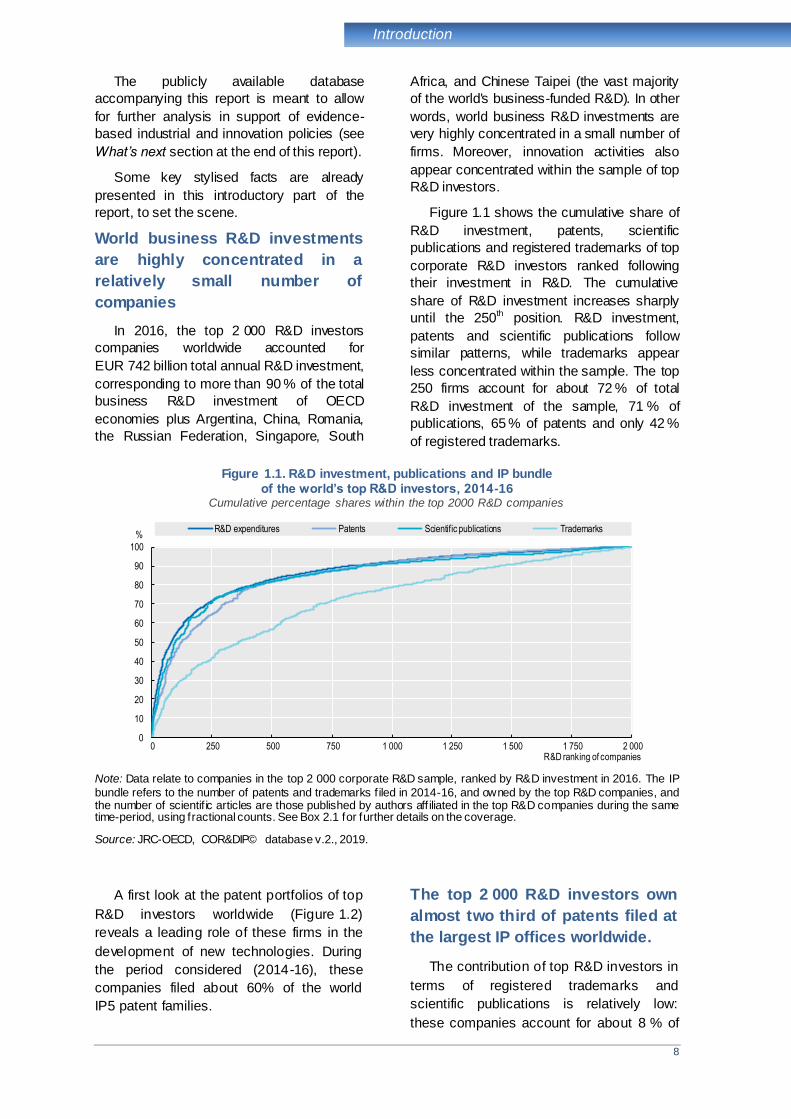
A first look at the patent portfolios of top
R&D investors worldwide (Figure 1.2)
reveals a leading role of these firms in the
development of new technologies. During
the period considered (2014-16), these
companies filed about 60% of the world
IP5 patent families.
The top 2 000 R&D investors own
almost two third of patents filed at
the largest IP offices worldwide.
The contribution of top R&D investors in
terms of registered trademarks and
scientific publications is relatively low:
these companies account for about 8 % of
0
10
20
30
40
50
60
70
80
90
100
0 250 500 750 1 000 1 250 1 500 1 750 2 000
%
R&D ranking of companies
R&D expenditures Patents Scientific publications Trademarks
9
Introduction
registered trademarks at the European
Union Intellectual Property Office (EUIPO),
the Japan Patent Office (JPO) and the
United States Patent and Trademark Office
(USPTO) altogether (respectively 11%,
13% and 6%) and 3% of scientific
publications. The low share of scientific
publications accounted for by these
companies is in line with what could be
expected given the leading role of
universities and other research institutions
in this respect.
Figure 1.2. Patents, trademarks and publications owned
by the world’s top R&D investors, 2014-16 As a percentage of total IP5 patents, trademarks and publications, respectively
Source: JRC-OECD, COR&DIP© database v.2., 2019.
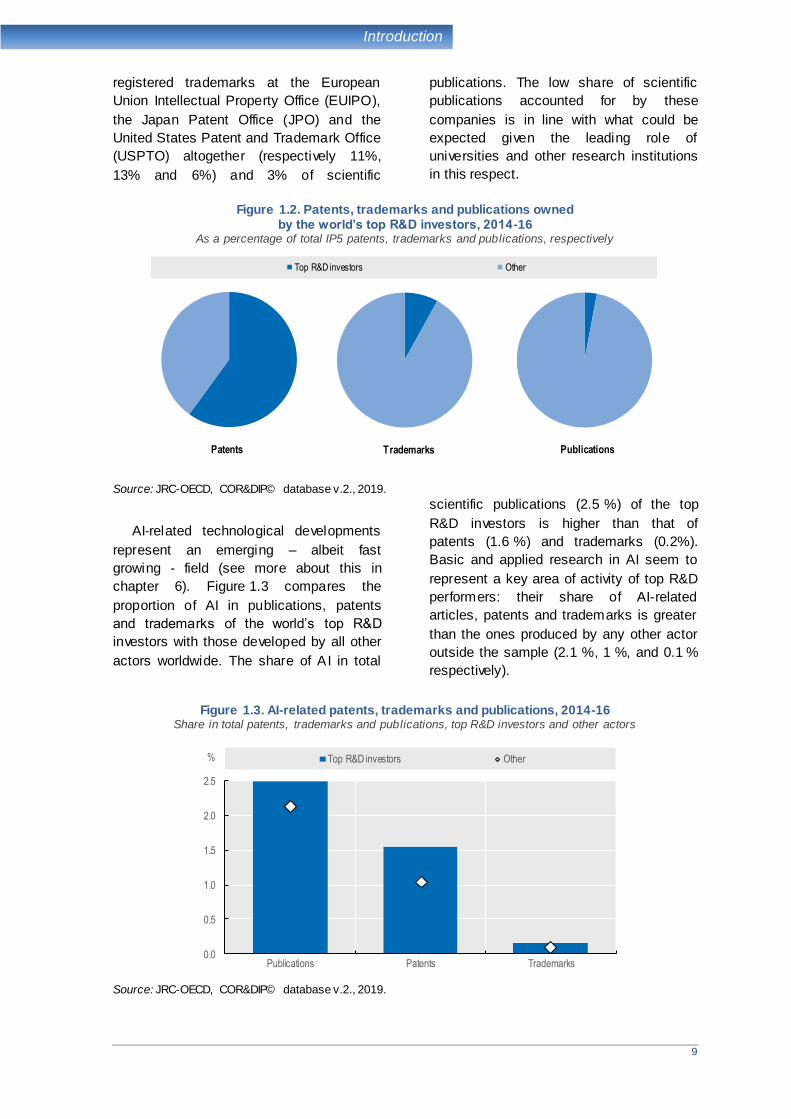
AI-related technological developments
represent an emerging – albeit fast
growing - field (see more about this in
chapter 6). Figure 1.3 compares the
proportion of AI in publications, patents
and trademarks of the world’s top R&D
investors with those developed by all other
actors worldwide. The share of AI in total
scientific publications (2.5 %) of the top
R&D investors is higher than that of
patents (1.6 %) and trademarks (0.2%).
Basic and applied research in AI seem to
represent a key area of activity of top R&D
performers: their share of AI-related
articles, patents and trademarks is greater
than the ones produced by any other actor
outside the sample (2.1 %, 1 %, and 0.1 %
respectively).
Figure 1.3. AI-related patents, trademarks and publications, 2014-16
Share in total patents, trademarks and publications, top R&D investors and other actors
Source: JRC-OECD, COR&DIP© database v.2., 2019.
Top R&D investors Other
Patents Trademarks Publications
0.0
0.5
1.0
1.5
2.0
2.5
Publications Patents Trademarks
% Top R&D investors Other

10
Introduction
The reminder of this publication is
articulated as follows:
Section 2 offers an overview of the
geographical distribution of the top
corporate R&D investors worldwide and of
the top 50 innovative companies, and their
ranking in terms of scientific and innovative
output. The analysis then moves to the
sector level to show the contribution of
different sectors to the overall production of
patents, trademarks and publications.
Evidence about the geographical and
industrial specificities emerging across
economies complements the picture.
Section 3 looks at the extent to which
top R&D investors and their innovative
activities have changed between 2012 and
2016. It compares the sample of top R&D
investors in 2016 with that of 2012,
focusing especially on the industrial and
geographical differences that emerge. The
final part of the chapter zooms into top
corporate R&D investors that entered in or
exited from the sample across the two
waves.
Section 4 investigates the innovative
competences on which the top corporate
R&D investors rely. It first assesses the
level of concentration in terms of scientific
and technological competences and
whether companies’ knowledge develops
in relation to well-defined core sets. The
analysis allows the sector-specific
competences of the top corporate R&D
investors to be uncovered. It is
complemented by a final focus on
information and communication
technologies (ICT)-related activities.
Section 5 examines the AI-related
innovation activities of top corporate R&D
investors worldwide. It further focuses on
the top 50 companies contributing the most
to AI developments, in terms of scientific
publications, patents and trademarks. The
analysis then moves to the sectoral and
geographical level, to provide specific
evidence along these two dimensions.
The final Section 6 sheds light on the
way top R&D investors combine their
knowledge port folio. It first investigates the
radicalness of technologies and the
“quality” of the scientific outputs produced
by the top R&D investors worldwide. In a
second stage, the way these companies
bundle basic and applied research
(science and technology) is explored.
Finally, a closer look is given at the
pervasiveness and potential impact of the
innovation activities related to AI.

11
The anatomy of innovative activities
2. The anatomy of innovative activities
2.1 The corporate structure and
geographical distribution of top R&D investors
To understand innovation dynamics in
the knowledge economy in the era of
global value chains, we need to take a
global perspective (Archibugi and
Iammarino, 2002).
Companies, particularly multinational
corporations (MNCs), may locate research
facilities abroad to tap into new or different
repositories of knowledge and capabilities,
e.g. to complement their in-house
technological activities, or to be able to
better meet local demand and needs (Rilla
and Squicciarini, 2011; Chung and Alcácer,
2002). This often translates into a
geographical dispersion of multinationals’
activities, and into research and
development (R&D) activities being
performed in certain countries or specific
locations, while other activities are
performed elsewhere. This is due to a
number of endogenous and exogenous
factors, and is shaped by herding
behaviours and by local characteristics
such as academic specialisation
(Contractor et al., 2010; Belderbos et al.,
2014; Santos‐Paulino et al., 2014).
Tapping into a diversified array of
scientific and technological contexts and
competences, and meeting diverse
consumer preferences and needs, enables
MNCs to acquire and generate context-
specific knowledge. This can be integrated
within the broader organisation, and may
lead to increased productivity and
enhanced innovative capabilities (Zanfei,
2000; Castellani et al., 2017).
This section looks at the geographical
location of the world’s top 2 000 corporate
R&D investors in 2016 (Hernández et al.,
2017). These firms are either independent
companies or mother companies of a
number of subsidiaries or affiliates. The
subsidiaries considered in this report are
firms owned at least 50 % by the mother
company in the sample. Altogether, almost
600 000 companies worldwide appear to
belong to the world’s top 2 000 corporate
R&D investors.
Top corporate R&D investors
worldwide are geographically
concentrated: about three out of
four are headquartered in only five
economies
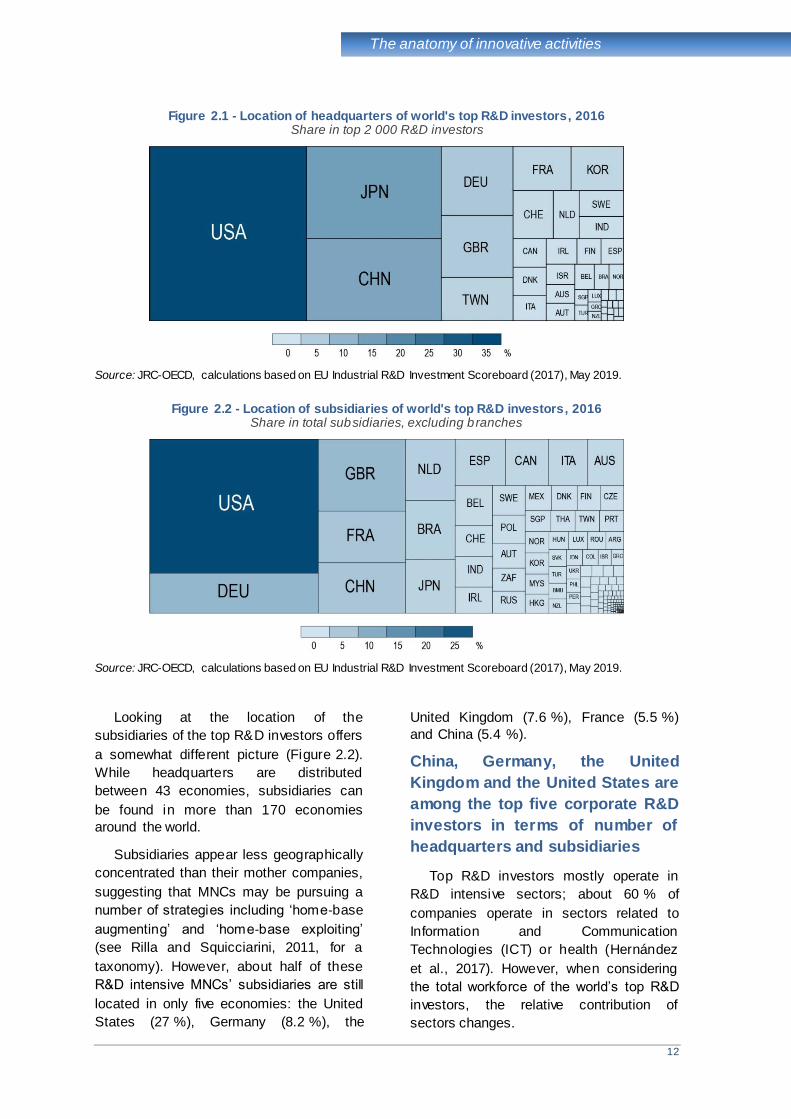
Figure 2.1 shows the share of the
world’s top 2 000 R&D investors according
to location of the corporate headquarters.
In 2016, approximately 73 % of the top
R&D investors (1 458 companies) had their
headquarters located in only five
economies: the United States (33 %),
Japan (15 %), China (13 %), Germany
(6 %) and the United Kingdom (5.4 %).
Another 14 % of companies were
headquartered in Chinese Taipei, France,
Korea, Switzerland and the Netherlands.
This chapter offers an overview of the geographical distribution of the top corporate R&D investors
worldwide, both in location of the headquarters and in the way subsidiaries are distributed around
the globe. Additional information is provided about the top 50 innovating companies, and their
rank ing in terms of scientific and innovative output, with comparisons based on patent, trademark
and publication-related data. The analysis then moves from the firm to the industry level, and
shows the contribution of different sectors to the overall production of patents, trademarks and
publications. This broad overview of the anatomy of innovative activities of top corporate R&D
investors worldwide is completed by evidence about the geographical and industrial specificities
emerging across economies worldwide.
12
The anatomy of innovative activities
Figure 2.1 - Location of headquarters of world's top R&D investors, 2016 Share in top 2 000 R&D investors
Source: JRC-OECD, calculations based on EU Industrial R&D Investment Scoreboard (2017), May 2019.
Figure 2.2 - Location of subsidiaries of world's top R&D investors, 2016 Share in total subsidiaries, excluding branches
Source: JRC-OECD, calculations based on EU Industrial R&D Investment Scoreboard (2017), May 2019.
Looking at the location of the
subsidiaries of the top R&D investors offers
a somewhat different picture (Figure 2.2).
While headquarters are distributed
between 43 economies, subsidiaries can
be found in more than 170 economies
around the world.
Subsidiaries appear less geographically
concentrated than their mother companies,
suggesting that MNCs may be pursuing a
number of strategies including ‘home‐base
augmenting’ and ‘home‐base exploiting’
(see Rilla and Squicciarini, 2011, for a
taxonomy). However, about half of these
R&D intensive MNCs’ subsidiaries are still
located in only five economies: the United
States (27 %), Germany (8.2 %), the
United Kingdom (7.6 %), France (5.5 %)
and China (5.4 %).
China, Germany, the United
Kingdom and the United States are
among the top five corporate R&D
investors in terms of number of
headquarters and subsidiaries
Top R&D investors mostly operate in
R&D intensive sectors; about 60 % of
companies operate in sectors related to
Information and Communication
Technologies (ICT) or health (Hernández
et al., 2017). However, when considering
the total workforce of the world’s top R&D
investors, the relative contribution of
sectors changes.
13
The anatomy of innovative activities
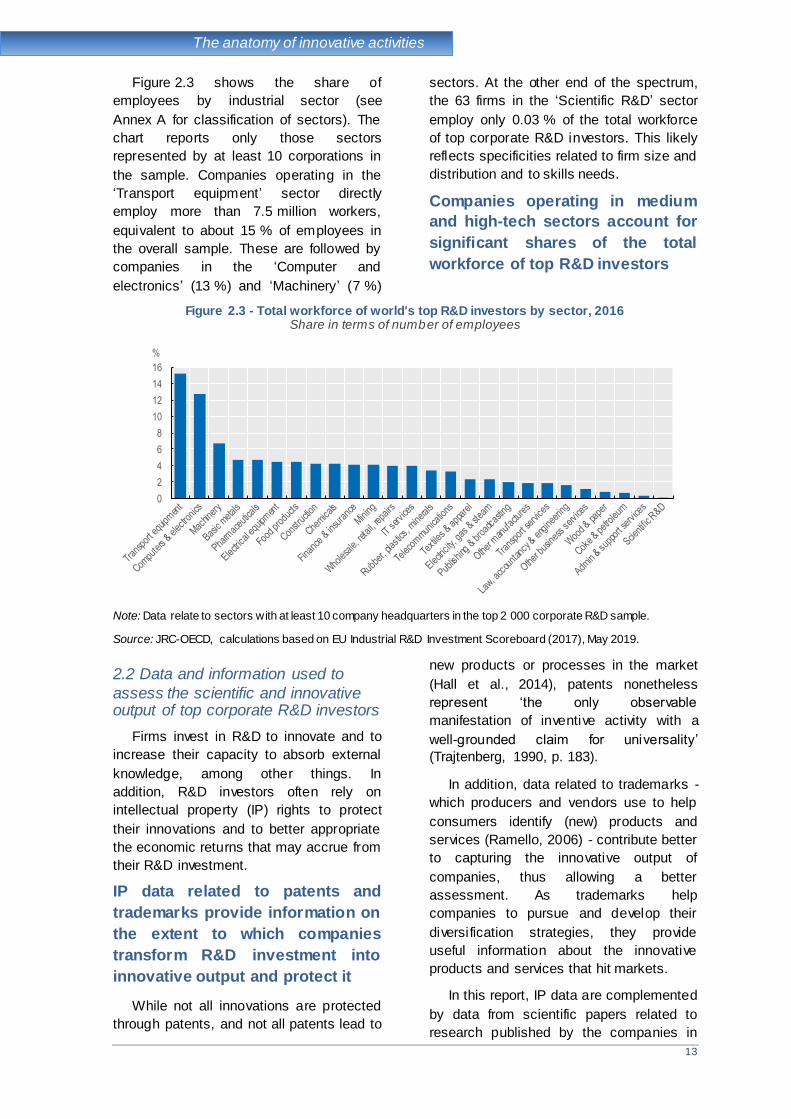
Figure 2.3 shows the share of
employees by industrial sector (see
Annex A for classification of sectors). The
chart reports only those sectors
represented by at least 10 corporations in
the sample. Companies operating in the
‘Transport equipment’ sector directly
employ more than 7.5 million workers,
equivalent to about 15 % of employees in
the overall sample. These are followed by
companies in the ‘Computer and
electronics’ (13 %) and ‘Machinery’ (7 %)
sectors. At the other end of the spectrum,
the 63 firms in the ‘Scientific R&D’ sector
employ only 0.03 % of the total workforce
of top corporate R&D investors. This likely
reflects specificities related to firm size and
distribution and to skills needs.
Companies operating in medium
and high-tech sectors account for
significant shares of the total
workforce of top R&D investors
Figure 2.3 - Total workforce of world's top R&D investors by sector, 2016 Share in terms of number of employees
Note: Data relate to sectors with at least 10 company headquarters in the top 2 000 corporate R&D sample.
Source: JRC-OECD, calculations based on EU Industrial R&D Investment Scoreboard (2017), May 2019.
2.2 Data and information used to
assess the scientific and innovative output of top corporate R&D investors
Firms invest in R&D to innovate and to
increase their capacity to absorb external
knowledge, among other things. In
addition, R&D investors often rely on
intellectual property (IP) rights to protect
their innovations and to better appropriate
the economic returns that may accrue from
their R&D investment.
IP data related to patents and
trademarks provide information on
the extent to which companies
transform R&D investment into
innovative output and protect it
While not all innovations are protected
through patents, and not all patents lead to
new products or processes in the market
(Hall et al., 2014), patents nonetheless
represent ‘the only observable
manifestation of inventive activity with a
well-grounded claim for universality’
(Trajtenberg, 1990, p. 183).
In addition, data related to trademarks -
which producers and vendors use to help
consumers identify (new) products and
services (Ramello, 2006) - contribute better
to capturing the innovative output of
companies, thus allowing a better
assessment. As trademarks help
companies to pursue and develop their
diversification strategies, they provide
useful information about the innovative
products and services that hit markets.
In this report, IP data are complemented
by data from scientific papers related to
research published by the companies in
0
2
4
6
8
10
12
14
16
%
14
The anatomy of innovative activities
the sample; both headquarters and
affiliates (see Box 2.1 for further details on
coverage of IP data and publications).
Box 2.1. IP assets and scientific publications of the top R&D investors 2016: patents, trademarks and scientific publications
Patents
To better reflect the inventive activ ities of top corporate R&D investors w orldw ide, the statistics presented
here are based on families of patent applications f iled at the f ive largest IP off ices (IP5):* the European
Patent Office (EPO), the Japan Patent Office (JPO), the Korean Intellectual Property Office (KIPO), the
State Intellectual Property Office of the People's Republic of China (CNIPA) and the United States Patent
and Trademark Office (USPTO). The definition of IP5 patent families relates to families of patent
applications w ith members f iled in at least one of the IP5, provided that another family member has been
filed in any other off ice w orldw ide (see Dernis et al., 2015 and Daiko et al., 2017 for further discussion
about the use of IP5 families). Families are reported according to the earliest f iling date. The International
Patent Classif ication ( IPC) is used to allocate patents to technological f ields (see
http://w w w.wipo.int/classif ications/ipc and Annex D).
Trademarks portfolio
Data on trademark applications relate to trademarks registered at the European Union Intellectual Property
Office (EUIPO), the JPO and the USPTO. The EUIPO administers EU trademarks (EUTMs, former ly
know n as Community trademarks, CTMs), w hich are valid throughout the European Union and coexist w ith
nationally granted trademarks. The JPO and the USPTO guarantee protection on their national markets only. For more details on USPTO trademark data, see Graham et al. (2013). Trademarks are f iled in
accordance w ith the International Classif ication of Goods and Services, also know n as the Nice
Classif ication (see https://w w w.wipo.int/classif ications/nice/en, and Annex E).
Publications
The bibliometric data are based on Elsevier’s Scopus® database, an abstract and citation database for
peer-review ed literature, w hich includes scientif ic journals, books and conference proceedings. Elsevier
assigns each journal in Scopus to one or more subjects using its All Science and Journal C lassif ication
(ASJC). There are 27 main f ields compris ing 334 subjects in the classif ication, reported in Annex F of this
report. Publication f igures include only articles, review s and conference proceedings.
Analysis period
Statistics on IP rights refer to patents or trademark applications f iled in 2014-16, and ow ned by the top
2 000 R&D investors as w ell as their subsidiar ies, based on the corporate structure reported at the end of
2016. The same applies for the publications, w here only articles published in 2014-16 are considered.
For this report, it is assumed that the corporate structure of top R&D performers over the tw o years
preceding 2016 (i.e. 2014-15) w ere suff iciently similar to that observed in 2016, and that statist ics based on
the three-year period 2014-16 provide an accurate enough picture of the companies' IP and publishing
activities. This could not be assumed if longer timeframes w ere to be considered.
Furthermore, unless otherw ise specif ied, statistics are compiled using fractional counts.
* The IP5 is a forum of the five largest intellectual property offices in the world that was set up to improve the efficiency of the examination process for patents worldwide. The IP5 offices together handle about 90 per cent of the world's patent applications. See http://www.fiveipoffices.org.

15
The anatomy of innovative activities
Publishing represents a means to
connect with research, to attract
and display talent, and to signal
scientific capabilities to the
external world
While the contribution to science and
scientific literature is not directly linked to
(the protection of) innovation, it
nevertheless mirrors firms’ engagement in
the creation of new knowledge and in
innovative activities. Engaging in scientific
publications offers firms learning
opportunities and access to knowledge
available in the academic community. It
may further enhance companies’
reputation and their attractiveness,
especially when in search for the best
talent. In some cases, it may help in
obtaining approval for its innovative
products, e.g. for new drugs in the
‘Pharmaceuticals’ sector (see e.g. Hicks,
1995).
Figures 2.4, 2.5 and 2.6 show the top
patenting, trademarking and publishing
companies among the 2 000 companies
that invested the most in R&D in 2016. IP
and publication data refer to the 2014-16
period.
Figure 2.4. Top 50 patenting companies, 2014-16 IP5 patent families
Note: ICT-related companies are show n in darker blue.
Source: JRC-OECD, COR&DIP© database v.2., 2019.
In particular, Figure 2.4 shows the
top 50 patenting companies in terms of IP5
families. The size of the font used to
display companies’ name is proportional to
the share of their patent portfolio in the
overall patent portfolio of the top R&D
investors worldwide. In addition, the name
of companies in the ICT sector 1 is
displayed in dark blue.
Among the top 50 patent
assignees, the majority have
headquarters in Asia
Out of the 50 top patenting companies,
20 corporations are based in Japan, 6 are
Korean, and 4 are located in China or in
1 ICT-related sectors are defined in Annex C.
Chinese Taipei. Of the remaining top 50
patent assignees, 11 are headquartered in
the United States and 9 in Europe. These
results are in line with previous findings on
top corporate R&D investors worldwide
(Dernis et al., 2015; Daiko et al., 2017),
and confirm the increasing importance of
Asian corporations in the global R&D
landscape.
Samsung Electronics has the largest
patent port folio, owning more than 6 % of
the whole IP5 patent portfolio of the top
2 000 R&D investors worldwide. The
podium is completed by Canon and by
BOE Technology Group, which strongly
increased its patenting activities since the
last edition of the report.
16
The anatomy of innovative activities
The importance of ICT sector in overall
patenting activities stands out clearly.
Almost half of the top 50 patenting
companies operate in these sectors, mainly
in the ‘Computers and electronics’ sector.
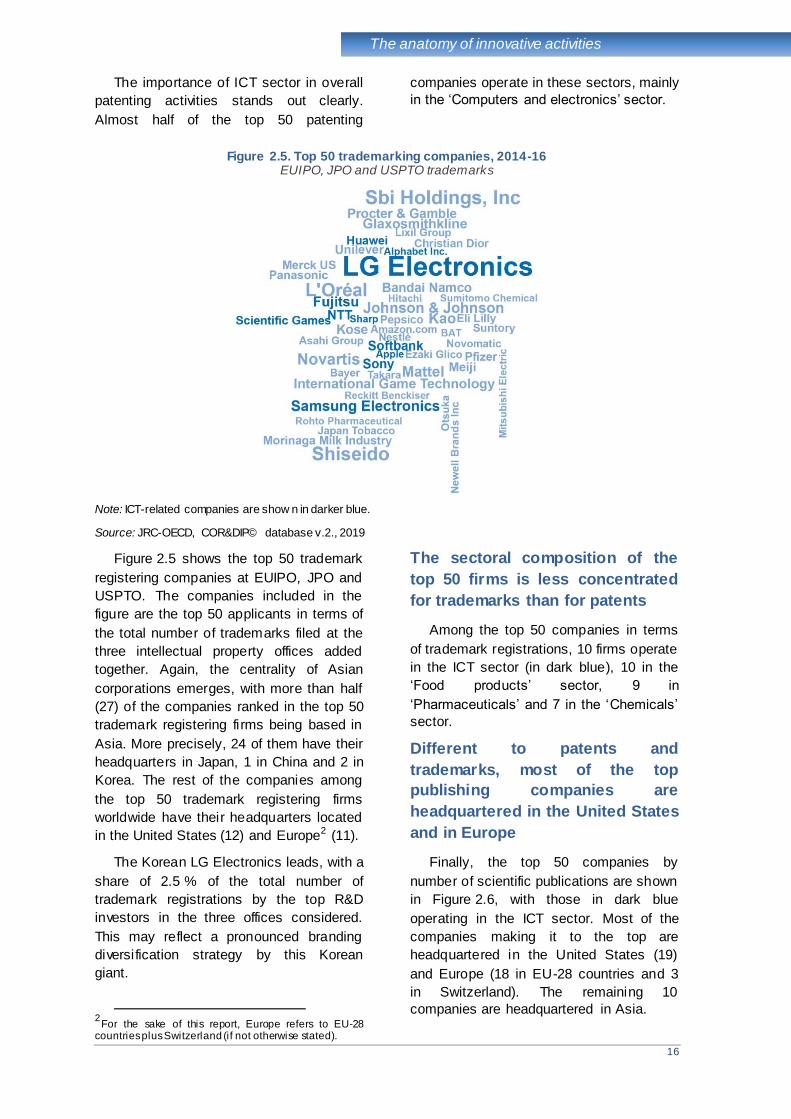
Figure 2.5. Top 50 trademarking companies, 2014-16 EUIPO, JPO and USPTO trademarks
Note: ICT-related companies are show n in darker blue.
Source: JRC-OECD, COR&DIP© database v.2., 2019
Figure 2.5 shows the top 50 trademark
registering companies at EUIPO, JPO and
USPTO. The companies included in the
figure are the top 50 applicants in terms of
the total number of trademarks filed at the
three intellectual property offices added
together. Again, the centrality of Asian
corporations emerges, with more than half
(27) of the companies ranked in the top 50
trademark registering firms being based in
Asia. More precisely, 24 of them have their
headquarters in Japan, 1 in China and 2 in
Korea. The rest of the companies among
the top 50 trademark registering firms
worldwide have their headquarters located
in the United States (12) and Europe2 (11).
The Korean LG Electronics leads, with a
share of 2.5 % of the total number of
trademark registrations by the top R&D
investors in the three offices considered.
This may reflect a pronounced branding
diversification strategy by this Korean
giant.
2
For the sake of this report, Europe refers to EU-28 countries plus Switzerland (if not otherwise stated).
The sectoral composition of the
top 50 firms is less concentrated
for trademarks than for patents
Among the top 50 companies in terms
of trademark registrations, 10 firms operate
in the ICT sector (in dark blue), 10 in the
‘Food products’ sector, 9 in
‘Pharmaceuticals’ and 7 in the ‘Chemicals’
sector.
Different to patents and
trademarks, most of the top
publishing companies are
headquartered in the United States
and in Europe
Finally, the top 50 companies by
number of scientific publications are shown
in Figure 2.6, with those in dark blue
operating in the ICT sector. Most of the
companies making it to the top are
headquartered in the United States (19)
and Europe (18 in EU-28 countries and 3
in Switzerland). The remaining 10
companies are headquartered in Asia.
17
The anatomy of innovative activities
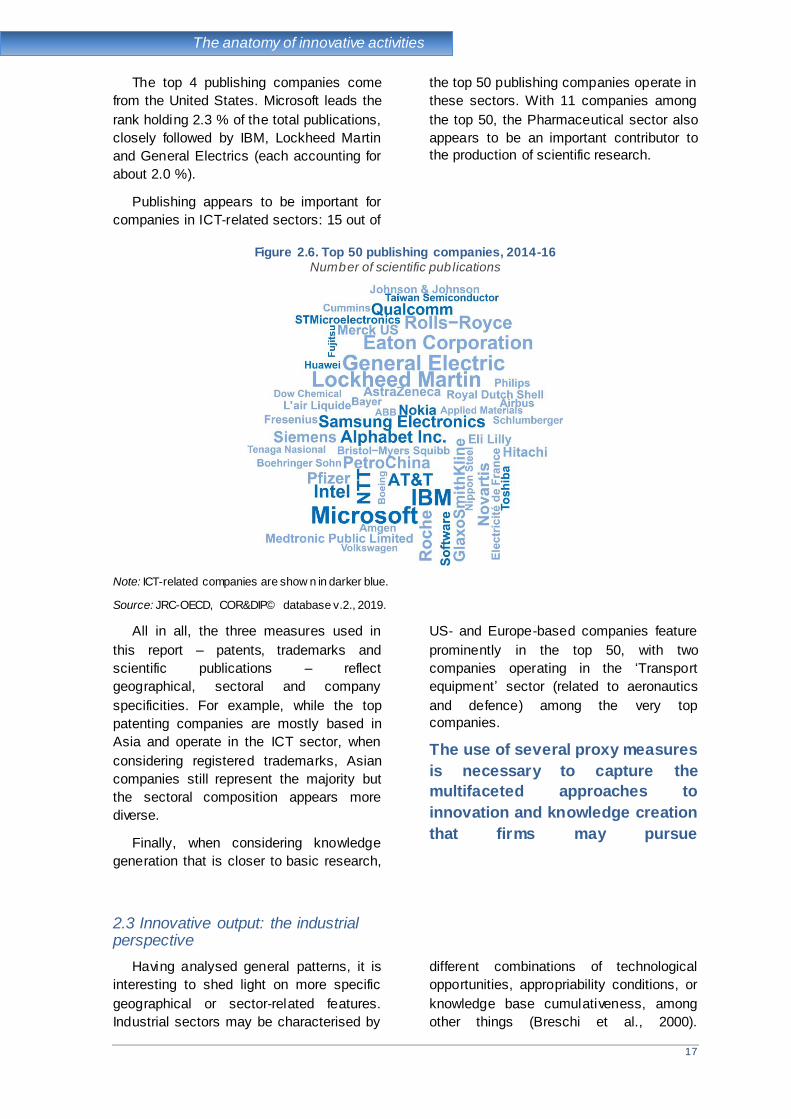
The top 4 publishing companies come
from the United States. Microsoft leads the
rank holding 2.3 % of the total publications,
closely followed by IBM, Lockheed Martin
and General Electrics (each accounting for
about 2.0 %).
Publishing appears to be important for
companies in ICT-related sectors: 15 out of
the top 50 publishing companies operate in
these sectors. With 11 companies among
the top 50, the Pharmaceutical sector also
appears to be an important contributor to
the production of scientific research.
Figure 2.6. Top 50 publishing companies, 2014-16 Number of scientific publications
Note: ICT-related companies are show n in darker blue.
Source: JRC-OECD, COR&DIP© database v.2., 2019.
All in all, the three measures used in
this report – patents, trademarks and
scientific publications – reflect
geographical, sectoral and company
specificities. For example, while the top
patenting companies are mostly based in
Asia and operate in the ICT sector, when
considering registered trademarks, Asian
companies still represent the majority but
the sectoral composition appears more
diverse.
Finally, when considering knowledge
generation that is closer to basic research,
US- and Europe-based companies feature
prominently in the top 50, with two
companies operating in the ‘Transport
equipment’ sector (related to aeronautics
and defence) among the very top
companies.
The use of several proxy measures
is necessary to capture the
multifaceted approaches to
innovation and knowledge creation
that firms may pursue
2.3 Innovative output: the industrial perspective
Having analysed general patterns, it is
interesting to shed light on more specific
geographical or sector-related features.
Industrial sectors may be characterised by
different combinations of technological
opportunities, appropriability conditions, or
knowledge base cumulativeness, among
other things (Breschi et al., 2000).
18
The anatomy of innovative activities
Companies’ innovative activities are partly
determined by the interplay of these
components, which concur to define the
dominant mode of innovating within a
sector (known as technological regimes
Dosi, 1982).
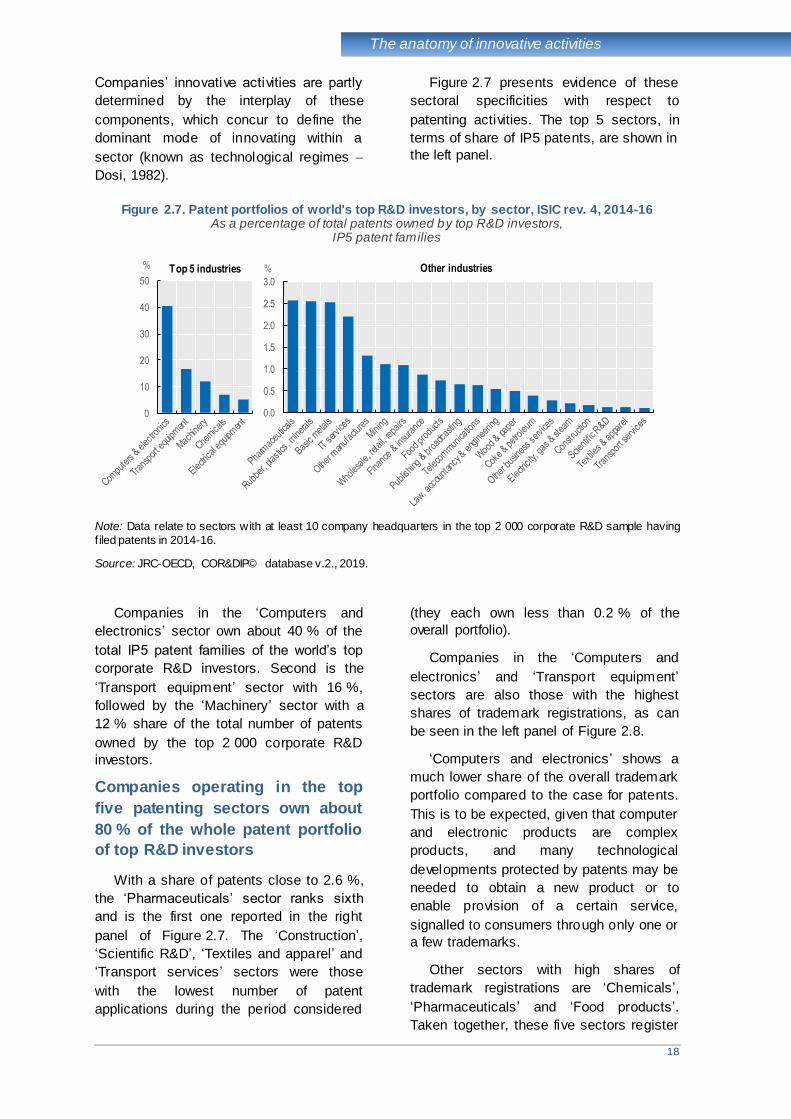
Figure 2.7 presents evidence of these
sectoral specificities with respect to
patenting activities. The top 5 sectors, in
terms of share of IP5 patents, are shown in
the left panel.
Figure 2.7. Patent portfolios of world's top R&D investors, by sector, ISIC rev. 4, 2014-16 As a percentage of total patents owned by top R&D investors,
IP5 patent families
Note: Data relate to sectors with at least 10 company headquarters in the top 2 000 corporate R&D sample having
f iled patents in 2014-16.
Source: JRC-OECD, COR&DIP© database v.2., 2019.
Companies in the ‘Computers and
electronics’ sector own about 40 % of the
total IP5 patent families of the world’s top
corporate R&D investors. Second is the
‘Transport equipment’ sector with 16 %,
followed by the ‘Machinery’ sector with a
12 % share of the total number of patents
owned by the top 2 000 corporate R&D
investors.
Companies operating in the top
five patenting sectors own about
80 % of the whole patent portfolio
of top R&D investors
With a share of patents close to 2.6 %,
the ‘Pharmaceuticals’ sector ranks sixth
and is the first one reported in the right
panel of Figure 2.7. The ‘Construction’,
‘Scientific R&D’, ‘Textiles and apparel’ and
‘Transport services’ sectors were those
with the lowest number of patent
applications during the period considered
(they each own less than 0.2 % of the
overall portfolio).
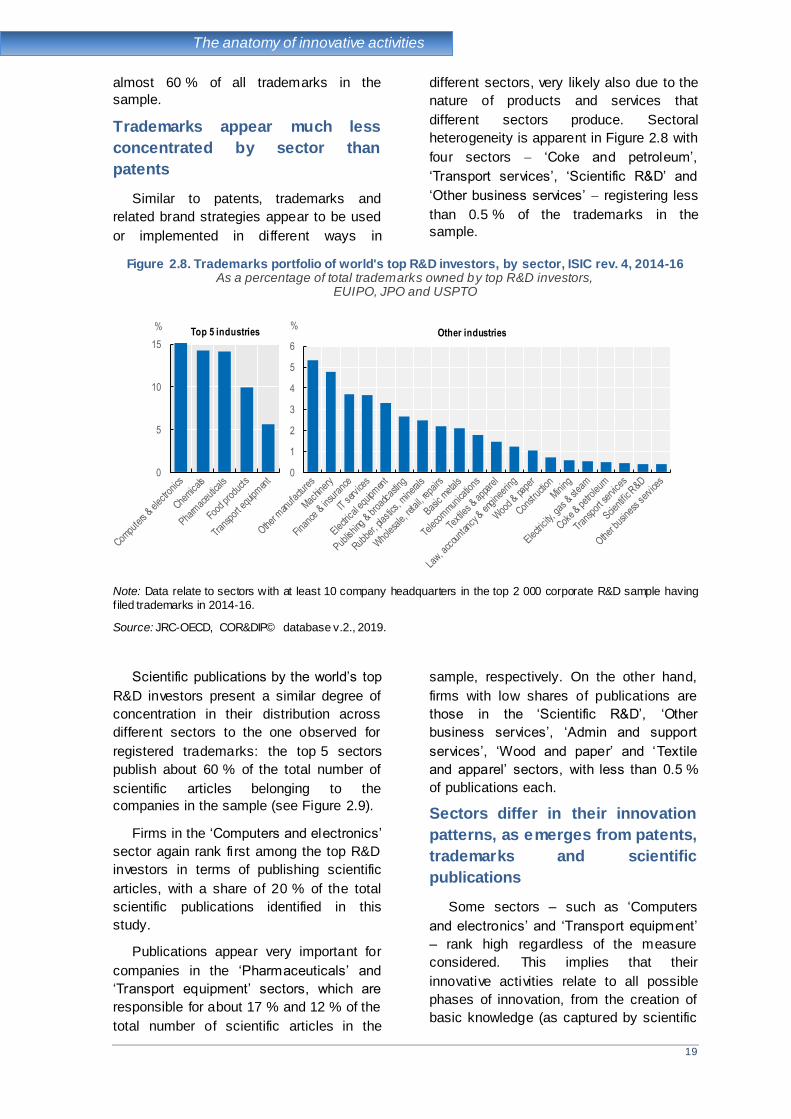
Companies in the ‘Computers and
electronics’ and ‘Transport equipment’
sectors are also those with the highest
shares of trademark registrations, as can
be seen in the left panel of Figure 2.8.
‘Computers and electronics ’ shows a
much lower share of the overall trademark
portfolio compared to the case for patents.
This is to be expected, given that computer
and electronic products are complex
products, and many technological
developments protected by patents may be
needed to obtain a new product or to
enable provision of a certain service,
signalled to consumers through only one or
a few trademarks.
Other sectors with high shares of
trademark registrations are ‘Chemicals’,
‘Pharmaceuticals’ and ‘Food products’.
Taken together, these five sectors register
0
10
20
30
40
50
% Top 5 industries
0.0
0.5
1.0
1.5
2.0
2.5
3.0
% Other industries
19
The anatomy of innovative activities
almost 60 % of all trademarks in the
sample.
Trademarks appear much less
concentrated by sector than
patents
Similar to patents, trademarks and
related brand strategies appear to be used
or implemented in different ways in
different sectors, very likely also due to the
nature of products and services that
different sectors produce. Sectoral
heterogeneity is apparent in Figure 2.8 with
four sectors ‘Coke and petroleum’,
‘Transport services’, ‘Scientific R&D’ and
‘Other business services’ registering less
than 0.5 % of the trademarks in the
sample.
Figure 2.8. Trademarks portfolio of world's top R&D investors, by sector, ISIC rev. 4, 2014-16 As a percentage of total trademarks owned by top R&D investors,
EUIPO, JPO and USPTO
Note: Data relate to sectors with at least 10 company headquarters in the top 2 000 corporate R&D sample having
f iled trademarks in 2014-16.
Source: JRC-OECD, COR&DIP© database v.2., 2019.
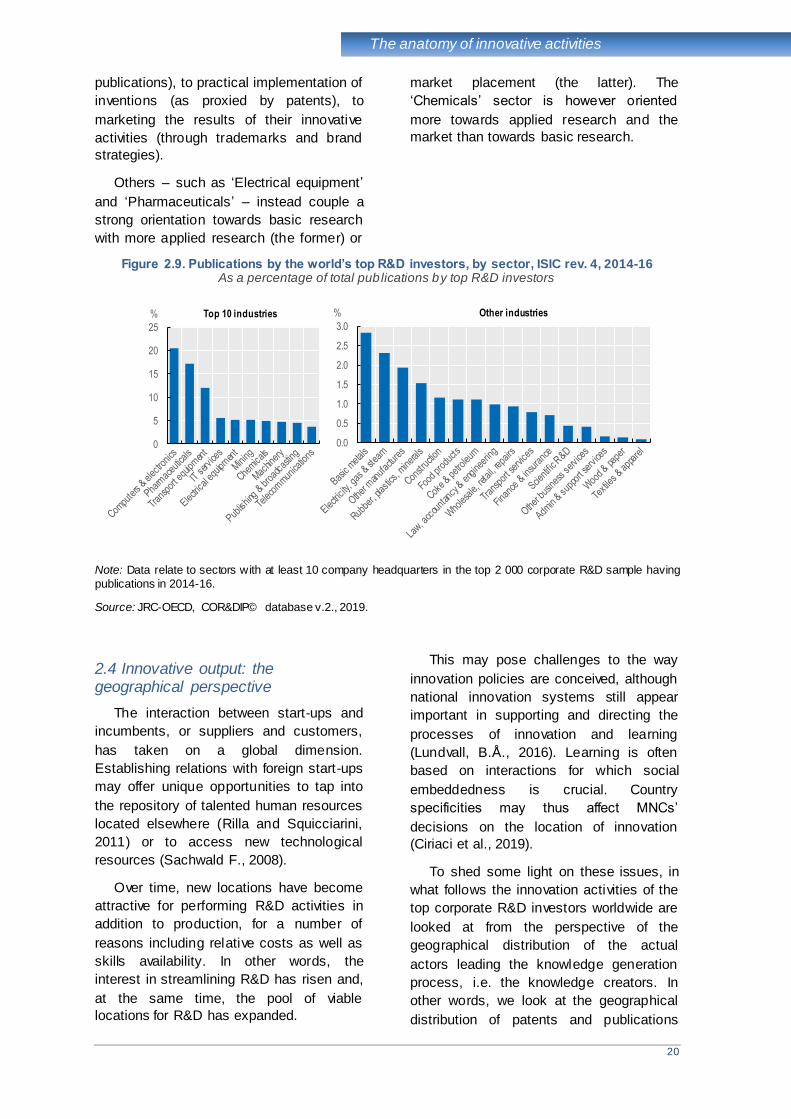
Scientific publications by the world’s top
R&D investors present a similar degree of
concentration in their distribution across
different sectors to the one observed for
registered trademarks: the top 5 sectors
publish about 60 % of the total number of
scientific articles belonging to the
companies in the sample (see Figure 2.9).
Firms in the ‘Computers and electronics’
sector again rank first among the top R&D
investors in terms of publishing scientific
articles, with a share of 20 % of the total
scientific publications identified in this
study.
Publications appear very important for
companies in the ‘Pharmaceuticals’ and
‘Transport equipment’ sectors, which are
responsible for about 17 % and 12 % of the
total number of scientific articles in the
sample, respectively. On the other hand,
firms with low shares of publications are
those in the ‘Scientific R&D’, ‘Other
business services’, ‘Admin and support
services’, ‘Wood and paper’ and ‘Textile
and apparel’ sectors, with less than 0.5 %
of publications each.
Sectors differ in their innovation
patterns, as emerges from patents,
trademarks and scientific
publications
Some sectors – such as ‘Computers
and electronics’ and ‘Transport equipment’
– rank high regardless of the measure
considered. This implies that their
innovative activities relate to all possible
phases of innovation, from the creation of
basic knowledge (as captured by scientific
0
5
10
15
%Top 5 industries
0
1
2
3
4
5
6
%Other industries
20
The anatomy of innovative activities
publications), to practical implementation of
inventions (as proxied by patents), to
marketing the results of their innovative
activities (through trademarks and brand
strategies).
Others – such as ‘Electrical equipment’
and ‘Pharmaceuticals’ – instead couple a
strong orientation towards basic research
with more applied research (the former) or
market placement (the latter). The
‘Chemicals’ sector is however oriented
more towards applied research and the
market than towards basic research.
Figure 2.9. Publications by the world’s top R&D investors, by sector, ISIC rev. 4, 2014-16 As a percentage of total publications by top R&D investors
Note: Data relate to sectors with at least 10 company headquarters in the top 2 000 corporate R&D sample having
publications in 2014-16.
Source: JRC-OECD, COR&DIP© database v.2., 2019.
2.4 Innovative output: the geographical perspective
The interaction between start-ups and
incumbents, or suppliers and customers,
has taken on a global dimension.
Establishing relations with foreign start-ups
may offer unique opportunities to tap into
the repository of talented human resources
located elsewhere (Rilla and Squicciarini,
2011) or to access new technological
resources (Sachwald F., 2008).
Over time, new locations have become
attractive for performing R&D activities in
addition to production, for a number of
reasons including relative costs as well as
skills availability. In other words, the
interest in streamlining R&D has risen and,
at the same time, the pool of viable
locations for R&D has expanded.
This may pose challenges to the way
innovation policies are conceived, although
national innovation systems still appear
important in supporting and directing the
processes of innovation and learning
(Lundvall, B.Å., 2016). Learning is often
based on interactions for which social
embeddedness is crucial. Country
specificities may thus affect MNCs’
decisions on the location of innovation
(Ciriaci et al., 2019).
To shed some light on these issues, in
what follows the innovation activities of the
top corporate R&D investors worldwide are
looked at from the perspective of the
geographical distribution of the actual
actors leading the knowledge generation
process, i.e. the knowledge creators. In
other words, we look at the geographical
distribution of patents and publications
0
5
10
15
20
25
% Top 10 industries
0.0
0.5
1.0
1.5
2.0
2.5
3.0
% Other industries
21
The anatomy of innovative activities
according to the location of inventors and
authors, respectively. This is unfortunately
not possible in the case of trademarks, due
to lack of relevant information, so the
trademark-related analysis looks at
trademark applicants.
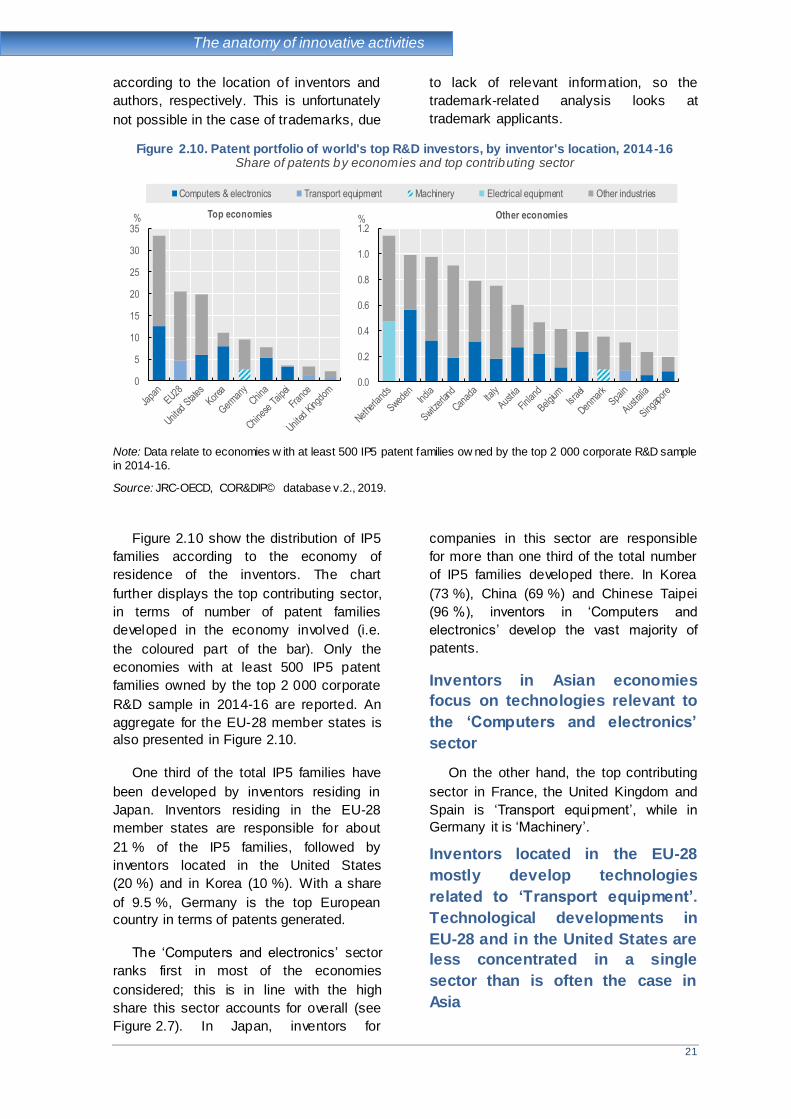
Figure 2.10. Patent portfolio of world's top R&D investors, by inventor's location, 2014-16 Share of patents by economies and top contributing sector
Note: Data relate to economies w ith at least 500 IP5 patent families ow ned by the top 2 000 corporate R&D sample
in 2014-16.
Source: JRC-OECD, COR&DIP© database v.2., 2019.
Figure 2.10 show the distribution of IP5
families according to the economy of
residence of the inventors. The chart
further displays the top contributing sector,
in terms of number of patent families
developed in the economy involved (i.e.
the coloured part of the bar). Only the
economies with at least 500 IP5 patent
families owned by the top 2 000 corporate
R&D sample in 2014-16 are reported. An
aggregate for the EU-28 member states is
also presented in Figure 2.10.
One third of the total IP5 families have
been developed by inventors residing in
Japan. Inventors residing in the EU-28
member states are responsible for about
21 % of the IP5 families, followed by
inventors located in the United States
(20 %) and in Korea (10 %). With a share
of 9.5 %, Germany is the top European
country in terms of patents generated.
The ‘Computers and electronics’ sector
ranks first in most of the economies
considered; this is in line with the high
share this sector accounts for overall (see
Figure 2.7). In Japan, inventors for
companies in this sector are responsible
for more than one third of the total number
of IP5 families developed there. In Korea
(73 %), China (69 %) and Chinese Taipei
(96 %), inventors in ‘Computers and
electronics’ develop the vast majority of
patents.
Inventors in Asian economies
focus on technologies relevant to
the ‘Computers and electronics’
sector
On the other hand, the top contributing
sector in France, the United Kingdom and
Spain is ‘Transport equipment’, while in
Germany it is ‘Machinery’.
Inventors located in the EU-28
mostly develop technologies
related to ‘Transport equipment’.
Technological developments in
EU-28 and in the United States are
less concentrated in a single
sector than is often the case in
Asia
0
5
10
15
20
25
30
35% Top economies
Computers & electronics Transport equipment Machinery Electrical equipment Other industries
0.0
0.2
0.4
0.6
0.8
1.0
1.2% Other economies
22
The anatomy of innovative activities
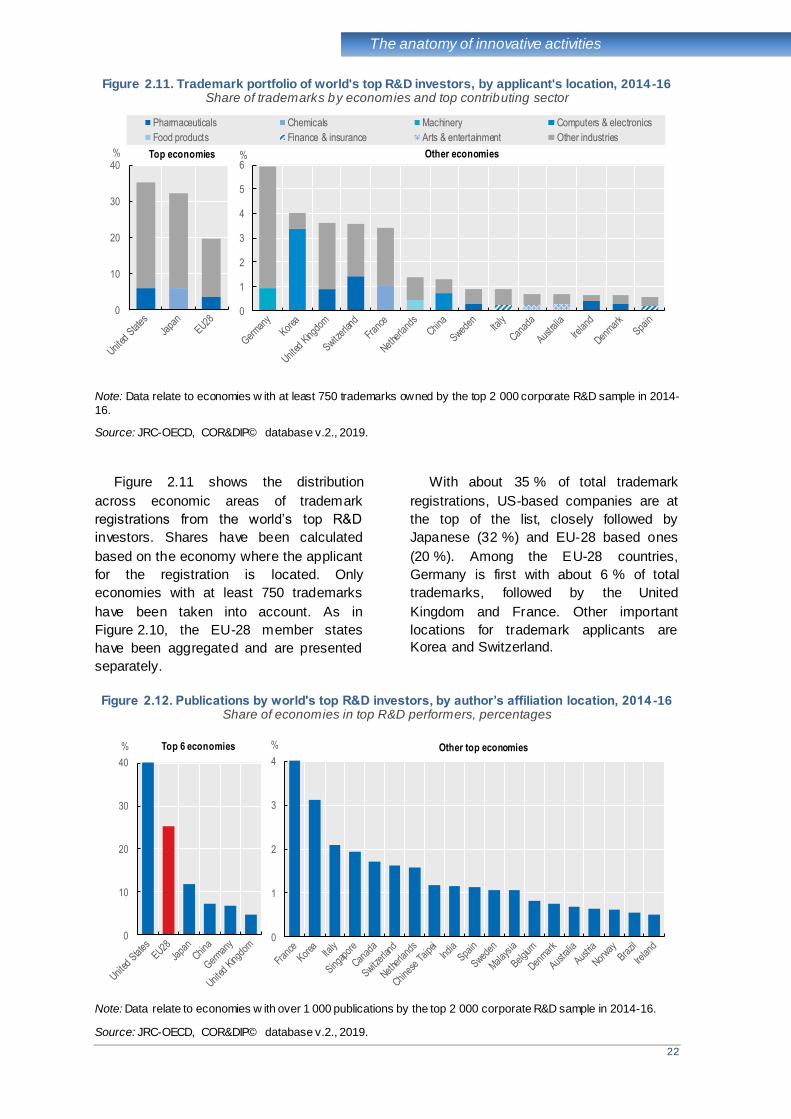
Figure 2.11. Trademark portfolio of world's top R&D investors, by applicant's location, 2014-16 Share of trademarks by economies and top contributing sector
Note: Data relate to economies w ith at least 750 trademarks owned by the top 2 000 corporate R&D sample in 2014-
16.
Source: JRC-OECD, COR&DIP© database v.2., 2019.
Figure 2.11 shows the distribution
across economic areas of trademark
registrations from the world’s top R&D
investors. Shares have been calculated
based on the economy where the applicant
for the registration is located. Only
economies with at least 750 trademarks
have been taken into account. As in
Figure 2.10, the EU-28 member states
have been aggregated and are presented
separately.
With about 35 % of total trademark
registrations, US-based companies are at
the top of the list, closely followed by
Japanese (32 %) and EU-28 based ones
(20 %). Among the EU-28 countries,
Germany is first with about 6 % of total
trademarks, followed by the United
Kingdom and France. Other important
locations for trademark applicants are
Korea and Switzerland.
Figure 2.12. Publications by world's top R&D investors, by author’s affiliation location, 2014 -16 Share of economies in top R&D performers, percentages
Note: Data relate to economies w ith over 1 000 publications by the top 2 000 corporate R&D sample in 2014-16.
Source: JRC-OECD, COR&DIP© database v.2., 2019.
0
10
20
30
40% Top economies
Pharmaceuticals Chemicals Machinery Computers & electronics
Food products Finance & insurance Arts & entertainment Other industries
0
1
2
3
4
5
6% Other economies
0
10
20
30
40
% Top 6 economies
0
1
2
3
4
% Other top economies
23
The anatomy of innovative activities
Another aspect that may be interesting
to look at is which sectors contribute more
to trademark registrations, in different
economies.
The ‘Pharmaceuticals’ sector is
first in terms of trademark
registrations in 7 out of the 17
economic areas considered
‘Pharmaceuticals’ emerges as the top
sector contributing to trademarks in the
United States, EU-28, United Kingdom,
Switzerland, Sweden, Ireland and
Denmark. Similar to the case for patents, in
Korea and China the first sector in terms of
trademark registration is ‘Computers and
electronics’. Meanwhile, in the case of
Japanese companies, the major source of
trademark registrations is the ‘Chemicals’
sector.
Finally, scientific publications from
authors affiliated to the world top 2 000
R&D performers across the globe are
shown in Figure 2.12.
Authors based in the United States are
responsible for approximately 40 % of the
whole number of publications in the
sample. Those based in the EU-28
produce about one quarter of the
publications of the top R&D investors
worldwide, while the contribution from
authors based in Asian economies is much
lower. Those residing in Japan contribute
about 12 % of overall publications, while
China and Korea show much lower shares:
about 7 % and 3 %, respectively.
Among the EU-28 countries, Germany
is still the country with the highest share,
(close to China with about 7 %), followed
by the United Kingdom (4.7 %) and France
(4 %).

24
On the shoulders of the giants
3. On the shoulders of the giants: R&D investors 2012 vs 2016
3.1 Sectoral and geographical dynamics of top R&D investors
In a world where technological
development is largely driven by the
research activities performed by firms,
innovation at the micro level plays an
important role for aggregate economic
growth (Aghion and Howitt, 1990).
R&D investment helps firms to gain
competitive advantages and enhances
their performance, and is thus considered a
key strategic asset (Reinganum, 1985).
Also, given the cumulativeness of
knowledge and its path dependency
(Nelson and Winter, 1982), remaining at
the top requires a continuous stream of
investment in R&D.
Evidence shows that the companies on
the EU Industrial R&D Investment
Scoreboard were responsible for about
90 % of overall corporate R&D investment
worldwide in 2016. These firms have
constantly increased their R&D efforts over
the last period, exhibiting an increase in
spending for eight consecutive years
(Hernández et al., 2017). Despite being
large and mostly operating on a global
scale, the top R&D investors worldwide
should not be seen as a monolithic block.
The ranking changes every year, with new
firms entering the ‘club’ while others exit it.
This part of the report compares the top
R&D investors included in the first edition
of the JRC-OECD World Corporate Top
R&D Investors (Dernis et al., 2015) with
those in the current edition. Although the
time span considered may seem short -
only four years from 2012 to 2016 - this
comparison allows a number of dynamics
to emerge, at both country and sector
levels.
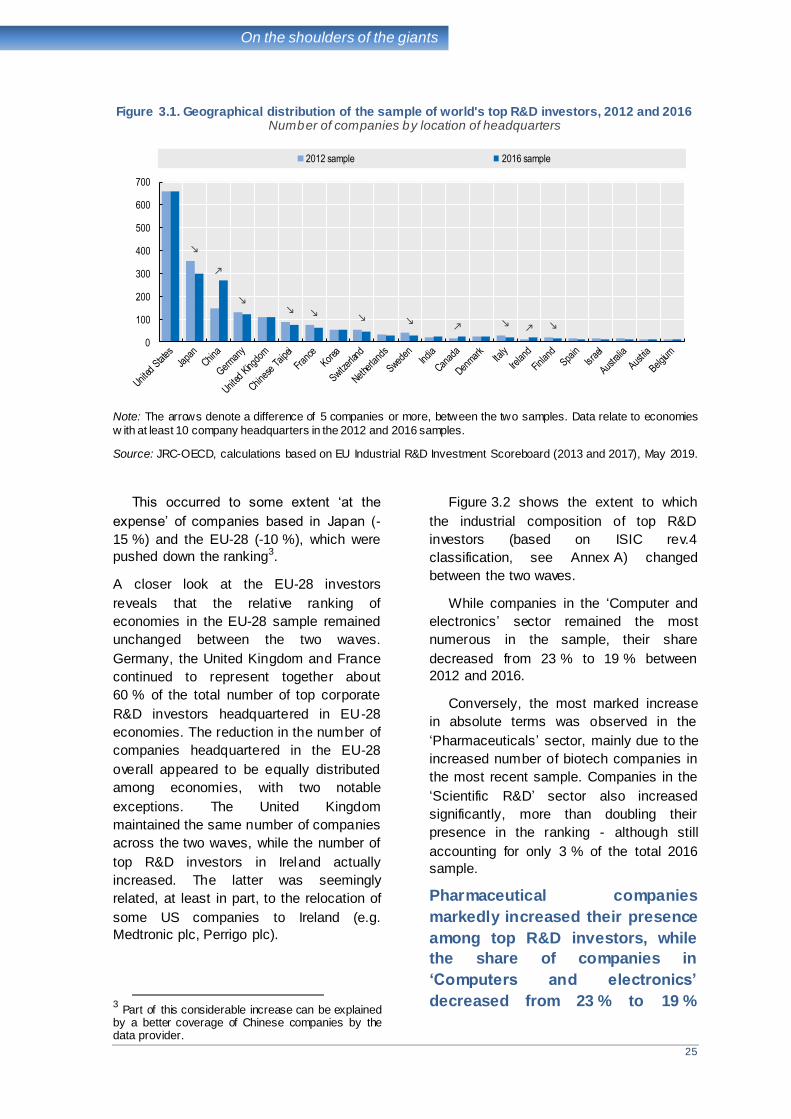
Figure 3.1 shows the geographical
distribution of the top corporate R&D
investors in the 2012 and the 2016
samples. Companies are assigned to the
economy where their headquarters are
located. US companies have the lion’s
share in both waves, and account for about
one third of the total number of top R&D
investors. Notably, their shares remain the
same across the two waves, illustrating
stable presence of the United States on the
R&D Scoreboard.
The number of top corporate R&D
investors from China almost
doubled between 2012 and 2016
The number of top corporate R&D
investors from China almost doubled
during the four years considered (from 147
in 2012 to 268 in 2016).
This chapter sheds light on whether and to what extent top R&D investors and their innovative
activities have changed between 2012 and 2016. It compares the sample of top R&D investors in
2016 with that of 2012, and focuses especially on the industrial and geographical differences that
emerge. As the different proxy measures used capture different dimensions of the dynamics at
stake, integrating them helps to provide a more general framework to read and interpret the
statistics presented. First, changes in industrial and geographical distribution are analysed,
followed by statistics about differences in terms of R&D investment, patents and trademarks.
Patents in particular help to unveil the technological specialisation of different economic areas and
how this changes over time. The final part of the chapter zooms in on those top corporate R&D
investors that enter or exit from the sample between 2012 and 2016, to complete the above
analysis of the industrial and geographical dynamics that have occurred.
25
On the shoulders of the giants
Figure 3.1. Geographical distribution of the sample of world's top R&D investors, 2012 and 2016 Number of companies by location of headquarters
Note: The arrows denote a difference of 5 companies or more, between the two samples. Data relate to economies
w ith at least 10 company headquarters in the 2012 and 2016 samples.
Source: JRC-OECD, calculations based on EU Industrial R&D Investment Scoreboard (2013 and 2017), May 2019.
This occurred to some extent ‘at the
expense’ of companies based in Japan (-
15 %) and the EU-28 (-10 %), which were
pushed down the ranking3.
A closer look at the EU-28 investors
reveals that the relative ranking of
economies in the EU-28 sample remained
unchanged between the two waves.
Germany, the United Kingdom and France
continued to represent together about
60 % of the total number of top corporate
R&D investors headquartered in EU-28
economies. The reduction in the number of
companies headquartered in the EU-28
overall appeared to be equally distributed
among economies, with two notable
exceptions. The United Kingdom
maintained the same number of companies
across the two waves, while the number of
top R&D investors in Ireland actually
increased. The latter was seemingly
related, at least in part, to the relocation of
some US companies to Ireland (e.g.
Medtronic plc, Perrigo plc).
3 Part of this considerable increase can be explained by a better coverage of Chinese companies by the data provider.
Figure 3.2 shows the extent to which
the industrial composition of top R&D
investors (based on ISIC rev.4
classification, see Annex A) changed
between the two waves.
While companies in the ‘Computer and
electronics’ sector remained the most
numerous in the sample, their share
decreased from 23 % to 19 % between
2012 and 2016.
Conversely, the most marked increase
in absolute terms was observed in the
‘Pharmaceuticals’ sector, mainly due to the
increased number of biotech companies in
the most recent sample. Companies in the
‘Scientific R&D’ sector also increased
significantly, more than doubling their
presence in the ranking - although still
accounting for only 3 % of the total 2016
sample.
Pharmaceutical companies
markedly increased their presence
among top R&D investors, while
the share of companies in
‘Computers and electronics’
decreased from 23 % to 19 %
0
100
200
300
400
500
600
700
2012 sample 2016 sample
26
On the shoulders of the giants
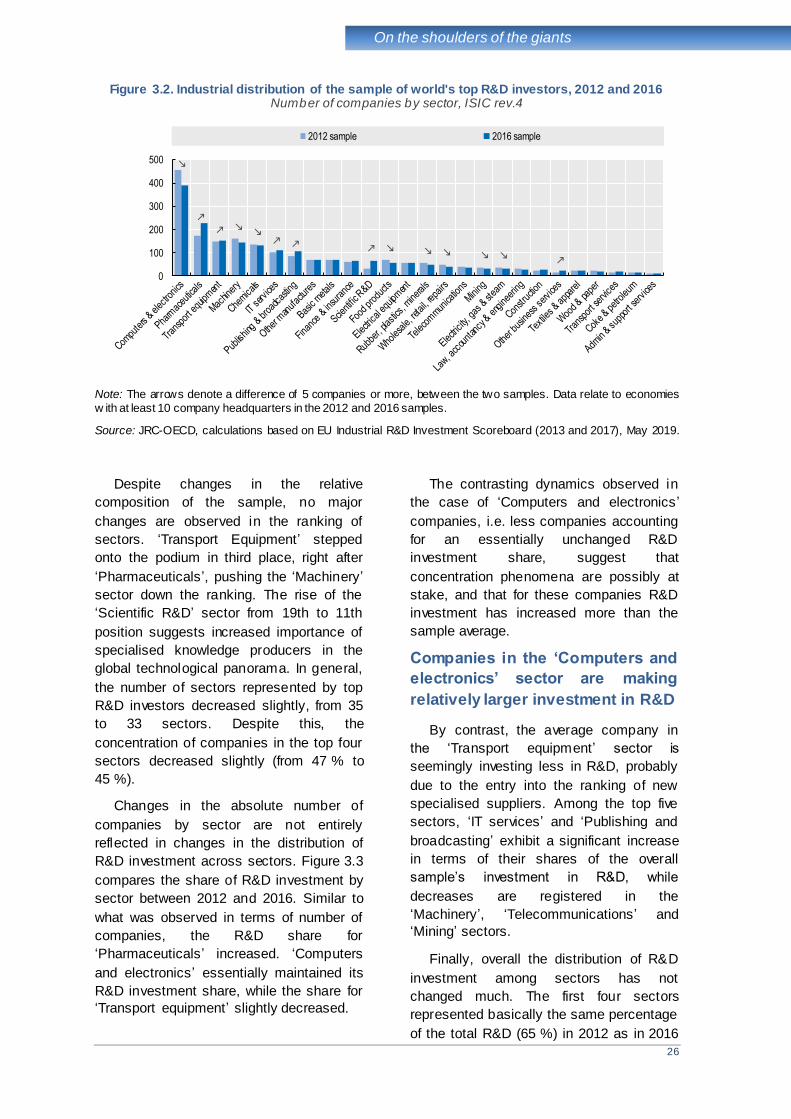
Figure 3.2. Industrial distribution of the sample of world's top R&D investors, 2012 and 2016 Number of companies by sector, ISIC rev.4
Note: The arrows denote a difference of 5 companies or more, between the two samples. Data relate to economies
w ith at least 10 company headquarters in the 2012 and 2016 samples.
Source: JRC-OECD, calculations based on EU Industrial R&D Investment Scoreboard (2013 and 2017), May 2019.
Despite changes in the relative
composition of the sample, no major
changes are observed in the ranking of
sectors. ‘Transport Equipment’ stepped
onto the podium in third place, right after
‘Pharmaceuticals’, pushing the ‘Machinery’
sector down the ranking. The rise of the
‘Scientific R&D’ sector from 19th to 11th
position suggests increased importance of
specialised knowledge producers in the
global technological panorama. In general,
the number of sectors represented by top
R&D investors decreased slightly, from 35
to 33 sectors. Despite this, the
concentration of companies in the top four
sectors decreased slightly (from 47 % to
45 %).
Changes in the absolute number of
companies by sector are not entirely
reflected in changes in the distribution of
R&D investment across sectors. Figure 3.3
compares the share of R&D investment by
sector between 2012 and 2016. Similar to
what was observed in terms of number of
companies, the R&D share for
‘Pharmaceuticals’ increased. ‘Computers
and electronics’ essentially maintained its
R&D investment share, while the share for
‘Transport equipment’ slightly decreased.
The contrasting dynamics observed in
the case of ‘Computers and electronics ’
companies, i.e. less companies accounting
for an essentially unchanged R&D
investment share, suggest that
concentration phenomena are possibly at
stake, and that for these companies R&D
investment has increased more than the
sample average.
Companies in the ‘Computers and
electronics’ sector are making
relatively larger investment in R&D
By contrast, the average company in
the ‘Transport equipment’ sector is
seemingly investing less in R&D, probably
due to the entry into the ranking of new
specialised suppliers. Among the top five
sectors, ‘IT services’ and ‘Publishing and
broadcasting’ exhibit a significant increase
in terms of their shares of the overall
sample’s investment in R&D, while
decreases are registered in the
‘Machinery’, ‘Telecommunications’ and
‘Mining’ sectors.
Finally, overall the distribution of R&D
investment among sectors has not
changed much. The first four sectors
represented basically the same percentage
of the total R&D (65 %) in 2012 as in 2016
0
100
200
300
400
500
2012 sample 2016 sample

27
On the shoulders of the giants
(64%). In both samples, less than half the
companies are responsible for almost two
thirds of the total R&D investment. This
means that the company-specific
investment made by the corporate R&D
investors in the first four sectors, i.e. those
displayed on the left-hand side of
Figure 3.3, is much larger (on average)
than that made by the companies
operating in the remaining sectors.
Figure 3.3. Distribution of R&D investment of world's top R&D investors, 2012 and 2016 Share of R&D investment in total R&D investment of world's top R&D investors
Note: The arrows denote a difference of 5 companies or more, between the two samples. Data relate to sectors with
at least 10 company headquarters in the 2012 and 2016 samples.
Source: JRC-OECD, calculations based on EU Industrial R&D Investment Scoreboard (2013 and 2017), May 2019.
3.2 The changing landscape of innovative activities
Patents have long been used to proxy
companies’ innovative output activity
(Pakes and Griliches, 1980; Acs and
Audretsch, 1989) and technological
strength (Narin et al., 1987). More recently,
trademarks have started to complement
patent-based statistics, in order to better
account for, in particular, non-technological
and service innovations (Mendonça et al.,
2004; Gotsch and Hipp, 2012).
As shown in the previous section of this
chapter, the trademark and patent
portfolios of top R&D investors worldwide
are fairly concentrated. What follows is a
discussion of the possible changes that
occurred in the concentration of patents
and trademarks, by sector, between the
two periods considered, and a use of
patent data to investigate changes in
technological specialisation in different
geographical areas. Technological
specialisation is here assessed using
revealed technological advantage (RTA)
indicators, which compare the share of
patents in a given technology generated in
an identified area, with the overall share of
the same technology generated elsewhere.
For this purpose, 2012 statistics are here
compared with 2016 ones.
Figure 3.4 shows the shares of patents,
by sector, for the two periods considered.
As can be seen, the same sectors are at
the top in the two samples, whereas
significant changes can be observed in
shares accounted for by the rest of the
sectors.
While important differences
emerge at company-specific level,
changes at the aggregate sector
level appear more nuanced
The relative stability of patent shares
across sectors may be a reflection of
persistent sector specificities.
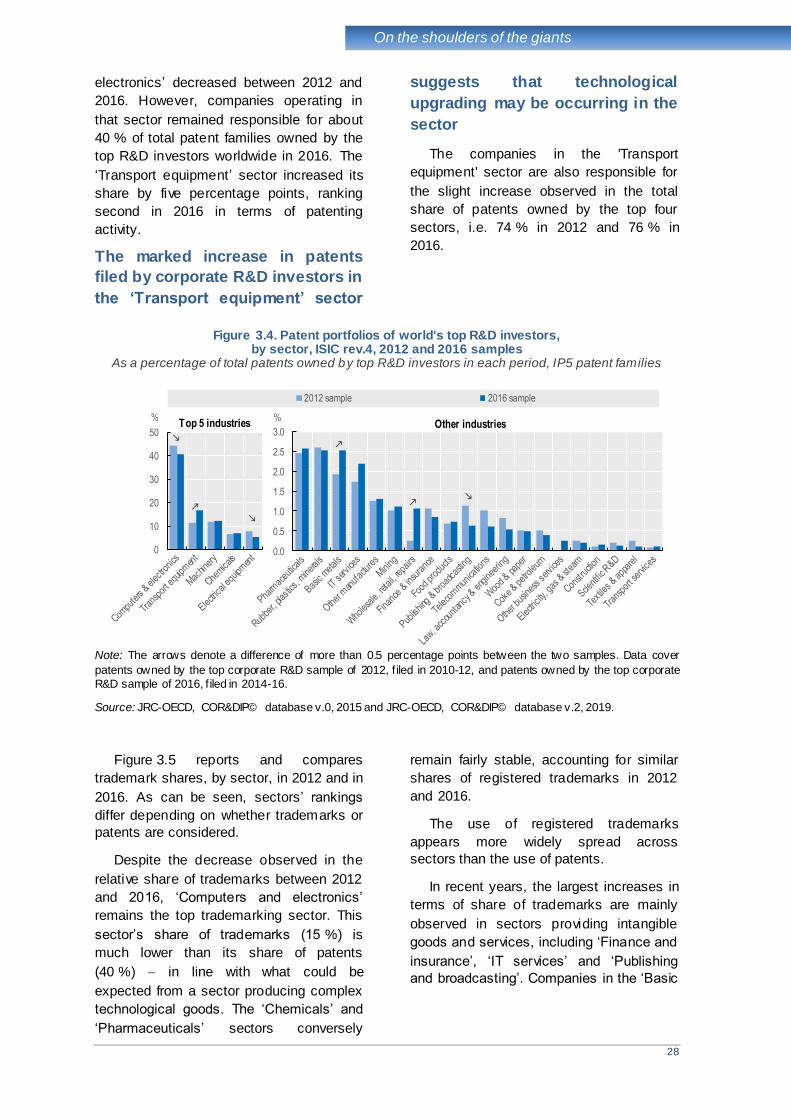
The overall share of IP5 families filed by
companies operating in ‘Computers and
0
5
10
15
20
25
%
2012 sample 2016 sample
Top 6 industries
0
1
2
3
4
5
%Other industries
28
On the shoulders of the giants
electronics’ decreased between 2012 and
2016. However, companies operating in
that sector remained responsible for about
40 % of total patent families owned by the
top R&D investors worldwide in 2016. The
‘Transport equipment’ sector increased its
share by five percentage points, ranking
second in 2016 in terms of patenting
activity.
The marked increase in patents
filed by corporate R&D investors in
the ‘Transport equipment’ sector
suggests that technological
upgrading may be occurring in the
sector
The companies in the 'Transport
equipment' sector are also responsible for
the slight increase observed in the total
share of patents owned by the top four
sectors, i.e. 74 % in 2012 and 76 % in
2016.
Figure 3.4. Patent portfolios of world's top R&D investors, by sector, ISIC rev.4, 2012 and 2016 samples
As a percentage of total patents owned by top R&D investors in each period, IP5 patent families
Note: The arrows denote a difference of more than 0.5 percentage points between the two samples. Data cover
patents owned by the top corporate R&D sample of 2012, f iled in 2010-12, and patents owned by the top corporate
R&D sample of 2016, f iled in 2014-16.
Source: JRC-OECD, COR&DIP© database v.0, 2015 and JRC-OECD, COR&DIP© database v.2, 2019.
Figure 3.5 reports and compares
trademark shares, by sector, in 2012 and in
2016. As can be seen, sectors’ rankings
differ depending on whether trademarks or
patents are considered.
Despite the decrease observed in the
relative share of trademarks between 2012
and 2016, ‘Computers and electronics’
remains the top trademarking sector. This
sector’s share of trademarks (15 %) is
much lower than its share of patents
(40 %) in line with what could be
expected from a sector producing complex
technological goods. The ‘Chemicals’ and
‘Pharmaceuticals’ sectors conversely
remain fairly stable, accounting for similar
shares of registered trademarks in 2012
and 2016.
The use of registered trademarks
appears more widely spread across
sectors than the use of patents.
In recent years, the largest increases in
terms of share of trademarks are mainly
observed in sectors providing intangible
goods and services, including ‘Finance and
insurance’, ‘IT services’ and ‘Publishing
and broadcasting’. Companies in the ‘Basic
0
10
20
30
40
50
%
2012 sample 2016 sample
Top 5 industries
0.0
0.5
1.0
1.5
2.0
2.5
3.0
%Other industries
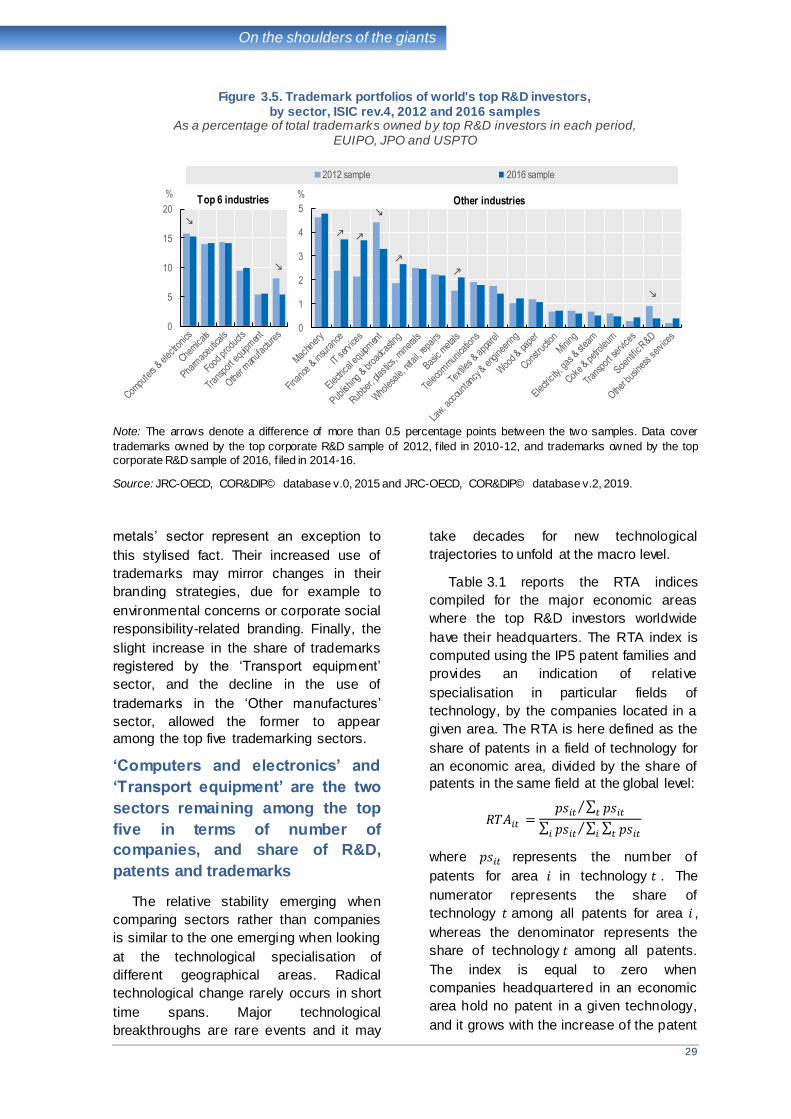
29
On the shoulders of the giants
Figure 3.5. Trademark portfolios of world's top R&D investors, by sector, ISIC rev.4, 2012 and 2016 samples
As a percentage of total trademarks owned by top R&D investors in each period, EUIPO, JPO and USPTO
Note: The arrows denote a difference of more than 0.5 percentage points between the two samples. Data cover
trademarks owned by the top corporate R&D sample of 2012, f iled in 2010-12, and trademarks owned by the top
corporate R&D sample of 2016, f iled in 2014-16.
Source: JRC-OECD, COR&DIP© database v.0, 2015 and JRC-OECD, COR&DIP© database v.2, 2019.
metals’ sector represent an exception to
this stylised fact. Their increased use of
trademarks may mirror changes in their
branding strategies, due for example to
environmental concerns or corporate social
responsibility-related branding. Finally, the
slight increase in the share of trademarks
registered by the ‘Transport equipment’
sector, and the decline in the use of
trademarks in the ‘Other manufactures’
sector, allowed the former to appear
among the top five trademarking sectors.
‘Computers and electronics’ and
‘Transport equipment’ are the two
sectors remaining among the top
five in terms of number of
companies, and share of R&D,
patents and trademarks
The relative stability emerging when
comparing sectors rather than companies
is similar to the one emerging when looking
at the technological specialisation of
different geographical areas. Radical
technological change rarely occurs in short
time spans. Major technological
breakthroughs are rare events and it may
take decades for new technological
trajectories to unfold at the macro level.
Table 3.1 reports the RTA indices
compiled for the major economic areas
where the top R&D investors worldwide
have their headquarters. The RTA index is
computed using the IP5 patent families and
provides an indication of relative
specialisation in particular fields of
technology, by the companies located in a
given area. The RTA is here defined as the
share of patents in a field of technology for
an economic area, divided by the share of
patents in the same field at the global level:
𝑅𝑇𝐴𝑖𝑡 =𝑝𝑠𝑖𝑡
∑ 𝑝𝑠𝑖𝑡𝑡⁄
∑ 𝑝𝑠𝑖𝑡𝑖∑ ∑ 𝑝𝑠𝑖𝑡𝑡𝑖
⁄
where 𝑝𝑠𝑖𝑡 represents the number of
patents for area 𝑖 in technology 𝑡 . The
numerator represents the share of
technology 𝑡 among all patents for area 𝑖 ,
whereas the denominator represents the
share of technology 𝑡 among all patents.
The index is equal to zero when
companies headquartered in an economic
area hold no patent in a given technology,
and it grows with the increase of the patent
0
5
10
15
20
%
2012 sample 2016 sample
Top 6 industries
0
1
2
3
4
5
%Other industries
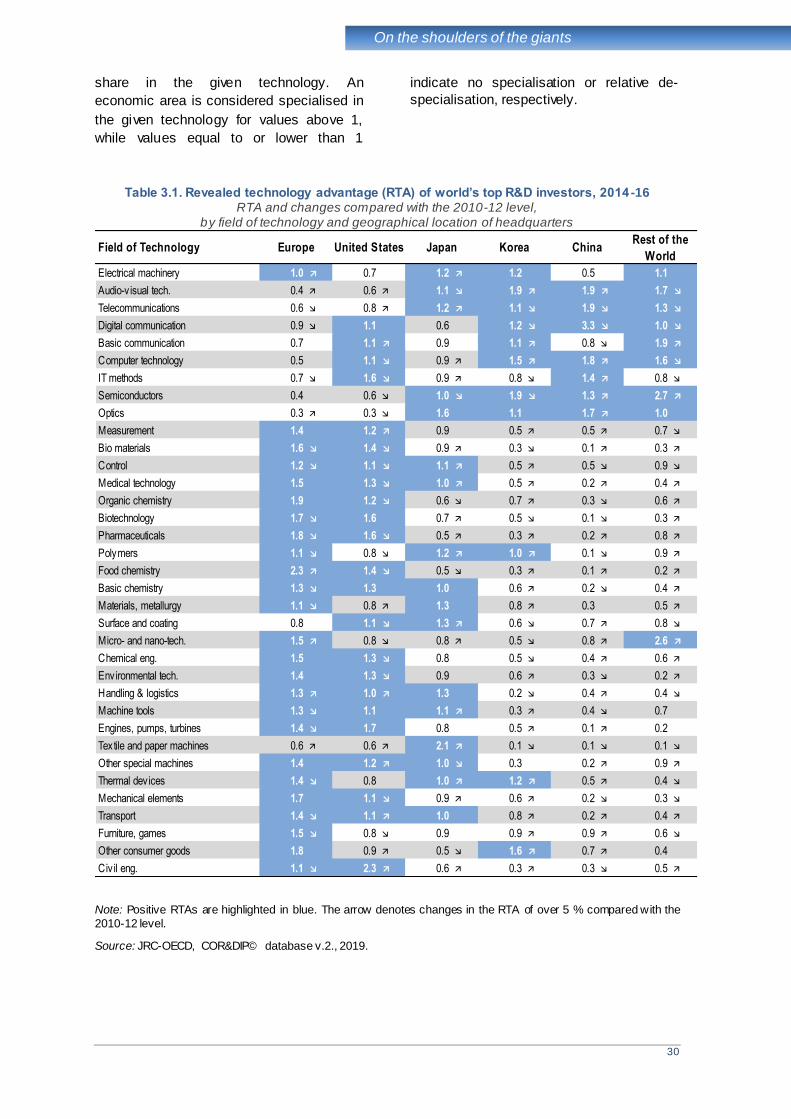
30
On the shoulders of the giants
share in the given technology. An
economic area is considered specialised in
the given technology for values above 1,
while values equal to or lower than 1
indicate no specialisation or relative de-
specialisation, respectively.
Table 3.1. Revealed technology advantage (RTA) of world’s top R&D investors, 2014 -16 RTA and changes compared with the 2010-12 level,
by field of technology and geographical location of headquarters
Note: Positive RTAs are highlighted in blue. The arrow denotes changes in the RTA of over 5 % compared with the
2010-12 level.
Source: JRC-OECD, COR&DIP© database v.2., 2019.
Field of Technology
Electrical machinery 1.0 0.7 1.2 1.2 0.5 1.1
Audio-v isual tech. 0.4 0.6 1.1 1.9 1.9 1.7
Telecommunications 0.6 0.8 1.2 1.1 1.9 1.3
Digital communication 0.9 1.1 0.6 1.2 3.3 1.0
Basic communication 0.7 1.1 0.9 1.1 0.8 1.9
Computer technology 0.5 1.1 0.9 1.5 1.8 1.6
IT methods 0.7 1.6 0.9 0.8 1.4 0.8
Semiconductors 0.4 0.6 1.0 1.9 1.3 2.7
Optics 0.3 0.3 1.6 1.1 1.7 1.0
Measurement 1.4 1.2 0.9 0.5 0.5 0.7
Bio materials 1.6 1.4 0.9 0.3 0.1 0.3
Control 1.2 1.1 1.1 0.5 0.5 0.9
Medical technology 1.5 1.3 1.0 0.5 0.2 0.4
Organic chemistry 1.9 1.2 0.6 0.7 0.3 0.6
Biotechnology 1.7 1.6 0.7 0.5 0.1 0.3
Pharmaceuticals 1.8 1.6 0.5 0.3 0.2 0.8
Polymers 1.1 0.8 1.2 1.0 0.1 0.9
Food chemistry 2.3 1.4 0.5 0.3 0.1 0.2
Basic chemistry 1.3 1.3 1.0 0.6 0.2 0.4
Materials, metallurgy 1.1 0.8 1.3 0.8 0.3 0.5
Surface and coating 0.8 1.1 1.3 0.6 0.7 0.8
Micro- and nano-tech. 1.5 0.8 0.8 0.5 0.8 2.6
Chemical eng. 1.5 1.3 0.8 0.5 0.4 0.6
Environmental tech. 1.4 1.3 0.9 0.6 0.3 0.2
Handling & logistics 1.3 1.0 1.3 0.2 0.4 0.4
Machine tools 1.3 1.1 1.1 0.3 0.4 0.7
Engines, pumps, turbines 1.4 1.7 0.8 0.5 0.1 0.2
Textile and paper machines 0.6 0.6 2.1 0.1 0.1 0.1
Other special machines 1.4 1.2 1.0 0.3 0.2 0.9
Thermal devices 1.4 0.8 1.0 1.2 0.5 0.4
Mechanical elements 1.7 1.1 0.9 0.6 0.2 0.3
Transport 1.4 1.1 1.0 0.8 0.2 0.4
Furniture, games 1.5 0.8 0.9 0.9 0.9 0.6
Other consumer goods 1.8 0.9 0.5 1.6 0.7 0.4
Civ il eng. 1.1 2.3 0.6 0.3 0.3 0.5
Rest of the
WorldEurope United States Japan Korea China
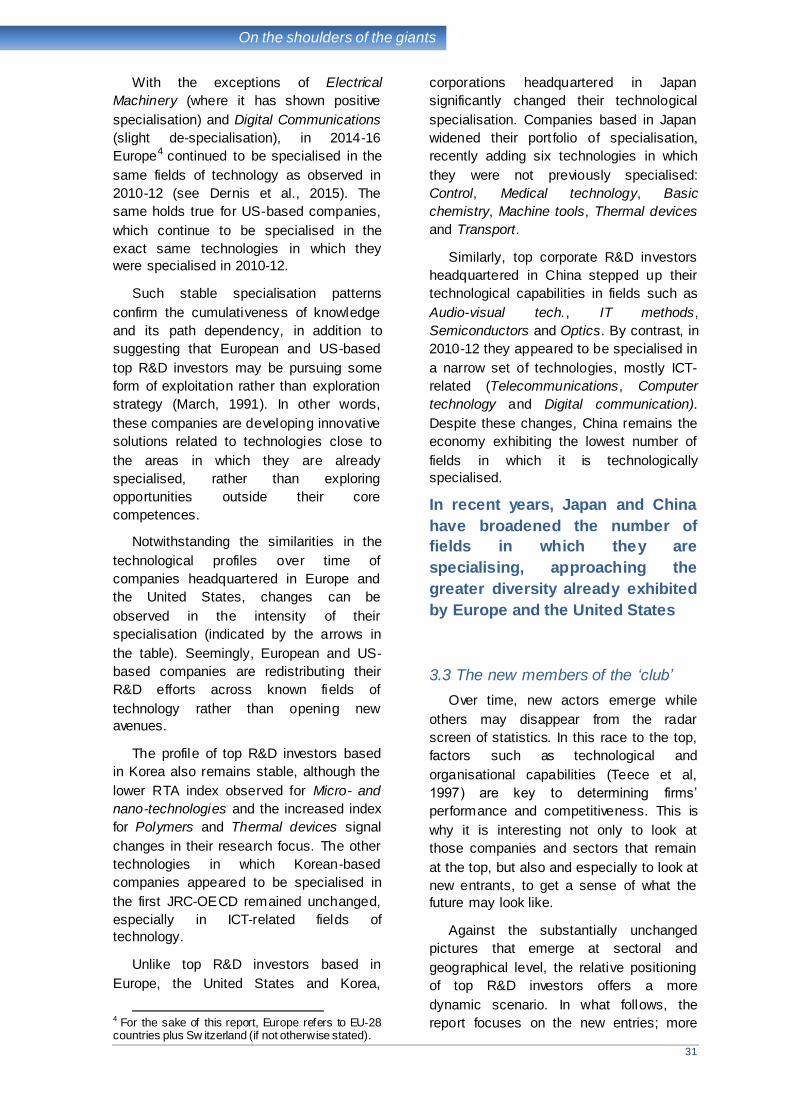
31
On the shoulders of the giants
With the exceptions of Electrical
Machinery (where it has shown positive
specialisation) and Digital Communications
(slight de-specialisation), in 2014-16
Europe4 continued to be specialised in the
same fields of technology as observed in
2010-12 (see Dernis et al., 2015). The
same holds true for US-based companies,
which continue to be specialised in the
exact same technologies in which they
were specialised in 2010-12.
Such stable specialisation patterns
confirm the cumulativeness of knowledge
and its path dependency, in addition to
suggesting that European and US-based
top R&D investors may be pursuing some
form of exploitation rather than exploration
strategy (March, 1991). In other words,
these companies are developing innovative
solutions related to technologies close to
the areas in which they are already
specialised, rather than exploring
opportunities outside their core
competences.
Notwithstanding the similarities in the
technological profiles over time of
companies headquartered in Europe and
the United States, changes can be
observed in the intensity of their
specialisation (indicated by the arrows in
the table). Seemingly, European and US-
based companies are redistributing their
R&D efforts across known fields of
technology rather than opening new
avenues.
The profile of top R&D investors based
in Korea also remains stable, although the
lower RTA index observed for Micro- and
nano-technologies and the increased index
for Polymers and Thermal devices signal
changes in their research focus. The other
technologies in which Korean-based
companies appeared to be specialised in
the first JRC-OECD remained unchanged,
especially in ICT-related fields of
technology.
Unlike top R&D investors based in
Europe, the United States and Korea,
4 For the sake of this report, Europe refers to EU-28 countries plus Sw itzerland (if not otherwise stated).
corporations headquartered in Japan
significantly changed their technological
specialisation. Companies based in Japan
widened their port folio of specialisation,
recently adding six technologies in which
they were not previously specialised:
Control, Medical technology, Basic
chemistry, Machine tools, Thermal devices
and Transport.
Similarly, top corporate R&D investors
headquartered in China stepped up their
technological capabilities in fields such as
Audio-visual tech., IT methods,
Semiconductors and Optics. By contrast, in
2010-12 they appeared to be specialised in
a narrow set of technologies, mostly ICT-
related (Telecommunications, Computer
technology and Digital communication).
Despite these changes, China remains the
economy exhibiting the lowest number of
fields in which it is technologically
specialised.
In recent years, Japan and China
have broadened the number of
fields in which they are
specialising, approaching the
greater diversity already exhibited
by Europe and the United States
3.3 The new members of the ‘club’
Over time, new actors emerge while
others may disappear from the radar
screen of statistics. In this race to the top,
factors such as technological and
organisational capabilities (Teece et al,
1997) are key to determining firms’
performance and competitiveness. This is
why it is interesting not only to look at
those companies and sectors that remain
at the top, but also and especially to look at
new entrants, to get a sense of what the
future may look like.
Against the substantially unchanged
pictures that emerge at sectoral and
geographical level, the relative positioning
of top R&D investors offers a more
dynamic scenario. In what follows, the
report focuses on the new entries; more
32
On the shoulders of the giants
broadly, on changes in the companies at
the very top of the ranking (top 50). The
top 50 companies are responsible for
about 40 % of overall R&D investment by
the sample (Hernández et al., 2017).
Overall mobility in the sample is further
discussed by looking at the new entries
(i.e. 456 companies) and their industrial
and geographical distribution.
Figure 3.6 compares the ranking of the
top 50 R&D investors in 2012 and in 2016.
Seven companies made it to the top 50 in
2016, six of which were already present in
2012, albeit featuring in a lower part of the
ranking. Facebook is the company that
made the greatest leap in the last four
years, climbing from 105th to 19th position.
Other new entries in the top 50 are Gilead
Sciences and Celgene (biotech
companies), Boeing, SAP, Continental and
LG Electronics. The biopharmaceutical
company AbbVie is the only new company
entering the top 50 in 2016 which had been
outside the Scoreboard sample in 2012.
However, this company is not strictly
speaking a newcomer: it was founded in
2013 as a spin-off of Abbott Laboratories,
which was ranked among the top 50 in
2012 and remains in the ranking (position
108). Corporate strategies and
restructuring play an important role in the
(measurement of the) relative positioning of
companies. Indeed, the only two
companies that fell from the top 50 to
below 100th position are Hewlett-Packard
and Abbott Laboratories, both of which
experienced deep organisational
restructuring. The other companies moving
down from the top 50 nevertheless
remained in the top 100 in 2016.
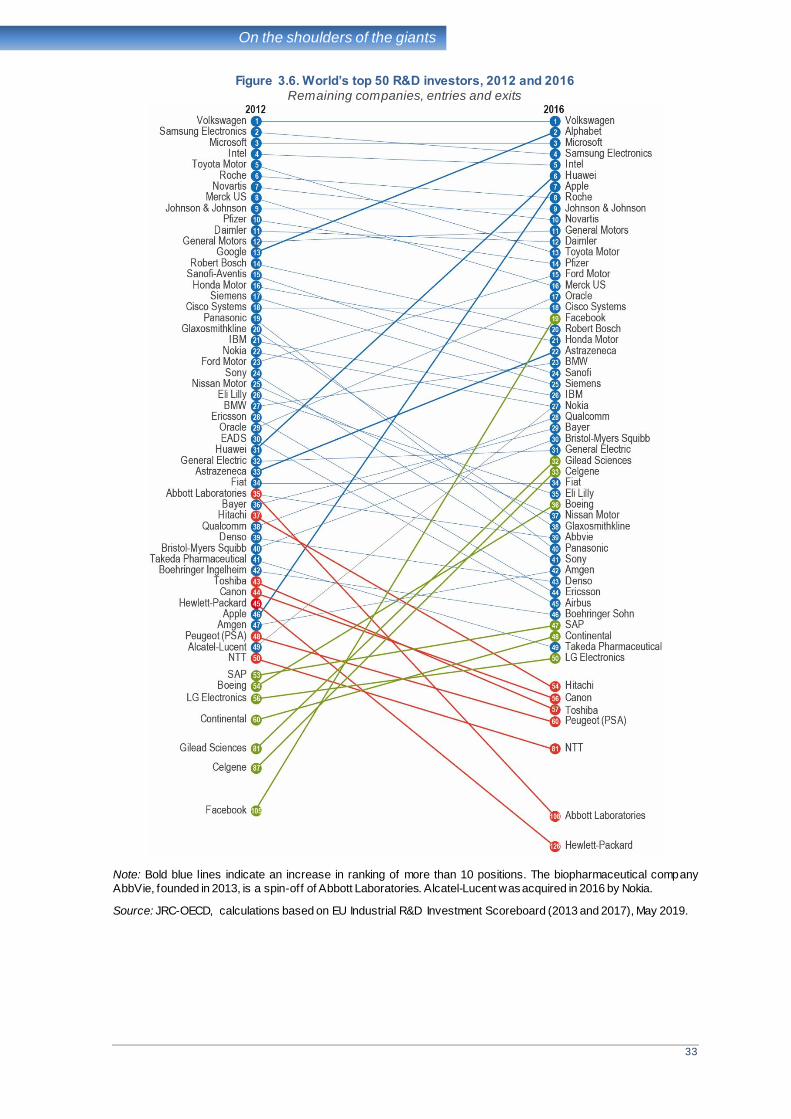
33
On the shoulders of the giants
Figure 3.6. World’s top 50 R&D investors, 2012 and 2016 Remaining companies, entries and exits
Note: Bold blue lines indicate an increase in ranking of more than 10 positions. The biopharmaceutical company
AbbVie, founded in 2013, is a spin-off of Abbott Laboratories. Alcatel-Lucent was acquired in 2016 by Nokia.
Source: JRC-OECD, calculations based on EU Industrial R&D Investment Scoreboard (2013 and 2017), May 2019.
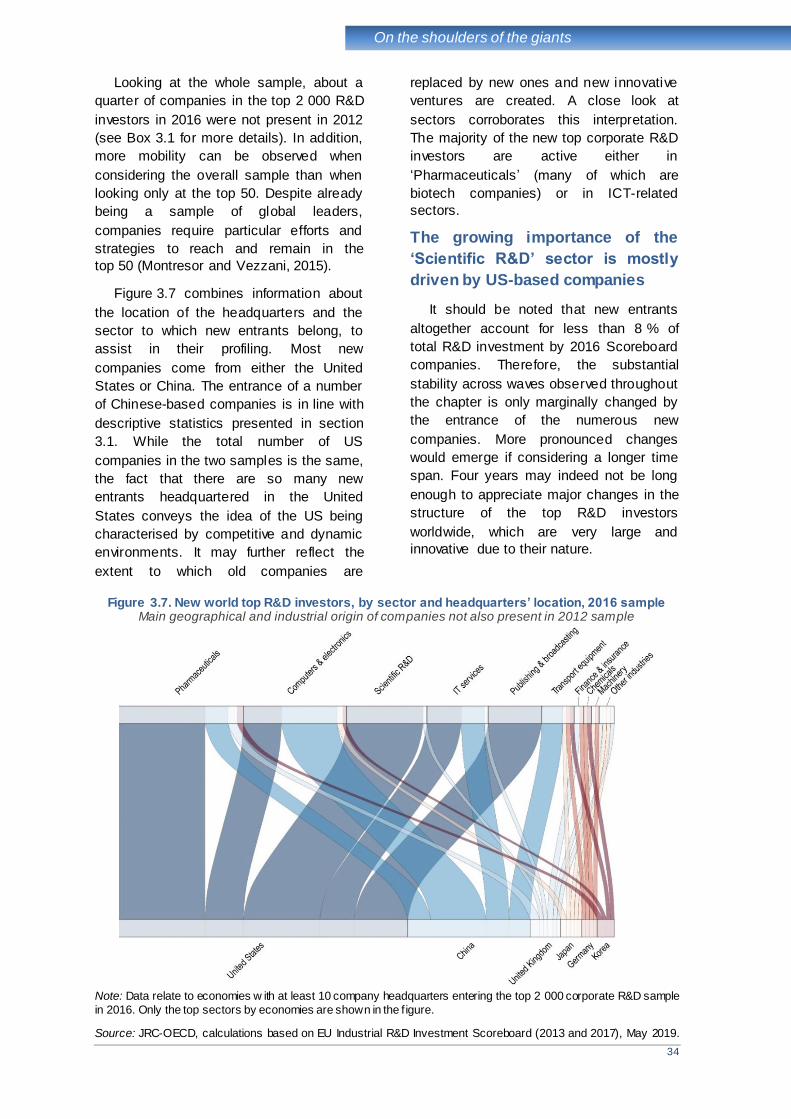
34
On the shoulders of the giants
Looking at the whole sample, about a
quarter of companies in the top 2 000 R&D
investors in 2016 were not present in 2012
(see Box 3.1 for more details). In addition,
more mobility can be observed when
considering the overall sample than when
looking only at the top 50. Despite already
being a sample of global leaders,
companies require particular efforts and
strategies to reach and remain in the
top 50 (Montresor and Vezzani, 2015).
Figure 3.7 combines information about
the location of the headquarters and the
sector to which new entrants belong, to
assist in their profiling. Most new
companies come from either the United
States or China. The entrance of a number
of Chinese-based companies is in line with
descriptive statistics presented in section
3.1. While the total number of US
companies in the two samples is the same,
the fact that there are so many new
entrants headquartered in the United
States conveys the idea of the US being
characterised by competitive and dynamic
environments. It may further reflect the
extent to which old companies are
replaced by new ones and new innovative
ventures are created. A close look at
sectors corroborates this interpretation.
The majority of the new top corporate R&D
investors are active either in
‘Pharmaceuticals’ (many of which are
biotech companies) or in ICT-related
sectors.
The growing importance of the
‘Scientific R&D’ sector is mostly
driven by US-based companies
It should be noted that new entrants
altogether account for less than 8 % of
total R&D investment by 2016 Scoreboard
companies. Therefore, the substantial
stability across waves observed throughout
the chapter is only marginally changed by
the entrance of the numerous new
companies. More pronounced changes
would emerge if considering a longer time
span. Four years may indeed not be long
enough to appreciate major changes in the
structure of the top R&D investors
worldwide, which are very large and
innovative due to their nature.
Figure 3.7. New world top R&D investors, by sector and headquarters’ location, 2016 sample Main geographical and industrial origin of companies not also present in 2012 sample
Note: Data relate to economies w ith at least 10 company headquarters entering the top 2 000 corporate R&D sample
in 2016. Only the top sectors by economies are shown in the f igure.
Source: JRC-OECD, calculations based on EU Industrial R&D Investment Scoreboard (2013 and 2017), May 2019.
35
On the shoulders of the giants
Box 3.1: The ‘new kids on the block’ - companies entering the ‘club’ of top R&D investors
Of the top 2 000 R&D investors in 2016, 1 428 w here already among the top R&D investors in 2012.
Altogether, these companies accounted for 91.4 % of total R&D performed by the sample in 2016.
An addit ional 116 companies (accounting for 1.1 % of total R&D for the sample in 2016) w ere already
present in the 2012 ranking but featured betw een 2 001 and 2 500 in terms of position.
This leaves 456 f irms (representing 7.6 % of the total R&D in 2016) w hich w ere not present in the ranking
four years previously.
Only 45 of these new companies entered in a signif icant position (top 500) in the most recent ranking
considered. Many of these new entrants are not strictly speaking new companies, but are either the result
of major company transformations (mergers and acquisit ions, spin offs, etc.) or companies that w ent public
during the period betw een the tw o samples.
The top three entrants are a clear example of this. AbbVie (position 39) and Hew lett Packard Enterprise
(position 62) are the results of a spin-off (of Abbott Laboratories) and a split of Hew lett-Packard into tw o
companies: HP and Hew lett Packard Enterprise. The third top entrant is Dell Technologies (posit ion 51).
Dell w ent private in 2013 (hence did not publish audited accounts) and disappeared from the ranking (included in the R&D Scoreboard edition of 2012). The follow ing year the company w ent public again and
reappeared in the ranking for the 2014 edition.
The new entrants not due to a major company operation or to a long-established company going public are
mainly companies in ICT-related sectors.
The main example of this is Tw itter: founded in 2006, it has traded since 2013 and entered the ranking of
top 2 000 R&D investors in the 2014 edition.
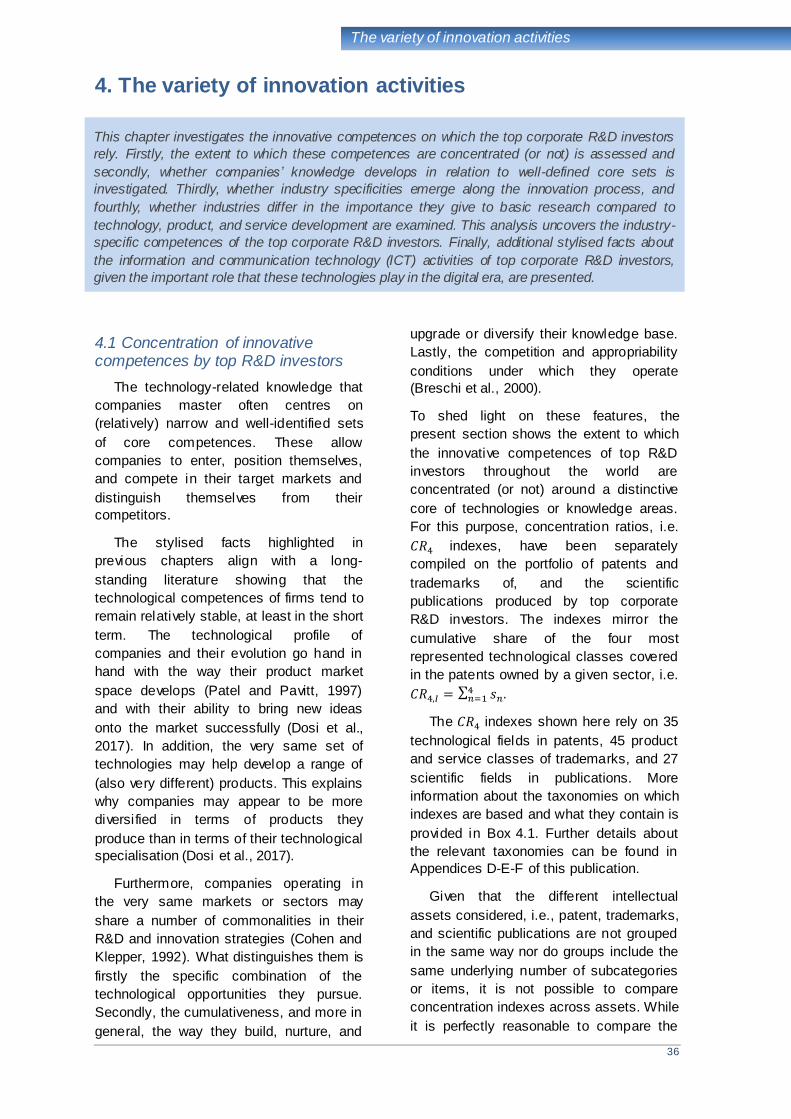
36
The variety of innovation activities
4. The variety of innovation activities
4.1 Concentration of innovative competences by top R&D investors
The technology-related knowledge that
companies master often centres on
(relatively) narrow and well-identified sets
of core competences. These allow
companies to enter, position themselves,
and compete in their target markets and
distinguish themselves from their
competitors.
The stylised facts highlighted in
previous chapters align with a long-
standing literature showing that the
technological competences of firms tend to
remain relatively stable, at least in the short
term. The technological profile of
companies and their evolution go hand in
hand with the way their product market
space develops (Patel and Pavitt, 1997)
and with their ability to bring new ideas
onto the market successfully (Dosi et al.,
2017). In addition, the very same set of
technologies may help develop a range of
(also very different) products. This explains
why companies may appear to be more
diversified in terms of products they
produce than in terms of their technological
specialisation (Dosi et al., 2017).
Furthermore, companies operating in
the very same markets or sectors may
share a number of commonalities in their
R&D and innovation strategies (Cohen and
Klepper, 1992). What distinguishes them is
firstly the specific combination of the
technological opportunities they pursue.
Secondly, the cumulativeness, and more in
general, the way they build, nurture, and
upgrade or diversify their knowledge base.
Lastly, the competition and appropriability
conditions under which they operate
(Breschi et al., 2000).
To shed light on these features, the
present section shows the extent to which
the innovative competences of top R&D
investors throughout the world are
concentrated (or not) around a distinctive
core of technologies or knowledge areas.
For this purpose, concentration ratios, i.e.
𝐶𝑅4 indexes, have been separately
compiled on the portfolio of patents and
trademarks of, and the scientific
publications produced by top corporate
R&D investors. The indexes mirror the
cumulative share of the four most
represented technological classes covered
in the patents owned by a given sector, i.e.
𝐶𝑅4,𝐼 = ∑ 𝑠𝑛4𝑛=1 .
The 𝐶𝑅4 indexes shown here rely on 35
technological fields in patents, 45 product
and service classes of trademarks, and 27
scientific fields in publications. More
information about the taxonomies on which
indexes are based and what they contain is
provided in Box 4.1. Further details about
the relevant taxonomies can be found in
Appendices D-E-F of this publication.
Given that the different intellectual
assets considered, i.e., patent, trademarks,
and scientific publications are not grouped
in the same way nor do groups include the
same underlying number of subcategories
or items, it is not possible to compare
concentration indexes across assets. While
it is perfectly reasonable to compare the
This chapter investigates the innovative competences on which the top corporate R&D investors
rely. Firstly, the extent to which these competences are concentrated (or not) is assessed and
secondly, whether companies’ knowledge develops in relation to well-defined core sets is
investigated. Thirdly, whether industry specificities emerge along the innovation process, and
fourthly, whether industries differ in the importance they give to basic research compared to
technology, product, and service development are examined. This analysis uncovers the industry-
specific competences of the top corporate R&D investors. Finally, additional stylised facts about
the information and communication technology (ICT) activities of top corporate R&D investors,
given the important role that these technologies play in the digital era, are presented.
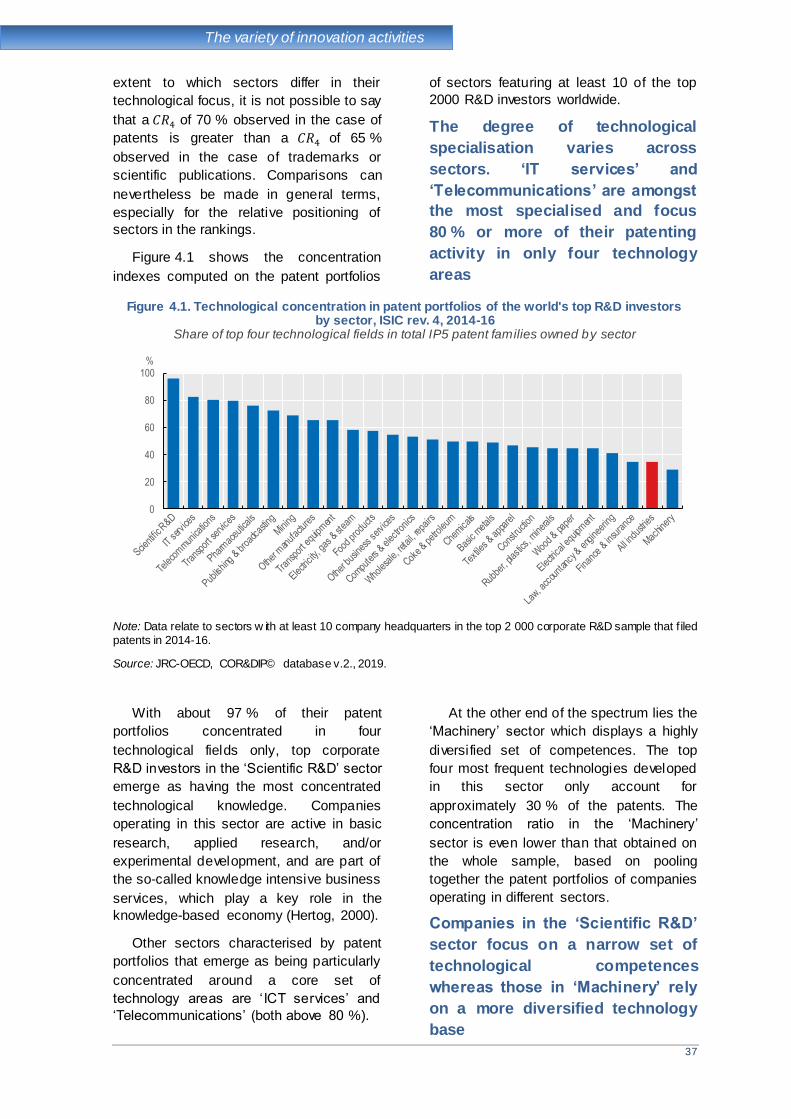
37
The variety of innovation activities
extent to which sectors differ in their
technological focus, it is not possible to say
that a 𝐶𝑅4 of 70 % observed in the case of
patents is greater than a 𝐶𝑅4 of 65 %
observed in the case of trademarks or
scientific publications. Comparisons can
nevertheless be made in general terms,
especially for the relative positioning of
sectors in the rankings.
Figure 4.1 shows the concentration
indexes computed on the patent portfolios
of sectors featuring at least 10 of the top
2000 R&D investors worldwide.
The degree of technological
specialisation varies across
sectors. ‘IT services’ and
‘Telecommunications’ are amongst
the most specialised and focus
80 % or more of their patenting
activity in only four technology
areas
Figure 4.1. Technological concentration in patent portfolios of the world's top R&D investors by sector, ISIC rev. 4, 2014-16
Share of top four technological fields in total IP5 patent families owned by sector
Note: Data relate to sectors w ith at least 10 company headquarters in the top 2 000 corporate R&D sample that f iled
patents in 2014-16.
Source: JRC-OECD, COR&DIP© database v.2., 2019.
With about 97 % of their patent
portfolios concentrated in four
technological fields only, top corporate
R&D investors in the ‘Scientific R&D’ sector
emerge as having the most concentrated
technological knowledge. Companies
operating in this sector are active in basic
research, applied research, and/or
experimental development, and are part of
the so-called knowledge intensive business
services, which play a key role in the
knowledge-based economy (Hertog, 2000).
Other sectors characterised by patent
portfolios that emerge as being particularly
concentrated around a core set of
technology areas are ‘ICT services’ and
‘Telecommunications’ (both above 80 %).
At the other end of the spectrum lies the
‘Machinery’ sector which displays a highly
diversified set of competences. The top
four most frequent technologies developed
in this sector only account for
approximately 30 % of the patents. The
concentration ratio in the ‘Machinery’
sector is even lower than that obtained on
the whole sample, based on pooling
together the patent portfolios of companies
operating in different sectors.
Companies in the ‘Scientific R&D’
sector focus on a narrow set of
technological competences
whereas those in ‘Machinery’ rely
on a more diversified technology
base
0
20
40
60
80
100%
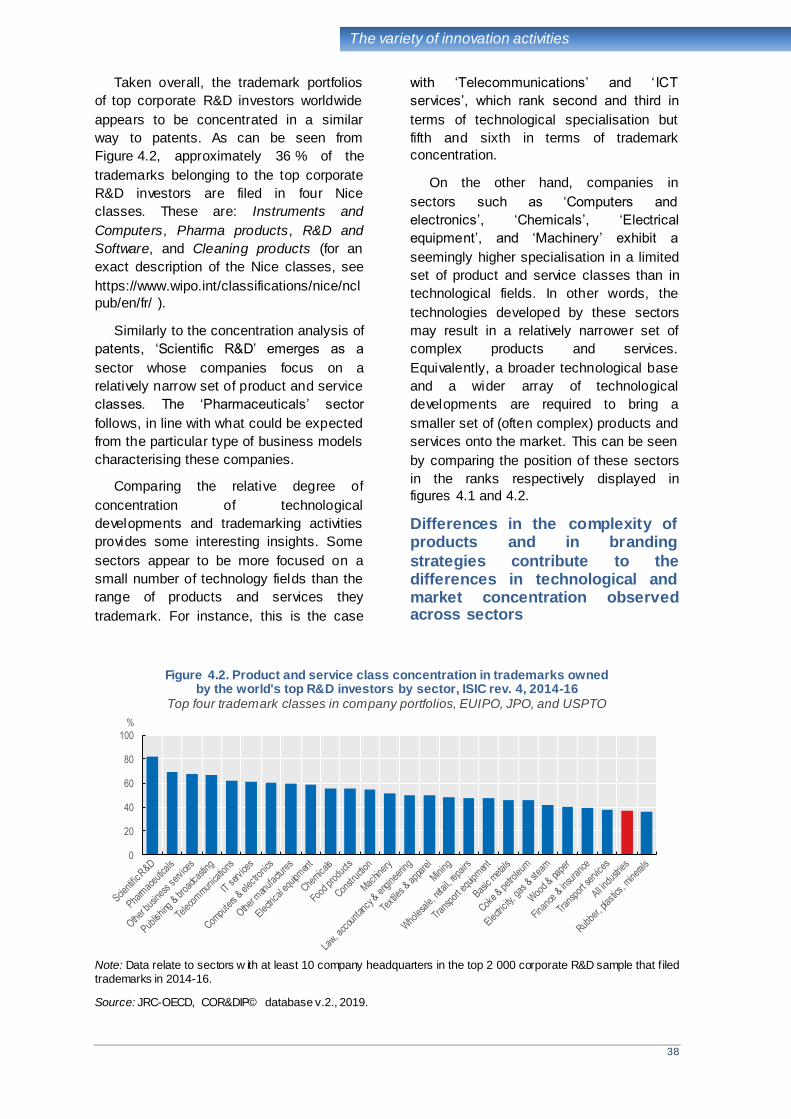
38
The variety of innovation activities
Taken overall, the trademark portfolios
of top corporate R&D investors worldwide
appears to be concentrated in a similar
way to patents. As can be seen from
Figure 4.2, approximately 36 % of the
trademarks belonging to the top corporate
R&D investors are filed in four Nice
classes. These are: Instruments and
Computers, Pharma products, R&D and
Software, and Cleaning products (for an
exact description of the Nice classes, see
https://www.wipo.int/classifications/nice/ncl
pub/en/fr/ ).
Similarly to the concentration analysis of
patents, ‘Scientific R&D’ emerges as a
sector whose companies focus on a
relatively narrow set of product and service
classes. The ‘Pharmaceuticals’ sector
follows, in line with what could be expected
from the particular type of business models
characterising these companies.
Comparing the relative degree of
concentration of technological
developments and trademarking activities
provides some interesting insights. Some
sectors appear to be more focused on a
small number of technology fields than the
range of products and services they
trademark. For instance, this is the case
with ‘Telecommunications’ and ‘ICT
services’, which rank second and third in
terms of technological specialisation but
fifth and sixth in terms of trademark
concentration.
On the other hand, companies in
sectors such as ‘Computers and
electronics’, ‘Chemicals’, ‘Electrical
equipment’, and ‘Machinery’ exhibit a
seemingly higher specialisation in a limited
set of product and service classes than in
technological fields. In other words, the
technologies developed by these sectors
may result in a relatively narrower set of
complex products and services.
Equivalently, a broader technological base
and a wider array of technological
developments are required to bring a
smaller set of (often complex) products and
services onto the market. This can be seen
by comparing the position of these sectors
in the ranks respectively displayed in
figures 4.1 and 4.2.
Differences in the complexity of products and in branding
strategies contribute to the differences in technological and market concentration observed across sectors
Figure 4.2. Product and service class concentration in trademarks owned by the world's top R&D investors by sector, ISIC rev. 4, 2014-16
Top four trademark classes in company portfolios, EUIPO, JPO, and USPTO
Note: Data relate to sectors w ith at least 10 company headquarters in the top 2 000 corporate R&D sample that f iled
trademarks in 2014-16.
Source: JRC-OECD, COR&DIP© database v.2., 2019.
0
20
40
60
80
100
%

39
The variety of innovation activities
An analysis of the breadth of the
scientific base that top corporate R&D
investors contribute to developing and rely
upon also reveals significant differences
across sectors, as shown in Figure 4.3. On
average, approximately 57 % of the
scientific publications made by authors
affiliated to the top corporate R&D
investors only relate to 4 out of 27 of the
main fields listed in the Elsevier
classification of scientific articles. Generally
speaking, this means that more than half of
the scientific production of each company
in the dataset concern a relatively narrowly
set of scientific developments.
Box 4.1. Classifying IP rights and publications Patents and trademarks are classif ied by Intellectual Property off ices during the examination procedure (in
the case of patents) or the registration process (for trademarks) according to internationally-agreed
classif ications. Bibliographic experts group scientif ic publications into main subject areas.
Patent examiners attribute International Patent Classification (IPC) codes to patents to denote the
technology domains to w hich inventions belong (see http://www.w ipo.int/classif ications/ipc). The IPC
classif ication groups technologies into eight main sections, w hich in total feature approximately 70 000
subdivisions. In the present report, IPC codes are aggregated into 35 technological f ields according to the concordance proposed by WIPO (2013, revised in 2018). The list of technology f ields is provided in
Appendix D.
Trademarks applications are f iled follow ing the International Classification of Goods and Services
which is also know n as the Nice Classif ication (NCL). This classif ication consists of 34 classes covering a
w ide range of goods and 11 c lasses relating to services (see: http://www.wipo.int/classif ications/nice/en/,
and Appendix E).
Bibliometr ic data are classif ied according to the All Science and Journal Classification (ASJC). Elsevier
assigns each journal in Scopus (w hich is one of the largest abstract and citation databases of peer -
review ed literature) to one or more subjects using ASJC. There are 27 main f ields compris ing 334 subjects
in the classif ication, as detailed in Appendix F of this publication (see also: https://service.elsevier.com/app/
overview /scopus).
Analysis of applied research and
product development reveals that
‘Scientific R&D’ sector is the most
concentrated. About 85 % of scientific
articles authored by employees affiliated to
the companies operating in this sector are
in four scientific fields (Medicine;
Biochemistry, Genetics, and Molecular
Biology; Pharmacology, Toxicology and
Pharmaceutics, and Immunology and
Microbiology).
As in the case of trademarks, the
‘Pharmaceuticals’ sector ranks second with
a concentration index related to scientific
publications of almost 80 %. At the other
end of the spectrum, ‘Chemicals’ and
‘Finance and insurance’ are the sectors
reporting the lowest degrees of scientific
specialisation, as shown by 𝐶𝑅4 ratios
being slightly below 50 %.
Taken together, the specialisation
indexes proposed tell a story of sector
specificities. The way companies innovate
and bring their innovative products and
services onto the market differs depending
on the sectors in which these companies
operate. Basic research, applied research,
and product and service development - as
captured by scientific publications, patents,
and trademark registrations, respectively –
play a different role in different sectors.
Some sectors, such as ‘Scientific R&D’, are
highly specialised in their production of
basic and applied research as well as in
the type of product and services they
develop while other sectors present varying
degrees of specialisation in the core set of
competences they rely upon during the
innovation process.
Basic research, applied research,
and product and service
development play a very different
role in companies competing to be
at the top in different sectors

40
The variety of innovation activities
Figure 4.3. Scientific concentration in the publication portfolios of the world's top R&D investors by sector, ISIC rev. 4, 2014-16
Share of top four scientific fields in publications by sector
Note: Data relate to sectors w ith at least 10 company headquarters in the top 2 000 corporate R&D sample w ith
publications in 2014-16.
Source: JRC-OECD, COR&DIP© database v.2., 2019.
4.2 Top competence areas by sector
The technological capabilities of
companies often show regularities that
allow them to be grouped and competition
in technological markets to be
characterised (Gkotsis et al., 2018). For
example, recent evidence shows that the
development of environmental-related
innovations in the automotive sector has
led to patents being applied in relation to
three main technological trajectories: green
internal combustion engines,
electric/hybrid, and mixed/complex
technologies (Faria and Andersen, 2017).
In attempting to shed light on the key
scientific technological and product
developments on which top corporate R&D
investors focus, the three figures that follow
show the sectors on the left-hand side and
on the right-hand side the type of output
considered, which companies contributed
to developing (i.e., patents, trademarks,
and scientific publications, respectively).
The size of the bars on the left-hand side
denotes the proportion of the overall
innovative output generated by the sector
considered. Conversely, the size of the
bars on the right-hand side mirrors, for
example, the way patents in considered
technology are filed by the top corporate
R&D investors, as a proportion of their
overall patent port folio. Furthermore, two
flows depart from each sectors listed on
the left hand side, each corresponding to
the top two technology fields, product and
service class, or scientific fields to which
they contribute. Again, the relative size of
these flows mirrors the relative importance
of these developments in the sector
considered.
Figure 4.4 shows the top two
technology fields that sectors focus the
most on. As previously mentioned, this
figure may be read from different
perspectives. These include considering
the shares of top technologies (right axis)
developed overall or the extent to which
different sectors contribute to develop
different technologies, (the flows between
the left and the right axis) may be
examined to see the most significant
contributors in different technology fields.
0
20
40
60
80
100%

41
The variety of innovation activities
Figure 4.4. Top two technologies patented by sector, ISIC rev.4, 2014-16 Share in total IP5 patent families owned by the world's top R&D investors
Note: Data relate to sectors w ith at least 50 company headquarters in the top 2 000 corporate R&D sample that f iled
patents in 2014-16.
Source: JRC-OECD, COR&DIP© database v.2., 2019.
The majority of patents filed by top
corporate R&D investors relate to
Computer Technology and Digital
Communication, both fields related to ICT
technologies and digitalisation. These
inventions mainly originate from companies
operating in the ‘Computers and
electronics’ and ‘ICT services’ sectors.
Interestingly, Computer Technology
(together with Optics) is also the
technology most frequently developed by
the ‘Machinery’ sector, a fact which
highlights the importance of digitalisation
and automation for the sector. Similarly,
technological developments related to
Electrical Machinery appear to be highly
relevant for the ‘Basic Metal’ sector.
Transport and Engines, pumps, turbines
are the two main technological fields in
which companies in the ‘Transport
equipment’ sector file for patents, and
together they represent approximately
43 % of the patent portfolio of this sector.
Medical and chemical related
technologies are also highly patented by
companies in the overall sample. These
technologies are among those that are
most developed by a number of selected
sectors, including ‘Food products’,
‘Chemicals’, ‘Pharmaceuticals’, and ‘Other

42
The variety of innovation activities
manufactures’. Figure 4.4 also
characterises the patent portfolio of
companies operating in ‘Scientific R&D’,
with approximately 51 % being filed in
Pharmaceuticals and 30 % in
Biotechnology.
More than 80 % of patents owned
by ‘Scientific R&D’ sector relate to
Pharmaceuticals and
Biotechnology, suggesting a
growing importance of (highly)
specialised suppliers in the
medical industries
Figure 4.5 offers a picture similar to that
shown in Figure 4.4, but applied to the two
product and service trademark classes
most frequently registered by the top R&D
investors worldwide by sector.
Similar to patents, registered
trademarks are broadly consistent with the
type of products and services that the
sectors considered could be expected to
specialise in. Most trademarked products
and services directly relate to the industrial
classification of companies although some
peculiarities worth noticing do emerge.
Figure 4.5. Top two goods and services registered by sector, ISIC rev.4, 2014-16 Share in total trademarks owned by the world’s top R&D investors
Note: Data relate to sectors w ith at least 50 company headquarters in the top 2 000 corporate R&D sample that f iled
trademarks in 2014-16. Class titles correspond to short labels based on the Nice Classif ication. For an exact
description of the classes, see https://www.wipo.int/classif ications/nice/nclpub/en/fr/
Source: JRC-OECD, COR&DIP© database v.2., 2019.

43
The variety of innovation activities
Firstly, the top trademarked products by
‘Chemicals’ companies fall in the Cleaning
and Pharma products classes. The former
is a broad product category also including
non-medicated cosmetics and toothpastes,
toiletry preparations, perfumery, essential
oils, bleaching preparations, and other
substances. Therefore, it should not be
seen as strictly related to cleaning products
and this is confirmed by the fact that it is
among the top 4 classes protected by
‘Pharmaceuticals’ companies.
Secondly, Instruments & computers is
among the two most frequent classes used
by several non-ICT sectors: ‘Basic metals’,
‘Machinery’, ‘Transport equipment’, ‘Other
manufactures’, ‘Publishing and
broadcasting’, and ‘Finance and
insurance’.
Registered trademarks confirm the
importance of developing digitally
related products for a wide
spectrum of industrial sectors
Finally, the most frequent product and
services developed by ‘Scientific R&D’
companies are Pharma products and R&D
and software. This evidence helps to
further characterise this group of
companies in the top corporate R&D
sample and also highlights the importance
of digitalisation in the discovery and
commercialisation of new drugs.
Figure 4.6 shows the two most frequent
classification fields to which the scientific
publications authored by staff affiliated to
the top R&D investors worldwide belong.
It is worth noting that publications by the
top R&D corporate investors in the world
broadly fall into seven main scientific
classes. This confirms some of the stylised
facts proposed so far and suggests the
importance of a somewhat specialised
knowledge base for the development of a
relatively wider array of technological
solutions. Scientific publications further
appear to relate to scientific fields that are
directly related to the industrial
classification of companies.
Top corporate R&D investors
focus their scientific publications
in Engineering, Computer Science,
and Medicine
Approximately, 16 % of the total number
of publications belonging to the firms in the
sample is classified as Engineering- related
publications. Companies in the 'Computers
and electronics' sector are responsible for
6.3 % of total publications in this field,
which represents 31 % of the sector's total
publications. A considerable amount of
Engineering-related publications is
contributed by firms in 'Transport
equipment', which hold 4.5 % of total
publications in this field. This represents
almost 39 % of total publications from firms
in the sector, the second most important
field being physics and Astronomy with
12 %.
Engineering also emerges as being
highly important in the research performed
by companies in sectors such as 'Electrical
equipment', 'Machinery', and 'Basic
metals', where this scientific field
represents more than 30 % of publications.
Computer Science is the second most
important field for ‘Electrical equipment’
and ‘Machinery’, while 'Basic metals' is
active in the Material Science field.
On the other hand, Medicine and
Computer Science related publications
represent 10 % each of the total number of
publications in the sample.
The majority of the Medicine-related
publications (7.9 %) come from firms in the
'Pharmaceuticals' sector, which appear to
focus 43 % of their total publications in this
field. Conversely, another 17 % relate to
Biochemistry, Genetics and Molecular
Biology.
The main body of Computer Science-
related publications in the sample comes
from companies in the 'Computers and
electronics' sector (4.6 %) and in the 'IT
services' sector (2.5 %).
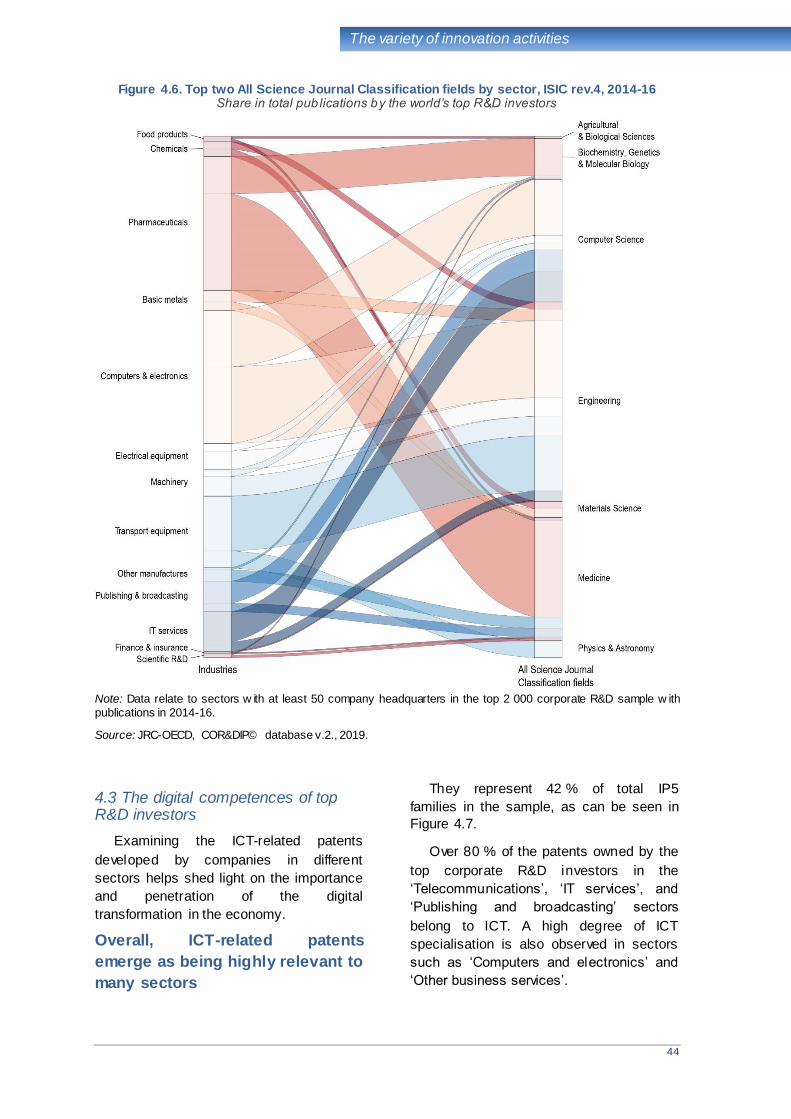
44
The variety of innovation activities
Figure 4.6. Top two All Science Journal Classification fields by sector, ISIC rev.4, 2014-16 Share in total publications by the world’s top R&D investors
Note: Data relate to sectors w ith at least 50 company headquarters in the top 2 000 corporate R&D sample w ith
publications in 2014-16.
Source: JRC-OECD, COR&DIP© database v.2., 2019.
4.3 The digital competences of top R&D investors
Examining the ICT-related patents
developed by companies in different
sectors helps shed light on the importance
and penetration of the digital
transformation in the economy.
Overall, ICT-related patents
emerge as being highly relevant to
many sectors
They represent 42 % of total IP5
families in the sample, as can be seen in
Figure 4.7.
Over 80 % of the patents owned by the
top corporate R&D investors in the
‘Telecommunications’, ‘IT services’, and
‘Publishing and broadcasting’ sectors
belong to ICT. A high degree of ICT
specialisation is also observed in sectors
such as ‘Computers and electronics’ and
‘Other business services’.

45
The variety of innovation activities
Figure 4.7. ICT patents owned by the world's top R&D investors by sector, ISIC rev. 4, 2014-16 Share in IP5 patent families by sector
Note: Data relate to sectors w ith at least 10 company headquarters in the top 2 000 corporate R&D sample that f iled
patents in 2014-16.
Source: JRC-OECD, COR&DIP© database v.2., 2019.
At the other end of the spectrum
‘Pharmaceuticals’, ‘Food products’, and
'Scientific R&D' firms have the lowest
shares of ICT patents in their portfolios,
with ICT patents that respectively account
for approximately 5 %, 4 %, and 1 % of
their overall portfolio.
Figure 4.8 shows the ICT-related
trademarks registered at EU IPO, JPO, and
USPTO by the top R&D investors as a
share of the total number of trademarks in
their portfolio, with statistics that are
displayed at the sector level. This figure
only displays the statistics for those sectors
with at least 10 firms in the top 2 000 list.
Figure 4.8. ICT-related trademarks owned by the world's top R&D investors by sector, ISIC rev. 4, 2014-16
Share in total trademarks by sector, EUIPO, JPO, and USPTO
Note: Data relate to sectors w ith at least 10 company headquarters in the top 2 000 corporate R&D sample that f iled
trademarks in 2014-16.
Source: JRC-OECD, COR&DIP© database v.2., 2019.
0
20
40
60
80
100
%
0
20
40
60
80
100
%
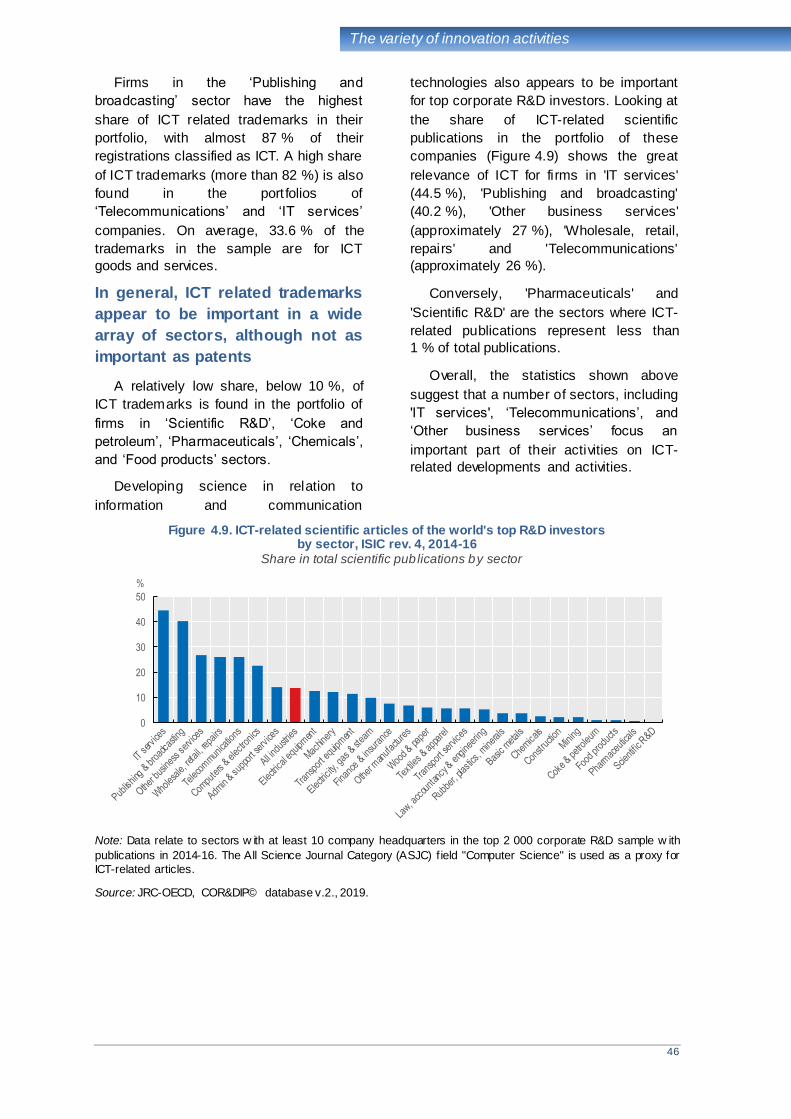
46
The variety of innovation activities
Firms in the ‘Publishing and
broadcasting’ sector have the highest
share of ICT related trademarks in their
portfolio, with almost 87 % of their
registrations classified as ICT. A high share
of ICT trademarks (more than 82 %) is also
found in the port folios of
‘Telecommunications’ and ‘IT services’
companies. On average, 33.6 % of the
trademarks in the sample are for ICT
goods and services.
In general, ICT related trademarks
appear to be important in a wide
array of sectors, although not as
important as patents
A relatively low share, below 10 %, of
ICT trademarks is found in the portfolio of
firms in ‘Scientific R&D’, ‘Coke and
petroleum’, ‘Pharmaceuticals’, ‘Chemicals’,
and ‘Food products’ sectors.
Developing science in relation to
information and communication
technologies also appears to be important
for top corporate R&D investors. Looking at
the share of ICT-related scientific
publications in the portfolio of these
companies (Figure 4.9) shows the great
relevance of ICT for firms in 'IT services'
(44.5 %), 'Publishing and broadcasting'
(40.2 %), 'Other business services'
(approximately 27 %), 'Wholesale, retail,
repairs' and 'Telecommunications'
(approximately 26 %).
Conversely, 'Pharmaceuticals' and
'Scientific R&D' are the sectors where ICT-
related publications represent less than
1 % of total publications.
Overall, the statistics shown above
suggest that a number of sectors, including
'IT services', ‘Telecommunications’, and
‘Other business services’ focus an
important part of their activities on ICT-
related developments and activities.
Figure 4.9. ICT-related scientific articles of the world's top R&D investors by sector, ISIC rev. 4, 2014-16
Share in total scientific publications by sector
Note: Data relate to sectors w ith at least 10 company headquarters in the top 2 000 corporate R&D sample w ith
publications in 2014-16. The All Science Journal Category (ASJC) f ield "Computer Science" is used as a proxy for
ICT-related articles.
Source: JRC-OECD, COR&DIP© database v.2., 2019.
0
10
20
30
40
50
%
47
Shaping AI development
5. Shaping AI development: The role of Top R&D investors
5.1 Top innovators in Artificial Intelligence
Artificial Intelligence (AI) is high on the
agenda of both businesses and
governments (EC COM (2018)237). AI is
expected to have far-ranging societal and
economic repercussions in the near future
(OECD 2018). Although the term was
initially coined in 1950, recent advances in
the field have further fuelled the
development of AI-related applications also
transforming non-ICT related sectors and
creating value that many are trying to
appropriate (Baruffaldi et al, 2019).
Many consider AI to be a general
purpose technology, one which may bring
about a major technological shift like the
one triggered by the World Wide Web
(WIPO 2019, Craglia et al., 2018). As such,
AI is not only expected to have an impact
on the (technological) competitiveness of
economic actors, but it is also expected to
change the way people think, act, and
interact between each other and with
machines (Gomez et al., 2018).
While discussing the possible impact of
AI on economies and societies is
interesting, it remains outside the scope of
the present work. Here the focus is on
understanding the role that top corporate
R&D investors are playing in the
development and use of AI given that they
represent key actors in the innovation
space. The analysis presented in this
chapter aims to shed light on basic and
applied research, and AI product and
service development that top corporate
R&D investors worldwide are responsible
for.
Measuring AI is still in its infancy and
various researchers and institutions are
developing a number of measurement
frameworks (for example, see WIPO 2019,
IPO 2019, or the EC AI Watch Knowledge
Service to monitor the Development,
Uptake and Impact of Artificial Intelligence
for Europe). The operational definition of AI
used in the present report relies on the
experimental measurement framework
developed by the OECD in collaboration
with the Max Plank Institute and the
OECD-led IP Statistics Task Force (see
Baruffaldi et al., 2019, and Box 5.1).
Figure 5.1 displays the top 50
companies with the largest share of AI
related inventions in their patent portfolio.
The size of the font with which the names
of companies are written is proportional to
the share of relevant patents owned by
these companies. Names in dark blue font
correspond to companies in ICT-related
sectors.
The majority of the top corporate R&D
investors which contribute the most to
develop AI-related technologies appear to
be headquartered in Japan (21), in the
United States (12), in China (6), and in
Korea (4). When it comes to top AI
developers, only 4 companies are
headquartered in Europe (2 in Germany, 1
This chapter sheds light on Artificial Intelligence (AI)-related developments by top corporate R&D
investors worldwide. The analysis encompasses scientific publications, patents, and trademarks,
and additional information is also provided about the top 50 companies that most contribute to
developing artificial intelligence in terms of scientific and innovative output. The analysis then
moves from the firm to industry level, and shows the contribution of different sectors to the overall
production of AI related patents, trademarks, and publications. Further insights into the geographic
location where basic research and applied research on AI are pursued and products/services are
developed are also presented.
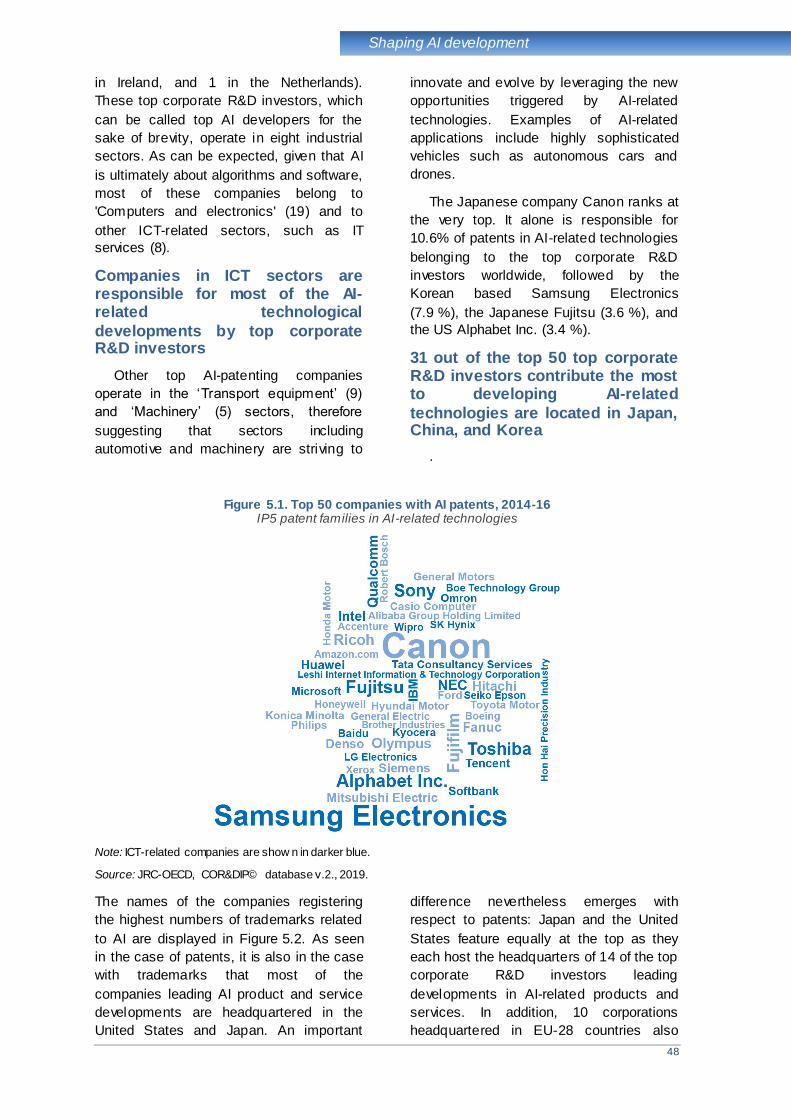
48
Shaping AI development
in Ireland, and 1 in the Netherlands).
These top corporate R&D investors, which
can be called top AI developers for the
sake of brevity, operate in eight industrial
sectors. As can be expected, given that AI
is ultimately about algorithms and software,
most of these companies belong to
'Computers and electronics' (19) and to
other ICT-related sectors, such as IT
services (8).
Companies in ICT sectors are responsible for most of the AI-related technological
developments by top corporate R&D investors
Other top AI-patenting companies
operate in the ‘Transport equipment’ (9)
and ‘Machinery’ (5) sectors, therefore
suggesting that sectors including
automotive and machinery are striving to
innovate and evolve by leveraging the new
opportunities triggered by AI-related
technologies. Examples of AI-related
applications include highly sophisticated
vehicles such as autonomous cars and
drones.
The Japanese company Canon ranks at
the very top. It alone is responsible for
10.6% of patents in AI-related technologies
belonging to the top corporate R&D
investors worldwide, followed by the
Korean based Samsung Electronics
(7.9 %), the Japanese Fujitsu (3.6 %), and
the US Alphabet Inc. (3.4 %).
31 out of the top 50 top corporate R&D investors contribute the most to developing AI-related
technologies are located in Japan, China, and Korea
.
Figure 5.1. Top 50 companies with AI patents, 2014-16 IP5 patent families in AI-related technologies
Note: ICT-related companies are show n in darker blue.
Source: JRC-OECD, COR&DIP© database v.2., 2019.
The names of the companies registering
the highest numbers of trademarks related
to AI are displayed in Figure 5.2. As seen
in the case of patents, it is also in the case
with trademarks that most of the
companies leading AI product and service
developments are headquartered in the
United States and Japan. An important
difference nevertheless emerges with
respect to patents: Japan and the United
States feature equally at the top as they
each host the headquarters of 14 of the top
corporate R&D investors leading
developments in AI-related products and
services. In addition, 10 corporations
headquartered in EU-28 countries also
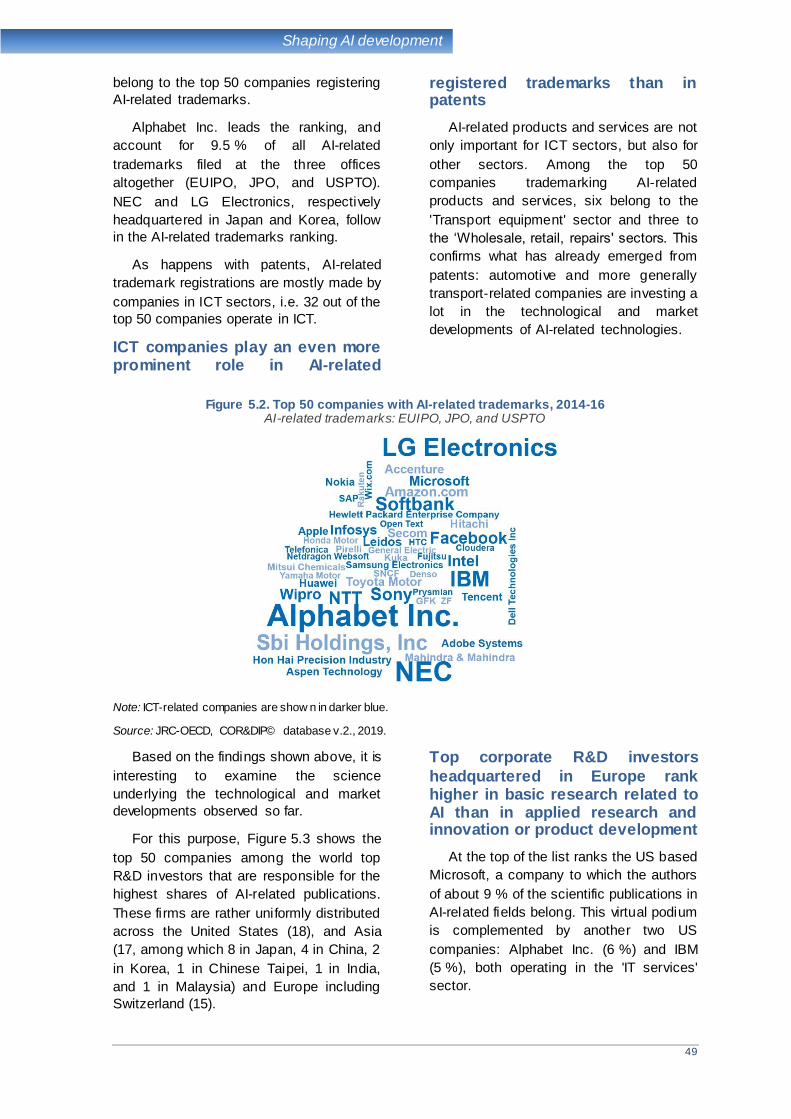
49
Shaping AI development
belong to the top 50 companies registering
AI-related trademarks.
Alphabet Inc. leads the ranking, and
account for 9.5 % of all AI-related
trademarks filed at the three offices
altogether (EUIPO, JPO, and USPTO).
NEC and LG Electronics, respectively
headquartered in Japan and Korea, follow
in the AI-related trademarks ranking.
As happens with patents, AI-related
trademark registrations are mostly made by
companies in ICT sectors, i.e. 32 out of the
top 50 companies operate in ICT.
ICT companies play an even more prominent role in AI-related
registered trademarks than in patents
AI-related products and services are not
only important for ICT sectors, but also for
other sectors. Among the top 50
companies trademarking AI-related
products and services, six belong to the
'Transport equipment' sector and three to
the ‘Wholesale, retail, repairs' sectors. This
confirms what has already emerged from
patents: automotive and more generally
transport-related companies are investing a
lot in the technological and market
developments of AI-related technologies.
Figure 5.2. Top 50 companies with AI-related trademarks, 2014-16 AI-related trademarks: EUIPO, JPO, and USPTO
Note: ICT-related companies are show n in darker blue.
Source: JRC-OECD, COR&DIP© database v.2., 2019.
Based on the findings shown above, it is
interesting to examine the science
underlying the technological and market
developments observed so far.
For this purpose, Figure 5.3 shows the
top 50 companies among the world top
R&D investors that are responsible for the
highest shares of AI-related publications.
These firms are rather uniformly distributed
across the United States (18), and Asia
(17, among which 8 in Japan, 4 in China, 2
in Korea, 1 in Chinese Taipei, 1 in India,
and 1 in Malaysia) and Europe including
Switzerland (15).
Top corporate R&D investors
headquartered in Europe rank higher in basic research related to AI than in applied research and innovation or product development
At the top of the list ranks the US based
Microsoft, a company to which the authors
of about 9 % of the scientific publications in
AI-related fields belong. This virtual podium
is complemented by another two US
companies: Alphabet Inc. (6 %) and IBM
(5 %), both operating in the 'IT services'
sector.
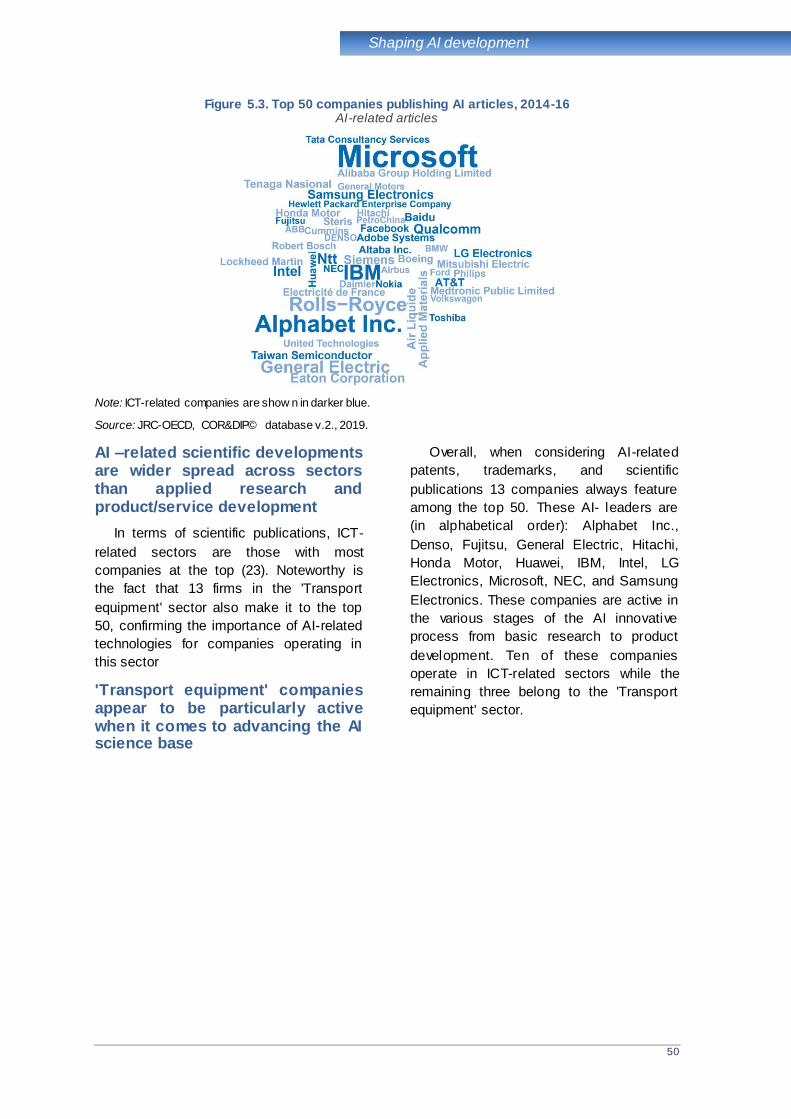
50
Shaping AI development
Figure 5.3. Top 50 companies publishing AI articles, 2014-16 AI-related articles
Note: ICT-related companies are show n in darker blue.
Source: JRC-OECD, COR&DIP© database v.2., 2019.
AI –related scientific developments are wider spread across sectors than applied research and product/service development
In terms of scientific publications, ICT-
related sectors are those with most
companies at the top (23). Noteworthy is
the fact that 13 firms in the 'Transport
equipment' sector also make it to the top
50, confirming the importance of AI-related
technologies for companies operating in
this sector
'Transport equipment' companies appear to be particularly active when it comes to advancing the AI science base
Overall, when considering AI-related
patents, trademarks, and scientific
publications 13 companies always feature
among the top 50. These AI- leaders are
(in alphabetical order): Alphabet Inc.,
Denso, Fujitsu, General Electric, Hitachi,
Honda Motor, Huawei, IBM, Intel, LG
Electronics, Microsoft, NEC, and Samsung
Electronics. These companies are active in
the various stages of the AI innovative
process from basic research to product
development. Ten of these companies
operate in ICT-related sectors while the
remaining three belong to the 'Transport
equipment' sector.
51
Shaping AI development
Box 5.1: Identifying Artificial Intelligence patents, trademarks, and scientific publications Artif icial intelligence (AI) is a term used to describe machines performing human-like cognitive functions
(e.g., learning, understanding, reasoning, and interacting). It refers to machine-based systems that are
capable of influencing the environment by making recommendations, predictions , or decisions for a given
set of objectives (OECD, 2019).
The boundaries betw een AI and other innovations are at times blurred and constantly evolving. AI
developments began in the 1950s + w hen pioneers in computing, mathematics, psychology, and statistics
set out to solve some concrete problems in order to make machines that can “think” (Turing, 1950). These
included playing games, classifying images, and understanding natural language.
Detecting the development of AI is therefore challenging. The OECD jointly w ith the Max Planck Institute for
Innovation and Competit ion (MPI), and benefitting from the support of the experts belonging to the OECD-
led IP Statist ic Task Force,* devised a three-pronged approach to identifying and measuring developments
in A I. The approach relies on exploring developments in science as captured in scientif ic publications;
technological developments, softw are especially open source softw are, and as proxied by patents... It
involves identifying documents (publications, patents, and softw are) that can be unambiguous ly related to
AI as w ell as using expert advice (for details see Baruffaldi et al., 2019).
AI Articles
AI-related documents are identif ied using a list of AI-related keyw ords to search scientif ic documents,
especially abstracts and tit les. These keyw ords w ere selected on the basis of an analysis of w ord
frequencies and co-occurrence patterns, w ith the start ing point being the f requency patterns of the terms
used in journals classif ied as being A I-focused in the Elsevier ’s SCOPUS © database. To avoid over-
identif ication and to account for the fact that some AI-related terms may also be used in non-AI sett ings,
only documents w ith tw o or more keyw ords w ere considered as being AI-related.
AI-related patents
An experimental approach – based on patent classif ication codes, keyw ords obtained from the analysis of
AI-related scientif ic publications, and a combination of these tw o – was taken to search patent documents
in order to identify AI-related inventions contained in patent applications. This patent-based approach,
init ially developed by the OECD and MPI, w as further refined through w ork carried out under the aegis of
the OECD-led Intellectual Property (IP) Statistics Task Force, benefitting in particular from the advice of
experts and patent examiners at selected IP off ices.
AI-related trademarks
Trademark registrations for AI-related products or services are identif ied using keyw ord searches
performed on text describing items protected by registered trademarks. The list of keyw ords derives from
those obtained from the publication analysis, and has been refined using advice from IP experts. No class-
based approach is implemented in the case of trademarks as no AI-specif ic codes could be identif ied in the
list of goods and services contained in the NICE classif ication.
* OECD IP data activities are carried out in close co-operation with the members of the IP Statistics Task
Force, which gathers representatives from about 20 IP offices worldwide (see http://oe.cd/ipstats). The
work on AI measurement specifically benefitted from useful inputs from experts and patent examiners from
IP Australia, the Canadian Intellectual Property Office (CIPO), the European Patent Office (EPO), the Israel
Patent Office (ILPO), the Italian Patent and Trademark Office (UIBM), the National Institute for Industrial
Property of Chile (INAPI), the United Kingdom Intellectual Property Office (UK IPO), and the United States
Patent and Trademark Office (USPTO)
5.2 Innovative activities in AI: the industrial perspective
As already shown in chapter 4, the way
innovative activities are performed is highly
heterogeneous across firms and often
depends on sector specificities. This
heterogeneity is well captured in Figure 5.4
which displays the share of AI patents,
trademarks, and scientific publications that
belong to the 5 sectors that emerge as
being most active in the field.
The development of AI-related
patents is concentrated in a few sectors: almost half AI patents by top R&D investors are filed by companies in 'Computers and electronics'

52
Shaping AI development
Almost 91 % of the AI-related patent
families are filed in only 5 sectors by the
top R&D investors worldwide, of which
46% are owned by companies operating in
'Computers and electronics', followed by
‘Machinery’ (18 %).
‘IT Services’ and 'Computers and electronics' account for about 70 % of AI-related trademarks while AI-related publications are more evenly distributed across sectors
The top 5 sectors are responsible for
82 % of the total AI-related trademark
registrations. 'IT services' companies
register the highest share of AI-trademarks
(34 %) closely followed by those operating
in the 'Computer and electronics' sector
(32 %).
The generation of new scientific AI
knowledge is relatively less concentrated
than patents and trademarks. The top 5
sectors that contribute the most to
advancing AI-related scientific
developments account for approximately
73 % of these publications.
Companies in 'Computer and
electronics', 'Transport equipment', and 'IT
services' each publish about one fifth of all
AI-related documents published by the top
R&D investors worldwide. These three
sectors feature among the top 5 sectors
generating AI patents, trademarks, and
scientific publications as shown in
Figure 5.4.
Figure 5.4. Top 5 sectors in Artificial Intelligence, ISIC rev.4, 2014-16 Patents, trademarks, and publications
Source: JRC-OECD, COR&DIP© database v.2., 2019.
Taken together, the stylised facts
displayed above suggest that while ICT-
related sectors are at the forefront of AI
developments, other sectors, such as
'Transport equipment', are also very active
and exploit and develop the potential of AI.
The relative intensity of AI-related
patents filings by sectors is presented in
Figure 5.5. This shows AI-related patents
as a share of the total number of patents in
the portfolio of top corporate R&D investors
by sector.
Overall, approximately 1.6 % of the
sample’s patent portfolio relate to AI
technologies. 'IT services' (8 %), 'Other
business services' (7.6 %), and 'Publishing
and broadcasting' (5.5 %) are by far the
most AI-intensive sectors in patent filings.
0
10
20
30
40
50
%Patents
0
10
20
30
40
50
%Publications
0
10
20
30
40
50
%Trademarks

53
Shaping AI development
Companies in service sectors account for a high share of AI related patents
'Wholesale, retail, repairs', 'Machinery',
and 'Computer and electronics' also display
above average shares in AI-related
patents.
Figure 5.5. AI-related patents of world's top R&D investors by sector, ISIC rev. 4, 2014-16 Share in IP5 patent families by sector
Note: Data relate to sectors with at least 10 company headquarters in the top 2 000 corporate R&D sample that AI
f iled patents in 2014-16.
Source: JRC-OECD, COR&DIP© database v.2., 2019.
Similar to the patent figure above,
Figure 5.6 displays the proportion of AI
trademark registrations owned by the top-
2 000 R&D investors worldwide as a share
of total trademarks owned, by sector.
Similar to patents, companies in the 'IT
services' sector are those reporting the
highest share of AI-related trademarks,
albeit smaller than that of patents (1.4 %),
followed by 'Other business services'
(1.1 %). Overall, the number of AI-related
trademarks remains low in all of the sectors
considered.
Figure 5.6. AI-related trademarks of the world's top R&D investors by sector, ISIC rev. 4, 2014-16 Share in total trademarks by sector, EUIPO, JPO, and USPTO
Note: Data relate to sectors w ith at least 10 company headquarters in the top 2 000 corporate R&D sample that f iled
for AI-related trademarks in 2014-16.
Source: JRC-OECD, COR&DIP© database v.2., 2019.
0
2
4
6
8%
0.0
0.2
0.4
0.6
0.8
1.0
1.2
1.4
%
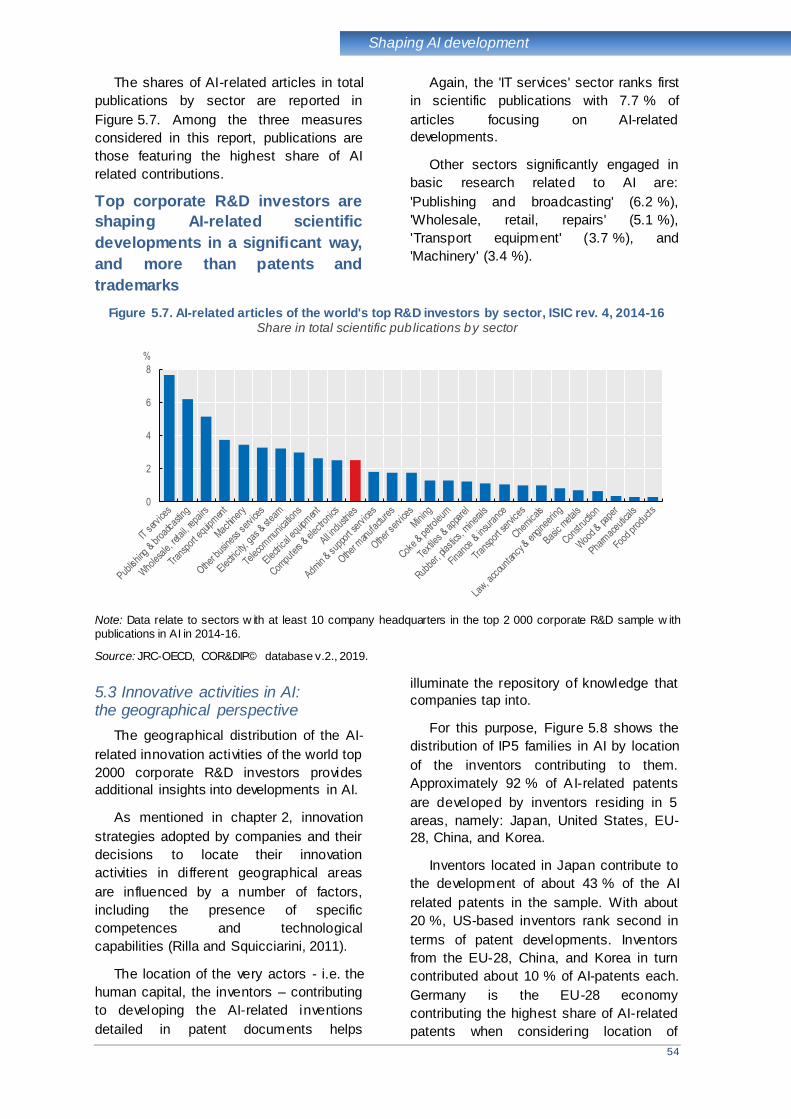
54
Shaping AI development
The shares of AI-related articles in total
publications by sector are reported in
Figure 5.7. Among the three measures
considered in this report, publications are
those featuring the highest share of AI
related contributions.
Top corporate R&D investors are
shaping AI-related scientific
developments in a significant way,
and more than patents and
trademarks
Again, the 'IT services' sector ranks first
in scientific publications with 7.7 % of
articles focusing on AI-related
developments.
Other sectors significantly engaged in
basic research related to AI are:
'Publishing and broadcasting' (6.2 %),
'Wholesale, retail, repairs' (5.1 %),
'Transport equipment' (3.7 %), and
'Machinery' (3.4 %).
Figure 5.7. AI-related articles of the world's top R&D investors by sector, ISIC rev. 4, 2014-16 Share in total scientific publications by sector
Note: Data relate to sectors w ith at least 10 company headquarters in the top 2 000 corporate R&D sample w ith
publications in AI in 2014-16.
Source: JRC-OECD, COR&DIP© database v.2., 2019.
5.3 Innovative activities in AI: the geographical perspective
The geographical distribution of the AI-
related innovation activities of the world top
2000 corporate R&D investors provides
additional insights into developments in AI.
As mentioned in chapter 2, innovation
strategies adopted by companies and their
decisions to locate their innovation
activities in different geographical areas
are influenced by a number of factors,
including the presence of specific
competences and technological
capabilities (Rilla and Squicciarini, 2011).
The location of the very actors - i.e. the
human capital, the inventors – contributing
to developing the AI-related inventions
detailed in patent documents helps
illuminate the repository of knowledge that
companies tap into.
For this purpose, Figure 5.8 shows the
distribution of IP5 families in AI by location
of the inventors contributing to them.
Approximately 92 % of AI-related patents
are developed by inventors residing in 5
areas, namely: Japan, United States, EU-
28, China, and Korea.
Inventors located in Japan contribute to
the development of about 43 % of the AI
related patents in the sample. With about
20 %, US-based inventors rank second in
terms of patent developments. Inventors
from the EU-28, China, and Korea in turn
contributed about 10 % of AI-patents each.
Germany is the EU-28 economy
contributing the highest share of AI-related
patents when considering location of
0
2
4
6
8
%

55
Shaping AI development
inventors. Despite the small number of
Indian-based companies among the top
corporate R&D investors worldwide, Indian
inventors contributed to developing 2.5 %
of AI-related inventions, more than the
United Kingdom (2.4 %), Chinese Taipei
(1.8 %), and France (1.5 %).
Two thirds of AI-related patents are
developed by inventors residing in
Asia (approximately 43 % in Japan,
10 % in China, and 10 % in Korea)
Inventors located in Asia are leading
technological developments in AI,
confirming the strong specialisation of
Asian economies in the development of
ICT innovations in general, and of AI in
particular.
Figure 5.8. AI-related patents of the world's top R&D investors by inventor's location, 2014-16 Share in AI-related IP5 patent families
Source: JRC-OECD, COR&DIP© database v.2., 2019.
In contrast, a different picture emerges
when registered trademarks protecting
products and services in AI are considered.
Figure 5.9 shows the distribution of AI
trademarks according to the location of
their applicants. The United States is the
economy registering the most AI related
trademarks with about 34 % of AI owned
by companies’ affiliates located in the US.
Japan ranks second (30 %), followed by
the EU-28 (16 %), and Korea (8 %). Lastly,
Chinese affiliates own a small portion of AI-
related trademarks (1.8 %).
When considering AI related
trademarks in the sample,
applicants from Asia are behind
compared to the United States and
the EU-28
The United Kingdom takes the leading
position within EU-28 economies, with
about 7 % of AI-trademarks registered by
affiliates located in the country. Indian firms
are also relatively active in protecting AI-
related products and services.
As in the case of AI related patents, AI
trademarks are also highly concentrated
geographically with the first two economic
areas together summing over 60 % of the
total number of trademark registered by the
top corporate R&D investors worldwide. In
both cases, the top two economies are
Japan (first when considering patents) and
the United States (first for trademarks
registrations). This can be taken as an
indication of the special and successful
focus put on AI technological and
commercial developments in these
economies.
0
10
20
30
40
50
% Top 6 economies
0.0
0.5
1.0
1.5
2.0
2.5
% Other economies
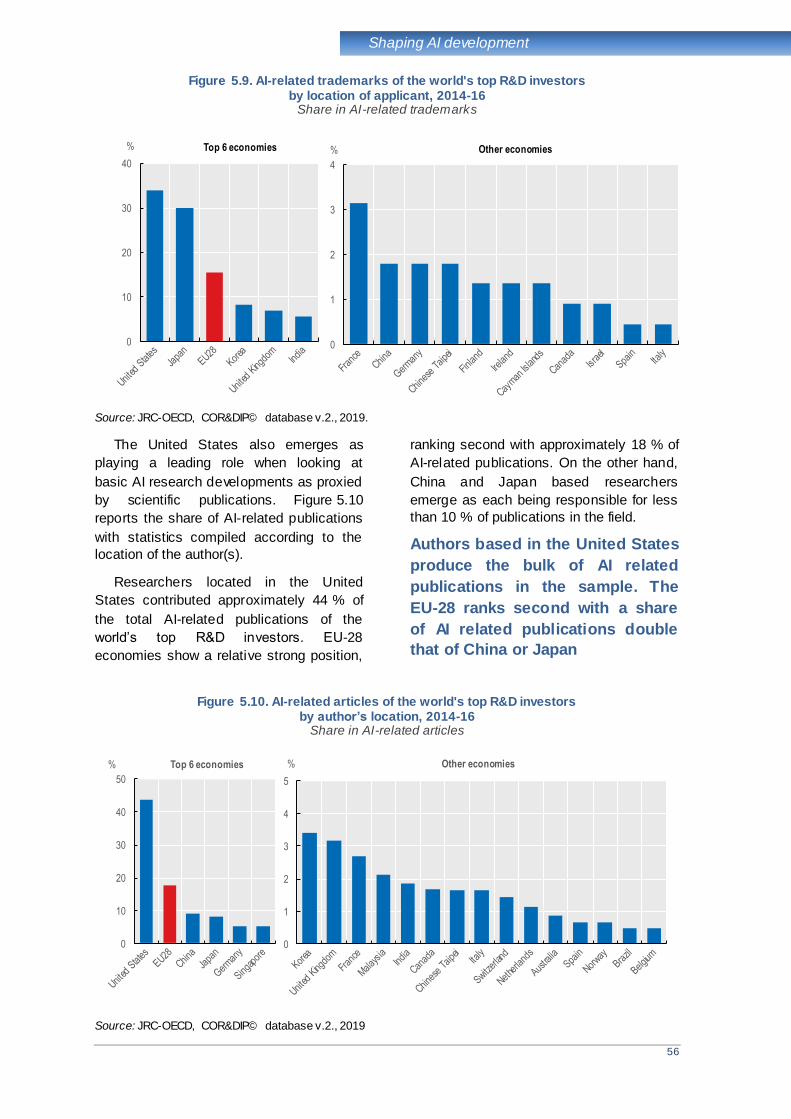
56
Shaping AI development
Figure 5.9. AI-related trademarks of the world's top R&D investors by location of applicant, 2014-16
Share in AI-related trademarks
Source: JRC-OECD, COR&DIP© database v.2., 2019.
The United States also emerges as
playing a leading role when looking at
basic AI research developments as proxied
by scientific publications. Figure 5.10
reports the share of AI-related publications
with statistics compiled according to the
location of the author(s).
Researchers located in the United
States contributed approximately 44 % of
the total AI-related publications of the
world’s top R&D investors. EU-28
economies show a relative strong position,
ranking second with approximately 18 % of
AI-related publications. On the other hand,
China and Japan based researchers
emerge as each being responsible for less
than 10 % of publications in the field.
Authors based in the United States
produce the bulk of AI related
publications in the sample. The
EU-28 ranks second with a share
of AI related publications double
that of China or Japan
Figure 5.10. AI-related articles of the world's top R&D investors by author’s location, 2014-16
Share in AI-related articles
Source: JRC-OECD, COR&DIP© database v.2., 2019
0
10
20
30
40
% Top 6 economies
0
1
2
3
4
% Other economies
0
10
20
30
40
50
% Top 6 economies
0
1
2
3
4
5
% Other economies
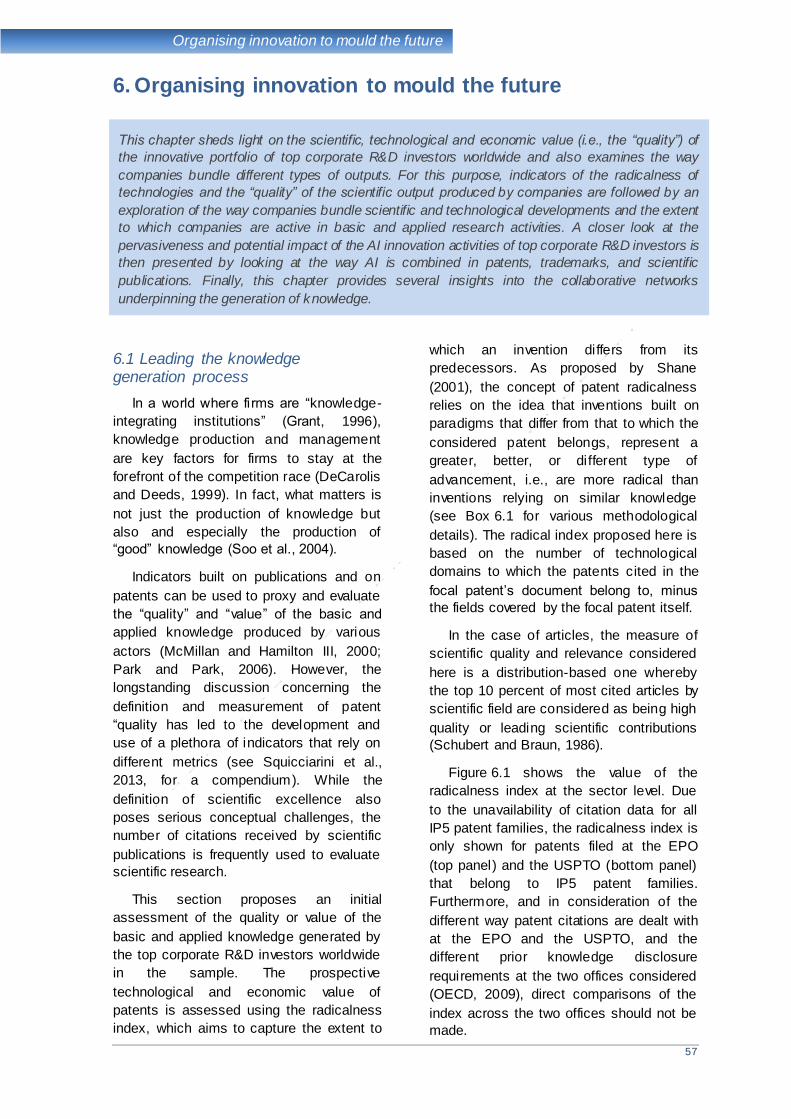
57
Organising innovation to mould the future
6. Organising innovation to mould the future
6.1 Leading the knowledge generation process
In a world where firms are “knowledge-
integrating institutions” (Grant, 1996),
knowledge production and management
are key factors for firms to stay at the
forefront of the competition race (DeCarolis
and Deeds, 1999). In fact, what matters is
not just the production of knowledge but
also and especially the production of
“good” knowledge (Soo et al., 2004).
Indicators built on publications and on
patents can be used to proxy and evaluate
the “quality” and “value” of the basic and
applied knowledge produced by various
actors (McMillan and Hamilton III, 2000;
Park and Park, 2006). However, the
longstanding discussion concerning the
definition and measurement of patent
“quality has led to the development and
use of a plethora of indicators that rely on
different metrics (see Squicciarini et al.,
2013, for a compendium). While the
definition of scientific excellence also
poses serious conceptual challenges, the
number of citations received by scientific
publications is frequently used to evaluate
scientific research.
This section proposes an initial
assessment of the quality or value of the
basic and applied knowledge generated by
the top corporate R&D investors worldwide
in the sample. The prospective
technological and economic value of
patents is assessed using the radicalness
index, which aims to capture the extent to
which an invention differs from its
predecessors. As proposed by Shane
(2001), the concept of patent radicalness
relies on the idea that inventions built on
paradigms that differ from that to which the
considered patent belongs, represent a
greater, better, or different type of
advancement, i.e., are more radical than
inventions relying on similar knowledge
(see Box 6.1 for various methodological
details). The radical index proposed here is
based on the number of technological
domains to which the patents cited in the
focal patent’s document belong to, minus
the fields covered by the focal patent itself.
In the case of articles, the measure of
scientific quality and relevance considered
here is a distribution-based one whereby
the top 10 percent of most cited articles by
scientific field are considered as being high
quality or leading scientific contributions
(Schubert and Braun, 1986).
Figure 6.1 shows the value of the
radicalness index at the sector level. Due
to the unavailability of citation data for all
IP5 patent families, the radicalness index is
only shown for patents filed at the EPO
(top panel) and the USPTO (bottom panel)
that belong to IP5 patent families.
Furthermore, and in consideration of the
different way patent citations are dealt with
at the EPO and the USPTO, and the
different prior knowledge disclosure
requirements at the two offices considered
(OECD, 2009), direct comparisons of the
index across the two offices should not be
made.
This chapter sheds light on the scientific, technological and economic value (i.e., the “quality”) of
the innovative portfolio of top corporate R&D investors worldwide and also examines the way
companies bundle different types of outputs. For this purpose, indicators of the radicalness of
technologies and the “quality” of the scientific output produced by companies are followed by an
exploration of the way companies bundle scientific and technological developments and the extent
to which companies are active in basic and applied research activities. A closer look at the
pervasiveness and potential impact of the AI innovation activities of top corporate R&D investors is
then presented by looking at the way AI is combined in patents, trademarks, and scientific
publications. Finally, this chapter provides several insights into the collaborative networks
underpinning the generation of knowledge.
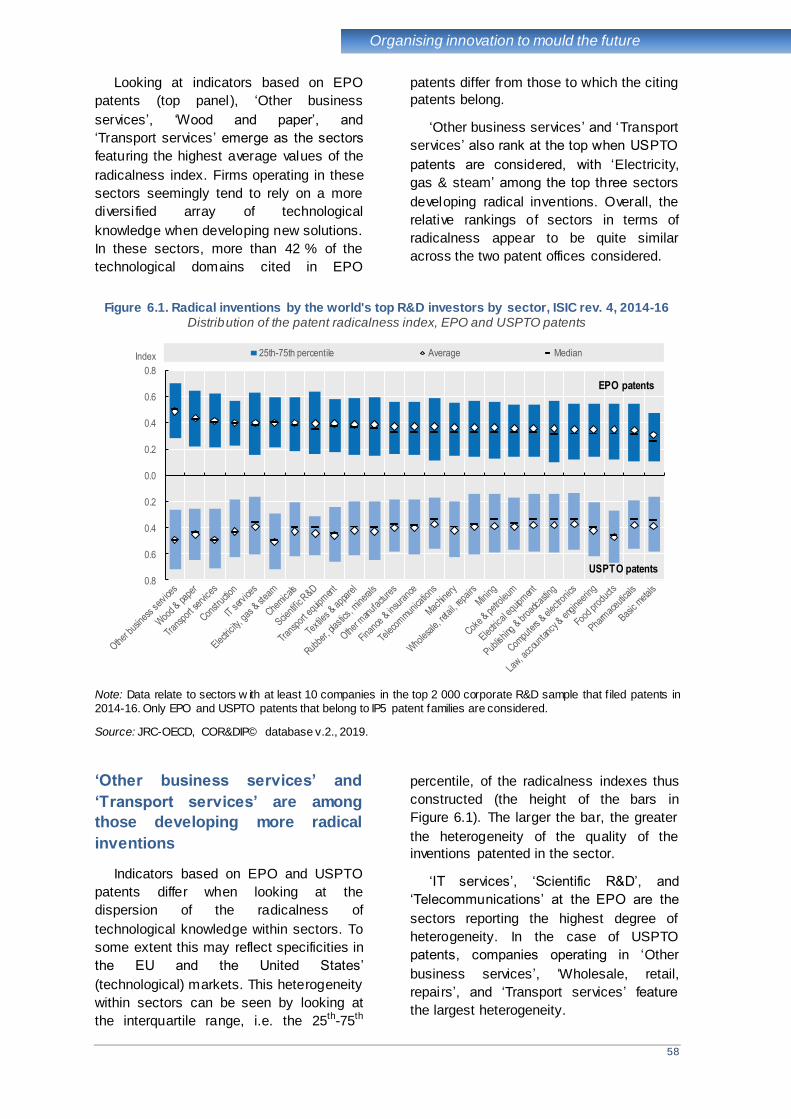
58
Organising innovation to mould the future
Looking at indicators based on EPO
patents (top panel), ‘Other business
services’, ‘Wood and paper’, and
‘Transport services’ emerge as the sectors
featuring the highest average values of the
radicalness index. Firms operating in these
sectors seemingly tend to rely on a more
diversified array of technological
knowledge when developing new solutions.
In these sectors, more than 42 % of the
technological domains cited in EPO
patents differ from those to which the citing
patents belong.
‘Other business services ’ and ‘Transport
services’ also rank at the top when USPTO
patents are considered, with ‘Electricity,
gas & steam’ among the top three sectors
developing radical inventions. Overall, the
relative rankings of sectors in terms of
radicalness appear to be quite similar
across the two patent offices considered.
Figure 6.1. Radical inventions by the world's top R&D investors by sector, ISIC rev. 4, 2014-16 Distribution of the patent radicalness index, EPO and USPTO patents
Note: Data relate to sectors w ith at least 10 companies in the top 2 000 corporate R&D sample that f iled patents in
2014-16. Only EPO and USPTO patents that belong to IP5 patent families are considered.
Source: JRC-OECD, COR&DIP© database v.2., 2019.
‘Other business services’ and
‘Transport services’ are among
those developing more radical
inventions
Indicators based on EPO and USPTO
patents differ when looking at the
dispersion of the radicalness of
technological knowledge within sectors. To
some extent this may reflect specificities in
the EU and the United States’
(technological) markets. This heterogeneity
within sectors can be seen by looking at
the interquartile range, i.e. the 25th-75th
percentile, of the radicalness indexes thus
constructed (the height of the bars in
Figure 6.1). The larger the bar, the greater
the heterogeneity of the quality of the
inventions patented in the sector.
‘IT services’, ‘Scientific R&D’, and
‘Telecommunications’ at the EPO are the
sectors reporting the highest degree of
heterogeneity. In the case of USPTO
patents, companies operating in ‘Other
business services’, ‘Wholesale, retail,
repairs’, and ‘Transport services’ feature
the largest heterogeneity.
0.8
0.6
0.4
0.2
0.0
0.2
0.4
0.6
0.8
Index 25th-75th percentile Average Median
USPTO patents
EPO patents

59
Organising innovation to mould the future
In turn Figure 6.2 presents the share of
publications that are among the top 10
percent cited in their respective scientific
fields, broken down by sector. The three
sectors featuring the greater proportion of
highly cited papers are ‘Pharmaceuticals’,
‘Computers and electronics’, and
‘Transport equipment’.
Altogether companies in these three
sectors produced 54 % of the total number
of highly cited academic papers authored
by individuals belonging to the companies
in the sample. The same sectors also
feature in the top three positions in terms of
share of total number of scientific
publications (see Figure 2.9 in chapter 2).
Comparing the ranking related to the
way different sectors contributing to
generating scientific publications overall
(Figure 2.9 in chapter 2), ordering sectors
on the basis of their production of highly
cited papers, identifies those sectors
making significant contributions to scientific
development in terms of both quantity and
quality.
Companies in ‘Pharmaceuticals’
‘Computers and electronics’, and
‘Transport equipment’ rank top in
terms of highly cited papers and
share of total number of scientific
publications
In addition, ‘Pharmaceuticals’,
‘Publishing and broadcasting’, and ‘IT
services’ are sectors producing basic
research of relatively higher quality than
other sectors as they account for relatively
higher shares of top cited articles (22.7 %,
7.1 %, and 7.6 %) than total publications
(17.2 %, 4.6 %, and 5.5 % respectively).
This is in line with the literature showing
how these firms produce both high
numbers of and high quality publications
(Camerani et al., 2018).
Other sectors, such as ‘Chemicals’,
‘Mining’, and ‘Basic metals’ feature lower
shares of top 10 percent cited papers
(2.9 %, 3.3 %, and 1.4%, respectively) than
shares of total publications (5.1 %, 4.9 %,
and 2.8 %).
Figure 6.2. Top cited articles of the world's top R&D investors by sector, ISIC rev. 4, 2014-16 Share of the top 10 % cited publications
Note: Data relate to sectors w ith at least 10 companies in the top 2 000 corporate R&D sample w ith publications in
2014-16.
Source: JRC-OECD, COR&DIP© database v.2., 2019.
0
5
10
15
20
25
% Top 6 industries
0
1
2
3
4
5
% Other industries
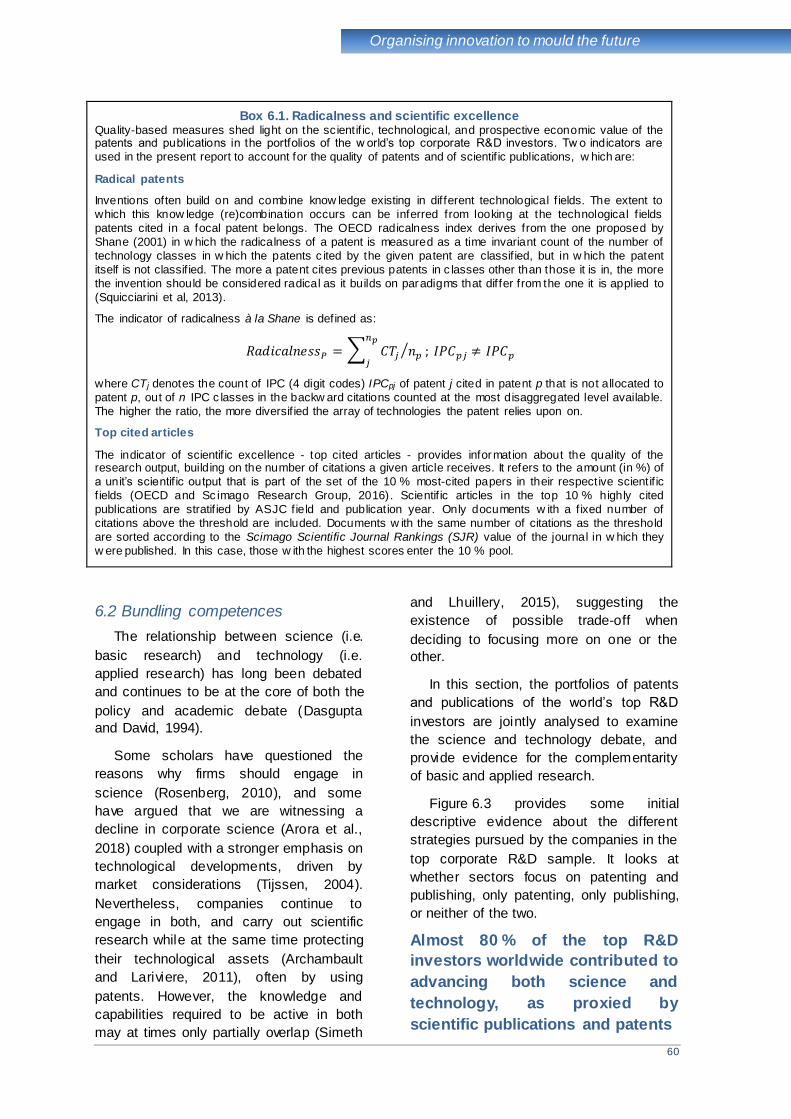
60
Organising innovation to mould the future
Box 6.1. Radicalness and scientific excellence Quality-based measures shed light on the scientif ic, technological, and prospective economic value of the patents and publications in the portfolios of the w orld’s top corporate R&D investors. Tw o indicators are
used in the present report to account for the quality of patents and of scientif ic publications, w hich are:
Radical patents
Inventions often build on and combine know ledge existing in different technological f ields. The extent to
which this know ledge (re)combination occurs can be inferred from looking at the technological f ields
patents cited in a focal patent belongs. The OECD radicalness index derives from the one proposed by
Shane (2001) in w hich the radicalness of a patent is measured as a time invariant count of the number of
technology classes in w hich the patents c ited by the given patent are classif ied, but in w hich the patent
itself is not classif ied. The more a patent cites previous patents in c lasses other than those it is in, the more
the invention should be considered radical as it builds on paradigms that differ from the one it is applied to
(Squicciarini et al, 2013).
The indicator of radicalness à la Shane is defined as:
𝑅𝑎𝑑𝑖𝑐𝑎𝑙𝑛𝑒𝑠𝑠𝑃 = ∑ 𝐶𝑇𝑗
𝑛𝑝
𝑗𝑛𝑝⁄ ; 𝐼𝑃𝐶𝑝𝑗 ≠ 𝐼𝑃𝐶𝑝
where CTj denotes the count of IPC (4 digit codes) IPCpj of patent j cited in patent p that is not allocated to
patent p, out of n IPC c lasses in the backw ard citations counted at the most disaggregated level available.
The higher the ratio, the more diversif ied the array of technologies the patent relies upon on.
Top cited articles
The indicator of scientif ic excellence - top cited articles - provides information about the quality of the research output, building on the number of citations a given article receives. It refers to the amount (in %) of
a unit’s scientif ic output that is part of the set of the 10 % most-cited papers in their respective scientif ic
f ields (OECD and Sc imago Research Group, 2016). Scientif ic articles in the top 10 % highly cited
publications are stratif ied by ASJC field and publication year. Only documents w ith a f ixed number of
citations above the threshold are included. Documents w ith the same number of citations as the threshold
are sorted according to the Scimago Scientific Journal Rankings (SJR) value of the journal in w hich they
w ere published. In this case, those w ith the highest scores enter the 10 % pool.
6.2 Bundling competences
The relationship between science (i.e.
basic research) and technology (i.e.
applied research) has long been debated
and continues to be at the core of both the
policy and academic debate (Dasgupta
and David, 1994).
Some scholars have questioned the
reasons why firms should engage in
science (Rosenberg, 2010), and some
have argued that we are witnessing a
decline in corporate science (Arora et al.,
2018) coupled with a stronger emphasis on
technological developments, driven by
market considerations (Tijssen, 2004).
Nevertheless, companies continue to
engage in both, and carry out scientific
research while at the same time protecting
their technological assets (Archambault
and Lariviere, 2011), often by using
patents. However, the knowledge and
capabilities required to be active in both
may at times only partially overlap (Simeth
and Lhuillery, 2015), suggesting the
existence of possible trade-off when
deciding to focusing more on one or the
other.
In this section, the portfolios of patents
and publications of the world’s top R&D
investors are jointly analysed to examine
the science and technology debate, and
provide evidence for the complementarity
of basic and applied research.
Figure 6.3 provides some initial
descriptive evidence about the different
strategies pursued by the companies in the
top corporate R&D sample. It looks at
whether sectors focus on patenting and
publishing, only patenting, only publishing,
or neither of the two.
Almost 80 % of the top R&D
investors worldwide contributed to
advancing both science and
technology, as proxied by
scientific publications and patents

61
Organising innovation to mould the future
Nevertheless, marked differences
emerge across sectors to the extent to
which they focus on scientific or
technological developments or both.
Patenting and publishing are a common
practice in the three most represented
sectors of the sample in terms of number of
firms. In ‘Computers and electronics ’, 86 %
of companies generated both patents and
scientific publications while this share
amounted to more than 86 % in the case of
‘Pharmaceuticals’ companies and to 82 %
in the case of ‘Transport equipment’ during
the period considered.
Figure 6.3. The world’s top R&D investors producing patents and publications by sector, ISIC rev. 4, 2014-16
Share in total number of companies by sector
Note: Data relate to sectors with at least 10 companies in the top 2 000 corporate R&D sample.
Source: JRC-OECD, COR&DIP© database v.2., 2019.
Less than 50 % of companies in sectors
like ‘Finance & Insurance’, ‘IT services’,
‘Publishing and broadcasting', and ‘Textiles
& apparel’ both patent and publish
scientific papers, and 12 % to 38 % of
these do neither of these two.
Of all sectors, ‘Finance and Insurance’
is the one with the highest share of
companies that only focus on publishing
scientific papers (27 %) while ‘IT services’
features the highest share of firms that only
file patents (15 %). 40 % of companies in
the ‘Publishing and broadcasting' sector
either only publish or only patent (23 %
and 15 %, respectively). It is also worth
noting that 38 % of ‘Textiles & apparel’
firms did not publish scientific papers or file
patents during the period.
Overall, the data suggests that
sectoral specificities are
significant in the way firms engage
in science and technology
developments
Figure 6.4 further details the way in
which patents and publications are bundled
together by companies in different sectors
by showing the distribution of patents and
publications in the portfolio of companies
featuring both.
A marked heterogeneity also emerges
across sectors in this case. Some sectors
appear more technologically oriented
because they display larger shares of
patents in their overall patent and
publication portfolios. This is the case for
‘Wood and paper’ (86 % of patents),
‘Machinery’ (82 %), and ‘Computers and
electronics’ (77 %). Others sectors appear
to be more oriented towards scientific
developments. Among these sectors
featuring larger shares of publications in
their patent and publication portfolios there
are ‘Transport services’ (84 % of scientific
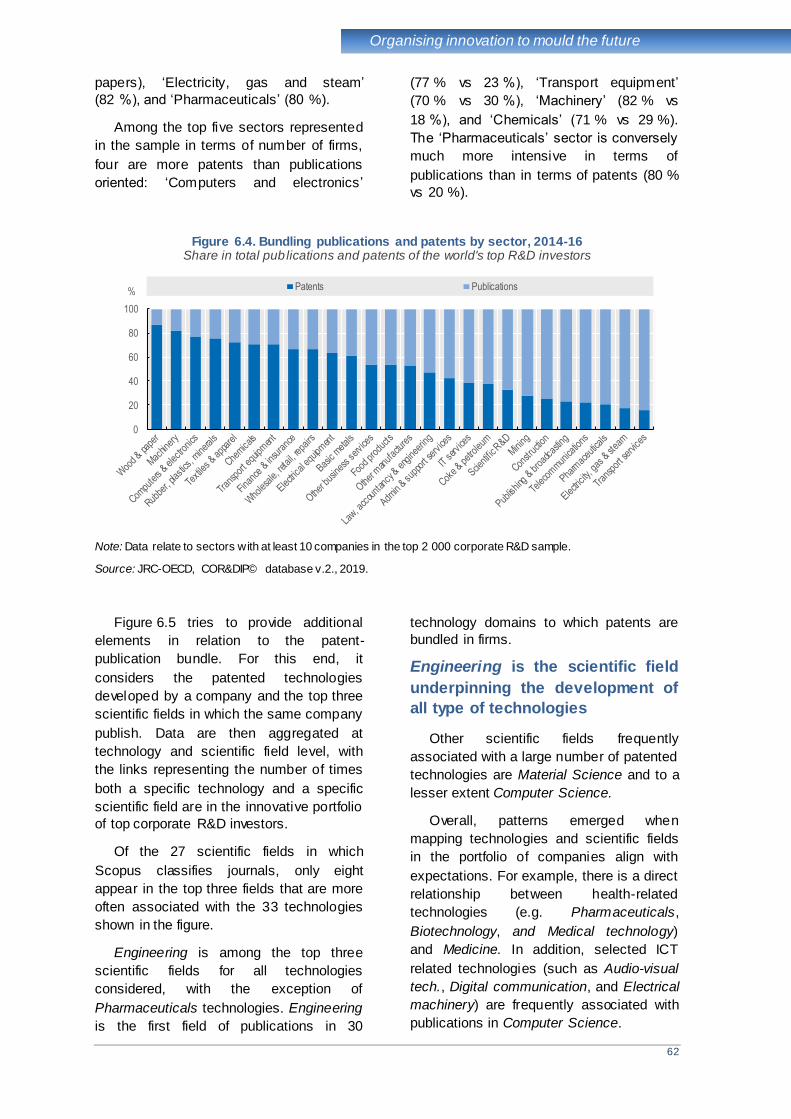
62
Organising innovation to mould the future
papers), ‘Electricity, gas and steam’
(82 %), and ‘Pharmaceuticals’ (80 %).
Among the top five sectors represented
in the sample in terms of number of firms,
four are more patents than publications
oriented: ‘Computers and electronics’
(77 % vs 23 %), ‘Transport equipment’
(70 % vs 30 %), ‘Machinery’ (82 % vs
18 %), and ‘Chemicals’ (71 % vs 29 %).
The ‘Pharmaceuticals’ sector is conversely
much more intensive in terms of
publications than in terms of patents (80 %
vs 20 %).
Figure 6.4. Bundling publications and patents by sector, 2014-16 Share in total publications and patents of the world's top R&D investors
Note: Data relate to sectors with at least 10 companies in the top 2 000 corporate R&D sample.
Source: JRC-OECD, COR&DIP© database v.2., 2019.
Figure 6.5 tries to provide additional
elements in relation to the patent-
publication bundle. For this end, it
considers the patented technologies
developed by a company and the top three
scientific fields in which the same company
publish. Data are then aggregated at
technology and scientific field level, with
the links representing the number of times
both a specific technology and a specific
scientific field are in the innovative portfolio
of top corporate R&D investors.
Of the 27 scientific fields in which
Scopus classifies journals, only eight
appear in the top three fields that are more
often associated with the 33 technologies
shown in the figure.
Engineering is among the top three
scientific fields for all technologies
considered, with the exception of
Pharmaceuticals technologies. Engineering
is the first field of publications in 30
technology domains to which patents are
bundled in firms.
Engineering is the scientific field
underpinning the development of
all type of technologies
Other scientific fields frequently
associated with a large number of patented
technologies are Material Science and to a
lesser extent Computer Science.
Overall, patterns emerged when
mapping technologies and scientific fields
in the portfolio of companies align with
expectations. For example, there is a direct
relationship between health-related
technologies (e.g. Pharmaceuticals,
Biotechnology, and Medical technology)
and Medicine. In addition, selected ICT
related technologies (such as Audio-visual
tech., Digital communication, and Electrical
machinery) are frequently associated with
publications in Computer Science.
0
20
40
60
80
100
% Patents Publications
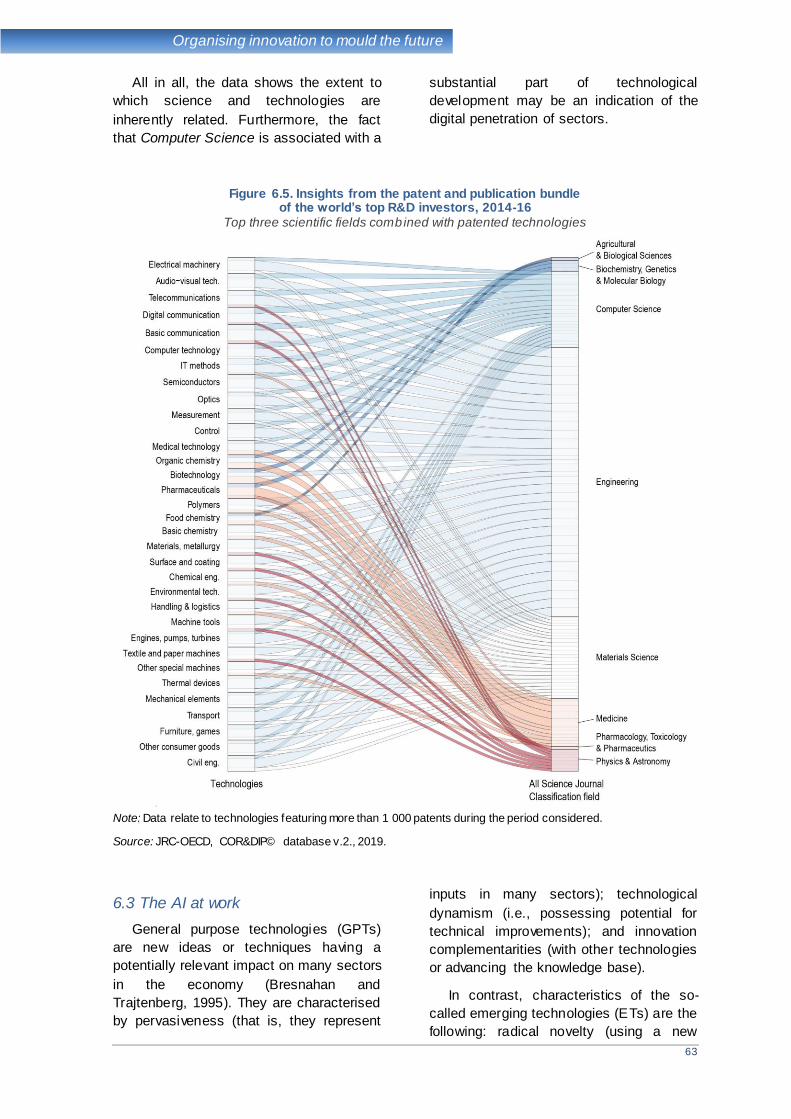
63
Organising innovation to mould the future
All in all, the data shows the extent to
which science and technologies are
inherently related. Furthermore, the fact
that Computer Science is associated with a
substantial part of technological
development may be an indication of the
digital penetration of sectors.
Figure 6.5. Insights from the patent and publication bundle of the world’s top R&D investors, 2014-16
Top three scientific fields combined with patented technologies
Note: Data relate to technologies featuring more than 1 000 patents during the period considered.
Source: JRC-OECD, COR&DIP© database v.2., 2019.
6.3 The AI at work
General purpose technologies (GPTs)
are new ideas or techniques having a
potentially relevant impact on many sectors
in the economy (Bresnahan and
Trajtenberg, 1995). They are characterised
by pervasiveness (that is, they represent
inputs in many sectors); technological
dynamism (i.e., possessing potential for
technical improvements); and innovation
complementarities (with other technologies
or advancing the knowledge base).
In contrast, characteristics of the so-
called emerging technologies (ETs) are the
following: radical novelty (using a new
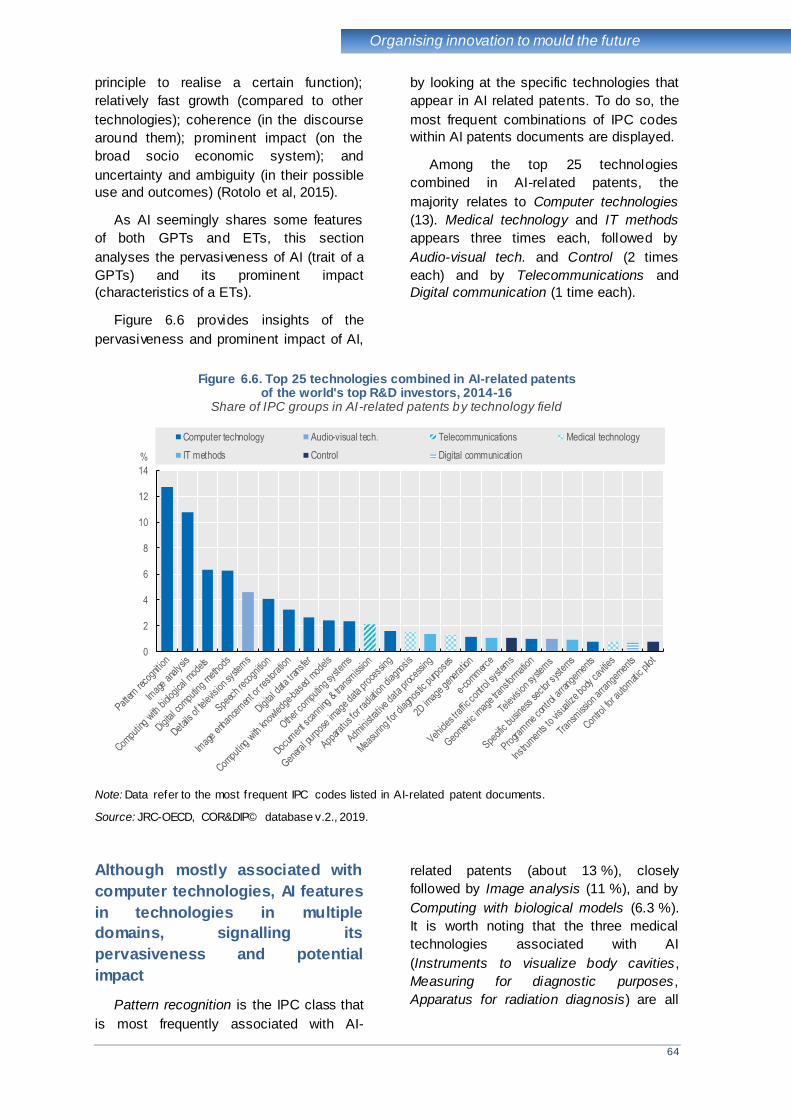
64
Organising innovation to mould the future
principle to realise a certain function);
relatively fast growth (compared to other
technologies); coherence (in the discourse
around them); prominent impact (on the
broad socio economic system); and
uncertainty and ambiguity (in their possible
use and outcomes) (Rotolo et al, 2015).
As AI seemingly shares some features
of both GPTs and ETs, this section
analyses the pervasiveness of AI (trait of a
GPTs) and its prominent impact
(characteristics of a ETs).
Figure 6.6 provides insights of the
pervasiveness and prominent impact of AI,
by looking at the specific technologies that
appear in AI related patents. To do so, the
most frequent combinations of IPC codes
within AI patents documents are displayed.
Among the top 25 technologies
combined in AI-related patents, the
majority relates to Computer technologies
(13). Medical technology and IT methods
appears three times each, followed by
Audio-visual tech. and Control (2 times
each) and by Telecommunications and
Digital communication (1 time each).
Figure 6.6. Top 25 technologies combined in AI-related patents of the world's top R&D investors, 2014-16
Share of IPC groups in AI-related patents by technology field
Note: Data refer to the most frequent IPC codes listed in AI-related patent documents.
Source: JRC-OECD, COR&DIP© database v.2., 2019.
Although mostly associated with
computer technologies, AI features
in technologies in multiple
domains, signalling its
pervasiveness and potential
impact
Pattern recognition is the IPC class that
is most frequently associated with AI-
related patents (about 13 %), closely
followed by Image analysis (11 %), and by
Computing with biological models (6.3 %).
It is worth noting that the three medical
technologies associated with AI
(Instruments to visualize body cavities,
Measuring for diagnostic purposes,
Apparatus for radiation diagnosis) are all
0
2
4
6
8
10
12
14
%
Computer technology Audio-visual tech. Telecommunications Medical technology
IT methods Control Digital communication
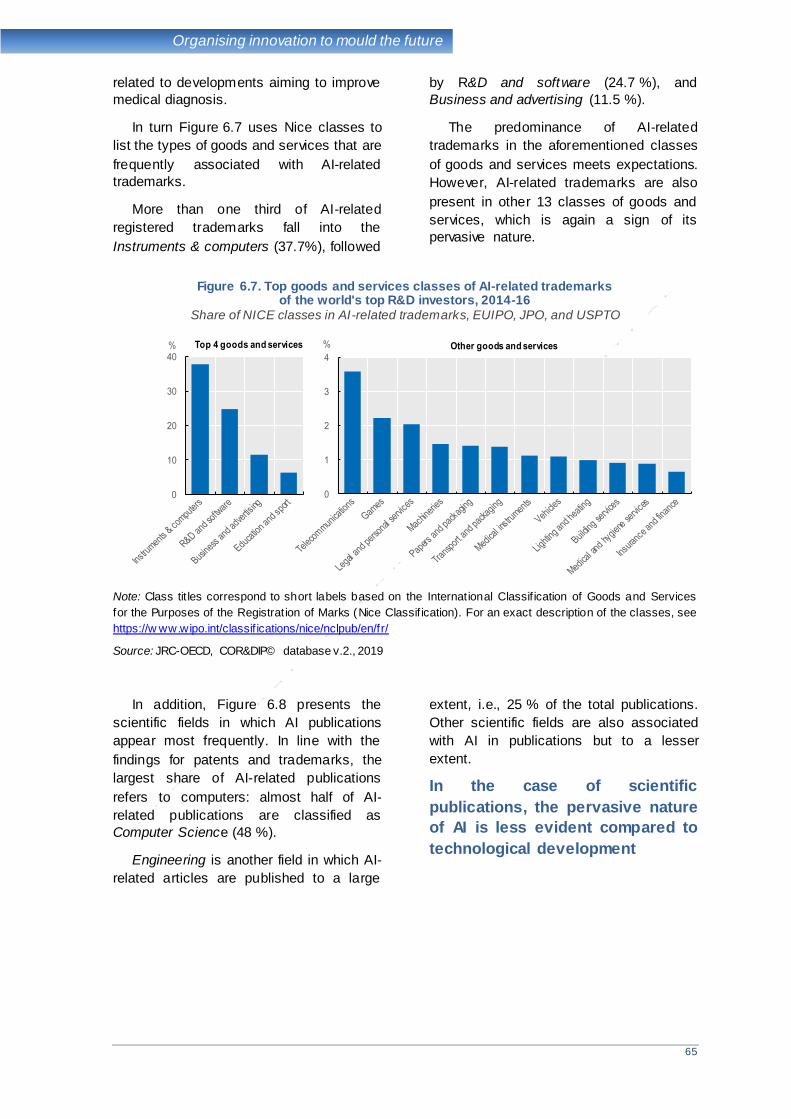
65
Organising innovation to mould the future
related to developments aiming to improve
medical diagnosis.
In turn Figure 6.7 uses Nice classes to
list the types of goods and services that are
frequently associated with AI-related
trademarks.
More than one third of AI-related
registered trademarks fall into the
Instruments & computers (37.7%), followed
by R&D and software (24.7 %), and
Business and advertising (11.5 %).
The predominance of AI-related
trademarks in the aforementioned classes
of goods and services meets expectations.
However, AI-related trademarks are also
present in other 13 classes of goods and
services, which is again a sign of its
pervasive nature.
Figure 6.7. Top goods and services classes of AI-related trademarks of the world's top R&D investors, 2014-16
Share of NICE classes in AI-related trademarks, EUIPO, JPO, and USPTO
Note: Class tit les correspond to short labels based on the International Classif ication of Goods and Services
for the Purposes of the Registration of Marks (Nice Classif ication). For an exact description of the classes, see
https://w ww.wipo.int/classif ications/nice/nclpub/en/fr/
Source: JRC-OECD, COR&DIP© database v.2., 2019
In addition, Figure 6.8 presents the
scientific fields in which AI publications
appear most frequently. In line with the
findings for patents and trademarks, the
largest share of AI-related publications
refers to computers: almost half of AI-
related publications are classified as
Computer Science (48 %).
Engineering is another field in which AI-
related articles are published to a large
extent, i.e., 25 % of the total publications.
Other scientific fields are also associated
with AI in publications but to a lesser
extent.
In the case of scientific
publications, the pervasive nature
of AI is less evident compared to
technological development
0
10
20
30
40% Top 4 goods and services
0
1
2
3
4
% Other goods and services

66
Organising innovation to mould the future
Figure 6.8. Top scientific fields in AI publications of the world’s top R&D investors, 2014-16 Share of ASJC fields in AI publications
Source: JRC-OECD, COR&DIP© database v.2., 2019.
6.4 Organising the innovation network
Companies in the sample are present in
more than 170 economies around the
world (see chapter 2). It is therefore logical
to expect that their geographical dispersion
may also be reflected in their knowledge
production to some extent.
Internationalisation of science (Zitt and
Bassecoulard) and technology (Patel and
Vega, 1999) is a well-documented
phenomenon in the economic and
management innovation literature.
Publications (Katz and Martin, 1997) and
patents (Guellec and de la Potterie, 2001)
are often used to study the patterns of
internationalisation in science and
technology alongside collaboration
between firms and between firms and
universities (Veugelers and Cassiman,
2005; Bruneel et al., 2010).
This is why this section presents
evidence about the patterns of international
collaboration between the world’s top R&D
investors in the development of both
science and technology.
Figure 6.9 displays the shares of
international co-inventions observed in the
entire patent port folio of top R&D investors
worldwide (bars), and highlights the
patterns in AI- patents (diamonds).
'Pharmaceuticals’ (20 %), ‘Other
business services’ (16 %), and ‘Food
products’ (15 %) are the sectors with the
highest shares of patents developed by
international teams of inventors.
The share of AI-related patents
developed by international teams
of inventors is highest in ‘Other
business services’ (31 %)
0
10
20
30
40
50
%Top 5 fields
0.0
0.5
1.0
1.5
2.0
2.5
% Other fields
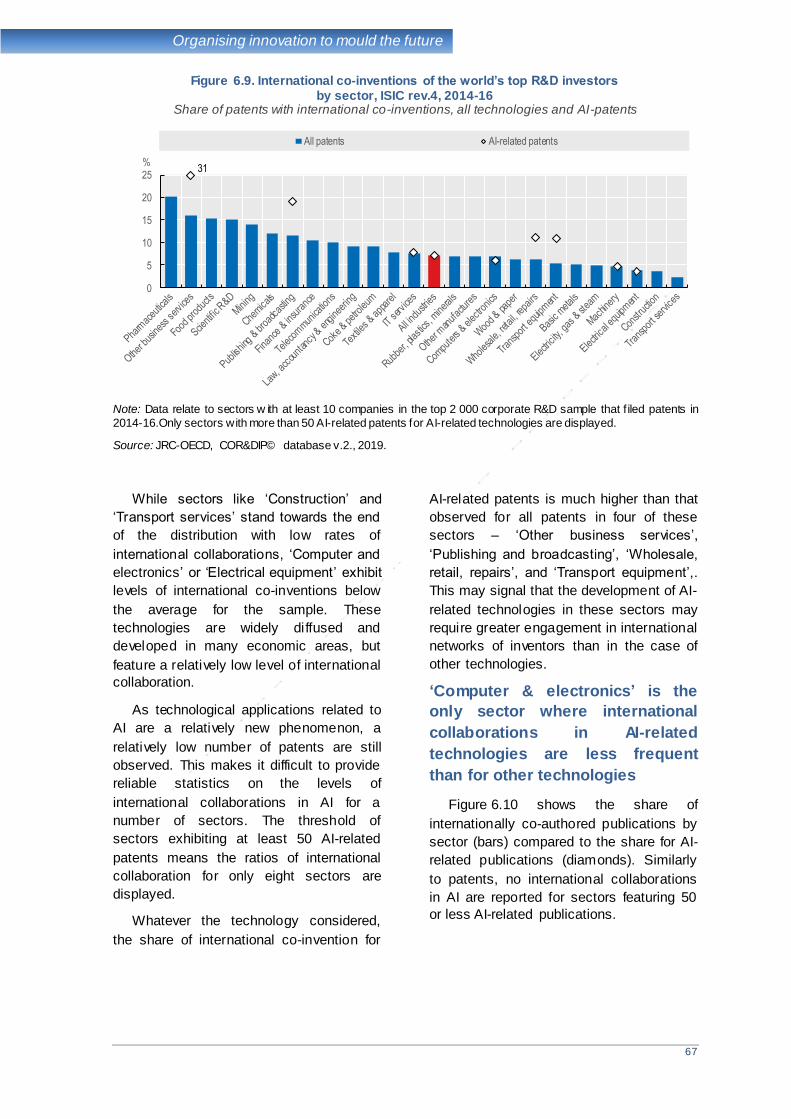
67
Organising innovation to mould the future
Figure 6.9. International co-inventions of the world’s top R&D investors by sector, ISIC rev.4, 2014-16
Share of patents with international co-inventions, all technologies and AI-patents
Note: Data relate to sectors w ith at least 10 companies in the top 2 000 corporate R&D sample that f iled patents in
2014-16.Only sectors with more than 50 AI-related patents for AI-related technologies are displayed.
Source: JRC-OECD, COR&DIP© database v.2., 2019.
While sectors like ‘Construction’ and
‘Transport services’ stand towards the end
of the distribution with low rates of
international collaborations, ‘Computer and
electronics’ or ‘Electrical equipment’ exhibit
levels of international co-inventions below
the average for the sample. These
technologies are widely diffused and
developed in many economic areas, but
feature a relatively low level of international
collaboration.
As technological applications related to
AI are a relatively new phenomenon, a
relatively low number of patents are still
observed. This makes it difficult to provide
reliable statistics on the levels of
international collaborations in AI for a
number of sectors. The threshold of
sectors exhibiting at least 50 AI-related
patents means the ratios of international
collaboration for only eight sectors are
displayed.
Whatever the technology considered,
the share of international co-invention for
AI-related patents is much higher than that
observed for all patents in four of these
sectors – ‘Other business services’,
‘Publishing and broadcasting’, ‘Wholesale,
retail, repairs’, and ‘Transport equipment’,.
This may signal that the development of AI-
related technologies in these sectors may
require greater engagement in international
networks of inventors than in the case of
other technologies.
‘Computer & electronics’ is the
only sector where international
collaborations in AI-related
technologies are less frequent
than for other technologies
Figure 6.10 shows the share of
internationally co-authored publications by
sector (bars) compared to the share for AI-
related publications (diamonds). Similarly
to patents, no international collaborations
in AI are reported for sectors featuring 50
or less AI-related publications.
0
5
10
15
20
25%
All patents AI-related patents
31
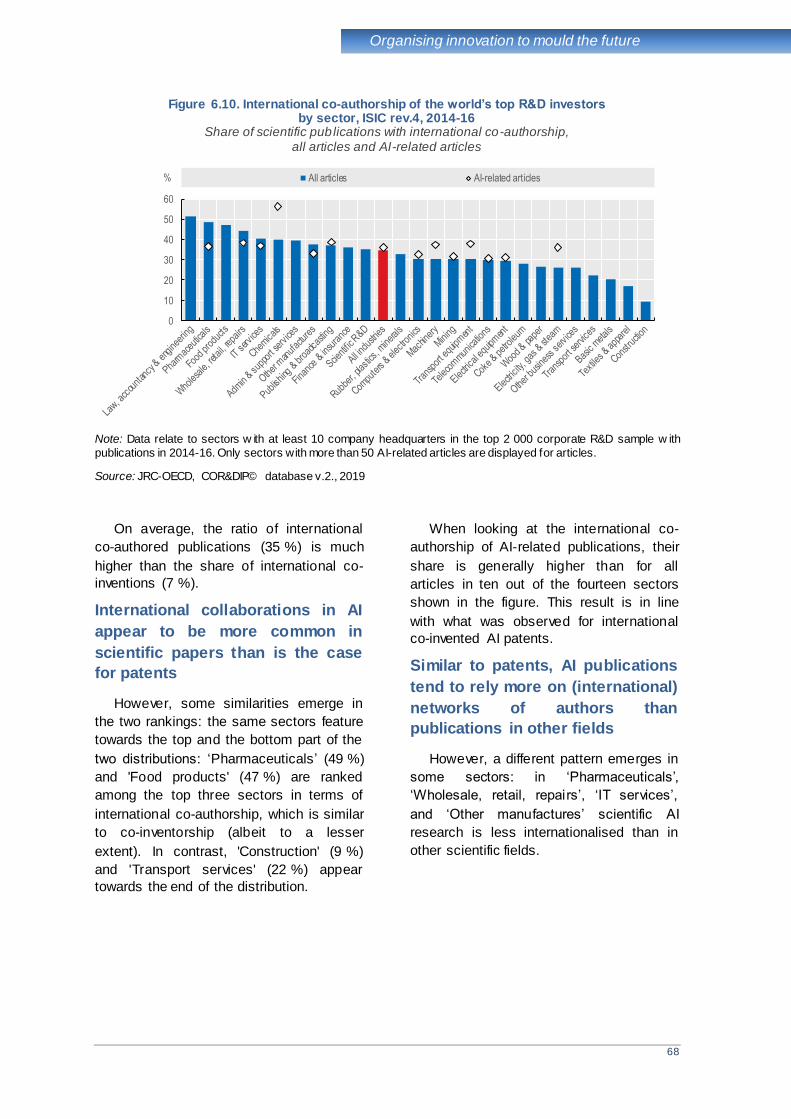
68
Organising innovation to mould the future
Figure 6.10. International co-authorship of the world’s top R&D investors by sector, ISIC rev.4, 2014-16
Share of scientific publications with international co-authorship, all articles and AI-related articles
Note: Data relate to sectors w ith at least 10 company headquarters in the top 2 000 corporate R&D sample w ith
publications in 2014-16. Only sectors with more than 50 AI-related articles are displayed for articles.
Source: JRC-OECD, COR&DIP© database v.2., 2019
On average, the ratio of international
co-authored publications (35 %) is much
higher than the share of international co-
inventions (7 %).
International collaborations in AI
appear to be more common in
scientific papers than is the case
for patents
However, some similarities emerge in
the two rankings: the same sectors feature
towards the top and the bottom part of the
two distributions: ‘Pharmaceuticals’ (49 %)
and 'Food products' (47 %) are ranked
among the top three sectors in terms of
international co-authorship, which is similar
to co-inventorship (albeit to a lesser
extent). In contrast, 'Construction' (9 %)
and 'Transport services' (22 %) appear
towards the end of the distribution.
When looking at the international co-
authorship of AI-related publications, their
share is generally higher than for all
articles in ten out of the fourteen sectors
shown in the figure. This result is in line
with what was observed for international
co-invented AI patents.
Similar to patents, AI publications
tend to rely more on (international)
networks of authors than
publications in other fields
However, a different pattern emerges in
some sectors: in ‘Pharmaceuticals’,
‘Wholesale, retail, repairs’, ‘IT services’,
and ‘Other manufactures’ scientific AI
research is less internationalised than in
other scientific fields.
0
10
20
30
40
50
60
% All articles AI-related articles

69
What’s next?
What’s next?
This third report on the innovative activity
of the world top 2 000 R&D investors is
accompanied by the database on the “IP
bundle of top corporate R&D investors” (JRC-
OECD, COR&DIP© database, v.2, 2019).
The database (as well as its previous
versions) is made available for free, upon
request, to allow for further analysis in
support of evidence-based policy making.
The JRC-OECD COR&DIP© v.2 database
contains information about the R&D activity
and IP assets (i.e. patents and trademarks)
of the top 2 000 corporate R&D investors
worldwide. Information about the R&D
investors is taken from the 2017 EU Industrial
R&D Investment Scoreboard (Hernández
et al., 2017). Industrial property (IP) records
are extracted from EPO’s Worldwide Patent
Statistical Database (PATSTAT, Spring
2019) in the case of patents, and, from the
EU IPO and the USPTO in the case of
trademarks (raw data on JPO trademarks are
not included in the dataset). Scientific
publication data have been consolidated at
the headquarters’ level, with counts provided
by AJSC.
Raw data are made available through the
OECD website at http://oe.cd/ipstats, and are
accompanied by a short technical document.
The structure of the JRC-OECD
COR&DIP© v.2, 2019 database is detailed
below.
JRC-OECD COR&DIP© v.2, 2019
Database structure
\
World Top 2000 Corporate
R&D Investors
Financial2013-16
R&D, Sales, Employees, etc.
Trademark Portfolio2014-16
EUIPO, USPTO
Trademark Classes
NICE Class
Scientific Publications
Counts by ASJC fields
Patent Classes
IPC & WIPO technologies
Patent Portfolio2014-16
IP5 families
70
References
References
Acs, J.Z., & Audretsch, D.B. (1989). Patents as a measure of innovative activity. Kyklos, 42(2), 171-180.
Aghion, P., & How itt, P. (1990). A model of growth through creative destruction (No. w 3223). National Bureau of Economic Research.
Archambault, É., & Larivière, V. (2011). Scientif ic publications and patenting by companies: a study of the whole population of Canadian f irms over 25 years. Science and Public Policy, 38(4), 269-278.
Archibugi, D., & Iammarino, S. (2002). The globalization of technological innovation: definition and evidence. Review of International Political Economy, 9(1), 98-122.
Arora, A., Belenzon, S., & Patacconi, A. (2018). The decline of science in corporate R&D. Strategic Management Journal, 39(1), 3-32.
Baruffaldi, S., B. van Beuzekom, H. Dernis, D. Harhoff, N. Rao, D. Rosenfeld and M. Squicciarini (2019). Identifying and Measuring Developments in Artif icial Intelligence. OECD Science, Technology and Industry Working Papers.
Belderbos, R., Van Roy, V., Leten, B., & Thijs, B. (2014). Academic Research Strengths and Multinational Firms’
Foreign R&D Location Decisions: Evidence from R&D Investments in European Regions. Environment and Planning
A: Economy and Space, 46(4), 920–942. https://doi.org/10.1068/a45536
Breschi, S., Malerba, F., & Orsenigo, L. (2000). Technological regimes and Schumpeterian patterns of innovation. The Economic Journal, 110(463), 388-410.
Bruneel, J., d’Este, P., & Salter, A. (2010). Investigating the factors that diminish the barriers to university–industry collaboration. Research Policy, 39(7), 858-868.
Camerani, R., Rotolo, D., & Grassano, N., (2018). Do f irms publish? A multi-sectoral analysis. JRC Working Papers on Corporate R&D and Innovation No 5/2018, Joint Research Centre.
Castellani, D., Montresor, S., Schubert, T., & Vezzani, A. (2017). Multinationality, R&D and productivity: Evidence from the top R&D investors worldwide. International Business Review, 26(3), 405-416.
Craglia M. (Ed.), Annoni A., Benczur P., Bertoldi P., Delipetrev P., De Prato G., Feijoo C., Fernandez Macias E.,
Gomez E., Iglesis M., Junklew itz H., Lòpez Cobo M., Martens B., Nascimento S., Nativi S., Polvora A., Sanchez I., Tolan S., Tuomi I., Vesnic Alujevic L.,(2018). Artif icial Intelligence – A European Perspective, EUR 29425 EN, Luxemburg Publication Office
Chung, W., & Alcácer, J. (2002). Know ledge seeking and location choice of foreign direct investment in the United States. Management Science, 48(12), 1534-1554.
Ciriaci, D., Grassano, N., & Vezzani, A. (2019). Regulations and location choices of top R&D investors worldw ide. Structural Change and Economic Dynamics, 49, 29-42.
Cohen, W.M. & Klepper, S. (1992). The anatomy of industry R&D intensity distributions. The American Economic Review, 82(4):773-799.
Contractor, F. J., Kumar, V., Kundu, S. K., & Pedersen, T. (2010). Reconceptualizing the f irm in a world of outsourcing and offshoring: The organizational and geographical relocation of high‐value company functions.
Journal of management studies, 47(8), 1417-1433.
Daiko, T., Dernis, H., Dosso, M., Gkotsis, P., Squicciarini, M., Tuebke, A., & Vezzani, A. (2017). World top R&D investors: Industrial property strategies in the digital economy (No. JRC107015). Joint Research Centre (Seville site).
Dasgupta, P., & David, P.A. (1994). Tow ard a new economics of science. Research Policy, 23(5), 487-521.
DeCarolis, D.M., & Deeds, D.L. (1999). The impact of stocks and f lows of organizational know ledge on f irm performance: An empirical investigation of the biotechnology industry. Strategic Management Journal, 20(10), 953-968.
Dernis, H., Dosso, M., Hervás, F., Millot, V., Squicciarini, M., & Vezzani, A. (2015). World corporate top R&D investors: Innovation and IP bundles (No. JRC94932). Joint Research Centre (Seville site).
Dosi, G. (1982). Technological paradigms and technological trajectories: a suggested interpretation of the determinants and directions of technical change. Research policy, 11(3), 147-162.
Dosi, G., Grazzi, M., & Moschella, D. (2017). What do f irms know? What do they produce? A new look at the relationship between patenting profiles and patterns of product diversif ication. Small Business Economics, 48(2), 413-429.
EC Communication from the Commission to the European Parliament, the European Council, the Council, the European Economic and Social Committee and the Committee of the Regions. Artif icial Intelligence for Europe. COM(2018) 237 f inal {SWD(2018) 137 f inal}.
Faria, L.G.D. & Andersen, M.M. (2017). Sectoral patterns versus f irm-level heterogeneity-The dynamics of eco-innovation strategies in the automotive sector. Technological Forecasting and Social Change, 117:266-281.
Gçmez, E. (ed) (2018). Assessing the impact of machine intelligence on human behavior: an interdisciplinary endeavor. 1st HUMAINT w orkshop, Barcelona.
71
References
Gkotsis, P., Pugliese, E., & Vezzani, A. (2018). A Technology-Based Classif ication of Firms: Can We Learn Something Looking Beyond Industry Classif ications?. Entropy, 20(11), 887
Gotsch, M., & Hipp, C. (2012). Measurement of innovation activities in the knowledge-intensive services industry: a trademark approach. The Service Industries Journal, 32(13), 2167-2184.
Grant, R. M. (1996). Toward a knowledge‐based theory of the f irm. Strategic Management Journal, 17(S2),
109-122.
Guellec, D., & de la Potterie, B.V.P. (2001). The internationalisation of technology analysed w ith patent data. Research Policy, 30(8), 1253-1266.
Hall, B., Helmers, C., Rogers, M., & Sena, V. (2014). The choice between formal and informal intellectual property: a review. Journal of Economic Literature, 52(2), 375-423.
Hernández, H., Grassano, N., Tübke, A., Potters, L., Amoroso, S., Doss, M., Gkotsis, P., & Vezzani, A., (2017). The 2017 EU Industrial R&D Investment Scoreboard; EUR 28870 EN; Publications Office of the European Union, Luxembourg, 2017, ISBN 978-92-79-76298-7, doi:10.2760/912318, JRC108520.
Hertog, P. D. (2000). Know ledge-intensive business services as co-producers of innovation. International journal of innovation management, 4(04), 491-528.
Hicks, D. (1995). Published papers, tacit competencies and corporate management of the public/private character of knowledge. Industrial and Corporate Change, 4(2), 401-424.
IPO (2019). Artif icial Intelligence: A Worldw ide Overview of AI Patents and Patenting by the UK AI Sector.
Katz, J.S., & Martin, B.R. (1997). What is research collaboration? Research Policy, 26(1), 1–18.
Levenshtein, V. I. (1965). Binary Codes Capable of Correcting Deletions, Insertions and Reversals. Doklady Akademii Nauk SSSR, 163(4), 845-848.
Lundvall, B. (2016). Innovation as an Interactive Process: From User– Producer Interaction to the National Systems of Innovation. In B. Lundvall (Author), The Learning Economy and the Economics of Hope (pp. 61-84). Anthem Press.
March, J. G. (1991). Exploration and exploitation in organizational learning. Organization science, 2(1), 71-87.
McMillan, G.S., & Hamilton III, R.D. (2000). Using bibliometrics to measure f irm know ledge: an analysis of the US pharmaceutical industry. Technology Analysis & Strategic Management, 12(4), 465-475.
Mendonça, S., Pereira, T. S., & Godinho, M. M. (2004). Trademarks as an indicator of innovation and industrial change. Research Policy, 33(9), 1385-1404.
Montresor, S., & Vezzani, A. (2015). On the R&D giants’ shoulders: do FDI help to stand on them?. Economia e Politica Industriale, 42(1), 33-60.
Narin, F., Noma, E., & Perry, R. (1987). Patents as indicators of corporate technological strength. Research Policy, 16(2-4), 143-155.
Nelson, R. R. and Winter, S.G., (1982). An Evolutionary Theory of Economic Change. Cambridge MA: Harvard University Press.
OECD (2019), Scoping principles to foster trust in and adoption of AI, Proposal by the Expert Group on Artif icial Intelligence at the OECD (AIGO), http://oe.cd/ai
OECD (2009). OECD patent statistics manual. France: OECD Publications.
OECD (2017), OECD Science, Technology and Industry Scoreboard 2017: The digital transformation, OECD Publishing, Paris, doi: 10.1787/9789264268821-en.
OECD and SCImago Research Group (CSIC) (2016), Compendium of Bibliometric Science Indicators . OECD, Paris. Accessed from http://oe.cd/scientometrics.
Pakes, A., & Griliches, Z. (1980). Patents and R&D at the f irm level: A f irst report. Economics letters, 5(4), 377-381.
Park, G., & Park, Y. (2006). On the measurement of patent stock as knowledge indicators. Technological Forecasting and Social Change, 73(7), 793-812.
Patel, P. & Pavitt, K. (1997). The technological competencies of the world's largest f irms: complex and path-dependent, but not much variety. Research Policy, 26(2):141-156.
Patel, P., & Vega, M. (1999). Patterns of internationalisation of corporate technology: location vs. home country advantages. Research Policy, 28(2-3), 145-155.
Ramello, G.B. (2006). What's in a sign? Trademark law and economic theory. Journal of Economic Surveys, 20(4), 547-565.
Reinganum, J. F. (1985). Innovation and industry evolution. The Quarterly Journal of Economics, 100(1), 81-99.
Rilla, N., & Squicciarini, M. (2011). R&D (re) location and offshore outsourcing: a management perspective.
International Journal of Management Reviews , 13(4), 393-413.
Rosenberg, N. (2010). Why do f irms do basic research (with their own money)?. In: Studies On Science And The Innovation Process: Selected Works of Nathan Rosenberg (pp. 225-234).
72
References
Rotolo, D., Hicks, D., & Martin, B.R. (2015). What is an emerging technology?. Research Policy, 44(10), 1827-1843.
Sachwald, F. (2008). Location choices w ithin global innovation networks: the case of Europe. The Journal of
Technology Transfer, 33(4), 364-378.
Santos‐Paulino, A. U., Squicciarini, M. & Fan, P. (2014), Foreign Direct Investment, R&D Mobility and the New Economic Geography: A Survey. World Economy, 37: 1692-1715. doi:10.1111/twec.12208
Schubert, A., & Braun, T. (1986). Relative indicators and relational charts for comparative assessment of publication output and citation impact. Scientometrics, 9(5-6), 281-291.
Teece, D.J., Pisano, G., & Shuen, A. (1997). Dynamic capabilities and strategic management. Strategic Management Journal, 18(7), 509-533.
Shane, S. (2001). Technological opportunities and new firm creation. Management science, 47(2), 205-220.
Simeth, M., & Lhuillery, S. (2015). How do f irms develop capabilities for scientif ic disclosure? Research Policy, 44(7), 1283–1295.
Soo, C.W., Devinney, T.M., & Midgley, D.F. (2004). The role of know ledge quality in f irm performance. In: Organizations as knowledge systems (pp. 252-275). Palgrave Macmillan, London.
Squicciarini, M., Dernis, H., & Criscuolo, C. (2013). Measuring Patent Quality: Indicators of Technological and Economic Value, OECD Science, Technology and Industry Working Papers, 2013/03, OECD Publishing.
Tijssen, R.J.W. (2004). Is the commercialisation of scientif ic research affecting the production of public know ledge?: Global trends in the output of corporate research articles. Research Policy, 33(5), 709–733.
Trajtenberg, M. (1990). Patents as Indicators of Innovation, Economic Analysis of Product Innovation. Cambridge (MA): Harvard University Press.
Turing, A. M. (1950). Mind. Mind, 59(236), 433-460.
Veugelers, R., & Cassiman, B. (2005). R&D cooperation between firms and universities. Some empirical evidence from Belgian manufacturing. International Journal of Industrial Organization, 23(5-6), 355-379.
Winkler, W. E. (1999). The State of Record Linkage and Current Research Problems. Statistics of Income Division, Internal Revenue Service Publication R99/04.
WIPO (2019). WIPO Technology Trends 2019. Artif icial Intelligence. Geneva, Sw itzerland.
Zanfei, A. (2000). Transnational f irms and the changing organisation of innovative activities. Cambridge Journal of Economics, 24(5), 515–542.
Zitt, M., & Bassecoulard, E. (2004). Internationalisation in science in the prism of bibliometric indicators. In Handbook of Quantitative Science and Technology Research (pp. 407-436). Springer, Dordrecht.
73
Appendices
Appendix
Annex A - List of sectors, ISIC rev. 4
Source: OECD, STAN Structural Analysis Database, http://oe.cd/stan , May 2019
38 sectors, ISIC rev. 4
01-03 Agriculture
05-09 Mining
10-12 Food products
13-15 Textiles & apparel
16-18 Wood & paper
19 Coke & petroleum
20 Chemicals
21 Pharmaceuticals
22-23 Rubber, plastics, minerals
24-25 Basic metals
26 Computers & electronics
27 Electrical equipment
28 Machinery
29-30 Transport equipment
31-33 Other manufactures
35 Electricity, gas & steam
36-39 Water, sewerage & waste
41-43 Construction
45-47 Wholesale, retail, repairs
49-53 Transport services
55-56 Hotels & food services
58-60 Publishing & broadcasting
61 Telecommunications
62-63 IT services
64-66 Finance & insurance
68 Real estate
69-71 Law, accountancy & engineering
72 Scientific R&D
73-75 Other business services
77-82 Admin & support services
84 Public administration and defence
85 Education
86 Health services
87-88 Care & social work
90-93 Arts & entertainment
94-96 Other services
74
Appendices
Annex B - Definition of the ICT sector
ICT economic activities (sectors) are defined according to the general definition that follow s:
“The production (goods and services) of a candidate industry must primar ily be intended to fulf il or enable
the function of information processing and communication by electronic means, including tr ansmission and
display”.
The list of ICT sectors (ISIC Rev. 4) that meet this condition is provided below :
ICT manufacturing sectors
2610 Manufacture of electronic components and boards
2620 Manufacture of computers and peripheral equipment
2630 Manufacture of communication equipment
2640 Manufacture of consumer electronics
2680 Manufacture of magnetic and optical media
ICT trade sectors
4651 Wholesale of computers, computer peripheral equipment and softw are
4652 Wholesale of electronic and telecommunications equipment and parts
ICT services sectors
5820 Softw are publishing
61 Telecommunications
6110 Wired telecommunications activities
6120 Wireless telecommunications activities
6130 Satellite telecommunications activities
6190 Other telecommunications activities
62 Computer programming, consultancy and related activities
6201 Computer programming activities
6202 Computer consultancy and computer facilities management activities
6209 Other information technology and computer service activities
631 Data processing, hosting and related activities; web portals
6311 Data processing, hosting and related activities
6312 Web portals
951 Repair of computers and communication equipment
9511 Repair of computers and peripheral equipment
9512 Repair of communication equipment
Source: OECD (2007).
75
Appendices
Annex C - Linking company data to IP data: a matching approach
Characterising the portfolio of IP rights and scientific publications of companies requires raw data to
be linked with enterprise data. To this end, the names of the top corporate R&D investors and of their
subsidiaries were matched to the applicants names provided in published patent and trademark
documents, and to the companies to which authors of scientific papers are affiliated. The matching was
carried out on a by-country basis using a series of algorithms contained in the Imalinker (Idener Multi
Algorithm Linker) system developed by IDENER (http://www.idener.es/).
The matching exercise was implemented over a number of key steps:
The names of top corporate R&D investors and subsidiaries and of the firms included in the
data on IP rights and scientific publications were separately harmonised using country-specific
‘dictionaries’. These aimed to dealing with legal entity denomination (e.g. ‘Limited’ and ‘Ltd’),
common names and expressions, as well as phonetic and linguistic rules, that might affect how
enterprise names are written. Failing to account for such features of the data might mistakenly
lead to excluding a company (not considering only because its name had been misspelt or
shortened in some places), or double counting a company (because different spellings of its
name made it appear to be different entities). The compilation of suitable country- and
language-specific dictionaries required country-level and language-related knowledge.
In a second step, a series of string-matching algorithms – mainly token-based and string-metric-
based, such as token frequency matching and Levenshtein (1965) and Jaro -Winkler (Winkler,
1999) distances – were used to compare the harmonised names from the two datasets and
provide a matching accuracy score for each pair. The precision of the match, which depended
on minimising the number of false positive matches, was ensured through a selection of pairs of
company names/ IP rights owners made on the basis of high-score thresholds imposed on the
algorithm.
A post-processing stage was handled manually and involved reviewing the results of the
matches; assessing the proportion of non-matched firms (possibly false negatives, that is, firms
that the algorithm had failed to recognise as part of the sample) among the top R&D performers
and affiliates; and identifying new matches on a case-by-case basis (e.g. allowing for lower
thresholds for a given algorithm), by correcting and augmenting dictionaries and through
manual searches. More specifically, to cope with the heterogeneity of the affiliations fields
recorded in the SCOPUS© database, additional matching was manually performed for the top
10% of companies by sector.
The matching was performed using the names of both the top corporate R&D investors and their
subsidiaries. IP portfolios and published articles were aggregated at the level of the headquarters:
patents, trademarks owned by a given subsidiary - and authors of articles affiliated in a given subsidiary
- were thus fully attributed to the parent company of the group, regardless of the precise structure of the
group. In practical terms, this choice meant that the patents, trademarks and publications of a certain
subsidiary were attributed to the parent R&D performer under all circumstances, and regardless of the
exact share of the affiliate that the parent company owns (whether, for example, 60 % or 70 %).
Overall, 98 % of top R&D-performing companies could be matched to at least one patent applicant in
the patent database, either directly or through one or more subsidiary firms. The same overall matching
rate was observed for trademark applications (95 %). Because of the higher heterogeneity in the way in
which affiliation names are recorded in the database used, the matching rate is a little lower for
publications (87 %).
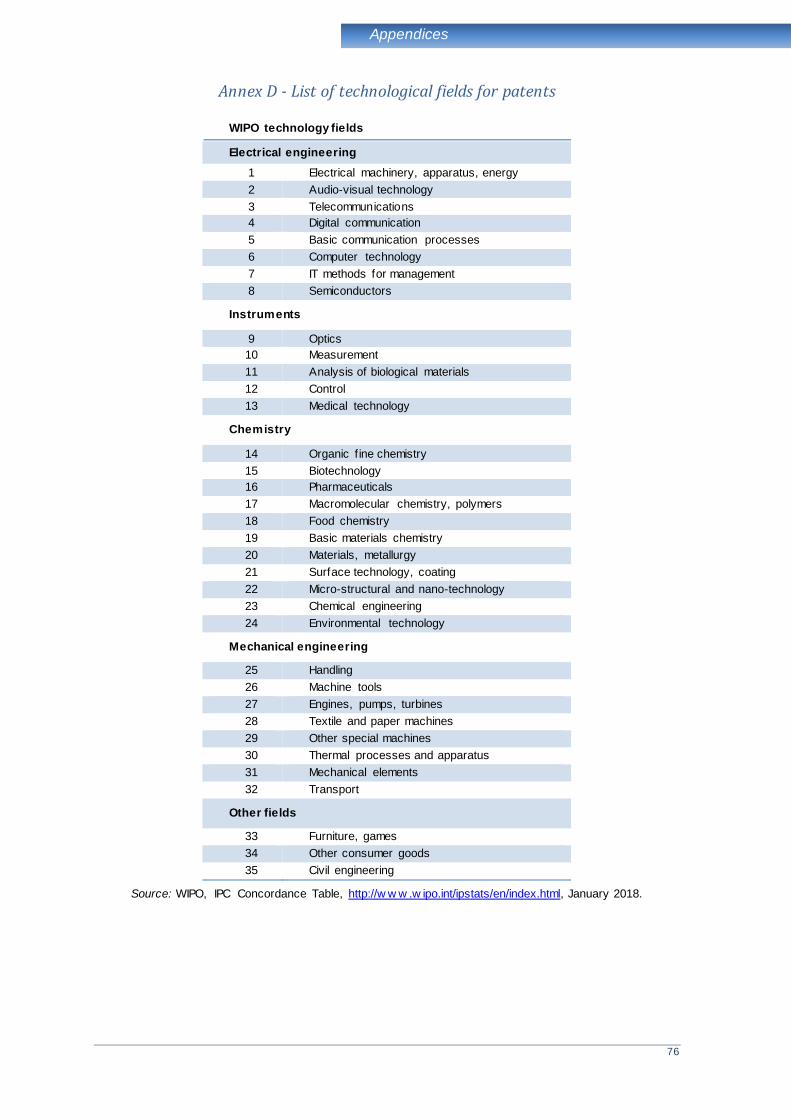
76
Appendices
Annex D - List of technological fields for patents
WIPO technology fields
Electrical engineering
1 Electrical machinery, apparatus, energy
2 Audio-visual technology
3 Telecommunications
4 Digital communication
5 Basic communication processes
6 Computer technology
7 IT methods for management
8 Semiconductors
Instruments
9 Optics
10 Measurement
11 Analysis of biological materials
12 Control
13 Medical technology
Chemistry
14 Organic f ine chemistry
15 Biotechnology
16 Pharmaceuticals
17 Macromolecular chemistry, polymers
18 Food chemistry
19 Basic materials chemistry
20 Materials, metallurgy
21 Surface technology, coating
22 Micro-structural and nano-technology
23 Chemical engineering
24 Environmental technology
Mechanical engineering
25 Handling
26 Machine tools
27 Engines, pumps, turbines
28 Textile and paper machines
29 Other special machines
30 Thermal processes and apparatus
31 Mechanical elements
32 Transport
Other fields
33 Furniture, games
34 Other consumer goods
35 Civil engineering
Source: WIPO, IPC Concordance Table, http://w w w .w ipo.int/ipstats/en/index.html, January 2018.

77
Appendices
Annex E - List of Goods and Services for Trademarks
NICE classes
1 Chemical goods
2 Paints and colorants
3 Cleaning products
4 Oils and fuels
5 Pharma products
6 Metals
7 Machineries
8 Hand tools
9 Instruments & computers
10 Medical instruments
11 Lightening and heating
12 Vehicles
13 Firearms
14 Precious goods
15 Musical instruments
16 Papers and packaging
17 Rubber and plastics
18 Leather and complements
19 Building material
20 Furniture
21 House utensils
22 Fibrous products
23 Yarns and threads
24 Textiles
25 Clothing and footw ear
26 Decorations
27 Carpets and f loor covers
28 Games
29 Food
30 Condiments and cereals
31 Animals and grains
32 Low and non alcohol drinks
33 Alcoholic drinks
34 Tobaccos
35 Business and advertising
36 Insurance and f inance
37 Building services
38 Telecommunications
39 Transport and packaging
40 Treatment of materials
41 Education and sport
42 R&D and softw are
43 Food, drink and accommodation
44 Medical and hygiene services
45 Legal and personal services
Source: WIPO, Nice Classif ication, https://w w w .w ipo.int/classif ications/nice, May 2019 .

78
Appendices
Annex F - List of All Science Journal Classification (ASJC) fields
ASJC fields
10 Multidisciplinary
11 Agricultural & Biological Sciences
12 Arts & Humanities
13 Biochemistry, Genetics & Molecular Biology
14 Business, Management & Accounting
15 Chemical Engineering
16 Chemistry
17 Computer Science
18 Decision Sciences
19 Earth & Planetary Sciences
20 Economics, Econometrics & Finance
21 Energy
22 Engineering
23 Environmental Science
24 Immunology & Microbiology
25 Materials Science
26 Mathematics
27 Medicine
28 Neuroscience
29 Nursing
30 Pharmacology, Toxicology & Pharmaceutics
31 Physics & Astronomy
32 Psychology
33 Social Sciences
34 Veterinary
35 Dentistry
36 Health Professions
Source: Elsevier, Scopus Support Center, https://service.elsevier.com/app/overview /scopus, May 2019.
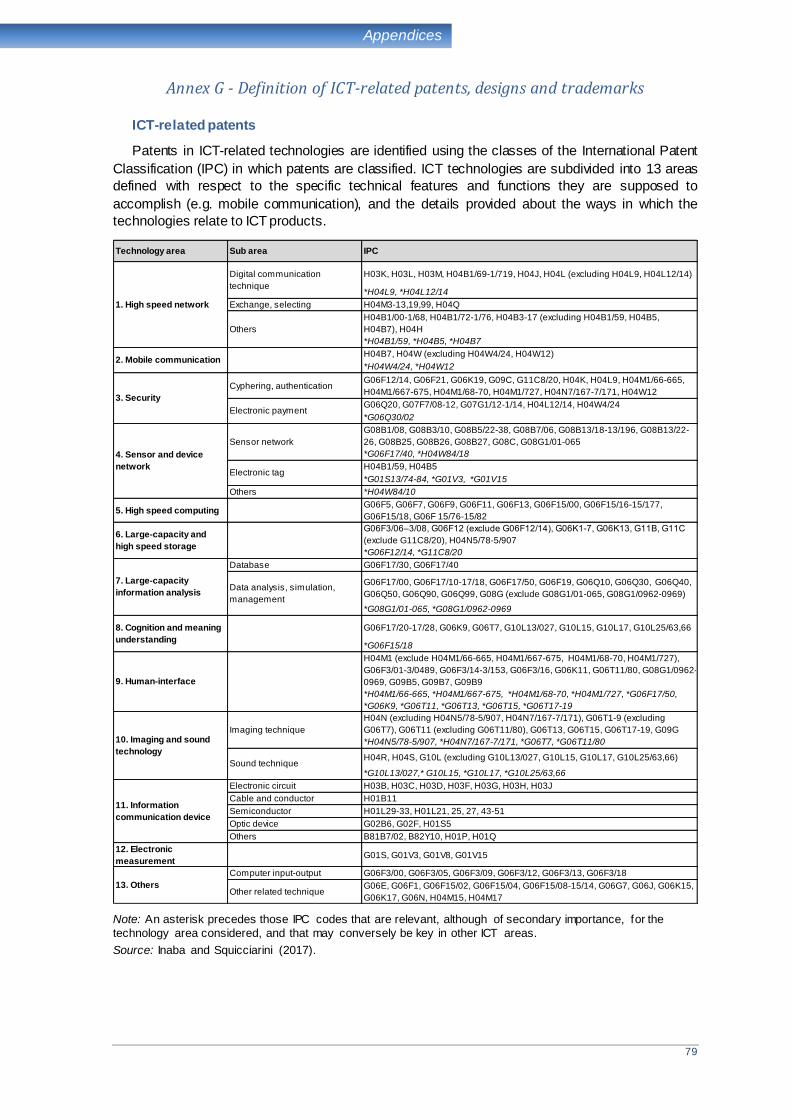
79
Appendices
Annex G - Definition of ICT-related patents, designs and trademarks
ICT-related patents
Patents in ICT-related technologies are identified using the classes of the International Patent
Classification (IPC) in which patents are classified. ICT technologies are subdivided into 13 areas
defined with respect to the specific technical features and functions they are supposed to
accomplish (e.g. mobile communication), and the details provided about the ways in which the
technologies relate to ICT products.
Note: An asterisk precedes those IPC codes that are relevant, although of secondary importance, for the
technology area considered, and that may conversely be key in other ICT areas.
Source: Inaba and Squicciarini (2017).
Technology area Sub area IPC
H03K, H03L, H03M, H04B1/69-1/719, H04J, H04L (excluding H04L9, H04L12/14)
*H04L9, *H04L12/14
Exchange, selecting H04M3-13,19,99, H04Q
H04B1/00-1/68, H04B1/72-1/76, H04B3-17 (excluding H04B1/59, H04B5,
H04B7), H04H
*H04B1/59, *H04B5, *H04B7
H04B7, H04W (excluding H04W4/24, H04W12)
*H04W4/24, *H04W12
Cyphering, authenticationG06F12/14, G06F21, G06K19, G09C, G11C8/20, H04K, H04L9, H04M1/66-665,
H04M1/667-675, H04M1/68-70, H04M1/727, H04N7/167-7/171, H04W12
G06Q20, G07F7/08-12, G07G1/12-1/14, H04L12/14, H04W4/24
*G06Q30/02
G08B1/08, G08B3/10, G08B5/22-38, G08B7/06, G08B13/18-13/196, G08B13/22-
26, G08B25, G08B26, G08B27, G08C, G08G1/01-065
*G06F17/40, *H04W84/18
H04B1/59, H04B5
*G01S13/74-84, *G01V3, *G01V15
Others *H04W84/10
5. High speed computingG06F5, G06F7, G06F9, G06F11, G06F13, G06F15/00, G06F15/16-15/177,
G06F15/18, G06F 15/76-15/82
G06F3/06–3/08, G06F12 (exclude G06F12/14), G06K1-7, G06K13, G11B, G11C
(exclude G11C8/20), H04N5/78-5/907
*G06F12/14, *G11C8/20
Database G06F17/30, G06F17/40
G06F17/00, G06F17/10-17/18, G06F17/50, G06F19, G06Q10, G06Q30, G06Q40,
G06Q50, G06Q90, G06Q99, G08G (exclude G08G1/01-065, G08G1/0962-0969)
*G08G1/01-065, *G08G1/0962-0969
G06F17/20-17/28, G06K9, G06T7, G10L13/027, G10L15, G10L17, G10L25/63,66
*G06F15/18
H04M1 (exclude H04M1/66-665, H04M1/667-675, H04M1/68-70, H04M1/727),
G06F3/01-3/0489, G06F3/14-3/153, G06F3/16, G06K11, G06T11/80, G08G1/0962-
0969, G09B5, G09B7, G09B9
*H04M1/66-665, *H04M1/667-675, *H04M1/68-70, *H04M1/727, *G06F17/50,
*G06K9, *G06T11, *G06T13, *G06T15, *G06T17-19
H04N (excluding H04N5/78-5/907, H04N7/167-7/171), G06T1-9 (excluding
G06T7), G06T11 (excluding G06T11/80), G06T13, G06T15, G06T17-19, G09G
*H04N5/78-5/907, *H04N7/167-7/171, *G06T7, *G06T11/80
H04R, H04S, G10L (excluding G10L13/027, G10L15, G10L17, G10L25/63,66)
*G10L13/027,* G10L15, *G10L17, *G10L25/63,66
Electronic circuit H03B, H03C, H03D, H03F, H03G, H03H, H03J
Cable and conductor H01B11
Semiconductor H01L29-33, H01L21, 25, 27, 43-51
Optic device G02B6, G02F, H01S5
Others B81B7/02, B82Y10, H01P, H01Q
12. Electronic
measurementG01S, G01V3, G01V8, G01V15
Computer input-output G06F3/00, G06F3/05, G06F3/09, G06F3/12, G06F3/13, G06F3/18
Other related techniqueG06E, G06F1, G06F15/02, G06F15/04, G06F15/08-15/14, G06G7, G06J, G06K15,
G06K17, G06N, H04M15, H04M17
11. Information
communication device
13. Others
8. Cognition and meaning
understanding
9. Human-interface
10. Imaging and sound
technology
Imaging technique
Sound technique
4. Sensor and device
network
Sensor network
Electronic tag
6. Large-capacity and
high speed storage
7. Large-capacity
information analysisData analysis, simulation,
management
1. High speed network
Digital communication
technique
Others
2. Mobile communication
3. Security
Electronic payment
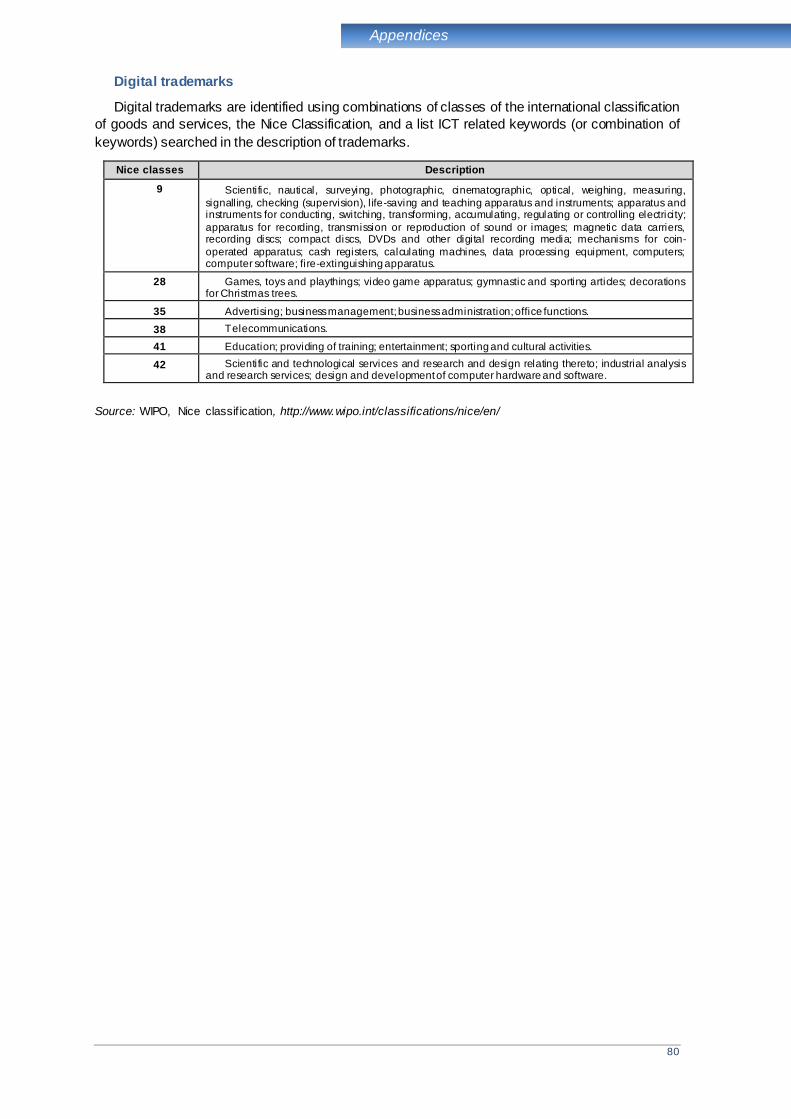
80
Appendices
Digital trademarks
Digital trademarks are identified using combinations of classes of the international classification
of goods and services, the Nice Classification, and a list ICT related keywords (or combination of
keywords) searched in the description of trademarks.
Nice classes Description
9 Scientific, nautical, surveying, photographic, cinematographic, optical, weighing, measuring,
signalling, checking (supervision), l ife-saving and teaching apparatus and instruments; apparatus and instruments for conducting, switching, transforming, accumulating, regulating or controlling electricity;
apparatus for recording, transmission or reproduction of sound or images; magnetic data carriers, recording discs; compact discs, DVDs and other digital recording media; mechanisms for coin-
operated apparatus; cash registers, calculating machines, data processing equipment, computers; computer software; fire-extinguishing apparatus.
28 Games, toys and playthings; video game apparatus; gymnastic and sporting articles; decorations for Christmas trees.
35 Advertising; business management; business administration; office functions.
38 Telecommunications.
41 Education; providing of training; entertainment; sporting and cultural activities.
42 Scientific and technological services and research and design relating thereto; industrial analysis and research services; design and development of computer hardware and software.
Source: WIPO, Nice classif ication, http://www.wipo.int/classifications/nice/en/
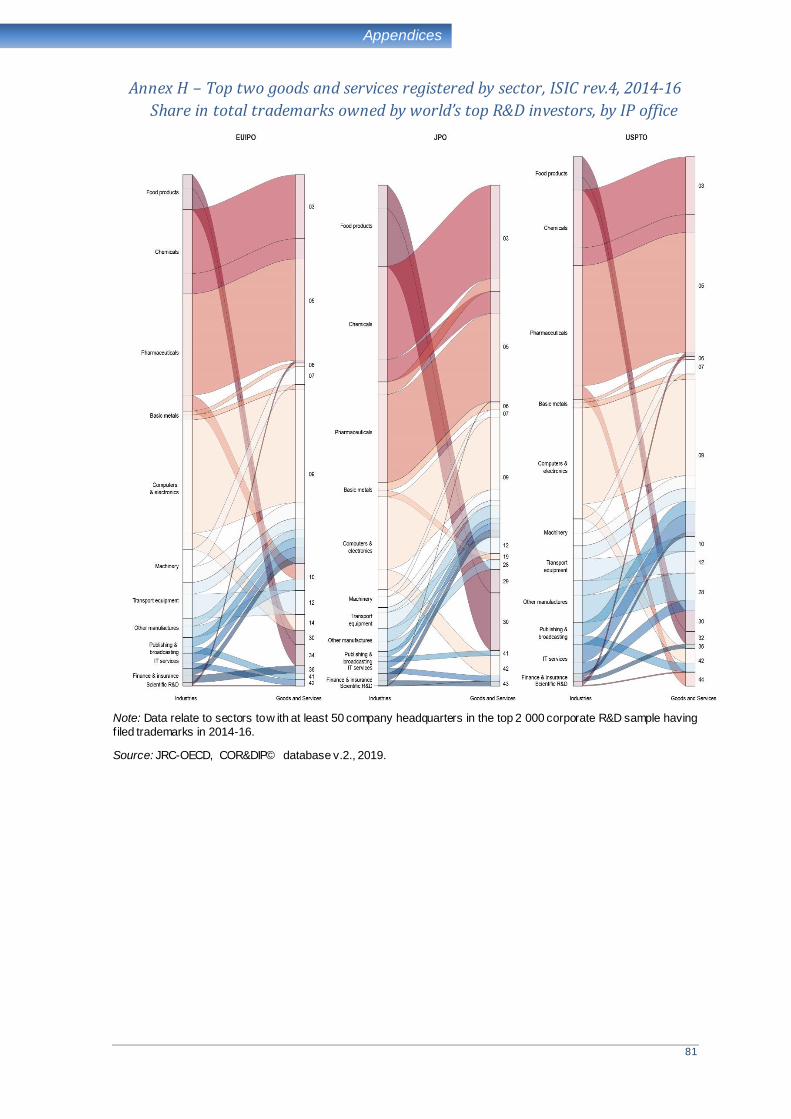
81
Appendices
Annex H – Top two goods and services registered by sector, ISIC rev.4, 2014-16
Share in total trademarks owned by world’s top R&D investors, by IP office
Note: Data relate to sectors to w ith at least 50 company headquarters in the top 2 000 corporate R&D sample having
f iled trademarks in 2014-16.
Source: JRC-OECD, COR&DIP© database v.2., 2019.

82
GETTING IN TOUCH WITH THE EU
In person
All over the European Union there are hundreds of Europe Direct information centres. You can find the address of the centre
nearest you at: https://europa.eu/european-union/contact_en
On the phone or by email
Europe Direct is a service that answers your questions about the European Union. You can contact this service :
- by freephone: 00 800 6 7 8 9 10 11 (certain operators may charge for these calls),
- at the following standard number: +32 22999696, or
- by e lectronic mail via: https://europa.eu/european-union/contact_en
FINDING INFORMATION ABOUT THE EU
Online
Information about the European Union in all the official languages of the EU is available on the Europa website at:
https://europa.eu/european-union/index_en
EU publications
You can download or order free and priced EU publications from EU Bookshop at: https://publications.europa.eu/en/publications. Multip le copies of free publications may be obtained by contacting Europe Direct
or your local information centre (see https://europa.eu/european-union/contact_en).
83
KJ-N
A-2
98
31
-EN-C
Consult this publication online at
http://iri.jrc.ec.europa.eu/other-reports.html
http://oe.cd/ipstats
The dataset will be available through the OECD website at http://oe.cd/ipstats
doi:10.2760/16575
ISBN 978-92-76-09670-2