World Bank Wednesday April 29, 2009 Paul E. Peterson - Discussant Henry Lee Shattuck Professor of...
23
World Bank Wednesday April 29, 2009 Paul E. Peterson - Discussant Henry Lee Shattuck Professor of Government, Harvard University Director Harvard Program on Education Policy and
-
Upload
garry-holland -
Category
Documents
-
view
214 -
download
1
Transcript of World Bank Wednesday April 29, 2009 Paul E. Peterson - Discussant Henry Lee Shattuck Professor of...

World BankWednesday April 29, 2009
Paul E. Peterson - DiscussantHenry Lee Shattuck Professor of Government, Harvard University
DirectorHarvard Program on Education Policy and Governance

Heterogeneity in School Sector Heterogeneity in School Sector Effects on Effects on
Elementary Student Elementary Student
PerformancePerformance
Paul E. Peterson & Elena Llaudet Paul E. Peterson & Elena Llaudet Harvard UniversityHarvard University
2. Effects of Public and Private 2. Effects of Public and Private Schools on Elementary School Schools on Elementary School
StudentsStudents

Data from Early Childhood Data from Early Childhood Longitudinal Survey - Kindergarten Longitudinal Survey - Kindergarten Class of 1998-9 (ECLS-K), Class of 1998-9 (ECLS-K),
the first longitudinal study that the first longitudinal study that attempts to track the elementary attempts to track the elementary school experience of a nationally school experience of a nationally representative sample of studentsrepresentative sample of students
Track students from K to 5Track students from K to 5thth grade grade

MethodMethod
Propensity score matching of public Propensity score matching of public and private studentsand private students
Imputation of missing variables.Imputation of missing variables. Fifth grade outcomes, controlling for Fifth grade outcomes, controlling for
first grade performance and first grade performance and numerous background numerous background characteristics.characteristics.
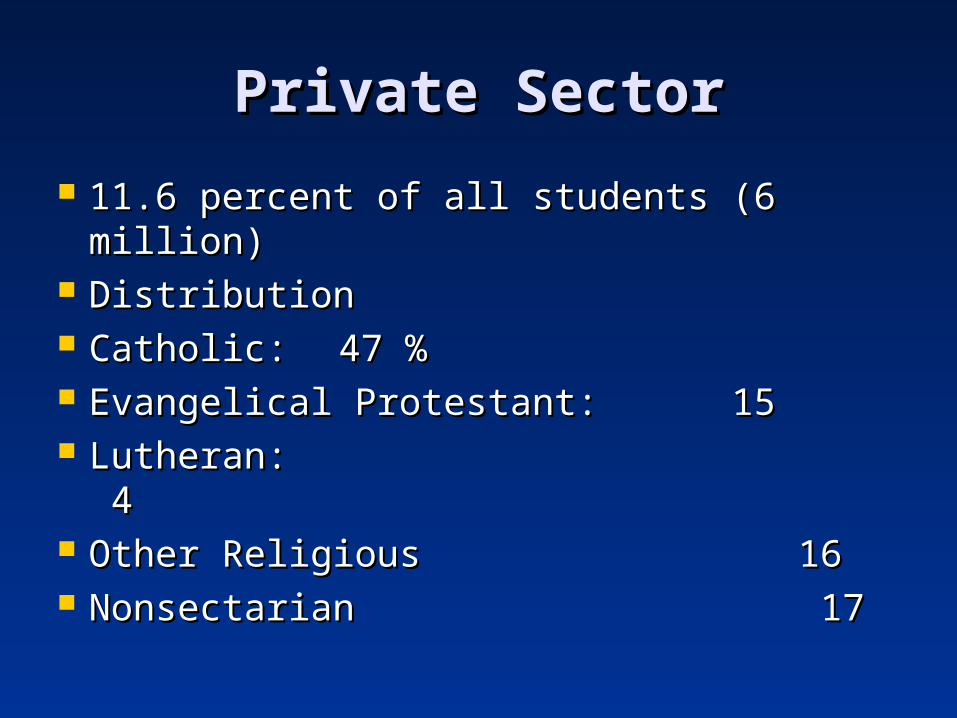
Private SectorPrivate Sector
11.6 percent of all students (6 11.6 percent of all students (6 million)million)
DistributionDistribution Catholic: Catholic: 47 %47 % Evangelical Protestant: 15 Evangelical Protestant: 15 Lutheran: 4Lutheran: 4 Other Religious 16Other Religious 16 Nonsectarian 17 Nonsectarian 17

Average Expenditure per Average Expenditure per PupilPupil
Public SchoolPublic School $9,929$9,929 Private SchoolPrivate School $5,634$5,634
Average Teacher SalariesAverage Teacher Salaries Public SchoolPublic School about $43,000about $43,000 Private SchoolPrivate School less than $30,000less than $30,000
In 2003, according to information reported by U.S. Department of In 2003, according to information reported by U.S. Department of Education (2005b)Education (2005b)
In 2000, according to information reported by U.S. Department of In 2000, according to information reported by U.S. Department of Education (2005b)Education (2005b)

FindingsFindings
Overall, private school advantage in Overall, private school advantage in reading (0.05), not in mathreading (0.05), not in math
Larger private school advantage in Larger private school advantage in reading for low SES, low initial ability reading for low SES, low initial ability students (0.23 s. d.)students (0.23 s. d.) (One third of a years worth of learning, (One third of a years worth of learning,
approximately)approximately)
Private school advantage in reading Private school advantage in reading for minority students (0.18 s. d.)for minority students (0.18 s. d.)

Findings (cont.)Findings (cont.)
Public school advantage in math for Public school advantage in math for high SES, high initial ability students high SES, high initial ability students (0.13)(0.13)
Public school advantage in math for Public school advantage in math for white and Asian students (0.12)white and Asian students (0.12)

Charter school Charter school effectivenesseffectiveness
National observational studies—national National observational studies—national sample, but few if any control variablessample, but few if any control variables
do not track student gains.do not track student gains.
Randomized field trialsRandomized field trials
excellent quality, few excellent quality, few unrepresentative schoolsunrepresentative schools
Student fixed effectsStudent fixed effects
reasonable quality, only certain reasonable quality, only certain placesplaces


Estimated Test Score Effect of Attending Estimated Test Score Effect of Attending New York City’s Charter Schools, Per Year New York City’s Charter Schools, Per Year
of Attendance, on Average studentof Attendance, on Average student
MathMath ReadingReadingmalemale femalefemale malemale femalefemale.09.09 .09.09 .03.03 .05.05
MathMath ReadingReading
blackblackHispanHispan
icic blackblackHispanHispan
icic.09.09 .08.08 .04.04 .03.03
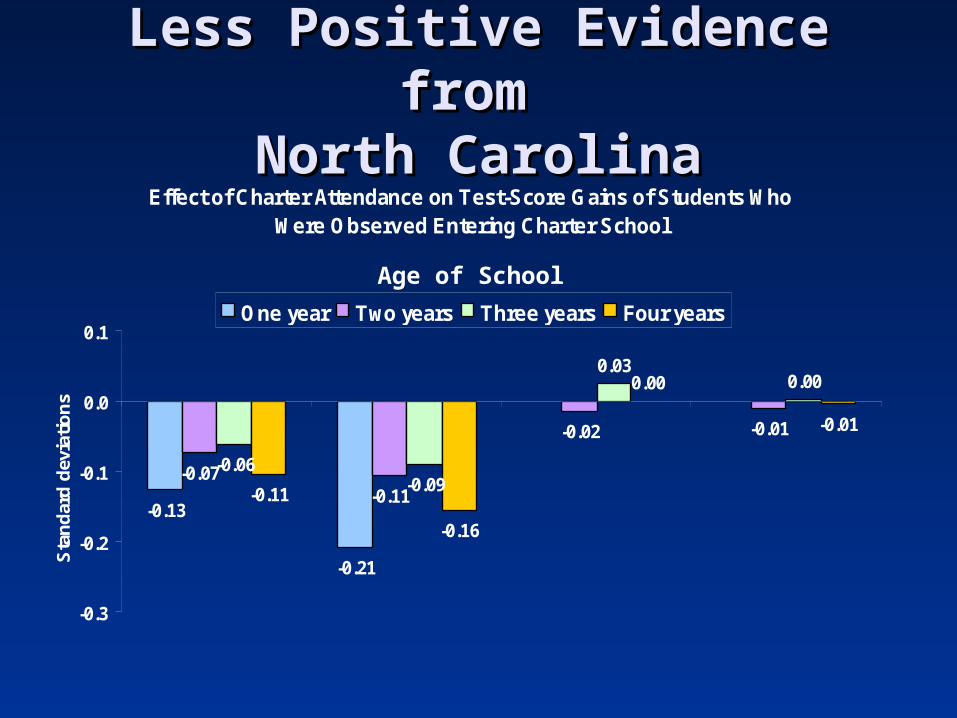
Less Positive Evidence from Less Positive Evidence from
North CarolinaNorth CarolinaEffect of Charter Attendance on Test-Score Gains of Students Who
Were Observed Entering Charter School
-0.13
-0.21
-0.07-0.11
-0.02 -0.01
-0.06-0.09
0.030.00
-0.11
-0.16
0.00
-0.01
-0.3
-0.2
-0.1
0.0
0.1
Sta
nd
ard
dev
iati
on
s
One year Two years Three years Four years
Age of School

School choice research can’t School choice research can’t tell us what we really want to tell us what we really want to
know:know:
What happens in the long What happens in the long run, after parents have had run, after parents have had choice for many years and choice for many years and
schools systems have schools systems have evolved in response to evolved in response to
parental choice.parental choice.

But, now, we have research that tells us exactly that:
4. Long-Term Effects of 4. Long-Term Effects of School Choice: Data from 29 School Choice: Data from 29 CountriesCountries
Study by Martin R. WestStudy by Martin R. West
and Ludger Woessmannand Ludger Woessmann

Comes from 29 countries. Some have Comes from 29 countries. Some have lots of parental choice, some a littlelots of parental choice, some a little
Student performance in math, science Student performance in math, science and reading at age 15 is measured and reading at age 15 is measured by the PISA 2003, collected by the by the PISA 2003, collected by the Organization of Economic Co-Organization of Economic Co-operation and Development (OECD), operation and Development (OECD), an official international agency.an official international agency.

Do countries that have more Do countries that have more school choice have higher school choice have higher
student performance?student performance?
School choice is measured School choice is measured by the percentage of by the percentage of
students attending private students attending private schools.schools.

Private Share of School Private Share of School EnrollmentEnrollment
A LOTA LOT SOMESOME A LITTLE / NONEA LITTLE / NONE
CountryCountry Share Share (%)(%)
CountryCountry Share Share (%)(%)
CountryCountry Share Share (%)(%)
NetherlaNetherlandsnds
7777 MexicoMexico 1616 ItalyItaly 55
BelgiumBelgium 6969 LuxembourgLuxembourg 1414 New New ZealandZealand
55
IrelandIreland 6161 Slovak Slovak RepublicRepublic
1212 GreeceGreece 44
KoreaKorea 5656 HungaryHungary 1111 SwedenSweden 44
AustraliaAustralia 3838 AustriaAustria 88 TurkeyTurkey 33
SpainSpain 3838 GermanyGermany 88 NorwayNorway 11
JapanJapan 2727 CanadaCanada 77 PolandPoland 11
DenmarkDenmark 2222 Czech Czech RepublicRepublic
77 IcelandIceland 00
FinlandFinland 77
PortugalPortugal 66
SwitzerlandSwitzerland 66
United United KingdomKingdom
66
United United StatesStates
66

Math Test ScoresMath Test ScoresWELL ABOVEWELL ABOVE AVERAGEAVERAGE BELOWBELOW
CountryCountry ScoreScore CountryCountry ScoreScore CountryCountry ScoreScore
FinlandFinland 544544 AustraliaAustralia 524524 Slovak Slovak RepublicRepublic
499499
KoreaKorea 541541 New ZealandNew Zealand 524524 NorwayNorway 495495
NetherlaNetherlandsnds
538538 Czech Czech RepublicRepublic
516516 LuxembourLuxembourgg
493493
JapanJapan 534534 IcelandIceland 515515 HungaryHungary 490490
CanadaCanada 533533 DenmarkDenmark 514514 PolandPoland 490490
BelgiumBelgium 529529 SwedenSweden 510510 SpainSpain 486486
SwitzerlaSwitzerlandnd
526526 United United KingdomKingdom
508508 United United StatesStates
483483
AustriaAustria 505505 PortugalPortugal 466466
IrelandIreland 503503 ItalyItaly 466466
GermanyGermany 503503 GreeceGreece 445445
TurkeyTurkey 424424
MexicoMexico 385385

Government Funding of Government Funding of Private Schools*Private Schools*
More than 80%More than 80% 50 to 79 %50 to 79 % Less than 50%Less than 50%
CountryCountry PercentPercentageage
CountryCountry PercentaPercentagege
CountryCountry PercentPercentageage
SwedenSweden 9999 GermanyGermany 7878 IrelandIreland 4545
FinlandFinland 9898 HungaryHungary 7878 PolandPoland 3535
NetherlanNetherlandsds
9696 DenmarkDenmark 7676 JapanJapan 3333
Slovak Slovak RepublicRepublic
9494 SpainSpain 6767 SwitzerlaSwitzerlandnd
2222
IcelandIceland 9090 PortugalPortugal 6464 New New ZealandZealand
1515
LuxembouLuxembourgrg
8989 Czech Czech RepublicRepublic
6363 ItalyItaly 1414
NorwayNorway 8888 KoreaKorea 5555 U.K.U.K. 1313
BelgiumBelgium 8585 CanadaCanada 5454 United United StatesStates
22
MexicoMexico 11
GreeceGreece 00
TurkeyTurkey 00
*Note: Data unavailable for Australia and *Note: Data unavailable for Australia and AustriaAustria

Impact of Country’s Private Impact of Country’s Private Share on…Share on…
126points
71points 56
points
Math Science Reading

The effect of aThe effect of a10-percentage-point10-percentage-pointincrease in the share of increase in the share of enrollment in private enrollment in private school is equivalent toschool is equivalent to
41 percent41 percentof a year’s worth of learning of a year’s worth of learning
in high school.in high school.

Impact of Country’sImpact of Country’sPrivate Share onPrivate Share onMath Scores ofMath Scores of
Students in Public SchoolStudents in Public Schoolisis
66 points66 points..

Impact of Country’sImpact of Country’sPrivate Share onPrivate Share on
Per Pupil Expenditure isPer Pupil Expenditure isto reduce it byto reduce it by5.6 percent5.6 percent..