World Bank Documentdocuments.worldbank.org/curated/en/... · G. Ratings of Project Performance in...
69
Document of The World Bank Report No: ICR00002233 IMPLEMENTATION COMPLETION AND RESULTS REPORT (Loan No 7303-UR) ON A LOAN IN THE AMOUNT OF US$ 70 MILLION TO THE ORIENTAL REPUBLIC OF URUGUAY FOR A TRANSPORT INFRASTRUCTURE MAINTENANCE AND RURAL ACCESS PROJECT JANUARY 31, 2012 Sustainable Development Department Argentina, Paraguay and Uruguay Country Management Unit Latin America and Caribbean Region Public Disclosure Authorized Public Disclosure Authorized Public Disclosure Authorized Public Disclosure Authorized Public Disclosure Authorized Public Disclosure Authorized Public Disclosure Authorized Public Disclosure Authorized
Transcript of World Bank Documentdocuments.worldbank.org/curated/en/... · G. Ratings of Project Performance in...
Document of The World Bank
Report No: ICR00002233
IMPLEMENTATION COMPLETION AND RESULTS REPORT
(Loan No 7303-UR)
ON A
LOAN
IN THE AMOUNT OF US$ 70 MILLION
TO THE
ORIENTAL REPUBLIC OF URUGUAY
FOR A
TRANSPORT INFRASTRUCTURE MAINTENANCE AND RURAL ACCESS PROJECT
JANUARY 31, 2012
Sustainable Development Department
Argentina, Paraguay and Uruguay Country Management Unit
Latin America and Caribbean Region
Pub
lic D
iscl
osur
e A
utho
rized
Pub
lic D
iscl
osur
e A
utho
rized
Pub
lic D
iscl
osur
e A
utho
rized
Pub
lic D
iscl
osur
e A
utho
rized
Pub
lic D
iscl
osur
e A
utho
rized
Pub
lic D
iscl
osur
e A
utho
rized
Pub
lic D
iscl
osur
e A
utho
rized
Pub
lic D
iscl
osur
e A
utho
rized

CURRENCY EQUIVALENTS
(Exchange Rate Effective December 12, 2011)
Currency Unit = Uruguayan Peso (UY$)
UY$ 1.00 = US$ 0.051
US$ 1.00 = UY$ 19.700
FISCAL YEAR
[January 1 – December 31]
ABBREVIATIONS AND ACRONYMS
CAF Corporacion Andina de Fomento
CAS Country Assistance Strategy
CND (Comisión Nacional para el Desarrollo)
CREMA Road rehabilitation and maintenance contracts
(Contratos de rehabilitacion y mantenimiento)
CVU Corporacion Vial del Uruguay
DNH Direccion Nacional de Hidrografía – MTOP
DNT Direccion Nacional de Topografía – MTOP
DNV Road department (Direccion Nacional de Vialidad – MTOP)
ECLAC Economic Commission for Latin America and the Caribbean
GoU Government of Uruguay
IDB Inter American Development Bank
IFI International Financing Institutions
IRI International Roughness Index
IRR Internal Rate of return
M&E Monitoring and Evaluation
MTOP Ministry of Transport and Public Works
(Ministerio de Transporte y Obras Publicas)
NPV Net Present Value
PAD Project Appraisal Document
PDO Project Development Objective
PPP Public-Private Partnerships
Vice President: Hasan Tuluy
Country Director: Penelope Brook
Sector Manager: Aurelio Menendez
Project Team Leader: Gregoire Gauthier
ICR Team Leader: Gregoire Gauthier

ORIENTAL REPUBLIC OF URUGAY
Transport Infrastructure Maintenance and Rural Access Project
CONTENTS
Data Sheet
A. Basic Information
B. Key Dates C. Ratings Summary
D. Sector and Theme Codes
E. Bank Staff
F. Results Framework Analysis G. Ratings of Project Performance in ISRs
H. Restructuring
I. Disbursement Graph
1. Project Context, Development Objectives and Design ..........................................................................................1
2. Key Factors Affecting Implementation and Outcomes ..........................................................................................5
3. Assessment of Outcomes ................................................................................................................................... 11
4. Assessment of Risk to Development Outcome ............................................................................................... 23
5. Assessment of Bank and Borrower Performanceh.......................................................................................... 25
6. Lessons Learned (both project-specific and of wide general application) .......................................................... 28
7. Comments on Issues Raised by Borrower/Implementing Agencies/Partners .................................................... 29
Annex 1. Project Costs and Financing ................................................................................................................. 30
Annex 2. Outputs by Component ....................................................................................................................... 31
Annex 3. Economic and Financial Analysis (including assumptions in the analysis) .......................................... 34
Annex 4. Bank Lending and Implementation Support/Supervision Processes .................................................. 37
Annex 5. Beneficiary Survey Results (if any)....................................................................................................... 39
Annex 6. Stakeholder Workshop Report and Results (if any) ............................................................................ 40
Annex 7. Summary of Borrower’s ICR and/or Comments on Draft ICR ............................................................. 41
Annex 8. Comments of Cofinanciers and Other Partners/Stakeholders ............................................................ 55
Annex 9. List of Supporting Documents ............................................................................................................. 56
MAP


i
A. Basic Information
Country: Uruguay Project Name: Transport Infrastructure Maintenance and Rural Access
Project ID: P057481 L/C/TF Number(s): IBRD-73030 ICR Date: 01/31/2012 ICR Type: Core ICR
Lending Instrument: SIL Borrower: REPUBLIC OF URUGUAY
Original Total Commitment:
USD 70.00M Disbursed Amount: USD 68.11M
Revised Amount: USD 68.11M Environmental Category: B Implementing Agencies: Ministerio de Transporte y Obras Publicas Cofinanciers and Other External Partners: B. Key Dates
Process Date Process Original Date Revised / Actual Date(s)
Concept Review: 08/03/2004 Effectiveness: 07/04/2005 07/04/2005
Appraisal: 04/12/2005 Restructuring(s): 03/26/2007 02/25/2010
Approval: 06/09/2005 Mid-term Review: Closing: 07/31/2011 07/31/2011 C. Ratings Summary C.1 Performance Rating by ICR Outcomes: Moderately Satisfactory Risk to Development Outcome: Moderate Bank Performance: Satisfactory Borrower Performance: Satisfactory
C.2 Detailed Ratings of Bank and Borrower Performance (by ICR) Bank Ratings Borrower Ratings
Quality at Entry: Moderately Satisfactory Government: Satisfactory
Quality of Supervision: Satisfactory Implementing Agency/Agencies: Satisfactory
Overall Bank Performance: Satisfactory Overall Borrower
Performance: Satisfactory

ii
C.3 Quality at Entry and Implementation Performance Indicators Implementation
Performance Indicators QAG Assessments (if any) Rating
Potential Problem Project at any time (Yes/No):
No Quality at Entry (QEA):
None
Problem Project at any time (Yes/No):
No Quality of Supervision (QSA):
None
DO rating before Closing/Inactive status:
Satisfactory
D. Sector and Theme Codes
Original Actual Sector Code (as % of total Bank financing) Central government administration 3 3 Ports, waterways and shipping 3 3 Roads and highways 92 92 Sub-national government administration 2 2
Theme Code (as % of total Bank financing) Infrastructure services for private sector development 17 17 Injuries and non-communicable diseases 16 16 Regional integration 17 17 Rural services and infrastructure 17 17 Trade facilitation and market access 33 33 E. Bank Staff
Positions At ICR At Approval Vice President: Hasan A. Tuluy Pamela Cox Country Director: Penelope J. Brook Axel van Trotsenburg Sector Manager: Aurelio Menendez Jose Luis Irigoyen Project Team Leader: Gregoire Francois Gauthier Andres G. Pizarro ICR Team Leader: Gregoire Francois Gauthier ICR Primary Author: Melanie Glass

iii
F. Results Framework Analysis Project Development Objectives (from Project Appraisal Document) The project's development objective is to upgrade the country's transport infrastructure to a condition that facilitates the transportation of freight and passengers at a cost-efficient level of service. Revised Project Development Objectives (as approved by original approving authority) The PDO was never revised (a) PDO Indicator(s)
Indicator Baseline Value
Original Target Values (from
approval documents)
Formally Revised Target Values
Actual Value Achieved at
Completion or Target Years
Indicator 1 : Cost-efficiency: Percentage of the road network below the optimal level of service (based on the International Roughness Index --IRI)
Value quantitative or Qualitative)
16% for the flexible pavement network 20% for the total network
2008: 9% 2011: 11% 2008: 13% 2011: 15%
2008: 22.53% 2011: 22.54% 2008: 26.31% 2010: 31.06%
Date achieved 04/25/2005 12/31/2008 12/31/2010 Comments (incl. % achievement)
Indicator was not met.
Indicator 2 : Arresting deterioration: Percentage of the road network in bad condition as determined by the Road Condition Index (Indice de Estado-IES).
Value quantitative or Qualitative)
29.50%
2008: 25% 2011: 23% 2006: 21.42%
2008: 18.66% 2010: 22.27%
Date achieved 04/25/2005 12/31/2008 12/31/2010 Comments (incl. % achievement)
Indicator was met.
Indicator 3 : Preserving the value of road assets: The value of road assets is maintained equal or above the median level.
Value quantitative or Qualitative)
2008: value of road 0.65% below the median value
2008: value of road assets reaches median level 2011: value of road assets is at least 1% above the
2008: 0.12% below the median level 2010: 0.45% below the median level

iv
median level Date achieved 04/25/2005 12/31/2008 12/31/2010 Comments (incl. % achievement)
Indicator was partially met; values oscillated around the median and was in the order of magnitude recommended by ECLAC even if the 2010 value is below the target value.
(b) Intermediate Outcome Indicator(s)
Indicator Baseline Value
Original Target Values (from
approval documents)
Formally Revised
Target Values
Actual Value Achieved at
Completion or Target Years
Indicator 1 :
Targeted national roads and bridges on international corridors (managed by DNV and within the Megaconcesion) have adequate levels of service and are upgraded to Mercosur standards.
Value (quantitative or Qualitative)
IRI: 3 IES: 78 Only on: Montevideo-Empalme Ruta 9; Empalme Ruta 9-Minas and Melo-Acegua
2008: IRI:<3; IES:>70 2011: IRI:<3; IES:>78 2008: Transit of trucks loaded up to Mercosur standards enabled on Route 8. 2011: Transit of trucks loaded up to Mercosur standards enabled on Route 8.
2008: IRI: 2.61; IES: 85 2010: IRI: 2.45; IES: 82 2008/ 2010: Only on: Montevideo-Empalme Ruta 9; Empalme Ruta 9-Minas and Melo-Acegua
Date achieved 04/25/2005 12/31/2008 12/31/2010 Comments (incl. % achievement)
Indicator was met. Target levels were attained in the first year of project implementation (2006) and remained that way until Project closure.
Indicator 2 : Roads maintained through CREMA contracts are preserved at an adequate level of service.
Value (quantitative or Qualitative)
determined by the initial conditions of roads to be maintained through CREMA
2011: Level of service required as determined by each contract=95%
2011: Access to Montevideo=>95% 2010: Route 3<90%
Date achieved 04/25/2005 12/31/2011 12/31/2010 Comments (incl. % achievement)
Indicator was partially met. The Access of Montevideo contract exceeded the expected target. Route 3 contract however did not accomplish the target.
Indicator 3 : The departmental road network is maintained in a good condition Percentage of the Departmental Road Network in bad condition

v
Number of Departments that execute the Departmental Program completely Kilometers of Departmental Roads maintained
Value (quantitative or Qualitative)
Good (s1): 50%; Good (s2): 25%; Fair (s1): 25%; Fair (s2): 25%; Bad (s1): 15%; Bad (s2): 15% 15 8700 km.
2006-2011: percentage of the Departmental Road network in bad condition at 10% 2006-2011:19 2006-2011: 9000 km
2010: Good (s1): 60%; Good (s2): 58%; Fair (s1): 26%; Fair (s2): 35%; Bad (s1): 13%; Bad (s2): 6% 2006: 16 2007:14 2008: 16 2009: 16 2010: 19 2011:19 2006: 8953 km. 2007: 9803 km. 2008: 9182 km. 2009: 9875 km. 2010: 9875 km.
Date achieved 04/25/2005 12/31/2011 12/31/2010
Comments (incl. % achievement)
Indicator substantially met. Although the percentage of the Departmental Road Network in bad condition diminished throughout the Project’s lifespan, in one case (s1) the target was not met (13%). In s2 the target was exceeded, reaching only 6%
Indicator 4 : Safety is improved in targeted sections of Uruguay’s road network Road accident index in targeted sections of the national routes
Value (quantitative or Qualitative)
Number of accidents: 88 2011: Number of accidents: 66 2010: Number of
accidents: 53
Date achieved 04/25/2005 12/31/2011 12/31/2010 Comments (incl. % achievement)
Indicator was met. Number of accidents has been consistently below the target level since 2007.
Indicator 5 :
Capacity of the MTOP to identify, formulate and eval. transport infrast. projects is strengthened. Updated strategic planning tool Updated financial mgt. system for PCU The Govt. has the necessary tools Master Plans for Reg. Public Ports laun
Value (quantitative or Qualitative)
Plan has not been prepared
2007: Plan completed
2007: Plan in execution

vi
HDM-III utilized at project level SIIF The Program has not been prepared Only the Port of Montevideo has a Master Plan
2011: First network plan completed 2008: Updated financial management system including hardware and software 2008: studies completed 2008: Plans are launched
2010: HDM-IV is used for the work plan 2010-2014 at network level 2008: Updated financial management system including hardware and software 2008: studies completed 2008: DNH Strategy presented
Date achieved 04/25/2005 12/31/2011 12/31/2010
Comments (incl. % achievement)
Indicator was met Indicator was met Indicator was met Indicator was met Indicator was substantially met
G. Ratings of Project Performance in ISRs
No. Date ISR Archived DO IP
Actual Disbursements (USD millions)
1 09/16/2005 Satisfactory Satisfactory 0.35 2 11/17/2005 Satisfactory Satisfactory 0.35 3 06/02/2006 Satisfactory Moderately Satisfactory 5.35 4 12/27/2006 Moderately Satisfactory Moderately Satisfactory 10.87 5 06/28/2007 Satisfactory Moderately Satisfactory 15.48 6 12/04/2007 Satisfactory Moderately Satisfactory 23.69 7 06/20/2008 Satisfactory Satisfactory 33.59 8 12/31/2008 Satisfactory Satisfactory 40.20 9 05/15/2009 Satisfactory Satisfactory 44.61
10 12/19/2009 Satisfactory Satisfactory 51.33 11 05/10/2010 Satisfactory Satisfactory 52.70 12 02/16/2011 Satisfactory Satisfactory 60.49 13 07/27/2011 Satisfactory Satisfactory 64.36

vii
H. Restructuring (if any)
Restructuring Date(s)
Board Approved
PDO Change
ISR Ratings at Restructuring
Amount Disbursed at
Restructuring in USD millions
Reason for Restructuring & Key Changes Made DO IP
03/26/2007 N MS MS 13.13 Subsitution of sub-projects and reallocation of loan proceeds.
02/25/2010 S S 52.70 Reallocation of loan proceeds.
I. Disbursement Profile


1
1. Project Context, Development Objectives and Design
At the time of Project preparation, Uruguay’s economy was bouncing back, after four years in which
GDP declined by almost 20%. In 2003, the economy grew at a rate of 2.5%, accelerating further at a rate
of 12.3% in 2004. This pickup in the economy motivated the Government to review its broader
development strategy, focusing on the improvement of national transport infrastructure in order to cope
with expected increases in regional trade, enhance the country’s competitiveness in the forestry and
agricultural sectors and increase the attractiveness of Uruguay as a logistics center for Mercosur.
In terms of the political context at appraisal, most of the Project was prepared during the last years of the
Batlle administration, with preparation being finalized and the Project being approved under the
administration of Tabaré Vázquez, who won the national elections of 2004 and entered office in 2005.
In 2003, the transport sector represented 7% of Uruguayan GDP, making it an important sector of the
national economy. The total road network, at the time of appraisal, comprised a total of 70,732 km, of
which 8,732 formed the national road network managed by the National Directorate of Highways
(DNV) and 62,000 km were departmental roads managed by 19 Departmental Governments
(Departamentos). The Departmental road network was mostly unpaved, with only 8% of paved roads,
65% of gravel roads with year round accessibility and 27% earth roads. In turn, approximately 90% of
the national road network was paved (7,743 km.) although road conditions had seen a gradual
deterioration in the last few years, due primarily to an increased maintenance backlog resulting from
growing fiscal constraints.
From 2000 to 2004, given the economic crisis and increasing budget restrictions, the value of road assets
in the country fell from its peak value in 2000 of US$2.23 billion to US$2.14 billion. The percentage of
roads in very good condition dropped to 19% and the percentage in poor condition increased from 25%
to 33% from 2001 to 2003. Additionally, many maintenance contracts with the private sector could not
be implemented and standards of force account maintenance had to be reduced in order to meet MTOP
budgetary restrictions. Therefore, despite consistency of policies in terms of absolute priority to
maintenance, the lack of investments inevitably took a toll in terms of the condition and value of road
infrastructure assets.
The Government of Uruguay’s road management strategy at the time of appraisal was based on the use
of performance-based instruments, including: (i) private sector participation mechanisms such as road
concessions, performance-based maintenance contracts (CREMAs) and maintenance microenterprises;
(ii) the “megaconcesion”-an innovative scheme for channeling funding towards the performance-based
maintenance of key sections of the busiest sections of the primary road network, awarding the contract
to CND (Corporacion Nacional de Desarrollo, a public corporation), which in turn assigned the contract
to a special subsidiary entity vested with legal personality, CVU (Corporacion Vial del Uruguay); and
(iii) output-based maintenance schemes for the departmental road network. Maintenance of the
departmental road network has been undertaken through MTOP’s Departmental Roads Maintenance
Program (DRMP) which assists departments in carrying out approximately 10,000km of roads per year
and provides technical assistance to improve overall institutional capacity at the departmental level.
However, although participation of maintenance by force account saw an important reduction in the
1998-2004 period, due to the adoption of new performance-based instruments and the increased

2
participation of the private sector, DNV remained, at the time of appraisal, the major player in the
sector, with force account accounting for 58% of the network (5,065 km). Maintenance performed by
microenterprises accounted for 18.4% of the network (1,613 km.); CREMA contracts covered 14.9% of
the network (1,303 km.); and 5% of the network (442 km.) were managed through concession contracts.
Sector financing in Uruguay was – and still is – determined through a Five Year Investment Plan (Plan
Quinequenal), prepared at the beginning of each administration and approved by Congress. This
provides a good framework in terms of medium term planning, although it somewhat reduces flexibility
in cases of budget shortfalls. On average, in the 1990s, funds dedicated to road investments ranged from
US$60 to US$89 million per year and funds allocated to maintenance ranged between US$23-28
million. From 1999 onwards, the economic crisis meant a drastic reduction of public expenditures,
meaning that DNV had to manage its asset with a significantly lower budget. However, even when
DNV’s budget declined drastically from 1999 to 2003, the yearly maintenance budget remained at
US$40 million in 2003-where almost 100% of road expenditures were dedicated to maintenance-,
showing MTOP’s absolute prioritization of road maintenance, even at a time of budget constraints.
The Bank has historically played a role in ensuring continuity in sector development, having a
longstanding partnership with the country, through: (i) the First Transport Project (1988), which created
a maintenance management system (MMS) within DNV and supported DNV’s assistance program to
Departments, among others; (ii) the Forest Products Transport Project (loan 42040, approved in 1997),
with some of the programmed infrastructure works being finally financed through this operation; and
(iii) the Second Transport Project (loan 4395-UR, approved in 1998), which improved the MMS and the
integrated highway planning system (SIPLA), introduced CREMA contracts in the rehabilitation and
maintenance of the primary road network and supported technology transfers and institutional capacity
building of Departments. The Transport Infrastructure Maintenance and Rural Access Project was in
many ways designed so as to provide continuity to sector policies being supported by the Bank over the
last two decades or so, particularly under the Second Transport Project.
Project objectives were consistent with the Government’s transport strategy and the Bank’s FY 05-10
new Country Assistance Strategy (CAS); the Project was proposed together with the new CAS to the
Board. The CAS included within its objectives: (i) improving infrastructure service delivery to enhance
competitiveness and foster economic growth; (ii) increase private sector participation; and (iii)
accelerating the rationalization of public expenditure needed to sustain macroeconomic stability. This
was in line with the Government strategy for regional integration and trade, road network conservation
and the strengthening of road sector management, and enhancing the participation of the private sector,
as the Project sought to increase efficiency in the provision of transport services and the maintenance of
strategic transport infrastructure to enhance the competitiveness of Uruguay, particularly within
Mercosur.
1.1 Original Project Development Objectives (PDO and Key Indicators):
The Project’s development objective is to upgrade the country’s transport infrastructure to a condition
that facilitates the transportation of freight and passengers at a cost-efficient level of service. This will
be done by rehabilitating key transport links, removing existing bottlenecks, arresting any further

3
deterioration of infrastructure due to budgetary constraints, and improving infrastructure management
and safety.
Performance indicators used to assess the achievement of the Project’s PDO included: (i) percentage of
the road network below the optimal level of service according to surface type; (ii) percentage of road
network in bad condition according to Road Condition Index; and (iii) value of road assets maintained
equal or above the average level.
Intermediate results included: (i) Targeted national roads and bridges on international corridors have
adequate levels of service and are upgraded to Mercosur standards; (ii) Roads maintained through
CREMA contracts are maintained at an adequate level of service; (iii) The departmental road network is
maintained in a good condition; (iv) Safety is improved in targeted section of Uruguay’s road network;
and (v) The capacity of MTOP to identify, formulate and evaluate transport infrastructure projects is
strengthened. Each intermediate result included a set of indicator capturing progress.
1.2 Revised PDO (as approved by original approving authority) and Key Indicators, and
reasons/justification:
There was no revision to the Project’s Development Objectives or the Project’s Key Indicators.
1.3 Main Beneficiaries:
Multiple stakeholders were expected to benefit from the Project. Defined broadly, the country as a
whole was expected to see indirect benefits, given the Project’s positive impact on national
competitiveness, employment and economic growth. More specifically, road users and road transport
services would directly benefit from the improvement in key trade corridors, with decreased transport
costs and upgraded road safety. By improving the condition of departmental roads, the Project also
targeted rural communities within all of the 19 Departments in Uruguay, stemming from enhanced
accessibility to communities and markets. Through specific interventions in transfer terminals and
national ports managed by the MTOP, the Project also intended to have a positive impact on national
tourism, benefiting both local and international tourists. Finally, MTOP was expected to benefit directly
from the Project, building on institutional strengthening activities.
1.5 Original Components (as approved):
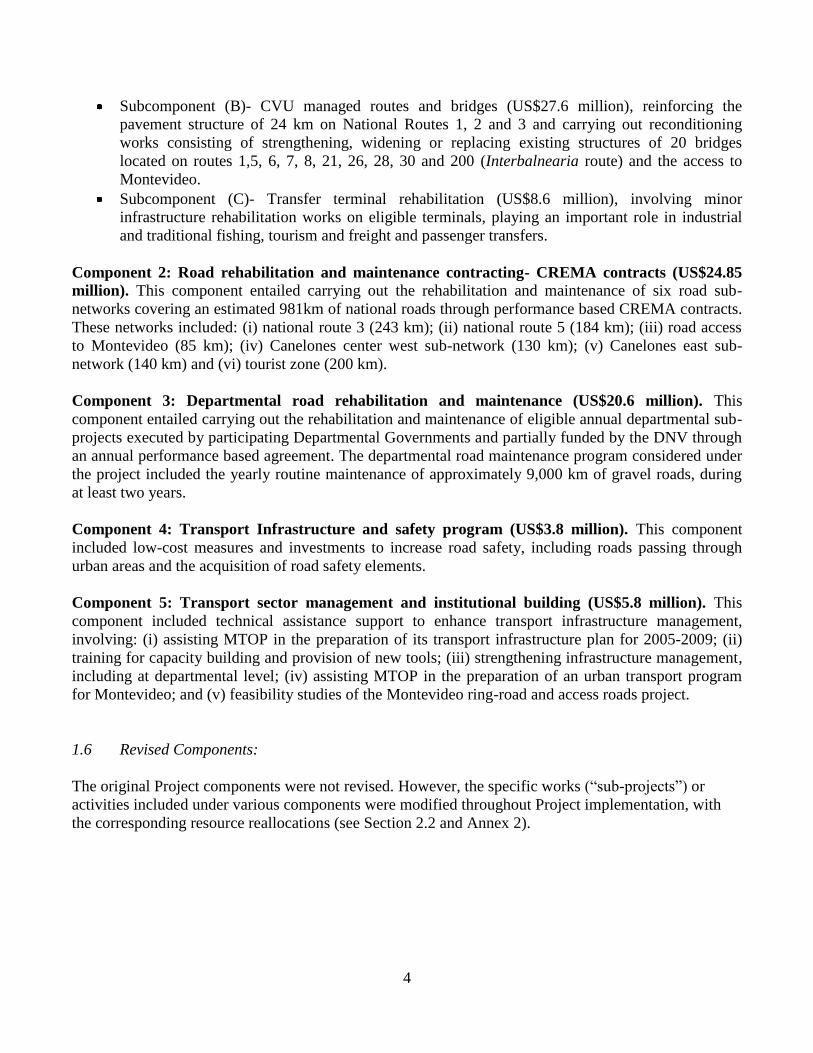
Component 1: Transport Infrastructure Rehabilitation (US$44.6 million). This component entailed
carrying out reinforcement, replacement, and rehabilitation works of strategic transport infrastructure,
including international Mercosur corridors, linking economic poles with export markets or providing
transfer terminals for key economic activities. This component was subdivided into three
subcomponents:
Subcomponent (A)- DNV managed routes (US$8.4 million), reinforcing the pavement structure
of about 35 km of roads on national route 3 and route 8.
4
Subcomponent (B)- CVU managed routes and bridges (US$27.6 million), reinforcing the
pavement structure of 24 km on National Routes 1, 2 and 3 and carrying out reconditioning
works consisting of strengthening, widening or replacing existing structures of 20 bridges
located on routes 1,5, 6, 7, 8, 21, 26, 28, 30 and 200 (Interbalnearia route) and the access to
Montevideo.
Subcomponent (C)- Transfer terminal rehabilitation (US$8.6 million), involving minor
infrastructure rehabilitation works on eligible terminals, playing an important role in industrial
and traditional fishing, tourism and freight and passenger transfers.
Component 2: Road rehabilitation and maintenance contracting- CREMA contracts (US$24.85
million). This component entailed carrying out the rehabilitation and maintenance of six road sub-
networks covering an estimated 981km of national roads through performance based CREMA contracts.
These networks included: (i) national route 3 (243 km); (ii) national route 5 (184 km); (iii) road access
to Montevideo (85 km); (iv) Canelones center west sub-network (130 km); (v) Canelones east sub-
network (140 km) and (vi) tourist zone (200 km).
Component 3: Departmental road rehabilitation and maintenance (US$20.6 million). This
component entailed carrying out the rehabilitation and maintenance of eligible annual departmental sub-
projects executed by participating Departmental Governments and partially funded by the DNV through
an annual performance based agreement. The departmental road maintenance program considered under
the project included the yearly routine maintenance of approximately 9,000 km of gravel roads, during
at least two years.
Component 4: Transport Infrastructure and safety program (US$3.8 million). This component
included low-cost measures and investments to increase road safety, including roads passing through
urban areas and the acquisition of road safety elements.
Component 5: Transport sector management and institutional building (US$5.8 million). This
component included technical assistance support to enhance transport infrastructure management,
involving: (i) assisting MTOP in the preparation of its transport infrastructure plan for 2005-2009; (ii)
training for capacity building and provision of new tools; (iii) strengthening infrastructure management,
including at departmental level; (iv) assisting MTOP in the preparation of an urban transport program
for Montevideo; and (v) feasibility studies of the Montevideo ring-road and access roads project.
1.6 Revised Components:
The original Project components were not revised. However, the specific works (“sub-projects”) or
activities included under various components were modified throughout Project implementation, with
the corresponding resource reallocations (see Section 2.2 and Annex 2).

5
1.7 Other significant changes (in design, scope and scale, implementation arrangements and
schedule, and funding allocations):
No other modifications were made to the original project concept and structure. Some changes to
funding allocations were made through the second Project Restructuring, described in Section 2.2.
2. Key Factors Affecting Implementation and Outcomes
2.1 Project Preparation, Design, and Quality at Entry (including whether lessons of earlier
operations were taken into account, risks and their mitigation identified, and adequacy of participatory
processes, as applicable):
Project design was generally sound and built directly on the Government’s transport priorities as well as
on the experience and lessons learnt under the First and Second Transport Projects, having both been
executed in a satisfactory manner. The longstanding partnership between the MTOP and the Bank
guaranteed a thorough knowledge of the transport sector in the country and a deep understanding of the
Government’s policies, which have revealed a strong sense of continuity in the past decade or so. This
explains why the overall structure of the Project, as well as its key components, reveal a sense of
continuity vis a vis the Second Transport Project. Although Project design was realistic and
straightforward, the short preparation period, with only 12 months elapsing between the identification
mission and Bank approval) probably limited a more innovative Project design, particularly under new
Project components such as the Departmental roads and the Road Safety components.
Project components and the activities undertaken under each of them were all perfectly aligned to the
broader development objective of upgrading the country’s transport infrastructure. Although, as
previously explained, some of the sub-projects originally envisaged under Project design were finally
replaced by other works during Project implementation, all of the works finally financed by the Project
were coherent in terms of contributing towards the achievement of the Project’s development outcome,
expressed in terms of quality of the transport network, irrespective of the specific works or contracts
being carried out. This is mainly because the MTOP conceives its program as a continuous effort,
irrespective of the source of the funds, therefore the broader program is not altered.
Project design was also well suited to the counterpart’s institutional capacity. The Project Coordination
Unit established within MTOP centralized the relationship with the Bank and had extended experience
in the execution of Bank-financed operations, including the Second Transport Project, with a
satisfactory performance in terms of overall Project management. All components were implemented by
the MTOP, through the DNV, DNT (Direcion Nacional de Transporte – Transport department) and
DNH (Direccion Nacional de Hidrografia – Waterways department), with the exception of Component
1 (B), which was implemented by CVU (Corporacion Vial del Uruguay, a public entity concessionaire
of the most-travelled primary highway network). Subsidiary agreements were signed by MTOP and
CVU.
Government commitment throughout Project preparation was sustained, despite changes in the
administration and ruling political party. The institutional continuity, both in terms of sector policies and

6
technical teams in place within the Ministry, was vital to effective Project preparation and effectiveness.
The political transition and change in the ruling political party had therefore no major effects or delays
on the Project cycle.
Overall, risks were adequately appraised, although many did not materialize, including: (i) lack of
institutional capacity (inability to retain qualified staff), with technical teams staying in place throughout
Project execution; (ii) insufficient leadership, ownership or change in priorities on the part of MTOP and
DNV, with continuity in terms of transport policy and general orientations within the Government,
despite political changes; and (iii) weaknesses at the Departmental level (turnover of local staff, lack of
ownership, etc.), which were not perceived, quite on the contrary, this proved to be one of the best
performing components, with additional resources being channeled to departmental road works under
the last Project restructuring. The risk that did materialize was that of implementation delays due to
insufficient or untimely release of counterpart funds, and delays in procurement processes, already
evidenced under previous Bank financed operations. Unidentified risks that did impact Project
implementation, particularly in the initial phases, following the 2002-2004 economic crisis, include
foreign exchange risk and cost escalations in the construction market, as described in the next section.
Finally, management of social and environmental issues has been satisfactory throughout the Project’s
lifespan with no significant issues arising in terms of safeguards.
2.2 Implementation (including any project changes/restructuring, mid-term review, Project at Risk
status, and actions taken, as applicable):
During the implementation stage, there were some critical factors that affected Project performance.
These are briefly described below:
Initial delays in Project implementation and heat up of the construction market. Cost estimates
established at the time of Project preparation turned out to be underestimated. This, added to a “drag
effect” of works programmed under the previous period following the economic crisis, translated into a
series of delays in the first stages of Project implementation, with very low disbursements in the first
two years. Following the 2002-2004 crisis, Uruguay saw high price variations for civil works. Strong
and sustained economic growth, added to the dollar devaluation, contributed to the evidenced price
escalation in the construction market. This had a direct impact on the Project, and on its capacity to
finance all the works envisaged at the design stage. This resource shortfall led to having to redefine the
scope of the Project and the amount of works that could actually be financed given the existing budget
allocations. Only after the first restructuring, approved by the Bank in 2007, which included
modifications to the original list of works, did execution really kick off. The restructuring prioritized
works that were ready to start execution and significantly reduced the overall number of works,
adjusting for price increases. However, despite this initial delay, after 2007 disbursements started
catching up, managing to finalize with a 97.4% disbursement rate as of November, 30 2011, deadline
date of a four-month grace period conceded to enable the completion of disbursements.
Montevideo ring-road construction decision. Montevideo East-West ring-road is a 22 km new road,
between Route 5 and Route 8, which aims at avoiding through traffic, in particular cargo trucks, through
Montevideo. The construction contract was awarded in 2007, during the Tabaré Vázquez administration,

7
and works were completed in October 2009; the total ring-road cost is around US$90 million, financed
through CVU. Although this Project was not financed by the Bank, it diverted resources away from
maintenance spending, hence contributing to increase the road maintenance backlog which this Project
intended to address.
Shortage of counterpart funds and lack of budget flexibility. During the last two years of Project
implementation, there were shortages in terms of counterpart financing, generating bottlenecks and
delays in the completion of the last programmed works. In particular, the shortages affected the CREMA
contracts and the rehabilitation of route 18. This was solved by transferring two contracts from DNV to
CVU (formalized under the February 2011 restructuring), given that CVU is not subject to fiscal space
issues, hence enabling counterpart funds to be provided through this alternate source and not
compromising the overall work program. The 5-year planning scheme followed by MTOP enables
sector programming in the medium term; however, overall fiscal shortages, if accumulated over the five
year term, tend to impact towards the end period.
Changes to the Bank’s standard bidding documents. In midst of project implementation, the Bank
reviewed the prevailing standard bidding documents for CREMA contracts. Given the nature of the
construction market (small market) in the country, the qualification criteria standards requirements
included in the Bank standard bidding documents implied that few firms were able to meet the
established requirements. Bidding documents were consequently adjusted lowering the standard
qualification requirements, so as to increase the number of qualified firms. Had this issue been identified
earlier during Project preparation, some implementation delays associated to this could have been
preempted.
Project restructurings. The Project underwent two restructuring processes and two reallocations of
loan proceeds. The first restructuring undertaken in March 2007, derived because: (i) most of the works
(“sub-projects”) listed in the PAD were not ready yet, in terms of technical preparation; (ii) a financing
gap showed up, due to the combined impact of substantially underestimated works cost estimates (as a
result of the heat-up of the construction market, as detailed above) and the US dollar depreciation.
Concretely, this restructuring altered the list of works (“sub-projects”) included under Component 1 (B)-
CVU managed routes and bridges-replacing some of the original works with works included under the
Forest Products Transport Project, given that this Project suffered a series of delays in implementation
due to severe fiscal space restrictions that constrained MTOP’s budget. New works under the Project
following the restructuring included road rehabilitations on Route 8 (segments A Piraraja-235km and
Rio Cebollati-A Piraraja) and Route 11 (segments San Jose-Villa Rodriguez and E. Paullier-J.Soler) and
the reinforcement of bridges on Route 3 (Arroyo Grande), Route 5 (Arroyo Banado Rocha and Arroyo
Curticieiras) and Route 11 (Arroyo Descarnado-Arroyo la Pedrera). The total allocation of funds for
Component 1 (B) was not altered, no other Project components were affected by the restructuring and
there were no changes to the Project’s PDO or result indicators. However, the restructuring did modify
the physical output indicators for Component 1 (increasing the number of kilometers being rehabilitated
from 143.6 to 210.8 and reducing the number of bridges being reinforced, widened or replaced from 20
to 8). This first restructuring really enabled activities to start.
In 2008, the Project underwent two reallocations of loan proceeds. In January 2008, US$3.5 million
were reallocated from the unallocated category to the Departmental roads category, whereas the October

8
reallocation transferred the balance of the unallocated category (US$4.38 million) to the CVU
subprojects category.
The second Project restructuring, approved in February 2011, involved the reallocation funds among
Project components, as reflected in the table below. This reallocation of funds was necessary to: (a)
formalize the transfer of road rehabilitation contracts from DNV to CVU; and (b) adjust amounts
allocated to what was actually achieved on the ground. This included: (i) cancelling 3 of the 6 CREMA
contracts originally included under the Project; (ii) cancelling all allocations under the road safety
component, given that these were finally financed by other sources; (iii) reducing the total allocation
under the technical assistance component, given that many activities originally envisaged were also
financed by other sources; and (iv) increasing the funds under the Departmental roads component, to
finance additional months of the rehabilitation and maintenance program, given the successful results of
this activity, with over 9,900 km of departmental roads per year being maintained since the Project
initiated.
Category of Expenditure Allocation % of Financing
Current Revised Current Revised
(1) Works
(a) under DNV (Dirección Nacional de
Vialidad) Subprojects 5,200,000 4,500,000 70% 70%
(b) under CVU (Corporación Vial del
Uruguay) Subprojects 21,375,500 35,800,000 70% 70%
(c) under DNH (Dirección Nacional de
Hidrovías) Subprojects 5,320,000 5,000,000 70% 70%
(d) under CREMA (Rehabilitation and
Maintenance Contract) Subprojects 15,230,000 5,000,000 70% 70%
(e) under Annual Departmental Road
Rehabilitation and Maintenance subprojects 16,264,500 18,840,000 70% 70%
(f) under Road Safety subprojects 1,500,000 0 70% 70%
(2) Goods under Road Safety subprojects 850,000 0 70% 70%
(3) Consultants’ services 3,910,000 510,000 70% 70%
2.3 Monitoring and Evaluation (M&E) Design, Implementation and Utilization:
The M&E system established under the Project was based on semi-annual reports prepared by the PCU
including: (i) a description of overall Project progress; (ii) data on disbursement performance over the
last 6 months and an updated disbursement calendar; (iii) an updated procurement plan; (iv) a
description of progress in implementation of social and environmental safeguards; (v) a description of
potential developments that could affect implementation; and (vi) measurement of Project performance
against the impact indicators included within the Results Framework.
Impact indicators included in the Project’s Result Framework, particularly those linked to investment
components, are indicators measured routinely by DNV (mostly performance indicators using the

9
Highway Development and Management model -HDM). Additional indicators were included under the
result framework to evaluate results of the road safety and technical assistance components, although
most of the activities envisaged under these two components were finally financed by other sources.
Given the nature of the established framework, implementation by the Monitoring and Evaluation unit
within the MTOP has been fully successful. Semi-annual reports have been regularly submitted to the
Bank in a satisfactorily manner. In general, there have been no difficulties in terms of measuring result
indicators (lack of data, problems in the definitions of indicators, etc.) for most of them are tested
periodically by the Ministry. However, some of the outcome indicators selected were probably too broad
in order to actually reflect Project results. These indicators show the evolution of the road sector in
general, which cannot realistically be impacted by a US$70 million operation. Limiting the scope of
these indicators to road sub-networks being financed by the Project could have probably been more
indicative of actual results attained under the operation.
2.4 Safeguard and Fiduciary Compliance (focusing on issues and their resolution, as applicable):
Safeguards: Project preparation with regard to the safeguards aspects was carried out in accordance with
World Bank Operational Guidelines, reflected in Chapter 8 of the Project’s Operational Manual. As part
of the environmental and social assessment of road projects, DNV applied the Guidelines for
Environmental and Social Safeguard Issues in Road Projects, developed by the Bank’s QAT team. In
turn, regarding transfer terminal restoration projects, DNH applied the guidelines developed by ANP
with support of the Bank under the Forest Products Transport Project, denominated Environmental
Manual for Port Projects and Activities. Institutionally, evaluations undertaken during preparation
indentified a series of actions that would have to be undertaken to strengthen DNV’s Environmental
Unit, including the updating of its Environmental Manual, and create an environmental unit within
DNH. Under the previous Project and in the early stages of implementation of this operation, the
Ministry did not have a formal Environmental Unit, so road engineers conformed an informal
environmental unit, which worked relatively well in practice. However, the Tabaré Vázquez
administration, upon entry created an Environmental Unit within MTOP, helping to further consolidate
the environmental agenda and the compliance of environmental safeguards. In 2003, the Environmental
Manual for road works was passed as a national Decree and the updated version of 2006 reformulated as
environmental technical specifications.
At appraisal, the Project was accorded Category B given that rehabilitation and maintenance works were
foreseen on existing roads and transfer terminals and no significant negative impacts were expected.
During implementation, this was confirmed, with no major impacts or safeguard compliance issues
arising.
In terms of social safeguards, during the lifetime of the Project the MTOP developed its first Operational
Manual on Resettlements as well as a Framework to deal with issues of expropriations and
resettlements. No major issues arose in dealing with the specific cases requiring resettlement. In the case
of the widening of Route 1, in 2008 all of the affected properties had been formally conceded to the
State, with the exception of one property due to titling problems.

10
Financial Management: Financial management of the project was carried out in accordance with the
arrangements agreed upon in the legal agreement and operational manual. Also, the project had an
acceptable financial system in place at the start-up due to the continuity of the PCU and its previous
experience with Bank financed operations. In general, it can be said that the financial management
arrangements of the project were found to be satisfactory during project implementation. Annual
Audited Financial Statements have been submitted to the Bank in timely manner throughout the project
life, and no major issues have been identified. Consistently, ISR ratings have been deemed as
“satisfactory” during project implementation.
Procurement: Given the experience and institutional capacity within the PCU, in general terms,
procurement of goods, works, and services under the project was carried out satisfactorily in accordance
with Bank Procurement Policies. A review conducted in June 2007 assessed procurement as moderately
satisfactory and made a series of recommendations to the counterpart moving forward, including the
need to improve the existing information system. Procurement processes in the MTOP tend to be
lengthy, with extended periods elapsing between the opening of a bidding process and the signing of
contracts in the case of works. Recommendations made in different review instances to revert some of
the weaknesses encountered in terms of procurement processes are being introduced at the PCU level,
with positive results.
2.5 Post-completion Operation/Next Phase (including transition arrangement to post-completion
operation of investments financed by present operation, Operation & Maintenance arrangements,
sustaining reforms and institutional capacity, and next phase/follow-up operation, if applicable):
A new transport project is currently being prepared with the MTOP, providing continuity to the long-
standing partnership of the GoU and the Bank in the transport sector, and further supporting the policies
that have been undertaken over the past decade or so, in a considerably persistent manner.
Focusing on road maintenance and logistics, the new proposed operation builds on the lessons learnt in
past operations as well as on the overall satisfactory performance of the sector and the Borrower. A
particular attention would be paid to the new Project result framework, in a consistent approach with the
5-year budget law that sets targets for each of its programs; likewise, the new operation would factor
into its design the programmatic approach adopted by the Government, enhancing collaboration and
further dialogue with other stakeholders and financiers. Finally, Project design would put the emphasis
on measures to ensure further outcome sustainability when it comes to road maintenance, trying to
“ring-fence” Project investments from potential risks of under financing within the sector; institutional
strengthening activities and technical dialogue on the sector will be key drivers of the new Project.

11
3. Assessment of Outcomes
3.1 Relevance of Objectives, Design and Implementation (to current country and global priorities,
and Bank assistance strategy):
The project objectives remain highly relevant to current country priorities, also in line with the recently-
approved Uruguay – Bank Country Partnership Strategy. The project’s development objective, as stated
in the Project Appraisal Document (PAD), reads: “basic transport infrastructure is maintained in a
condition that facilitates the movement of freight and passengers at a cost-efficient level of service, by
arresting any further deterioration due to fiscal restriction, and ensuring the preservation of existing
infrastructure assets in the long term.” This objective was responsive to the Borrower’s broader sector
strategy which prioritizes rehabilitating and upgrading internationally vital sections of the road network,
arresting the overall deterioration of the road network, expanding the role of the private sector in road
maintenance and strengthening road sector management. Additionally; it was consistent with the Bank’s
Country Assistance Strategies for Uruguay (2000-2005 and 2005-2010), which emphasized enhanced
competitiveness, increased private sector participation, rationalization of public expenditure and
sustainable economic development. By reducing transportation costs, removing infrastructure
bottlenecks to improve regional integration and trade, modernizing MTOP and promoting participation
of the private sector in road maintenance, Project objectives were directly aligned to country, sector and
Bank priorities.
The objectives remain relevant today because Uruguay still conceives road maintenance as a key sector
priority. In particular, the current 5-year budget law introduces some predictability in funding allocated
for road maintenance. Moreover, over the past decade or so, Uruguay has been increasingly
consolidating its overall objective of becoming a regional logistics hub, mainly due to the efficiency and
reliability of its transport infrastructure.
Project design responded to the established objectives as well as to MTOP/DNV’s administrative and
fiduciary capacity. Project structure built upon the Second Transport Project, given the continuity in the
broader Project objectives. However, by detailing the list of works and activities to be undertaken by
component, Project design limited flexibility during implementation, requiring two Project
restructurings during the Project’s life cycle. Therefore, Project design is rated as moderately
satisfactory. However, Project design shortcomings were adequately resolved during implementation
and, despite changes in terms of the specific activities undertaken under the Project, overall objectives
were met and the Project was satisfactorily executed.
3.2 Achievement of Project Development Objectives (including brief discussion of causal linkages
between outputs and outcomes, with details on outputs in Annex 2):
As set out in the PAD, three indicators appraise the achievement of Project Development Objectives: (i)
the Uruguay national road network pavement condition, measured by the International Roughness Index
(“Cost Efficiency” indicator); (ii) the national road network pavement condition, measured by road
condition index (“Arresting further deterioration” indicator); and (iii) the value of the Uruguay’s road
network asset. This outcome indicators framework suffers from two weaknesses.

12
First and foremost, the scope of the indicators is way beyond what a US$70 million financing could
achieve. This financing was able to support the rehabilitation (130 km) and maintenance (430km) of
only a fraction of the approx. 8,700 km of the Uruguay’s national road network; this portion is too small
to drive global impacts at network level. The road quality at network level depends much more on
exogenous factors, in particular the total amount of financing available for the road and rehabilitation
sub-sector.
Second, the target values set for these indicators were too optimistic; such outcomes might have been
reached on sub-networks on which the loan focused on, but were too demanding, considering Uruguay’s
national network as a whole. For instance, the target set for “Cost efficiency” is very high, by any LAC
standards: having achieved only 22% (compared to a target of 11%) of the flexible pavement network
below the optimal level of service may be considered a very good level of service, from a regional
comparative perspective.
Based on the above, it is assessed that this monitoring and evaluation framework, at outcome level, is
not adequate to measure the results of the Project, in the sense that the project could not influence
significantly the indicators, set at network level. The three proposed outcome indicators are useful to
monitor the evolution of Uruguay’s national road network condition, showing in a convergent fashion
that the road network deterioration has been slowed (if not stopped), but these indicators fail to capture
the influence of the project itself onto the overall network condition.
Regarding detailed results of the three PDO indicators:
(1) Cost Efficiency: this indicator measures the pavement condition, on Uruguay’s national road
network (8,700km) through the International Roughness Index (IRI). This indicator includes two
sub-indicators focusing: (i) on the flexible pavement network, which covers approx. 85% of the
national network and includes asphalt concrete and surface treatment pavements; and (ii) on the
total national road network, of which about 10% are gravel roads. Although none of the two sub-
indicators reaches its target, both indicators have been stabilized during the project
implementation period. This situation is attributable mainly to the lack of rehabilitation works
being undertaken in the secondary road network due to budgetary restrictions. This, added to
overloads and sustained truck traffic increase, has had a strong impact on the deterioration of the
secondary road network, affecting the overall rating of the national road network.
(2) Arresting further deterioration: this indicator measures the pavement condition, on Uruguay’s
national road network (8,700km) through the Road condition index (IES); IES is a composite
Baseline 2006 2007 2008 2009 2010 2011
Percentage
of road
network
below the
optimal
level of
service,
determined
by IRI
16% for
the flexible
pavement
network
Target 9% 11%
Actual 16.88% 23.14% 22.53% 22.53% 22.54%
20% for
the total
network
Target 13% 15%
Actual 21.21% 26.56% 26.31% 26.17% 31.06%
Indicators NOT MET

13
index capturing pavement transversal and longitudinal deformation, cracks and raveling. IES and
IRI are correlated, as pavement degradation captured by IES usually translates, with some time
lag, into increasing IRI. Uruguay’s road network IES and IRI have indeed the same evolution
pattern, showing stabilization in pavement condition. Compared to the 2006 actual value and the
following evolution, some questions arise regarding the accuracy of the 29.5% baseline.
(3) Preserving the value of road assets: this indicator measures the value of road infrastructure
patrimony. ECLAC’s methodology recommends that road asset value be slightly above the
“median value”, median point between the established “maximum value” (if the entire network
were in good condition) and the “minimum value” (if the entire network were in bad condition).
This optimum road infrastructure asset value would correspond to the minimum sum of road
infrastructure maintenance and road users’ costs. Although the value attained for 2010 is beyond
the set target of 1% above the median value, this indicator has been slightly oscillating around
the median, meaning that, the value of the patrimony is in general maintained and that this is
within the order of magnitude recommended by ECLAC.
1 ECLAC’s methodology for measuring the value of road patrimony establishes a “median value” between the established
“maximum value” (if the entire network were in good condition) and the “minimum value” (if the entire network were in bad
condition.)
Baseline 2006 2007 2008 2009 2010 2011
Percentage
of the road
network in
bad
condition as
determined
by the Road
Condition
Index
29.50% Target 25% 23%
Actual 21.42% 22.74% 18.66% 18.68% 22.27%
Indicator MET
Baseline 2006 2007 2008 2009 2010 2011
Value of road
asset is
maintained
equal or
above the
median of the
theoretical
maximum
and minimum
admissible
values, as
defined by
ECLAC’s
methodology1
Target Value of
road assets
reaches
median
level
Value of
road assets
is at least
1% above
the median
level
2004:
US$2148
million
Actual US$2192
million
US$2184
million
US$2205
million
US$2238
million
US$2224
million
0.65%
below
median
value
Actual 0.44%
above
0.20%
below
0.12%
below
0.22%
above
0.45%
below
Indicator PARTIALLY MET

14
Intermediate Result Indicators by Component:
As the outcome M&E framework is not deemed relevant to assess the performance of the project, in
terms of achievement of the project Development Objectives, most of the evaluation is therefore based
on the intermediate result indicators; these indicators are much more directly linked to the Project
results. The M&E framework included 13 intermediate result indicators, focusing on each one of the
project component: (i) national roads and bridges works; (ii) CREMA contracts; (iii) departmental roads
maintenance; (iv) road safety and (v) institutional strengthening.
On Component 1 (national roads and bridges works), the pavement condition target on international
corridors has been met; this is a key indicator for the project performance appraisal, as international
corridors are critical to Uruguay’s transport and logistics agenda. However, the other two indicators,
both capturing the retrofitting of bridges to MERCOSUR standards, have not been met. Just one bridge
is missing on Route 8; had this bridge been adapted, both indicators would have been met.
For Component 2 (CREMA contracts), the indicator measures the infrastructure level of service, as
defined in each one of the performance-based contracts. The indicator is partially met as some contracts
reached the expected level of service, while other failed to do so.
Three indicators cover Component 3 (departmental road maintenance). Two of these indicators are met
(19 departments implemented fully the program, approx. 9,000 km of departmental roads have been
maintained yearly), while the third indicator is considered substantially met: depending on departmental
sub-networks, between 6% and 13% are in poor condition (compared to the 10% target).
On road safety (Component 4), the indicator was met; in particular, the number of fatalities on selected
international corridors is significantly below the established target.
Five sub-indicators cover the institutional strengthening activities (Component 5), mostly focusing and
transport planning, road infrastructure management and DNV financial management systems. Even
though some activities were financed by other sources than the loan, they were completed, as evidenced
by 4 sub-indicators being met. The only sub-indicator not being fully met is the elaboration of a master-
plan for each one of Uruguay’s public ports; significant progress has been made though, since a master
plan has been adopted for the port of Montevideo – Uruguay’s most important port – and the national
port strategy has been issued.
As a result, out of the 13 intermediate result indicators, 8 were fully met, 2 substantially met, 1 partially
met and 2 not met. As far as the last two indicators are concerned, the results actually conceal the fact
that real progress has been made, with no less than 5 bridges having been adapted to MERCOSUR
standards. Further details are provided below, component by component.
Component 1:
The detailed status of works (roads and bridges) under Component 1 (A and B) is synthesized in Annex
2. In general terms, most of the works originally included under this component were modified under the
first and second restructurings. However, as mentioned previously, this had a limited impact in terms of
the selected indicators.
15
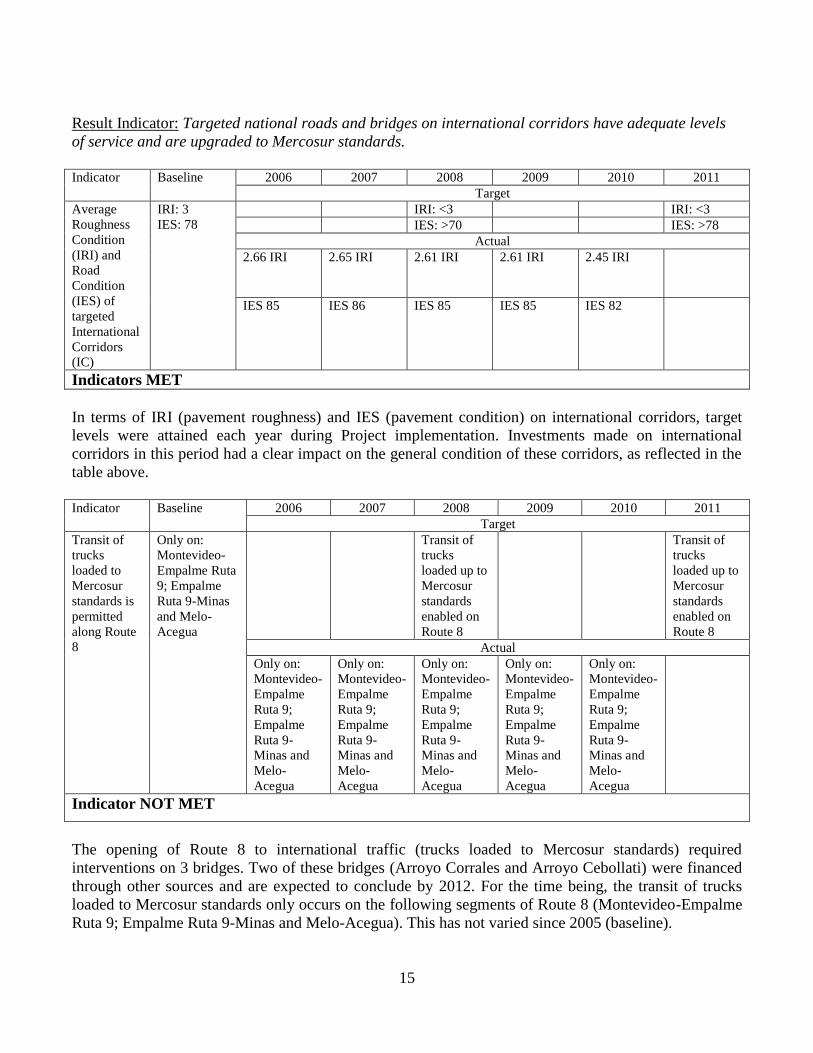
Result Indicator: Targeted national roads and bridges on international corridors have adequate levels
of service and are upgraded to Mercosur standards.
Indicator Baseline 2006 2007 2008 2009 2010 2011
Target
Average
Roughness
Condition
(IRI) and
Road
Condition
(IES) of
targeted
International
Corridors
(IC)
IRI: 3
IES: 78
IRI: <3 IRI: <3
IES: >70 IES: >78
Actual
2.66 IRI 2.65 IRI 2.61 IRI 2.61 IRI 2.45 IRI
IES 85 IES 86 IES 85 IES 85 IES 82
Indicators MET
In terms of IRI (pavement roughness) and IES (pavement condition) on international corridors, target
levels were attained each year during Project implementation. Investments made on international
corridors in this period had a clear impact on the general condition of these corridors, as reflected in the
table above.
Indicator Baseline 2006 2007 2008 2009 2010 2011
Target
Transit of
trucks
loaded to
Mercosur
standards is
permitted
along Route
8
Only on:
Montevideo-
Empalme Ruta
9; Empalme
Ruta 9-Minas
and Melo-
Acegua
Transit of
trucks
loaded up to
Mercosur
standards
enabled on
Route 8
Transit of
trucks
loaded up to
Mercosur
standards
enabled on
Route 8
Actual
Only on:
Montevideo-
Empalme
Ruta 9;
Empalme
Ruta 9-
Minas and
Melo-
Acegua
Only on:
Montevideo-
Empalme
Ruta 9;
Empalme
Ruta 9-
Minas and
Melo-
Acegua
Only on:
Montevideo-
Empalme
Ruta 9;
Empalme
Ruta 9-
Minas and
Melo-
Acegua
Only on:
Montevideo-
Empalme
Ruta 9;
Empalme
Ruta 9-
Minas and
Melo-
Acegua
Only on:
Montevideo-
Empalme
Ruta 9;
Empalme
Ruta 9-
Minas and
Melo-
Acegua
Indicator NOT MET
The opening of Route 8 to international traffic (trucks loaded to Mercosur standards) required
interventions on 3 bridges. Two of these bridges (Arroyo Corrales and Arroyo Cebollati) were financed
through other sources and are expected to conclude by 2012. For the time being, the transit of trucks
loaded to Mercosur standards only occurs on the following segments of Route 8 (Montevideo-Empalme
Ruta 9; Empalme Ruta 9-Minas and Melo-Acegua). This has not varied since 2005 (baseline).

16
Indicator Baseline 2006 2007 2008 2009 2010 2011
Target
Km. of
national
roads
compliant
with
Mercosur
standards
1287 km. 1400 km.
Actual
1287 km. 1287 km. 1287 km. 1287 km. 1287 km. 1287 km.
Indicator NOT MET
Likewise, the number of kilometers of national roads compliant with Mercosur standards has also
remained constant since 2005 at 1287km when the expected target at Project closure was 1400km.
Regarding progress on Component 1 (C), Transfer Terminal Rehabilitation, the status is as follows: (i)
Port of Punta del Este (Marinas 1 and 2 and Ecollera): the contract was rescinded due to prolonged
delays on behalf of the construction firm (Santa Maria). The contract was signed in December 2007,
with works starting in April and June 2008, respectively. However, in November 2010 the contract was
finally rescinded, in mutual agreement with the construction firm, having attained a 25% and 35% level
of progress, respectively. The works are to be carried out with DNH funds; (ii) Carmelo-Escollera
Arroyo de las Vacas: works started in April 2008; (iv) Piriapolis (dock repair): the bidding process was
canceled; and (v) Colonia-Muelle Santa Rita: was excluded from the Project under the Second
Restructuring.
Component 2:
The status of contracts under this component is synthesized in Annex 2. Few of the contracts included
within the PAD were actually undertaken under the Project. However, many of the envisaged works
were carried out through other sources of financing, with overall positive results.
Result Indicator:
Indicator Baseline 2006 2007 2008 2009 2010 2011
Roads
maintaine
d through
CREMA
contracts
are
preserved
at an
adequate
level of
service.
Target Level of
service
required as
determined by
each
contract=95%
Level of
service
required as
determined
by each
contract=95
%
Actual
CVU
848 km
(77%)=>95
%
252 km
(23%)=>93
%
899.3 km
(55%)=>95%
219.3 km
(13.4%)=<90
%
514.4 km
(31.5%) no
contract
803.71 km
(49.2%)=>95
%
315. 8 km
(19.3%)=<90
%
514.4 km
(31.5%) no
487.6 km
(30%)=>95
%
1132.6 km
(70%)=<90
%
394 km
(24%)=<90
%
1227 km
(76%)=>95
%

17
contract
Actual
Access to
Montevide
o
45.5 km=
<90%
45.5 km=
<90%
45.5 km=
<95%
Actual
Route 3
173.3 km=
<90%
173.3 km=
<90%
Indicator PARTIALLY MET
The level of service of contracts undertaken is, in general, within the established targets. In the case of
the Access to Montevideo contract, actually financed through the operation, the level of service is now
above the established target. The level of service on Route 3 however is below the established target at
90%.
Component 3:
Results under this component have been satisfactory, with Convenios for 2006 and 2007, accounting for
8.953 km. and 9.803 km. respectively, having been completed in the 19 participating Departments.
Convenios for 2008, 2009 and 2010 were financed with local funds with positive results. Finally, the
Convenio for 2011 is being partially financed by Project funds, through new allocations of funds under
the Project’s Second Restructuring.
Result indicator: The departmental road network is maintained in a good condition.
Indicator Baseline 2006 2007 2008 2009 2010 2011
Percentage
of the
Departmental
Road
Network in
bad
condition
Target 10% 10% 10% 10% 10% 10%
Good (s1): 50%
Good (s2): 50%
Actual Good (s1):
60%
Good (s2):
58%
Fair (s1): 25%
Fair (s2): 25%
Actual
Fair (s1):
26%
Fair (s2):
35%
Bad (s1): 15%
Bad (s2): 15%
Actual Bad (s1):
13%
Bad (s2):
6%
Indicator SUBSTANTIALLY MET
According to the method used to evaluate the condition of the departmental network (SEVR-Sistema de
Evaluacion por Velocidad de Recorrido), on a sample evaluated in 2010, 29% of departmental roads
were in good conditions, 64% in acceptable conditions and 8% in bad conditions.
Indicator Baseline 2006 2007 2008 2009 2010 2011

18
Target
Number of
Departments
that execute
the
Departmental
Program
completely
15 19 19 19 19 19 19
Actual
16 14 16 16 19 19
Indicator MET
Indicator Baseline 2006 2007 2008 2009 2010 2011
Target
Kilometers
of
Departmental
Roads
maintained
8700 km. 9000 km. 9000 km. 9000 km. 9000 km. 9000 km. 9000 km.
Actual
8953 km. 9803 km. 9182 km. 9875 km. 9875 km.
Indicator MET
Component 4:
Most of this component activities, focusing on road safety, have been financed either by local funds or
IDB financing as evidenced in Annex 2.
Result indicators: Safety is improved in targeted sections of Uruguay’s road network.
Indicator Baseline 2006 2007 2008 2009 2010 2011
Road
accident
index in
targeted
sections of
the national
routes
Target Number of
accidents: 66
Number
of
accidents:
88
Actual Number
of
accidents:
103
Number of
accidents: 36
Number
of
accidents:
39
Number
of
accidents:
53
Number
of
accidents:
53
IACC:
406.5
Actual
IACC:
474.8
IACC: 182.4 IACC:
65.7
IACC:
81.3
IACC:
76.5
Indicator MET
Despite activities being financed through other sources, monitoring on a sample of roads on routes 101,
102, 5 and 6 was carried out, demonstrating a substantial reduction in the number of road accidents,
exceeding the target set under the Project’s result framework.
Component 5:

19
This institutional strengthening component has been successful, with many of the expected outcomes
achieved, although most activities have been financed by other resources than the loan proceeds: (i) the
Urban Transport Master Plan for Montevideo was financed by the IDB; (ii) the ring-road study was also
financed by Spanish bilateral financing; (iii) planned DNV studies, including the study for the
implementation of the 5 year plan and the updating of HDM IV, were also financed through local funds;
(iv) Port Master Plans; these were carried out directly by the DNH, as an overall strategy for the sub-
sector and submitted to the Bank, including proposed studies for the Atlántida Port, financed through the
Project and currently underway (the contract was signed in March 2011). The Forestry Demand Study,
not originally included in the PAD, was concluded and submitted to the Bank in February 2007.
Result indicator: The capacity of the MTOP to identify, formulate and evaluate transport infrastructure
projects is strengthened.
Indicator Baseline 2006 2007 2008 2009 2010 2011
Target
The DNV
manages the
road network
under its
jurisdiction
according to
the
Infrastructure
Plan 2005-
2009
Plan has not
been prepared
yet.
Plan
completed
Actual
Plan
developed
and
approved
Plan in
execution
Plan in
execution
Plan in
execution
Plan in
execution.
Plan in
execution.
Drag-on
from 2005-
2010 Plan
Indicator MET
Indicator Baseline 2006 2007 2008 2009 2010 2011
Target
Updated
strategic
planning tool
(HDM-IV)
fully
operational
for analysis
at network
level
Currently,
HDM-III is
utilized at
project level
First
network
plan
completed
Actual
HDM-IV at
project
level; HDM-
III at
network
level
HDM-IV is
being tested
for work
plan 2010-
2014 at
network
level
HDM-IV is
used for the
work plan
2010-2014
at network
level
HDM-IV is
used for the
work plan
2010-2014
at network
level
HDM-IV is
used for the
work plan
2010-2014
at network
level
HDM-IV is
used for the
work plan
2010-2014
at network
level
Indicator MET

20
Indicator Baseline 2006 2007 2008 2009 2010 2011
Target
Updated
financial
management
system for
PCU
SIIF Updated
financial
management
system
including
hardware
and software
Actual
Current
system
Updated Updated Updated Updated Updated
Indicator MET
Indicator Baseline 2006 2007 2008 2009 2010 2011
Target
The
Government
has the
necessary
tools to
evaluate and
prepare an
Urban
Public
Transport
Program for
Montevideo
The Program
has not been
prepared
Studies
completed
Actual
Commission
has been
established.
Program in
preparation.
Commission
is
implemented.
Studies
completed.
Studies
completed.
Studies
completed.
Studies
completed.
Studies
completed.
Indicator MET
Indicator Baseline 2006 2007 2008 2009 2010 2011
Target
Master Plans
for Regional
Public Ports
are launched
Only the Port
of Montevideo
has a Master
Plan
Plans are
launched
Actual
Only the
Port of
Montevideo
has a Master
Plan
Only the
Port of
Montevideo
has a Master
Plan
DNH
Strategy
presented
DNH
Strategy
presented
DNH
Strategy
presented
DNH
Strategy
presented
Indicator SUBSTANTIALLY MET
These results prove that despite many of the technical assistance activities being finally financed through
other sources, results have been positive and progress has been made in terms of institutional
strengthening of DNV, particularly in the areas of Project programming and acquisition of planning
tools, namely, HDM-IV, with the 2010-2014 work plan being based on the use of this model at network
level. This situation shows also the strong coordination between MTOP and other financiers.

21
3.3 Efficiency (Net Present Value/Economic Rate of Return, cost effectiveness, e.g., unit rate norms,
least cost, and comparisons; and Financial Rate of Return):
At appraisal, only the projects corresponding to the first year of the program were evaluated. Road
rehabilitation projects included under Component 1 yielded a Net Present Value, at 12% discount rate,
of US$3.6 million and an ERR of 19.1%. Bridge restoration projects also included under Component 1
yielded a NPV, at 12% discount rate, of US$2.8 million and an ERR of 62.3%. Only one CREMA
contract (Tourist Zone) was evaluated, yielding an NPV of US$4.94 million and an ERR of 34.5%.
Regarding the Departmental Road Maintenance Program, the NPV for the selected maintenance strategy
over a 15-year period yielded US$102.1 million. Overall, the total NPV for projects analyzed under this
sample amounted to US$116.9 million.
Road traffics have substantially increased between 2005 and 2011, not only on the main radial road
network but also on transversal corridors. Truck traffic has increased proportionally faster than light
vehicle traffic, with subsequent impact on pavement deterioration. Between 2005 and 2011, depending
on routes, it is estimated that Average Annual Daily Traffics (AADT) has increased by 30 to 50%.
The ex-post economic evaluation was performed on a sample of three works, considered representative
of the universe of works undertaken under the Project, given volumes of traffic and the nature of
investments. These works constitute approximately one third of the loan amount. No further analysis
could be carried out of the Project as a whole because of data unavailability for the road sections that
were not originally included in the project scope. The three selected sub-projects, for which ex-post
economic appraisals were specifically carried out, are deemed representative of the investments financed
by the Project on Uruguay national road network, because of similar technical solutions (and, therefore,
investment costs) and road traffic ranges.
The Route 18 road rehabilitation yielded an ex-post IRR of 13.1% and a NPV, discounted at 12%, of
US$0.3 million, for an investment of US$13.3 million. Rehabilitation works on two segments of Route 8
yielded an IRR of 20.1% and a NPV, discounted at 12%, of about US$2.0 million, requiring an
investment of US$ 9.2 million. The bridge reinforcement sub-project, on Route 8 Arroyo Grande,
yielded an IRR of 46.5% and a NPV, discounted at 12%, of US$4.2 million, for an investment of
US$1.9 million.
Traffic data on the departmental road network was not available, during the ICR preparation, to carry
out the ex-post economic evaluation of the departmental road maintenance subcomponent. However,
based on the Project completion report provided by the Borrower, only 8% of the network are in bad
condition, while respectively 29% and 63% of the network are in good and regular conditions. It is
assessed that the departmental road maintenance component has improved accessibility for communities
and agro-industry production output.
Overall, bridge reconditioning IRR turned out to be 46.5%, to be compared to the 62.3% estimated in
the PAD, and road rehabilitation IRR averaged 16.6%, to be compared to the 19.1% estimated in the
PAD. Economic benefits were significant, though slightly below those estimated in the PAD.

22
3.4 Justification of Overall Outcome Rating (combining relevance, achievement of PDOs, and
efficiency):
Rating: Moderately Satisfactory
As detailed above, the PDO outcome indicators per se cannot be used to assess the overall outcome
rating of the Project: they are too broad in their definition, far beyond the scope of what the Project
could achieve with a US$70 million financing. Furthermore, the targets set at appraisal for the indicators
were certainly too optimistic, as highlighted when comparing outcome indicators targets with other road
networks in the southern cone. Project outcome appraisal must therefore be based on other elements, as
detailed below.
First, project objectives and project content are deemed relevant to the country’s priorities, aiming at
placing Uruguay as a logistic hub in the medium term, as well as with the recently-approved Country
Partnership Strategy. Road maintenance is still high on GoU’s agenda, sustaining the efforts undertaken
over the last years.
Second, eleven out of thirteen project intermediate result indicators were either met or substantially met.
This is a good score, for activities directly linked to the project financing. In particular, a key
intermediate result indicator, directly related to the project’s infrastructure component, is the significant
improvement of pavement condition of International Corridors, critical to trade, transport and logistics
services. The project did deliver, with: (i) 5 bridges on MERCOSUR corridors upgraded; (ii) approx.
130 km of national highway rehabilitated to facilitate transportation; (iii) more than 430 km of paved
national roads maintained with cost-efficient performance-based contracts (CREMA); (iv) several
campaigns of maintenance of the 9,000 km of rural accesses, key for the agro-industry production as
well as for the communities; and (v) critical institutional strengthening activities, focusing on transport
planning and road management, having been completed.
Finally, the economic appraisal carried out on selected, but representative, investment sub-projects show
that the Project socio-economic rate of return remains robust, yielding significant benefits for the Project
beneficiaries as a whole. The project reached its objectives in an efficient manner.
As the outcome indicators cannot be used to assess whether the project reached its objectives, the global
assessment of outcomes is based on the adequacy of the project’s objectives to Uruguay’s priorities, on
the performance of the intermediate result indicators and on the economic appraisal. All three aspects
appear positive; still, as some intermediate result indicators were not achieved and, more importantly,
since the outcome framework could not be used to assess Project outcomes, a Moderately Satisfactory
rating is proposed.
3.5 Overarching Themes, Other Outcomes and Impacts (if any, where not previously covered or to
amplify discussion above):
(a) Poverty Impacts, Gender Aspects, and Social Development
The project is expected to have had an indirect positive impact on poverty and social development:
improving transport conditions would, on the one hand, fuel the economy, entailing job creation and
access to markets and, on the other hand, better connecting communities, fostering access to social

23
facilities and reinforcing social nets. Poverty impact and social development were more a consequence
of the project success and have not been specifically assessed. The Project did not specifically address
gender issues.
(b) Institutional Change/Strengthening (particularly with reference to impacts on longer-term
capacity and institutional development):
Beyond the above-mentioned activities, embedded in the Components, the Project has been a useful
vehicle to carry out a rich technical and institutional dialogue with the MTOP. In 2010, this dialogue
materialized in particular through two Economic and Sector Works respectively focusing on logistics
and the railroad sector reform. While the Uruguay. Trade and Logistics: An Opportunity; report
provided an in-depth analysis of logistics in Uruguay, the Policy Options for Improving the Efficiency of
Uruguay’s Railway Sector report discussed some alternatives for Uruguay to move forward on the rail
reform agenda.
In terms of the Project’s technical assistance component, despite most activities being finally financed
through other sources, as mentioned previously, these activities have had an impact in terms of the
overall institutional strengthening of DNV, particularly in the areas of Project programming and
acquisition of planning tools,
(c) Other Unintended Outcomes and Impacts (positive and negative):
No unintended outcome and impact has materialized.
3.6 Summary of Findings of Beneficiary Survey and/or Stakeholder Workshops (optional for Core
ICR, required for ILI, details in annexes):
No beneficiary survey and / or stakeholder workshop was held.
4. Assessment of Risk to Development Outcome
Rating: Moderate.
The level of risk to development outcomes is rated as moderate, on the basis of a few factors that could
potentially impact the sustainability of results, moving forward. While the still insufficient financing of
the road maintenance sector jeopardizes the quality of the road network, the policy framework is strong
and, aware of the financing issue, the GoU has initiated proactive measures to address the issue.
The main issue is that the financing of the sector continues to raise doubts in terms of its capacity to live
up to the current and future needs of the road network, in terms of rehabilitation and maintenance.
Budget increases to the road sector, since 2005, have made it possible to partially catch up with the road
maintenance backlog stemming from the 2002-2004 crisis; while the indicators trends show that
network deterioration has been slowed, 2010 indicators values reveal some deterioration of the network.
Further, ageing pavements are likely to require increased maintenance in the upcoming years; given
budget spending limits, there is therefore a risk that the road maintenance subsector is insufficiently
funded to deal adequately with road maintenance and rehabilitation needs.

24
However, the policy framework remains strong and transport infrastructure maintenance remains a
priority at Government level, with little risk of policy reversal. Aware of the challenge, the GoU is
taking proactive measures to address the financing issue, including: (i) increasing the allocation of
resources devoted to the sector throughout the last few years (even if these are still insufficient given
sector needs); and (ii) developing new strategies to increase the financing of the road maintenance
sector, including external financing with IFIs, PPPs and a new tax on land use to fund road rehabilitation
and maintenance. Aiming at providing solutions in the medium term, these strategies are being
supported by a broad range of stakeholders beyond the Bank, including different Government agencies
and other IFIs, among others.
In terms of the technical sustainability of physical works, multiple systems are in place to guarantee the
maintenance of the road network, as previously mentioned. Performance-based maintenance contracts
(CREMA) only account for one fraction of the network (approximately 18%); the network under CVU
management also is maintained through result-based contracts, adding an additional 18% of the network.
Other systems used to promote a greater participation of the private sector in road management include
concessions (which only account for 1.4% of the network). Further, it is the Government policy to
increase the participation of the private sector in highway management and financing. This perspective
is promising, even though there are still some uncertainties regarding the outcome of the currently
under-preparation PPP program. To date, the large majority of the network (59%) is still maintained by
DNV directly by force account. Beyond the efficiency of each of these systems, budget spending limits
are likely to have an impact on DNV’s capacity to ensure adequate levels of maintenance on its network.
Finally, institutional continuity and technical capacity within the MTOP, DNV in particular, provide a
stronghold in terms of safeguarding the results attained through the Project. The culture of road
maintenance is entrenched in the way MTOP/ DNV carry their day-to-day work. This situation, added to
the strong experience and relatively low turnover of technical teams within the Ministry, guarantees the
sustainability of policies moving forward and minimizes the impact of potential changes in political
leaderships and priorities.

25
5. Assessment of Bank and Borrower Performance (relating to design, implementation and outcome
issues)
5.1 Bank
(a) Bank Performance in Ensuring Quality at Entry (i.e., performance through lending phase):
Rating: Moderately Satisfactory.
Overall, Bank performance during preparation and appraisal is rated as moderately satisfactory. While
the project was prepared in a timely manner, in a fruitful partnership with two successive
administrations, quality at entry was hindered by substantial shortcomings regarding project readiness
and the Monitoring and Evaluation framework definition.
On the positive side, the Project was prepared in timely fashion and drew on many of the lessons learnt
through previous operations in the sector, given the longstanding partnership of the Bank with the
country and the MTOP. Policy dialogue with the Government during preparation was continuous,
despite changes in the political administration, and the Bank effectively managed the effects of the
political transition, holding a series of consultations with the entering Government, which enabled to
generate ownership of the Program within the new administration. Besides, the Bank provided access to
global experience and best practices regarding institutional reforms, the consolidation of a maintenance
policy (through innovative approaches such as CREMA contracts) and the introduction of road
management planning tools.
However, there were some shortcomings in Project design, including: (i) weaknesses in the design of the
M&E framework, with PDO indicators turning out to be too broad and ambitious, and therefore
incapable of reflecting actual Project results; (ii) project readiness, with problems in the original
selection of sub-projects which resulted in almost no disbursement during the first year of the project
and the need for a substantial Project restructuring, only one year after effectiveness; and (iii) flaws in
the design of the technical assistance component, considering that almost none of the activities
originally envisaged were finally financed through the loan.
(b) Quality of Supervision (including fiduciary and safeguards policies):
Rating: Satisfactory.
Bank supervision is rated as satisfactory. Bank supervision has been strong in supporting and advising
the MTOP on the transport sector agenda, as well as being creative in providing solutions, even if
supervision could have been improved on Project processes.
The Bank task team carried out, on average, two supervision missions per year and there was a good
time dedication on behalf of the team, particularly after the Task Team Leader was based in the region.
Bank supervision in terms of environmental and social safeguards is deemed adequate, even though the
project could have benefited from some more involvement from environmental and social experts:
safeguards supervision was indeed mainly carried out by the Project’s TTL, in part due to existing

26
capacity at local level and in part due to the lack of any significant events in this area during
implementation. Fiduciary supervision is deemed globally adequate, no significant issue being reported
especially on Financial Management. The team has in general terms been proactive in anticipating issues
and creative in providing solutions; more importantly, the Bank played a substantial role providing
technical assistance and advice to its counterparts, even if many of the activities included under the
technical assistance component were eventually financed through other sources. In terms of the overall
support of the Bank to the larger policy agenda within the transport sector, Bank performance by the
Borrower is rated as highly satisfactory.
However, this globally positive picture suffered from a few procedural issues, including: (i) delays in the
processing of the first restructuring, with over 10 months elapsing between the first restructuring request
and its approval by the Bank; (ii) a missed opportunity to adjust PDO indicators during Project
implementation, specifically, at midterm review; and (iii) delays arising from procurement issues.
(c) Justification of Rating for Overall Bank Performance:
Rating: Satisfactory.
The overall Bank performance is considered satisfactory, with quality at entry being moderately
satisfactory and supervision being satisfactory. Six years of effective supervision, including a rich
institutional dialogue with the MTOP, is considered outweighing the moderately satisfactory quality at
entry.
5.2 Borrower Performance
(a) Government Performance:
Rating: Satisfactory.
Government support is rated satisfactory on the basis of its role during Project preparation and
implementation. Project preparation ran smoothly despite time constraints and the change in ruling
parties, with one administration preparing the Project and another one approving it. This is explained by
the widespread support to maintenance within the MTOP, which goes beyond political lines and
factions. However, despite this political commitment to the sector policies being supported by the
Project, new priorities arose during the Tabaré Vázquez administration, in terms of new works (ring
road, expansion of route 1, etc.); such new priorities became conflictive under a scenario of budget
restrictions, diverting needed resources from highway maintenance. However, in the last few years
priorities have been reoriented towards rehabilitation and maintenance, with no major works being
programmed for the next few years.
Shortages in terms of counterpart funding were evidenced towards the end of the Project, although these
managed to be addressed through the transfer of some works from DNV to CVU in the final stages of
Project implementation, hence not bringing works to a halt. Additionally, through effective donor

27
coordination at Government level, many of the works excluded from the operation ended up being
financed through other donors, as has been previously indicated, with good results.
Finally and looking ahead, the Government has launched several initiatives to further support road
maintenance and rehabilitation, including: (i) a new loan with the Bank, (ii) a new loan with the IADB,
(iii) several PPP operations for road rehabilitation and maintenance.
(b) Implementing Agency or Agencies Performance:
Rating: Satisfactory.
The performance of the implementing agencies, particularly DNV, is rated satisfactory, both in terms of
its general institutional capacity and its effective management of the Project (technical, fiduciary and
safeguards). The continuity of technical teams has been critical to effective Project implementation.
However, many functions have become “personalized” within DNV, making dependence on a limited
number of staff. Moreover, despite the good quality of work undertaken at technical level, there is a
general trend of diminishing human resources within specific areas, which may, at some point, hinder
the ministry’s performance.
DNV showed flexibility and resourcefulness in addressing problems arising during implementation. The
clearest expression of this is found in the fact that despite problems in the original Project design
(detailing works and activities which were not implemented), during implementation the Project was
broadly redefined in its content into something that ultimately worked and managed to meet the
Project’s objectives.
Besides, the PCU had extremely good reporting systems in place, submitting bi-annual progress reports
to the Bank in a timely manner, containing updated information on Project financing, procurement,
physical progress of works, overall monitoring and evaluation of Project indicators, safeguards and key
implementation issues.
Finally, procurement processes were somewhat lengthy and could have been more streamlined. In
particular, the time required to address an issue on the last procurement process delayed the works,
preventing basically the loan to disburse 100%.
(c) Justification of Rating for Overall Borrower Performance:
Rating: Satisfactory.
The overall Borrower performance is rated as Satisfactory, both Government and Implementing Agency
performance being satisfactory.

28
6. Lessons Learned (both project-specific and of wide general application)
Several lessons can be derived from this Project. They are summarized below:
PDOs and PDO indicators should be commensurable to what a Project can realistically attain.
Both the PDO and the corresponding PDO indicators were defined too broadly, given the scale and
scope of the Project, and with too optimistic targets. A US$70 million Specific Investment Loan can
contribute to address road maintenance issues but cannot be expected to impact sector-wide trends. This
should be adequately reflected in terms of Project design, ensuring that objectives and indicators are
coherent with the Project’s capacity to deliver. If needed, complementary instruments should be adopted
to address broader sector-wide issues identified by the Borrower.
Fast-track preparation Projects should include significant flexibility in their design so as to
become quickly operational: Although the Project was prepared rapidly, this implied that some of the
preparatory work – typically: engineering designs – that should have been undertaken prior to Project
approval were actually carried out in the first years of implementation. This, added to the fact that the
Project Appraisal Document included a very specific list of works and activities to be undertaken under
the Project implied that practically no works were executed in the first two years following
effectiveness. Two significant restructurings were required, with substantial delays to implementation.
In this case, establishing a list of potentially eligible activities, subject to comply with a set of eligibility
criteria defined upfront, could have provided a better alternative and given more flexibility during
implementation; defining the works to be executed only during the first years of the project would also
have been another possibility.
An early understanding of the particularities of a market can avoid procurement-related delays
further down the road. In the case of this operation, an earlier identification of the specific
characteristics of the Uruguayan construction market, and the consequent adaptation of standard Bank
qualification criteria applied in bidding documents, could have avoided some of the delays encountered
during implementation.
Conceiving the sector’s work program as a holistic unit and promoting effective donor
coordination seems to be the right way to go, moving forward. The Government of Uruguay, through
the MTOP, does not think in terms of the IDB Project, the World Bank Project, CAF’s Project, etc. but
rather in terms of a comprehensive MTOP work program, which is partially financed by different
financiers. This explains why, although the Bank did not finance many of the works originally included
in the Project at design stage, these ended up being executed through other alternative sources of
financing. This programmatic approach is particularly adapted to rehabilitation and maintenance works,
which require regular and predictable funding, especially when such services are contracted out to the
private sector.
Ensuring adequate financing for maintenance remains a challenge and future Bank engagement
in the sector should focus on this issue. Sector financing still faces strong restrictions; budget
allocations cannot account for sector needs. Despite the existence of five-year work plans, most of the
programmed works cannot be executed given budget restrictions. The limited amount of funds available
at sector level, vis a vis existing sector needs, makes guaranteeing sufficient funds for road maintenance

29
a challenging task. For the past decade or so, the Bank has tried to support Uruguay to bridge the exiting
financing gap in terms of rehabilitation and maintenance in the national road network. However, if
issues of sector financing are not addressed in the short to medium term, the financing gap is likely to
grow, with an adverse impact on the network. Further Bank support ought to facilitate a broader policy
dialogue with the Government of Uruguay on how to ensure a better sustainability of road maintenance
financing.
7. Comments on Issues Raised by Borrower/Implementing Agencies/Partners
(a) Borrower/implementing agencies:
The Borrower submitted the 15th
of December of 2011, their version of the ICR (included as Annex 7).
General arguments made are in line with what has been expressed in this ICR. Key points raised by the
Borrower include, among others: (i) that Project design drew from lessons learnt under previous
operations and was consistent with the general policy guidelines adopted by the GoU; (ii) that Project
implementation schemes were adequate and that DNV performance in the day-to-day implementation
of the Project was satisfactory in terms of technical environmental, social and fiduciary procedures; (iii)
that the Project managed to deliver, despite changes in its content, achieving a 97.3% rate of
disbursement in October 2011; (iv) that Bank performance was overall satisfactory in terms of providing
solutions and technical assistance, despite some procedural delays (restructuring, procurement
processes, etc.); (v) that Project results were considerable given conditions encountered in the initial
years of implementation; and (vi) that there continues to be a wide support in terms of the policies being
supported by the Project within the Government.
(b) Cofinanciers:
Not applicable.
(c) Other partners and stakeholders (e.g. NGOs/private sector/civil society):
Not applicable.

30
ANNEXES
Annex 1. Project Costs and Financing
(a) Project Cost by Component (in US$ million equivalent)
Components Appraisal Estimate
(US$ million)
Actual /Latest Estimate
(US$ million)
Percentage of Appraisal
1. Transport Infrastructure
Rehabilitation 27.52 45.3 164.6%
(A) DNV Managed Routes 5.20 4.5 115.5%
(B) CVU Managed Routes and
Bridges 17 35.8 210.6%
(C) Transfer Terminal
Rehabilitation 5.32 5 93.9%
2. Road Rehabilitation and
Maintenance Contracting
(CREMA contracts)
15.23 5 32.8%
3. Departmental Road
Rehabilitation and Maintenance 12.76 18.84 147.6%
4. Transport Infrastructure
Safety Program 2.35 0 0%
5. Transport Sector
Management and Institutional
Building
3.91 0.510 13%
Total Baseline Cost 61.77 69.65 112.7%
Physical Contingencies 5.79
Price Contingencies 2.09
Total Project Costs 69.65 69.65 100%
Front-end fee (IBRD only) 0.35 0.35 100%
Total Financing Required 70.00 70.00 100%
(b) Financing
Source of Funds Type of Financing
Appraisal
Estimate
(US$ million)
Actual/Latest
Estimate
(US$ million)
Percentage of
Appraisal
[Government] 30 30 100%
[IBRD/IDA or GEF] IBRD 70 70 100%

31
Annex 2. Outputs by Component
Component 1 Project/ Activity Original
Allocation
(US$ millions)
Revised
Allocation
(US$
millions)
Comments
1.A DNV
managed routes
Route 3 (former Route
3-584km700)
3.2 Excluded from the Project for lack of
financing, under the Second
Restructuring. Not executed
Route 3 (587km300-
594km100)
1.2 Excluded from the Project for lack of
financing, under the Second
Restructuring. Not executed
Route 18 (Rio Tacuari-
Canada Santos)
4 Work was transferred to CVU under the
Second Restructuring
Route 13 (Route 8-
Aigua)
0 n.a. Included in the Project under the Second
Restructuring-Works started on February
2011
1.B CVU
managed routes
and bridges
Route 1 (144km-Route
22)
7.1 8.2 Under the First Restructuring work was
modified from route 54 (138km) to route
22.
Work was concluded in December 2010
Route 1 (Route 2-
144km)
2.3 10.8 Under the First Restructuring work was
modified from route 2 to Route 54.
Work was concluded in December 2010
Route 3 (Planta Urbana
de Young)
0.5 Work was excluded from the Project
under the Second Restructuring. Not
executed and not programmed for
execution.
Route 8 (Rio Cebollati-
Arroyo Piraraja)
0 4.1 Work was included in the Project under
the First Restructuring and has been
concluded
Route 8 (Arroyo
Piraraja-235km)
0 3.5 Work was included in the Project under
the First Restructuring and has been
concluded
Route 11 (Ecilda
Paullier-Juan Soler)
0 3.3 Work was included in the Project under
the First Restructuring and has been
concluded
Route 11 (San Jose-
Villa Rodriguez)
0 3 Work was included in the Project under
the First Restructuring and has been
concluded
Route 1 (Bridge
Arroyo Sauce)
0.7 Executed under the Project
Route 1 (Bridge
Arroyo Minuano)
0.4 Executed under the Project
Route 1 (Bridge
Arroyo Riachuelo)
0.5 Executed under the Project
Route 3 (Bridge
Arroyo Grande)
0 1.4 Work was included in the Project under
the First Restructuring and has been
concluded
Route 5 (Bridge
Banado de Rocha)
0 0.4 Work was included in the Project under
the First Restructuring and has been
concluded
Route 5 (Bridge
Arroyo Curticeiras)
0 0.4 Work was included in the Project under
the First Restructuring and has been
concluded

32
Route 8 (Bridge
Arroyo Sarandi)
0.3 0.4 Executed through CVU
Route 11 (Bridge
Arroyo Descarnado y
La Pedrera)
0 0.5 Work was included in the Project under
the First Restructuring and excluded
under the Second Restructuring- The two
bridges are being financed by other
sources.
Route 5 (Bridge Rio
Yi)
0.3 0 Work was excluded from the Project
under the First Restructuring. Not
executed and not programmed for
execution.
Route 5
(Bridge A Villasboas)
0.3 0 Work was excluded from under the First
Restructuring the Project. Not executed.
Programmed for 2012
Route 5 (Bridge A
Molles)
0.1 0 Work was excluded from the Project
under the First Restructuring. Not
executed. Programmed for 2012
Route 5 (Bridge Cda la
Zorra)
0.1 0 Work was excluded from the Project
under the First Restructuring. Not
executed. Programmed for 2012
Route 6 (Bridge A
Canelon Grande)
0.2 0 Work was excluded from the Project
under the First Restructuring. Not
executed.
Route 6 (Bridge A
Tala)
0.7 0 Work was excluded from the Project
under the First Restructuring. Not
executed and not programmed for
execution.
Route 7 (Bridge A
Fraile Muerto)
0.6 0 Work was excluded from the Project
under the First Restructuring. Not
executed. Under CVUs Plan.
Route 21 (Bridge A las
Viboras)
1 0 Work was excluded from the Project
under the First Restructuring. Not
executed.
Route 26 (Cda. Sin
nombre)
0.2 0 Work was excluded from the Project
under the First Restructuring. Not
executed.
Route 26 (Cda. Sin
nombre)
0.2 0 Work was excluded from the Project
under the First Restructuring. Not
executed.
Route 28 (Bridge A
Corrales)
0.5 0 Work was excluded from the Project
under the First Restructuring. Not
executed.
Route 30 (Bridge A
Yucutuja)
3.5 0 Work was excluded from the Project
under the First Restructuring
Route 200 (overpass
with route 87)
2 0 Work was excluded from the Project
under the First Restructuring. Under
CVUs Plan.
Route 200 (overpass
with route 35)
2 0 Work was excluded from the Project
under the First Restructuring. Under
CVUs Plan.
Overpass Santin C.
Rossi
2 0 Work was excluded from the Project
under the First Restructuring and is not
programmed for execution.
Overpass to be defined 2 0 Work was excluded from the Project
under the First Restructuring and is not

33
programmed for execution.
Component 4
Activity
Amount (US$,
thousands)
Financing Source
Illumination R.102 500 DNV/IDB
Illumination R.101 350 Local Funds
Construction of pedestrian refuges 50 Local Funds
Illumination R.5 (Joanico-R.11) 350 DNV/IDB
Pedestrian pathways R.8 150 Local Funds
Pavement demarcation 700 DNV/IDB
Illumination R.6 200 DNV/IDB
Pedestrian pathways Canelones 100 Local Funds
Metal defenses (flexbeam) 800 DNV/IDB
Acquisition of road signals 600 DNV/IDB
Component 2 Project/ Activity Original
Allocation
(US$ millions)
Revised
Allocation
(US$
millions)
Comments
2. CREMA
contracts
Routes 3 and 11 6.8 Transferred to CVU under the Second
Restructuring, with works staring in May
2010
Route 5 5.6 Excluded from the Project under the
Second Restructuring
Access to Montevideo 3.1 Works started in March 2009, with a 36
month duration (75% progress)
Route 6-11 (Canelones
Center West
subnetwork)
4.6 Excluded from the Project under the
Second Restructuring
Route 6-11 (Canelones
East subnetwork)
3.1 Excluded from the Project under the
Second Restructuring
Tourism Zone 5.9 Contract signed in July 2011, impeding it
to be financed with Project funds

34
Annex 3. Economic and Financial Analysis (including assumptions in the analysis)
The ex-post economic appraisal was carried out for three investments, deemed to be representative of
the works executed under the project:
Arroyo Grande Bridge;
Route 8: section Rio Cebollati – Arroyo Piraraja – Aramendia;
Route 18 (Via Ferrea-Canada Santa).
1) Arroyo Grande Bridge
Works consisted in widening to 8m and in structural strengthening of the Arroyo Grande bridge (360 m
span), located on Route 3. This route is heavily used, in particular for forestry products.
The economic evaluation was carried out using the consumers’ surplus methodology, comparing a “with
project scenario” to a “base case” scenario; economic calculations were carried out using the HDM4
software. While, in the “with project scenario”, truck with 25-tons axle load are allowed to go through
the upgraded bridge, the “base case scenario” includes a restriction on trucks maximum axle loads,
conducive to either longer detours or transshipments. The ex-post appraisal methodology also updates
the variables used hypothetically in 2003 (year of the ex-ante appraisal), with real data from 2010: initial
traffic evolution and subsequent evolution, investment costs in particular.
On a 15-year appraisal period, the following results were obtained:
Route Description Estimated
Amount
(thousands
of US$)
Contract
Amount
(thousands
of US$)
Amount
finally
contracted
(thousands
of US$)
NPR
(thousands
of US$)
Ex-ante
IRR
(%)
Ex
ante
NPR
(thousands
of US$)
Ex-post
IRR
(%)
Ex-
post
3 Arroyo
Grande
2.160 1.036 1.891 4.214.954 41.21 4.167.499 46.5
Route Description Ex-ante length
(Km)
Ex-post length
(Km)
Work Estimated
Year
Work Actual
Year
3 Arroyo Grande 0.36 0.36 2003 2006-2009
As observed in the table above, the project of the Arroyo river bridge on Route 3 has an ex-post Internal
Rate of Return of 46.5% and a Net Present Value, at a 12% discount rate, of approx. US$ 4.2 million.
Sensibility analysis shows that, if the consumers’ benefits were cut by 20%, the investment IRR and
NPV would be respectively 43.2% and US$3.4 million.
2) Route 8: Rio Cebollati – Arroyo Piraraja – Aramendia
On this approx. 27 km highway section, works consisted in pavement and drainage rehabilitation; the
total investment cost of about US$9.2 million. Average annual daily traffic ranges between 1,200 and
1,300, depending on the subsections, with 20% to 25% freight traffic, mainly for agriculture and forestry
products.

35
The economic evaluation was carried out using the consumers’ surplus methodology, comparing a “with
project scenario” to a “base case” scenario; economic calculations were carried out using the HDM4
software. The economic appraisal compares costs and benefits of a “with project scenario” to a “base
case scenario”; main benefits from the investment stem from the reduction of vehicle economic costs –
thanks to better road condition – and, to a lesser extent, reduced travel time and accidents. The ex-post
appraisal methodology also updates the variables used hypothetically in 2003 (year of the ex-ante
appraisal), with real data from 2010:
Amount, length, year of execution and type of work
Real initial traffic for the period and average annual growth rate for the 2006-2010 period
Calibration of the deterioration curve with respect to IRI and adjustments on that index for the
initial year (2005)
As a result of the technical-economic ex-post analysis and its comparison with ex-ante indicators, for the
rehabilitation project the following indicators were attained, under a 15-year horizon:
Route Description Estimated
Amount
(thousands
of US$)
Contract
Amount
(thousands
of US$)
Amount
finally
contracted
(thousands
of US$)
NPR
(thousands
of US$)
Ex-ante
IRR
(%)
Ex
ante
NPR
(thousands
of US$)
Ex-post
IRR
(%)
Ex-
post
8 Rio
Cebollati-
Piraraja
3.592 4.188 5.686 488 17.20 1.070 21.1
8 Pirarja-
Aramendia
2.404 2.835 3.504 550 16.70 880 19.2
Route Description Ex-ante length
(Km)
Ex-post length
(Km)
Work Estimated
Year
Work Actual
Year
8 Rio Cebollati-
Piraraja
15.05 15.05 2006 2007
8 Pirarja-
Aramendia
12.55 12.55 2006 2007
As observed in the tables above, the economic indicators and investment undertaken is detailed for each
of the segments on Route 8; both segments together attain an ex-post Internal Rate of Return of 20.1%
and a Net Present Value, discounted at 12%, of almost US$2.0 million. As a reminder, the ex-ante
economic indicators for this sub-project were: (i) IRR: 16.9% and (ii) NPV: US$1.0 million. The
economic appraisal actually resulted in better outcome than anticipated.
Finally, sensibility analysis shows that, if the consumers’ benefits were cut by 20%, the investment IRR
and NPV would be respectively 16.8% and US$1.1 million.
3) Route 18 (Via Ferrea-Canada Santa)
On this approx. 22 km highway section, works consisted in pavement and drainage rehabilitation; the
total investment cost of about US$13.3 million. In 2001, the average annual daily traffic on this Route
18 section was 700, with 23% freight traffic, mainly for agriculture and forestry products.

36
The economic evaluation was carried out using the consumers’ surplus methodology, comparing a “with
project scenario” to a “base case” scenario; economic calculations were carried out using the HDM4
software. The economic appraisal compares costs and benefits of a “with project scenario” to a “base
case scenario”; main benefits from the investment stem from the reduction of vehicle economic costs –
thanks to better road condition – and, to a lesser extent, reduced travel time and accidents. The ex-post
appraisal methodology also updates the variables used hypothetically in 2003 (year of the ex-ante
appraisal), with real data from 2010:
Amount, length, year of execution and type of work
Real initial traffic for the period and average annual growth rate for the 2006-2010 period
Calibration of the deterioration curve with respect to IRI and adjustments on that index for the
initial year (2005)
As a result of the technical-economic ex-post analysis and its comparison with ex-ante indicators, for the
rehabilitation project the following indicators were attained, under a 15-year horizon:
Route Description Estimated
Amount
(thousands
of US$)
Contract
Amount
(thousands
of US$)
Amount
finally
contracted
(thousands
of US$)
NPR
(thousands
of US$)
Ex-ante
IRR
(%)
Ex
ante
NPR
(thousands
of US$)
Ex-post
IRR
(%)
Ex-
post
18 Via Ferrea-
Canada
Santos
3.740 12.611 13.257 340 17.30 250 13.08
Route Description Ex-ante length
(Km)
Ex-post length
(Km)
Work Estimated
Year
Work Actual
Year
18 Via Ferrea-
Canada Santos
19.70 21.85 2006 2008-2009
As observed in the table above, the ex-post Internal Rate of Return is 13.1% and the Net Present Value,
discounted at 13.1%, of US$250k. As a reminder, the ex-ante economic indicators for this sub-project
were: (i) IRR: 17.3% and (ii) NPV: US$340k. This lower-than-anticipated economic indicators result
from a pavement rehabilitation solution heavier (and more costly) than initially designed, including
platform widening.

37
Annex 4. Bank Lending and Implementation Support/Supervision Processes
(a) Task Team members
Names Title Unit Responsibility/ Specialty
Lending
Jorge Rebelo Transport Specialist LCSFT Task Team Leader
Andres Pizarro Sr. Transport Specialist LCSFT Co-Task Team Leader
Daniel Pullido Junior Professional LCSFT Economist, Junior Professional
José Maria Alonso-Biarge Lead Highway Specialist LCSFT Consultant
Rodrigo Archondo Highway Specialist TUDTR Consultant
Emilio Rodriguez Procurement Specialist TCOPR Procurement Specialist
Luis Schwarz Sr. Management Specialist LCOAA Procurement
Marco Zambrano Social & Environmental
Specialist
LCSEN Consultant
Reynaldo Pastor Sr. Counsel LEGLA Counsel
César Quiroz Transport Specialist ECSIE Peer Reviewer
Aurelio Menendez Transport Specialist LCSFT Peer Reviewer
Supervision
Gregoire Francois Gauthier Sr. Transport. Engineer LCSTR Task Team Leader
Maria Lucy Giraldo Senior Procurement Specialist LCSPT Procurement
Natalia Cecilia Bavio Financial Management Spec. LCSFM Financial Managment
Daniel R. Gross Consultant LCSSO Social Safeguard Specialist
Claudio Luis Daniele Consultant LCSEN Environmental Specialist
Melanie Glass Consultant LCSTR Transport Specialist
Aracelly Woodall Sr. Program Assistant LCSTR Project Assistant
Daniel Benitez Sr. Transport Economist LCSTR Economist
Ruth Tiffer-Sotomayor Sr. Environmental Specialist LCSEN Environmental Safeguard Specialist

38
(b) Staff Time and Cost (from SAP)
(The system pulls data available for all fields)
Stage of Project Cycle
Staff Time and Cost (Bank Budget Only)
No. of Staff Weeks US$ Thousands
(including travel and consultant
costs)
Lending
FY 2004 22.07
FY 2005 41.5 204.20
FY 2006 1.35 1.920
TOTAL: 42.85 228.19
Supervision/ICR
FY 2006 9.30 54.70
FY 2007 14.34 64.90
FY 2008 14.94 70.91
FY 2009 9.62 53.92
FY 2010 12.30 76.12
FY 2011 10.01 62.38
FY 2012 3.62 18.08
TOTAL 74.13 401.01

39
Annex 5. Beneficiary Survey Results (if any)
No beneficiary survey result was carried out.

40
Annex 6. Stakeholder Workshop Report and Results (if any)
No stakeholder workshop was organized.

41
Annex 7. Summary of Borrower’s ICR and/or Comments on Draft ICR
URUGUAY Ministerio de Transporte y Obras Públicas
PROYECTO DE MANTENIMIENTO DE INFRAESTRUCTURA DE TRANSPORTE Y ACCESO RURAL
Préstamo 7303-UR
REPORTE DE FINALIZACION DEL PROYECTO
1. INTRODUCCION El Banco Internacional de Reconstrucción y Fomento (BIRF) firmó con la República Oriental del Uruguay (ROU) con fecha 16 de junio de 2005, un Convenio de préstamo para financiar parcialmente el Proyecto de Mantenimiento de Infraestructura de Transporte y Acceso Rural.
El Ministerio de Transporte y Obras Públicas (MTOP) asume a su cargo la ejecución del Proyecto a través de sus agencias.
El Proyecto fue diseñado en concordancia con los objetivos establecidos en el documento de Banco Mundial, Country Assistance Strategy (CAS) para el año fiscal 2005-2010.
El monto del Préstamo ascendió a U$S 70:000.000, siendo el aporte por concepto de aporte local del Gobierno de Uruguay de unos U$S 30:000.000, lo que totaliza un monto de inversión de unos U$S 100:000.000. El MTOP como organismo ejecutor del Proyecto, cuenta con antecedentes en la ejecución de Proyectos con financiamientos del Banco Mundial, en el sector transporte. Los ejemplos anteriores son el Proyecto de Transporte I (Pmo. 3021-UR) del año 1988, el Proyecto de Transporte de Productos Forestales (Pmo. 4204-UR) del año 1997 y finalizado en abril de 2006; y el Segundo Proyecto de Transporte (Pmo. 4395-UR) del año 1998 y finalizado en setiembre de 2003. Los resultados satisfactorios en el desarrollo de la gestión de la infraestructura de transporte, permitieron la continuación de este tipo de proyectos y colaboraron en la consolidación de las políticas de mantenimiento y la utilización de ciertos modelos como los contratos tipo CREMA o la ejecución de obras a través de la CVU. S.A. La fecha de cierre prevista en el Convenio de Préstamo era el 31 de julio de 2011, la cual se cumplió efectivamente, habiéndose solicitado un período de gracia de 4 meses para desembolsar el cual fue aprobado por nota de fecha 5 de mayo de 2011, por la directora de pais. El Préstamo es de la categoría de “Margen Fijo” que se encuadra en el Documento del BM “Condiciones Generales aplicables a Convenios de Margen Fijo” de la versión de 1999 con enmiendas de mayo de 2004. La fecha de amortización comenzó a regir a partir del 15 de octubre de 2010 y finalizará en abril de 2020. El Ministro de Transporte y Obras Públicas quedó designado como representante del prestatario a los efectos establecidos en la Sección 11.03 del documento de Condiciones Generales aplicables a los convenios de Préstamo.
2. OBJETIVOS DEL PROYECTO Antecedentes. En el marco en que se negoció y firmó el Proyecto, la economía de la R. O. del Uruguay empezaba a mostrar mejoras y crecimiento, luego de la recesión que se manifestó entre los años 1999 y 2001

42
que tuvo como consecuencia la crisis del año 2002. A partir de allí el Gobierno de Uruguay comenzó a proyectar una estrategia de desarrollo en la cual la mejora de la infraestructura de transporte ocuparía un lugar destacado en base a las expectativas de crecimiento de intercambio con el MERCOSUR, para mejorar la competitividad por el crecimiento de los sectores forestal y de agricultura junto con la estrategia de posicionar al país como centro logístico y de distribución de la región. Es en este marco en el cual se fijaron los objetivos del Proyecto. El objetivo general del Proyecto consiste en contribuir a un crecimiento económico del país, incrementando la competitividad de los productores uruguayos a través de la mejora del costo eficiencia de los servicios de transporte, mejorando las oportunidades de intercambio con el MERCOSUR. La mejora de la infraestructura de transporte del país logrará que haya una adecuada relación entre el costo y la eficiencia de los servicios de transporte de cargas y pasajeros. Como objetivos subsidiarios del mismo se identifican los siguientes:
Reducir los costos a los usuarios mejorando la infraestructura física y la seguridad en los corredores internacionales;
Asistir al MTOP en la consolidación de un marco seguro y confiable para el financiamiento del mantenimiento y rehabilitación de la infraestructura de transporte;
Mejorar el acceso a las zonas rurales para mejorar las ventajas comparativas de los productores agropecuarios y ganaderos así como también facilitar la integración de los centros urbanos secundarios y rurales;
Asegurar que todas las terminales de transferencia estén preparadas para atender la nueva demanda intermodal para el transporte de cargas y de pasajeros.
El organismo encargado de la ejecución es el Ministerio de Transporte y Obras Públicas a través de sus agencias ejecutoras tales como la Dirección Nacional de Vialidad (DNV), la Dirección Nacional de Hidrografía (DNH) y la Dirección Nacional de Transporte (DNT). Participan también como apoyo, otras áreas del MTOP, así como indirectamente otras dependencias del Estado.
3. DISEÑO E IMPLEMENTACION DISEÑO El Proyecto fue diseñado recogiendo las lecciones derivadas de los Proyectos previos financiados por el Banco y otros organismos, así como también del intercambio de ideas durante la preparación e identificación entre el BIRF y las autoridades de la Administración que tomaron posesión en marzo de 2005, en conjunto con los técnicos del MTOP. El Proyecto de Mantenimiento de Infraestructura de Transporte y Acceso Rural planeó financiar inversiones clave según lo delineado en el Plan Quinquenal de Inversiones del gobierno para el período 2005 – 2009, y se complementa con otros Proyectos en ejecución para el sector transporte que financian otros organismos tales como el BID, la CAF y FOCEM. En particular, se tuvieron en cuenta los siguientes lineamientos para su diseño:
La tradición de continuidad en las reformas del sector infraestructura en Uruguay que resultaron exitosas.
Encuadrar los objetivos del Proyecto con el desarrollo y crecimiento de las actividades económicas en los rubros de agricultura, forestal y portuaria.
Intervenciones que se acompasen al ritmo presupuestario y de apoyo a la inversión del sector privado principalmente a través de la CVU S.A.
ajustar los componentes del mismo a las distintas modalidades de ejecución de la Dirección Nacional de Vialidad.
Incorporar la participación de la Dirección Nacional de Hidrografía en el desarrollo de la infraestructura y a la Dirección Nacional de Transporte en las políticas de gestión y regulación del transporte.

43
El Préstamo apoyaría a la DNV en las rehabilitaciones a cargo de su propio presupuesto, al apoyo al Contrato de Concesión de gran parte de la red primaria a la CVU S.A., a los Contratos de rehabilitación y mantenimiento por niveles de servicio (CREMA), a la eliminación de puentes fusibles en los corredores, a la transferencia a la caminería rural departamental y al fortalecimiento institucional y al apoyo a la seguridad vial. La DNH sería apoyada para revertir el deterioro sufrido en las terminales de transferencia marítimas a su cargo, por la falta de inversión en mantenimiento. Constituirían inversiones menores en varias terminales para responder adecuadamente al transporte de pasajeros y eventualmente de cargas. El fortalecimiento institucional actuaría a través de varias asistencias dentro del MTOP, tales como la capacitación para la DNV, preparación de planes maestros de los puertos regionales o fluviales, fortalecer la capacidad técnica para la evaluación de la caminería rural y asistir en la preparación del Programa de Transporte Interurbano en el área metropolitana de Montevideo. IMPLEMENTACIÓN El MTOP como responsable de diseñar, ejecutar y controlar la política nacional de transporte en todas sus modalidades, actúa en coordinación con las empresas públicas relacionadas a esas actividades, con los gobiernos departamentales (intendencias) y con otras organizaciones estatales y privadas. El Proyecto se implementará a través de sus diversas agencias, principalmente la Dirección Nacional de Vialidad (DNV) es la que tiene a su cargo la red de rutas de jurisdicción nacional (casi 8.800 kms) y coordina los convenios con la caminería rural departamental. La Dirección Nacional de Hidrografía, esta a cargo de la política del sector portuario, como así también de otras actividades de mantenimiento de las vías navegables, estudios hidráulicos y está a cargo de todos los puertos que no están bajo la jurisdicción de la ANP. La Dirección Nacional de Transporte está a cargo de la regulación de los servicios de transporte en todos sus modos. La Corporación Vial del Uruguay S.A. que pertenece a la Corporación Nacional para el Desarrollo (CND) es una persona pública no estatal de derecho privado que tiene la concesión de una malla de unos 1600 kms de la red vial a través de un Contrato de Cesión del MTOP. A efectos del Préstamo el MTOP firmó un contrato subsidiario con la CVU S.A. en la cual se compromete a adoptar los compromisos asumidos por el MTOP en el marco del Convenio de Préstamo para las obras específicas que formen parte del mismo. La Unidad Coordinadora de Proyectos del MTOP es la responsable de que los diferentes ejecutores lleven a cabo la misma de acuerdo a los cometidos y políticas del Banco Mundial fijadas en el Convenio de Préstamo y de plantear las diferentes alternativas a los que se ve sometido el Proyecto, durante su transcurso. Desde punto de vista ambiental la implementación del Proyecto incluyó los arreglos necesarios para lograr un manejo adecuado de los impactos sociales y ambientales. El QAT (Quality Assurance Team) del Banco identificó los requerimientos para cumplir con las políticas de salvaguardas requeridas. Esto inicialmente consistió en la preparación de fichas sociales y ambientales individualmente para cada proyecto. La DNV aplicaría su Manual Ambiental para obras viales y sus procedimientos habituales de incluir la recuperación ambiental como un rubro más de las obras y la presentación de un Plan de Gestión Ambiental para cada obra, bajo la supervisión de la Unidad Ambiental. Para los proyectos de reparación de terminales de transferencia, principalmente reparaciones menores en terminales de puertos, la DNH aplicaría las guías establecidas en el Manual Ambiental para Proyectos de Puertos y Actividades desarrollado por la Administración Nacional de Puertos (ANP) con el apoyo del Banco en 1998. A efectos de mejorar la capacidad institucional de la Unidad Ambiental de la DNV, se previeron como actividades el fortalecimiento de la misma y la actualización del Manual Ambiental. Para la DNH se planteó la creación de
44
una Unidad Ambiental a efectos de mejorar la gestión ambiental. La previsión implicaba impactos ambientales mínimos por los tipos de obras a ejecutarse. Las adquisiciones se realizaron según los criterios de Revisión Previa (Prior review) o posterior (Post review), según las pautas descritas en el Convenio de Préstamo. Se aplicaron modelos de pliegos estándar y las Normas del Banco en su versión de 2004. Todos los procesos que requirieron revisión previa estuvieron sujetos a las “no objeciones” del Banco y al envío de toda la documentación requerida. Los procesos sin revisión previa estuvieron sujetos a las auditorias ex post realizadas durante el transcurso del Proyecto.
4. DESCRIPCIÓN DEL PROYECTO El Proyecto quedó estructurado con cinco componentes principales, que se detallan a continuación. 4.1. Rehabilitación de la Infraestructura de Transporte. Este Componente que es el mas importante desde el punto de vista de la inversión, a su vez se dividía en tres subcomponentes:
Rutas a cargo de la DNV (Categoría 1.A.). Comprende la rehabilitación de rutas incluidas dentro del Plan quinquenal a cargo de la Dirección Nacional de Vialidad.
Rutas y puentes a cargo de la CVU (Categoría 1.B). Este subcomponente es el mas extenso, comprendiendo la rehabilitación de rutas y puentes que forman parte de la malla concedida a la CVU.
Rehabilitación de Estaciones de Transferencia (Categoría 1.C.). Este componente consiste en rehabilitaciones menores en la infraestructura de muelles y escolleras de los puertos de jurisdicción de la DNH, a efectos de adecuarlos las nuevas demandas de transporte de pasajeros y cargas.
4.2 Contratos de Rehabilitación y Mantenimiento (CREMA) (Categoría 1.D.). Este componente comprende la realización de contratos para el mantenimiento por niveles de servicio de determinadas mallas o tramos de rutas nacionales por períodos de tiempo de 24 a 36 meses. 4.3 Programa de mantenimiento de caminos rurales departamentales. Se trata del apoyo a la ejecución por parte de las diecinueve intendencias municipales de las tareas de mantenimiento y de transferencia de tecnologías por parte de la DNV para unos 9.000 kms de caminos de balasto de jurisdicción municipal, más las obras de arte correspondientes. Se realizan Convenios anuales entre las Intendencias Municipales y el MTOP. El Proyecto prevé financiar dos de estos Convenios. 4.4 Programa de seguridad vial de la infraestructura de transporte. Este componente, busca complementar la mejora de la red física con las inversiones necesarias para mejorar la seguridad a través de elementos de demarcación de pavimento o de señalización, como así también en iluminación, de sendas para bicicletas o peatones y de la adquisición de señales de tránsito y de defensas para las rutas nacionales. 4.5 Gestión del sector transporte y fortalecimiento institucional. Este componente busca brindar apoyo para: i) el mejoramiento de las prácticas de gestión de infraestructura del sector transporte. Planteaba el diseño de un plan de estudios para el quinquenio 2005 – 2009. ii) capacitación para el uso del HDM IV. iii) fortalecer el gerenciamiento y la capacidad técnica para la evaluación de la caminería rural y en la preparación del un Plan Maestro para los puertos regionales. iv) asistir a en la preparación del programa de transporte para el área metropolitana de Montevideo.

45
5. ANÁLISIS DE LA EJECUCION La ejecución de Proyecto logró el cumplimiento de los objetivos propuestos, si bien se realizaron durante el transcurso del mismo, modificaciones y cambios respecto a los identificados originalmente. 5.1. Obras 5.1.1. Rehabilitación de rutas y puentes (Categorías 1.A y 1.B) La rehabilitación de rutas y puente incluidos originalmente en el Proyecto se expresa en el cuadro del Anexo I (AI-I) El cuadro expresa las obras de rutas incluidas originalmente en el Appraisal, según las categorías y con los montos estimados del momento (2005). Por la fecha en que fueron seleccionadas las obras que formaron parte del PAD, los montos estimados de las mismas fueron muy bajos, dado que provenían del arrastre de la crisis de los años 2002 y 2003. Las consiguientes reducciones presupuestales retrasaron las obras en ejecución y algunas obras con procesos adjudicados estaban a la espera de comenzar. Al comenzarse a recuperar la economía del país se retomó el ritmo de ejecución. Esto conllevó un arrastre en el tiempo, de las obras pendientes, lo que a efectos del Proyecto provocó un desfasaje en los plazos de las obras previstas y modificación de las prioridades. Por ese motivo se resolvió solicitar una Enmienda al Convenio, para incluir obras en ejecución o listas para comenzar (algunas provenientes del Préstamo BIRF 4204 –UR) a efectos de agilizar el Proyecto en detrimento de la exclusión de otras. La Enmienda fue finalmente aprobada por el Banco en marzo de 2007. Luego de la Enmienda, la parte vial del Esta Enmienda significó una disminución grande en el número de obras, pero a su vez se previó el aumento del costo de las obras, debido entre otros factores al aumento de la demanda de obras, a la depreciación del dólar respecto al peso uruguayo, con el consiguiente aumento de los insumos. Proyecto quedó definido según las siguientes tablas (en negrita las obras originales):
Category Number Section/Terminal Type of Works lenght Estimated
(route/terminal) kms Amount (US M.)
DNV 3 Ex.Ruta 3-584km700 Reconstruction 8,2 3,2
managed 3 587km300-594km100 Overlay 6,8 1,2
road 18 Río Tacuarí-Cda Santos Reinforcement 21 4,0
sections 13 Ruta 8 - Aiguá 21,5 *
CVU 1 144km-Ruta 22 New lane constuction 8,2
managed 1 Ruta 2-144km000 New lane constuction 21 6,3
8 Río Cebollatí – Ao. Pirarajá Rehabilitation 15 4.1
8 Ao. Pirarajá – 235km000 Rehabilitation 13 3.5
11 Ecilda Paullier – Juan Soler Rehabilitation 26 3.3**
11 San José – Villa Rodríguez Rehabilitation 14 3.0**
roads 3 Planta urbana de Young Reinforcement 0,5 0,5
1 Arroyo Sauce New bridge ***
managed 1 Arroyo Minuano New bridge ***
Bridges 8 Arroyo Sarandí New bridge 0,4
3 Ao. Grande Widening and reinforcement 1.4
5 Ao. Bañado de Rocha Widening and reinforcement 0.4
5 Ao. Curticeiras Widening and reinforcement 0.4
11 Ao. Descarnado y Ao. La Pedrera
Widening and reinforcement 0.5

46
* Obra agregada posteriormente.
** Obras ya en ejecución. Se financiarán solo los saldos. *** El costo se incluirá en la licitación de la doble vía de Ruta 1.
La nueva situación implicaba la rehabilitación total de unos 127 kms rutas (36kms a cargo de DNV y 90kms a cargo de la CVU) y readecuación de unos 8 puentes, todos a cargo de la CVU, estando 2 de ellos incluidos en la obra de la doble vía de la Ruta 1. Los puentes ejecutados por el Proyecto finalmente fueron cinco. El Proyecto igualmente realizó el monitoreo de los puentes fusibles de la ruta 8 a efectos de liberar ese corredor internacional para circulación con 25.5 ton en ejes triples. Los dos puentes remanentes sobre los arroyos Corrales y Cebollatí, aún no se han terminado, aunque se espera que para 2012 estén listos. En el transcurso del Proyecto fueron desafectados del mismo algunas obras por diversos motivos estratégicos. Las dos rehabilitaciones de la Ruta 3 fueron ejecutadas como parte de Contratos CREMA con financiación por fuera del Proyecto. Los costos de oficina estimados para las obras a efectos de las licitaciones se realizaban previo a los llamados. 5.1.2. Terminales de Transferencia (Categoría 1.C). Este componente consistió en rehabilitaciones menores de la infraestructura de muelles y escolleras a efectos de adecuarlas a demandas de transporte intermodal para carga o pasajeros. Las obras previstas originalmente para este subcomponente eran las siguientes:
Cat. Puerto Tipo de obra
Puerto Punta del Este Reparación Marinas 1 y 2
Puerto Punta del Este Reparación Escollera
Piriápolis Reparación muelle
1.C Colonia Escollera Santa Rita
Carmelo Escollera A. De las Vacas
La Paloma Escollera
Sistema de Mdeo. Puerto Buceo Obras varias
Sistema de Mdeo. Escollera y otras
a.1) Las obras para el Puerto de Punta del Este fueron licitadas en abril de 2007. Las dos obras fueron adjudicadas a la Empresa Constructora Santa María. El Contrato fue firmado en diciembre del mismo año, comenzando las obras en abril y junio de 2008. El avance en ambas fue muy lento por diversos temas vinculados a ajustes en el Proyecto y deterioros más importantes de los previstos . Dada una compleja situación de la Empresa para poder terminar con los trabajos, se decidió de común acuerdo la rescisión del Contrato. Con avances en las obras 1 y 2 que no llegaron al 25% y 35% respectivamente, se efectivizó el retiro de la Empresa en noviembre de 2010. a.2) Carmelo – Escollera Arroyo de las Vacas. Las obras comenzaron en abril de 2008 a cargo de la Empresa Saceem. Los trabajos se desarrollaron a buen ritmo. Se aprobó una ampliación de 24,5% del Contrato. a.3) Piriápolis – Reparación de muelle. Se realizó y llamado, realizándose la apertura de ofertas en julio de 2008. La Comisión Asesora de Adjudicaciones decidió cancelar el proceso y realizar un nuevo llamado. a.4) El resto de las obras previstas del Proyecto fueron postergadas. En La Paloma, se realizaron los trabajos de reparación del espigón con fondos propios de la DNH.

47
5.1.3 Contratos de Rehabilitación y Mantenimiento (CREMA) (Categoría 1.D.) Este componente comprendió la realización de trabajos de rehabilitación y mantenimiento por niveles de servicios en 6 tramas de redes, cubriendo unos 981 kms de rutas nacionales, por períodos de tiempo de entre 36 y 48 meses. Las Contratos originalmente previstos en el PAD se detallan a continuación:
Cat. Rutas Descripción kms Tipo
1.D 3 Tramo: Ruta 1- Aº Grande 176 Rehabilitación y mantenimiento
5 Varios tramos 184 Rehabilitación y mantenimiento
Accesos a Mdeo 85 Rehabilitación y mantenimiento
6 y 11 Malla Centro-Oeste Canelones 130 Mantenimiento
Malla Este de Canelones 140 Rehabilitación y mantenimiento
10 y otras Zona Turística (Regionales 2 y 10) 200 Mantenimiento
De estos Contratos finalmente se licitaron los tres que se detallan a continuación:
a) Crema Ruta 3: Tramo Ruta 1 – Arroyo Grande (176 kms). El contrato comprende obras de mejora y mantenimiento por niveles de servicio por un período de 36 meses. Por problemas presupuestales se traspasó a la CVU S.A., comenzando los trabajos en mayo de 2010.
b) Crema Accesos a Montevideo. Las obras en unos 85 kms de las rutas de acceso a la ciudad de Montevideo, comprenden el pavimento, areas verdes y señalización vertical y horizontal. Comenzó en marzo de 2009 por un período de 36 meses.
c) Crema Zona Turística (Regionales 2 y 10). El contrato comprendía el mantenimiento de 171 kms por un período de 24 meses. Si bien fue adjudicada en diciembre de 2010, por demoras debido un recurso de revocación presentado por una Empresa, el contrato se firmó finalmente en julio de 2011, por lo que no pudo justificar gastos con cargo al Préstamo.
Si bien del total previsto se “contrataron” por el Proyecto unos 432 kms, otros contratos se realizaron con otros financiamientos.
5.1.3.1 Programa de Mantenimiento de la DNV La DNV en cuanto su responsabilidad de una red vial nacional de unos 8783 kms utiliza desde tiempo atrás distintos instrumentos, que han reducido su participación en el mantenimiento por administración directa de la red. A modo de ejemplo el cuadro siguiente ejemplifica la situación en el año 2010.
18.11%
1.36%
59%
18.55% 2.61%
0.37%
FORMAS DE GESTIÓN DE LA RED
CVU
Concesión
DNV
Contr. Mant.
Mant. Compartidos
En obra
Formas de Gestión de la Red (Año 2010)
CVU 1591 kms 18,11%
Concesión 119 Kms 1,36%
DNV 5185 Kms 59%
Contr. Mant. 1629 Kms 18,55% Mant. Compartidos 230 Kms 2,61%
En obra 28 kms 0,37%

48
Si bien la DNV mantiene la principal responsabilidad directa en el mantenimiento, la CVU pasó a ser un importante actor, ya que administra mayormente la red primaria. A efectos de tener una referencia en la tabla AI-2 del Anexo I se ejemplifica con el parámetro de estado de confort de la red, los valores del año 2010. Pese a que presupuestalmente el quinquenio 2005 – 2009 no permitía una mejora en los parámetros, la misma mantiene un nivel mas que aceptable. Para ejemplificar, durante el período 2002 – 2010 el Tráfico Promedio Diario Anual (TPDA) tuvo un crecimiento constante que promedia mas de un 5% anual. A modo de ejemplo el siguiente cuadro toma un punto de medición en la ruta 1, en la progresiva 150km140 (zona inmediata a la doble vía ejecutada con el Proyecto),
Crecimiento periodo 2002 - 2009 en %
Periodo 02 - 03 03 - 04 04 - 05 05 - 06 06 - 07 07 - 08 08 - 09 09 - 10 Acum. Prom.
TPDA -30,29% 24,76% 9,59% 7,48% 9,89% 3,93% 6,35% 8,39% 40,09% 5,01%
Autos -31,72% 25,41% 12,33% 7,93% 9,75% 3,86% 7,19% 8,09% 42,83% 5,35%
Omnibus -1,81% 16,56% 7,89% 8,29% 13,51% 3,97% 0,38% 5,32% 54,13% 6,77%
Cam Liv -38,63% 23,96% -0,77% 2,34% 9,14% 6,74% 10,46% 12,82% 26,06% 3,26%
Cam Sem -32,88% 34,69% 3,03% 10,29% 9,33% 2,44% 8,33% 4,40% 39,64% 4,96%
Cam Pes -30,83% 36,96% 15,87% 15,07% 13,10% 0,53% -3,66% 4,89% 51,92% 6,49%
5.1.4 Mantenimiento de caminos departamentales (Categoría 1.E) Se continuó con los cometidos de los Convenios inicialmente financiados pro el Proyecto de Transporte I (Pmo. 3021 –UR) y siguientes Proyectos BIRF, pero fue objeto de sucesivas mejoras a lo largo de los años. El objetivo del programa, estipulado en los Convenios que firman cada año las Intendencias Municipales con el MTOP es de mejorar la calidad del servicio de la red departamental, afianzando la cultura del mantenimiento regular y sostenible de su red. Se realiza el mantenimiento de unos 9.000 kms por año de caminos de grava de jurisdicción municipal más las obras de arte correspondientes. El Préstamo financió los Convenios de los años 2006 y 2007. Se destaca el grado de cumplimiento del total de las 19 intendencias involucradas.
Año % de cumplimiento
2006 98%
2007 99%
2008 98,9%
2009 99,2%
2010 99,8%
La evaluación del estado de los mismos se hace a través del Sistema de Evaluación por Velocidad de Recorrido (SEVR). Se obtiene hallando la correlación existente entre el estado superficial y la velocidad. Sobre una muestra evaluada, para el año 2011 los valores indican lo siguiente:
Bueno Aceptable Malo
2011 29% 64% 8%
5.1.5 Programa de Seguridad de la Infraestructura de transporte (Cat. 1.F. y 2) El Programa consistía en la implementación de medidas de bajo costo en rutas y zonas suburbanas, como así también la adquisición e instalación de elementos de seguridad.

49
Las medidas a implementar incluían a) la iluminación de rutas de areas suburbanas, b) demarcación y señalización de rutas nacionales, c) ejecución de sendas para bicicletas/peatonales de protección y d) adquisición de señales de tránsito y defensas para rutas nacionales. El cuadro a continuación describe las obras seleccionadas. Las obras se ejecutaron con fondos propios de la DNV y otros con financiamiento de un préstamo BID, incluidas las adquisiciones, excluyéndose la financiación con cargo al Préstamo. Este componente respondió al cumplimiento de los objetivos planteados.
Cat. Descripción Tipo Monto
1.F Iluminación de R. 102 (4kM) Obras Seguridad Vial 500 Financiado DNV/BID
Iluminación de R. 101 Obras Seguridad Vial 350 Fondos propios
Construcción de refugios peatonales Obras Seguridad Vial 50 Fondos propios
Ilumin. R.5 desde Joanicó a Emp. R.11 Obras Seguridad Vial 350 Financiado DNV/BID
Sendas peatonales en R. 8 Obras Seguridad Vial 150 Fondos propios
Dem. de pavimento y colocación de tachas Obras Seguridad Vial 700 Financiado DNV/BID
Iluminación de tramos R. 6 Obras Seguridad Vial 200 Financiado DNV/BID
Sendas peatonales en Canelones Obras Seguridad Vial 100 Fondos propios
2 Defensa metálicas (flexbeam) Adquisiciones 800 Financiado DNV/BID
Adquisición de señales viales Adquisiciones 600 Financiado DNV/BID
Se mantuvo el seguimiento en el monitoreo de la muestra seleccionada en las rutas 101, 102, 5 y 6 en la zona suburbana del área metropolitana (Anexo I, Tabla de monitoreo de resultados), donde se manifestó una baja sustancial de accidentes respecto a la línea base fijada. 5.1.5 Fortalecimiento Institucional y de Gestión del Sector Transporte En el cuadro se describen los estudios seleccionados.
Cat. Descripción Tipo Estado
3 Estudio para implem. del Plan Quinquenal Consultoría
No ejecutado por el Préstamo
Actualización del SIIPLA Consultoría No ejecutado por el Préstamo
Actualiación y training del HDM-IV Consultoría No ejecutado por el Préstamo
Plan maestro para transp.urbano Mdeo. Consultoría No ejecutado por el Préstamo
Planes maestros portuarios (DNH) Consultoría y Servicios No ejecutado por el Préstamo
Estudio de demanda forestal Consultoría Entregado en feb/2007
Estudios geomorfológicos en Atlántida Servicios no consultoría Contratado marzo 2011
El estudio de Demanda Forestal, no estaba originalmente incluido en el PAD, por lo que fue solicitada su inclusión en el Proyecto (No objeción a inclusión el 19/may/2006). Se ejecutó bajo supervisión de la D.N. de Transporte, siendo entregado el mismo en febrero de 2007. Respecto a los estudios previstos, los mismos se implementaron a través de distintos mecanismos (Ver Anexo I cuadro monitoreo componente 5), aunque sin financiamiento del Banco Mundial. La implementación del Plan quinquenal 2005 – 2009 ya a principios del 2006 estaba desarrollado y aprobado. El HDM IV a partir del año 2008 totalmente operacional para el Plan de Obras 2010 – 2014. El Plan maestro para el transporte urbano de Montevideo, la DN de Transporte realizó un estudio para el área metropolitana, junto con las intendencias involucradas. Previó realizar estudios para el Sistema de transporte de cargas por carretera y de análisis de la demanda de transporte, sin efectivizarse durante el Proyecto. Respecto a los planes maestros portuarios previstos, la DNH definió no realizarlos. Presentó al Banco (noviembre de 2008) un resumen de la estrategia portuaria a cargo de la DNH, que entre sus opciones se incluía la realización de estudios geomorfológicos para definir un futuro puerto en Atlántida.

50
Los estudios geomorfológicos para un puerto en Atlántida se incluyeron en el Proyecto, efectivizándose en el año 2009, bajo la modalidad de llamado de Servicios de No Consultoría. La apertura fue en julio de 2010, firmándose el contrato en marzo de 2011, estando en ejecución al cierre del Préstamo. Durante el transcurso del Proyecto se formalizó una capacitación por parte del BM con el DIVD (Departamento de Infraestructura Vial Departamental) de la DNV, a efectos de identificar una metodología para mejorar la planificación y monitoreo de las obras de mantenimiento de los caminos rurales. Se desarrolló en el mes de mayo de 2009, quedando planteado algunas sugerencias a efectos de la mejora en la colecta y procesamiento de datos. Posteriormente, no se avanzó más en la elaboración o en el llamado a Consultor para plasmar un modelo mas avanzado. 5.2 Procesos de Adquisiciones Las adquisiciones que se llevaron a cabo durante el Proyecto se llevaron a cabo de acuerdo a lo establecido en el Anexo 4 del Contrato de Préstamo. Se utilizaron los Documentos Estándar del Banco para la Contratación de Obras en su versión del año 2004. Fueron sometidos a Revisión Previa (Prior review) las obras cuyos presupuestos estimados superaban los U$S 4:000.000. Esto implicó cinco Licitaciones Públicas Internacionales de obras y una de Servicio de No Consultoría. Igualmente se sometió a Revisión Previa a las 3 primeras licitaciones (de las incluídas en la Enmienda) A partir del año 2008 se ingresaron en el Sistema SEPA del Banco Mundial, los datos sobre las adquisiciones y a través del Client Connection se realizaron las publicaciones en el Development Bussines. Se adjunta un cuadro resumen de los procesos licitatorios de las obras que formaron parte del Proyecto, aunque se destaca que algunas de ellas no recibió financiamiento del mismo.
PROCESOS LICITATORIOS
Montos en U$S
Ruta Descripción
COMPONENTE DNV Tipo
Fecha de Apertura
Duración (meses)
Nº de Ofertas
Monto Estimado
Monto Adjudicado
% Varación
18 Río Tacuarí - Cañada Santos LPI 07/02/2008 14 3 12.000 13.800 13%
13 Ruta 8 (150km500 ) - Aiguá (172km000) LPN 09/08/2011 8 10 3.300 2.868 -13%
COMPONENTE CVU
1 Tramo Ruta 2-Ruta 22 LPI 04/10/2006 18 5 17.600 19.770 12,3%
5 PUENTE Bañado de Rocha LPN 26/11/1999 8 5 (a)
3 PUENTE s/Aª Grande LPN (a) 09/10/2003 18 4 2.160 1.036 -48,0%
11 San José-Villa Rodríguez LPI (a) 15/09/2003 18 7 (a)
11 Ecilda Paullier-J. Soler LPI (a) 01/09/2003 15 9 (a)
5 Aª Curticeiras LPN (a) 26/11/1999 5 4 (a)
8 Aª Pirarajá-235 km LPN (a) 13/07/2004 10 5 2.404 2.834 17,9%
8 Cebollatí-Pirarajá LPN (a) 13/07/2004 10 5 2.807 3.281 16,8%
11 Pte. s/AªDescarnado y Pedrera LPN (b) 06/06/2007 24 1 405 453 10,4%
8 Aª Sarandí LPN (b) 06/06/2007 15 1 1.069 1.280 19,7%
COMPONENTE DNH
Puerto Punta del Este LPN 26/04/2007 11 3 2.500 2.410 -4%
Puerto Punta del Este LPN 26/04/2007 11 4 2.100 700 -67%
Carmelo LPN 13/07/2007 18 3 3.300 3.400 3%
Piriapolis LPN (b) 22/07/2008 18 1 2.000 Lid. Anulada
COMP. CONTRATOS CREMA
3 Ruta 3 - Tramo: Ruta 1- Aº Grande LPI 07/04/2008 36 3 10.900 12.345 13%
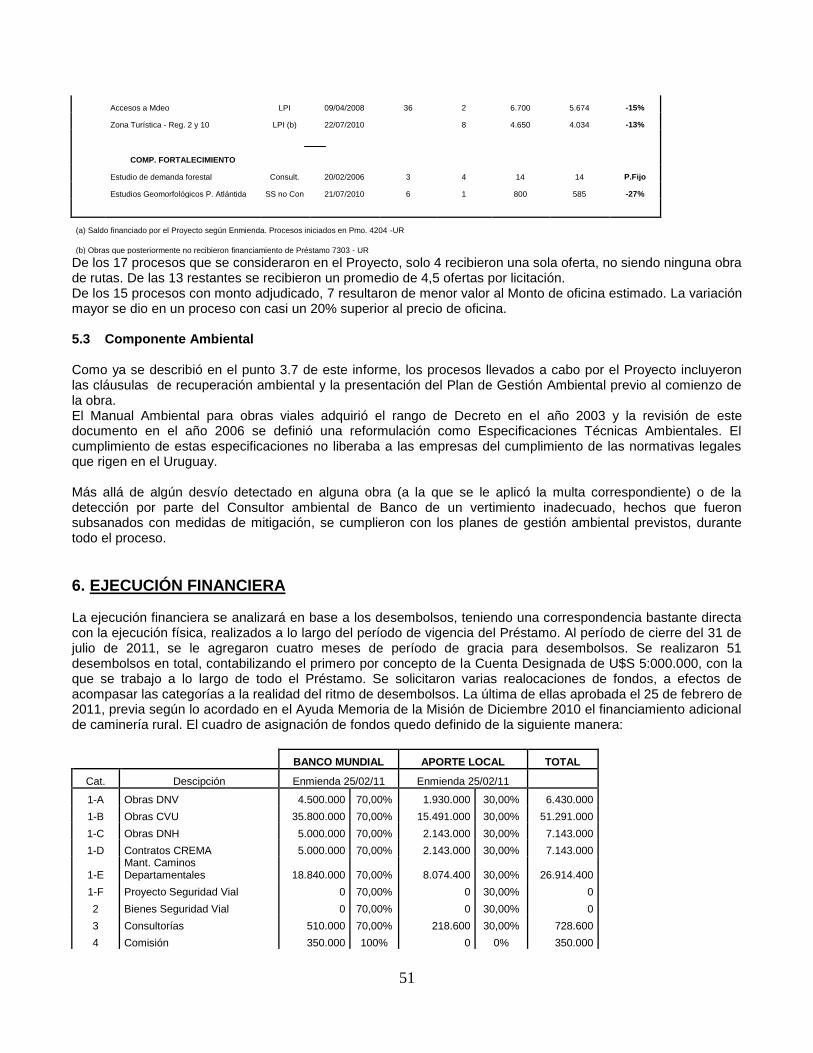
51
Accesos a Mdeo LPI 09/04/2008 36 2 6.700 5.674 -15%
Zona Turística - Reg. 2 y 10 LPI (b) 22/07/2010 8 4.650 4.034 -13%
COMP. FORTALECIMIENTO
Estudio de demanda forestal Consult. 20/02/2006 3 4 14 14 P.Fijo
Estudios Geomorfológicos P. Atlántida SS no Con 21/07/2010 6 1 800 585 -27%
(a) Saldo financiado por el Proyecto según Enmienda. Procesos iniciados en Pmo. 4204 -UR
(b) Obras que posteriormente no recibieron financiamiento de Préstamo 7303 - UR De los 17 procesos que se consideraron en el Proyecto, solo 4 recibieron una sola oferta, no siendo ninguna obra de rutas. De las 13 restantes se recibieron un promedio de 4,5 ofertas por licitación. De los 15 procesos con monto adjudicado, 7 resultaron de menor valor al Monto de oficina estimado. La variación mayor se dio en un proceso con casi un 20% superior al precio de oficina. 5.3 Componente Ambiental Como ya se describió en el punto 3.7 de este informe, los procesos llevados a cabo por el Proyecto incluyeron las cláusulas de recuperación ambiental y la presentación del Plan de Gestión Ambiental previo al comienzo de la obra. El Manual Ambiental para obras viales adquirió el rango de Decreto en el año 2003 y la revisión de este documento en el año 2006 se definió una reformulación como Especificaciones Técnicas Ambientales. El cumplimiento de estas especificaciones no liberaba a las empresas del cumplimiento de las normativas legales que rigen en el Uruguay. Más allá de algún desvío detectado en alguna obra (a la que se le aplicó la multa correspondiente) o de la detección por parte del Consultor ambiental de Banco de un vertimiento inadecuado, hechos que fueron subsanados con medidas de mitigación, se cumplieron con los planes de gestión ambiental previstos, durante todo el proceso.
6. EJECUCIÓN FINANCIERA La ejecución financiera se analizará en base a los desembolsos, teniendo una correspondencia bastante directa con la ejecución física, realizados a lo largo del período de vigencia del Préstamo. Al período de cierre del 31 de julio de 2011, se le agregaron cuatro meses de período de gracia para desembolsos. Se realizaron 51 desembolsos en total, contabilizando el primero por concepto de la Cuenta Designada de U$S 5:000.000, con la que se trabajo a lo largo de todo el Préstamo. Se solicitaron varias realocaciones de fondos, a efectos de acompasar las categorías a la realidad del ritmo de desembolsos. La última de ellas aprobada el 25 de febrero de 2011, previa según lo acordado en el Ayuda Memoria de la Misión de Diciembre 2010 el financiamiento adicional de caminería rural. El cuadro de asignación de fondos quedo definido de la siguiente manera:
BANCO MUNDIAL APORTE LOCAL TOTAL
Cat. Descipción Enmienda 25/02/11 Enmienda 25/02/11
1-A Obras DNV 4.500.000 70,00% 1.930.000 30,00% 6.430.000
1-B Obras CVU 35.800.000 70,00% 15.491.000 30,00% 51.291.000
1-C Obras DNH 5.000.000 70,00% 2.143.000 30,00% 7.143.000
1-D Contratos CREMA 5.000.000 70,00% 2.143.000 30,00% 7.143.000
1-E Mant. Caminos Departamentales 18.840.000 70,00% 8.074.400 30,00% 26.914.400
1-F Proyecto Seguridad Vial 0 70,00% 0 30,00% 0
2 Bienes Seguridad Vial 0 70,00% 0 30,00% 0
3 Consultorías 510.000 70,00% 218.600 30,00% 728.600
4 Comisión 350.000 100% 0 0% 350.000
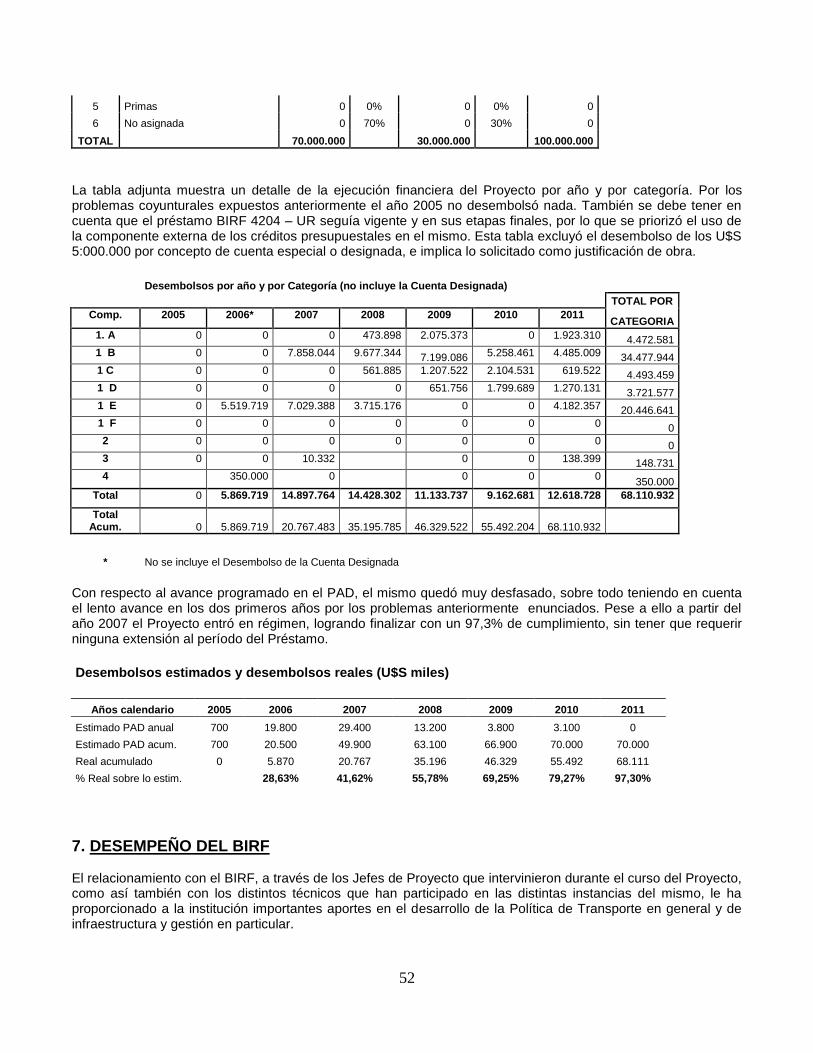
52
5 Primas 0 0% 0 0% 0
6 No asignada 0 70% 0 30% 0
TOTAL 70.000.000 30.000.000 100.000.000
La tabla adjunta muestra un detalle de la ejecución financiera del Proyecto por año y por categoría. Por los problemas coyunturales expuestos anteriormente el año 2005 no desembolsó nada. También se debe tener en cuenta que el préstamo BIRF 4204 – UR seguía vigente y en sus etapas finales, por lo que se priorizó el uso de la componente externa de los créditos presupuestales en el mismo. Esta tabla excluyó el desembolso de los U$S 5:000.000 por concepto de cuenta especial o designada, e implica lo solicitado como justificación de obra.
Desembolsos por año y por Categoría (no incluye la Cuenta Designada)
TOTAL POR
Comp. 2005 2006* 2007 2008 2009 2010 2011 CATEGORIA
1. A 0 0 0 473.898 2.075.373 0 1.923.310 4.472.581
1 B 0 0 7.858.044 9.677.344 7.199.086 5.258.461 4.485.009 34.477.944
1 C 0 0 0 561.885 1.207.522 2.104.531 619.522 4.493.459
1 D 0 0 0 0 651.756 1.799.689 1.270.131 3.721.577
1 E 0 5.519.719 7.029.388 3.715.176 0 0 4.182.357 20.446.641
1 F 0 0 0 0 0 0 0 0
2 0 0 0 0 0 0 0 0
3 0 0 10.332 0 0 138.399 148.731
4 350.000 0 0 0 0 350.000
Total 0 5.869.719 14.897.764 14.428.302 11.133.737 9.162.681 12.618.728 68.110.932
Total Acum. 0 5.869.719 20.767.483 35.195.785 46.329.522 55.492.204 68.110.932
* No se incluye el Desembolso de la Cuenta Designada
Con respecto al avance programado en el PAD, el mismo quedó muy desfasado, sobre todo teniendo en cuenta el lento avance en los dos primeros años por los problemas anteriormente enunciados. Pese a ello a partir del año 2007 el Proyecto entró en régimen, logrando finalizar con un 97,3% de cumplimiento, sin tener que requerir ninguna extensión al período del Préstamo.
Desembolsos estimados y desembolsos reales (U$S miles)
Años calendario 2005 2006 2007 2008 2009 2010 2011
Estimado PAD anual 700 19.800 29.400 13.200 3.800 3.100 0
Estimado PAD acum. 700 20.500 49.900 63.100 66.900 70.000 70.000
Real acumulado 0 5.870 20.767 35.196 46.329 55.492 68.111
% Real sobre lo estim. 28,63% 41,62% 55,78% 69,25% 79,27% 97,30%
7. DESEMPEÑO DEL BIRF El relacionamiento con el BIRF, a través de los Jefes de Proyecto que intervinieron durante el curso del Proyecto, como así también con los distintos técnicos que han participado en las distintas instancias del mismo, le ha proporcionado a la institución importantes aportes en el desarrollo de la Política de Transporte en general y de infraestructura y gestión en particular.

53
El BIRF siempre ha participado aportando su experiencia a la hora de subsanar ajustes o adaptaciones a los cambios de escenarios que se plantearon. Luego de un comienzo lento del Proyecto y de una cierta demora en aprobar la primera Enmienda modificatoria, posteriormente ha demostrado una gran receptividad y flexibilidad, sobre todo, en aquellos momentos en que se le requirieron cambios o ajustes en diferentes componentes del Proyecto a efectos del logro de los objetivos establecidos en el mismo. En todas las etapas del proyecto, desde la identificación y preparación, la confección del PAD y la supervisión realizada al mismo, la gestión del BIRF ha sido sumamente satisfactoria, y ha resultados un gran apoyo a la gestión. Durante la preparación y ejecución del proyecto, se realizó 1 Misión de evaluación, 1 de Preparación, 1 de Pre-evaluación, 1 Misión técnica hacia la evaluación y 11 misiones de Supervisión, todas ellas integradas por técnicos altamente calificados, lo que junto con la decisión del gobierno de priorizar las obras incluidas en el proyecto, colaboró en el éxito final del mismo. Se destaca la concurrencia de un especialista a efectos de colaborar en la concreción de una metodología para la caminería rural, de un especialista ambiental a efectos de evaluar la inclusión de la obra del Anillo Colector perimetral y el dictado de cursos de capacitación y actualización en gestión financiera, adquisiciones, clientconnection y SEPA. La representación en Montevideo, resultó de gran apoyo, a través de sus dos representantes y de su staff permanente, como soporte o intermediación y de uso de sus instalaciones principalmente para las videoconferencias.
8. DESEMPEÑO DEL PRESTATARIO Durante el período de vigencia del Préstamo (14 de julio de 2005 – 31 de julio de 2011), el mismo tuvo algunas variaciones, aunque se puede resumir en que luego de un comienzo muy lento o postergado, mantuvo un ritmo parejo, que llevo a su finalización en la fecha prevista, cancelando solo una porción muy pequeña (menor al 3%). El arrastre de la ejecución de las obras viales de ejercicios anteriores, imposibilitó el comienzo de las obras previstas de en el PAD. Asimismo esta postergación llevó a un cambio en las prioridades. Por ese motivo se solicitó una Enmienda al Contrato de Préstamo en la cual se incluían obras con los procesos indiciados o en ejecución en detrimento de la gran mayoría de las obras incluidas originalmente. La solicitud de Enmienda realizada en agosto de 2006, fue aprobada por el Banco en marzo de 2007. El incremento de los costos de las obras viales debido entre otros factores a los efectos post crisis del 2002 – 2003, al aumento de la demanda y a la baja del dólar, influyeron en que se pudieran ejecutar menos obras que las previstas. La DNH venía de un período de muy poca actividad, por lo que la preparación de los proyectos le demandó un poco mas de tiempo de lo previsto y debió contratar la preparación de los temas ambientales y de los pliegos. Una vez superado esto, pudo realizar los llamados para 4 de las obras previstas. El ritmo del Proyecto se pudo ir adaptando a los topes presupuestales del Ministerio, logrando cumplir los objetivos previstos. Durante el transcurso del Proyecto se efectuó por primera vez un Manual Operativo del mismo, como así también un Documento Marco para las expropiaciones y reasentamientos. Paralelamente se analizaron los casos en que se requerían expropiaciones en 3 obras específicas, los cuales no generaron conflictos con respecto al comienzo de las obras. En el caso concreto de la doble vía de Ruta 1, que incluía la expropiación de algunas construcciones, para el 2008 todas estaban escrituradas a favor del estado, salvo un caso por tener problemas formales con la titulación del bien. Los proceso licitatorios que se realizaron, fueron acorde a las normas del Banco, como así también la gestión financiera y la aplicación de las normas en materia ambiental y de reasentamientos. Se utilizó el sistema de Client Connection como herramienta de consulta, de publicación y de formularios.

54
Se presentaron todos los Informes Semestrales de avance del Proyecto y los informes anuales de Auditoria de los estados financieros y los de Indicadores de monitoreo de resultados. La UCP cumplió su función coordinadora y responsable en el intercambio de información y relacionamiento con el Banco, así como internamente en las diversas entidades involucradas en el Proyecto.
9. EVALUACIÓN DE LOS RESULTADOS El Proyecto pudo ser ejecutado en el plazo original del Contrato, con solo un pequeño saldo sin utilizar del monto total. De no haber surgido algunos imponderables en algunas obras, se hubiera cumplido en su totalidad. El Proyecto se supo adaptar a las condicionantes que fueron surgiendo en el transcurso de mismo, fundamentalmente al comienzo, donde se realizó la reestructura mas importante. La política del país en cuanto a la prioridad en incrementar la eficiencia y competitividad del sector transporte, se mantuvo a través de las dos administraciones durante las cuales transcurrió el Proyecto. Esto quedó plasmado tanto en el documento CAS para el período 2005 – 2010, manteniéndose en el Reporte de Progreso de marzo de 2008. El nuevo reporte de Estrategia Alianza con el País (EAP) para el período 2010 - 2015, no solo mantiene el concepto, sino que lo amplía a toda la infraestructura vinculada con todo el sector logístico, destacando el desarrollo de la actividad ferroviaria. Ciertas limitaciones presupuestales del año 2009, transfirieron la ejecución de algunas obras a la categoría CVU, pero sin afectar el monto o a la obra en sí.
La no ejecución del componente de Seguridad vial y el poco uso del componente de consultorías, no afectaron
los objetivos del Proyecto. La ejecución fue adaptada a las capacidades y requerimientos de la DNV y DNH.

55
Annex 8. Comments of Cofinanciers and Other Partners/Stakeholders
There were no cofinanciers and other partners.

56
Annex 9. List of Supporting Documents
1. Project Concept Note, August 2004
2. Project Appraisal Document, April 2005
3. First restructuring Project Paper, February 2007
4. Reallocation of loan proceeds, January 2008
5. Reallocation of loan proceeds, October 2008
6. Second restructuring Project Paper, February 2011

Sub-component B
Sub-component
A
Sub-component
A
B
BB
BB
B
B
B
B
B
B
B
B
AIRPORTS
PORTS
MAIN ROADS
SECONDARY ROADS
RAILROADS
RIVERS
DEPARTMENT BOUNDARIES
INTERNATIONAL BOUNDARIES
B
BB
B
B
San Joséde Mayo
Colonia delSacramento
Mercedes
FrayBentos
Paysandú
Salto
Artigas
Rivera
Tacuarembó
Melo
Durazno
Trinidad
Florida
Minas
MONTEVIDEO
Ombues deLavalle
Soriano
Dolores
Nueva Palmira
Carmelo
José E. Rodo
F.Sanchez
Tarariras Rosario
NuevaHelvecia
E.Paullier
Libertad
Santa Lucia
25 de Mayo
Las PiedrasPando
Atlantida
Sauce
Santa RosaSan Jacinto
Montes
TalaSan
Ramon
FrayMarcos
Casupa
A.Gallinal
Solis de MataojoSoca
Piriápolis
Pan deAzucar
Punta del Este
MaldonadoSan Carlos
Rocha
La Paloma
Aigua
MariscalaVelazquez
Castillos
Lascano
José P. Varela
Cebollatí
Chuy
LaCoronilla
Vergara
Río Branco
Aceguá
Fraile Muerto
Vichadero
Minas de Corrales
Ansina
TupambaeSanta Clarade Olimar
SanGregorio de
Polanco
LaPaloma
Pueblo del Carmen
Sarandí del Yí
Paso deLos Toros
Nuevo Berlin
San Javier
Young
Quebracho
Constitución
Belén
B. Brum
Bella Unión
Tranqueras
Canelones
Treinta y Très
Jaun ILacaze
A R T I G A S
S A L T O
P A Y S A N D U
R I O N E G R O
SORIANO
COLONIA SAN JOSE
F L O R E SF L O R I D A
CANELONES
MONTEVIDEO
L A V A L L E J A
MALDONADO
R O C H A
T R E I N T A Y T R E S
C E R R O L A R G O
R I V E R A
T A C U A R E M B O
D U R A Z N O
Rio NegroReservoir
Negro
Tacuarembo
Cuareim
Arapey
Dayman
Grande
Queguay
Negro
Uruguay
SanJosé
Sant
a Lu
cia
MerínLagoon
AT L A N T I C
O C E A NA T L A N T I C O C E A N
R í od e l a
P l a t a
3
3
5
5
26
26 8
8
26
14
8
14
14
14
14
3
3
2
2
5
5
3
1
1
11
11 8
9
9
COMPONENT 1: ROAD REHABILITATION AND BRIDGE RESTORATION
SUB-COMPONENT A: ROAD SECTIONS OUTSIDE THE MEGACONCESSION
SUB-COMPONENT B: ROAD SECTIONS WITHIN THE MEGACONCESSION
SUB-COMPONENT B: BRIDGE RESTORATION
COMPONENT 2: CREMA SUB-NETWORKS
This map was produced by theMap Design Unit of The World Bank.The boundaries, colors, denominationsand any other information shown onthis map do not imply, on the part ofThe World Bank Group, any judgmenton the legal status of any territory, orany endorsement or acceptance ofsuch boundaries.
IBRD 33861
MARCH 2005
ARGENTINA
B R A Z I L
PARAGUAY
BOLIVIA
CHILE
URUGUAY
Montevideo
AR
GE
NT
IN
A
U R U G U A Y
TRANSPORT INFRASTRUCTURE MAINTENANCEAND RURAL ACCESS PROJECT
58° 57° 56° 55° 54° 53°
31°
32°
33°
34°
53°
35°
54°55°56°57°58°
35°
34°
33°
32°
31°
0 10 20 30 40 50
KILOMETERS
B
R
A
ZI
L
B