World Bank Documentdocuments.worldbank.org/curated/pt/986051468151774268/pdf/793… · For...
27
Health Financing Revenue Composition Fiscal Context Macroeconomic Environment MACRO-FISCAL CONTEXT AND HEALTH FINANCING FACT SHEETS SOUTH ASIA How Much Can a Country Spend on Health? Public Disclosure Authorized Public Disclosure Authorized Public Disclosure Authorized Public Disclosure Authorized Public Disclosure Authorized Public Disclosure Authorized Public Disclosure Authorized Public Disclosure Authorized
Transcript of World Bank Documentdocuments.worldbank.org/curated/pt/986051468151774268/pdf/793… · For...
Health Financing
Revenue Composition
Fiscal Context
Macroeconomic Environment
MACRO-FISCAL CONTEXT AND HEALTH FINANCING FACT SHEETS
SOUTH ASIA
How Much Can a Country Spend on Health?
Pub
lic D
iscl
osur
e A
utho
rized
Pub
lic D
iscl
osur
e A
utho
rized
Pub
lic D
iscl
osur
e A
utho
rized
Pub
lic D
iscl
osur
e A
utho
rized
Pub
lic D
iscl
osur
e A
utho
rized
Pub
lic D
iscl
osur
e A
utho
rized
Pub
lic D
iscl
osur
e A
utho
rized
Pub
lic D
iscl
osur
e A
utho
rized
WB456286
Typewritten Text
79349


ACKNOWLEDGEMENTS
These factsheets are produced by a task team consisting of Rafael Cortez (Task Team Leader, Sr. Economist, HDNHE), Aakanksha Pande (Young Professional, Health Specialist, MNSHH), Patrick Eozenou (Young Professional, Economist, HDNHE), Adam Leive (Consultant), Marc Smitz (Consultant), and Ece Ozcelik (Consultant), under the overall supervision of Armin Fidler (Acting Sector Manager, HDNHE) and Nicole Klingen (Acting Director, HDNHE). The task team is grateful for inputs from Jack Langenbrunner, Ajay Tandon, Robert Gilingham, George Schieber, Edit Velenyi, and Cheryl Cashin. The financial contribution of the Rockefeller Foundation Trust Fund is gratefully acknowledged.

ABOUT THE MACRO-FISCAL CONTEXT AND HEALTH FINANCING FACT SHEETS
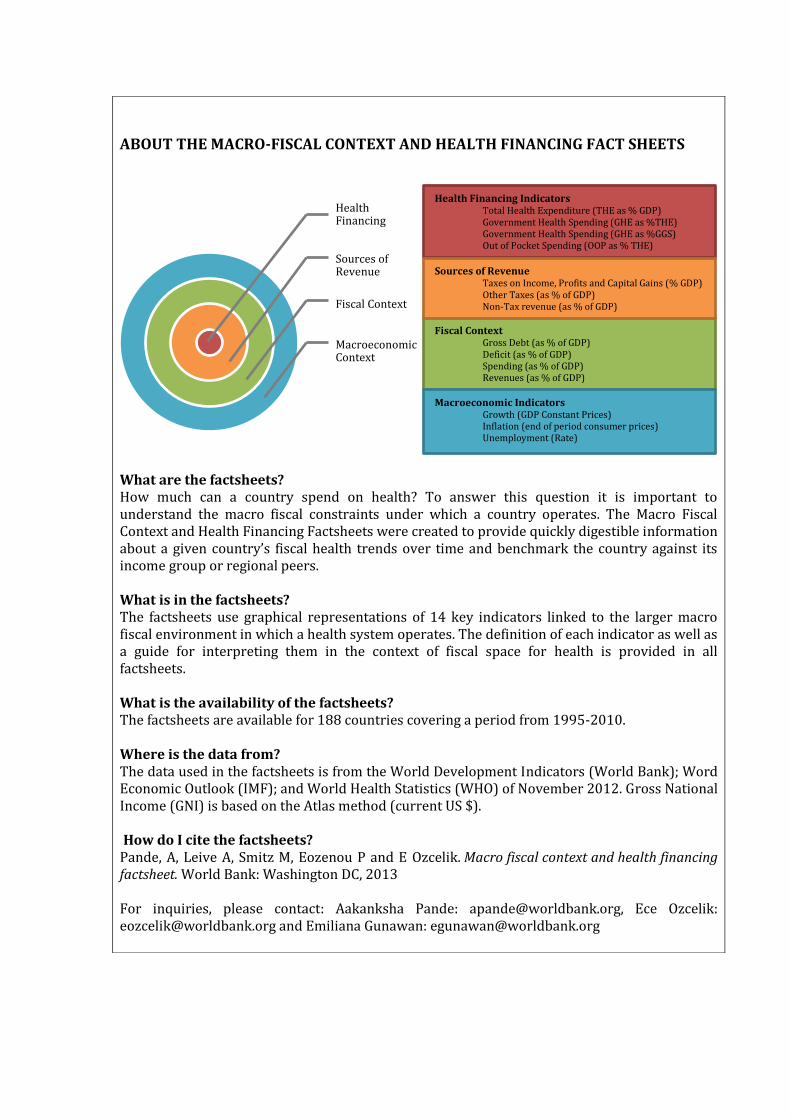
What are the factsheets? How much can a country spend on health? To answer this question it is important to understand the macro fiscal constraints under which a country operates. The Macro Fiscal Context and Health Financing Factsheets were created to provide quickly digestible information about a given country’s fiscal health trends over time and benchmark the country against its income group or regional peers. What is in the factsheets? The factsheets use graphical representations of 14 key indicators linked to the larger macro fiscal environment in which a health system operates. The definition of each indicator as well as a guide for interpreting them in the context of fiscal space for health is provided in all factsheets. What is the availability of the factsheets? The factsheets are available for 188 countries covering a period from 1995-2010. Where is the data from? The data used in the factsheets is from the World Development Indicators (World Bank); Word Economic Outlook (IMF); and World Health Statistics (WHO) of November 2012. Gross National Income (GNI) is based on the Atlas method (current US $). How do I cite the factsheets? Pande, A, Leive A, Smitz M, Eozenou P and E Ozcelik. Macro fiscal context and health financing factsheet. World Bank: Washington DC, 2013 For inquiries, please contact: Aakanksha Pande: [email protected], Ece Ozcelik: [email protected] and Emiliana Gunawan: [email protected]
Health Financing
Sources of Revenue
Fiscal Context
Macroeconomic Context
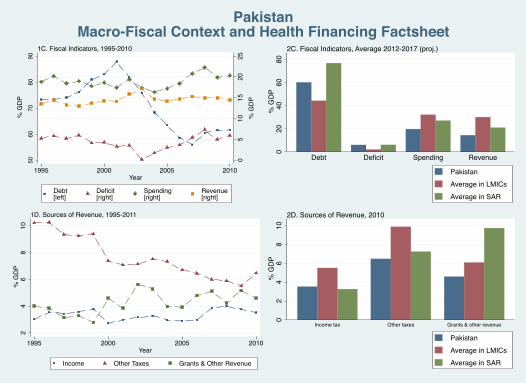
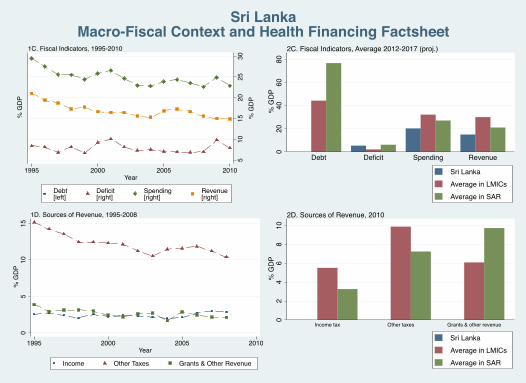
Fiscal Context Gross Debt (as % of GDP) Deficit (as % of GDP) Spending (as % of GDP) Revenues (as % of GDP)
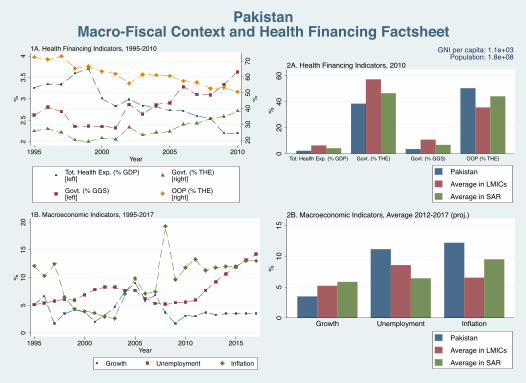
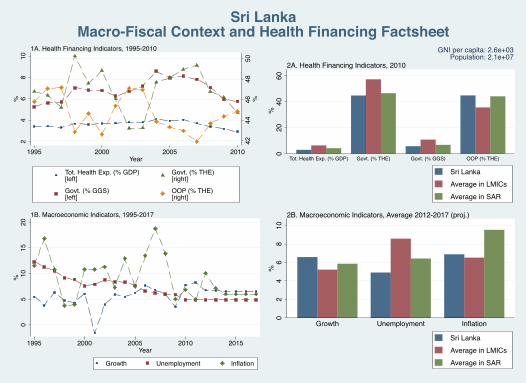
Health Financing Indicators Total Health Expenditure (THE as % GDP) Government Health Spending (GHE as %THE) Government Health Spending (GHE as %GGS) Out of Pocket Spending (OOP as % THE)
Macroeconomic Indicators Growth (GDP Constant Prices) Inflation (end of period consumer prices)
Unemployment (Rate)
Sources of Revenue Taxes on Income, Profits and Capital Gains (% GDP) Other Taxes (as % of GDP) Non-Tax revenue (as % of GDP)


List of Countries
AFGHANISTAN .......................................................................................................................................... 1
BANGLADESH ............................................................................................................................................ 2
BHUTAN ...................................................................................................................................................... 3
INDIA ............................................................................................................................................................ 4
MALDIVES ................................................................................................................................................... 5
NEPAL .......................................................................................................................................................... 6
PAKISTAN ................................................................................................................................................... 7
SRI LANKA .................................................................................................................................................. 8

020
4060
8010
0 %
02
46
8 %
1995 2000 2005 2010Year
Tot. Health Exp. (% GDP)[left]Govt. (% GGS)[left]
Govt. (% THE)[right]OOP (% THE)[right]
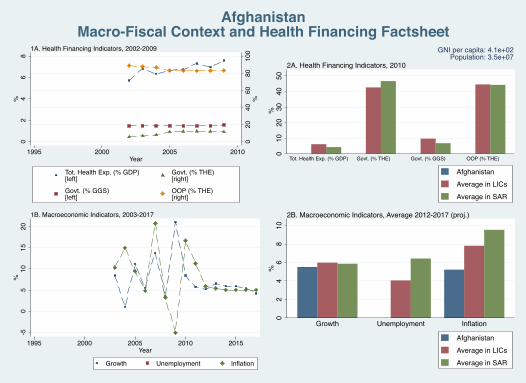
1A. Health Financing Indicators, 2002-2009
010
2030
4050
%
Tot. Health Exp. (% GDP) Govt. (% THE) Govt. (% GGS) OOP (% THE)
2A. Health Financing Indicators, 2010
GNI per capita: 4.1e+02Population: 3.5e+07
AfghanistanAverage in LICsAverage in SAR
-50
510
1520
%
1995 2000 2005 2010 2015Year
Growth Unemployment Inflation
1B. Macroeconomic Indicators, 2003-2017
02
46
810
%
Growth Unemployment Inflation
2B. Macroeconomic Indicators, Average 2012-2017 (proj.)
AfghanistanAverage in LICsAverage in SAR
AfghanistanMacro-Fiscal Context and Health Financing Factsheet
05
1015
20 %
GDP
% G
DP
1995 2000 2005 2010Year
Debt[left]
Deficit[right]
Spending[right]
Revenue[right]
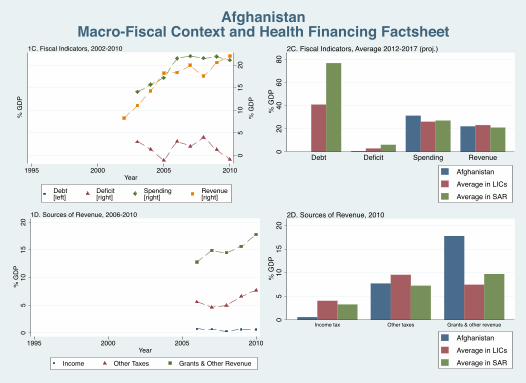
1C. Fiscal Indicators, 2002-2010
020
4060
80 %
GDP
Debt Deficit Spending Revenue
2C. Fiscal Indicators, Average 2012-2017 (proj.)
AfghanistanAverage in LICsAverage in SAR
05
1015
20 %
GDP
1995 2000 2005 2010Year
Income Other Taxes Grants & Other Revenue
1D. Sources of Revenue, 2006-2010
05
1015
20 %
GDP
Income tax Other taxes Grants & other revenue
2D. Sources of Revenue, 2010
AfghanistanAverage in LICsAverage in SAR
AfghanistanMacro-Fiscal Context and Health Financing Factsheet
3040
5060
70 %
24
68
10 %
1995 2000 2005 2010Year
Tot. Health Exp. (% GDP)[left]Govt. (% GGS)[left]
Govt. (% THE)[right]OOP (% THE)[right]
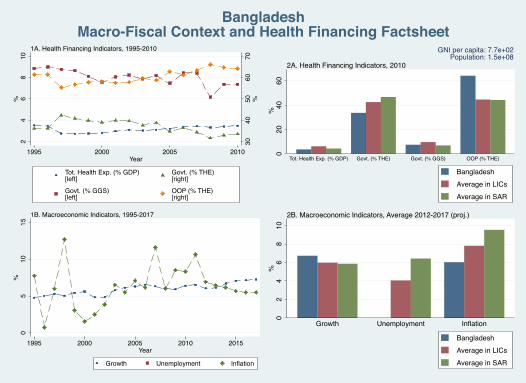
1A. Health Financing Indicators, 1995-2010
020
4060
%
Tot. Health Exp. (% GDP) Govt. (% THE) Govt. (% GGS) OOP (% THE)
2A. Health Financing Indicators, 2010
GNI per capita: 7.7e+02Population: 1.5e+08
BangladeshAverage in LICsAverage in SAR
05
1015
%
1995 2000 2005 2010 2015Year
Growth Unemployment Inflation
1B. Macroeconomic Indicators, 1995-2017
02
46
810
%
Growth Unemployment Inflation
2B. Macroeconomic Indicators, Average 2012-2017 (proj.)
BangladeshAverage in LICsAverage in SAR
BangladeshMacro-Fiscal Context and Health Financing Factsheet
05
1015
% G
DP
% G
DP
1995 2000 2005 2010Year
Debt[left]
Deficit[right]
Spending[right]
Revenue[right]
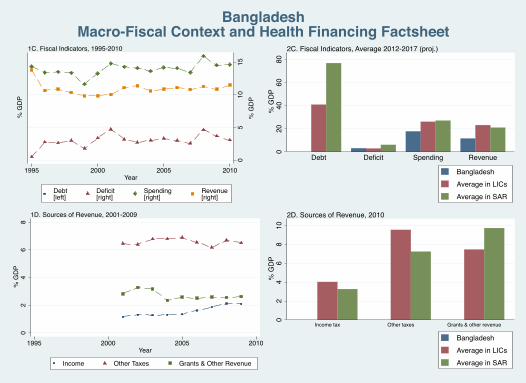
1C. Fiscal Indicators, 1995-2010
020
4060
80 %
GDP
Debt Deficit Spending Revenue
2C. Fiscal Indicators, Average 2012-2017 (proj.)
BangladeshAverage in LICsAverage in SAR
02
46
8 %
GDP
1995 2000 2005 2010Year
Income Other Taxes Grants & Other Revenue
1D. Sources of Revenue, 2001-2009
02
46
810
% G
DP
Income tax Other taxes Grants & other revenue
2D. Sources of Revenue, 2010
BangladeshAverage in LICsAverage in SAR
BangladeshMacro-Fiscal Context and Health Financing Factsheet
2040
6080
100
%
05
1015
20 %
1995 2000 2005 2010Year
Tot. Health Exp. (% GDP)[left]Govt. (% GGS)[left]
Govt. (% THE)[right]OOP (% THE)[right]
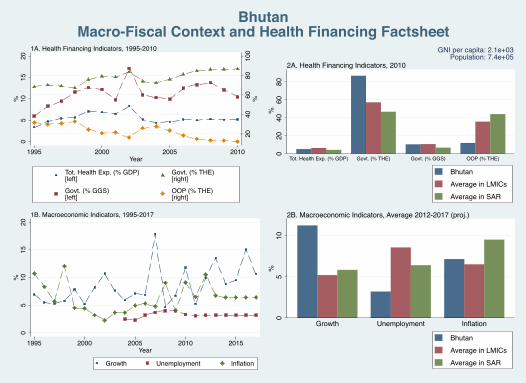
1A. Health Financing Indicators, 1995-2010
020
4060
80 %
Tot. Health Exp. (% GDP) Govt. (% THE) Govt. (% GGS) OOP (% THE)
2A. Health Financing Indicators, 2010
GNI per capita: 2.1e+03Population: 7.4e+05
BhutanAverage in LMICsAverage in SAR
05
1015
20 %
1995 2000 2005 2010 2015Year
Growth Unemployment Inflation
1B. Macroeconomic Indicators, 1995-2017
05
10 %
Growth Unemployment Inflation
2B. Macroeconomic Indicators, Average 2012-2017 (proj.)
BhutanAverage in LMICsAverage in SAR
BhutanMacro-Fiscal Context and Health Financing Factsheet
010
2030
4050
% G
DP
2040
6080
% G
DP
1995 2000 2005 2010Year
Debt[left]
Deficit[right]
Spending[right]
Revenue[right]
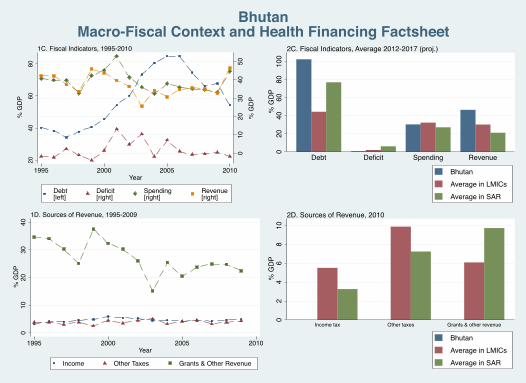
1C. Fiscal Indicators, 1995-2010
020
4060
8010
0 %
GDP
Debt Deficit Spending Revenue
2C. Fiscal Indicators, Average 2012-2017 (proj.)
BhutanAverage in LMICsAverage in SAR
010
2030
40 %
GDP
1995 2000 2005 2010Year
Income Other Taxes Grants & Other Revenue
1D. Sources of Revenue, 1995-2009
02
46
810
% G
DP
Income tax Other taxes Grants & other revenue
2D. Sources of Revenue, 2010
BhutanAverage in LMICsAverage in SAR
BhutanMacro-Fiscal Context and Health Financing Factsheet
2030
4050
6070
%
33.
54
4.5
5 %
1995 2000 2005 2010Year
Tot. Health Exp. (% GDP)[left]Govt. (% GGS)[left]
Govt. (% THE)[right]OOP (% THE)[right]
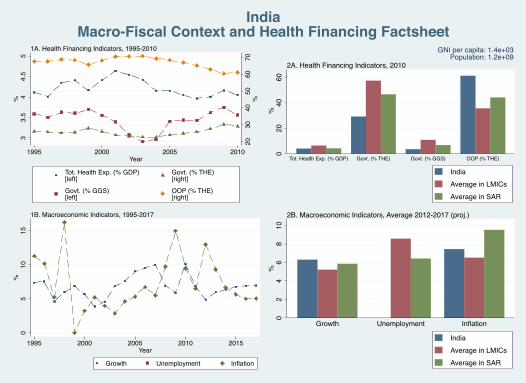
1A. Health Financing Indicators, 1995-2010
020
4060
%
Tot. Health Exp. (% GDP) Govt. (% THE) Govt. (% GGS) OOP (% THE)
2A. Health Financing Indicators, 2010
GNI per capita: 1.4e+03Population: 1.2e+09
IndiaAverage in LMICsAverage in SAR
05
1015
%
1995 2000 2005 2010 2015Year
Growth Unemployment Inflation
1B. Macroeconomic Indicators, 1995-2017
02
46
810
%
Growth Unemployment Inflation
2B. Macroeconomic Indicators, Average 2012-2017 (proj.)
IndiaAverage in LMICsAverage in SAR
IndiaMacro-Fiscal Context and Health Financing Factsheet
510
1520
2530
% G
DP
6570
7580
85 %
GDP
1995 2000 2005 2010Year
Debt[left]
Deficit[right]
Spending[right]
Revenue[right]
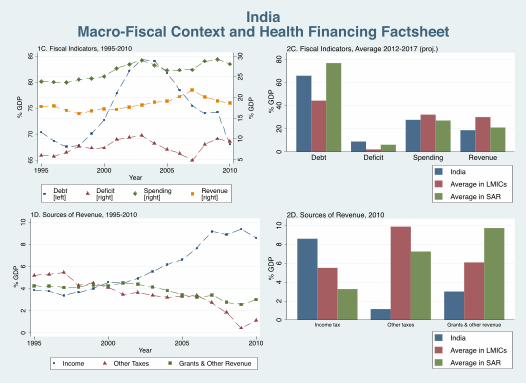
1C. Fiscal Indicators, 1995-2010
020
4060
80 %
GDP
Debt Deficit Spending Revenue
2C. Fiscal Indicators, Average 2012-2017 (proj.)
IndiaAverage in LMICsAverage in SAR
02
46
810
% G
DP
1995 2000 2005 2010Year
Income Other Taxes Grants & Other Revenue
1D. Sources of Revenue, 1995-2010
02
46
810
% G
DP
Income tax Other taxes Grants & other revenue
2D. Sources of Revenue, 2010
IndiaAverage in LMICsAverage in SAR
IndiaMacro-Fiscal Context and Health Financing Factsheet
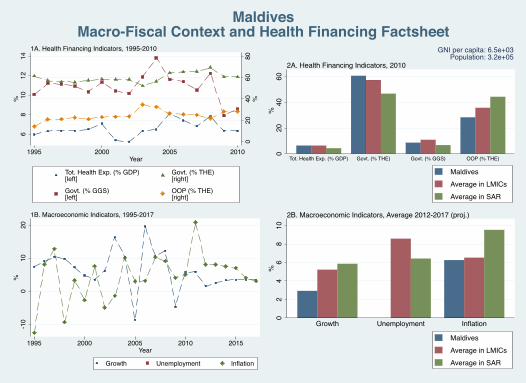
020
4060
80 %
68
1012
14 %
1995 2000 2005 2010Year
Tot. Health Exp. (% GDP)[left]Govt. (% GGS)[left]
Govt. (% THE)[right]OOP (% THE)[right]
1A. Health Financing Indicators, 1995-2010
020
4060
%
Tot. Health Exp. (% GDP) Govt. (% THE) Govt. (% GGS) OOP (% THE)
2A. Health Financing Indicators, 2010
GNI per capita: 6.5e+03Population: 3.2e+05
MaldivesAverage in LMICsAverage in SAR
-10
010
20 %
1995 2000 2005 2010 2015Year
Growth Unemployment Inflation
1B. Macroeconomic Indicators, 1995-2017
02
46
810
%
Growth Unemployment Inflation
2B. Macroeconomic Indicators, Average 2012-2017 (proj.)
MaldivesAverage in LMICsAverage in SAR
MaldivesMacro-Fiscal Context and Health Financing Factsheet
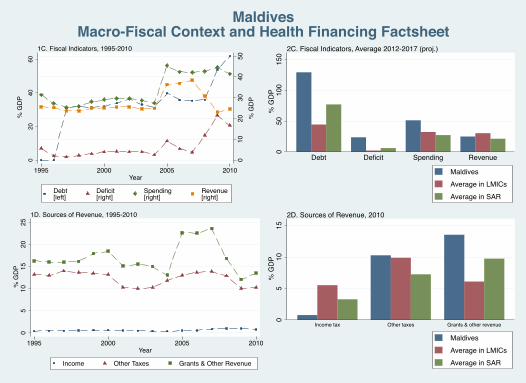
010
2030
4050
% G
DP
020
4060
% G
DP
1995 2000 2005 2010Year
Debt[left]
Deficit[right]
Spending[right]
Revenue[right]
1C. Fiscal Indicators, 1995-2010
050
100
150
% G
DP
Debt Deficit Spending Revenue
2C. Fiscal Indicators, Average 2012-2017 (proj.)
MaldivesAverage in LMICsAverage in SAR
05
1015
2025
% G
DP
1995 2000 2005 2010Year
Income Other Taxes Grants & Other Revenue
1D. Sources of Revenue, 1995-2010
05
1015
% G
DP
Income tax Other taxes Grants & other revenue
2D. Sources of Revenue, 2010
MaldivesAverage in LMICsAverage in SAR
MaldivesMacro-Fiscal Context and Health Financing Factsheet
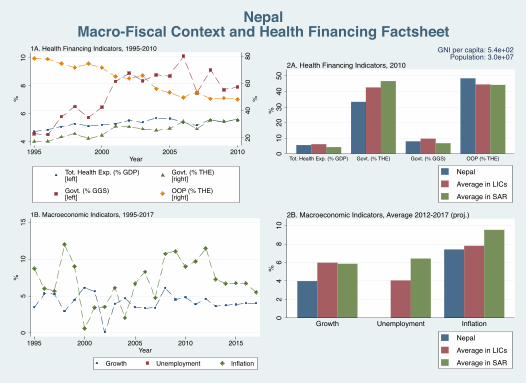
2040
6080
%
46
810
%
1995 2000 2005 2010Year
Tot. Health Exp. (% GDP)[left]Govt. (% GGS)[left]
Govt. (% THE)[right]OOP (% THE)[right]
1A. Health Financing Indicators, 1995-2010
010
2030
4050
%
Tot. Health Exp. (% GDP) Govt. (% THE) Govt. (% GGS) OOP (% THE)
2A. Health Financing Indicators, 2010
GNI per capita: 5.4e+02Population: 3.0e+07
NepalAverage in LICsAverage in SAR
05
1015
%
1995 2000 2005 2010 2015Year
Growth Unemployment Inflation
1B. Macroeconomic Indicators, 1995-2017
02
46
810
%
Growth Unemployment Inflation
2B. Macroeconomic Indicators, Average 2012-2017 (proj.)
NepalAverage in LICsAverage in SAR
NepalMacro-Fiscal Context and Health Financing Factsheet
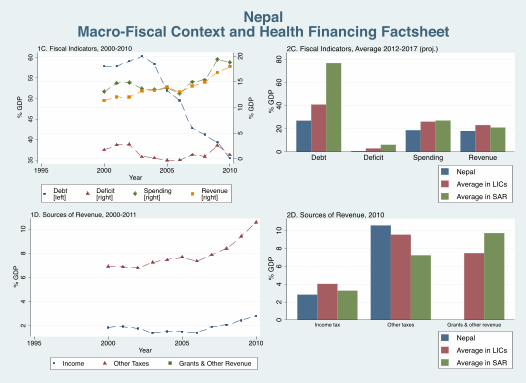
05
1015
20 %
GDP
3540
4550
5560
% G
DP
1995 2000 2005 2010Year
Debt[left]
Deficit[right]
Spending[right]
Revenue[right]
1C. Fiscal Indicators, 2000-2010
020
4060
80 %
GDP
Debt Deficit Spending Revenue
2C. Fiscal Indicators, Average 2012-2017 (proj.)
NepalAverage in LICsAverage in SAR
24
68
10 %
GDP
1995 2000 2005 2010Year
Income Other Taxes Grants & Other Revenue
1D. Sources of Revenue, 2000-2011
02
46
810
% G
DP
Income tax Other taxes Grants & other revenue
2D. Sources of Revenue, 2010
NepalAverage in LICsAverage in SAR
NepalMacro-Fiscal Context and Health Financing Factsheet
2030
4050
6070
%
22.
53
3.5
4 %
1995 2000 2005 2010Year
Tot. Health Exp. (% GDP)[left]Govt. (% GGS)[left]
Govt. (% THE)[right]OOP (% THE)[right]
1A. Health Financing Indicators, 1995-2010
020
4060
%
Tot. Health Exp. (% GDP) Govt. (% THE) Govt. (% GGS) OOP (% THE)
2A. Health Financing Indicators, 2010
GNI per capita: 1.1e+03Population: 1.8e+08
PakistanAverage in LMICsAverage in SAR
05
1015
20 %
1995 2000 2005 2010 2015Year
Growth Unemployment Inflation
1B. Macroeconomic Indicators, 1995-2017
05
1015
%
Growth Unemployment Inflation
2B. Macroeconomic Indicators, Average 2012-2017 (proj.)
PakistanAverage in LMICsAverage in SAR
PakistanMacro-Fiscal Context and Health Financing Factsheet
05
1015
2025
% G
DP
5060
7080
90 %
GDP
1995 2000 2005 2010Year
Debt[left]
Deficit[right]
Spending[right]
Revenue[right]
1C. Fiscal Indicators, 1995-2010
020
4060
80 %
GDP
Debt Deficit Spending Revenue
2C. Fiscal Indicators, Average 2012-2017 (proj.)
PakistanAverage in LMICsAverage in SAR
24
68
10 %
GDP
1995 2000 2005 2010Year
Income Other Taxes Grants & Other Revenue
1D. Sources of Revenue, 1995-2011
02
46
810
% G
DP
Income tax Other taxes Grants & other revenue
2D. Sources of Revenue, 2010
PakistanAverage in LMICsAverage in SAR
PakistanMacro-Fiscal Context and Health Financing Factsheet
4244
4648
50 %
24
68
10 %
1995 2000 2005 2010Year
Tot. Health Exp. (% GDP)[left]Govt. (% GGS)[left]
Govt. (% THE)[right]OOP (% THE)[right]
1A. Health Financing Indicators, 1995-2010
020
4060
%
Tot. Health Exp. (% GDP) Govt. (% THE) Govt. (% GGS) OOP (% THE)
2A. Health Financing Indicators, 2010
GNI per capita: 2.6e+03Population: 2.1e+07
Sri LankaAverage in LMICsAverage in SAR
05
1015
20 %
1995 2000 2005 2010 2015Year
Growth Unemployment Inflation
1B. Macroeconomic Indicators, 1995-2017
02
46
810
%
Growth Unemployment Inflation
2B. Macroeconomic Indicators, Average 2012-2017 (proj.)
Sri LankaAverage in LMICsAverage in SAR
Sri LankaMacro-Fiscal Context and Health Financing Factsheet
510
1520
2530
% G
DP
% G
DP
1995 2000 2005 2010Year
Debt[left]
Deficit[right]
Spending[right]
Revenue[right]
1C. Fiscal Indicators, 1995-2010
020
4060
80 %
GDP
Debt Deficit Spending Revenue
2C. Fiscal Indicators, Average 2012-2017 (proj.)
Sri LankaAverage in LMICsAverage in SAR
05
1015
% G
DP
1995 2000 2005 2010Year
Income Other Taxes Grants & Other Revenue
1D. Sources of Revenue, 1995-2008
02
46
810
% G
DP
Income tax Other taxes Grants & other revenue
2D. Sources of Revenue, 2010
Sri LankaAverage in LMICsAverage in SAR
Sri LankaMacro-Fiscal Context and Health Financing Factsheet
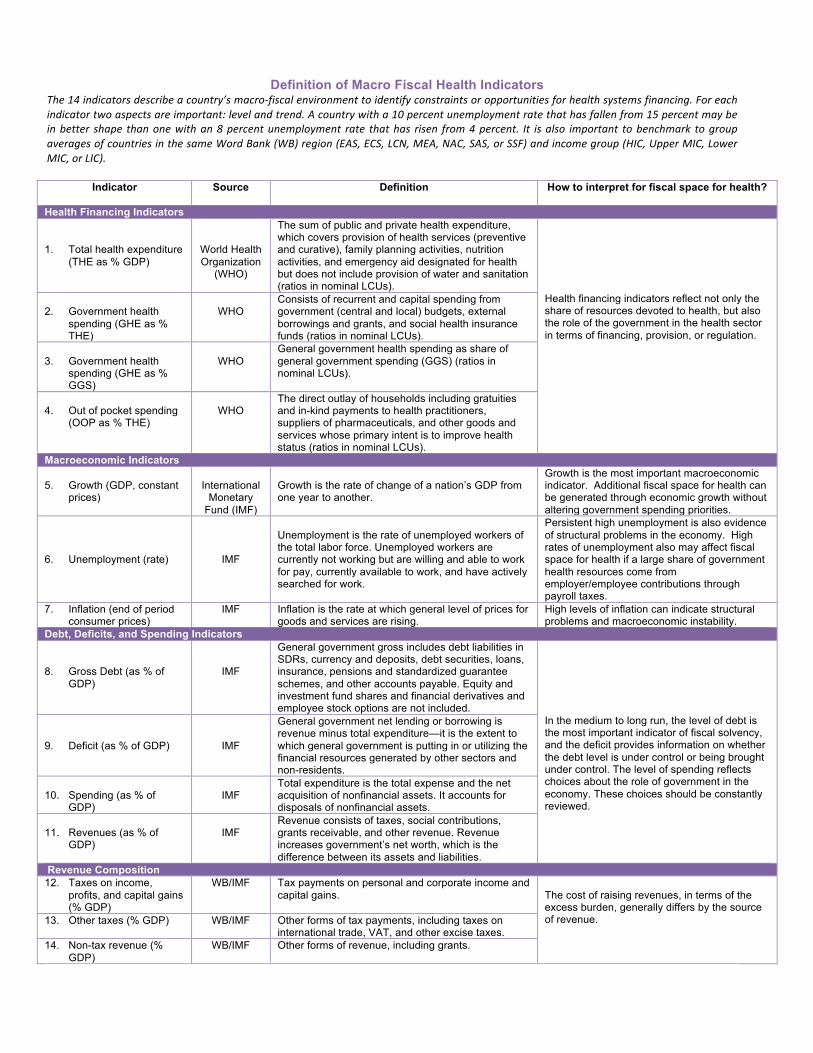
Definition of Macro Fiscal Health Indicators The$14$indicators$describe$a$country’s$macro5fiscal$environment$to$identify$constraints$or$opportunities$for$health$systems$financing.$For$each$indicator$two$aspects$are$important:$level$and$trend.$A$country$with$a$10$percent$unemployment$rate$that$has$fallen$from$15$percent$may$be$in$better$ shape$ than$one$with$an$8$percent$unemployment$ rate$ that$has$ risen$ from$4$percent.$ It$ is$also$ important$ to$benchmark$ to$group$averages$of$countries$in$the$same$Word$Bank$(WB)$region$(EAS,$ECS,$LCN,$MEA,$NAC,$SAS,$or$SSF)$and$income$group$(HIC,$Upper$MIC,$Lower$MIC,$or$LIC).$$
Indicator Source Definition How to interpret for fiscal space for health?
Health Financing Indicators
1. Total health expenditure (THE as % GDP)
World Health Organization
(WHO)
The sum of public and private health expenditure, which covers provision of health services (preventive and curative), family planning activities, nutrition activities, and emergency aid designated for health but does not include provision of water and sanitation (ratios in nominal LCUs).
Health financing indicators reflect not only the share of resources devoted to health, but also the role of the government in the health sector in terms of financing, provision, or regulation.
2. Government health
spending (GHE as % THE)
WHO
Consists of recurrent and capital spending from government (central and local) budgets, external borrowings and grants, and social health insurance funds (ratios in nominal LCUs).
3. Government health
spending (GHE as % GGS)
WHO
General government health spending as share of general government spending (GGS) (ratios in nominal LCUs).!
4. Out of pocket spending
(OOP as % THE)
WHO
The direct outlay of households including gratuities and in-kind payments to health practitioners, suppliers of pharmaceuticals, and other goods and services whose primary intent is to improve health status (ratios in nominal LCUs).
Macroeconomic Indicators
5. Growth (GDP, constant prices)
International
Monetary Fund (IMF)
Growth is the rate of change of a nation’s GDP from one year to another.
Growth is the most important macroeconomic indicator. Additional fiscal space for health can be generated through economic growth without altering government spending priorities.
6. Unemployment (rate)
IMF
Unemployment is the rate of unemployed workers of the total labor force. Unemployed workers are currently not working but are willing and able to work for pay, currently available to work, and have actively searched for work.
Persistent high unemployment is also evidence of structural problems in the economy. High rates of unemployment also may affect fiscal space for health if a large share of government health resources come from employer/employee contributions through payroll taxes.
7. Inflation (end of period consumer prices)
IMF Inflation is the rate at which general level of prices for goods and services are rising.
High levels of inflation can indicate structural problems and macroeconomic instability.
Debt, Deficits, and Spending Indicators
8. Gross Debt (as % of GDP)
IMF
General government gross includes debt liabilities in SDRs, currency and deposits, debt securities, loans, insurance, pensions and standardized guarantee schemes, and other accounts payable. Equity and investment fund shares and financial derivatives and employee stock options are not included.
In the medium to long run, the level of debt is the most important indicator of fiscal solvency, and the deficit provides information on whether the debt level is under control or being brought under control. The level of spending reflects choices about the role of government in the economy. These choices should be constantly reviewed.
9. Deficit (as % of GDP)
IMF
General government net lending or borrowing is revenue minus total expenditure—it is the extent to which general government is putting in or utilizing the financial resources generated by other sectors and non-residents.
10. Spending (as % of
GDP)
IMF
Total expenditure is the total expense and the net acquisition of nonfinancial assets. It accounts for disposals of nonfinancial assets.
11. Revenues (as % of
GDP)
IMF
Revenue consists of taxes, social contributions, grants receivable, and other revenue. Revenue increases government’s net worth, which is the difference between its assets and liabilities.
Revenue Composition 12. Taxes on income,
profits, and capital gains (% GDP)
WB/IMF Tax payments on personal and corporate income and capital gains.
The cost of raising revenues, in terms of the excess burden, generally differs by the source of revenue. 13. Other taxes (% GDP) WB/IMF Other forms of tax payments, including taxes on
international trade, VAT, and other excise taxes. 14. Non-tax revenue (%
GDP) WB/IMF Other forms of revenue, including grants.
!

! !

!!
!