World Bank Document€¦ · World Bank team including Dung Thi Ngoc Tran on editing, Chi Kim Tran...
182
47023 Public Disclosure Authorized Public Disclosure Authorized Public Disclosure Authorized Public Disclosure Authorized Public Disclosure Authorized Public Disclosure Authorized Public Disclosure Authorized Public Disclosure Authorized
Transcript of World Bank Document€¦ · World Bank team including Dung Thi Ngoc Tran on editing, Chi Kim Tran...

47023P
ublic
Dis
clos
ure
Aut
horiz
edP
ublic
Dis
clos
ure
Aut
horiz
edP
ublic
Dis
clos
ure
Aut
horiz
edP
ublic
Dis
clos
ure
Aut
horiz
edP
ublic
Dis
clos
ure
Aut
horiz
edP
ublic
Dis
clos
ure
Aut
horiz
edP
ublic
Dis
clos
ure
Aut
horiz
edP
ublic
Dis
clos
ure
Aut
horiz
ed

Vietnam Development Report 2009
Capital Matters
World Bank Report to the Vietnam Consultative Group MeetingHanoi, December 4-5, 2008
47023


CURRENCY EQUIVALENTS
CURRENCY UNIT = DONGUS$ = 16,500
GOVERNMENT FISCAL YEARJanuary 1 to December 31
ACRONYMS AND ABBREVIATIONS
ACB Asia Commercial BankADB Asian Development BankAFTA ASEAN Free Trade AreaBIDV Bank for Investment and Development of VietnamBOT Build-Operate-TransferBTO Build-Transfer-OperateCDS Credit Default SwapDAD Development Assistance DatabaseDFID Department for International Development of the United KingdomDRG Diagnostic Related GroupDRS Debtor Reporting SystemEC European CommissionEximbank Vietnam Import Export BankEIT Enterprise Income TaxEVN Electricity of VietnamFDI Foreign Direct InvestmentGAC Governance and Anti-corruptionGDP Gross Domestic Product GDT General Department of TaxationGNI Gross National IncomeGSO General Statistics OfficeHaSTC Hanoi Stock Trading CenterHCMC Ho Chi Minh CityHIFU Ho Chi Minh City Investment Fund for Urban DevelopmentHOSE Ho Chi Minh City Stock ExchangeHSBC Hong Kong and Shanghai Banking CorporationIBRD International Bank for Reconstruction and DevelopmentICOR Incremental Capital-Output RatioIDA International Development AgencyIFC International Finance CorporationIMF International Monetary FundIPO Initial Public OfferingIT Information TechnologyJICA Japan International Cooperation AgencyJSB Joint Stock BankJSC Joint Stock CompanyLDIF Local Development Investment Fund

MHB Mekong Housing BankMOF Ministry of Finance MPI Ministry of Planning and InvestmentMTEF Medium-Term Expenditure FrameworkNDF Non-Deliverable ForwardNGO Non-Governmental OrganizationNPL Non-Performing LoanNPV Net Present ValueOCBC Overseas Chinese Banking CorporationOECD Organization for Economic Co-operation and DevelopmentOTC Over-the-Counter P/E Price-to-Earnings PIT Personal Income TaxPPP Purchasing Power ParityPPP Public Private PartnershipsPRSC Poverty Reduction Support CreditSacombank Sai Gon Thuong Tin Commercial Joint Stock BankSAE Small-Area EstimatesSASAC State-owned Assets Supervision and Administration CommissionSBV State Bank of VietnamSCIC State Capital Investment CorporationSEDP Socio-Economic Development PlanSMBC Sumitomo Mitsui Banking CorporationSOCB State-Owned Commercial BankSOE State-Owned EnterpriseSRO Self-Regulatory OrganizationSSC State Securities CommissionSSI Saigon Securities Inc.Techcombank Vietnam Technology and Commercial Joint Stock BankUNCTAD United Nations Conference on Trade and DevelopmentUSBTA US-Vietnam Bilateral Trade AgreementVAT Value Added TaxVBARD Vietnam Bank for Agriculture and Rural DevelopmentVBSP Vietnam Bank for Social PoliciesVDB Vietnam Development BankVietcombank Vietnam Foreign Commercial Joint Stock BankVietinbank Vietnam Bank for Industry and TradeVMBA Vietnam Bond Market AssociationVSD Vietnam Securities DepositoryVSS Vietnam Social InsuranceVPBank Vietnam Commercial Bank for Private EnterprisesVPSSC Vietnam Postal Savings Service CompanyWTO World Trade Organization

ACKNOWLEDGMENTS
This report was prepared by the World Bank for the Consultative Group meeting ofDecember 4-5, 2008. The outline and content of the report were discussed with donors, bothvirtually and at a workshop held in Hanoi on March 28. Comments and suggestions by LaurieBarnier (European Commission, EC), Bridget Crumpton (Department for InternationalDevelopment of the United Kingdom, DFID), Elke Foerster (on behalf of the Like-MindedDonor Group), Bahodir Ganiev (Asian Development Bank), Daniel Lenggenhager (SwissDevelopment Cooperation), Yasuhisa Ojima (Japan International Cooperation Agency, JICA)and Huong Thuy Vu (Embassy of Ireland) are gratefully acknowledged. The report alsobuilds on various studies conducted or funded by donors in areas related to the content of thereport over the months and years preceding its writing. Such studies, listed in thebibliography section, were prepared as part of each donor’s own country program.
The preparation of the report involved consultations with Vietnamese researchers andpractitioners who participated on a personal capacity. Their inputs and feedback werecoordinated through a Reviewing Committee comprising Mr. Ha Bui (Ministry of Planningand Investment), Dr. Doanh Dang Le (Institute of Development Studies), Mr. Nghia Xuan Le(State Bank of Vietnam), Mme. Tam Thi Bang Le (advisor), Mme. Cuc Thi Nguyen (GeneralDepartment of Taxation), Mr. Do Thanh Nguyen (Ministry of Finance), Mr. Huy QuangNguyen (State Bank of Vietnam), Mme. Yen Thi Hoang Nguyen (Ministry of Finance), Mme.Lan Chi Pham (Institute of Development Studies), Dr. Thanh Tri Vo (Central Institute forEconomic Management), and Mr. Bang Vu (State Securities Commission).
The team in charge of formally writing the report was led by Martin Rama. Viet Tuan Dinhand Keiko Kubota contributed to the entire report. Noritaka Akamatsu, James Anderson,Quang Hong Doan, Tuan Minh Le, Lasse Melgaard, Dzung The Nguyen, Nga NguyetNguyen, Duc Minh Pham, Kalpana Seethepalli, Susan Shen, Viet Quoc Trieu and QuyenHoang Vu contributed inputs for specific chapters. The writing team built on a range ofstudies prepared by colleagues in the World Bank. It also benefited from substantivecontributions by partners outside the World Bank. Special thanks go to Daniel Alvarez (DukeUniversity), Michael Engelschalk (consultant), Cuong Viet Nguyen (National EconomicsUniversity), GP Shukla (Duke University), and Roy Van Der Weide (consultant).
Nha Thi Vu (Vietnam Development Information Center - VDIC) was in charge ofbibliographical research and referencing. The processing of the document was done by aWorld Bank team including Dung Thi Ngoc Tran on editing, Chi Kim Tran on publishing, andPhuong Minh Le on administrative Supoort.
Overall guidance was provided by Vikram Nehru, from the World Bank. Homi Kharas(Brookings Institution) and Luiz Pereira Da Silva (World Bank) served as peer reviewers.The report was discussed with the International Monetary Fund (IMF). Comments andsuggestions by numerous colleagues are gratefully acknowledged.


g
TABLE OF CONTENTS
AcknowledgementsExecutive Summary . . . . . . . . . . . . . . . . . . . . . . . . . . . . . . . . . . . . . . . . . . . . . . . . . . . . . . . . .i
PART I: NEEDS AND IMPACTS . . . . . . . . . . . . . . . . . . . . . . . . . . . . . . . . . . . . . . . . . . . . .11. Financing Growth . . . . . . . . . . . . . . . . . . . . . . . . . . . . . . . . . . . . . . . . . . . . . . . . . . . .32. Transformation and Turbulence . . . . . . . . . . . . . . . . . . . . . . . . . . . . . . . . . . . . . . . .16
PART II: SOURCES AND USES . . . . . . . . . . . . . . . . . . . . . . . . . . . . . . . . . . . . . . . . . . . . .273. Tax Revenue . . . . . . . . . . . . . . . . . . . . . . . . . . . . . . . . . . . . . . . . . . . . . . . . . . . . . . .294. Debt and Liabilities . . . . . . . . . . . . . . . . . . . . . . . . . . . . . . . . . . . . . . . . . . . . . . . . . .415. State Capital . . . . . . . . . . . . . . . . . . . . . . . . . . . . . . . . . . . . . . . . . . . . . . . . . . . . . . . .526. Policy Lending . . . . . . . . . . . . . . . . . . . . . . . . . . . . . . . . . . . . . . . . . . . . . . . . . . . . . .647. Banking Credit . . . . . . . . . . . . . . . . . . . . . . . . . . . . . . . . . . . . . . . . . . . . . . . . . . . . . .718. Equity Investment . . . . . . . . . . . . . . . . . . . . . . . . . . . . . . . . . . . . . . . . . . . . . . . . . . .849. Private Partnerships . . . . . . . . . . . . . . . . . . . . . . . . . . . . . . . . . . . . . . . . . . . . . . . . .9310. Donor Support . . . . . . . . . . . . . . . . . . . . . . . . . . . . . . . . . . . . . . . . . . . . . . . . . . . . .102
PART III: A POLICY AGENDA . . . . . . . . . . . . . . . . . . . . . . . . . . . . . . . . . . . . . . . . . . . .11411. Ensuring Stability . . . . . . . . . . . . . . . . . . . . . . . . . . . . . . . . . . . . . . . . . . . . . . . . . . .11712. Sustaining Growth . . . . . . . . . . . . . . . . . . . . . . . . . . . . . . . . . . . . . . . . . . . . . . . . . .128
Bibliography . . . . . . . . . . . . . . . . . . . . . . . . . . . . . . . . . . . . . . . . . . . . . . . . . . . . . . . . . . . . .136Statistical Appendix . . . . . . . . . . . . . . . . . . . . . . . . . . . . . . . . . . . . . . . . . . . . . . . . . . . . . . .139
Boxes
Box 1.1: What Does an ICOR Tell about Efficiency? ......................................................7Box 2.1: How many Years to Catch Up? ........................................................................23Box 3.1: The Tax Reform Program ................................................................................32Box 3.2: Land Administration Reform and Property Tax................................................36Box 4.1: Defining Government Debt ..............................................................................42Box 5.1: Equitization Methods: Competition versus Direct Sale ....................................60Box 5.2: China’s Approach to the Management of State Ownership Rights ..................63Box 6.1: Microcredit in Cambodia and Vietnam ............................................................70

h
Box 7.1: Strategic Investments in the Banking Sector ....................................................75Box 7.2: Assessing the Quality of Bank Lending............................................................82Box 8.1: A Combination of Temasek and Treuhand ......................................................89Box 8.2: Does Listing Improve Performance? ................................................................91Box 9.1. PPP Schemes and Modalities ............................................................................94Box 9.2: Successes and Failures in the Granting of Guarantees ....................................98Box 9.3: Local Development Investment Funds............................................................100Box 10.1: Aid Fungibility in the Transport and Health Sectors ......................................106Box 10.2: China’s Graduation from Concessional Lending ............................................110Box 10.3: The Governance and Anticorruption Strategy ................................................112Box 11.1: Systemic Risk in East Asian Economic Crises ..............................................120Box 11.2: Identifying Poor and Vulnerable Households ................................................127
Tables
Table 1.1: Total Investment at Current Prices ....................................................................4Table 1.2: The Engineering Approach to Investment ..........................................................9Table 1.3: The Financial Approach to Investment ............................................................12Table 3.1: Composition of Government Revenue..............................................................30Table 3.2: The Revenue Gap on EIT ................................................................................33Table 3.3: Partial Tax Filing Compliance ..........................................................................39Table 4.1: Debt Issuance by SOCBs and Large SOEs ......................................................50Table 5.1: Public Investments by Sector of Activity ..........................................................55Table 6.1: Beneficiaries from Social Policy Lending ........................................................66Table 7.1: Financial Investments by Large SOEs ..............................................................76Table 7.2: Key Financial Ratios for SOCBs ......................................................................78Table 7.3: Key Financial Ratios for JSBs ..........................................................................79Table 8.1: Joint Stock Companies: Public versus Listed....................................................87Table 10.1: What are the Main Priorities? ........................................................................109Table 10.2: Main Gaps in Procurement..............................................................................113
Figures
Figure 1.1: Key Investment Ratios ........................................................................................5Figure 1.2: The Incremental Capital-Output Ratio................................................................8Figure 1.3: The Economic Approach to Investment ............................................................10Figure 1.4: A Robust External Debt Position ......................................................................15Figure 2.1: Richer Countries Are more Expensive ............................................................18Figure 2.2: Richer Provinces Are more Expensive ............................................................20
i
Figure 2.3: A Changing Balance of Payments ....................................................................21Figure 2.4: The Rise and Fall of Real Estate Prices ..........................................................22Figure 2.5: The Real Exchange Rate and Export Performance ..........................................24Figure 3.1: A Progressive Tax Burden ................................................................................33Figure 3.2: Gaps in Operational Processes..........................................................................40Figure 4.1: A Multiplicity of Small Bond Series ................................................................44Figure 4.3: Will Future Pensions Be Affordable? ..............................................................48Figure 5.1: Funding Sources for Public Investments ..........................................................54Figure 5.2: Rate of Return on Assets by Enterprise Ownership..........................................58Figure 6.1: Is Social Policy Lending Well Targeted?..........................................................67Figure 6.2: One among Several Sources of Finance ..........................................................69Figure 7.1: Financial Deepening or Monetary Turbulence? ..............................................73Figure 7.2: How Much Borrowing by SOEs? ......................................................................80Figure 8.1: Stock Market Trends and Fundamentals ..........................................................85Figure 9.1: The Gap between Investment Plans and Available Financing ........................95Figure 10.1: Donor Support Looking Backward..................................................................103Figure 10.2: Donor Support Looking Forward ....................................................................108Figure 11.1: Dramatic Fluctuations in Commodity Prices ..................................................118Figure 11.2: Good policies are not enough..........................................................................124


Now, more than ever, it matters howVietnam raises and uses capital.
In 2007 the world experienced unprecedentedeconomic growth. There was abundantcapital seeking profitable investments inemerging countries, and country riskpremiums were low. Vietnam’s accession tothe World Trade Organization (WTO) wasinterpreted as a sign that its government wasserious about economic reform. Given itshardworking population and excellentlocation, market sentiment was strong. Manysaw Vietnam as a new economic tiger in themaking, the “+1” country in a “China+1”investment strategy. Resources flowed inunder many forms, from remittances toforeign direct investment (FDI) to portfolioinvestments. Capital inflows were four timeshigher relative to GDP than anything Chinahad experienced since the beginning of itsown reform process.
In 2008 the world economy went into a tailspin. What started as financial difficulties ina risky segment of the mortgage market inthe United States grew into a global financialcrisis of unprecedented proportions. Fearparalyzed economic activity, bringing creditto a halt and pushing many who had investedin emerging countries to sell their assets toraise liquidity.
What the next few years will bring isuncertain. What is certain, however, is that
2009 will be a difficult year. The downturnin industrial countries will lead to a declinein developing country exports. FDI projectsunder implementation may be delayed, orcancelled altogether. New FDI will decline,perhaps dramatically. Portfolio investmentwill become rare and even remittances couldsuffer, as those who send money home maysee their jobs disappear and their earningsdwindle. In the year 2009, mobilizingcapital for development will be very difficultindeed. Using it efficiently will beimperative.
* * *
Vietnam’s balance of payments offers boththe prospect of faster growth and the risk ofgreater turbulence. In late 2007, theabundance of capital inflows created strongpressure for the dong to appreciate,affecting export competitiveness. Resistingthat pressure meant injecting massiveamounts of liquidity into the economy. Theresult was a boom in banking credit, risinginflation, and an asset price bubble. In late2008 and early 2009, export growth is boundto slow, capital inflows will decline, and theinvestment rate will fall. As economicactivity slows and jobs are lost, real incomegrowth will weaken, and the poor are likelyto suffer the most.
The shifts in market sentiment that driveexternal capital flows are one of the main
i
EXECUTIVE SUMMARY

risks faced by the Vietnamese economy. Butthe package of macroeconomic policies atpresent available to the government may beinsufficient to mitigate the impact of thoseshifts. Another risk stems the possibility forenterprises and banks, both state-owned andprivate, to contract more debt than theyshould, running up implicit claims on thegovernment. This risk has not materializedyet, and current circumstances make itunlikely in the short term. But in afinancially open economy, this is more thanjust a theoretical possibility.
Disengagement from world markets is notthe answer, however. Global integration hasbeen the country’s ticket to prosperity.Linking domestic prices to internationalmarkets allowed farmers to get better returnsfor their products and emerge from poverty.FDI inflows resulted in the creation of wageemployment, making it possible for Vietnamto absorb millions of entrants into its labormarket. Exports have been the main driverof economic growth, as domestic enterprisesconnected increasingly to internationalmarkets. Opening the services sector to newentry brought competition into activitiespreviously dominated by large state-ownedenterprises (SOEs) and state-ownedcommercial banks (SOCBs), resulting insubstantial efficiency gains.
As Vietnam reaches middle-income status itwill need to engage more deeply withprivate capital markets, including the globalfinancial market. Without this, Vietnam’sinvestment rate will be constrained by itsdomestic savings rate, which hovers around30 percent of GDP. That may be high byinternational standards, but it is not highenough to support Vietnam’s ambition tobecome an industrial country in one
generation. To bridge the difference andrealize this ambition, Vietnam will have toembrace international capital, but with anadequate policy and institutional framework.
Global integration may hold the key toprosperity, but it also confronts the countrywith new challenges, especially in the areaof economic management. Financial crisesare a hazard of life in middle-incomecountries. Such crises can be costly,economically and socially, and set backeconomic growth. When capital marketconditions change and lenders stop providingfinance, long-gestation projects can be leftincomplete, new ones are not constructed,real wages and asset prices fall, and the realexchange rate depreciates, spreadingturmoil through the rest of the economy.
Managing risk requires decisive policyaction. Limited reliance on short-term debtand a safe level of international reserves arecritical, but may not be sufficient. Alsoneeded are appropriate monetary policy, asound banking system with the capacity toassess credit risks well, and solid financialsector supervision.
* * *
To ensure stability, Vietnam will need toreconcile its financing needs with a prudentreliance on foreign capital. A sudden surgein inflows as occurred in 2007 can lead toexchange rate appreciation, makingborrowing in foreign currency moreattractive and encouraging further short-term inflows. A flexible exchange rate canhelp deal with such a situation, andVietnam’s move in this direction iswelcome. But excessive exchange ratevariability can also hurt export
CAPITAL MATTERS
ii

competitiveness and the business climateand affect balance sheets in enterprises andbanks. Exchange rate flexibility may alsoaccentuate instability in the presence oflarge short-term capital inflows or outflows.
Given these constraints, exchange ratepolicy alone will not be sufficient.Reconciling financing needs withmacroeconomic stability will require a morecomprehenive policy framework across allthe major policy instruments: exchange ratepolicy, monetary policy, and fiscal policy.But for this framework to be effective, allthree instruments will need to be brought upto speed, and the coordination between themwill have to be improved.
Monetary policy can be effective in theabsence of short-term capital movements, ashad been the case until 2006. But monetarypolicy became less independent in thepresence of large capital movements, as inlate 2007 and early 2008, when theauthorities basically lost control of creditgrowth and could not prevent significantdemand pressures in the economy, resultingin rising inflation, a current account deficit,and asset price bubbles.
Effective fiscal policy requires goodinformation on government revenue andexpenditures, and strong control over publicinvestments. Vietnam faces shortcomings inall three fronts. Its measure of the budgetbalance differs from standard internationalpractice. The treatment of amortization, off-budget accounts, and revenue carry-overssubstantially distort the budget position of thegovernment. Information is particularlyweak for budget-funded investment projects,which account for 30 percent of total capitalaccumulation in Vietnam. Just as it did in late
2007 and early 2008 in responding tooverheating, the government should moresystematically stop or delay projects withweak justification, insufficient funding orpoor performance.
* * *
Investing efficiently should be a top priorityof the government, regardless of the level ofcapital inflows. Capital efficiency isprobably low, and may have deteriorated inlate 2007 and 2008. During this period,state-owned Economic Groups and largeState corporations relied on their deeppockets to diversify into sectors far removedfrom their core business, such as real estate,financial investments and the establishmentof new banks. Real estate investments mighthave looked highly profitable as long as theasset price bubble was growing, but theiractual returns were punctured when thebubble burst.
Economic Groups and large corporationsinvesting in finance pose a potential threat tomacroeconomic stability. Efforts to reformthe state sector in Vietnam have relied onincreased competition and harder budgetconstraints. If Economic Groups and largeState corporations can raise funds directlyfrom the public through deposit takinginstitutions, scrutiny over the bankability oftheir investment projects will inevitablydeteriorate. Poor investment decisions couldbe pursued for longer than they should.Fortunately, in Vietnam the asset pricebubble was short-lived, so that many of theseinvestments did not have time to materialize.But looking forward this is an area wherecaution is warranted.
The usual evidence provided to claim thatinvestment efficiency is low in Vietnam is its
EXECUTIVE SUMMARY
iii

growing Incremental Capital-Output Ratio(ICOR). But this can be misleading. In 2007,for example, the most dramatic increase hasbeen for the foreign-invested sector, notbecause it is the most inefficient, butbecause it has grown the fastest.
Since ICORs are not necessarily helpful inassessing Vietnam’s investment efficiency,this report analyzes in some depth howfinancial resources are raised, allocated andchanneled to specific projects. The approachexamines the sources and uses of funds,quantifies the gaps between investment andsavings for each of the main economicagents, and highlights the mechanismsthrough which the agents that save channelresources to those that invest. The reportthen explores in more detail the efficiency ofeach of these mechanisms, including theraising of tax revenues by government, theissuance of debt, the allocation of resourcesthrough the budget, the targeting of socialpolicy lending, the mobilization of bankingcredit, the raising of equity finance, theparticipation of the private sector ininfrastructure projects, and the mobilizationof donor support.
* * *
The main challenges revealed by thisanalysis are the shortage of long-termfinance and the institutional constraints todevelop private-public partnerships ininfrastructure. Investment projects withpotentially high returns may never beimplemented due to the lack of funding. Thebond market is still thin, and will probablyremain that way unless there is moreprogress in consolidating the large numberof outstanding series of government bondsand bills, thus supporting the emergence of a
reliable yield curve. The main obstacle toprivate-public partnerships is the absence ofa specialized agency with the capacity tofoster competition and with the ability toidentify the financial support needed wherethere is a perceived funding gap.
Other sources of investment finance arefunctioning better, but improvements arepossible in their case too. For example,much progress has been made in relation tothe tax system. But the lack of a genuineproperty tax and the variability of theeffective tax burden across enterprises withdifferent ownership suggest that more couldbe done to improve efficiency and equity. Inthe banking system, there is need forstronger credit risk rating to rapidly identifyborrowers under stress and weak loanportfolios. In the stock market severalimprovements can be made at the level ofthe trading platforms. In the medium term,its dynamism would be boosted by a faster(but still transparent) equitization of largeSOEs and SOCBs.
The selection of public investment projectsand their implementation are two areaswhere large improvements can be made inthe use of public resources. Decentralizationhas brought key decisions closer tobeneficiaries, and this should in principleimprove project selection. But it has also ledto weaker project appraisal andimplementation processes. Cost-benefitanalyses are not always undertaken, and themonitoring of project execution is not strongenough to avoid substantial delays and costoverruns. A Law on Public Investment isneeded to identify the steps that lineministries and local governments need totake to prepare, appraise and implementprojects. The Ministry of Planning and
CAPITAL MATTERS
iv

Investment (MPI) also needs the capacity toreview feasibility studies and monitorimplementation. The Law should alsoprovide clarity on the powers of the centralgovernment to suspend or stop investmentprojects, especially because the ability toadjust investment volumes rapidly may holdthe key to macroeconomic stability in anincreasingly uncertain world.
* * *
Vietnam has made important progress inestablishing well-functioning capital markets
as the infrastructure to ensure itsindustrialization and modernization. But ithas not fully succeeded yet. Investmentrates have been high. But domestic savingshave not always being mobilized efficiently,and foreign savings cannot always be reliedupon. Meanwhile, investment decisions donot always channel resources to the rightsectors and activities. And some of themcould increase the vulnerability of theVietnamese economy to shifts in marketsentiment. In this context, the system formobilizing and using capital matters.
EXECUTIVE SUMMARY
v


PART I: NEEDS AND
IMPACTS
1


Vietnam has been one of the fastest growingcountries in the world, with rapid outputgains being sustained (among others) onmassive capital accumulation. Reassuringly,the share of investments undertaken by theprivate sector, and especially by thedomestic private sector, has grown steadily.By now, the state sector accounts for roughly40 percent of the total, compared to 60percent at the beginning of the decade. Butwith the investment rate exceeding 45percent of the Gross Domestic Product(GDP) in 2007, questions remain regardingthe efficiency and the affordability of thismassive accumulation effort. Attempts toassess the efficiency of investment have sofar relied on macroeconomic data, which isquestionable on methodological grounds andleads to non-conclusive results anyway. Onthe other hand, some macroeconomicanalyses are well suited to assess theaffordability of the accumulation effort. Theengineering approach to investment “needs”does not fall in this category, as it tends tofocus on a few (mainly infrastructure)sectors, assuming that all master plans haveto be implemented and all governmenttargets attained. Moreover, the engineeringapproach remains silent on who (of theprivate sector of the state) should undertakethe investments. But the economic approachgives a sense of magnitude of the investmenteffort needed to attain different growth
targets, and shows how large the currentaccount deficit of the balance of paymentscan be when those targets are ambitious.And the financial approach highlights howthe main stakeholders raise and channelresources for investments of various sorts.An assessment of debt sustainabilitysuggests that Vietnam can afford a relativelyhigh level of capital accumulation. But arigorous analysis of the efficiency of capitalaccumulation in Vietnam needs to dig intoeach of the main sources and uses of fundsidentified by the financial approach.
Massive accumulation
Over the present decade, and especiallyafter the acceleration of economic reformsthat followed the 9th Party Congress, in2001, Vietnam has experienced high ratesof economic growth. Its GDP per person,measured at constant prices, increased onaverage by 6.5 percent per year.Admittedly, China has grown faster, ashave also done a few other countries(many of them small, relying on naturalresource booms or emerging fromconflict). But when the period 2001-2007as a whole is considered, Vietnam ranks24 among 139 countries in terms of thegrowth of its GDP per person measured atconstant prices (the ranking excludescountries and territories with a GDP of lessthan 2 billion dollars in 2007).
3
1. FINANCING GROWTH

Another common way to measure progress isin current dollar terms. From thisperspective, Vietnam climbed from a GDPper person of 413 dollars in 2001 to 836 in2007, and will most likely surpass the 1000milestone in 2008, a couple of years ahead ofthe target set by the Socio-EconomicDevelopment Plan (SEDP) 2006-2010. At12.5 percent, the annual growth rate of GDPper person over the period 2001-2007 ismuch higher than when measured at constantprices. This is not surprising, given thegradual loss in the value of the dollar.Figures measured in current dollars are alsomore subject to fluctuations due to short-termmovements in exchange rates.
However, there is more than inflation andshort-term turbulence in the gap betweenmeasures at constant prices and in currentdollar terms, and the implications will bediscussed recurrently in this report. Beyondwhich GDP measure is used, it is clear thatVietnam has grown fast. Such rapid growthhas been one of the main drivers of povertyreduction, another area where Vietnam hasdone remarkably well, regardless of themeasure used.
Rapid economic growth has been partlysustained on massive capital accumulation
(Table 1.1). By 2007, Vietnam wasinvesting 521.7 trillion dong per year, almostexactly three times as much as in 2001, wheneconomic reforms accelerated. Only afraction of this increase can be attributed tocapital goods being more expensive.
The growth in investment has been faster inthe private sector than in the state sector,with the strongest performance (both inabsolute and in relative terms)corresponding to the domestic private sector.As a result, the fraction of total investmentcontributed by different stakeholders haschanged dramatically since the accelerationof economic reforms. In 2001, the statesector accounted for almost 60 percent oftotal capital accumulation in Vietnam, withthe rest divided roughly equally betweenforeign invested companies and thedomestic private sector. By 2007, it was theprivate sector which accounted for 60percent, with more than half of the amountcontributed by domestic enterprises (Figure1.1, left panel).
Investment has grown much faster thanGDP. The share of total output dedicated togross capital accumulation has increasedfrom 35.4 percent in 2001 to an astounding45.6 percent in 2007 (Figure 1.1, right
CAPITAL MATTERS
4
Table 1.1: Total Investment at Current Prices
2001 2002 2003 2004 2005 2006 2007e 2008p
State 102.0 114.7 126.6 139.8 161.6 185.1 208.1 236.0
Private domestic 38.5 50.6 74.4 109.8 130.4 154.6 184.3 190.0
Foreign 30.0 34.8 38.3 41.3 51.1 65.6 129.3 153.0
Total 170.5 200.1 239.2 290.9 343.1 404.7 521.7 579.0
Source: General Statistics Office (GSO). Figures are in trillion dong. The state sector includesSOEs.

panel). Not all of this effort translates intonet capital accumulation, as some of theinvestment simply compensates thedepreciation of existing capital. Based onnational accounts, over the period 2001-2007, capital depreciation has accounted forroughly 4.5 percent of GDP, measured atcurrent prices. But regardless of whichmeasure of capital accumulation isconsidered, it is clear that Vietnam currentlyhas one of the highest investment ratios inthe world. For instance, on the grossaccumulation measure only 12 out of the 139countries considered had a higher ratio thanVietnam in 2007.
Efficient accumulation?
When a country is devoting such a massiveamount of resources to capital accumulation,an obvious question is whether thoseresources are being invested efficiently.There is evidence, from studies usingindividual records from the enterprise surveyof GSO that total factor productivity at theenterprise level is increasing rapidly. This
means that not all economic growth inVietnam comes from increases in the volumeof capital or the size of labor force. Butregardless of the magnitude of total factorproductivity gains, the question is whetherthe additional capital is being allocated to the“right” sectors, activities, and projects.
Because market mechanisms are still beingdeveloped in Vietnam, and publicinvestment processes are only partiallymodernized, this is not just a hypotheticalconcern. Much of the economic policydebate in recent years, and especiallyaround the 10th Party Congress, in 2006, wason the distinction between “quantity” and“quality” of growth. By now there is nodoubt that Vietnam is delivering on the“quantity” dimension. Whether it does so onthe “quality” dimension is much less clear.
However, providing an answer to thisquestion is less straightforward than manycommentators suggest. The usualcommentary uses the ICOR as proof. On thesurface, this is a sensible approach. The
FINANCING GROWTH
5
0
10
20
30
40
50
60
70
2001
2002
2003
2004
2005
2006
2007
e
Perc
ento
ftot
alin
vestm
ent
State Non-state Foreign
0
10
20
30
40
50
2001
2002
2003
2004
2005
2006
2007
e
Perc
ento
fGD
P
Total investment
Figure 1.1: Key Investment Ratios
Source: Based on data from GSO.

ICOR measures how many units of capitalare associated with every additional unit ofoutput. So, in principle at least, the higherthe ICOR the less efficient investment is(because more units of capital are needed togenerate one additional unit of output).
A cursory look at the date suggests that theICOR has indeed increased substantially inVietnam in recent years. Using the standardmeasure, at constant prices, it went from 4.5in 2001 to 6.6 in 2007. Some increase in theICOR can be expected as the capital stock ofthe economy expands and the most urgentgaps are addressed. The first, criticallyimportant investments in basic infrastructureshould do more to expand GDP thansubsequent projects with lower priority. Buta 48 percent increase in just six years seemstoo high to be due to the mere effect of arelative abundance of capital; especiallybecause infrastructure gaps remain severe inVietnam.
An important assumption underlying theinterpretation of the ICOR as an efficiencyindicator is that capital accumulation willresult in a higher GDP within one year.While this might be plausible in the case ofsmall commercial investments, it may beonly partially true in the case of majorindustrial undertakings and it is mostcertainly wrong in the case of largeinfrastructure projects. It follows that theICOR should increase when growthaccelerates due to surge in investment, anddecrease when investment decelerates.
Some would even question that the ICORshould be at all used to assess the efficiencyof investment (Box 1.1). But even if thestandard measure of the ICOR at constantprices was retained, most of the surge
observed in 2007 would be driven byforeign-invested companies (Figure 1.2).Admittedly, some relatively heroicassumptions are needed to disaggregate totaloutput by institutional sector. It is also clearthat an upward trend is noticeable in the caseof the state sector and the domestic privatesector, perhaps reflecting decreasing returnsto capital as the most urgent investment gapsare addressed. But something radicallydifferent happened in relation to foreigninvestment in 2007, something that helpsexplain the macroeconomic turbulence ofthat year, and understand the unprecedentedchallenges faced by policy makers in theirquest for stability.
Investment “needs”
While macroeconomic data is not adequateto evaluate the efficiency of investment, it iswell-suited to assess its affordability. Thecapacity of Vietnam to sustain an investmentratio as high as in 2007 is questionable.Over time, various analyses have beenproposed to determine the investment levelVietnam should aim for.
The simplest and intuitively most appealingapproach focuses on investment “needs”.One popular variant of this approach,favored by those dealing with infrastructure,uses sectoral targets and master plans as itsstarting point. Through its developmentstrategies and socio-economic plans,Vietnam has set ambitious objectives andtargets across a range of areas. Some ofthose objectives and targets are related tooutcome indicators, such as the proportion ofthe population having access to specificservices. Others are spelled out in outputterms, such as kilometers of highways orpassenger airport capacity. Meeting these
CAPITAL MATTERS
6
FINANCING GROWTH
7
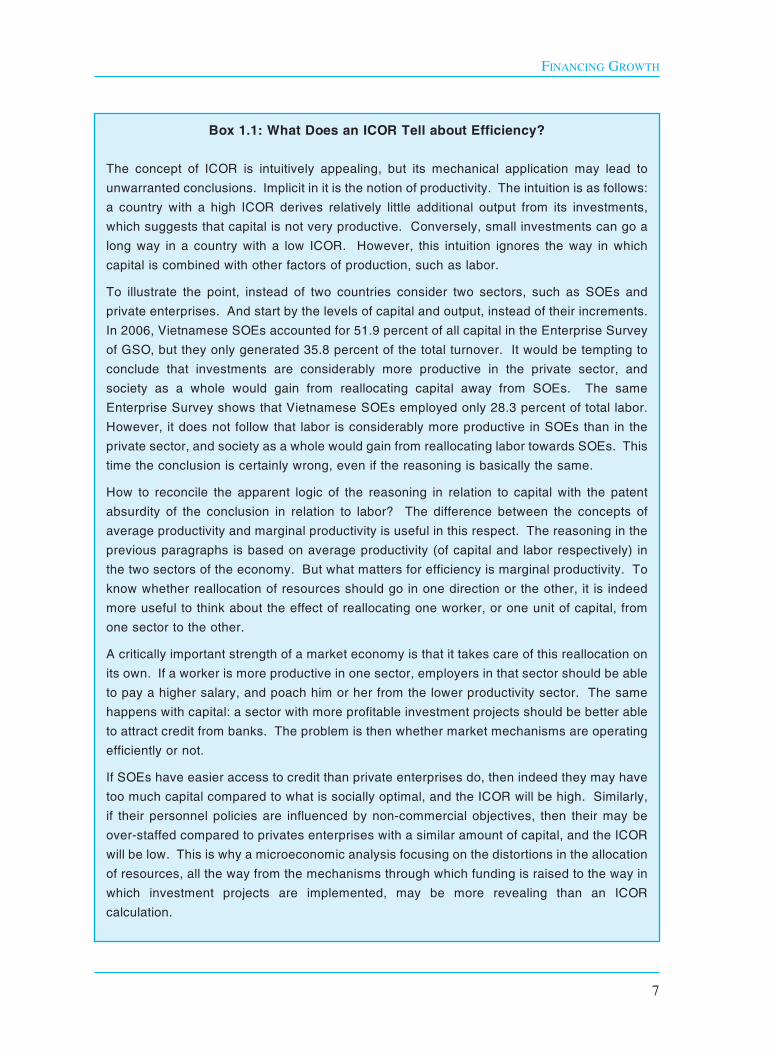
Box 1.1: What Does an ICOR Tell about Efficiency?
The concept of ICOR is intuitively appealing, but its mechanical application may lead tounwarranted conclusions. Implicit in it is the notion of productivity. The intuition is as follows:a country with a high ICOR derives relatively little additional output from its investments,which suggests that capital is not very productive. Conversely, small investments can go along way in a country with a low ICOR. However, this intuition ignores the way in whichcapital is combined with other factors of production, such as labor.
To illustrate the point, instead of two countries consider two sectors, such as SOEs andprivate enterprises. And start by the levels of capital and output, instead of their increments.In 2006, Vietnamese SOEs accounted for 51.9 percent of all capital in the Enterprise Surveyof GSO, but they only generated 35.8 percent of the total turnover. It would be tempting toconclude that investments are considerably more productive in the private sector, andsociety as a whole would gain from reallocating capital away from SOEs. The sameEnterprise Survey shows that Vietnamese SOEs employed only 28.3 percent of total labor.However, it does not follow that labor is considerably more productive in SOEs than in theprivate sector, and society as a whole would gain from reallocating labor towards SOEs. Thistime the conclusion is certainly wrong, even if the reasoning is basically the same.
How to reconcile the apparent logic of the reasoning in relation to capital with the patentabsurdity of the conclusion in relation to labor? The difference between the concepts ofaverage productivity and marginal productivity is useful in this respect. The reasoning in theprevious paragraphs is based on average productivity (of capital and labor respectively) inthe two sectors of the economy. But what matters for efficiency is marginal productivity. Toknow whether reallocation of resources should go in one direction or the other, it is indeedmore useful to think about the effect of reallocating one worker, or one unit of capital, fromone sector to the other.
A critically important strength of a market economy is that it takes care of this reallocation onits own. If a worker is more productive in one sector, employers in that sector should be ableto pay a higher salary, and poach him or her from the lower productivity sector. The samehappens with capital: a sector with more profitable investment projects should be better ableto attract credit from banks. The problem is then whether market mechanisms are operatingefficiently or not.
If SOEs have easier access to credit than private enterprises do, then indeed they may havetoo much capital compared to what is socially optimal, and the ICOR will be high. Similarly,if their personnel policies are influenced by non-commercial objectives, then their may beover-staffed compared to privates enterprises with a similar amount of capital, and the ICORwill be low. This is why a microeconomic analysis focusing on the distortions in the allocationof resources, all the way from the mechanisms through which funding is raised to the way inwhich investment projects are implemented, may be more revealing than an ICORcalculation.

objectives and targets, in turn, requiresimplementing a range of investmentprojects.
Going from these diverse objectives andpotential projects to concrete investmentfigures per sector is not straightforward. Forinstance, no readily-available estimatescould be found in the case of irrigation. Andfor other sectors, compiling the variousavailable estimates in a coherent way is adaunting task. However, the picture thatemerges from this exercise is one wherecapital accumulation needs remain massiveover the next few years (Table 1.2). Basedon this “engineering” approach, thegovernment would need to invest around11.5 billion dollars per year. This is theequivalent of more than 16 percent ofVietnam’s GDP in 2007.
However, no matter how impressive thetotal figure, this approach to assessinginvestment needs has important limitations
that reduce its usefulness. First, as the caseof irrigation shows, there is always a risk ofomitting important sectors, activities orprojects. Second, the engineering approachdoes not say much about who shouldundertake which investments. Most of theeffort goes into quantifying the cost ofpublicly funded infrastructuredevelopment. But it is clear that some ofthe effort could be undertaken by theprivate sector (electricity, oil and gas, andtelecommunications are obvious examples).Third, and related to the previous point, theengineering approach remains silent oninvestment needs in commercially-orientedsectors, such as manufacturing, real estateor tourism. Last but not least, it assumesthat all development objectives are attainedand all master plans implemented, whilethis may not be feasible (or may not be thebest choice) under all circumstances.
Another frequently used approach to assessinvestment “needs”, more economic in
CAPITAL MATTERS
8
0
2
4
6
8
10
12
14
2001 2002 2003 2004 2005 2006 2007
ICO
R(in
cons
tant
pric
es)
State sectorDomestic private sectorForeign-owned companies
Figure 1.2: The Incremental Capital-Output Ratio
Source: Based on data from GSO.

nature, relies on the ICOR. As discussedabove, the ICOR captures the relationshipbetween incremental capital on the one handand additional output on the other. Dividingboth terms by GDP, the relationshipbecomes one between the net investmentrate (incremental capital over GDP) and thegrowth rate of the economy (additionaloutput over GDP). Adding the depreciationrate to the investment rate, one obtains thegross investment rate.
The economic approach has the merit of itssimplicity, although the question remainswhether the standard ICOR is the relevantindicator for this calculation. To illustratehow the economic approach works, assumethat the ICOR is equal to 5, which is a roughaverage of the last few years in Vietnam.Assume also a depreciation rate equivalentto 4.5 percent of GDP, which is again the
average for Vietnam in recent years, basedon national accounts. Under theseassumptions, a GDP growth rate of 8.4percent per year is associated withinvestment “needs” amounting to 46.5percent of GDP (= 8.4 x 5 + 4.5). If thegrowth rate fell to 6 percent instead,investment needs would drop to 34.5 percentof GDP (= 6 x 5 + 4.5).
The economic approach also provides astraightforward assessment of the wayinvestment needs can be funded. This isusually done by assuming a constantdomestic savings rate. The differencebetween investment needs and the savingsrate needs to be financed by the rest of theworld. By definition, this difference is thedeficit of the current account of the balanceof payments. Put differently, if the countryinvests more than it saves someone else has
FINANCING GROWTH
9
Table 1.2: The Engineering Approach to Investment
Sector Billion dollars Forecast periodper year
I. Economic developmentTransport 2.8 n.a. Electricity 4.0 Until 2010Oil and gas 0.9 Imputed from 2008Telecommunications 0.7 Until 2010Urban development 0.7 Until 2010Water and sanitation (rural) 0.1 Until 2020Environmental protection 0.3 Until 2011Agriculture n.a.
II. Social developmentEducation 1.2 Imputed from 2008
Health 0.7 Imputed from 2008Total investment needs (I + II) 11.5
Source: Based on estimates by the World Bank, the International Monetary Fund (IMF), the Ministryof Finance (MOF), and various line ministries.

to fill the gap. In countries with low savingsrates, the current account deficit is mainlydue to large imports of consumer goods, inexcess of total exports. In countries withhigh investment rates, like Vietnam, largeimports of capital goods tend to drive thedeficit.
Again, to illustrate how this approach works,assume a domestic savings rate equal to 30percent of GDP, close to the Vietnameseaverage in recent years. With a growth rateof 8.4 percent per year, the current accountdeficit amounts to 16.5 percent of GDP (=46.5 – 30). This is a remarkably large figure,one that would raise concerns among creditrating agencies. But the current accountdeficit would drop by more than two thirds,to a much more palatable 4.5 percent of GDP(= 34.5 – 30), if the growth rate fell to 6percent (Figure 1.3). Modulating the growthrate of the economy is thus a way to controlthe magnitude of the current account deficit.Much of the recent macroeconomic debate
in Vietnam has implicitly relied on this typeof analysis.
Investment funding
A less mechanical way to analyze theprovenance and use of resources is the flow-of-funds analysis (Table 1.3). The mostrecent year for which this snapshot analysiscan be conducted is 2007. Ideally, theexercise should be conducted annually, tointroduce a time-series dimension, inaddition to the snapshot. Moreover, themacroeconomic situation is changing quitedramatically as a result of the globalfinancial crisis, so that the analysis for 2008could be quite different. And the quality ofavailable data leaves something to bedesired, so the results should be interpretedwith caution. Nevertheless, this snapshotgives interesting insights.
Following a standard practice, the economyis divided into government, the privatesector, government, the banking sector, andthe rest of the world. The government sector
CAPITAL MATTERS
10
0
10
20
30
40
50
60
0 2 4 6 8
GDP growth rate (in percent)
Perc
ento
fGD
P
Net investment Gross investment Savings
Figure 1.3: The Economic Approach to Investment
Source: Own estimates.

includes on-budget capital expenditure and“off-budget” investment expenditure(mainly infrastructure bonds). A moredifficult decision concerns the classificationof on-lending of ODA and other resources.Much of the on-lending goes to lower levelsof government, but large SOEs such asElectricity of Vietnam have benefitted fromit as well. The balance is probably tilted inthe opposite direction in the case of lendingby the Vietnam Development Bank (VDB),which has a strong customer base amongSOEs. Short of classifying on a loan-by-loanbasis, the most defensible rule is to classifyVDB loans as finance for SOEs and the restof on-lending as budgetary resources forlower levels of government. Followingstandard practice, SOEs are counted as partof the private sector. An effort to treat themseparately required too many assumptions tobe credible.
The main sources of information to conductthe flow-of-funds analysis are the budget inthe case of the government, the monetarysurvey in the case of the banking sector, andthe balance of payments in the case of therest of the world. Private sector data iscompiled from the other sources, using thedouble entry principle, and balancing theaccount through the estimate of value addedfrom domestic sales (a variable that can onlybe measured with a considerable margin oferror). In principle, the accounts for theother three sectors should balance, in thesense that financing should match thedifference between expenditures andincome, if there is any. Unfortunately,budget sector data in Vietnam do not meetthis requirement. The budget deficit is muchhigher when it is measured as the differencebetween expenditures and income (thestandard definition) than when it is
calculated as the sum of all financialresources mobilized (such as domestic debtand foreign debt). The difference betweenthe two measures is due to revenuecarryovers, which are treated here as othergovernment income.
This snapshot analysis reveals some clearpatterns. A few of them are clearly visible inmore standard presentations of the samedata; others less so. Among the relativelyobvious patterns is the breakdown ofinvestment by sector. The governmentaccounts for roughly 30 percent of totalcapital accumulation, whereas the privatesector and SOEs contribute 70 percent of it,with roughly 10 percentage points investedby SOEs. This pattern was already clear inthe gross investment data discussed earlier.
Both government and the business sectorinvested more than they saved, implyingthat they both needed to resort to finance.On the surface, they did it to similarextents. The financing gap for the privatesector and SOEs was 58.7 trillion dong,equivalent to 3.6 percent of their totalincome and 18.0 percent of total capitalaccumulation. In the case of government,the gap amounted to 26.2 trillion dong, andthe corresponding ratios were 7.6 and 18.6percent respectively. However, this isbecause carryovers are being treated asrevenue. If they were classified asfinance, then the ratios for governmentwould climb to 17.1 and 38.4 percentrespectively. It follows that in 2007 thegovernment was less thrifty than theprivate sector and SOEs. The mainprovider of financial resources was the restof the world, with the current accountdeficit representing roughly 18.2 percent oftotal capital accumulation in Vietnam.
FINANCING GROWTH
11

CAPITAL MATTERS
12
Table 1.3: The Financial Approach to Investment
Government
Source Use Items included
1. ReceiptsExportsTransfers 4.3 ODA grantsTaxes 265.9 Taxes and oil-related revenueOther income 73.4 Non-tax revenue + carryovers
2. Current ExpenditureConsumption 157.3 Non-salary expenditureImports 4.7 Gasoline subsidy
Transfers 67.3 SalariesTaxesOther
3. Investment expenditure 140.5 Includes off budget but no VDB4. Saving (=1- 2) 114.35. Net financing (=6+7+8+9) 26.26. To/from government7. To/from private sector 15.8 Bonds and VDB borrowing8. To/from financial sector 7.4 Change in deposits - loans9. To/from rest of the world 17.8 Change in foreign public debt
Private sector and SOEs
Source Use Items included
1. ReceiptsExports 878.5 Exports of goods and servicesTransfers 108.2 Remittances + gasoline subsidyTaxesOther income 660.2 Domestic value added (residual)
2. Current ExpenditureConsumptionImports 1032.2 Imports of goods and services
TransfersTaxes 265.9 Taxes and oil-related revenueOther 80.5 FDI profits + non-tax revenue
3. Investment expenditure 327.0 Total - government investment4. Saving (=1- 2) 268.35. Net financing (=6+7+8+9) 58.76. To/from government 15.8 Bonds and VDB borrowing7. To/from private sector8. To/from financial sector 115.1 Change in deposits + liquidity9. To/from rest of the world 189.6 FDI + portfolio + loans
(continued)

FINANCING GROWTH
13
Table 1.3: The Financial Approach to Investment (Continued)
Financial sector
Source Use Items included
1. ReceiptsExportsTransfersTaxesOther income
2. Current ExpenditureConsumptionImports
TransfersTaxesOther
3. Investment expenditure4. Saving (=1- 2)5. Net financing (=6+7+8+9)6. To/from government 7.4 Change in deposits - loans7. To/from private sector 115.1 Change in deposits + liquidity8. To/from financial sector 9. To/from rest of the world 122.5 Change in bank's foreign assets
Rest of the world
Source Use Items included1. Receipts
Exports 1032.2 Imports of goods and servicesTransfers 34.7 FDI profitsTaxesOther income
2. Current ExpenditureConsumptionImports 878.5 Exports of goods and services
Transfers 103.5 RemittancesTaxesOther
3. Investment expenditure4. Saving (=1- 2)5. Net financing (=6+7+8+9) 84.96. To/from government 17.8 Change in foreign public debt7. To/from private sector 189.6 FDI + portfolio + loans8. To/from financial sector 122.5 Change in bank's foreign assets9. To/from rest of the world
Source: Own calculations based on data from CSO, IMF and SBV. Figures are in trillion dong.

(Flow-of-fund analyses are built on theassumption that the financial sector is apure intermediary, neither saving norinvesting).
A closer look at the government accountshows the importance of taxes as the mainsource of revenue, and the relatively evensplit of finance between domestic borrowingand external borrowing. It also appears thatthe government used some of theseresources to increase its financial assets,under the form of an additional 7.4 trilliondong in deposits in commercial banks. Thismay not be a good choice from an economicpoint of view, and may simply reflectweaknesses in cash management.
In the case of the business sector, exportsaccount for 53.3 percent of total income,which shows how open the Vietnameseeconomy is by now. And an additional 6.3percent of income is under the form ofremittances from abroad. The role of globalintegration is even more striking whenlooking at the financing side of the equation.An astounding 189.6 trillion dong, theequivalent of 58 percent of total capitalaccumulation by the private sector andSOEs, was received under the form of FDI,portfolio investment or lending from abroad.It is also striking to see the large fraction ofbusiness resources devoted to financialinvestments in 2007. Changes in bankingdeposits (net of loans) and governmentbonds (directly or through social securitycontributions) were equivalent to roughly 40percent of capital accumulation. This is anindication of financial deepening, but such arapid pace is a matter for concern.
Sustainable accumulation?
With Vietnam investing considerably more
than it saves, the question is whether thismassive accumulation effort is sustainableover time. For the country as a whole, thefinancing gap is the same as the currentaccount deficit of the balance of payments.In 2007, this deficit almost reached 10percent of GDP, which is usually considereda warning threshold. However, comparingthe current account deficit to the country’sGDP is a rudimentary approach to assesswhether it is too large or of adequate size.
Vietnam’s external debt position hashistorically been robust. Most of its debt isconcessional, enjoying a low average, fixedinterest rate, long maturities, and nobunching of repayments. With support froma variety of multilateral and bilateralcreditors, it also has a fairly diversifiedcurrency composition. It has access to strongprivate remittances, which help finance itstrade deficit, and strong FDI inflows whichprovide significant non-debt creatingfinancing. Moreover, the government hasbeen prudent in external borrowing. Thesovereign external market was onlyaccessed once, for a ten-year maturity 750million dollar bond. External debt isestimated to total 29.7 percent of GDP, and21.6 percent in the case of the public sector.
In terms of liquidity, in 2007 the service ofexternal debt amounted to 6.2 percent ofexports whereas the service of publicexternal debt represented 11.9 percent ofgovernment revenues. These ratios remainmanageable, well within the thresholdsjointly established by the World Bank andthe IMF. And they are expected to declinefurther in 2008, to 3.2 and 4.2 percentrespectively. Although the current accountdeficit increased markedly in 2007,
CAPITAL MATTERS
14

financing from FDI and portfolio inflowsalso rose considerably. The rapid growth ofexports and FDI inflows, buoyantgovernment revenue and the appreciation ofthe dong underlie the expected reduction inthese ratios in 2008.
Vietnam’s debt situation has remainedrelatively favorable despite the significantmacroeconomic imbalances that emerged in2007. The much larger current account deficitwas partly financed by much higher FDI andportfolio inflows. The latter declined in 2008,
but the former increased. Looking forward,under plausible macroeconomic assumptions,the present value of external debt is projectedto decline consistently in relation to GDP,exports, and revenue (Figure 1.4). Stress testsindicate that the present value of debt to GDPratio is most sensitive to an increase in otherdebt creating flows, and to a lower primaryfiscal balance. A one-time 30 percentdepreciation would have less impact on thepresent value of debt. But even the mostextreme negative shock would not destabilizekey ratios over the longer term.
FINANCING GROWTH
15
0
10
20
30
40
2007 2008 2009 2010 2011 2012 2013 2014
Perc
ento
fGD
P
All nominal Public sector nominal
All present value Public sector present value
Figure 1.4: A Robust External Debt Position
Source: Joint IMF-World Bank debt sustainability assessment (IMF, 2008).

16
The analysis of economic growth is usuallydissociated from that of macroeconomicstabilization. This is because the time spansinvolved are different, and also becausegrowth is perceived as dealing withquantities, whereas stabilization has to dowith prices. However, in an economyaccumulating resources as massively asVietnam, the connection between growthand stability cannot be ignored. There aretwo mechanisms connecting largeinvestments with prices. One of them isrelatively benign, the other more worrisome.On the benign side, some goods and servicesbecome more expensive as countries growricher. These are basically goods andservices that cannot be easily traded with therest of the world. Housing and personalservices are obvious examples. The result isthat richer countries tend to be moreexpensive, and the same pattern can beobserved across provinces within Vietnam.The implication is that rapid growth isassociated with real exchange rateappreciation. In a country growing rapidly,appreciation happens at a non-trivial speed.The more worrisome mechanism is relatedto the balance of payments. Unless thedomestic savings rate increasessubstantially, accumulating capital in thescale Vietnam did in recent years is bound torequire large foreign savings. However,capital inflows tend to be volatile, as they
are affected by market sentiment. Investors’perceptions can switch from exuberance tofear in no time, for reasons that may havelittle to do with Vietnam’s actualperformance. Sudden capital outflows areobviously dangerous for economic stability,but surges in capital inflows are dangeroustoo, as they can result in asset price bubbles.These more dramatic swings in relativeprices typically result in inefficiencies in theallocation of capital and may eventually leadto costly financial crises. Massive capitalaccumulation may thus hold the key to rapideconomic growth, but it also confronts policymakers with unusual challenges.
Prices and quantities
Massive capital accumulation is associatedwith a greater availability of goods andservices, but also with changes in therelative prices of those goods and services.The first dimension (quantities) isemphasized in most analyses abouteconomic growth, but the second one(prices) is quite often ignored. Or, moreaccurately, variation in relative prices isanalyzed from a cross-country perspective,for instance in the context of purchasingpower parity analyses, but not from a timeperspective.
Dissociating quantities from prices isunderstandable when long-term growth of
2. TRANSFORMATION AND TURBULENCE

GDP per person is in the order of 1 or 2percent per year, as was the case for most ofthe Western countries which are developedby now. At that pace, changes in relativeprices are bound to take place over longperiods of time. So long that they becomeirrelevant from the point of view ofmacroeconomic policy. But several EastAsian countries have experienced muchfaster growth, crossing in one or twogenerations the income range that industrialcountries spanned over one or two centuries.As Vietnam stands a chance to do the same,it is useful to understand how rapid growthmay affect relative prices in the short term.
Purchasing power parity analyses provide auseful starting point. These analysescompare the price, in dollar terms, of acommon set of goods and services acrosscountries. The simplest version focuses onjust one homogeneous product which issupposed to be made to the samespecifications and delivered in the samemanner all around the world, namelyMcDonald’s Big Mac hamburger. In spite ofthe homogeneity of the product, the price ofa Big Mac varies from 1.8 dollars in China to3.6 dollars in the United States to 7.9 dollarsin Norway. More refined analyses considera broader basket of goods and services, withthe assessment becoming increasinglycomplicated when items such as health careor education are considered.
Whatever the definition of the basket andthe methodological choices made formeasurement, the ratio between the cost ofthe basket in a specific country and the samebasked in the United States indicates howmany cents of a dollar are needed in thatcountry to enjoy the same purchasing powerone dollar has in the United States.
As an illustration, PPP correction factorshave played an important role in themeasurement of world poverty, whichusually involves counting which fraction ofthe population lives on less than “one dollara day”. In this context, “one dollar” meansone dollar with United States purchasingpower. In developing countries, that isactually much less than one dollar. Forinstance, in the case of Vietnam the mostrecent PPP correction factor is 0.322, whichmeans that 32.2 cents buy the same inVietnam as one dollar does in the UnitedStates.
As a general rule, adjustments forpurchasing power parity are larger in poorercountries, which is another way to say thatthose countries are cheaper (Figure 2.1).While there is considerable dispersionacross countries, the overall pattern is clear.A regression analysis involving the 169countries for which data are available showsthat an increase of 1 percent in GDP perperson (measured in dollar terms) isassociated with a 0.2 percent increase inprices (measured in dollar terms too). If thesame relationship applied to individualcountries over time, a growth rate of GDPper capita of 12.5 percent (the rough figurefor Vietnam in 2001-2007) would beassociated with an annual appreciation in theorder of 2.5 percent.
Exchange rate appreciation
There are reasons to suspect that the pace ofappreciation could be even faster in the caseof Vietnam. To begin with, Vietnam remainsconsiderably cheaper than other countries ata similar development level. While its PPPconversion factor is 0.322, the predictedvalue (given by the estimated line in Figure
TRANSFORMATION AND TURBULENCE
17

2.1) is 0.441. Just catching up to thepredicted value would require a 37 percentincrease in domestic prices, in dollar terms.Admittedly, the development level is not theonly good predictor of PPP conversionfactors. But increased internationalintegration, especially after the WTOaccession, can be expected to lead to a moreaccelerated convergence of Vietnam toglobal norms and patterns across a range ofdimensions. Similarity of prices could beone of them.
Price disparities across provinces also hint atthe possibility of rapid appreciation. Thestandard analyses of PPP correction factorsacross countries can indeed be reproducedusing Vietnamese provinces as the unit ofobservation (Figure 2.2). In this case, ratherthan a given basket, a set of individual goodsand services such as rice, labor and housingcan be considered. In terms of the scope totrade these goods and services across
provinces, they range from the fully mobile(rice) to the partially mobile (labor) to thefully immobile (housing).
In line with the pattern uncovered by cross-country analyses, goods and services aremore expensive in richer provinces. And notsurprisingly, the relationship is steeper theless mobile the good or service is. Anincrease of one percent in expenditure perperson is associated with a 0.11 percentincrease in the average price of rice (perkilo), a 0.83 percent increase in the averagewage level (per hour), and a 1.63 percentincrease in the average housing price (persquare meter). Admittedly, housing andworkers are less homogeneous acrossprovinces than rice, which implies that someof the estimated gap in prices may simplyreflect differences in quality. But thepotential for appreciation implied by theestimated relationships seems considerable.
To illustrate the point, consider the
CAPITAL MATTERS
18
0.0
0.2
0.4
0.6
0.8
1.0
0 2,000 4,000 6,000 8,000
GDP per person (current dollars)
Loc
alpr
ices
rela
tive
toU
Spr
ices
Actual Vietnam
Figure 2.1: Richer Countries Are more Expensive
Source: Own calculations using data from the World Bank.

average growth rate of Vietnam’s GDP perperson during the period 2001-2007,measured in dollars. This rate was about12.5 percent, so that the growth rate ofexpenditures per person must have beensimilar. If quality effects are ignored, a12.5 percent increase in averageexpenditures per person, measured indollars, would be associated with a 1.4percent increase in the price of rice, a 10.4percent increase in labor earnings and a20.4 percent increase in the cost ofhousing. These increases are measured indollar terms too. And while they sufferfrom measurement problems, related to thedifferent quality of labor and housingacross provinces, they are plausible. Forinstance, based on household survey data,labor earnings grew by a cumulative 12.5percent per year between 1998 and 2006,at a time when the exchange rate wasstable. A weighted average of thesefigures reflecting the relative importanceof mobile, partially mobile and less mobileitems in a hypothetical basket of goods andservices is bound to yield a large priceincrease associated with growth, possiblymuch larger than cross-country analysessuggest.
Last but not least, time trends in theadjustment for purchasing power parity alsopoint in the direction of rapid appreciation.Between 2001 and 2007, the ratio ofdomestic prices to United States prices grewby 3 percent per year in the case of Vietnam,half a percentage point faster than the cross-country comparison would suggest, and halfa percentage point faster than China too.This does not appear to be a statisticalartifact, given that the trend is almost thesame when a longer period is considered.
For instance, between 1991 and 2007, theratio of domestic prices to United Statesprices increased by 2.9 percent per year,compared to 1.5 percent in the case of China.
Capital inflows and prices
The acceleration of capital accumulationexperienced by Vietnam in recent years wasaccompanied by a dramatic change in thecomposition of the balance of payments.Between 2005 and 2007 the investment ratioincreased from 40.9 to 45.6 of GDP. Overthe same period, the current account deficitincreased from 0.9 to 9.8 percent of GDP.The capital account surplus increased evenfaster, from 4.8 to 24.6 percent of GDP.
This trend is now being reversed, due to theturbulence in international financial markets,and the reversal could be dramatic.However, beyond the shifts in marketsentiment, it is clear that attempts to growrapidly are bound to lead to current accountdeficits if they are not accompanied by anincrease in the domestic savings rate. Largecurrent account deficits need to be matchedby similarly large capital inflows. And this,in turn, may create considerable pressure ondomestic demand and prices.
In 2007 alone, 17.5 billion dollars in FDI,portfolio investments, banking credit andOfficial Development Assistance (ODA)entered the country. If remittances areadded (they are usually counted as part ofthe current account) total inflows reached 24billion dollars (Figure 2.3). This is theequivalent of 33.7 percent of GDP. To givea sense of perspective, in none of the yearsfor which data are available did the capitalaccount balance of China exceed 5 percentof GDP. Out of 129 countries for which data
TRANSFORMATION AND TURBULENCE
19

are available in 2007, only 13 had largercapital account balances than Vietnam.
Absorbing such large capital inflows would bedifficult for an industrial country with maturefinancial institutions. It is enormouslychallenging for a country that is still in theprocess of establishing a modern central bank.To be clear, a large capital account balance isthe flip side of massive capital accumulation.As shown by the economic approach tofinancing needs, an investment ratio in excessof the domestic savings rate is bound to leadto a current account deficit. But in the case ofVietnam, the hype associated with WTOaccession resulted in capital inflows farexceeding the current account deficit.
This confronted the government with the“impossible trinity” of having capitalmobility a fixed exchange rate and anindependent monetary policy.
Massive capital inflows needed to beconverted into dong to support the purchaseof goods, services and financial instrumentsin Vietnam. In the absence of governmentintervention, this would have resulted in amore expensive dong or, equivalently, acheaper dollar. Most mature economieswould have allowed this nominal exchangerate appreciation as a way to absorb theshock. But the government preferred toprevent this appreciation, mainly to avoid aloss of competitiveness. There was a fearthat nominal exchange rate appreciationwould punish exporters and eventuallyundermine the appetite of foreign investorsto bring capital to Vietnam.
In practice, there is an additional reason whya prudent approach to exchange rateflexibility might have been warranted, andthat is the risk of affecting the liquidity, or
CAPITAL MATTERS
20
0
20
40
60
80
100
120
140
0 2000 4000 6000 8000 10000 12000
Expenditure per person (thousand dong)
Pric
eof
rice
(ave
rage
=10
0)
Actual Predicted
0
50
100
150
200
250
0 2000 4000 6000 8000 10000 12000
Expenditure per person (thousand dong)
Ear
ning
spe
rho
ur(a
vera
ge=
100)
Actual Predicted
0
200
400
600
800
0 2000 4000 6000 8000 10000 12000
Exoenditure per person (thousand dong)
Pric
eof
hous
ing
(ave
rage
=10
0)
Actual Predicted
Figure 2.2: Richer Provinces Are more Expensive
Source: Own calculations using data from GSO.

even the solvency, of commercialenterprises and financial institutions.Balance sheet effects of this sort were one ofthe main reasons why the East Asian crisis of1997 was so severe.
Currency mismatches are still common inVietnam, and hedging against exchange riskis not developed. Accounting standards donot reveal which fraction of assets andliabilities is denominated in dong and whichfraction in foreign currency, making itdifficult to tell who is exposed and who isnot. Moreover, after many years with thedong unofficially pegged to the dollar, thevery notion of exchange rate risk soundedhypothetical to many.
Regardless of whether the decision tostabilize the exchange rate market wasjustified or not, it certainly led to asubstantial increase in the liquidity of theeconomy. When SBV purchases the capitalinflow to prevent the currency fromappreciating, it injects dong in the economy.This additional liquidity can in turn be
“mopped up” by selling bonds, but in 2007the SBV almost run out of governmentsecurities to sell. Money supply can also betightened by selling SBV bills, but theinterest rate offered was not attractiveenough. As a result, banking credit wasgrowing by more than 63 percent by March2008, fueling consumer prices, imports, anda real estate bubble.
Asset price bubbles
There is an inherent instability in the“impossible trinity”. Once themacroeconomic situation runs out of control,it can rapidly drift in the direction offinancial instability. Towards the end of2007, the government started facing failureafter failure in its attempts to sell securitiesin order to mop up liquidity. The interestrate needed to make bonds and securitiesattractive appeared to be too high, hence tocostly to either the budget or SBV.Sterilization did not catch up with capitalinflows, liquidity expanded and the bankingsystem recycled it into loans. This in turn
TRANSFORMATION AND TURBULENCE
21
0
5
10
15
20
25
2005 2006 2007
Billio
nU
Sdo
llars
Portfolio, short-term and errorsMedium and long-term loansRemittancesFDI net of profit repatriation
0
5
10
15
20
25
2005
Billio
nU
Sdo
llars
Trade deficit (goods and services)
Figure 2.3: A Changing Balance of Payments
Source: Own estimates based on data from State Bank of Vietnam (SBV) and GSO.
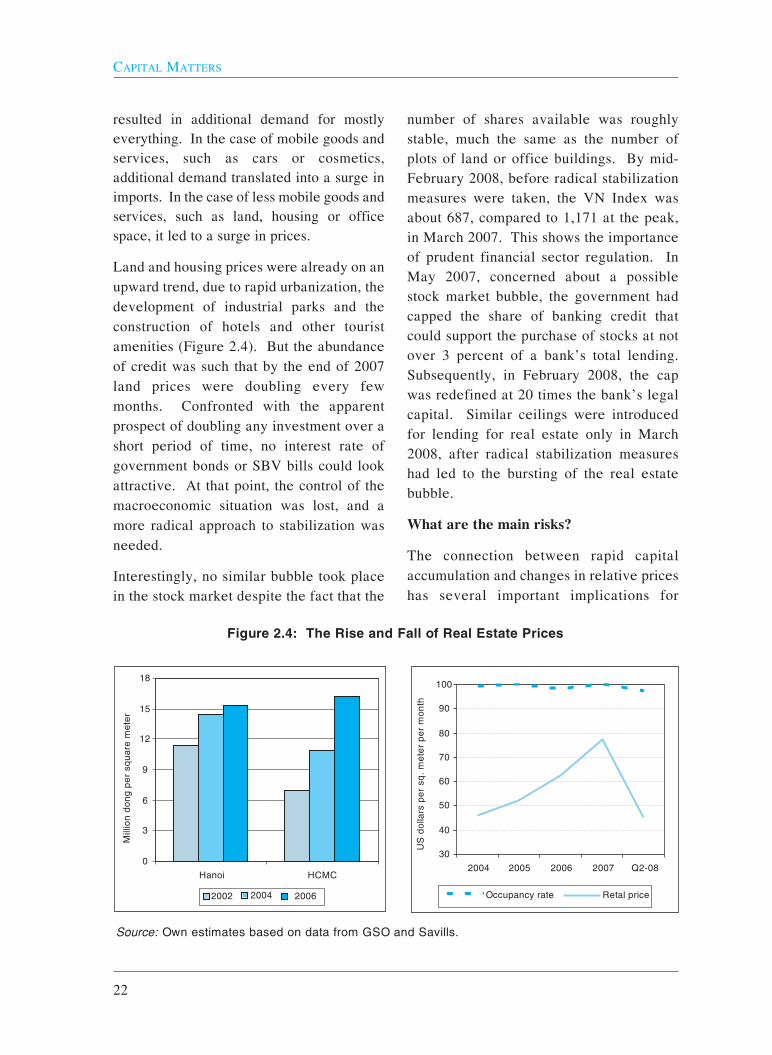
resulted in additional demand for mostlyeverything. In the case of mobile goods andservices, such as cars or cosmetics,additional demand translated into a surge inimports. In the case of less mobile goods andservices, such as land, housing or officespace, it led to a surge in prices.
Land and housing prices were already on anupward trend, due to rapid urbanization, thedevelopment of industrial parks and theconstruction of hotels and other touristamenities (Figure 2.4). But the abundanceof credit was such that by the end of 2007land prices were doubling every fewmonths. Confronted with the apparentprospect of doubling any investment over ashort period of time, no interest rate ofgovernment bonds or SBV bills could lookattractive. At that point, the control of themacroeconomic situation was lost, and amore radical approach to stabilization wasneeded.
Interestingly, no similar bubble took placein the stock market despite the fact that the
number of shares available was roughlystable, much the same as the number ofplots of land or office buildings. By mid-February 2008, before radical stabilizationmeasures were taken, the VN Index wasabout 687, compared to 1,171 at the peak,in March 2007. This shows the importanceof prudent financial sector regulation. InMay 2007, concerned about a possiblestock market bubble, the government hadcapped the share of banking credit thatcould support the purchase of stocks at notover 3 percent of a bank’s total lending.Subsequently, in February 2008, the capwas redefined at 20 times the bank’s legalcapital. Similar ceilings were introducedfor lending for real estate only in March2008, after radical stabilization measureshad led to the bursting of the real estatebubble.
What are the main risks?
The connection between rapid capitalaccumulation and changes in relative priceshas several important implications for
CAPITAL MATTERS
22
0
3
6
9
12
15
18
Hanoi HCMC
2002 2004 2006
30
40
50
60
70
80
90
100
2004 2005 2006 2007 Q2-08
Occupancy rate Retal price
Mill
ion
dong
per s
quar
em
eter
US
dolla
rspe
r sq.
met
erpe
r mon
th
Figure 2.4: The Rise and Fall of Real Estate Prices
Source: Own estimates based on data from GSO and Savills.

policy making in Vietnam. On the benignside, the prospects for Vietnam to becomean industrial country within one generationare brighter than calculations “at constantprices” suggest. Economic growth resultsin more goods and services been produced,but it also leads to a sustained increase inthe price of some of those goods and
services, including real estate, housing andlabor. These price effects will lead toincreased wealth by many, if not most,Vietnamese families. The consequencesare far from trivial, as shown by somesimple arithmetic on how long it would takefor the country to catch up with itsneighbors (Box 2.1).
TRANSFORMATION AND TURBULENCE
23
Box 2.1: How many Years to Catch Up?
Forecasting long-term growth trends is a task economists do not excel at. For instance,there was a time when discussing how many years it would take for the Soviet Union to catchup with the United States seemed to make sense, in the understanding that the answer was:“not many”. In the early 1970s, even the famous economics textbook by Nobel Prizelaureate Paul Samuelson devoted an entire section to this discussion. In all fairness, theSoviet Union’s military prowess and its remarkable space program gave some plausibility tothe hypothesis of a quick catch up. And yet, forecasts ignored the fundamental weaknessesof the central planning model, making the entire discussion meaningless less than twodecades later. Conversely, in 1977 Nobel Prize laureate James Meade also announced thatMauritius was a hopeless case in economic development. But Mauritius turned out to be oneof the greatest success stories in economic development ever.
With the poor track record of the profession in mind, forecasting how long it would take toVietnam to catch up with its neighbors is a risky undertaking. But it is interesting to see howsensitive the (hypothetical) answer is to real exchange rate appreciation trend.
In 2007, income per person attained 836 dollars in Vietnam, 1,918 in Indonesia, 3,850 inThailand and 35,163 in Singapore. Over period 2001-2007, growth rates of income perperson (measured at constant prices) were 6.5, 4.8, 4.8 and 4.0 percent per yearrespectively. If these rates are considered, then indeed it takes a very long time for Vietnamto catch up: 51 years with Indonesia, 95 with Thailand and 158 with Singapore. However,growth rates of income per person measured in dollar terms were 12.5, 6.4, 4.9 and 6.0percent per year respectively. Using them instead, the time needed for Vietnam to catch upis 15, 22 and 63 years respectively. This shows the potentially far-reaching implications ofchanges in relative prices for a fast-growing country.
All of this is, of course, purely hypothetical. Nobody can tell whether Vietnam will go the wayof the Soviet Union or be a success story like Mauritius. Although the latter seems morelikely, it will all depend on economic policy decisions that will be made over the coming years.But if Vietnam was to keep growing at its current pace, the prospect of catching up with itsneighbors in one generation would not be unrealistic.

Also on the benign side, Vietnam will needto accept a gradual but steady realappreciation over time. The magnitude isbound to be small on an annual basis, butcertainly not nil; perhaps a few percentagepoints per year. With the current exchangerate policy, which implicitly pegs the dong tothe dollar, real exchange rate appreciationwill happen through domestic inflation. Itcould also happen through nominalexchange rate appreciation if the authoritieswere to allow it. In any event, the fear oflosing competitiveness would be misplacedin relation to this trend. The real exchangerate appreciation trend comes from the veryfact that Vietnam is growing rapidly, hencebecoming more productive. In fact, a lookback shows that the trend has not conflictedwith sustained penetration of Vietnameseexports in international markets so far(Figure 2.5).
On the more worrisome side, the variability
of capital inflows may confront Vietnamwith sudden outbursts of real exchange ratevolatility, as the experience of late 2007 andearly 2008 showed. Ideally, the currentaccount deficit of the balance of paymentsshould be roughly equal to the inflow oflong-term capital to the country, in whichcase SBV should be able to retain control ofthe money supply. But capital inflows aremore volatile than the current accountdeficit, and there may be times when the gapwill put pressure on macroeconomicmanagement.
The experience of 2008 is revealing in thisrespect. While the final figures for the yearare not known yet, most likely Vietnam willhave experienced a real exchange rateappreciation in the double digits. On thebenign side, this implies that GDP perperson measured in dollar terms has grownfaster than expected. The goal of the SEDPwas to cross the 1,000 dollar benchmark
CAPITAL MATTERS
24
2001
2002
2003
20042005
20062007
30
40
50
60
70
80
0.25 0.26 0.27 0.28 0.29 0.30 0.31 0.32 0.33
Local prices relative to US prices
Expo
rts(in
perc
ento
fGD
P)
Figure 2.5: The Real Exchange Rate and Export Performance
Source: Own estimates based on data from GSO and World Bank.

TRANSFORMATION AND TURBULENCE
25
some time in 2011, towards the end of thefive-year planning cycle. Chances areVietnam will have reached this milestonethree years earlier than planned. In a way,substantial exchange rate appreciation couldbe expected as a result of WTO accession.
But it may be difficult for government todetermine how substantial the appreciationshould be, and whether the double-digitjump of 2008 is something that needs to becorrected in the coming years, or rather onemore step in a longer-term process.


PART II:SOURCESAND USES
27


Assessing the efficiency of capitalaccumulation requires analyzing one by onea series of steps, from the channels throughwhich resources are raised to themechanisms through which they areallocated to projects to the ways in whichthose projects are implemented andmonitored. There is a similarity between thisdeconstruction of investment processes and avalue-chain analysis in the case of productionprocesses. In both cases, the goal is toidentify concrete inefficiencies more than tomake sweeping claims based on aggregateindicators. With government-fundedinvestments accounting for roughly one thirdof capital accumulation in Vietnam, especialattention should go to taxation. Taxes andfees are the main source of governmentrevenue, hence a key determinant ofgovernment savings. But they also affect theincentives faced by enterprises andhouseholds, and entail administrative costs.All of this results in a burden for society,potentially affecting the savings capacity ofother stakeholders. Vietnam has undertakentwo major reforms of its tax system, and isnow in the process of implementing a thirdone. The objectives this time are to copewith the expected decline in trade-relatedrevenue as the economy integrates with therest of the world, and to adjust to the surge inthe number of potential taxpayers as marketmechanisms develop. The tax system has
been coping well so far, ensuring stablerevenue for government and a goodperformance of its main tax instruments. Butthere are still important design gaps. If theyremain unaddressed, they could result in anencouragement of informality, themismanagement of natural resources, and thewidening of inequality. Existing taxinstruments can also be simplified tominimize waste. Tax administrationprocesses need to be revamped to match thetransformation of the taxpayer base.
A system in transition
Rapid global integration and thedevelopment of market mechanisms willtransform Vietnam’s tax base in the comingyears. Previous milestones in the tradeintegration process were the membership ofVietnam in the ASEAN Free Trade Area(AFTA) and the bilateral trade agreementwith the United States (USBTA). But themost important step was becoming amember of the WTO in early 2007. As aresult of this process, and beyond thespecific milestones, the trade policy regimehas undergone significant changes mainly inthree directions. Restrictions on the right toimport and export have been relaxed, tariffrates have been reduced, and non-tariffmeasures have been slackened.
Import and export duties still accounted for
29
3. TAX REVENUE

3.6 percent of GDP in 2001, when the reformprocess accelerated. By 2007, they weredown to 2.1 percent. So far, this decline intax revenue has been more thancompensated by the good performance ofother tax instruments (Table 3.1). Also,increasing global integration is leading to ahigher ratio of imports to GDP, so that thereduction in tariff rates is partly offset by theincrease in the tax base. But Vietnam needsto prepare for the gradual disappearance oftrade-related revenue.
Meanwhile, the emergence of a vibrantprivate sector is changing the potentialnumber and composition of taxpayers. For acountry with a population of 86 million,Vietnam still has relatively few of them. Atpresent, some 270,000 enterprises andorganizations, and 1.62 million businesshouseholds are registered for tax purposes.But these numbers are bound to increaserapidly. In 2007 alone, 63,655 new
businesses registered under the EnterpriseLaw. Many of them are small, fallingsomewhere in between the myriadhousehold businesses of Vietnam and themuch bigger SOEs and foreign-investedcompanies. An in-depth analysis ofenterprise transitions (from one size toanother, or to exit) suggested that the“missing middle” of the size distributioncould be filled quite rapidly. The expectationis that the number of enterprises willincrease by close to 50 percent within fiveyears. The number of small taxpayers couldreach at least 2.3 million by 2012.
The institutional nature of taxpayers matterstoo. Tax collection from SOEs still constitutesthe major source of revenue government,accounting for 54 percent of all EnterpriseIncome Tax (EIT) proceeds and 42 percent ofValue Added Tax (VAT) proceeds fromdomestic production. With the move to amarket economy, the importance of SOEs in
CAPITAL MATTERS
30
Table 3.1: Composition of Government Revenue
Percent of total revenue 2001 2002 2003 2004 2005 2006 2007eTax revenue 78.5 80.2 74.8 69.6 71.4 79.6 77.9
Value added tax (VAT) 18.6 21.3 21.0 19.5 19.2 20.7 22.1Excise tax 6.0 6.0 5.6 6.4 6.6 6.5 5.5Enterprise income tax (EIT) 32.1 30.3 30.0 28.7 31.8 38.2 32.6Personal income tax (PIT) 2.0 1.9 1.9 1.8 1.8 2.0 2.3Import and export duties 16.8 18.0 14.2 10.9 9.9 10.0 12.2Land and housing tax 0.3 0.3 0.2 0.2 0.2 0.2 0.2Licence tax 0.4 0.3 0.5 0.3 0.3 0.3 0.3Tax on transfer of properties 1.1 1.1 1.1 1.3 1.2 1.3 1.8Levies on land use rights 0.3 0.3 0.3 0.3 0.4 0.5 0.7Agricultural land-use tax 0.8 0.6 0.1 0.1 0.1 0.0 0.0Other taxes 0.2 0.1 0.0 0.0 0.0 0.0 0.0
Non-tax revenue 19.6 18.0 23.3 29.0 27.0 19.0 20.8Grants 1.9 1.8 1.9 1.4 1.6 1.4 1.3Total revenue 100.0 100.0 100.0 100.0 100.0 100.0 100.0
Source: MOF. Figures for 2007 are budget estimates.
the economy has been decreasing steadily,and the trend is bound to continue. But taxinga much larger number of smaller domesticprivate enterprises is bound to be challenging.
With these challenges in mind, an ambitiousreform program was spelled out in the SEDP2006-2010. The SEDP envisions taxadministration playing an increasinglyimportant role in mobilizing domesticresources and creating a dynamic investmentenvironment. Objectives spelled out in theSEDP include developing a modern, fair andtransparent revenue collection system,promoting voluntary compliance through abalance between high-quality taxpayerservices and effective enforcement; andenhancing revenue collection with a finaltarget of achieving a tax-to-GDP ratio of 21percent (Box 3.1).
Coping well so far
A straightforward way to judge theperformance of the Vietnamese tax systemin the current transition is to assess itscapacity to deliver a sustained flow ofresources for the government to operate.From this point of view, the system hasbeen doing well so far. In spite of thedecline in trade-related proceeds, totalrevenue has fluctuated between 24.9 and27.1 percent of GDP. This comparesfavourably with other countries in theregion. Performance has been strongenough for government to consistentlyunderestimate tax revenue. However, theunderestimation could also reflect poorforecasting capacity, unforeseen economicdevelopments, or a deliberate attempt toimpose discipline on spending units.
Admittedly, buoyant revenue is partly due tohigh prices of oil in international markets.
But this is not the only reason. The decreasein trade-related revenues has beencompensated primarily by the operation ofan extremely efficient VAT. Tax“productivity”, defined as percentage pointsof GDP in revenue divided by percentagepoints of the basic tax rate, is a standardperformance indicator. Vietnam’s VATproductivity is close to 0.6, which exceedsthe average for industrial countries. Somecascading-inducing features of theVietnamese VAT may contribute to thisexceptional performance. But there is morethan cascading involved, which explains whyVAT has become one of the workhorses ofthe Vietnamese tax system.
The other workhorse of the system is EIT.Together with VAT, this has been adominant source of revenue, with each of thetwo instruments contributing slightly lessthan 6 percent of GDP. The goodperformance of EIT is partly due to the highcompliance among SOEs (Table 3.2). Muchlower compliance among the domesticprivate sector is a matter for concern.Compliance rates with EIT are bound toimprove when the Personal Income Tax(PIT) comes into effect, in January 2009. Atthat point, some 1.62 million businesshouseholds will switch from EIT to PIT. Butthis will shift the enforcement problemelsewhere.
The Vietnamese tax system also does well interms of equity. A study conducted usinghousehold survey data from 2006 shows thatmore affluent population groups, whethermeasured by income per person or byexpenditure per person, face aproportionately higher tax burden (Figure3.1). Comparing with a similar study for1998, the tax burden is now heavier, and it is
TAX REVENUE
31

CAPITAL MATTERS
32
Box 3.1: The Tax Reform Program
The tax system in Vietnam has undergone three phases of reform over the past two decades.The elements of a modern system were put in place in the early 1990s. A large number oflaws were enacted or revised at that point, including for taxes on Turnover, SpecialConsumption (Excise), Imports and Exports, Profits, Natural Resources, Agricultural Land,Transfer of Land-Use Rights, and High-Income Earners. The second phase of reforms tookplace during the late 1990s and early 2000s, and focused on the removal of discriminatorytreatment within the tax system. The third and current phase is more ambitious in scope, asit includes the reform of virtually all tax instruments and a modernization of tax collectionprocesses, supported by a Tax Administration Law which became effective in 2007.
This third phase of reforms was adopted by the Politburo of the Party in 2004 and itsimplementation is being led by a Steering Committee under MOF. A special reformdepartment was created in the General Department of Taxation (GDT). The program has afive-year implementation time frame, and includes ten major initiatives:
1. Institutional reform: reform of each of the substantive tax laws and enactment of aconsolidated law on tax administration.
2. Taxpayer services: development of high quality taxpayer services to enhance voluntarytax compliance.
3. Reform and modernization of tax audit: development of a comprehensive audit program,including a national tax audit plan, an audit selection system, and new audit procedures.
4. Reform and modernization of tax collection: development of programs to deal with taxdebtors, including annual arrears collection plan and efficient collection enforcementmethods.
5. Reform and modernization of the taxpayer database: development of a database tosupport tax administration operations, revenue analysis, revenue forecasting, and riskmanagement.
6. Information technology: development and implementation of an advanced InformationTechnology (IT) system to support tax administration reform.
7. Organizational restructuring: design and implementation of a function-basedorganizational structure at all levels of tax administration.
8. Capacity building of tax officials: training and development of tax administration staff tomeet the requirements of a modern tax administration.
9. Modernization of tax office accommodation and equipment: substantial improvement ofGDT’s facilities and equipment across the country.
10. Management of the reform process: establishment of a proper management andgovernance framework for implementing the reform plan.
Key milestones so far have been the piloting of functional reorganization of tax offices andthe introduction of self-assessment, for VAT and EIT in 2004, and for all taxes from 2007onwards.

more progressive. The earlier study foundthat taxes represented about 8 percent ofexpenditures for all but the top quintile,where they stood at just over 10 percent.The figures for 2006 show a tax burden ofabout 8 percent only for the bottom twopopulation deciles, rising steadily to reach aplateau of about 14 percent in the four topdeciles.
This higher, more progressive, tax structureis due in large part to the introduction of theVAT in 1999, when it replaced a complex
system of turnover taxes. VAT is notprogressive in every country. But in Vietnampoor people provide for many of their ownneeds rather than purchasing them, which inturn reduces the VAT they have to pay. Overtime this will change, as home productionbecomes less important, making the taxsystem gradually less progressive.
Missing instruments
Despite its overall good performance, theVietnamese tax system is still unbalanced.
TAX REVENUE
33
Table 3.2: The Revenue Gap on EIT
Operating Average Potential Actual Revenuesurplus effective revenue revenue Tax gap(billion tax rate (billion (billion compliance (billion dong) (percent) dong) dong) (percent) dong)
Sector A B C = Ax B D E = D/C F = C - D
SOEs 103,299 17 17,561 15,572 88.6 1,989Domestic 122,713 24 29,451 7,920 26.8 21,531private
Source: Own calculations, based on data from MOF. Figures are for 2007.
0
2
4
6
8
10
12
14
16
1 2 3 4 5 6 7 8 9 10
Population decile (from poor to rich)
Tax
burd
en
Percent of income Percent of expenditure
Figure 3.1: A Progressive Tax Burden
Source: Jonathan Haughton (2008).

Revenue from some tax instruments isalmost negligible, standing at less than 1percent of total revenue. Tax instrumentswith a strong potential to influence theallocation of resources and reduce waste aremissing. And the main instrument beingintroduced at present will not yield highrevenue for some time, but could distortincentives if it is not phased in carefully.
Current efforts to modernize the tax systemare very much focused on the introduction ofa broader PIT, extending beyond high-income earners to the population at large.With a potential 4 million taxpayers, tentimes the current figure, enforcing the newPIT is bound to be challenging. Internationalexperience shows that PIT compliance istypically low in developing countries. Infact, the only large source of personalincome that is relatively easy to monitor fora country at Vietnam’s development level isthe wages and salaries paid by formal sectoremployers. Growing wage employment andthe gradual expansion of the formal labormarket have been among the key drivers ofpoverty reduction in Vietnam. An attempt toexpand the tax base too rapidly couldpenalize the formalization of employment,thus hindering modernization and jobcreation. It would be preferable if PITremained for now tax on high-incomeearners only with its expansion to lowerincome groups taking place gradually.
With the current focus on taxing income, thetaxation of assets has been somewhatneglected. And yet, taxing natural resourcesand land bear the potential to increaseeconomic efficiency, reduce environmentaldamage and improve equity.
At present, natural resources may be placed
in four categories for the purpose of taxation.Minerals are only subject to royalty. Naturalforest products are also subject to royalty,although rates are quite high in their case (upto 40 percent). While high rates aim toprotect forest resources, they may alsoencourage the exploitation of high valuenatural wealth and create an incentive forevasion, thus negating their purpose.Natural aquatic resources and natural waterare subject to a combination of EIT and a lowrate of royalty. Most items in this categoryare taxed at 0-4 percent, except for pearlsand sea-slug at 10 percent. A similarcombination applies to oil and natural gas,although in this case EIT rates vary (from 6to 25 percent) depending on the amount anddepth of extraction.
The combination of EIT and royalty is asensible model, and it should be generalizedto all types of natural resources. Theintroduction of EIT in the case of minerals,and especially of natural forest products,should allow reducing royalty rates. Whilethe aim of such high rates is to protectnatural resources such as forests, in practicethey tend to promote the exploitation ofhigh-value natural wealth and foster taxevasion. Royalty rates should be reduced innumber and should not be kept at anabnormally high level. This would also helpreduce administrative and compliance costs.On the other hand, the EIT rate should notbe reduced below 20 or 25 percent, not evenin the case of the oil and natural gas sectors.
Property tax is another somewhat neglectedinstrument in the current system of Vietnam.In 2007, the associated revenue was lessthan 0.5 percent of GDP, whereas a ratio ofup to 2 percent could be expected. Further,
CAPITAL MATTERS
34

two thirds of the actual revenue came fromland-use right allocation levies, a hardlysustainable source.
Several features make property taxespecially attractive. The tax falls on anunmovable base and is quite likely borne byresidents in the jurisdiction where theservices financed by its proceeds areprovided. For this reason, one variation ofthis instrument is under the form of“betterment levies” or lump-sum paymentsexacted up front from the beneficiaries ofpublic service improvements, such as roadpaving, drain infrastructure, sidewalks orstreet lights, which all have a visible benefiton property values. Property tax (orbetterment levies) can thus be useful inproviding sub-national governments withresources to invest in local infrastructure.By not taxing the income derived from theproperty, this instrument can also lead tosignificant improvements in the quality ofland use. To avoid discouraging suchimprovements, some countries tax land moreheavily than the premises built on it.Property tax can also make speculation onland less attractive, and help avoid (or atleast contain) the asset price bubbles thatcould characterize this turbulent phase in thedevelopment of Vietnam.
Other desirable features of property tax arerelated to equity. In a developing country,the ability to redistribute resources throughPIT may be limited, as only formal sectorlabor earnings are easy to track. Profits frominvestments and capital gains on assets aremuch more difficult to monitor. In fact,capital gains or urban land have been at theroot of many of the recent (some timesspectacular) fortunes amassed in Vietnam.Property tax is one of the few instruments
available to bring this newly amassed wealthinto the country’s tax base.
When policy makers consider taxingproperty, they sometimes worry that poorpeople may be unable to pay. This concernmay be divided into two parts: poor peoplewith land of little value and poor people withvaluable land. Exempting subsistence farmsfrom property tax and introducing aminimum imposable threshold are obvioussolutions to the first concern. The problemof poor people with land of significant value(particularly in cities) is that they may bereluctant to move to cheaper land forunderstandable social reasons, especially inthe case of the elderly. A possible way toaddress this concern is to allow any poorperson to defer his or her taxes (plusinterest) until death, and then recover thedebt out of the value of the property.
Another concern regarding property tax isits possibly complex administration, whichcan make it costly compared to its revenuepotential. One difficulty in this respect isthe need for property revaluation on aregular basis. However, systematicassessments conducted by area can bringthe cost down. The self-assessment ofproperty prices is another practical solution.Avoidance risks can be mitigated throughthe provision that the self-assessed value iswhat will be paid as compensation bygovernment if the property is reclaimed forthe purpose of infrastructure development.A more serious difficulty in a country likeVietnam concerns the still partial issuanceof land-use right certificates, especially inurban areas (Box 3.2). Combined withlimited local capacity, this calls for a step-by-step approach in introducing this newinstrument.
TAX REVENUE
35

Further simplification
Even for existing tax instruments, relativelystraightforward changes could result inincreased economic efficiency. In the caseof VAT, reducing the number of tax rate
levels (three at present) would be a step inthe right direction. The lower tax rate of 5percent could be eliminated, leading to asimplified structure, with either a zero or a10 percent rate applying. While the currentrate differentiation may generate modest
CAPITAL MATTERS
36
Box 3.2: Land Administration Reform and Property Tax
An effective land administration represents not only a pre-requisite for the successfulintroduction of modern property tax but also an essential institutional arrangement forsustainable economic and social development. The allocation of agricultural land tohouseholds and individuals and the recognition of their land-use rights were among the initialsteps of the doi moi process, enormously contributing to economic growth and povertyreduction. The promulgation of the 2003 Land Law laid out a comprehensive legalframework for further land administration reform. However, weaknesses in the existing landadministration system represent a fundamental challenge to meeting the requirements of theLand Law and the expectations of the population.
The main problem at present is the incomplete issuance of land-use right certificates,especially in urban and upland areas. Household survey data from 2006 suggests that only76 percent of agricultural land parcels, 68 percent of urban land parcels and 34 percent offorest land parcels have been granted land-use right certificates. In practice, this means thatabout two thirds of the total parcels of Vietnam still lack a certificate.
Underlying the incomplete issuance of land-use right certificates is the shortage of basicinfrastructure for an effective operation of land administration, including cadastral mapping,transaction registrations and record management to the provision of land administrationservices. Problems are compounded by lack of public awareness and the limited capacity ofland administration staff, especially at the commune and district levels. The system itself iscumbersome, not transparent and inefficient and does not provide the quality services thatend users can rely on. As a result, land administration is generally recognized as one of themost severe constraints to business development and transparent governance in Vietnam.
There are also a number of significant land policy improvements pending. They range fromthe expansion of agricultural land use rights and land valuation to the reconciliation of the gapbetween the Land Law and the Housing Law on the registration of land use rights and theownership of buildings.
The Ministry of Natural Resources and Environment has outlined a comprehensive programfor the development and modernization of land administration. One of its objectives is toestablish a digital cadastral land record system. Based on it, a land information system willbe set up, to collect and update land information, establish a nation-wide unified landdatabase, and develop a system for accessing, retrieving and distributing land informationnationwide.

equity gains, if any, it creates distortions andopportunities for misclassification of items.A single positive rate lowers the cost ofcompliance by reducing the requirements ofkeeping records and invoices andsimplifying tax forms.
Similarly, a large number of exemptions (29at present) create administrative andcompliance problems for traders who sellboth taxed and exempt items. Morecritically, exemption breaks the VAT chainand may lead to cascading, as in the case ofa turnover tax. The current set of exemptionsshould be scrutinized and, ideally, only a fewof them should be retained.
Other simplifications may be considered inthe case of VAT. The current practice ofhaving a zero threshold of exempting smalltraders does not follow international goodpractice. A suitable threshold could be putin place based on the tradeoff between thecost of administration and revenueimplications. This would help theadministration focus on big taxpayers, whileapplying a simplified tax regime to tradersbelow the threshold. For the latter, thesubtraction method could be abolished, andreplaced by the credit method. This wouldimprove tax compliance since it leaves atrail of invoices that may be audited andused for verification.
There is also scope for simplification in thecase of EIT. The four tax rate levelscurrently in force (28, 20, 15 and 10 percent)are being replaced by a single tax rate, at 25percent. In contrast with this welcomedevelopment, the current EIT regimeincludes complex depreciation rules,involving 48 types of assets and threepossible schedules. To implement the
current regime, each fixed asset is requiredto be classified and maintained in a separatefile and also recorded in an assets recordbook, numbered and assigned a separatecard with relevant statistics. A betterapproach would be to place all assets in fouror five broad categories and then todepreciate the pool using a declining balancemethod. When an asset is added, the poolbecomes larger; when an asset is sold, thepool becomes smaller.
The incentive regime embedded in theVietnamese EIT is also complex and maynot achieve its intended objectives. Theregime is aimed to encourage capitalaccumulation in technologically dynamicsectors, in labor-intensive activities, and inpoorer regions. These are legitimatedevelopment objectives, and more can bedone to foster them under the currentregime. For instance, deductions could beallowed for non-wage benefits for thepersonnel. But the current regime shouldalso be rationalized.
At present, there are three major types ofincentives: access to preferential or reducedrates, outright tax exemption or tax holidayfor a prescribed period of time, andaccelerated depreciation. Over 300 rulesdefine eligibility and terms of application.But many of those rules overlap and someare contradictory. The system is alsopartially effective only, with businesssurveys revealing that a majority ofbeneficiary firms would have proceededwith their investments in the same form andlocation had the incentives not existed.
However, these incentives do have a cost interms of foregone tax revenue. A simulationconducted using data from the most recent
TAX REVENUE
37

enterprise surveys by GSO is revealing inthis respect. The simulation assumed thatenterprises eligible for EIT incentives, basedon their location, had benefitted from them.It then inflated the amount of tax collectedfrom then by bringing them from theireligible level to the general EIT rate of 28percent. With this assumption, revenue fromEIT would have been 7 percent higher in2004 and 6.3 percent higher in 2005. Ofcourse, this is only an indicative order ofmagnitude. Not all eligible enterprises mayhave accessed the incentives, for instance.But on the other hand, the simulation onlyconsidered incentives based on location,while there are others in force. Therefore, itis not by all means clear that these figuresunderestimate the loss.
The new PIT could benefit fromsimplification as well. At present, sevenincome brackets exist, when four (as in theold regime) would probably be sufficient.International experience suggests thathaving too many brackets complicatesadministration and encourages tax evasion,while doing little to promote equity.Importantly, these brackets are not indexedfor inflation, which may result in anunplanned increase in the already highnumber of potential taxpayers. Given thatbusiness households will be migrating fromEIT to PIT, the highest tax rate for the lattershould be similar to the EIT tax rate. At 35percent, it is currently much higher.
Tax administration reform
With almost 40,000 staff in its payroll, GDTis one of the largest public sector institutionsin Vietnam. It is organized at three levelswith the tax administration headquarters inHanoi, 63 tax offices at the provincial level
and 674 tax offices at the district level. GDTis charged with collecting all major domestictaxes, in particular VAT, EIT, Excise Taxes,and natural resource taxes, which togetheraccount for more than two thirds of totaldomestic revenue collection. GDT is alsoresponsible for the collection of a relativelylarge number of minor taxes, such as the taxon transfer of land-use rights, land andhousing tax, and small business tax.
The tax reform program adopted by thegovernment confronts GDT with a series ofnew challenges. Shifting collectionpriorities from the border to the domesticmarket, reducing dependence on oilrevenues, focusing more on private sectorenterprises and less on SOEs and foreigninvested companies, adjusting to self-assessments as opposed to inspections,introducing modern taxpayer serviceprocesses, and adapting to the electronicformats increasingly used by taxpayers tokeep their records are among them.
The new Tax Administration Law thatbecame effective in July 2007 was animportant step to address these challenges.The new law provides a foundation to ensuretransparency and integrity in all taxadministration operations. In addition, iteliminates gray areas potentially fosteringnoncompliance by taxpayers and abuse by taxadministration officials. Among severalimportant innovations, the new law introducesa unique Taxpayer Identification Number andstipulates that third party information can beacquired from various agencies for effectiveaudit and enforcement, while safeguarding itsconfidentiality. But there are someweaknesses too. While the new law stipulatesthe general rights and responsibilities of taxadministration agency and other related sub-
CAPITAL MATTERS
38

national organizations, it does not includeprovisions on the division of responsibilitiesbetween various levels of tax administrationnor on the division of responsibilities betweentax administration agency and People’sCouncils and People’s Committees at varioussub-national levels.
A taxpayer baseline survey conducted in 2007and 2008 provides some information on howGDT is doing so far. On the positive side, itcan be noted that 61.3 percent theinterviewed taxpayers consider that theservices to the public provided by tax officesare above average. However, only 3.9percent of them rate these services as verygood, suggesting that there is scope forimprovement. The taxpayer baseline surveyalso reveals that taxpayers struggle tounderstand major components of the EITlegislation, such as preferential regimes or thedetermination of deductable expenses. Lessthan 40 percent of respondents found theVAT refund system easy to understand andimplement. And more than 60 percentreported finding out about changes in the lawsand procedures less than a month prior toentry in force. All of which suggests the needto improve on taxpayer information andcommunication.
Filing compliance provides another,complementary perspective on the strengthsand weaknesses of tax administration inVietnam (Table 3.3). Compliance is high inthe case of VAT, and acceptable in the caseof excise taxes, but it is low in the case ofnatural resource taxation, and dismal in thecase of PIT. Electronic filing could helpimprove this mixed record. By reducingprocessing costs and minimizing the risk ofcorruption, an increased use of electronicfiling is in the interest of GDT. It is hopedthat by 2012 some 30 percent of taxpayerswill be filing electronically. While this is stilla much lower percentage compared tocountries with a well advanced electronic taxadministration system, such as Chile orSingapore, attaining this level wouldrepresent a major progress on the interactionwith taxpayers.
An assessment of GDT’s operationalprocesses was conducted by reviewing 15functional aspects of the tax administrationperformance (Figure 3.2). Among them, thelegal affairs function turned out to be the areawith the most advanced processes in place.Provisions for the counseling and advising ofGDT staff on legal issues exist, so that at leastbasic support for tax administration staff to
TAX REVENUE
39
Table 3.3: Partial Tax Filing Compliance
Filing among Filing on time Compositeregistered among taxpayers filing compliance
Tax instrument taxpayers having filed index
EIT 82 78 64VAT 92 91 84Excise Duty 79 82 65PIT 34 83 28Tax on Natural Resources 60 81 49
Source: Own estimates, based on data from GDT.

deal with more complex legal matters isavailable. The legal support is notcomprehensive yet, however, and additionalprocesses to perform critical legal tasks, suchas creating the capacity to issue private letterrulings to taxpayers, will still have to bedeveloped. Existing processes are lesssatisfactory in most other areas, with the taxaudit function being an area of concern.Procedures and methodologies for a risk-based audit selection have not yet beendeveloped, and auditor discretion in theselection of cases for a desk or field audit issubstantial. In addition, existing processes forthe conduct of an audit provide substantialdiscretion to the audit team, and the overallaudit planning and supervision process does
not yet include a systematic ongoingmonitoring of audit efficiency.
Another area for improvement concernsrevenue forecasting, which is the startingpoint in the preparation of the budget.Presently, GDT conducts revenueforecasting exercises for total tax revenues,VAT, excises, EIT, PIT, and naturalresource taxes (including oil revenues).Projections for the following year areprimarily based on the growth rate ofrevenues during the current year, adjustedafter consultations with line ministries andGDT field offices. No econometric ormicro-simulation modeling tools are used,and the quality of the data is poor.
CAPITAL MATTERS
40
0
1
2
3
4
5Pre-filing Taxpayer Services
Filing, Return Processing, and TaxAccounting
Tax Audit
Tax Collection
Apeals
Legal Affairs
Strategi c Planning, PerformanceMonitoring, Quality Assurance, and
Communications
IT, HRM, Training, Managementand Finance
Best PracticeGDT Peformance
Figure 3.2: Gaps in Operational Processes
Source: Based on Booz Allen Hamilton (2007). The outer line in the spider-webdiagram indicates best practice performance.

41
The issuance of bonds is a potentiallyimportant mechanism to raise resources forinvestment, both in the public and in theprivate sector. Few enterprises (most ofthem large SOEs) have issued corporatedebt in Vietnam. Government debt, on theother hand, is more developed. Roughlyhalf of it is with the rest of the world; mostof it is in concessional terms. The rest isunder the form of a large number ofrelatively small series of domestic bonds.The overall indebtedness of the governmentis within prudent limits, which is reassuringgiven that debt management is still weak.Important progress has been made in themanagement of external debt, but it stillneeds to be integrated with that of domesticdebt, as well as with the cash managementfunction of the government. In part as aresult of the weak management of domesticdebt, the bond market in Vietnam is in afledging state. In spite of rapid growth inrecent years, the market is still relativelysmall. The very large number of smallissuances of government bonds has made itdifficult for a yield curve to emerge.Limited liquidity, in turn, has led torecurrent failure when issuing new series.Several efforts are underway to improve theefficiency of the bond market, but marketconsolidation should be the biggest priority.Open market operations and themanagement of the social security reserves
could be used to speed up the process. Aremaining question is whether thegovernment faces other, implicitobligations. A reliable estimate ofcontingent liabilities from infrastructureprojects, borrowing by entities affiliatedwith provincial governments and largeSOEs is unavailable. But even underpessimistic assumptions, the total amountsat stake seem manageable.
Prudent indebtedness
With only 24.1 trillion dong (less than 2percent of GDP) in outstanding corporatebonds, issuance of debt by the private sectoris still in incipient stages in Vietnam. In oneway or another, most debt is from thegovernment. Some of it is with externalcreditors, mainly with bilateral agencies andmultinational organizations which providedevelopment assistance in more or lessconcessional terms, including the WorldBank. Another part is under the form of alarge number of series of domestic bondsand bills, some issued by the State Treasury,some by SBV, and a few by sub-nationallevels of government and large SOEs.
What exactly should be considered asgovernment debt is not free of controversy(Box 4.1). In the case of Vietnam, theconcept is not defined in any legaldocument. For instance, should the debt of
4. DEBT AND LIABILITIES
“off-budget” entities such as the VDB orthe Vietnam Bank for Social Policies(VBSP) be counted as government debt? Inprinciple, the answer would be yes. Butthen, when computing total governmentdebt it would be important to net out anycross lending. For instance, some of the
debt of the two policy banks is withVietnam Social Security (VSS), another“off-budget” entity.
The government of Vietnam hastraditionally been prudent in its borrowing.Total public debt by end of 2007 amounted
CAPITAL MATTERS
42
Box 4.1: Defining Government Debt
A collective effort to define government debt was undertaken by the Bank for InternationalSettlements, the Commonwealth Secretariat, Eurostat, the IMF, the Organization forEconomic Co-operation and Development (OECD), the Paris Club Secretariat, the UnitedNations Conference on Trade and Development (UNCTAD) and the World Bank. Theagreed definition should be seen as the official position of all the major international financialinstitutions. The External Debt Statistics Guide for Compilers and Users (or the Guide, forshort), published by the IMF in 2003, brought together this collective effort, defining thepublic sector as follows:
“The public sector includes the general government, monetary authorities, and those entitiesin the banking and other sectors that are public corporations. A public corporation is definedas a nonfinancial or financial corporation that is subject to control by government units, withcontrol over a corporation defined as the ability to determine general corporate policy bychoosing appropriate directors, if necessary. Control can be established throughgovernment ownership of more than half of the voting shares or otherwise controlling morethan half of the shareholder voting power (including through ownership of a second publiccorporation that in turn has a majority of the voting shares). In addition, it may be possibleto exercise control through special legislation, decree, or regulation that empowers thegovernment to determine corporate policy or to appoint directors. Any domestic institutionalunit not meeting the definition of public sector is to be classified as private sector”. (TheGuide, section 5.5, pages 39 and 40).
The Guide also refers to the World Bank’s Debtor Reporting System Manual (or DRSManual), published in 2000, for more details. In its section on “General Definitions andProcedures” (page 4), the DRS Manual specifies that the public sector consists of thefollowing types of institutions: (a) central governments and their departments, (b) politicalsubdivisions such as states, provinces and municipalities, (c) central banks and (d)autonomous institutions including financial and non-financial corporations, commercial anddevelopment banks, railways and utilities. These autonomous institutions are counted aspart of the public sector provided that their budget is subject to government approval, or thegovernment owns more than half of the voting stock, or more than half of the members of theboard of directors are government representatives, or the government is liable for the debtof the institution in case of default.
Source: IMF (2003) and World Bank (2000).

to 42.3 percent of GDP, with 23.7 percentagepoints denominated in foreign currency. Asignificant reduction in the overallgovernment deficit in 2008, together withconsiderable real exchange rateappreciation, should bring those figuresdown. With a significant portion of theforeign-currency debt being in concessionalterms, ratios are even lower when thepresent value of the debt (as opposed to itsnominal value) is considered. On that basis,the corresponding figures for 2008 are 32.7and 15.8 percent. Lower expected deficits inthe near future and a higher GDP should leadto further declines in these ratios, at leastuntil 2010.
Weak management
It is reassuring that debt levels are moderatein Vietnam, because debt management isstill weak. International standards provide auseful benchmark in this respect. Theminimum requirement for sound debtmanagement is that primary legislationprovides clear authorization to the executiveto approve borrowings and loan guaranteeson behalf of the central government,whereas secondary legislation provides clearauthorization to the implementing entities toundertake borrowing and debt-relatedtransactions and to issue loan guarantees onbehalf of the central government. Goodpractices include primary legislationspecifying borrowing purposes, a debtmanagement strategy, mandatory annualreporting to the National Assembly, andexternal audit of debt managementactivities.
In some cases, there are also ceilings on theannual fiscal deficit and the overall debtlevel, as in the Stability and Growth Pact of
the European Union, or in the so-called fiscalresponsibility laws of many countries. Othercountries have a public debt committee todecide on the debt strategy, delegate itsexecution and monitor its performance.Debt committees are typically chaired by aminister or a very senior official. Theyensure that relevant interests and expertiseare consulted, and can assist co-ordinationamong key players.
Vietnam has made important progress ondebt management in recent years. The legalframework has been gradually reformed andunified in the case of external debt, withdefinitions and concepts now close tointernational standards. The recentlypublished External Debt Bulletin is anothermajor step forward. In relation to domesticdebt, regulations have been approvedconcerning the issuance of governmentbonds, of government guaranteed bonds, andof local government bonds. There is nowscope to issue large volume bonds, incontrast with a tradition of multiple smallissues (Figure 4.1).
Significant weaknesses remain, however.There is no unified and comprehensive legalframework for general debt management,and no high-level legal document regulatingall activities related to debt borrowing andrepayment. External debt management anddomestic debt management are stillseparate, with the risk that inconsistentdecisions may be taken about the structure ofliabilities. The dispersion of responsibilitiesalso leads to insufficient coordination inpolicy making, management and monitoring.The lack of a specialized debt managementfunction spreads scarce skills and inhibitsprofessionalism.
These problems are being addressed through
DEBT AND LIABILITIES
43

the preparation of a Public Debt Law.Whether the debt of SOEs falls under thislaw would have important implications fordebt management. Meanwhile, agovernment decree is expected to appointMOF as focal point for debt management,and an MOF decision is expected to establisha single department for debt managementand external finance, which should lead inassisting government on the management ofpublic sector debt.
Another important weakness concerns thecoordination between debt management andcash management. In Vietnam, decisionsrelated to deficit financing take little accountof the government’s substantial cashsurpluses. This carries a cost, given theinterest rate differential between borrowingand lending rates. Due to the lack of a singleaccount bringing together all cash balancesheld within the central government, the StateTreasury does not have the capability toforecast future cash flows, hence tominimize the volume of idle governmentliquidity. Volatility in government cash
flows has its mirror image in volatility inbanking sector liquidity, complicatingmonetary policy operations.
Better cash management would also requirethe use of State Treasury bills with shortermaturities. At present those bills are for 364days, and any changes would requireamending the State Budget Law, somethingthat will not happen immediately. SBVserves as the fiscal agent for the StateTreasury, but in practice its own liquiditybills compete with Treasury bills. For thisreason, coordination with SBV isfundamental for effective cash management.Coordination would also allow bringing inthe market knowledge of SBV, and avoidsending potentially confusing signals toinvestors.
Some times the question has been askedwhether government should also try tomanage private sector debt. In principle, itwould be possible to limit or control privatesector debt through measures such as theapproval of all external borrowing. In
CAPITAL MATTERS
44
0
20
40
60
80
100
120
140
<5050-100
100-150
150-300
300-1000>1000
Volume (in billion dong)
Num
bero
fbon
dis
sues
0
20
40
60
80
100
120
140
6-7 7-8 8-9 9-10 >10
Interest rate (percent)
Nu m
be
ro
fb
ond
iss
ues
Figure 4.1: A Multiplicity of Small Bond Series
Source: Own calculations, based on data from MOF, for bonds issued until 2007.

practice, this is difficult (if not impossible) todo once the capital account is liberalized.There may be no other option than to let themarket determine the level of private debt,with lenders undertaking the necessarycredit assessments of the borrowers. But torely on market mechanisms it is necessary tohave in place a good credit rating systemcovering the whole country, so that creditchecks can be made before a decision istaken to lend. Letting the market determineprivate debt levels also requires appropriategovernance, disclosure and riskmanagement policies. This is necessary forthe regulatory authorities to monitor lendingactivities, balance sheets and otherdisclosure requirements. Early warningsystems to alert government about risks toeconomic stability, or to the level ofreserves, may be considered as well.
A fledging market
The Vietnamese bond market grewsubstantially in recent times. Transactionsincreased by 98.1 percent in 2007, comparedto an East Asian average of 21.1 percent. Andthey expanded by an additional 21 percent inthe first nine months of 2008. Growth waseven stronger in the case of corporate bonds,reaching 306 percent in 2006 and 251 percentin 2007. Macroeconomic turbulence, first inVietnam and then in world markets, alsoprompted a flurry of transactions. Tradingvalues of about 500 billion dong per sessionwere not uncommon in late 2008.
These growth figures are impressive, butthey convey a misguidedly upbeatassessment of the depth and efficiency of thebond market in Vietnam. In fact, its overallsize represents only 13.7 percent of GDP,compared to an East Asian average of 63.1
percent. The trading value on governmentbonds has been growing together with theiroutstanding amount, but the average numberof daily trades in 2007 was still estimated atthree or less. Corporate bonds have beengaining ground, and account by now forabout 15 percent of the total bond marketvalue, but this is about half the average ratioin East Asian countries. Interbank deposittransactions conducted on a clean basis (thisis, without using securities as collateral)dominate the money market. Repotransactions (the sale of securities with acommitment to repurchase them) are rare;those with maturities of less than two weekshardly take place. Bond issuances havebeen partially successful at best, with morethan 30 of them failing since March 2008.
Bond fragmentation is the main reason forthis fledging state of the bond market inVietnam. With 68 tender members and 46issue underwriters, there is no shortage onthe supply side. But there are currently 450series of bonds with different maturities andno standard coupon rate for bonds in themarket. As a result, a reliable benchmarkyield curve has yet to develop and liquidity islow. If anything, the uncertainty brought inby macroeconomic turbulence has reducedliquidity even further, especially for long-term maturities. As foreign investors sell outtheir bond holdings and get some cash torepatriate, local investors (mainly banks)have been purchasing actively. But this ismainly on short-term maturities. In spite ofreasonably high yields, over the entire year2008 there were only a few smalltransactions involving bonds with terms over10 years. If anything, corporate bonds find itharder to attract buyers than governmentbonds. This is partly due to the priority given
DEBT AND LIABILITIES
45
by SBV to bonds issued by the State Treasurywhen conducting open market operations. Asa result of it, government bonds are morebankable than corporate bonds.
Developing the domestic bond market is astated objective of the government.Reducing the cost of bond issuances shouldmake it easier to raise resources for bothgovernment and the private sector. Anefficient bond market would also providemore liquidity to enterprises and facilitatethe conduit of macroeconomic policy. At thesame time, this is a difficult policy area tomanage. Several agencies are involved,including MOF, the State SecuritiesCommision (SSC), GDT and SBV. Theyinteract with a multiplicity of exchange andinfrastructure providers, as well as withcommercial institutions. In thisinstitutionally fragmented context, there ismerit in allocating the responsibility forissues related to the government bondmarket to the managers of government debt(presumably, the newly establisheddepartment within MOF). This is becausedebt managers usually have both a goodknowledge of the day-to-day operation of themarket and a strong incentive to make itwork. But decisions need to be coherent withthose made by other key players, and theyshould avoid penalizing the corporate bondmarket, as current open market operations bySBV do.
The key priority is to consolidate bondseries, so as to allow the emergence of ayield curve. A fund has been established tothis effect. Combined with the newlyapproved regulations authorizing theissuance of large volume bonds, there is nowscope to improve the size and liquidity ofdomestic issues. A more aggressive stance
in this respect would involve using currentbond transactions to support this process.Both SBV (in the context of open marketoperations) and VSS (in its management ofthe reserves of the social security fund) areimportant buyers and sellers of bonds, andboth have deep pockets. Their actions couldbe coordinated with those of the StateTreasury to speed up the consolidationprocess.
For now, however, most of the action hasfocused on the nuts and bolts of bond marketoperation. Technology solutions are beingimplemented to provide traders andinvestors with online information on bondtransactions. While certainly important, thiswill not solve the liquidity issues faced bythe market. A tender program forgovernment bond issuances has beenpublished as well. But it contains limitedinformation on the debt strategy or onmanagement objectives. And it does notappear that the program was based on anactive dialogue with investors and ratingagencies.
Other efforts to increase the efficiency of thebond market have originated in the privatesector. In September 2006, a group ofcommercial banks, securities firms,investment funds and insurance companiescreated a forum to facilitate debt securitiestrading by disseminating market informationand standardizing practices. With supportfrom MOF, SSC and SBV, this forum is nowin the process of transforming itself into anoccupational association, to enhance its legaland financial capacity for addressingoperational as well as policy issues. Thenew Vietnam Bond Market Association(VMBA) expects to have a membership of100 or more.
CAPITAL MATTERS
46

A potential player?
There are several public financial funds inVietnam. Some of them operate at thecentral level only, while others areestablished at the provincial level. In mostcases their operations are partially coveredby budget transfers. Other sources of theirrevenue come from contributions by citizensand institutions. A few of these funds haveaccounts with the State Treasury, but themajority does not. Although, thegovernment has issued a regulation withregard to financial disclosure on theoperations of these funds, at present there islittle information readily available on theirfinancial positions.
Most of these public financial funds aresmall; for instance, the Veterans’ LegacyFund, the Vietnam Children’ Sponsors Fund,the Legal Assistance Fund, the LocalHousing Development Fund, the Flood andStorm Prevention Fund, the Security Fund,the National Fund for Employment, VietnamEnvironmental Protection Fund, the Fund forVietnamese Overseas, the Training CreditFund, the Prevention and Anti-drug Fund,the Dioxin Victims Fund or the PublicTelecommunication Services Fund. Othersare bigger if measured by the size of theflows they manage, but they do not havelarge reserves. Among them are the HealthCare Fund for the Poor, Fund for Proceeds ofPrivatizing SOEs, the Health Insurance Fundor the many Local Development InvestmentFunds (LDIFs).
On the other hand, two of the public financialfunds of Vietnam hold a substantial volumeof assets. These are the Foreign ExchangeReserve Fund, currently totaling about 21.9billion dollars in foreign currency, and the
Social Insurance Fund, with reservesamounting to 4.3 billion dollars. While thelatter is smaller, it is growing rapidly due tothe young average age of the Vietnamesepopulation and the rapid formalization of thelabor market. And this fund is to apotentially important player in the bondmarket.
The Social Insurance Fund is managed in aprudent and conservative manner, withsafety as its predominant objective. Itsassets are invested exclusively in domesticfixed-income instruments of one form or theother, all issued by public sector entities. Atthe end of 2007, 49 percent of the portfoliowas in deposits with SOCBs, 31 percent ingovernment bonds, 11 percent in loans to thepolicy banks, and 9 percent in loans to thestate budget. The bulk of the currentinvestments are in the form of privatelynegotiated loans rather than in publiclytraded marketable securities as such. Theinvestment portfolio is managed in-house byVietnam Social Insurance (VSS). Allinvestments are held until their respectivefinal maturities, with no trading in or out inthe meantime.
This approach to portfolio management isnot conducive to the timely adoption ofmodern investment management practicesincluding robust portfolio valuation, and riskmeasurement and control techniques, amongothers. In the case of VSS, the bulk of theportfolio is not even revalued periodicallybased on updated prices but carried insteadat historical cost. The absence of modernmanagement practices has resulted in lowreturns over the last five years (Figure 4.3).Returns are even lower from the point ofview of contributors to the social insurancesystem, as VSS allocates about one third of
DEBT AND LIABILITIES
47

the gross returns to supporting its ownoperational cost.
Over time, VSS will face a growing need toexpand its investments in marketable andpublicly traded securities, to diversify intoasset classes other than domestic fixed-income securities, and to transition intotraded sub-portfolios that have to beactively managed. This can only beaccomplished successfully with a significantupgrading and revamping of the overallinvestment management infrastructureincluding the creation of a dedicatedinvestment management unit with skilledprofessionals and a significant reinforcementof staff resources, both in terms of numbersand skills mix.
In doing so, VSS may contribute to thedevelopment of the bond market, and assistMOF in the consolidation of governmentbond series. However, the transition towardsa more active management stance will needto be done cautiously. As the assets Social
Insurance Fund already account for morethan 5 percent of the market it invests in,there is a risk of distorting prices andaffecting liquidity. This problem is bound tobecome more serious is the fund outgrowsthe domestic market, in which case it may beimperative to consider investments inoverseas assets. These challenges underlinethe importance of diversifying the fund’sinvestments into new asset classes andpotentially new markets globally, andmanaging its investment operations in amanner that combines a focus on prudentrisk management with an optimization ofinvestment returns.
VSS does not have any risk managementinfrastructure as such at the present time. Todevelop its capacity, a first step would be toconduct a periodic market value assessmentof its portfolio. While the importance ofknowing the updated value of the portfoliomay not seem readily apparent when assetsare held to maturity, this will be necessary togradually move towards more active trading.
CAPITAL MATTERS
48
0.0
2.04.0
6.08.0
10.012.0
14.0
16.018.0
20.0
2003 2004 2005 2006 2007
%
VSS's fund investment return GDP growth (nominal) CPI
Figure 4.3: Will Future Pensions Be Affordable?
Source: Own calculations based on data from GSO and VSS.

VSS should also report regularly oninvestment management and performance toits Governing Board, including details onportfolio composition, maturity profile andinterest rate structure of the outstandingportfolio. Calculating investmentperformance by investment type, ideallyagainst established benchmarks, wouldprovide information on the relativeefficiency of different types of investmentsand help ongoing decision-making.
Contingent liabilities
While the level of explicit government debt iswithin prudent limits in Vietnam, concernshave been raised about the level of implicitdebts. These are obligations which will needto be honored only under specificcircumstances. Government guarantees are acase in point. If an investor building anexpressway is promised some minimumrevenue from toll fee collections, but in theend vehicle traffic is insufficient to generatesuch revenue, the budget will have to pay forthe difference. Other implicit debts are notrecognized on paper, but are likely to behonored by the government in specificcircumstances, and especially if the explicitdebtors are under serious stress. A bankingsector crisis is the obvious example.Governments may threaten not to bail outbanks in the event of a crisis, but the socialcost of not intervening could actually be muchhigher than that of recapitalizing the banks.Similarly, if a provincial government or alarge SOE defaults on its obligations, theremay be a need for the government to jump in.
These implicit obligations are known ascontingent liabilities, as they may or may notmaterialize. Moreover, the probability thatthey will do, much the same as their
magnitude, is not really known, which makestheir valuation particularly difficult.
Guarantees have been uncommon inVietnam, except in electricity. Electricity ofVietnam (EVN) has offered investors a fixedpurchase price for all the electricity theygenerate until the introduction of thecompetitive generation market in 2009, andfor 90 percent of it afterwards. Thegovernment provided guarantees for the PhuMy 2.2 and Phu My 3 Build Operate andTransfer (BOT) power plants, and the NamCon Son pipeline bringing gas ashore. Theguarantee package in this case includes thepurchase price as well as access andavailability of foreign exchange, water userights, the performance of the gas supplierand the like. No contingent valuation hasbeen carried out yet. But the purchase pricewas set at a level that is low enough, and thegrowth rate in the demand for electricity ishigh enough, for the exercise of theseguarantees to be unlikely.
Sub-national debt is another potential sourceof liabilities for the central government(although not for the consolidated publicsector). So far, only Hanoi and Ho Chi MinhCity (HCMC) have issued provincial debt.But the process has been tightly controlledby MOF, which not only has to approve theissuance of debt but also intervenes insetting its modalities. Given the amountsinvolved and the tightness of theauthorization process, again, it is safe toassume that risks are limited.
There may be some more concern in relationto debts issued not by the provincialgovernments themselves but by entitiesreporting to them. Several provincialgovernments have contributed equity to
DEBT AND LIABILITIES
49

LDIFs with the objective of speeding up theimplementation of infrastructure projects, byraising resources from banks and bypassingthe cumbersome administrative proceduresof the public sector. The best-knownexample of a LDIF is the HCMC InvestmentFund for Urban Development (HIFU), whichhas a capital of 1.49 trillion dong provided bythe provincial government and 1.65 trilliondong in debt, mainly with banks. There areby now another 16 LDIFs in Vietnam, butthey tend to be much smaller than HIFU.They are all regulated by a decree issued in2007, which makes it clear that there is noformal government guarantee in their case.However, there is arguably a contingentliability in their case, no matter how modestit is for now.
Bond issuance by SOEs is a potentiallyimportant concern. Indeed, some of the largeEconomic Groups and State Corporations
have been among the main issuers ofcorporate debt. At around 30 trillion dong fornow, their total debt is not too large (Table4.1). However, in September 2008 Vinashinwas authorized by MOF to issue 3 trilliondong in bonds, to borrow 10 trillion dong fromdomestic banks and to borrow 400 milliondollars from external sources. This is toprovide working capital for an enterprisewith a robust series of shipbuilding contractsspanning many years, so that its solvencymay not be at stake. However, if this trendwere to continue, an important contingentliability could be building up.
On the surface, the contingent liabilitiesassociated with SOEs are much largerthan their bond issuances suggest, becausethey are all indebted with commercialbanks. If SOEs were unable or unwillingto repay their loans, commercial bankscould need to be bailed out. On closer
CAPITAL MATTERS
50
Table 4.1: Debt Issuance by SOCBs and Large SOEs
2005 2006 2007
Vietcombank 1,375Bank for Investment and Development of Vietnam (BIDV) 4,252 3,000Agribank 3,000Mekong Housing Bank (MHB) 1,000PVFC 368 1,000EVN 3,000Song Da Corp. 260Lilama 2,000Electricity Construction Corporation (VNECO) 500Vinacomin 1,500Vinasin 7,000Vinaconex 1,000Vinasteel 400CII 132 500Total 1,375 11,012 17,900
Source: Own calculations, based on data from SSC. Figures are in billion dong.

DEBT AND LIABILITIES
51
inspection, however, this reasoningamounts to double counting. If thegovernment needed (and wanted) to stepin, it would need to bail out either theSOEs or the banks, but there is no goodreason to bail out both sides. Moreover,SOEs are not the only creditors who could
run into difficulties. For instance, realestate developers could also be affectedby the recent macroeconomic turbulenceand lack the resources to service theirdebts. For this reason, it is preferably totreat the contingent liabilities from thebanking system separately.

52
In spite of its declining share of investment,state capital still accounts for nearly 40percent of total capital accumulation inVietnam. Roughly half of this investment isimplemented by the government, for noncommercial purposes such as infrastructuredevelopment, whereas the other half ismanaged by increasingly profit-orientedSOEs. Given the sheer volume of resourcesdevoted to capital accumulation by thegovernment and by SOEs, legitimatequestions about efficiency andaccountability arise. Much progress hasbeen made on the management andoversight of budget resources, includingpublic investment. There is also a betterintegration of planning and budgetingprocesses, but the separate preparation ofthe budgets for capital and recurrentexpenditures remains a weakness of thecurrent system. An even bigger weaknessconcerns the management of publicinvestment projects. The authority toapprove such projects has been increasinglydelegated to local levels of government. Butno mechanism is in place to screen projectson a cost-benefit basis, to oversee theirimplementation, and to discontinue thosewith poor performance. The recent need toadjust government expenditures down, inresponse to the overheating of the economy,showed how important those mechanismscan be. Investments by SOEs are often
criticized as ineffective, but this may be asimplification as their rate of returncompares favorably to that of otherenterprises. However, high returns mayresult from the economies of scalecharacterizing the sectors many SOEsoperate in, and from the market power theyoften enjoy, rather than from their internalefficiency. Therefore, reforming the statesector remains a priority and the question ishow to do it right. Much has beenaccomplished through the introduction ofprivate capital and the adoption of thecorporate governance models of the privatesector. More recently, rights over SOEs arebeing transferred out of line ministries andprovincial government to address theconflict of interest between ownership andregulation. But the introduction of strategicinvestors into large SOEs is progressing tooslowly, requiring a reconsideration of theequitization mechanisms used at present.And a strong management structure,separate from regulators, is still absent in thecase of Economic Groups and large StateCorporations.
Budget resources
As part of its renovation process, Vietnamhas adopted an increasingly comprehensivelegal framework for the management andoversight of budget resources, includingpublic investments. Key milestones in this
5. STATE CAPITAL

process include the State Budget Lawpassed in 2002, the Law on Constructionpassed in 2003, the Law on InternationalTreaties passed in 2004, and the Law onInvestment, the Enterprise Law and theProcurement Law passed in 2005. Inaddition, important regulations on budgetdecentralization, project appraisal andmonitoring and evaluation have beenapproved.
A forward-looking approach is graduallybeen adopted to guide public expendituredecisions. Budgets continue to be preparedon annual basis, but within a three-yearstability framework. Budget allocationnorms for both recurrent and capitalexpenditures, based on explicit formulas,give predictability to the flow of resourcesprovinces can expect from the centralgovernment. Progress has also been made inlinking planning and budgeting, withMedium-Term Expenditure Frameworks(MTEF) being successfully piloted in foursectors and four provinces. The MTEFapproach is expected to be scaled up, andthen mainstreamed into the budget processthrough the revision of the State Budget Lawscheduled for 2009.
The integration of capital and recurrentexpenditures into a single budget, one of themain weaknesses of Vietnamese publicfinancial management, has graduallyimproved. These two components of thebudget are prepared by MPI and MOF at thecentral level, and by the correspondingdepartments at the provincial level.Collaboration between the two sides hasbeen facilitated by the introduction of thethree-year stability period. The adoption ofbudget allocation norms for both capital andrecurrent expenditures has also led to
greater coherence. But the separatepreparation of the two components stillhampers the effective management ofresources and the composition of publicexpenditure remains unbalanced in somecases.
In practice, capital for public investmentsmay come from three different sources. Thestate budget is used for investments with lowpotential for cost recovery in economic andsocial infrastructure, human resourcedevelopment and environmental protection.It is also used for the maintenance of publicworks. For projects that can generaterevenue but are unlikely to achieve full costrecovery, the stage budget only finances partof the investment. The second source isstate credit, provided in concessional termsout of government’s own funds or from ODAresources. State credit is used for priorityprojects across a range of sectors. Theborrowing government agency is the ownerof the investment but has responsibility topay back interest and principal. Third is thecapital used by SOEs, which comes fromretained depreciation, after-tax profits,unused land and buildings, funds mobilizedfor business development, equity in jointventures, and partnerships with domestic andforeign entities.
From a presentational perspective a fourthsource is considered in Vietnam, namely off-budget government funds. Infrastructure oreducation bonds fall in this category.Although their spending is subject to thesame public financial managementregulations as the rest of the state budget,these funds are mapped to specificinvestments and reported separately fromthe main budget (Figure 5.1).
STATE CAPITAL
53

Public projects
As for the way these resources are allocated,two breakdowns may be considered. One isaccording to the level of government thatundertakes the investments. In this respect,the trend towards decentralization is quiteremarkable. In 2001, some 50 percent ofinvestments were undertaken by localgovernments. By 2007, the share hadincreased to 61.8 percent in which provincialgovernments and lower levels ofgovernment were in charge of 48.8 and 13percent respectively. The share directlycontrolled by the central government isexpected to decline even further in 2008,from 38.2 percent to a mere 33 percent. Theother breakdown is by sector (Table 5.1).From this perspective, the importance ofinfrastructure investments is very clear.
Whether these projects actually serve their
purpose very much depends on the way theyare identified, designed, appraised,approved and implemented. Since theissuance of the Law on Construction and theCommon Investment Law an increasinglystronger foundation for the management ofstate capital is in place. The duties andauthority of relevant government agencieshave been clarified, and a process has beenset up for projects of different importance.But there are important limitations as well.
In line with the decentralization process,public projects of national importance have tobe submitted by the government to theNational Assembly. The criteria to determinewhether a project falls in this category includeits size, its potential environmental impactand its requirements in terms of populationresettlement. Projects related to security,defense or historic and cultural heritage also
CAPITAL MATTERS
54
0
20
40
60
80
100
2006 2007 2008
State Budget Government Bond Credit by State Plan SOE
Figure 5.1: Funding Sources for Public Investments
Source: MPI. Data for 2008 are based on plans, not actuals.

fall in this group. Projects of nationalimportance are appraised and implementedby MPI in coordination with the relevant lineministries and local governments. Publicprojects of lesser importance are classified incategories A, B and C, depending on theircharacteristics, with requirements decreasingaccordingly.
One importance difference is the extent towhich cost-benefit analysis is used toappraise the projects. For those of nationalimportance, the Prime Minister can set up aninter-agency appraisal panel. For instance,in the case of the Son La hydropower plant,the panel included researchers andassociations, and gathered feedback onissues such as construction safety,environmental impact and populationresettlement. However, this feedback is
more in the spirit of consultation than onproject appraisal or impact assessment.
Public projects in category A, typicallyapproved by line ministries and provincialgovernments and listed in the annual budgetallocation plan, are subject to Net PresentValue (NPV) calculation. However, thecalculation is often based on partialinformation and is seldom updated to reflectchanging circumstances, such as the surge inthe cost of construction materials thatoccurred in early 2008. In principle, smallerprojects in categories B and C are alsosubject to cost-effectiveness analysis, but theapproach tends to be more cursory in theircase. In the end, project selection remainslargely qualitative, based on compliancewith master plans, with limited importanceattached to quantitative indicators.
STATE CAPITAL
55
Table 5.1: Public Investments by Sector of Activity
Sector 2001 2002 2003 2004 2005 2006 2007eAgriculture, forestry and fishery 9.0 8.2 8.7 7.0 7.2 6.8 6.7Industry, mining and energy 42.9 40.7 39.1 36.2 35.9 34.5 32.9Construction 3.5 5.1 5.1 4.6 4.6 4.8 4.6Trade 2.0 4.6 3.2 2.0 1.7 1.7 1.6Hotels, restaurants and tourism 0.6 0.8 1.3 0.4 0.4 0.4 0.4Transportation and communications 20.9 22.5 20.8 22.4 23.5 22.9 20.8Finance and credit 0.5 0.2 0.9 0.5 0.5 0.5 0.5Science and technology 1.9 0.3 0.7 1.0 0.9 1.4 1.5Real estate, renting and consulting 0.6 0.8 0.9 1.5 1.3 1.5 1.8State management and defense 3.6 2.7 3.5 5.9 6.0 6.4 6.4Education and training 5.3 3.8 4.4 5.9 5.4 5.4 5.2Healthcare and social relief 2.3 2.1 2.5 3.9 3.4 3.2 3.0Culture, recreation and sport 1.6 2.2 2.8 2.7 2.5 2.5 2.4Party and mass organization 0.3 0.3 0.2 0.4 0.4 0.4 0.4Individual and community services 5.0 5.7 6.0 5.7 6.3 7.8 12.0Total 100.0 100.0 100.0 100.0 100.0 100.0 100.0
Source: Based on data from GSO. Figures are in percent of total public investment.

One problem in this respect is the decliningrole of MPI as an investment appraisalagency, at a time when local authorities stilllack the relevant expertise. As part of thedrive towards decentralization, MPI isincreasingly confined to a stewardship role,not intervening anymore in project appraisaland implementation. As a result, there is noagency in government with the capacity andthe authority to review public projectsprepared by lower levels of government andrecommend changes (including theirpostponement or cancellation) when they donot meet minimum cost-effectivenessstandards.
There are also important weaknesses in theimplementation of public investmentprojects. While projects in category C shouldbe completed within two years, delays arecommon due to insufficient funding. Also,the amendment of approved projects is acommon practice, often resulting insubstantial increases of the amount ofresources spent.
The National Assembly can conduct on-siteevaluation of project performance. Inrecent years, it has also taken a number ofsteps to strengthen the management ofpublic projects. For instance, in 2006,although on-budget investment hadincreased by 23.6 percent, the total numberof projects was brought below 13,000. As aresult, the average capital per projectbecame larger, monitoring was facilitated,and implementation delays were reduced.
In the end, one of the biggest difficulties is topostpone or cancel a poorly performingproject. Until recently, this was only done onan exceptional basis, due to the potentialclash with the local government or agency in
charge. A large pulp project in Gia Lai wasone of very few large projects that were everrejected, and this was only after protracteddiscussions. However, the macroeconomicturbulence of late 2007 and early 2008required more decisive action to containpublic expenditure. This was done underPrime Minister Decision 390, issued in April2008. By then, MPI had already introducedstandardized templates for the monitoring ofpublic investment projects. Subsequently,with the authority provided by Decision 390,it requested line ministries and provinces tocompile a list of all their ongoing projectshaving lost their relevance, being poorlyimplemented or lacking appropriate funding.On the basis of this information, MPIadjusted, downscaled or stopped 1,145public projects with a total value of morethan 30 trillion dong, accounting for 12.7 percent of planned investment.
For how long these cuts will hold remains tobe seen. But Decision 390 represented acritical step in the direction of bringingcoherence to an increasingly decentralizedpublic investment program. While anumber of legal documents have beenadopted in line with international practices,Vietnam has yet to develop a PublicInvestment Law to govern projects financedby public resources. This would have thepotential to increase the efficiency in theuse of state capital. As a Public InvestmentLaw is prepared, the lessons from early2008 should be taken into consideration.The delegation of decisions related to publicinvestment projects is not incompatible withtheir screening on economic and socialgrounds, with the monitoring of theirimplementation, and with their adjustmentwhen circumstances require.
CAPITAL MATTERS
56
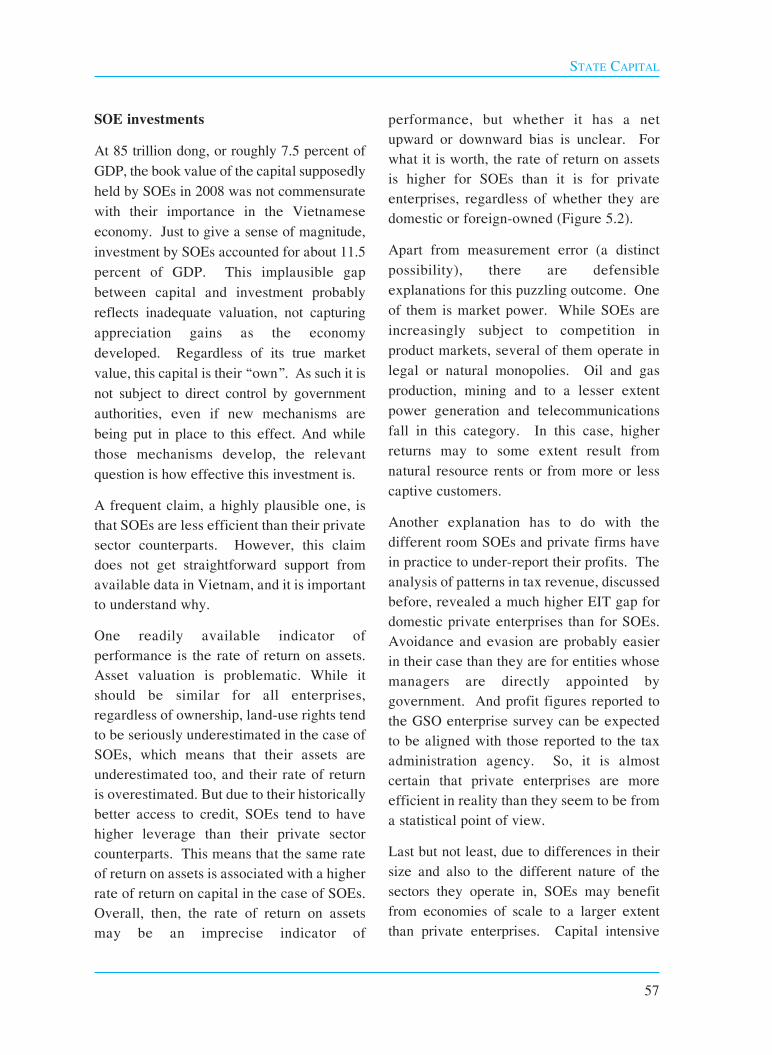
SOE investments
At 85 trillion dong, or roughly 7.5 percent ofGDP, the book value of the capital supposedlyheld by SOEs in 2008 was not commensuratewith their importance in the Vietnameseeconomy. Just to give a sense of magnitude,investment by SOEs accounted for about 11.5percent of GDP. This implausible gapbetween capital and investment probablyreflects inadequate valuation, not capturingappreciation gains as the economydeveloped. Regardless of its true marketvalue, this capital is their “own”. As such it isnot subject to direct control by governmentauthorities, even if new mechanisms arebeing put in place to this effect. And whilethose mechanisms develop, the relevantquestion is how effective this investment is.
A frequent claim, a highly plausible one, isthat SOEs are less efficient than their privatesector counterparts. However, this claimdoes not get straightforward support fromavailable data in Vietnam, and it is importantto understand why.
One readily available indicator ofperformance is the rate of return on assets.Asset valuation is problematic. While itshould be similar for all enterprises,regardless of ownership, land-use rights tendto be seriously underestimated in the case ofSOEs, which means that their assets areunderestimated too, and their rate of returnis overestimated. But due to their historicallybetter access to credit, SOEs tend to havehigher leverage than their private sectorcounterparts. This means that the same rateof return on assets is associated with a higherrate of return on capital in the case of SOEs.Overall, then, the rate of return on assetsmay be an imprecise indicator of
performance, but whether it has a netupward or downward bias is unclear. Forwhat it is worth, the rate of return on assetsis higher for SOEs than it is for privateenterprises, regardless of whether they aredomestic or foreign-owned (Figure 5.2).
Apart from measurement error (a distinctpossibility), there are defensibleexplanations for this puzzling outcome. Oneof them is market power. While SOEs areincreasingly subject to competition inproduct markets, several of them operate inlegal or natural monopolies. Oil and gasproduction, mining and to a lesser extentpower generation and telecommunicationsfall in this category. In this case, higherreturns may to some extent result fromnatural resource rents or from more or lesscaptive customers.
Another explanation has to do with thedifferent room SOEs and private firms havein practice to under-report their profits. Theanalysis of patterns in tax revenue, discussedbefore, revealed a much higher EIT gap fordomestic private enterprises than for SOEs.Avoidance and evasion are probably easierin their case than they are for entities whosemanagers are directly appointed bygovernment. And profit figures reported tothe GSO enterprise survey can be expectedto be aligned with those reported to the taxadministration agency. So, it is almostcertain that private enterprises are moreefficient in reality than they seem to be froma statistical point of view.
Last but not least, due to differences in theirsize and also to the different nature of thesectors they operate in, SOEs may benefitfrom economies of scale to a larger extentthan private enterprises. Capital intensive
STATE CAPITAL
57

activities such as mining or naval constructionhave very high fix costs, which means thattheir average cost per unit declines as theproduction volume increases. If so,inefficiencies in the internal management ofSOEs could be more than offset by scaleeffects playing to their advantage.
Regardless of the explanation for thisapparent anomaly, economic analyses thatsimply take for granted the inefficiency ofSOEs may be too simplistic to be useful.Vietnam does not seem to have the rust beltof poorly performing SOEs whichcharacterized the former Soviet block andeven some regions of China. This is not tosay that SOEs are at the efficiency frontier;almost certainly they are not. Moreover,large SOEs may pose risks to economicstability when they expand into financialsector activities, as will be discussed later.Therefore, reforming the state sector andbringing in private capital, if done right,should result in higher overall economicefficiency. The relevant question, from a
policy perspective, is how to do it right.
Divesting capital
Until recently, efforts to increase theefficiency of SOEs in Vietnam had combinedthree basic elements: enhancing autonomyfrom government administration for day-to-day management decisions, bringing inprivate investors through the equitization ofcapital, and adopting the corporategovernance models of the private sector.
The first one of these elements wasintroduced in earlier stages of the reformprogram. Equitization had been piloted earlyon too, but only gained speed after 2001. Bynow some 3,800 SOEs have sold some or allof their capital to outsiders. Equitization alsorequired taking SOEs out of the regulatoryframework provided by the SOE Law andbringing them under the umbrella of theEnterprise Law. One further step in thisprocess was the adoption of the unifiedEnterprise Law in 2005. This law provided acommon set of corporate governance
CAPITAL MATTERS
58
0.0
0.5
1.0
1.5
2.0
2.5
3.0
3.5
4.0
SO
Es
Centr
a lS
OE
s
Non -
state
E nte
rpri
ses
Sha r
eho
ldin
g
wit h
Sta
te
Equ
ity
10 0
%F
DI
2004
2005
2006
Figure 5.2: Rate of Return on Assets by Enterprise Ownership
Source: Based on Enterprise Survey from GSO. Figures are in percent.

framework for all enterprises, regardless ofownership. The unified Enterprise Law isbeing used to convert SOEs into either joint-stock companies or single-member limitedliability companies.
There have been several studies to assesswhether this combination of managerialautonomy, private ownership and corporategovernance has improved the efficiency ofSOEs. Some of those studies have comparedthe performance of enterprises before andafter equitization, based on a range ofindicators such as capital, turnover, profitsand salaries. Others have compared totalfactor productivity gains across enterpriseswith different ownership structures. All ofthese studies show equitization under apositive light.
Now that the process is reaching large SOEs,new issues emerge. As the amount of capitalat stake is sizeable, valuation becomes moresensitive. In the initial stages of equitization,which concerned small SOEs, few outsiderswould have dared to buy shares. Sellingthem at book value (in fact, at a discount) todirectors and employees was probably theonly workable approach. As bigger SOEscame in line for equitization, public auctionsstarted to be used. Having a “pricediscovery” mechanism of this sort in placebecame essential, given how murky thevaluation of land and intangible assets wouldotherwise be.
The risk with selling at book value was tosee large capital gains being made byinvestors shortly after equitization. Whileprobably irrelevant in terms of economicefficiency, this windfall would have madethe government vulnerable to the accusationof having handed over state assets at a
bargain price. The associated corruptionrisks and the global notoriety of “oligarchs”having made their fortunes in botchedprivatization episodes elsewhere, made itcritically important to ensure some form ofcompetition in the divestiture of state assets.
The emphasis on competition was pushedeven further as the largest SOEs and SOCBscame in line for equitization. In their case,and after failed attempts to do strategicplacement, the government decided that apublic auction would be conducted using thestock exchange as a platform. While notnecessarily involving a stock exchangelisting, this approach was aimed at ensuringtransparent price discovery. Onlysubsequently could direct negotiations beengaged with strategic investors, but theshare price could be no less than the InitialPublic Offering (IPO) price. While thisapproach had the merit of its transparency,its implementation ended up being morecomplicated than expected (Box 5.1).
By now, it seems clear that the mechanismsto equitize large SOEs need to be re-considered. Having a credible pricediscovery mechanism remains cruciallyimportant. Unfortunately, valuations byindependent advisors may not havesufficient credibility in this respect.Thorough valuations can only be undertakenfor very large SOEs, and even in their casethe experience so far is that IPOs may yieldsubstantially different share prices. This isnot to say that the IPO prices are in any wayreasonable. But the very fact that huge gapsare common undermines the credibility ofthe valuation, while at the same timecreating serious governance risks. If atransparent competition mechanism is usedfor price discovery, equitization could come
STATE CAPITAL
59

to be seen with suspicion, and eventually thecredibility of the SOE reform program wouldbe at risk. For this reason, proposals toproceed with direct sales of state capital to
strategic investors, while obviously favoredby potential investors and financialintermediaries, should not be embracedlightheartedly.
CAPITAL MATTERS
60
Box 5.1: Equitization Methods: Competition versus Direct Sale
The equitization method based on conducting an IPO on a small share of the capital throughpublic auction in the stock market was tried four times between 2006 and 2008. These fourepisodes concerned two leading insurance companies (PetroVietnam Insurance and BaoViet), one large beer brewery (Habeco), and one of the biggest SOCBs (Vietcombank).
PetroVietnam Insurance did its IPO in December 2006, when the market was about to entera period of bubble. The exuberant mindset of the time was reflected in an auction winningprice of 160,250 dong per share, against the starting price of 11,500 dong. In June 2007,additional shares were sold by auction and rights issue, yielding a winning price of 75,500dong. Even at that lower price, PetroVietnam Insurance could not find a strategic investorfor a while. Then, in April 2008, when the stock market was reaching bottom in the aftermathof the stabilization program, a deal was reached with Temasia Capital of Hong Kong, China.
Bao Viet went through IPO in May 2007, when the stock market was hottest, and offered an8.7 percent stake through public auction. The bid was strong, driving up the winning priceper share to nearly 74,000 dong, compared to a starting price of 30,500 dong. Due to thevery high price, however, the actual subscription reached only 74 percent of the amount won.Subsequently, Bao Viet attempted to sell part of its capital to strategic investors, but by thenthe share price had been diluted by new share issues to employees at a heavily discountedprice. Given that the transaction could not be conducted below the IPO price, theexpectation was that the transaction would fail. Then, in September 2007 Bao Viet managedto sell a 10 percent stake to HSBC and an additional 3.5 percent to Vinashin.
Habeco conducted its IPO in March 2008, when the stock market was already low. It onlymanaged to sell 4.4 million shares, out of the 35 million offered. At 50,015 dong per share,the winning price was barely above the 50,000 dong starting price. Carlsberg from Denmarkhad a 10 percent stake in Habeco’s capital from earlier on. After the IPO it acquired anadditional 5.77 percent.
These three cases can be considered successful, in the sense that a strategic investor wasattracted, or increased its stake in the company. This is despite the fact that two of them hadIPO prices which were multiples of the starting price. However, the fourth case is stillpending, and is seen as a failure.
Vietcombank had its IPO in December 2007, when the stock market was still high. This wasafter months of protracted negotiations with three potential strategic investors. Although theterms of these negotiations remain confidential, it is generally believed that prices beingdiscussed were around 60,000 dong per share. With the stock market still riding high, the IPOresulted in shares being sold at 108,000 dong. But the stock market plunged by one third inthe months following the adoption of the stabilization package. With shares trading in theinformal market at a fraction of the IPO price, attracting a strategic investor will be challenging.

Minor changes to the current approach couldactually address some of its shortcomings.IPOs processed through the stock marketprovide an easily observable price discoverymechanism, but not necessarily one that isconducive to finding the fundamental priceof the assets being sold. Equitization IPOsare not governed by the Securities Law,which means that full disclosure is notrequired. Because a small stake is offered tothe market, the auction attracts mainly retailinvestors who have little understanding ofthe fundamental value of the assets offered.The risk is that the IPO price could be toohigh. This may happen when the price isdriven up by unsophisticated domesticinvestors or when the entire market is drivenup by market sentiment or expansionarymacroeconomic policy. In this case, thealternative is to use the subsequent marketprice of the share sold through the IPO as thefloor price for the sale to strategic investors.
In the case of small SOEs, competitivebidding provides a simple mechanism forprice discovery. Financial statementsindependently audited could be made public,and prospective be invited to submit sealedoffers, as they would do for a tender. If noapplications are received, then a direct salecan be considered. Having given theopportunity for everyone to compete for thecapital stake being sold should help dispelany suspicions that the direct sale involvedfavoritism.
Managing capital
The SOE reform process entered a new phasein 2005, with the establishment of the StateCapital Investment Corporation (SCIC). TheSCIC is a for-profit organization mandated toexercise ownership rights in SOEs on behalf of
the state. In order to do so, it has to firstreceive those rights from the relevant lineministries and provincial governments. As ofSeptember 2008, the SCIC had receivedownership rights in 882 SOEs, with a bookvalue of 7.6 trillion dong. These SOEs operatein various sectors such as financial services,energy, manufacturing, telecommunications,construction, transportation, consumerproducts, health care, and informationtechnology (IT).
The transfer of SOE ownership rights to theSCIC is aimed at solving a conflict ofinterest, whereby those in charge of adoptingor implementing policies and regulations arealso in charge of enterprises subject to thosepolicies and regulations. The SCIC canprobably do very little to improve theinternal efficiency of the SOEs, and itprobably should not even try. But its creationhas the potential to strengthen the incentivesfaced by line ministries and provincialgovernments to adopt policies andregulations which are in the public interest,and to implement them without favoritism.
The SCIC is also charged with the task offully divesting SOEs which are not ofstrategic importance. Enterprises targetedfor full divestiture include those having astate share of capital below 30 percent, atotal chartered capital of less than 20 billiondong and a rate of return on equity lowerthan 15 percent. In addition, theseenterprises must operate in sectors notconsidered as a priority by government. Theother SOEs under SCIC are considered aseither strategic investments or flexibleinvestments. These other SOEs are to belisted in the stock market, so as provide theSCIC with an easily observable performanceindicator, facilitating its task as portfolio
STATE CAPITAL
61

manager on behalf of the state. The SCIC isalso supposed to assist its affiliatedcompanies to list overseas and to raise fundsthrough other means.
Of the 882 SOEs the SCIC had received bySeptember 2008, 40 had already beendivested, and another 754 were expected tofollow suit. The same classification andtreatment will apply to the roughly 1,200additional SOEs the SCIC should receivefrom line ministries and provincialgovernments in the coming time.
It is less clear that the SCIC will be in chargeof exercising ownership rights on behalf of thestate in the case of Economic Groups and largeState Corporations. These are still, for theforeseeable future, under the direct authorityof the Prime Minister, with any transfer ofownership to be decided on a case-by-casebasis. There are also uncertainties regardingSOCBs, which report to SBV. For now, thetransfer of ownership rights to the SCIC hasbeen approved in the case of three SOCBs(Vietcombank, MHB and Vietinbank) andthree large General Corporations (Vinaconex,Constrexim and VEIC).
In this respect, the Vietnamese approach tomanaging SOEs has both similarities anddifferences with the Chinese approach (Box5.2). Like the Chinese State-owned AssetsSupervision and Administration Commission(SASAC), the SCIC effectively addressesthe conflict of interest between regulationand management, because it is managed for
profit and has no regulatory authority. Butthe Chinese SASAC was focused on thelargest SOEs, which were seen as those withthe highest potential to benefit fromeconomies of scale and become globalplayers over a short period of time. On theother hand, their Vietnamese equivalents,namely the Economic Groups and large StateCorporations, are still firmly anchored undergovernment. Also, the Chinese SASAC didnot combine commercial and financialinterests under the same roof, whereas theVietnamese SCIC will exercise ownershiprights in both commercial enterprises andvery large banks.
From this perspective, it may be worthreconsidering some of the features of thenew phase of the SOE reform processinitiated in 2005. The way in whichEconomic Groups and large StateCorporations diversified into financial sectoractivities during the asset price bubble of late2007 and early 2008 raises concerns abouteconomic efficiency and macroeconomicstability. While those concerns are discussedin more detail later in this report, strongerstate management mechanisms may berequired in their case. And the fact thatEconomic Groups remain under the directoversight of appointed line ministries andgovernment agencies means that conflict ofinterest between regulation and ownershipstill needs to be addressed. As Vietnamderives the lessons from the recentmacroeconomic turbulence, this wouldcertainly be an area deserving attention.
CAPITAL MATTERS
62
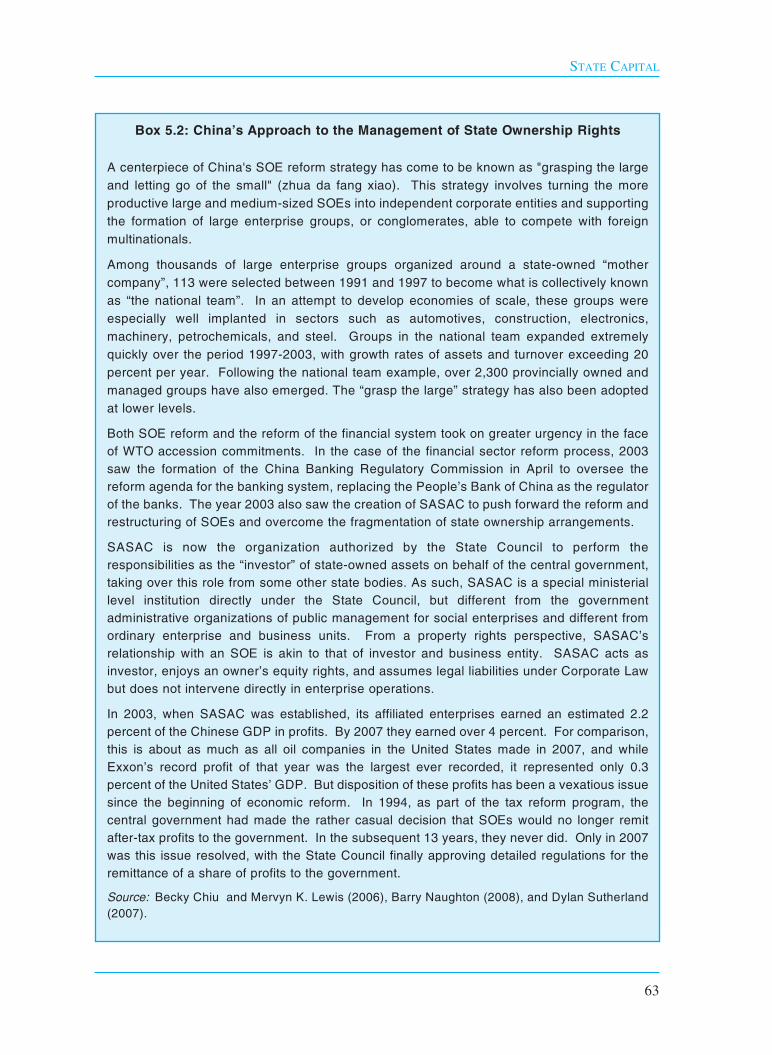
STATE CAPITAL
63
Box 5.2: China’s Approach to the Management of State Ownership Rights
A centerpiece of China's SOE reform strategy has come to be known as "grasping the largeand letting go of the small" (zhua da fang xiao). This strategy involves turning the moreproductive large and medium-sized SOEs into independent corporate entities and supportingthe formation of large enterprise groups, or conglomerates, able to compete with foreignmultinationals.
Among thousands of large enterprise groups organized around a state-owned “mothercompany”, 113 were selected between 1991 and 1997 to become what is collectively knownas “the national team”. In an attempt to develop economies of scale, these groups wereespecially well implanted in sectors such as automotives, construction, electronics,machinery, petrochemicals, and steel. Groups in the national team expanded extremelyquickly over the period 1997-2003, with growth rates of assets and turnover exceeding 20percent per year. Following the national team example, over 2,300 provincially owned andmanaged groups have also emerged. The “grasp the large” strategy has also been adoptedat lower levels.
Both SOE reform and the reform of the financial system took on greater urgency in the faceof WTO accession commitments. In the case of the financial sector reform process, 2003saw the formation of the China Banking Regulatory Commission in April to oversee thereform agenda for the banking system, replacing the People’s Bank of China as the regulatorof the banks. The year 2003 also saw the creation of SASAC to push forward the reform andrestructuring of SOEs and overcome the fragmentation of state ownership arrangements.
SASAC is now the organization authorized by the State Council to perform theresponsibilities as the “investor” of state-owned assets on behalf of the central government,taking over this role from some other state bodies. As such, SASAC is a special ministeriallevel institution directly under the State Council, but different from the governmentadministrative organizations of public management for social enterprises and different fromordinary enterprise and business units. From a property rights perspective, SASAC’srelationship with an SOE is akin to that of investor and business entity. SASAC acts asinvestor, enjoys an owner’s equity rights, and assumes legal liabilities under Corporate Lawbut does not intervene directly in enterprise operations.
In 2003, when SASAC was established, its affiliated enterprises earned an estimated 2.2percent of the Chinese GDP in profits. By 2007 they earned over 4 percent. For comparison,this is about as much as all oil companies in the United States made in 2007, and whileExxon’s record profit of that year was the largest ever recorded, it represented only 0.3percent of the United States’ GDP. But disposition of these profits has been a vexatious issuesince the beginning of economic reform. In 1994, as part of the tax reform program, thecentral government had made the rather casual decision that SOEs would no longer remitafter-tax profits to the government. In the subsequent 13 years, they never did. Only in 2007was this issue resolved, with the State Council finally approving detailed regulations for theremittance of a share of profits to the government.
Source: Becky Chiu and Mervyn K. Lewis (2006), Barry Naughton (2008), and Dylan Sutherland(2007).

64
In the transition from plan to market, policylending was separated from commerciallending and regrouped in specializedinstitutions explicitly benefitting frombudget support to finance their operations.At present, there are two such institutions,namely VDB, which lends for large priorityprojects, especially in infrastructure, andVBSP, which provides targeted support forthe poor and other disadvantaged groups. Interms of their outstanding portfolio, VDB isfive times as large as VBSP. But in a way,the operation of VDB can be considered asan integral part of state capital management.The operation of VBSP raises differentissues, mainly related to access to financeamong poor households. Like manymicrofinance institutions around the world,lending relies on Savings and Credit Groups,whose participants are held collectiveaccountable for loan repayment. But unlikestandard microfinance institutions, VBSPworks closely with mass organizations andlocal authorities, which are in charge ofrecruiting borrowers, but also of verifyingthat they are eligible for subsidized credit.The overall number of borrowers is quitelarge, representing roughly a quarter of thenumber of households in the country. Andthe targeting is satisfactory as well. Theproportion of borrowing households is muchlarger among those below the poverty line(and even among the food poverty line) than
it is among the near poor and the better-off.And VBSP loans represent a large fraction ofhousehold expenditures among the poor thanamong the better-off. Leakage isconsiderable mainly because there are manymore better-off households in Vietnam thanthere are poor households. The impact ofVBSP lending on household living standardsappears to be positive, but relatively modest.With roughly half of VSBP borrowers beingnon-poor, the question is whethersubsidization is warranted. The case ofCambodia, where microfinance is organizedon a for-profit basis and has been thriving, isat times shown as an example that otherapproaches can be implemented, withouttitling the playing field. The strategy of theVSBP is to move in the direction of morecommercially-oriented microfinance in thefuture, but this may be a gradual process.
Social policy
VBSP was established in 2002 to take overthe small-scale policy and directed lendingprograms previously administered bySOCBs and other government entities,including the Vietnam Bank for the Poor.Its institutional arrangements envision anon-profit bank that offers a full range offinancial products and services atsubsidized rates. In particular, VBSP issupposed to provide micro-credit at lowinterest rates without collateral. To target
6. POLICY LENDING

the poor, it works extensively with massorganizations.
VBSP is exempt from many of the regulatoryprovisions that govern the operation ofSOCBs and it is not covered by theregulatory framework for microfinanceinstitutions either. With headquarters inHanoi, it has 64 branches, 600 sub-branchesand 8000 outlets, with more than 7,000 staff.Its management board is chaired by theGovernor of the SBV and the other membersof the board are from other governmentministries or are directly appointed by thePrime Minister. MPI guides its operationalpolicies, whereas MOF oversees its financialmanagement. People’s Committees areprimarily responsible for the establishmentand regulation of local savings and capitalborrowing groups.
The VBSP has a charter capital of 8 trilliondong and an entrusted capital of 5.5 trillionfrom the state budget. These fundingsources are complemented by mandatorycontributions of 2 percent of total dongdeposits by the SOCBs. The rates paid to theSOCBs are negotiable. Capital is alsocomplemented with resources from OfficialDevelopment Assistance (ODA) on-lending,deposits, and borrowing from varioussources, including the Vietnam PostalSavings Service Company, the SocialInsurance Fund and the SBV.
Under current arrangements, VBSP is not asolvent institution. As of 2008, outstandingloans by the VBSP totaled 30 trillion dong.A third of this amount was funded bydeposits from the public, a quarter bydeposits from SOCBs, a fifth through statebudget grants, 16 percent by borrowing fromSBV and 6 percent by borrowing from theState Treasury. Another way to break down
outstanding borrowing is based on its terms.As of 2008, VBSP had borrowed 17.1 trilliondong in concessional terms, and 13.3 trillionin market terms. The state budget covers thecost of subsidized lending and the lossesVBSP may incur, as long as they arereasonable.
The target population of VBSP is quitebroad. It includes households classified aspoor, which are allowed to borrowfor productive business, safe water,electricity, housing and schooling. VBSPalso finances scholarships for disadvantagedstudents at universities, colleges andvocational training schools. A so-called jobcreation program targets small businesses,cooperatives, farms, business units for thedisabled, socio-labor education centers, andbusiness households. The households ofmigrant workers going abroad under thelabor exports program are entitled to borrowas well. In addition, there are programs forsafe water supply and rural sanitation, forproduction units employing former drugaddicts, and for especially disadvantagedethnic minority households.
Two main lending methods are used. Forbusiness households and production units,disbursement is made directly to theborrower, with VBSP in charge of all lendingprocedures, as well as controlling,supervising and collecting. For poorhouseholds and beneficiaries of socialpolicies, on the other hand, lending isimplemented through the establishment ofSavings and Credit Groups. At present,VBSP has trust contracts with four massorganizations to set up these groups. Theseare the Vietnam Women’s Union, VietnamFarmers’ Association, Vietnam Union andVietnam Youth Union.
POLICY LENDING
65

While group lending is organized alongstandard micro-finance principles, the closeworking relationship between massorganizations, local government officials andVBSP is a distinctive feature of Vietnam.Typically, local officials or representativesof mass organizations introduce the lendingproducts of VBSP to their constituencies.Households are invited to create Savings andCredit Groups. To be eligible, they have tobe residents of the same village or cluster ofhouseholds, and they must range from 30 to50. The list needs to be approved by thelocal People’s Committee before being sentto VBSP, to certify that member householdsare classified as poor or are indeed eligiblefor support.
Data from the outstanding loan portfolio ofVBSP suggest that it has been quitesuccessful (Table 10.1). Its 6.3 millionactive loans are equivalent to slightly more
than a quarter of the total number ofhouseholds in Vietnam. At 7.5 million dong,the average loan size is definitely modest.Financial charges on loans are modest.According to the household expendituresurvey of 2006, the average monthly interestpaid on VBSP loans was 0.36 percent permonth, or around 4.3 percent per year. Onlyfor the small and medium enterprisesprogram is the average loan size important,but this line of business has a different status,as it is run in partnership with KFW. All ofthis suggests that VBSP is reachingbeneficiaries of modest means. Whetherthey are the most modest, and what impactdoes subsidized lending have on theirlivelihoods, are different issues.
Poverty impact
The same household expenditure surveysused to measure poverty can be countedupon to assess how well targeted VBSP
CAPITAL MATTERS
66
Table 6.1: Beneficiaries from Social Policy Lending
Outstanding Average loanloans Number of size (thousand
Program (billion dong) beneficiaries dong)
Poor households 26,776 3,917,793 6,834Safe water supply and rural sanitation 3,181 757,698 4,198Disadvantaged students 6,061 731,224 8,289Especially disadvantaged communes 5,839 353,572 16,514Job creation 3,278 305,422 10,733Housing in the Mekong Delta area 541 65,642 8,242Temporary migrants abroad 730 44,846 16,278Ethnic minority households 162 34,095 4,751Forestry development by households 108 6,646 16,250Small and medium enterprises 134 440 304,545Others 245 53,250 4,601Total 47,055 6,270,628 7,504
Source: VBSP. Data are as of September, 2008. The small and medium enterprises component isimplemented as part of a partnership program with KFW.

lending programs are. Given that thoseprograms are subsidized, there is littlejustification to channel the resources tohouseholds which are not really in need.However, there are some grounds to beconcerned about the selection ofbeneficiaries at local levels. For instance,Savings and Credit Groups are said to bereluctant to include very poor households inthe borrowing lists, out of concerns abouttheir low repayment capacity. Even beyonddeliberate decisions by authorities, therecould be a selection bias at play. The pooroften lack the education to identify or exploitinvestment opportunities, which could makethem less prone to ask for loans.
Household data for 2006 indicate a relativelybetter targeting than could be anticipated(Figure 6.1). The highest participation rates,around 15 to 16 percent, can be found amonghouseholds in the two poorest groups of thepopulation. The participation rate remainsrelatively high among the near poor, at
around 10 percent, but it falls below 5percent of all households for the better-off.Borrowing amounts also display a clearprogressivity, if not in absolute terms at leastrelative to household expenditures. Thetypical loan of a household living below thefood poverty line accounts for 58 percent ofits annual expenditures. The proportiondeclines steadily, to reach 23 percent in thecase of better-off households.
This said, a majority of the Vietnamesepopulation can currently be classified asbetter-off. This means that in spite of a lowerparticipation rate, this group accounts for alarge share of beneficiaries and absorbs alarge proportion of resources. Almost 47percent of the borrowing households can beconsidered better off, and they receivealmost half of social policy lending. Fromthis perspective, VBSP faces a considerableextent of leakage. Some of it is by design.For instance, its water supply and sanitationprogram is targeted to rural areas, but not
POLICY LENDING
67
0
5
10
15
20
Food poor Other poor Near poor Non poor
0
10
20
30
40
50
60
70
Borrowing households Loan size
Per
cent
ofho
useh
olds
Per
cent
ofan
nual
expe
nditu
res
Figure 6.1: Is Social Policy Lending Well Targeted?
Source: Based on Cuong Viet Nguyen (2008). Data are for 2006.

exclusively to the poor. But in most cases,leakage is more of an unintendedconsequence, calling for a strengthening oftargeting mechanisms
An altogether different question is whethersocial policy lending has a substantial impacton living standards. If it does, then some ofthe previous discussion about targeting ispotentially misleading. Indeed, if VBSPloans were very successful at liftinghouseholds out of poverty, few of theborrowers would be poor. Success inpoverty reduction could thus bemisinterpreted as inadequate targeting. Andthere is some evidence that VBSP lendingmakes a difference. However, it may not bethat substantial.
The assessment in this case relies on thecomparison of pairs of households whichare similar in all respects, except that onereceived a loan and the other did not. Thecomparison relies on statistical methodswhich allow determining when twohouseholds can indeed be considered“similar in all respects”. The analysissuggests that the borrowing households seetheir expenditures increase by around 5percent, and their income by up to 9percent.
The gap between the estimated impact onexpenditures and income implies thatborrowing households save more. This inturn is consistent with a mobilization of ownresources (in addition to the borrowedresources) for investment purposes.Reassuringly, the percentage of overdueloans among Credit and Savings Groupsstood below 1.5 percent in 2008. This is alsoconsistent with relatively successfulinvestments by borrowing households.
Unfair competition?
With a borrower base that extends wellbeyond the poor, VBSP certainly competeswith other money lenders, formal andinformal. The most obvious competitor isthe Vietnam Bank for Agriculture and RuralDevelopment (VBARD), which has a verybroad reach too, but lends in commercialterms and requires collateral on most loans.
Even among the poor, who often have littleto offer in terms of collateral, there are othersources of finance available. Informalrotating savings and credit groups are one ofthem. These groups include individuals whoknow and trust each other well enough toformulate together a saving and borrowingprocess. Shopkeepers are another source ofinformal credit in rural Vietnam. They sellon credit agricultural inputs such aspesticides, fertilizers and seeds, and collectpayments after the harvest. There aremoneylenders too. These are usuallywealthy families living in the samecommunities or villages, who can rely ontheir good knowledge of customers to decidewhether any collateral is needed. Theirloans are in cash or in kind, typically for ashort duration and at very high interest rates.
Household survey data reveal that VBSP isan important competitor for commercialbanks and commercial money lendersamong the poor and the near poor (Figure6.2). Only among the better-off does itbecome a relatively marginal player.Conversely among households below thefood poverty line is VBSP a more importantsource of finance than commercial banks.And even among that extremely deprivedgroup, the difference is not large.
Because subsidized lending represents a
CAPITAL MATTERS
68
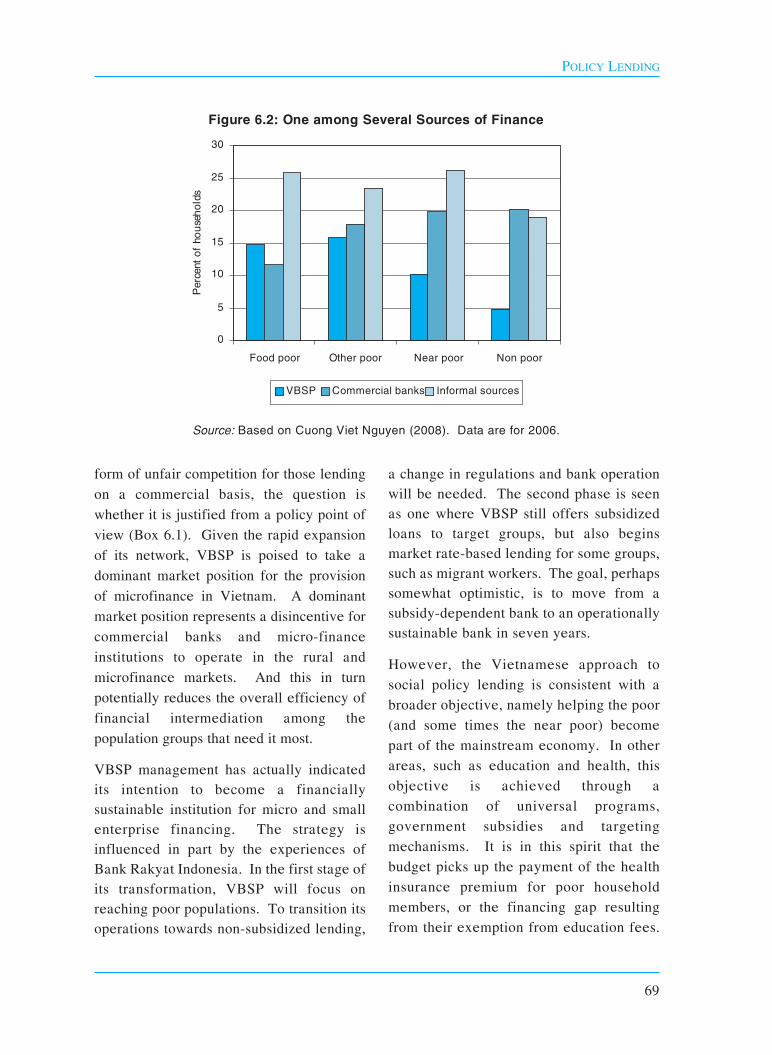
form of unfair competition for those lendingon a commercial basis, the question iswhether it is justified from a policy point ofview (Box 6.1). Given the rapid expansionof its network, VBSP is poised to take adominant market position for the provisionof microfinance in Vietnam. A dominantmarket position represents a disincentive forcommercial banks and micro-financeinstitutions to operate in the rural andmicrofinance markets. And this in turnpotentially reduces the overall efficiency offinancial intermediation among thepopulation groups that need it most.
VBSP management has actually indicatedits intention to become a financiallysustainable institution for micro and smallenterprise financing. The strategy isinfluenced in part by the experiences ofBank Rakyat Indonesia. In the first stage ofits transformation, VBSP will focus onreaching poor populations. To transition itsoperations towards non-subsidized lending,
a change in regulations and bank operationwill be needed. The second phase is seenas one where VBSP still offers subsidizedloans to target groups, but also beginsmarket rate-based lending for some groups,such as migrant workers. The goal, perhapssomewhat optimistic, is to move from asubsidy-dependent bank to an operationallysustainable bank in seven years.
However, the Vietnamese approach tosocial policy lending is consistent with abroader objective, namely helping the poor(and some times the near poor) becomepart of the mainstream economy. In otherareas, such as education and health, thisobjective is achieved through acombination of universal programs,government subsidies and targetingmechanisms. It is in this spirit that thebudget picks up the payment of the healthinsurance premium for poor householdmembers, or the financing gap resultingfrom their exemption from education fees.
POLICY LENDING
69
0
5
10
15
20
25
30
Food poor Other poor Near poor Non poor
Perc
ento
fhou
seho
lds
VBSP Commercial banks Informal sources
Figure 6.2: One among Several Sources of Finance
Source: Based on Cuong Viet Nguyen (2008). Data are for 2006.

In the case of credit, VBSP allows poorhouseholds to access credit despite themnot having any collateral.
The relevant questions in Vietnam’s caseconcern the quality of the targeting methodbut also the mechanism used to channel the
subsidy. Greater reliance on marketprinciples would involve transferring thesubsidy to other microfinance institutions(operating for a profit, but also NGOs)when they effectively provide credit to thetargeted populations.
CAPITAL MATTERS
70
Box 6.1: Microcredit in Cambodia and Vietnam
Cambodia has a thriving microfinance sector, not subject to government intervention.Services are provided by a commercial bank, 17 privately-owned microfinance institutions,and 26 regulated non-governmental organizations (NGOs). These altogether have over onemillion clients or about 7.5 percent of the population. Microfinance institutions have a strongprofit orientation. Many of them have foreign investors as shareholders. Most of them areexpanding rapidly and several are now taking deposits from the general public for an evenstronger growth.
Among the key reasons that private sector microfinance operations have developed so far inCambodia is the importance given to a for-profit ownership structure. Some consider thatthe extent of transparency, market-based management, and equal treatment of foreign andlocal participants make the case of Cambodia exemplary. In their view, this shows that acountry can build a well-functioning and sustainable microfinance sector in a short time withclear and proper regulatory role of the government and vibrant private sector participation inthe provision of products and services.
More generally, the Cambodian approach is seen as different from that of Vietnam on severalimportant principles. Among them are the following:
● Microfinance is a business. In Vietnam microfinance is widely perceived as an activityto be financed and carried out by the government and NGOs, for social reasons morethan as a business. But the subsidization of lending terms deters participation by profit-oriented organizations.
● Microfinance is independent from local authorities. In Vietnam, microfinance institutionsare required to involve mass organizations among their owners, but the latter are so largethat there is a risk of undermining competition. The participation of the same massorganization in several microfinance institutions could actually result in a potential conflictof interest.
Source: Binh T. Nguyen and Robert C. Vogel (2008).
71
Credit from commercial banks has been oneof the main sources of finance in Vietnam,and the transition to a market economy hasbeen associated with a sustained increase inits volume, relative to GDP. However, theperiod following accession to the WTO wascharacterized by an unsustainableacceleration in the rate of credit growth,followed by a sudden contraction asgovernment priorities shifted to stabilization.This macroeconomic turbulence acceleratedwhat was an ongoing transformation of thebanking sector, but it also amplified systemicrisks. The ongoing transformationconcerned, among others, the ownershipstructure of banking institutions. Anambitious reform roadmap adopted in 2005envisioned bringing in strategic investors toall SOCBs. In spite of delays, several ofthem have made progress in this direction.Meanwhile strategic foreign investors haveacquired increasingly larger stakes in anincreasingly large number of Joint StockBanks (JSBs). The period of dramatic creditgrowth was seized by JSBs as an opportunityto gain market share, especially given therestrained lending stance of SOCBs as theytried to clean their portfolios in preparationfor equitization. The risks are mainly relatedto the quality of lending. The asset pricebubble associated with rapid credit growthattracted investments in the financial sectorby Economic Groups and large State
Corporations, which had deep pockets andsaw the opportunity for quick gains.However, investments in lending institutionsby large SOEs raise concerns about relatedparty transactions. The possibility for theselarge SOEs to raise deposits from the publiccould loosen the screening of theirinvestment projects and undo long-termefforts to improve the efficiency of the statesector. The asset price bubble also resultedin massive lending for real estate. Whichfraction of those loans will be servicedremains an open question. An assessment ofthe risks faced by the banking systemsuggests that a financial crisis is unlikely.But the quality of loan portfolios willdeteriorate given the bursting of the realestate bubble and the economic slowdown,at a time when Vietnam still lacksappropriate instruments to assessdevelopments on a bank-by-bank basis andto react timely when needed.
Rapid growth
As part of the transition to a market economythere has been considerable financialdeepening in Vietnam in recent years. Broadmoney (M2) accounted for only 58.1 percentof GDP in 2001, when reforms accelerated,and banking credit for 39.3 percent. At thatpoint, there were barely 200,000 private bankaccounts in the entire country. Credit cardswere uncommon and ATM machines were
7. BANKING CREDIT

unheard of. Since then, there has been asteady increase in the use of financialinstruments. At present, there are more than10 million ATM accounts in Vietnam,approximately half a million credit cards, andapproximately 5,000 ATMs in service.Between 2001 and 2006, banking credit grewat an average rate of 28.5 percent, but thedemand for money was growing rapidly aswell, as shown by the moderate rate ofinflation over this period (5.45 percent peryear on average). By the end of the previousfive-year cycle, in 2006, broad moneyalready represented 94.8 percent of GDP,and banking credit 71.3 percent.
A considerable acceleration occurred from2007 onwards, in fact so large that itrepresented a departure from the previoustrend. When Vietnam’s WTO accession wasbeing finalized, capital inflows startedaccelerating in the form of both FDI andportfolio investments. Confronted withmassive inflows, and concerned about thepossible appreciation of the Vietnamesedong, the authorities intervened in theforeign exchange market. As a result, thedong not only failed to appreciate in nominalterms, but actually depreciated by 0.14percent against the dollar in 2007. And thiswas at a time when the dollar was losingvalue against other international currencies.The flip side is that Vietnam’s foreignreserves increased by 10.1 billion dollars injust one year, reaching 21.6 billion dollars bythe end of 2007.
Massive purchases of foreign exchange toprevent the appreciation of the dong had theunwanted side effect of increasing liquidity.Until the last quarter of 2007, SBV wasrelatively successful at mopping up some ofthis additional liquidity by mobilizing various
monetary policy instruments. Among themwere sales of government securities and SBVbills, increases in banking reserverequirements and higher policy interest rates.Yet, selling securities proved increasinglydifficult as the interest rate offered becameunattractive compared to the returnsexpected in a booming real estate market.The result was a ballooning of banking credit,peaking at 63.2 percent per year in March2008 (Figure 7.1).
In response to the over-heating of theeconomy the central bank tookcontractionary measures leading to a suddenshortage in liquidity. Initially, the SBVstopped purchases of foreign currency.Subsequently, it did not renew a largereverse repo (a purchase of securities with acommitment to sell them back) and placedan even larger compulsory bill withcommercial banks. A more comprehensivepolicy package was adopted in March 2008,reflecting a switch in government prioritiesfrom rapid growth to economic stability.
The stabilization package was no doubtsuccessful. Inflation rates remained highduring several months, but this was mainlydue to the surge in the international prices offood products (especially rice) and oil. Witha pegged exchange rate, the impact of foodand oil inflation was transmitted to thedomestic market to a larger extent than inother countries in the region, where somecurrency appreciation had taken place.However, “core” measures of inflation(excluding food, foodstuff and transportationfrom the consumer price index) showed aclearly decelerating trend. Governmentexpenditures declined substantially, as didthe value of imports. Credit growth fell evenbelow the official 30 percent target.
CAPITAL MATTERS
72

Changing ownership
This surge and subsequent contraction incredit growth took place at a time when thestructure of the banking sector in Vietnamwas being fundamentally transformed. Infact, monetary turbulence had the positiveeffect of speeding up some of the ongoingbanking sector developments. But it alsohad the negative effect of amplifyingsystemic risks.
One of the driving forces behind thetransformation of the banking sector is thereform roadmap approved by the Politburoin August 2005, and converted into policyby the government in May 2006. At therisk of simplifying, this roadmap has twomain building blocks: the creation of amodern central bank, with the capacity toconduct monetary policy and supervisethe financial sector, and the introductionof a strong commercial orientation inSOCBs, by bringing strategic investorsinto all of them.
Since the approval of the banking reformroadmap, several SOCBs have madeprogress in their equitization plans. Themost advanced is Vietcombank, whichcompleted an IPO for a marginal share of itscapital in late 2007 and held its firstshareholders’ general meeting in April 2008.As part of its equitization plan, Vietcombankwas authorized to sell to strategic investorsup to 20 percent of its capital. However,those investors are not allowed to buy sharesbelow the IPO price, despite the fact that thestock market slump associated withmacroeconomic stabilization has broughtshare prices substantially down. A waiverfrom the Prime Minister would be needed togo below the IPO price, and this is providedthat the technical and financial assistanceoffered by the potential investor isconsidered valuable.
Some progress has been made by otherSOCBs as well. MHB had its equitizationplan approved in March, 2008. It includes
BANKING CREDIT
73
Key Monetary Aggregates(percent of GDP)
20
40
60
80
100
120
140
2004 2005 2006 2007 2008e
Total deposit Total credit Broad money
Key Monetary Aggregates(YOY growth in percent)
0
10
20
30
40
50
60
70
Sep-04
Mar-05
Sep-05
Mar-06
Sep-06
Mar-07
Sep-07
Mar-08
Sep-08
Total liquidity (M2)Total creditTotal deposit
Per
cent
Per
cent
Figure 7.1: Financial Deepening or Monetary Turbulence?
Source: Based on data from SBV and GSO.

the sale of 15 percent of the capital tostrategic investors with the accompanyingrequirement of long-term investment.Although this small SOCB has a relativelyclean balance sheet, and Deutsche Bank AGSingapore was contracted to provideconsulting services for its equitzation, thetransaction has still been stagnant due tounfavorable market conditions. The sameapplies to the cases of Vietinbank BIDValthough they are in different stages ofequitization process. In September 2008,Vietinbank’s equitization plan was officiallyapproved by the government. The bank canconduct the IPO for maximum 20 percent ofits charter capital of which a maximum of 10percent can be reserved for foreign strategicinvestors. In the long run, foreign strategicinvestors shall not own more than 20 percentof the bank’s charter capital. Vietinbankcontracted JP Morgan for equitizationconsulting services. BIDV’s equitizationplan has not been approved by thegovernment, but the bank has chosenMorgan Stanley for the consulting services.The biggest and most complex SOCB,Agribank has also embarked on its way toequitization. However, it is widelyanticipated that Agribank may take muchlonger than the rest four SOCBs due to itsvast, weakly-connected banking networkand the daunting task of cleaning up itsbalance sheet.
Meanwhile, foreign strategic investors havebeen acquiring stakes in JSBs. This trendhas continued steadily in spite ofmacroeconomic turbulence. Although JSBsare smaller than SOCBs, they offeradvantages compared to the opening offully-owned foreign subsidiaries. Thoseadvantages include a branch network and an
established customer base, providing a quickentry point into a rapidly growing market.Fully-owned bank subsidiaries have beenopened so far by Standard Chartered and theHong Kong - Shanghai Banking Corporation(HSBC). But these two banks have alsoacquired strategic stakes in existing JSBs, asalso have done other reputable foreigninvestors (Box 7.1).
In addition to the large SOCBs scheduled forequitization, to the JSBs increasinglyattracting strategic investors, and to the newfully-owned bank subsidiaries, the bankingsystem of Vietnam also comprises a series ofsmaller institutions. These had originallybeen established as rural banks but have inmost cases been upgraded to urban banks.Among them are Western Bank (previouslyCo Do Rural JSB), Saigon-Hanoi Bank(previously Nhon Ai Rural JSB), Kien LongBank, Dong Thap Muoi Bank, Ocean Bank,and Dai A Bank.
Related parties
A less expected development was theventuring of Economic Groups and largeState Corporations into non-core businessareas such as banking, insurance, securitiesand real estate. This happened during theasset price bubble of late 2007 and early2008, when it was expected that anyonemobilizing resources could quickly makesubstantial gains. Licenses to create newbanks were granted to LienViet, TienPhongand BaoViet; applications are still pending inthe cases of Vietnam Postal Savings ServiceCo (VPSC), and several others. As forEconomic Groups and large StateCorporations, 13 of them establishedsecurities investment funds, for a total of 1trillion dong; 19 invested in banks, for 4.4
CAPITAL MATTERS
74

BANKING CREDIT
75
Box 7.1: Strategic Investments in the Banking Sector
Five out of the 10 largest JSBs, jointly accounting for 13 percent of the total assets of theVietnamese banking system, have by now a foreign strategic investor.
HSBC acquired a 10 percent stake in Techcombank in December 2005, and increased it to15 percent in July 2007. Techcombank is one of the largest JSBs in Vietnam, with totalassets of 40 trillion dong at the end of 2007. HSBC became the first foreign bank to hold a20 percent stake in a Vietnamese bank after the government allowed Techcombank to sellanother 5 percent stake on July 30. Besides its Techombank investment, HSBC is alsoholding a 10 percent stake in Vietnam’s leading insurer Bao Viet Group.
The Overseas Chinese Banking Corporation (OCBC), the third largest financial group inSingapore, became a strategic partner of the Vietnam Commercial Bank for PrivateEnterprises (VPBank) in March 2006. VPBank has a registered capital of 2 trillion dong, anetwork of 140 branches and transaction offices throughout the country. The agreementincluded a commitment by OCBC to spend 8.2 million dollars over three years trainingVPBank personnel. In August 2008, VPBank was allowed to sell an additional 5 percentstake to OCBC, bringing its total stake to 15 of the capital.
The International Finance Corporation (IFC) of the World Bank, ANZ Bank and DragonFinancial Holdings (which owns the biggest investment fund in Vietnam) jointly hold themaximum allowable 30 percent of Sai Gon Thuong Tin Comercial JSB (Sacombank), thebiggest JSB in terms of charter capital. In late 2007, IFC reduced its ownership inSacombank by 2 percent, but the shares offered were quickly bought up by ANZ, so that the30 percent threshold has been fully kept.
In a similar fashion, Standard Chartered, IFC, Jardines and Dragon Capital jointly hold 30percent of Asia Commercial bank (ACB), the largest JSB in Vietnam in terms of assets. Thebank has benefited from the foreign strategic partners in strengthening its corporategovernance, capital base and management to make itself the leading JSB in Vietnam. InJuly 2008, Standard Chartered bought IFC’s shares in ACB to increase its ownership from8.84 percent to the maximum allowable 15 percent for a single foreign strategic partner in alocal bank.
The most noticeable investment by a foreign bank in local bank took place in July 2007 whenSumitomo Mitsui Banking Corporation (SMBC) purchased of 15 percent of Vietnam ImportExport Bank (Eximbank) for an amount of 225 million dollars. SMBC committed tosupporting Eximbank in its retail banking, export finance, corporate governance and riskmanagement.
Because most of these partnerships with reputable foreign investors started before themacroeconomic turbulence of 2007, JSBs should be in a relatively strong position. It islikely that the credit culture of these entities was reinforced, credit risk assessmentimproved and internal controls strengthened. Also, according to unconfirmed reports, thecapital-adequacy ratios of some of the bigger JSBs could be unusually large, in the rangeof 15 to 30 percent.

trillion dong; and 13 invested in securitiescompanies, for 420 billion dong (Table 7.1).
This is a worrying trend, as it risks undoingprotracted efforts to harden the budgetconstraint on SOEs. In the planning period,credit was directly allocated to SOEs bySOCBs specialized in one particular sector(agriculture, industry, trade...). In the late1990s, directed lending of this sort was takenout of the commercial banking sector. Atpresent, only the VDB and the VBSP aresupposed to provide subsidized credit toselected projects or households. Curtailingpolicy lending is a way to force enterprisesto have bankable projects, of the kind acommercial bank with a strong profitorientation would be willing to finance. Thesuppression of explicit subsidies, thesubsequent tightening of eligibility rules forpolicy lending, and the banking reform mapitself were further steps towards levellingthe playing field for all businesses,
regardless of their ownership. Together withincreased competition in product markets,the sale of capital to private investors, andthe adoption of the corporate governancemodels of the private sector, these stepswere aimed at increasing the efficiency ofSOEs in Vietnam.
If Economic Groups and large StateCorporations were to control banks, or toraise deposits directly from the public, thepressure for them to have good projectswould be loosened again. The separation ofcommercial and financial interests meansthat every investment project is subject todouble scrutiny: once by the business entitywhich wants to undertake the project and asecond time by the financial entity whichdecides to advance resources for it. Lack ofseparation implies that those who consider aproject worth undertaking will be supportingit from both the borrowing end and thelending end. Under these circumstances, a
CAPITAL MATTERS
76
Table 7.1: Financial Investments by Large SOEs
Number ofSOEs involved VND trillion
Total non-core investments 23,300Financial investments to 13,888
Banks 19 4,426Investment funds 13 1,061Securities companies 13 420Real estate 18 1,463Finance and insurance 12 6,518
Other non-core investments 9,412Total investments to other entities 164,637Total debt 514,465Owner's equity 377,081Debt to Equity ratio 1.36
Source: NSCERD and MOF (2008), based on data from 76 Economic Groups and General Corporations..

dubious investment decision can be pursuedfor very long, with additional funding beingprovided to cover losses even if the chancesto ever recover the investment are thin. Thelonger it takes for a poor investment decisionto be exposed, and stopped, the more costlyit becomes to fix it later on (for instance,through the recapitalization of the bankwhich lent in its support).
The combination of commercial andfinancial interests under the same roof, andthe related-party transactions it supports, hasbeen repeatedly associated with economiccrises in middle-income countries. Chile in1982-83 and several East Asian countries in1997 illustrate the risks involved. Thosecrises involved excessively largeinvestments in sectors going throughunsustainable bubbles. It is also worthpointing out that the risk exists regardless ofwhether the commercial interests are ownedby the private or the public sector. Theeconomic groups of Chile were fully private.In East Asia, they used to fall in a gray area,combining private interests with cozyrelations with government.
Fortunately, the stabilization packageadopted in March 2008 resulted in thebursting of the asset price bubble,dramatically reducing the short-term profitsthat could be made in real estate and finance.As a result, several plans to expand in thesedirections were put on hold by EconomicGroups and large State Corporations. Andgovernment became more cautious in itsgranting of banking licenses.
A diverse profile
There are 83 commercial banks in Vietnam,but in spite of the large number ofparticipants the banking system remains
dominated by two main groups of entities.SOCBs account for approximately 48percent of assets in the system and JSBs foran additional 28 percent. Fully-foreignsubsidiaries, banks created by EconomicGroups and large General Corporations andthe former rural banks may be numerous,but their combined share of assets is smallfor now. Trends in banking credit aretherefore heavily influenced by SOCBs andJSBs. However, these two groups ofentities are different in several importantrespects, and they also behaved differentlyduring the recent macroeconomicturbulence.
SOCBs are not numerous but they are big.On average, the assets of the largest fouramounted to 13.4 billion dollars in 2007(Table 7.2). The corresponding figures forJSBs are only a fraction of this. Even if onlythe four biggest JSBs are considered,average assets per bank reached 3.6 billiondollars (Table 7.3). The gap is smaller inrelation to equity, with the average being756 million dollars in the case of SOCBs,compared to 303 million for JSBs. Thedifference in the equity-to-assets ratiobetween the two groups of institutionsexplains why their returns on equity aresimilar, at 22.3 and 28.6 percentrespectively, in spite of large gap in theirreturns on assets. In the case of JSBs, thereturn on assets (2.3 percent) is close to thenet interest margin (2.6 percentage points).But in the case of SOCBs it is much smaller(a meager 1.1 percent, compared to a 3percent margin).
SOCBs expanded their portfolio much moreslowly than JSBs during the period of rapidcredit growth. Combined lending by SOCBsgrew by only 25 percent during 2007. This
BANKING CREDIT
77

does not reflect a lack of liquidity, as thesebanks were flooded by cash much the sameas JSBs were. The restrained lending stanceof SOCBs was rather due to their efforts toimprove the overall quality of their portfolioin preparation for equitization. Prudentlending is reflected in their low loans-to-deposits ratio. The excess liquidity enjoyedby SOCBs during this period was lent toJSBs through the interbank market. Adeliberate clean up of bad loans inpreparation for equitization may also explaintheir low return on assets, although higheroperational costs are almost certainly part ofthe explanation too.
Combined lending by JSBs, on the otherhand, grew by an astounding 95 percent.The rate of growth was much higher forsome individual banks. This reflected anaggressive attempt to gain market share. Bythe time the stabilization package wasadopted, in March 2008, the share of JSBs in
total banking credit was estimated to beclose to 30 percent, up from roughly 12percent in 2001, when reforms accelerated.This amounts to a fundamentaltransformation of the banking system inVietnam. But it also raises questionsregarding the quality of lending, hence thepotential vulnerability of JSBs and, byextension, of the banking system as a whole.
Main creditors
In the initial stages of Vietnam’s transition toa market economy, most banking credit wentto SOEs. But their share has been decliningsteadily, to account for 31.1 percent of totaloutstanding loans in March 2008, when thestabilization package was adopted (Figure7.2). There have been repeated claims thatreckless borrowing by SOEs was one of maindriving forces behind the rapid creditexpansion of late 2007 and early 2008.However, in 2007 bank lending to SOEsgrew by 52.9 percent, compared to 54.3
CAPITAL MATTERS
78
Table 7.2: Key Financial Ratios for SOCBs
Vietcombank BIDV VietinBank VBARD2006 2007 2006 2007 2006 2007 2006 2007
Assets (million dollars) 10,443 12,274 9,852 12,518 8,432 10,660 15,704 18,090
Equity (million dollars) 625 698 276 543 349 682 698 1,099
Return on average equity 25.7 20.6 14.2 24.4 10.8 14.1 11.8 30.2
Return on average assets 1.5 1.2 0.4 0.9 0.5 0.8 0.5 1.6
Net interest margin 2.31 2.35 2.43 2.70 3.20 3.43 4.06 3.41
Equity/assets 6.0 5.7 2.8 4.3 4.1 6.4 4.4 6.1
Equity/loans 15.3 11.9 4.7 7.0 7.0 11.0 5.9 8.5
Loans/deposits 41 48 71 79 76 82 97 87
Loan growth 10 44 18 34 8 25 18 12
Fitch rating D D D
Source: Financial statements reclassified by Fitch. All figures are in percent, except when otherwiseindicated. Figures for VBARD in 2007 are for the first nine months of the year.
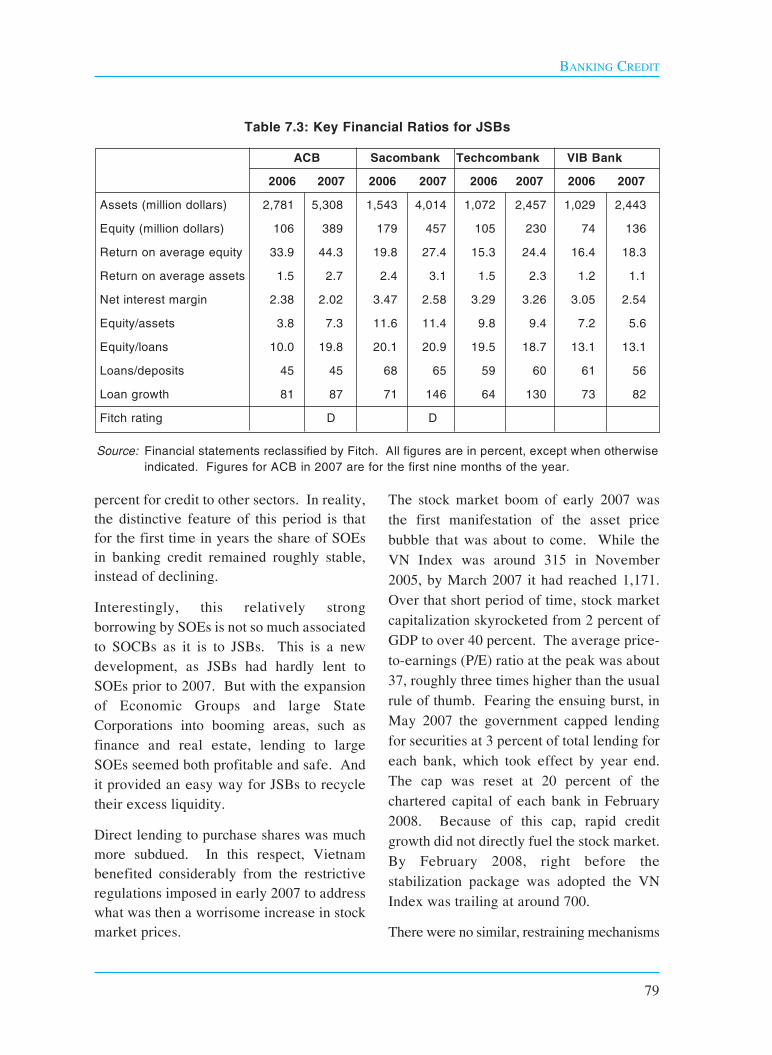
percent for credit to other sectors. In reality,the distinctive feature of this period is thatfor the first time in years the share of SOEsin banking credit remained roughly stable,instead of declining.
Interestingly, this relatively strongborrowing by SOEs is not so much associatedto SOCBs as it is to JSBs. This is a newdevelopment, as JSBs had hardly lent toSOEs prior to 2007. But with the expansionof Economic Groups and large StateCorporations into booming areas, such asfinance and real estate, lending to largeSOEs seemed both profitable and safe. Andit provided an easy way for JSBs to recycletheir excess liquidity.
Direct lending to purchase shares was muchmore subdued. In this respect, Vietnambenefited considerably from the restrictiveregulations imposed in early 2007 to addresswhat was then a worrisome increase in stockmarket prices.
The stock market boom of early 2007 wasthe first manifestation of the asset pricebubble that was about to come. While theVN Index was around 315 in November2005, by March 2007 it had reached 1,171.Over that short period of time, stock marketcapitalization skyrocketed from 2 percent ofGDP to over 40 percent. The average price-to-earnings (P/E) ratio at the peak was about37, roughly three times higher than the usualrule of thumb. Fearing the ensuing burst, inMay 2007 the government capped lendingfor securities at 3 percent of total lending foreach bank, which took effect by year end.The cap was reset at 20 percent of thechartered capital of each bank in February2008. Because of this cap, rapid creditgrowth did not directly fuel the stock market.By February 2008, right before thestabilization package was adopted the VNIndex was trailing at around 700.
There were no similar, restraining mechanisms
BANKING CREDIT
79
Table 7.3: Key Financial Ratios for JSBs
ACB Sacombank Techcombank VIB Bank
2006 2007 2006 2007 2006 2007 2006 2007
Assets (million dollars) 2,781 5,308 1,543 4,014 1,072 2,457 1,029 2,443
Equity (million dollars) 106 389 179 457 105 230 74 136
Return on average equity 33.9 44.3 19.8 27.4 15.3 24.4 16.4 18.3
Return on average assets 1.5 2.7 2.4 3.1 1.5 2.3 1.2 1.1
Net interest margin 2.38 2.02 3.47 2.58 3.29 3.26 3.05 2.54
Equity/assets 3.8 7.3 11.6 11.4 9.8 9.4 7.2 5.6
Equity/loans 10.0 19.8 20.1 20.9 19.5 18.7 13.1 13.1
Loans/deposits 45 45 68 65 59 60 61 56
Loan growth 81 87 71 146 64 130 73 82
Fitch rating D D
Source: Financial statements reclassified by Fitch. All figures are in percent, except when otherwiseindicated. Figures for ACB in 2007 are for the first nine months of the year.
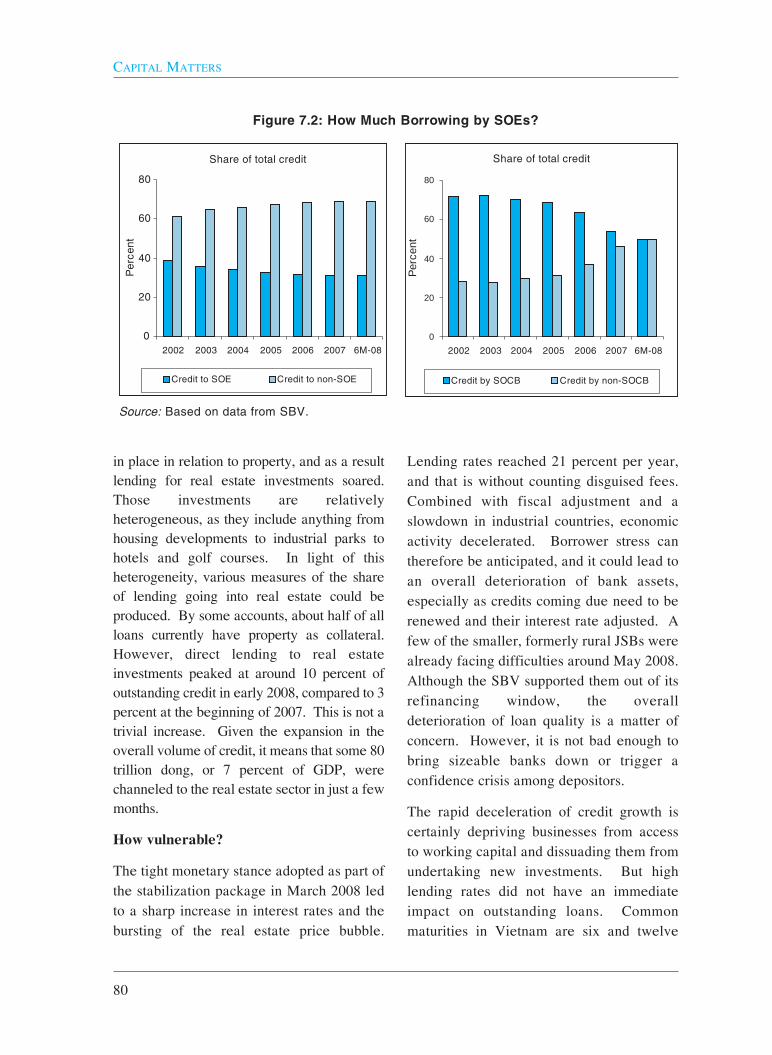
in place in relation to property, and as a resultlending for real estate investments soared.Those investments are relativelyheterogeneous, as they include anything fromhousing developments to industrial parks tohotels and golf courses. In light of thisheterogeneity, various measures of the shareof lending going into real estate could beproduced. By some accounts, about half of allloans currently have property as collateral.However, direct lending to real estateinvestments peaked at around 10 percent ofoutstanding credit in early 2008, compared to 3percent at the beginning of 2007. This is not atrivial increase. Given the expansion in theoverall volume of credit, it means that some 80trillion dong, or 7 percent of GDP, werechanneled to the real estate sector in just a fewmonths.
How vulnerable?
The tight monetary stance adopted as part ofthe stabilization package in March 2008 ledto a sharp increase in interest rates and thebursting of the real estate price bubble.
Lending rates reached 21 percent per year,and that is without counting disguised fees.Combined with fiscal adjustment and aslowdown in industrial countries, economicactivity decelerated. Borrower stress cantherefore be anticipated, and it could lead toan overall deterioration of bank assets,especially as credits coming due need to berenewed and their interest rate adjusted. Afew of the smaller, formerly rural JSBs werealready facing difficulties around May 2008.Although the SBV supported them out of itsrefinancing window, the overalldeterioration of loan quality is a matter ofconcern. However, it is not bad enough tobring sizeable banks down or trigger aconfidence crisis among depositors.
The rapid deceleration of credit growth iscertainly depriving businesses from accessto working capital and dissuading them fromundertaking new investments. But highlending rates did not have an immediateimpact on outstanding loans. Commonmaturities in Vietnam are six and twelve
CAPITAL MATTERS
80
Share of total credit
0
20
40
60
80
2002 2003 2004 2005 2006 2007 6M-08
Perc
ent
Credit to SOE Credit to non-SOE
Share of total credit
0
20
40
60
80
2002 2003 2004 2005 2006 2007 6M-08
Perc
ent
Credit by SOCB Credit by non-SOCB
Figure 7.2: How Much Borrowing by SOEs?
Source: Based on data from SBV.

months, and roughly six months after thestabilization package was adopted interestrates were easing again. More importantly,there is a cap on the penalties that apply forrepayment delays, at 150 percent of theinterest rate of the loan. This means that fora loan contracted before the stabilizationpackage was adopted, say at a 12 percentinterest rate, the maximum charge applyingon rollovers is 18 percent, less than thehighest lending rate so far.
Another reason why a massive increase inthe share of bad loans is unlikely is therelatively low leverage of business inVietnam. In 2007, the average debt-to-equity ratio of the 48 largest companieslisted in the stock market was about 0.6,much smaller than in industrial countries.Admittedly, the higher-end tail of the ratiomatters more than the average, so that theeconomic slowdown could still affectbusinesses and contribute to a deteriorationof loan quality. However, the slowdown isrelative in the case of Vietnam, as GDPgrowth is likely to remain strong in thecoming years, even amidst the globalfinancial crisis.
Leverage is higher in the state sector, giventhat SOEs traditionally had better access tocredit. For Economic Groups and largeState Corporations, the average debt-to-equity ratio stood at 1.36 at the end of 2007.In this case, the high-end tail includes somecases with very sizeable leverage, such asVinashin, Lilama and Cienco 5. It can beargued that these SOEs have a securerevenue stream, and if they were toconfront liquidity problems they would beunlikely to default, given their strategicimportance for the government. Therefore,the impact of poor performance by these
large SOEs is better seen as a contingentliability for the government budget, ratherthan a direct risk for the banking system.But attention is needed in their case.
The drop in asset prices is another area ofconcern. The VN Index declined steadily asa result of the stabilization package first andthe global financial crisis subsequently.Bond prices declined heavily when interestrates skyrocketed. Vietnamese accountingstandards do not require mark-to-market, sothat investment losses are not reflected infinancial statements. This calls into questionthe profit figures reported by many banks in2008. Due to the cap on lending to buyshares, the exposure of the banking system asa whole to stock market fluctuations islimited. Exposure was higher in the case ofbonds. Among the 11 JSBs for which dataare available, government bond holdingsaccounted for 6.5 percent of total assets bythe time the stabilization package. But withinterest rates sharply down, the losses of thebanks which kept their holdings should belimited.
The main concern is, no doubt, the slump inreal estate prices. Unfortunately, there is notenough data to assess how large it has been.Based on piecemeal evidence, prime officespace, tourist resorts, industrial parks andresidences for expatriates are holding well.Strong FDI sustains the demand pressure inthis segment. On the other hand, declines of30 percent and more in the residentialproperty market for local residents in urbanareas seem common. This segment washeavily influenced by speculators, many ofwhom have left the market by now.However, restrictive lending regulationsmay play a mitigating role in this case.Indeed, Vietnamese banks were not allowed
BANKING CREDIT
81
to lend for property beyond 50 percent of itsvalue, and the latter was set at 70 percent ofthe market reference point. With loans notexceeding 35 percent of the initial value of
the collateral (= 0.5 x 0.7) there is room toabsorb a large decline in property prices,probably larger than anything Vietnam hasexperienced so far.
CAPITAL MATTERS
82
Box 7.2: Assessing the Quality of Bank Lending
Credit risk assessment is regulated in Vietnam by Decision 493, issued by SBV in April 2005.In its article 6, consistent with Basel I principles, this Decision instructs all banks to classifyeach loan in five categories, from performing to total loss, based on quantitative performanceindicators such as the number of days overdue and whether or not there was a rollover.According to article 7, in line with the Basel II agreement, credit risk needs to be assessedbased on the expected financial situation of each customer.
Based on article 6, the share of non-performing loans (NPLs) of the entire banking systemstood at 1.46 percent as of March 2008. It is widely accepted that this is an under-estimate,but there is less consensus as to how large the real figure is. Previous assessmentsconducted for the four largest SOCBs around 2004-2005, using the Basel II approach,suggested that the real NPL figure could be around three times higher than the figure basedon loan servicing. It is also understood that loans approved during the period of rapid creditgrowth could be of a lower average quality.
A credible analysis or loan quality based on article 7 is available in the case of BIDV. Inpreparation for equitization, BIDV hired international consultants to classify loans based onBasel II criteria, using a set of 42 indicators. This exercise put the share of NPLs at 3.7percent, compared to 2.8 percent based on article 6. A recent Fitch report cited a NPL shareof 14.4 percent in the case of Vietcombank. However, the reliability of this estimate is notguaranteed.
Assessments of credit risk could also be accessed in the case of three of the five largestJSBs. In their case, the application of article 7 actually results in a lower share of NPLs thanimplied by article 6. This is because credit rollover automatically makes a loan non-performing under article 6, even if the borrower is solvent. Rollover is common in Vietnamdue to the obligation for banks to match the maturity of their loans to that of their deposits,which are mainly short term. Based on article 6 the share of NPLs in these three banks hadincreased from 2.5 percent at the end of 2007 to 2.9 percent in the first quarter of 2008.
If these numbers are actually correct, the quality of banking sector assets is manageablethought not impressive. However, a rapid credit growth temporarily brings down the shareof NPLs by inflating the denominator. With the extraordinary credit growth in 2007, financialsoundness depends very much on how the new credits extended will perform. Until moretime elapses, the quality of those new credits may not be fully revealed by a conventionalaudit process. Forward-looking stress tests are more reliable tool to assess credit risk in thecurrent environment.

If the risk of a banking crisis seems low, adecline in the overall quality of the lendingportfolio is almost certain. Unfortunately,credit risk assessment remains rudimentaryin Vietnam, making it difficult for theauthorities to monitor the situation ofindividual banks and to adopt timelycorrective measures (Box 7.2). Creditperformance is still evaluated on a loan-by-loan basis, using quantitative backward-looking indicators. All commercial banks
were supposed to have established theirown internal credit risk rating systems byMay 2008, and SBV was supposed tocertify the soundness of those systems.However, by end 2008, only two out of 83commercial banks had completed theprocess. Pending this very importantchange, and given the relative ignoranceregarding the quality of the lendingportfolio, it would be prudent to increasecapital adequacy ratios.
BANKING CREDIT
83

While offering opportunities for investors,the stock market helps mobilize risk capitalfor businesses. This capital is preciousbecause it enables to raise a much greateramount of debt finances by leveraging. Thestock market also provides a mechanism ofcorporate governance, a critical determinantof business success. Building on theequitization process and the hundreds ofthousands of shareholders it created, avibrant stock market developed in Vietnam.In the initial stages, most transactions tookplace in the informal market. But since end-2006 the number of stock listed and thenumber of market participants ballooned.Stock market capitalization has grown in aless steady way, alternating between boomand slump. The stabilization packageadopted in early 2008 and the subsequentglobal financial crisis have brought shareprices down, dramatically. But the overalldevelopment remains impressive, with oneof the main strengths of the Vietnamesestock market being its ability to mobilizenew capital, rather than just serve as supportfor secondary trading. The equitization oflarge SOEs and SOCBs should support acontinued dynamism in the coming years.Looking forward, the Vietnamese equitymarket would benefit from the integration ofits two stock exchanges into one, and theconsolidation of relatively small securitiescompanies into bigger entities, capable of
underwriting major public offers. There isalso a scarcity of institutional investors,although the SCIC is bound to become anintegral part of market development. Fornow, improvements are needed in theinfrastructure of the stock exchanges, so asto cope with larger trading volumes andhandle remote access. Importantly,increased transparency would strengthen thecorporate governance role of the equitymarket. There is also some evidence thatlisting has been associated with bettermanagement in equitized SOEs, but more isneeded in terms of compliance with disclosurerequirements. Looking forward, theemergence of self-regulatory organizationsshould be encouraged. Self-regulationwould be particularly important in the caseof the informal stock market.
Ups and downs
The combined market capitalization of theHo Chi Minh Stock Exchange (HOSE) andthe Hanoi Stock Trading Center (HaSTC)grew dramatically between December 2005,when it accounted for roughly 2 percent ofGDP, and March 2007, when it peaked at 43percent. By way of comparison, the targetset in February 2006 by the government wasto reach a stock market capitalization of 15percent of GDP by 2010. In light of thesedevelopments, the 2010 target was revisedup to 50 percent in August 2007.
84
8. EQUITY INVESTMENT

Share prices declined subsequently.Concerned about a possible bubble, thegovernment imposed a cap on bank lendingto purchase securities, at 3 percent ofoutstanding loans first and 20 percent ofchartered capital later. Then, thestabilization package adopted in March 2008constrained liquidity even further. Morerecently, the global financial crisis hasprompted foreign investors to sell shares andrepatriate their proceeds. As a result of allthese developments, stock marketcapitalization had declined to 15 percent ofGDP by end-2008 (Figure 8.1).
The decline in share prices should not beinterpreted as a set back, or even as a majorslowdown, in the development of the equitymarket in Vietnam. The number of listedcompanies has increased by fivefold to reach329 by the end of November, 2008. Out ofthem, 167 are with HOSE and 162 withHaSTC. The number of licensed securitiescompanies has also increased, to 98; the
number of investment managementcompanies to 42, and the number ofcustodians to seven. In addition to the HOSEand HaSTC, there is a so-called over-the-counter (OTC) market, operating mainlywith non-listed shares of equtized SOEs.
It is legitimate to ask whether a market ofVietnam’s size needs two stock exchanges,especially because role sharing between thetwo markets is not very clearly established.In principle, companies listed in HaSTC aresmaller, as the market operates on lessstringent listing requirements. In practice,however, HaSTC lists businesses of quitesignificant size so that it effectivelycompetes with HOSE. A stock marketbenefits greatly from liquidity, and higherliquidity is achieved by concentrating tradingactivities. A liquid market tends to attractmore issuers and more investors. Mostemerging market economies, except for verylarge economies like China’s or India’s,have only one, centralized exchange.
ENQUITY INVESTMENT
85
0
30
60
90
120
150
180
Jan-07 Apr-07 Jul-07 Oct-07
0
5
10
15
20
25
30
Inde
x(J
an07
=100
)
P/E
ratio
(HO
SE
)
Jan-08 Apr-08 Jul-08 Oct-08
VN index
Emerging market
Average P/E ratio
Figure 8.1: Stock Market Trends and Fundamentals
Source: SSC and SSI.

Today, exchanges compete across thenational boarder to attract issuers andinvestors. Thus, the benefit of havingcompetition within a country is becomingless obvious. In light of all this, thepossibility of consolidating or integrating thetwo exchanges should be considered.
Main stocks
The initial development of the stock marketwas closely linked to the equitizationprocess. Since the beginning of this processuntil October 2008 some 3,800 SOEs wereequitized. While many of them arerelatively small, by some estimates theprocess created more than 300,000 smallshareholders. Anecdotal evidence suggeststhat a substantial amount of consolidationoccurred through the informal market which,by some accounts, was about five timesbigger than the official stock market by2005. In fact, some of the boom in stockmarket capitalization observed since the endof 2006 is related to the migration of stocksfrom the informal stock market to the HOSEand HaSTC trading platforms.
Equitized SOEs will continue to be thebackbone of the Vietnamese stock market inthe near future. As of June 2008, 1,824SOEs were still fully in the hands of thestate, and they were the largest. Of those,554 are bound to remain fully owned by thestate, but the remaining 1,270 are to beequitized. A total of 189 large SOEs(including local giants such as Mobifone) arescheduled for divestiture before 2010. Thisis certainly bound to invigorate the stockmarket.
The number of listed companies which donot have state capital is growing steadily aswell. Under the Enterprise Law of 2000
first, and subsequently under the UnifiedEnterprise Law of 2005, joint stockcompanies (JSCs) have mushroomed, with270,000 of them registered by November2008. About 3,700 are public, which in theVietnamese context involves having at least100 shareholders. Of these, some 1,066have registered with HaSTC for disclosureand 328 are listed with HOSE or HaSTC(Table 8.1).
There has also been active issuance ofequity and subordinate debt by banks. Animportant driver for this development hasbeen the need for banks to strengthen theircapital adequacy, which is measured againstthe amount of risky assets they hold. Bankswith strong capital adequacy can extend agreater amount of loans.
Equity investment can take different forms.Initial investment to establish a business byfounders, strategic participation in anexisting business and the acquisition of asignificant stake are all direct investments.The acquisition of a minority stake in anexisting business, on the other hand, isconsidered a portfolio investment. When astake in an existing business is acquired froma new issue in the primary market, it enablesthe business to mobilize new capital. Whenit is done in the secondary market, on theother hand, it does not raise new capitalregardless of whether it is a directinvestment or a portfolio investment, andregardless of whether it is a minority stake ora strategic share.
A notable strength of Vietnam’s stockmarket has been its ability to mobilize newcapital. Many emerging stock marketsfunction primarily as trading platforms.Family owners of businesses are often
CAPITAL MATTERS
86

unwilling to accept the influence of outsidersor even the disclosure of information. InVietnam, because many companies startedwith state ownership and came to the marketthrough the equitization process, they are notconstrained by a similar lack of motivation togo public. On the contrary, additional shareofferings and new listings continue evenwhen the market is down. Although many ofadditional share offerings are made as rightsissues and stock dividends to existingshareholders, new IPOs and new listingscontinue as well.
Market participants
Vietnam’s investor base is still small. Thereare 450,000 securities accounts in thecountry. Of those, 12,535 are held byforeigners including both individuals andinstitutions. The relatively large number offoreign individuals directly holdinginvestment accounts is another characteristicof Vietnam’s stock market. Each investor isallowed to have only one account so far.
Therefore, the number of accountsrepresents that of investors in the market.This “one-account rule” creates significantinflexibility and inconvenience for largeinstitutional investors who wish to disguisetheir identity when buying or sellingparticular securities in order to avoid havingan impact on the share price.
There are 21 investment funds managed by42 investment management companies.About one quarter of their portfolio is inlisted equity and the rest in OTC stocks.About 80 percent of the foreign portfolioinvestors are closed end funds, with ahorizon of five to ten years. Closed endfunds issue fund certificates only once to thepublic and they are not allowed to buy backshares from investors or issue additionalunits. Investors trade shares on thesecondary market without affecting thefund’s capital source. The total capital ofthese funds is always stable and unchangedthroughout the operation time. Closed endfunds thus provide a stable source of capital.
ENQUITY INVESTMENT
87
Table 8.1: Joint Stock Companies: Public versus Listed
Public Listed Public companies registered with the SSC for disclosure and listed on the HOSE 167
Of which, have some state ownership. 121
Public companies registered with the SSC for disclosure and registered with on HaSTC. 161
Of which, have some state ownership. 119
Non- Public companies that are registered with the SSC for listed disclosure but not registered with HaSTC for OTC trading. 1.066
Public companies that are neither registered with the SSC About for disclosure nor registered with HaSTC for OTC trading. 3.000
Non- Non- Non-public companies. 267.000public listed
Source: SSC, HOSE, and HaSTC.

However, a small number of open fundswere established in 2007.
By November 2008, the stock trading codehad been granted to 858 foreign financeinstitutions, a five–fold increase from June2006. About 30 percent of them haveactually invested in the Vietnamese stockmarket so far. They include well–knowngroups such as Citigroup, Deutsche Bank,Credit Suisse, and JP Morgan. Theremaining institutions are still studying theprocess or are only investing in JSCs in thebanking and telecommunication sectors.While portfolio inflows were substantial in2007, the subsequent decline in share pricesand the sales prompted by the globalfinancial crisis have brought their equityholdings to around 3 billion dollars only.
There are 98 licensed securities companies inVietnam today. Many of them are membersof both exchanges but some participate inonly one of them. Many leading securitiescompanies are owned by banks and insurancecompanies. A few, including the leadingSaigon Securities Inc., have foreign partners.A couple of them are owned by thegovernments of Hanoi and HCMC. Yet,many Vietnamese securities companies aresmall and not capable of underwriting a largepublic offer by a major enterprise. Therewould be merit in promoting theconsolidation of securities companies into asmaller number of larger firms.
Securities companies are not allowed toprovide margin accounts for investors.Instead, banks have been providing creditagainst securities as collateral, thoughlimited in volume by regulation. Securitieslending, borrowing and short-selling are alsoprohibited. Therefore, securities companies
are taking little liquidity risk. The weaksettlement system requires investors toshoulder the cost of the inefficiency in theform of pre-payment and pre-delivery ofsecurities ahead of trading. The practice,while helping to sustain reasonable systemicstability of the market, imposes hightransaction cost and inconvenience oninvestors.
Institutional investors are still under-represented in the Vietnamese market.There are nine life insurers and 23 non-lifeinsurers; altogether they managed 58 trilliondong in assets as of the end of 2007. Vietnamlacks private pension funds. As for the state-run VSS, it is unlikely to invest in equity inthe near future. At only 13.9 percent of theirassets are securities investments, equity isnot central to the investment strategy ofinsurance companies either.
Integral to capital market development is therole of SCIC, the holding companyresponsible for managing the stateshareholdings in equitized SOEs (Box 8.1).Its mandate is to enhance the value of theenterprises by restructuring them andenhancing their corporate governance andperformance while divesting non-strategicones and investing in infrastructures. TheSCIC can contribute to capital marketdevelopment, as a major supplier of sharesto the market, but it also depends on anefficient stock market to assess theperformance of the enterprises it owns and tomanage its portfolio. Thus, its soundbusiness practice will directly impact on themarket price integrity and transparency.
Organization and supervision
The ups and downs of Vietnam’s stockmarket highlight the importance of
CAPITAL MATTERS
88

improving its regulation, upgrading itsinfrastructure and strengthening itssupervision. On the regulatory front, theSecurities Law that came into effect in 2007substantially broadened the scope ofresponsibility of the SSC and achieved asignificant improvement in the overall legalframework for capital markets. Amongother things, it required all public companiesto disclose audited financial statementsregardless of whether they are listed on anexchange. Given the large number of stocks
being traded unofficially, this is an importantmove in the direction of transparency. Butlimited supervision capacity will makeenforcement difficult.
Progress has also been made on tradinginfrastructure. The HCMC Stock TradingCenter was recently transformed into aformal stock exchange (HOSE) and is nowimplementing the upgrading of its tradingsystem to cope with growing trading volumesand to handle remote access. It should also
ENQUITY INVESTMENT
89
Box 8.1: A Combination of Temasek and Treuhand
The SCIC is modeled after Temasek of Singapore and Khazanah of Malaysia, but it alsoshares some of the characteristics of privatization funds in the transition economies ofEastern Europe and the former Soviet states, such as the German Treuhand. It startedoperation in August 2006 and now holds over 800 enterprises with estimated market valueof over 2 billion dollars. It expects to eventually receive about 1,400 enterprises, and themarket value of the portfolio is expected to grow to 21.5 billion dollars by 2010, or roughlyone fifth of the expected GDP then.
On the “Treuhand side” of its mandate, SCIC has to classify the companies in its portfolio intothree Groups called A, B and C. It will fully divest from Group C and much of Group B whilekeeping strategic State stakes in Group A. On the “Temasek side”, SCIC can use the fundsraised by divesting remaining state stakes in equitized SOEs to make equity investment ininfrastructure projects of national interest. Such equity enables a project to raise a muchgreater amount of debt at lower cost, thus enhancing the project feasibility.
However, to effectively contribute to the restructuring and governance of the enterprises inits portfolio, the SCIC needs a sound database and effective management of insiderinformation. To divest non-strategic enterprises without disrupting the market, SCIC has tobe able to appropriately value its assets and time the divestment while coordinating with theSOE equitization. To meet this challenge, it also needs competent systems for investmentmanagement and associated skills and expertise as well as sound business procedures andprofessional ethics. In addition, because it holds a large number of enterprises not listed inthe formal market, SCIC needs to build an information network to reach out securitiescompanies and find out market prices for OTC-traded companies. Valuing them frequentlyis necessary to measure their portfolio performance and handle their divestiture. Thenetwork capacity in question can be conceptually similar to one required for HaSTC tomonitor the OTC market. Thus, the SCIC and HaSTC should consult each other to avoid theduplication of investments.

build in a stock watch system and a circuitbreaker to monitor abnormal price andvolume movements and control marketoverheating. Meanwhile, market participantsalready started demanding for derivativesinstruments such as options and futures in thestock indices, foreign exchange, interestrates and government bonds as well as somecommodities. This situation requires Vietnamto start upgrading them today with an aim todevelop a modern market infrastructurerather quickly but in steps.
On the other hand, HaSTC has yet toupgrade its trading system. It not only needsto accommodate the growing volume anddiversity of stocks being traded but also ischarged with a responsibility to monitor thelarge OTC market. In addition, it isexpected to build a bond trading platform.Vietnam’s corporate and municipal bondmarket picked up in recent years thanks todemand from foreign portfolio investors. Aneffort is now needed to establish benchmarksand extend to the secondary market. But abond trading platform is substantiallydifferent in terms of its design (membership,accessibility, fee structures, tradingalgorithm…) from a stock market platform.This will require that HaSTC accommodatesto a different institutional setup.
Vietnam Securities Depository (VSD) wouldalso benefit from an upgrade. Its mandate isto safe-keep traded securities and to facilitatecorporate actions by the issuing companies,such as proxy voting at general shareholders’meetings, dividend payouts and the like. Butdata input at VSD is still operated manually.Looking forward, the VSD system should beintegrated with the central public companyregistry, so as to enhance the integrity ofsecurities ownership, settlement finality and
market transparency. The VSD systemshould also be linked with the inter-bankpayments system to ensure safe and efficientsettlement of transactions, particularly, thedelivery-versus-payments settlement. Thislink is critical because VSD housesgovernment securities which generate largevalue transactions, requiring sound riskmanagement and time-critical settlement.Currently, the settlement of exchange-listedsecurities is supported by BIDV. Thearrangement is creating considerable risks tomarket participants as well as to BIDV itself,as the trading volume increases.
On the supervision side, the monetaryauthority needs to be able to monitor capitalflows in and out of the country. But stockmarket data is aggregated, making it difficultto identify flows related to foreign indirectinvestment. To find out, a better coordinationis needed between SSC and VSD. Foreignportfolio investors are supported by globalcustodians who in turn rely on local sub-custodians to effect settlement of trades.This is an inescapable arrangement forportfolio investors in Vietnam, where VSDdoes not accept direct participation by globalcustodians overseas. Local custodians (andthere are seven of them licensed in Vietnam)have to provide essential services such asdaily net asset value calculation on a dailybasis. Based on this information, it would bepossible to know which securities or assets aforeign investor is holding and how muchthey are worth.
Increasing transparency
Apart from mobilizing risk capital, the stockmarket provides a mechanism of corporategovernance. For equitized SOEs, in particular,listing could represent an important additional
CAPITAL MATTERS
90

step in the quest for state sector efficiency.However, inadequate disclosure ofinformation by public companies makes itdifficult to assess the fundamentals of theunderlying business and encouragesspeculation. Whether listing has an impact onthe way a company is run remains is, in theend, an empirical question. In the case ofVietnam, there is some preliminary evidence
to suggest that it makes a difference (Box 8.2).
This said, a significant portion of the publiccompanies traded outside the stockexchanges has yet to comply with therequirement to disclose audited financialstatements. The auditing industry lacks acapacity and expertise to deal with thismounting task. The situation obscures the
ENQUITY INVESTMENT
91
Box 8.2: Does Listing Improve Performance?
Among the equitized SOEs traded in HOSE, several have disclosed audited financialstatements both before listing and for the three subsequent years. For these SOEs, it ispossible to compare performance before and after listing, along dimensions such asprofitability, liquidity, working capital management, investment policy and cashflow. This canbe done by averaging performance indicators for the year prior to listing and for each of thethree subsequent years, irrespective of the actual calendar year of listing. This is not arigorous impact evaluation, to the extent that it does not involve a matched comparison group(for instance, a set of equitized SOEs not listed, over a similar period of time). Yet, theexercise provides some interesting insights.
Applying this approach to a sample of 21 equitized SOEs, it appears that their profit marginsdeclined after listing. The main driver seems to have come from the pricing side of theequation, with declines in prices not being offset by similar declines in costs. However, theresults also suggest that these firms improved their working capital management practicesafter listing. This was due to a better receivables management, with average days receivableacross the sample as a whole falling from approximately 100 days before listing to around 60days by the third year.
While improvements to working capital management had a positive impact on the free cashflow position of the sample as a whole, this was offset by increased capital expenditures,particularly in the first and second year after listing. One possible explanation is that thecapital stock of companies was close to the point of obsolescence. The increased managerialfreedom and access to finance associated with listing may have provided managers with thecapacity to rejuvenate their enterprises.
Consistent with the increase in capital expenditures, there is also a noticeable change in thefinancing strategies adopted by firms in the period after listing. The equitized SOEs in thesample did increase their reliance on debt capital, relative to equity capital. Much of theadditional debt taken on by the firms in the sample was short term. This may simply reflectthe difficulties faced by enterprises in the absence of deep and liquid debt capital markets.
Source: Cuong Duc Pham and Tyrone M. Carlin (2008).

judgment on the stock market valuationbased on P/E ratio or any parameter basedon accounting information.
Public companies could be supported by ane-disclosure system to facilitate theircompliance with regulations. The SSC andinstitutional market participants should alsoconsider adopting an e-registration systemfor licensed market professionals. Such asystem should be linked with professionalexamination, certification and trainingdocumentation. This would help thesupervisor in the monitoring of professionalconducts and would also make it easier forsecurities companies and investors toconduct background checks.
At the same time, licensed marketparticipants should be required to develop astrong compliance program and promotecompliance culture. This would require anappropriate corporate governance mechanismwithin the licensed market participants. Forinstance, they could be requested to have anindependent compliance unit reportingdirectly to the board of directors andaccountable to the SSC. Such a governancemechanism and its effective operation shouldbe made part of the licensing requirementsnot only at entry but also for continuousoperation. The latter would in turn require theSSC to be able to periodically inspect itsadequacy. A code of good corporategovernance for listed companies should alsobe developed in consultation with thestakeholders.
Looking forward, there are second-
generational issues already emerging inrelation to self-regulatory organizations(SROs). The concept of self-regulation andthe role of SROs are not well defined inVietnam, probably due to the fact that theexchanges and the central depository startedas a government agency. But self-regulationis a serious business. An entity must satisfyappropriate institutional conditions andcapacity requirements in order to qualify asan SRO. The plan to corporatize theexchanges into for-profit business entitieswill likely complicate the extent to whichthey can play the role althoughcorporatization may generate more overallbenefits than costs.
Self-regulation would be particularlyimportant in the case of the informal market.Indeed, there is no effectively enforceableregulation nor code in place with respect ofunlisted stock issuers. But the unlisted stockmarket is bound to stay alive, and will likelygrow. Some issuers prefer to stay unlistedbut see benefits in liquidity of their stocks.Their investors always look for someliquidity, which could be much less than thatof listed stocks. Some brokers are slated toexpand intermediation of unlisted stocks.Nonetheless, investors of unlisted stocks donot have easy remedy for damage caused forlack of disclosure. Streamlining the unlistedstock market through licensed brokers couldbe practical under the current circumstances.The brokerage community should imposerules on themselves to govern theiroperations in unlisted stocks to respect theinvestor’s interest.
CAPITAL MATTERS
92

Public Private Partnerships (PPPs) ininfrastructure are a promising avenue tofinance infrastructure development andincrease efficiency in the delivery ofinfrastructure services. But so far, with theexception of a few projects in the energysector, PPPs are not taking off in Vietnam.To date, very few projects have involved acompetitive selection of investors, and thereis a noticeable absence of private foreigninvestors in projects that have been financedor are currently under preparation. Yet,there is clearly a financing gap that theprivate sector could help fill in. Assessmentsbased on a rudimentary engineeringapproach suggest a financing gap in theorder of 2 to 3 percent of GDP. A financialapproach, taking into account the change inthe global economic environment, wouldyield more ambitious targets. One of themain obstacles for the development of PPPsis the viability gap between the economicreturns to a project as perceived by thegovernment, and the financial returns asassessed by the prospective investor. Adifferent perspective on risk and the limitedcapacity to impose full cost recovery on end-users often imply that the deal needs to be“sweetened” by government in one way oranother. The issue is how to do so withoutincurring an excessive cost for the budget,without accepting large contingent liabilitiesand without distorting the incentives faced
by the investor. Two main mechanisms canbe considered: guarantees and subsidies.Critical to their design is the way risks areallocated between government, the investorand end-users. Good mechanism design andproper costing will be important for thesuccess of any PPP program. But they willnot be sufficient. It will also be important toestablish an appropriate policy framework,with clear allocation of responsibilities toprepare feasibility studies potentiallyinvolving government support, to appraisethose studies and to monitor the projectsoperating under PPP arrangements. Fornow, the closer Vietnam has to this model isthe LDIF model. However, for the PPPprogram to take off the establishment of aspecialized government agency ordepartment under MPI and the involvementof MOF will be needed.
What is a PPP?
By one relatively general definition, a PPP isthe transfer to the private sector ofinvestment projects that traditionally havebeen executed or financed by the publicsector. This definition emphasizes theinvestment dimension of PPPs, but there areat least two other dimensions to consider.First, the private investor often gets theresponsibility for the provision of a servicethrough the project; and second, some of therisk associated with the project is transferred
93
9. PRIVATE PARTNERSHIPS

from the government to the private sector.However, PPPs are different from thedivestiture of state assets or the contractingout of services. This is because they involvecooperation between the government andthe private sector, more in the spirit of a jointventure. There are several arrangementswhich are able to deliver this sort ofcooperation (Box 9.1).
Much of the case for PPPs rests on therelative efficiency of the private sector, butefficiency depends on the degree ofcompetition involved. Unfortunately, thescope for competition is limited ininfrastructure, where sunk costs are networkexternalities tend to create naturalmonopolies. This is why attempts to bring
the private sector into PPPs often involve the“unbundling” of infrastructure services, soas to focus on its most competitive segments.For instance, there may be little scope tobuild a second expressway after a first one isin place, but there can be competition for theconstruction of the first expressway, or for itsoperation and maintenance.
Some infrastructure services are better suitedthan others to be procured and provided in amarket setting. For instance, powergeneration, highways, airports, ports, andurban infrastructure tend to have broadcommercial appeal. This is not true in thecase of services with low cost recovery, suchas rural electrification, rural roads orsanitation. In the context of nascent
CAPITAL MATTERS
94
Box 9.1. PPP Schemes and Modalities
SchemesBuild-own-operate (BOO) Build-develop-operate (BDO)Design construct-manage-finance (DCMF)
Buy-build-operate (BBO)Lease-develop-operate (LDO)Wrap-around addition (WAA)
Build-operate-transfer (BOT)Build-own-operate-transfer (BOOT)Build-rent-own-transfer (BROT)Build-lease-operate-transfer (BLOT)Build-transfer-operate (BTO)
ModalitiesThe private sector designs, builds, owns,develops, operates and manages an assetwith no obligation to transfer ownership to thegovernment.
The private sector buys or leases an existingasset from the government, renovates,modernizes, and/or expands it, and thenoperates the asset, again with no obligationto transfer ownership back to thegovernment.
The private sector designs and builds anasset, operates it, and then transfers it to thegovernment when the operating contractends, or at some other prespecified time.The private partner may subsequently rent orlease the asset from the government.
Source: IMF (2004).

infrastructure markets, therefore, it is prudentto initiate PPPs in sectors that stand somechance of attracting private investment. Inpractice, this means that infrastructure plansshould consider which type of funding ismore appropriate in each case.
However, it should not be taken for grantedthat PPPs are always more efficient thanpublic investment and government supply ofservices. In particular, if they are not welldesigned they can simply be a source ofliabilities for the government, so that thesavings for the budget are only apparent.Monitoring service delivery under PPPs mayalso be challenging, which means that trade-offs exist. The issue for government is howto approach those trade-offs.
Two gaps
Discussions related to PPPs involve twodifferent gaps. One of them, the financinggap, is the shortage of budget resources toundertake critically important infrastructureinvestments. The other, the viability gap,results from the difference between thereturns associated with an infrastructure
project as seen by the government and asseen by the private sector. In the first casethe issue is whether the government caninvest on its own if needed. In the secondcase it is whether a private investor will wantto invest if invited.
Discussions about PPPs in Vietnam tend toemphasize the financing gap. It is often saidthat the current profile of infrastructurefunding is unsustainable. Currently, donorsmeet an estimated 33 percent of the ultimateburden of the investment program. AsVietnam enters the ranks of middle-incomecountries, its access to concessional financewill start to decline. Due to budgetconstraints, it is unlikely that the governmentwill increase its funding for infrastructure bya substantial margin. Therefore, theargument goes, the private sector will haveto pick up the part of the infrastructureprogram currently funded by donors. By oneestimate, by 2010 the combination ofgovernment resources, user financing andODA will fall short of the total “needs” by 3billion dollars (Figure 9.1).
PRIVATE PARTNERSHIPS
95
US
$m
illio
n
Annual Investment Annual Financing
Transport
Electricity
Telecoms
WSS
Private
Users
Government
ODA
8000
7000
6000
5000
4000
3000
2000
1000
0
8000
7000
6000
5000
4000
3000
2000
1000
0
2002 2010 2002 2010
US
$m
illio
n
Figure 9.1: The Gap between Investment Plans and Available Financing
Source: World Bank (2006a).

This calculation, based on an engineeringapproach to investment needs, provides astrong motivation to mobilize sustainablemagnitudes of private finance forinfrastructure. A financing approach couldbe even more ambitious. The globalfinancial crisis confronts Vietnam with theprospect of an economic slowdown.Supporting infrastructure developmentwould be one way to sustain long-termgrowth. But the government will faceconstraints to expand its capital expendituresat a time when it also needs to ensuremacroeconomic stability. An ambitious andeffective PPP program could help reconcileinfrastructure development with prudentfiscal policy.
A key issue is whether the private sectorwould be interested in filling this resourcegap. There are several reasons why aproject with high returns from a social pointof view may not look profitable from aprivate point of view. A common way todescribe this problem is in terms of a wedgebetween economic returns and financialreturns.
An important reason why this difference inreturns may arise is the difference betweenthe government and the private sector intheir approach to risk. The government canafford to be more patient than a privateinvestor. When appraising infrastructureprojects, governments typically consider arisk-free discount rate to compare futurebenefits to current costs. But a privateinvestor will start from the interest rate, andadd a risk premium. Another typical problemin developing countries is the limited scopefor cost recovery. The limited ability ofconsumers to pay for the services rendered,and the weak capacity of the government to
force them to do so, may result in adiminished interest from private investors.
Given this viability gap, projects valued bygovernment may not be undertaken by theprivate sector unless they are “sweetened”in one way or another. Some of the mostcomplex issues with PPPs refer, precisely, tothe sweetening component, and how to avoidit undermining the gains from bringing in theprivate sector. As tries to set up PPPs tosupport its infrastructure program, thegovernment needs to establish a clearmechanism to determine whether publicfinance support is needed, and under whichmodalities it should be provided.
Subsidies and guarantees
Two main mechanisms can be considered tobridge the gap between economic andfinancial returns to infrastructure investments.One of them involves offering a guarantee tothe private investor. In this case, the mainissue is to identify what exactly needs to beguaranteed. For instance, in the case of anexpressway it could be a minimum thresholdfor the revenue of the investor, or aminimum level of traffic, or a minimum rateof return on investment. And this still leavesthe issue of valuing the guarantee, whichrepresents a contingent liability for thegovernment. The other mechanism is toprovide a subsidy. In the expresswayexample, the subsidy could be determined asa certain amount per vehicle, or a certainamount per year.
These choices are not trivial, as they entail adifferent distribution of the risk between thegovernment, the investor and end-users. Ageneral principle is that risk should fall onthe party that is more able to do somethingabout it. For example, if the main risks are
CAPITAL MATTERS
96
associated with poor management ofinfrastructure services, shifting the risk tothe investor could provide better incentivesto make sure that the projects delivers. Butthis would not be accomplished if thegovernment guarantees the revenue of theprivate investor (Box 9.2). If, on the otherhand, the main risks are related to changes inpolicies, then the government should bearthe risk. However, this is easier said thandone. If the government is unreliable inrelation to its policies, then it will also beunreliable in relation to the guarantees itoffers. This is why policy risk is oftenmitigated through the use of foreign courtsfor the settlement of disputes.
Insolvency risk poses a different set ofproblems. If the investor goes bankrupt,there could be a disruption of service. Butthe response is not to guarantee the debts ofthe investor, as this would encourageexcessively high leveraging of the project. Itthe government or end-users bear insolvencyrisk, then the government should set andenforce limits on the investors’ indebtedness.Another important step is to make bankruptcysmoother. Mechanisms need to be in place toensure that there is no service disruption inthe event of a bankruptcy and assets can berapidly transferred to the creditors or to newinvestors.
These complex issues can be addressed byestablishing clear protocols for the grantingof guarantees. For example, the lineministry or agency sponsoring theinvestment may be requested to demonstratethat the project cannot be undertaken underthe PPP regime without a sweetener. Aneconomic analysis may be requested todemonstrate that the project’s cash flows aresufficient to cover repayment of the
guarantee. Project sponsors can berequested to supply a substantial portion ofequity funds from their own resources.
While guarantees are complex to design anddifficult to price, subsidies have the attractiveof being relatively easy to auction. In thiscase, the government designs the subsidy andprospective investors compete on the amountof subsidy to be provided, with the PPP goingto the one who asks for less support from thegovernment. In countries where the PPPprocess is mature enough, the subsidy can benegative. This is what would happen ifinvestors were willing to pay in order tooperate the infrastructure services (say, a tollroad).
A well-designed subsidy can unlock theimpasse between governments seeking torealize efficiency gains in service provisionthrough private participation, and privateinvestors that are able but unwilling tofinance projects that are not financiallyviable. In addition to aligning the interestsof government and private investors,subsidies can be instrumental in supportingthe principles of a market-orientedinfrastructure finance system by generatingcompetition (for the market) in investorselection and increasing transparency.
However, there are several issues toconsider in designing the subsidy. Thesimplest design is under the form of a grant,but a relationship can also be establishedbetween the subsidy and the service beingprovided. For instance, the subsidy may berelated to performance, with resourcestransferred in return for the operatorproviding, or the end-user purchasing, aninfrastructure service. Output-based paymentscome in many varieties, including
PRIVATE PARTNERSHIPS
97

CAPITAL MATTERS
98
Box 9.2: Successes and Failures in the Granting of Guarantees
The use of government guarantees to help persuade private investors to finance newinfrastructure is appealing. It can allow the government to get the infrastructure built withoutpaying anything immediately and to benefit from the skill and enterprise of private firms. Butit can cause problems too.
In the 1990s, for example, the government of the Republic of Korea guaranteed 90 percentof a 20-year forecast of revenue for a privately financed road linking Seoul to a new airportat Incheon. The government did not have to pay anything up front and would get to keep anyrevenue exceeding 110 percent of the forecast. When the road opened in 2000, however,traffic revenue turned out to be less than half the forecast. As a result, the government hashad to pay tens of millions of dollars every year. How much it will have to pay over the life ofthe guarantee is uncertain, but the present value of the liability could be in the order of 1.5billion dollars.
The government’s guarantee may not have been wrong, but it does raise questions. Shouldthe government really have borne demand risk in the project? Could it have estimated thecost of its guarantee before granting the guarantee? If so, should it have disclosed anestimate of the cost in its accounts? More generally, could the government have built theroad more cheaply using public finance? Or would it have been better to use private financewithout a revenue guarantee, if necessary giving the firm a straightforward subsidy?
These questions are hard to answer even though governments have been using guaranteesto help finance infrastructure since the construction of the bridge of Bordeaux in the early19th century. Later in the same century, Argentina guaranteed railway investors returns of6 or 7 percent on the capital they invested. The guarantees helped attract investment fromforeign capital markets. Yet the government did not always have enough money to meet itscommitments, in part because of the difficulty of accurately budgeting for claims and in partbecause the government usually had to make larger payments just when its tax revenue waslow. In time, the guarantees contributed to a fiscal crisis.
It is difficult for governments to make good decisions about guarantees. To start with, thereis no agreement among advisers about which risks governments should bear in privatelyfinanced projects. Second, government decisions would be difficult even in the absence ofpolitical pressures. Psychological research shows that people struggle to make accuratejudgments about risks and then fail to make the best use of even their imperfect judgments.Most people, for example, are overconfident in their judgments and therefore think the worldis more predictable than it is. Government decision makers may fall into the same trap,underestimating the risks to which they are exposing the public when they issueguarantees.
In sum, governments can easily make poor decisions about guarantees. There is no simplesolution to this problem, but good decisions are more likely if three conditions are met. First,the government’s advisers and decision makers have a framework for judging when aguarantee is likely to be justified. Second, the government’s advisers know how to estimatethe cost of a guarantee. And third, the government’s decision makers follow rules thatencourage careful consideration of a guarantee’s costs and benefits.
Source: Timothy Irwin (2007).

consumption subsidies (water sectorsubsidies in Chile, and ruraltelecommunications in Chile and Peru),connection subsidies (rural electrification inGuatemala), shadow tolls (privatelyfinanced roads in Portugal and the UK). Insome cases, both may be provided.
It is also important to determine beforehandthe maximum amount of resources to beprovided to the investor by the government.Indeed, the share of the subsidy in the totalproject cost should not be so high as to offsetthe benefits of additional financing, or theefficiency gains from private sectorparticipation. For instance, the governmentof India sets the cap at 20 percent of theproject cost.
The timing of the subsidy is an important toolfor risk transfer, and for ensuring thatinvestors are sufficiently vested in theproject. To use India’s example again,capital grants are provided at the stage ofproject construction, disbursements beginonly after the private sector company hasexpended the equity contribution required forthe project, and the grant is released inproportion to debt repayments remaining tobe disbursed thereafter. Such a disbursementschedule shields the government frommaking a large unilateral capital contributioninto a project before any private financing isspent; it also ensures that having disbursedtheir share of project capital, the equityproviders, seeking to realize returns on theirinvestment, will work to complete the projectand claim their profit.
Institutional arrangements
While good economic analysis will beneeded to decide whether a viability gapexists between economic and social returns,
and which support instrument would beneeded to fill that gap, the success of PPPswill critically depend on the institutionalarrangements in place to support them.Without a clear policy framework, anappropriate allocation of responsibilities andresources, and sufficient transparency of thedecision-making process, it will be difficultfor a PPP program to take off in anysignificant scale.
The government needs to develop its owntechnical expertise to manage PPPprograms, conduct thorough projectappraisal and prioritization, and ensure thatPPPs are consistent with broader economicpolicy objectives. At present, the closer tosuch institutional framework in Vietnam isthe LDIF model (Box 9.3). However, inspite being both expeditious and effective,the LDIF model falls short of the needs of alarge-scale PPP program.
There is a need for a comprehensive, multi-sector system to determine when, in whatform and to what magnitude, the governmentshould provide support to specific PPPprojects. For this to happen, there needs tobe a specialized government agency, or adepartment within MPI, able to provideconsistency in approaches across projects.The focus should be on developing afinancing framework, and clarifying theelements that are common to all sectors,leaving this agency or department thenecessary flexibility to fulfill theirresponsibilities. The framework shouldestablish simple qualification criteria forgovernment financial support to a projectand should provide incentives for the agencyor department in charge to gradually developthe process of preparing and bidding outprojects for private sector investments. The
PRIVATE PARTNERSHIPS
99

specific contractual obligations to be eligiblefor guarantees (for instance, minimumrevenues) should be identified at thefeasibility study stage.
The design and implementation of supportmechanisms for PPPs should be undertaken inconcert with fiscal risk managementconsiderations. Good fiscal risk management
CAPITAL MATTERS
100
Box 9.3: Local Development Investment Funds
LDIFs are special investment institutions designed to provide provincial governments withan operational and legal structure for infrastructure development. They have the legalstatus of a State Financial Institution of the sub national government, with charter capitaland balance sheets of their own. Their mandate is to mobilize medium- and long-termcapital from local and foreign institutions and individuals, to make equity investments, toprovide loans for investment, to contribute capital to set up enterprises in socio-economicinfrastructure development, to handle investment loan provisions and debt recovery, and toact as a trusted institution that manages investment capital. LDIFs are also authorized toissue sub-national government bonds to mobilize capital for local budgets for the provincesand cities.
LDIF investments can include all forms of BOT, BTO and BT. They are able to developprojects and lend money to those projects developed by the private sector. The provincialPeople’s Committee responsible for each LDIF has oversight over the investment policies,particularly where the scale of the investment is above a threshold, relative to the chartercapital of that LDIF (usually 10 to 15 percent). Lending terms are a maximum of 15 years,except under special circumstances.
Reliance on such sub-national government investment funds has required considerableoversight, coordination and leadership from MOF. The first law governing LDIFs waspromulgated in December 2001. It was followed by significant amounts of assistance to theestablished funds, culminating in Decree 138 on the Organization and Operation of theLDIFs, issued in August 2007. MOF has established a Project Management Office to supportthe LDIFs implement these policies and has set qualifying criteria for LDIFs to receivetechnical assistance and capital funding.
HIFU has been the pilot LDIF in terms of both its investment portfolio and its implementationof the good practice that is now part of Decree 138. HIFU commenced with theimplementation of project preparation and private sector participant selection procedures onseveral pilot projects in the City. These include solid waste recycling, water treatment andurban transport projects. It is envisaged that, with the appropriate MOF oversight andsupport, the LDIFs will operate in accordance with common rules of engagement with theprivate sector with respect to the selection of private sector partners by LDIFs and to theconcessions and authority granted by the provincial government to the LDIF-fundedcompanies.
Source: World Bank (2008h).

requires that government make sensiblefinancial commitments to PPP projects, aswell as monitor and report their statusthrough the project cycle. To the extent thatsubsidies and guarantees are part of thegovernment’s financial commitments to aPPP project, it is essential for them to bereported, monitored and tracked along withothers in a comprehensive manner. Beingexplicit about the support provided has thebenefit of revealing the true cost togovernment of individual infrastructurePPPs, and instituting early-warning signs ofoverexposure to fiscal risk.
Feasibility studies for PPP projects involvingsubsidies or guarantees should therefore besubmitted to MOF for approval. Theselection of the investor to implement theproject, ideally through competitive bidding,should only happen after this approval hasbeen secured. MOF should also be in chargeof monitoring the fiscal impacts andcontingent liabilities stemming from the PPP
program. One important issue concerns therole of SOEs in infrastructure finance,particularly in projects where privateinvestment is being sought. In this respect,there is a need to differentiate between therole of SOEs as project implementers fromtheir possible role as investors ininfrastructure projects. SOEs should not playboth roles in the same project.
One particularly critical issue is theestablishment of infrastructure financemodel that can allow the government tocombine public funds, private capital anddonor support in one project. Currently,infrastructure projects in Vietnam arefinanced in these three separate silos, andthere are implementation issues inrelation to all three. A well-designedpolicy and institutional framework forPPPs offers the opportunity to leverageand combine all three sources of financingand expertise, without crowding outprivate investment.
PRIVATE PARTNERSHIPS
101

The amount of resources committed by thedonor community has increased steadily.But disbursement rates are low, reflectingthe cumbersome procedures that need to befollowed to meet both Vietnameseregulations and donor requirements. Inaddition, in spite of the progress made inharmonization, the fragmentation of donorassistance puts a strain on the government’scapacity to handle it efficiently. Assessingthe impact of donor support is actuallydifficult. No obvious counterfactual can beused for operations involving a dialogueover policy reforms, although a series ofevaluations related to general budgetsupport operations in Vietnam suggest thatthey have had a satisfactory impact. Formore focused interventions, the availableevidence indicates that donor resources areto some extent fungible, at least within thesame sector. This means that in spite ofmeeting donor requirements, they end upsupporting other activities because they freeresources that the government would haveused anyway. As Vietnam enters the groupof middle income countries, the volume,composition and terms of donor support arebound to change. The volume of grants willremain roughly stable, whereas the volumeof loans will probably increase, beforereturning to its current level in the first halfof the next decade. But the gradual move toless concessional terms as Vietnam enters
the middle-income country group may makeit more difficult to provide continued supportin non-infrastructure areas. To maintaindonor engagement on poverty reduction andthe business climate, Vietnam couldconsider using non-concessional resourcesfor general or sectoral budget support,especially if they can be combined withgrants in the context of a harmonized policydialogue. The other obvious response is tostrengthen country systems, so as to reducethe cumbersome duplication of processes.This will require strategic clarity, to focus onthe most important gaps with internationalpractice.
Growing but cumbersome
Projects funded through official developmentassistance (ODA), including loans and grants,are equivalent to roughly 16 percent of totalinvestment in Vietnam, or 33 percent ofpublic sector investments. Not all ODAresources go to capital accumulation, andonly 10 percent of the capital for on-budgetinvestments comes from donor-fundedprojects. However, these figures show thatODA makes a relevant contribution to capitalaccumulation, in spite of Vietnam not beingan aid-dependent country.
The amount of resources contributed by thedonor community has increased steadily inthe 15 years elapsed since the first
102
10. DONOR SUPPORT

Consultative Group meeting, in 1993. For2008, donors had jointly pledged theequivalent of 5.4 billion dollars. On average,around three quarters of the pledgesmaterialize under the form of commitments.ODA disbursement, on the other hand, islower (Figure 10.1). A gap is understandablein a young and growing program, as mostprojects span several years. But the gap islarge in Vietnam, reflecting the cumbersomeprocedures that need to be followed to meetboth Vietnamese regulations and donorrequirements.
Following a series of reforms introducedbetween 2004 and 2006, the legal frameworkfor ODA management in Vietnam isrelatively comprehensive. It covers planning,budgeting, funds withdrawals, accounting,implementation, disbursement and reporting.A key regulation is Decree 131, issued inNovember 2006, which provides for thedecentralization of ODA investment
ownership, with more discretion delegated toimplementing agencies and strengthenedoversight by line ministries and provincialgovernments.
Vietnam has probably gone further than mostdeveloping countries in articulating principles,commitments and targets for the coordinationof donor support. The Hanoi Core Statement,issued in September 2005, establishedambitious objectives in terms of ownership,alignment, harmonization, managing forresults and mutual accountability, to beattained by the year 2010. This coordinationeffort, led by the government, has earnedVietnam an increasing recognition in theinternational arena.
Despite these clear objectives, thefragmentation of donor assistance still puts astrain on the government’s capacity to handleit efficiently. For instance, in agriculture andrural development alone there are as many as
DONOR SUPPORT
103
0
1
2
3
4
5
6
2001 2002 2003 2004 2005 2006 2007
Pledges Commitments Disbursements
Bill
ion
dolla
rs
Figure 10.1: Donor Support Looking Backward
Source: MPI.

200 ongoing projects, with some 40 to 50additional ones agreed every year. Whilethis sector represents an extreme, it is by nomeans unique. In the health sector, forinstance, there are around 75 ongoingprojects, mostly below 500 thousand dollarsin size, and with 98 percent of them fundedby a single donor.
The processes to channel donor resourcesare cumbersome as well. As ODAconstitutes part of the state budget, donor-funded projects must follow the sameplanning, discussion and decision-makingsteps as government-funded projects. ButODA projects also have their own, separateappraisal by the corresponding donor. Therehas been considerable progress inharmonizing the templates for feasibilitystudies among donors, especially among thedevelopment banks providing large loans.But the appraisal processes of donors andgovernment remain on parallel tracks.
Aid effectiveness
Assessing the actual effectiveness of donorsupport to Vietnam is difficult. Any rigorousassessment requires a counterfactual or, putdifferently, some credible way to measurewhat would have happened in the absence ofsuch support. However, in most cases thecounterfactual is not observable. Justcomparing the situation before and after adonor-funded initiative is undertaken isclearly not sufficient when other changes arehappening at the same time, as is often thecase in Vietnam. The problem is compoundedin the case of initiatives entailing a range ofeconomic changes, as opposed to a narrow,measurable intervention.
Evaluation is particularly difficult in the caseof program-based approaches, combining a
policy dialogue with budget support, at eithergeneral or sectoral level. Consider PovertyReduction Support Credits (PRSCs), theannual operations disbursing resourcesdirectly to the budget of the government ofVietnam in recognition for progress in policyreform. The preparation of these operationsinvolves year-long technical discussionsbetween participating donors andgovernment on a dozen of key policy triggers(or actions of strategic importance) and anadditional three dozen policy benchmarks (oractions of lesser importance, but still capableof making a major difference in economicoutcomes). Triggers and actions are spreadacross all pillars of the SEDP 2006-2010,namely economic development, socialinclusion, natural resource management andmodern governance. On the resources side,since their inception in 2001 PRSCs havecontributed around 1.8 billion dollars to thebudget of Vietnam. The most recentoperation in the series mobilized around 362million dollars from a dozen donors,equivalent to one fifth of annual ODAdisbursements.
Assessing the impact of PRSCs is difficultfor two reasons. First, resources disbursed tothe budget are indistinguishable fromgovernment revenue from other sources(such as taxes), and are subject to the sameappropriation mechanisms as them, so that itis technically not possible to trace them tospecific uses. Second, it is not clear howdifferent the policy actions undertaken bythe government would have been in theabsence of the year-long dialogue betweenparticipating donors and government. Insome areas, engagement results in importanttechnical improvements; in other,characterized by limited political will,
CAPITAL MATTERS
104

conflicting institutional responsibilities orinsufficient analytical work, the impact ismore limited.
Several independent evaluations of thePRSC process in Vietnam have beenconducted so far and they have been positive.A review by the Independent EvaluationGroup (IEG) rated the outcome of the firstseries of five PRSCs as satisfactory. Anotherassessment was conducted after PRSC 4, aspart of a broader evaluation of generalbudget support commissioned by 24 donorsfor seven countries. This assessmentshowcased Vietnam as a successful exampleof government-donor collaboration, with astrong impact on policies. An updateconducted one year later by the same teambut for Vietnam only concluded that PRSCswere effective at supporting policy reforms,at linking policy and budgets, atstrengthening financial management and athelping donor harmonization. At the sametime, PRSC operations were judged lesseffective at supporting policy breakthroughsand at helping policy implementation. Theywere seen as unable to overcome donorfragmentation in areas like publicadministration reform.
Assessing the actual effectiveness of donorsupport to Vietnam is easier in the case ofmore focused interventions, such asprograms targeted to specific programs or tospecific communes. In this case, the situationof similar geographic areas not benefittingfrom those interventions provides anappealing counterfactual. The relevantcomparison is then not just between beforeand after the intervention in targeted areas,but rather between the gains made by areastargeted by the intervention and the gainsmade by similar, non-targeted areas (in
statistical jargon, impact assessment can beconducted through differences-in-differencesmethods).
Two recent evaluations of World Banksupport to Vietnam, one for the transportsector and one for the health sector, use thisapproach (Box 10.1). Both conclude thatresources were to a large extent fungible,meaning that their availability for targetedprovinces and areas allowed government toredirect its own resources to non-targetedprovinces and areas. Aid fungibilitycomplicates the assessment of aideffectiveness. If non-targeted areas alsobenefit from more resources thanks to adonor project, the cleanness of thecounterfactual is undermined, and the impactof donor support is underestimated.
Reassuringly, both evaluations conclude thatthe projects had a positive impact in thesectors they targeted (transport and healthrespectively). But they also imply that someof the ODA resources were actuallychanneled through government systems.Indeed, if one additional dollar of donorfunding for a specific activity allowsgovernment to free X cents to spendelsewhere, then it is as if 100-X cents wereprocessed through donor systems and Xcents through country systems. The strongera country’s ownership of its developmentprogram, the more likely it is that finalresource allocations will be independent ofdonor preferences. This, in turn, suggeststhat country ownership and the use ofgovernment systems go together.
Towards middle income
As Vietnam joins the group of middle-income countries, there has been speculationregarding the volume and nature of donor
DONOR SUPPORT
105

CAPITAL MATTERS
106
Box 10.1: Aid Fungibility in the Transport and Health Sectors
The first World Bank-financed Rural Transport Project, launched in 1997, aimed atrehabilitating 5,000 kilometers of district and commune level roads in 18 provinces. Anevaluation based on independent administrative data shows that the project wasimplemented as planned, with an average of 4.6 kilometers of roads per participatingcommune rehabilitated under the project.
However, a simple comparison between participating and non-participating communesshows that the average difference between them is only 2.5 kilometers. It also appears thatproject communes built more kilometers of new roads than did the non-project communes.This is despite the fact that the project did not finance new roads.
A more rigorous evaluation uses a panel data set of communes and households withinproject and non-project areas. The dataset comprises a baseline and follow-up data,including information on relevant characteristics of project and comparison areas. Theresults confirm that resources stayed within the transport sector, but were diverted fromrehabilitation to the building of new roads. The results also show that the quality ofrehabilitated roads improved in the project communes thanks to a switch away from thedonors preferred technology, namely earth road rehabilitation.
Patterns are similar in the health sector. The World Bank’s Population and Family HealthProject and National Health Support Project were approved in 1996. Around half of thebudget of each was directed to 37 of Vietnam’s provinces, with the overall objective ofimproving primary care (especially maternal and childcare) in commune and district healthcenters. The measures implemented to achieve this goal included the upgrading offacilities, the purchase of equipment, the provision of essential drugs, in-service training andoutreach services.
The outcome examined to assess the impact of these projects is infant mortality (deathsamong children in the first year of life). Data are from the 1997 and 2003 DemographicHealth Surveys, which were fielded at the inception of the projects and at their originalclosing date. The assessment compares gains in infant mortality between participating andnon-participating provinces. However, to account for the possible fungibility of donorresources, an underlying function linking infant mortality to government spending and otherdeterminants is estimated.
The results suggest that the government responded to the World Bank projects by scalingback its planned increase in spending in the project provinces, relying largely on the Bank tofinance extra spending (compared to the initial level) in these areas. The projects thusallowed the government to achieve higher levels of spending (gross of World Bank-providedfunds) in both project and non-project provinces. But while aid is fungible across provinceswithin the health sector, there is no evidence of fungibility between the health sector andother sectors in the economy.
Source: Based on Dominique van de Walle and Ren Mu (2007) and Adam Wagstaff (2008).

support it may receive. A standardclassification between low- and middle-income countries relies on their GrossNational Income (GNI) per person. As of2007, countries with a GNI of up to 935dollars were counted as part of the low-income group, and countries with a GNI of936 to 3,705 dollars as part of the lowermiddle-income group. A GNI of 11,456dollars or more was needed to be part of thehigh-income group. These thresholds arerevised annually. Based on their currentlevels, Vietnam could enter the middle-income group in 2008. This is because inspite of a lower GDP growth in real terms, itexperienced a substantial real exchange rateappreciation.
Joining the middle-income group may affectthe volume of donor support in two ways.Donors providing grants tend to favor thepoorest countries, and allocate fewerresources to middle-income countries. Someof them use the World Bank GNI thresholdsas the basis for their own aid allocation rules.As for donors providing loans, they tend togradually shift to less concessional terms asborrowing countries grow richer.
In the case of the World Bank, countries witha GNI of less than 1,095 dollars per personcan borrow from the InternationalDevelopment Agency (IDA), with a 40-yearmaturity, a 10-year grace period and nointerest charge. Countries consideredcreditworthy can access resources from theInternational Bank for Reconstruction andDevelopment (IBRD), in terms comparableto those faced by high-income countries. Ahandful of low-income countries areconsidered creditworthy, and since 2008Vietnam is one of them. IBRD loans aremore flexible in their terms, depending on
the borrower’s needs. They can have amaturity of up to 30 years, their interest rateis very close to LIBOR and their front-endfee is 0.25 percent. IBRD terms are thusmore favorable than those usually faced bydeveloping countries, especially at a timewhen risk premiums are very high. But theyare less favorable than IDA terms. From thepoint of view of the World Bank, Vietnam isnow entering a “blend” situation, where IDAand IBRD resources can be combined. Afterseveral years with a GNI above the IDAthreshold, Vietnam will not be eligible forIDA support anymore. Other developmentbanks have similar rules. The AsianDevelopment Bank (ADB) is currently moreadvanced in its blending of resources forVietnam than the World Bank.
In spite of Vietnam’s access to middle-income status, donor support may stillincrease in the coming years. Intentionswere assessed through a survey circulatedamong all the donors who are active inVietnam. The survey was answered by 15 ofthem, jointly accounting for more than 4billion dollars in commitments every year.The results suggest that the volume of grantswill remain stable in the foreseeable future,but the volume of loans may increase, beforereturning to its current level in the first halfof the next decade (Figure 10.2).
The survey of donor intentions also revealedsome clear patterns in relation to aidinstruments, aid modalities and lendingterms. Respondents do not anticipate majorchanges in the volume of resources theydevote to technical assistance. There is moredispersion in relation to investment credits,with some donors planning an increase intheir volume and others a decrease. There isa clearly stated willingness to provide more
DONOR SUPPORT
107

sectoral budget support, along the lines ofcurrent program-based approaches onEducation for All, or on targeted transfers todisadvantaged communes under Program135 Phase II. But there is considerableuncertainty regarding general budgetsupport. This is probably due to the unclearstatus of the PRSC series beyond the end ofits current five-year cycle. Respondents alsoanticipate an increase in the volume ofresources they channel through non-government counterparts. The expectedincrease is modest in the case of civil societyorganizations, but more substantive in thecase of the private sector. Those providingloans expect the terms of their combinedsupport to shift to less concessional terms,with two thirds of resources channeled atclose-to-market terms after 2012.
Priority areas
The survey of donor intentions does notsuggest any strong sectoral orientation forfuture ODA support. But a recent survey ofWorld Bank counterparts (the so-called
Global Poll) sheds some light on the areasVietnam wants donors to help with (Table10.1). The survey had 2,611 respondentsfrom government, the media, academiccenters, the private sector and civil society in42 countries, including 57 participants fromVietnam. The results of the Global Poll needto be interpreted with caution, as countrysamples are small and questions havedifferent formats (some are open-endedwhile others offer a multiple choice). Yetthey provide some useful insights.
Interestingly, the areas favored byrespondents to the Global Poll are notnecessarily those considered most importantfrom the point of view of economicdevelopment, but rather those in whichdonors may have the highest potential tomake a difference. For instance, Vietnameserespondents see education as the maincontributor to rapid economic growth, evento a larger extent than other East Asianrespondents. But they do not think thateducation should be the most important
CAPITAL MATTERS
108
0
10
20
30
40
50
-50 percentor less
0 to-20percent
Roughlythe
same
0 to+20
percent
+50percentor more
Do notknow
0
10
20
30
40
50
60
70
Per
cent
(wei
ghte
d by
com
mitm
ents
)
û
û
Grants 2008-11 Grants 2012-15 Loans 2008-11 Loans 2012-15
-50 percentor less
0 to-20percent
Roughlythe
same
0 to+20
percent
+50percentor more
Do notknowP
erce
nt (w
eigh
ted
by c
omm
itmen
ts)
Figure 10.2: Donor Support Looking Forward
Source: Own calculations, based on an informal survey of donor intentions.

sectoral focus of the World Bank program.A similar gap can be seen in relation to thefight against corruption.
More generally, the Global Poll indicatesthat Vietnamese respondents see education,the business climate and improvedgovernance as the main avenues toprosperity. But they expect the World Bankto help on infrastructure development,poverty reduction and the business climate.Only the business climate can be found inboth top-three lists.
Supporting these priority areas will be morechallenging as Vietnam enters the ranks ofmiddle-income countries. The experience ofChina at a similar stage in its developmentprocess is revealing in this respect (Box10.2). It suggests that maintaining policylending and support for the social sectors asactive areas for donor engagement asVietnam becomes a middle-income country
will require a deliberate government choice.Absent that choice, there is a risk of seeingdonor support gradually drifting away frommore direct contributions to povertyreduction and the investment climate.Infrastructure finance would still contributeto capital mobilization. It would also helpintroduce better practices in projectpreparation and implementation, fromplanning to financial management toenvironmental and social safeguards,allowing the Vietnamese government toscale up what works, as the Chinesegovernment has been doing consistently.But an early disengagement from the socialsectors and from policy reforms related tothe business climate could amount to amissed opportunity.
The cumbersome procedures for thedisbursement of investment credits, togetherwith the experience accumulated withPRSCs, indicate a possible way to maintain
DONOR SUPPORT
109
Table 10.1: What are the Main Priorities?
East Asia Vietnam East Asia Vietnam
Poverty reduction - - 52 37Environmental protection - - 23 15Improving education 23 35 12 12Business climate 33 30 33 24Improving governance 23 30 10 10Reducing corruption 21 26 6 10Infrastructure development 27 18 20 58Agriculture and rural development 26 16 11 10Employment/income generation 17 14 4 6
Source: Adapted from World Bank (2008g).
Which areascontribute themost to fastergrowth in your
country?
What should themain objectives
of the WorldBank be in your
country?
CAPITAL MATTERS
110
Box 10.2: China’s Graduation from Concessional Lending
While China was still a low-income country, the World Bank’s strategy differed from that forother countries in two important respects.
First, it consistently emphasized lending for infrastructure. This was at a time when suchlending was falling worldwide, due to excessive optimism regarding private sectorparticipation in infrastructure and enormous caution in relation to the environmental andsocial impacts of large infrastructure projects. Second, budget support was not an importantinstrument. China was actually reluctant to accept any form of conditionality, and over theentire history of World Bank support to the country there was only one adjustment loaninvolving policy conditionality, for the rural sector. On the first dimension, there is a clearsimilarity between China and Vietnam; on the second one, there is an obvious difference.
As China approached middle-income levels, World Bank support was affected by twonegative developments.
First, IBRD exposure ceilings on the share of the portfolio allocated to a single countryconstrained the World Bank’s ability to lend. The volume of resources provided to China hadnever been large relative to the size of the country. In 1994, at its height, it reached 3.3billion dollars, or 0.6 percent of GDP. But IBRD ceilings brought that volume down to lessthan 1 billion by 2001.
Second, the World Bank stopped providing IDA support to China from 2000 onwards.Although plans to switch from blend to all-IBRD lending had been considered earlier, the lossof IDA resources was a disappointment to the government and placed strains on the WorldBank’s relationship with China. IDA donors decided that China was sufficiently creditworthyto dispense with IDA funding. The government thought this unfair because per capita GDPwas still below the cutoff line at that time and because there were still some 200 millionpeople in China with consumption below a dollar per day. The government also felt that Banksenior management could have fought harder to retain China’s access to IDA.
The shift to all-IBRD terms, more than the overall reduction in lending, complicated the WorldBank strategy in China. Beneficiaries right down to the village or individual farmer level areresponsible for loan repayment. With the loss of IDA, the World Bank is constrained fromshifting its lending to lagging regions and from maintaining the level, or even the share, oflending to agriculture, the social sectors and poverty projects. This is because of thedifficulties these regions and sectors would have in repaying IBRD. An innovativearrangement, in which DFID blends grants with IBRD loans to simulate IDA terms, offers anopportunity for the Bank (jointly with DFID) to remain engaged in social sectors and povertyprojects. By also maintaining a relatively high level of lending for infrastructure, the Bankaims to increase the share of lending to poorer, inland provinces.
Source: Adapted from World Bank (2005).

donor engagement in non-infrastructureareas. This is to use non-concessionalresources for general and sectoral budgetsupport operations. By disbursing throughcountry systems, budget support reducessome of the transaction costs associated withinvestment credits. Because it is associatedwith policy reforms, it may also contribute topoverty reduction and the improvement ofthe business climate. And given the extentof donor coordination attained in Vietnam,support in non-concessional terms by somedonors can be blended with grant support byothers to deliver overall terms close to thoseIDA can offer at present.
Country systems
Using country systems involves includingODA resources in national or provincialbudgets, reporting on their use through thegovernment’s accounting system, and havingthe expenditures audited by or incooperation with the State Audit of Vietnam.To qualify as using country systems, at leasthalf of the resources contributed by a donorneed to meet these standards. Currently, it isclaimed that 12 percent of aid flows and 42percent of the donors are using the nationalbudgeting, financial reporting and auditingsystems. However, these figures may sufferfrom inconsistent self-reporting by donors.
However, increasing the use of thegovernment’s systems and procedures inprocurement, financial management andsocial safeguards remains a challenge. Apartfrom general budget support and sectoralbudget support, most donors have to complywith practices and standards that are notcompatible with those of the government ofVietnam. There is some tension betweenthe understandable fiduciary concerns of
taxpayers in donor countries and theirwillingness to improve the capacity ofrecipient countries and entrust them todeliver on aid programs. The tension isexacerbated every time a corruption scandalarises, regardless of whether the scandal isan indication of corruption getting worse orrather proof that the government is seriousabout fighting it. In those tense times,additional transparency initiatives andcontrol layers tend to be added by donors.While it is not evident that such initiativeseffectively mitigate fiduciary risk, they oftenmake the use of ODA more cumbersome,potentially resulting in even lowerdisbursement rates. Reaching the rightbalance between fiduciary controls andgovernance improvements will not happenin the absence of a clear strategy (Box 10.3).
Considerable effort has been devoted to theharmonization of feasibility studies betweenthe government and the development banksoperating in Vietnam. Guidelines have beenissued specifying the objective ofharmonizing procedures and policies ofproject preparation, appraisal andevaluation. For instance, feasibility studiesare supposed to indicate the medium- andlong-term results expected from projects,including their possible impact on the poor,ethnic minorities and local people. If theprojects involve resettlement, then thecompensation mechanism for the affectedpopulation needs to be specified.
Reforms of financial management in recentyears have also enhanced the effective useand management of ODA. Theimplementation of a modern TreasuryManagement and Budget InformationSystem (TABMIS), together with a unifiedand updated Chart of Accounts, will mark
DONOR SUPPORT
111
significant improvements. However,government systems are not currently able toadequately budget, account and report fordonor-financed projects separately fromother funds and expenditures, and as a resulta parallel set of financial management
accounting systems is used. To allowconfidence in reliance on country systems,weaknesses in the government internalcontrols, internal auditing, reporting andoversight procedures and mechanism wouldneed to be addressed.
CAPITAL MATTERS
112
Box 10.3: The Governance and Anticorruption Strategy
By the late 1990s, corruption had come to be recognized as a scourge for development. Anexpanding body of research provided evidence of the negative effects of corruption oninvestment and growth, on the ability of the state to deliver quality services to poor people,and on the effectiveness of international aid. Corruption, once viewed as a localized politicalissue, came to be viewed as a fundamental problem of economic development.
At the same time, it became clear that controlling corruption could not be accomplishedthrough a purely enforcement-oriented approach. The underlying weaknesses in the systemof governance open up the channels through which corruption operates, and addressingthose governance weaknesses would be necessary to control corruption, and to supportgovernments to become more effective. During the first decade of open discussion aboutcorruption, the World Bank’s emphasis on governance issues expanded and strategies forhelping countries reduce corruption and improve governance were developed.
Following a large international consultation with representatives from governments, donors,civil society, parliaments, private sector, academia, and other stakeholders in 35 developingand 12 donor countries, a new strategy was adopted in 2007. Drawing upon the viewsexpressed during the consultation, the Governance and Anticorruption (GAC) Strategyrested upon seven principles:
● The focus on governance and anticorruption is consistent with the mandate to reducepoverty.
● The country has primary responsibility for improving governance.
● Remain engaged even in poorly-governed countries (“don’t make the poor pay twice”).
● There is no “one-size-fits-all” approach to governance and anticorruption issues.
● Engage with multiple government, business, and civil society stakeholders in operationalwork.
● Strengthen, rather than bypass, country systems.
● Work with others toward a harmonized approach.
The strategy itself consists of three main pillars: (i) supporting country efforts to strengthengovernance and reduce corruption, (ii) addressing corruption in World Bank operations, and(iii) strengthening global partnerships. The strategy also emphasized that monitoring is keyto accountability.
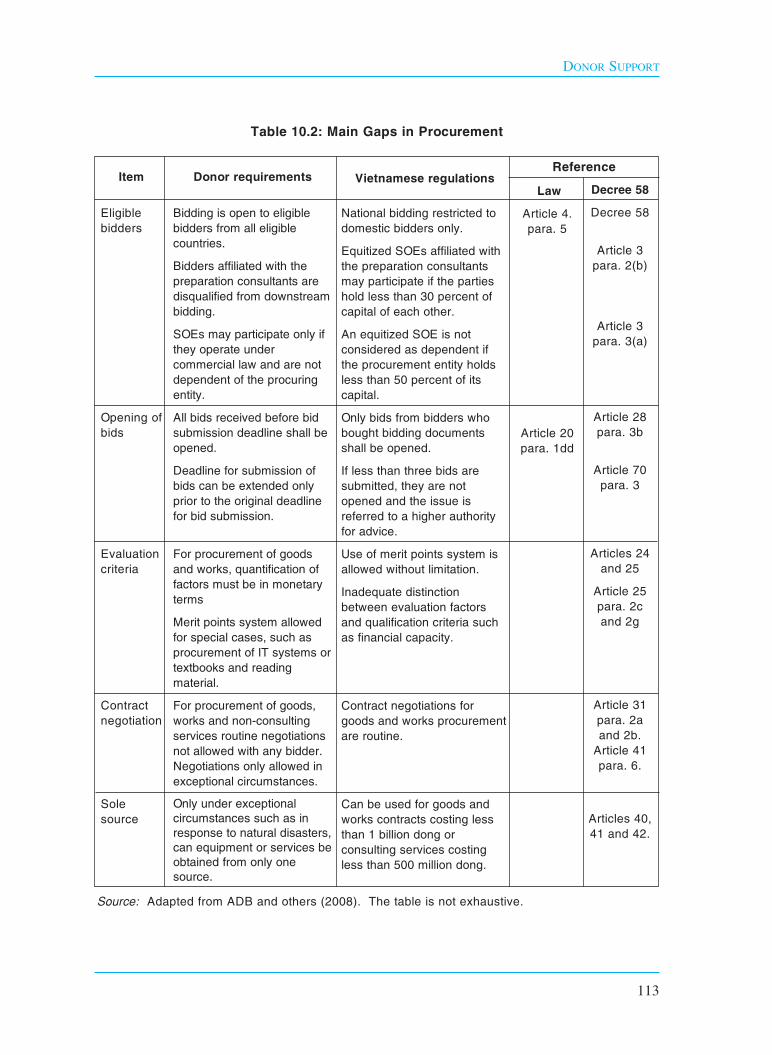
DONOR SUPPORT
113
Table 10.2: Main Gaps in Procurement
Source: Adapted from ADB and others (2008). The table is not exhaustive.
Item
Eligiblebidders
Opening ofbids
Evaluationcriteria
Contractnegotiation
Sole source
Donor requirements
Bidding is open to eligiblebidders from all eligiblecountries.
Bidders affiliated with thepreparation consultants aredisqualified from downstreambidding.
SOEs may participate only ifthey operate undercommercial law and are notdependent of the procuringentity.
All bids received before bidsubmission deadline shall beopened.
Deadline for submission ofbids can be extended onlyprior to the original deadlinefor bid submission.
For procurement of goodsand works, quantification offactors must be in monetaryterms
Merit points system allowedfor special cases, such asprocurement of IT systems ortextbooks and readingmaterial.
For procurement of goods,works and non-consultingservices routine negotiationsnot allowed with any bidder.Negotiations only allowed inexceptional circumstances.
Only under exceptionalcircumstances such as inresponse to natural disasters,can equipment or services beobtained from only onesource.
Vietnamese regulations
National bidding restricted todomestic bidders only.
Equitized SOEs affiliated withthe preparation consultantsmay participate if the partieshold less than 30 percent ofcapital of each other.
An equitized SOE is notconsidered as dependent ifthe procurement entity holdsless than 50 percent of itscapital.
Only bids from bidders whobought bidding documentsshall be opened.
If less than three bids aresubmitted, they are notopened and the issue isreferred to a higher authorityfor advice.
Use of merit points system isallowed without limitation.
Inadequate distinctionbetween evaluation factorsand qualification criteria suchas financial capacity.
Contract negotiations forgoods and works procurementare routine.
Can be used for goods andworks contracts costing lessthan 1 billion dong orconsulting services costingless than 500 million dong.
Law
Article 4.para. 5
Article 20para. 1dd
Decree 58
Decree 58
Article 3para. 2(b)
Article 3para. 3(a)
Article 28para. 3b
Article 70para. 3
Articles 24and 25
Article 25para. 2cand 2g
Article 31para. 2aand 2b.
Article 41para. 6.
Articles 40,41 and 42.
Reference

Some of the largest gaps betweenVietnamese regulations and internationalgood practice refer to procurement (Table10.2). Those gaps provide a good illustrationof the problems inherent in systems that arenot harmonized. Both the VietnamProcurement Law and the policies of thedevelopment banks stipulate that in the eventof an inconsistency in the provisions, thebanks’ guidelines prevail. But in practiceproject officials often tend to “play it safe” by
trying first to apply the local rules. This isbecause the consequences of flouting thelocal regulations are severe and more direct.This has at times led to mistakes and delays inthe implementation of projects financed bythe development banks.
Recent months have witnessed largefluctuations in commodity prices, a globalfinancial crisis, and a recession in industrialcountries. This turbulence unfolded when
CAPITAL MATTERS
114

PART III:A POLICYAGENDA
115


Vietnam was barely emerging from theoverheating caused by its own success atattracting capital in massive amounts. Whilethe government reacted swiftly,macroeconomic instability could underminethe efforts to increase the efficiency ofcapital accumulation. For now, the mostlikely scenario is one in which capitalinflows decline substantially, bringingVietnam back to a pre-WTO environment.But this is not the only possible scenario.Given the uncertainty, the immediatepriority is to be ready to cushion the shocksstemming from the balance of payments.The standard prescription in this respect is tolet the exchange rate fluctuate freely, andVietnam is moving in that direction.However, getting there may take some timeand meanwhile, the effectiveness of otherpolicy tools, from monetary policy to fiscalpolicy, is limited. This suggests that thegovernment should prepare to face moreturbulence in the near future. Containingrisk requires decisive action in the financialsector. Creating a modern central bankempowered to adopt appropriate monetarypolicy, building the institutional capacity toimplement such policy, upgrading the abilityof the banking system to assess credit risk,and improving the quality of financial sectorsupervision, will be critical to make Vietnamless vulnerable. There is also a need toimprove communication with market
participants and the public at large. Progresshas been made in relation to financial sectorindicators. But better and more current datais also needed in relation to governmentrevenue and expenditures, including publicinvestments. Last but not least, ensuringstability has a social dimension. Rapidinflation and the deceleration of growthaffect jobs and purchasing power. In a timeof possible hardship it is crucial to ensurethat resources can be channeled to those whoneed them most.
An uncertain world
At a time when Vietnam is consolidating itsglobal integration, the world economy hasturned much more unpredictable. Theprotracted negotiations that led to WTOaccession had been conducted during aperiod of remarkable stability and sustainedgrowth. International trade volumes wereincreasing steadily and country riskpremiums had fallen. At the culmination ofthis process, in 2007, Vietnam was mainlysuffering from its own success. Accession tothe WTO was seen as a clear indication thatthe government was serious about economicreform and the reliance on marketmechanisms. In a world of abundant capitaland growing trade, capital flowed in, underthe form of FDI, portfolio investments andremittances by the overseas Vietnamesecommunity. Volumes were so large that
117
11. ENSURING STABILITY

they would have been difficult to manageeven for a seasoned central bank. Vietnamdid not have one at the time.
In the fall of 2008, difficulties gotcompounded by turbulence in the worldeconomy. A financial crisis of unprecedentedproportions led to a collapse in credit, in spiteof abundant liquidity. Starting with arelatively narrow segment of the mortgagemarket in the United States, the financialcrisis spread from one class of assets toanother, forcing the adoption of massivebailout packages all over the world.Economic activity was hit to a larger extentthan anticipated, with major industrialcountries going into recession, andinternational trade slowing down. Aftertrending upwards for several years, andexperiencing a surge in late 2007, commodityprices fell sharply in 2008 (Figure 11.1).
This unprecedented global turbulence takesplace at a time when Vietnam has become amuch more open economy. The ratio of
international trade to GDP increased from 46percent in 2001, when reforms accelerated,to an estimated 72 percent in 2008.International commitments made to accedeto the WTO resulted in higher internationalcapital mobility. While the dong is notconvertible, foreigners face almost norestriction to purchase bonds and stocks inthe domestic market, nor to sell them andrepatriate the proceeds if they wish to do so.It is very difficult to achieve economic andfinancial integration without beingsusceptible to contagious effects. Suddenglobal turbulence is thus combined withincreased Vietnamese exposure.
With the balance of payments as the mainsource of instability in the near future,cushioning the impact of its fluctuations onthe domestic economy is a priority. Slowerexport growth and a slowdown in inflowswould constraint the pace of capitalaccumulation, and some depreciation of thedong would take place. But Vietnam couldalso hold well in its export markets, FDI
CAPITAL MATTERS
118
0
100
200
300
400
500
Nov-03 Nov-04 Nov-05 Nov-06 Nov-07 Nov-08
Energy
Food
Metal and Minerals
0
200
400
600
800
1000
Oct-05 Apr-06 Oct-06 Apr-07 Oct-07 Apr-08 Oct-08
Inde
x(J
an20
03=
100)
US
dolla
rper
ton
Philippines fourth tender
Philippines panic bying
Vietnam tightens export restrictions
India imposes export restrictions
Figure 11.1: Dramatic Fluctuations in Commodity Prices
Source: World Bank (2008e).

disbursements could continue in spite of alower implementation rate (simply due to thesheer volume of approvals) and remittancesmay not fall by a large margin. While thefirst scenario is the most plausible, thesecond one is not totally unrealistic.Forecasting the balance of payments istherefore difficult. Rather than preparing forjust one scenario, the government needs tobe ready to respond.
Macroeconomics first
The economic reforms needed to improvethe efficiency of capital mobilization inVietnam are microeconomic in nature.However, microeconomic reforms alone willfail to deliver if the economy is subject tomacroeconomic instability.
The experience of Vietnam in late 2007 andearly 2008 is telling in this respect. Havinglost control of credit growth, asset pricessurged and investments followed the pricesignals. The rapid diversification ofEconomic Groups and large StateCorporations diversified in the direction ofreal estate and financial investmentsactually showed that they had a strong profitdrive. The problem was not so much theirresponse, but rather the wrong economicsignals they were responding to. Wrongmarket signals, especially when they last forlong, create systemic risk (Box 11.1). Andpolicy makers are not well equipped to dealwith it. A stable macroeconomic context isthus a pre-condition for efficient capitalmobilization.
In light of the uncertainties associated withinternational trade and capital movements,the government should try to steer theeconomy along a steady growth path in themedium term, while building in strong
stabilizing mechanisms to cope with short-term fluctuations.
A steady growth path, one that is notassociated with major changes in theexternal debt position, requires a tradedeficit that is commensurate with both theinvestment needs of Vietnam andavailability of long-term capital. In recentdebates, capital inflows have been blamedfor the large trade deficit. But as long asthose inflows are being invested, andespecially invested well, the trade deficitshould not be a matter of concern. Efficientinvestment should sooner or later translateinto a higher supply of goods and services,hence into more exports and less imports.Trying to suppress the trade deficit, as someclaim Vietnam should do, is the same astrying to reduce domestic consumption andinvestment. This would not be the rightchoice for a country that is not yet rich andneeds to grow.
As for short-term stabilization mechanisms,the standard recommendation is to let thenominal exchange rate fluctuate. Vietnam ismoving in the direction of increasedflexibility, by gradually widening thefluctuation band around the rate set by SBV.However, whether the ultimate objective ofthe government is a fully flexible exchangerate is unclear at this point. And even if itwere, there are understandable reasons whythe transition may take some time.
In an economy not yet used to exchange raterisk, and with limited hedging instrumentsavailable, there could still be sizeablecurrency mismatches in enterprises andbanks. Large fluctuations in the nominalexchange rate could then result in importantbalance-sheet effects, possibly leading to
ENSURING STABILITY
119

bankruptcies. For instance, an enterprisewhich sells to the domestic market but isindebted in dollars would suffer from thedepreciation of the dong. Large exchangerate fluctuations may also affect
competitiveness in the short term, and createuncertainty among investors who seeVietnam as an export platform. Andexchange rate movements also create awedge between interest rates in domestic
CAPITAL MATTERS
120
Box 11.1: Systemic Risk in East Asian Economic Crises
The crises that shook East Asia over the last two decades had all a systemic elementembedded. This is why they were so difficult to stop and eventually so costly. The way theyunfolded provides useful insights for Vietnam.
The common cause of the crises in Thailand, Indonesia and South Korea, in 1997, was themismatch between the composition of assets and liabilities in terms of their tenure andcurrency. In varying degree, banks and enterprises in the three countries were borrowingshort-term credits in foreign currencies (mainly dollars) from abroad and financing long-term investments in domestic currencies. This mismatch resulted in large un-hedgedforeign currency liabilities. When foreign investors and lenders stopped refinancing theircredits, out of their concern about the borrowers’ financial health, enterprises had toliquidate assets to repay their short-term credits. This pushed asset prices down,complicating further the already vulnerable situation of enterprises. Meanwhile, thesecountries’ international reserves were not sufficient to counter the reversal of short-termcapital flows. The result was a massive depreciation of local currencies. Lower assetprices and more expensive debt burdens brought many of those enterprises intobankruptcy, creating major recessions.
The root causes of Japan’s decade-long economic stagnation were the protracted stock andproperty market bubbles of the late 1980s. It is often difficult to distinguish a bubble from aboom sustained on strong fundamentals. And it is tempting to misconstrue bubbles as asignal of the skills of policy makers, the vibrancy of the investment climate or the greatnessof the nation. In the case of the stock market, the P/E ratio can be used as a starting pointto assess those claims. A market-wide P/E ratio is measured as the ratio between totalmarket capitalization and the total earnings of all companies traded in the market. Themeasure varies depending on whether past earnings or forecasted earnings are used in thecalculation. Before the specifics, a very general rule of thumb is that a market-wide PERhigher than 20 is a sign of overheating. A higher P/E ratio can be justified for rapidly growingeconomies such as China, India or Vietnam. Just before Japan’s stock market collapsed in1990, Tokyo’s market-wide P/E ratio was registering over 60, while the total marketcapitalization surpassed 160 percent of GDP. Prolonged loose monetary policy is generallyrecognized as the primary cause of this bubble. Given how large the departure fromeconomic fundamentals was, when the bubble burst debtors became insolvent and banksportfolios deteriorated sharply. A general reluctance to lend followed, and economic activitysuffered.
Source: Noritaka Akamatsu (2008).

and foreign currency, which may amplifyshort-term capital movements and lead toinstability. For example, with a flexibleexchange rate, a sudden capital inflowwould lead to the appreciation of the dong,making interest rates in dong more attractivethan interest rates in foreign currency. Thiscould in turn attract more short-term capital(under the form of carry trade), pushing thedong even higher up.
If not all the burden of adjustment can fall onthe nominal exchange rate, at least in theshort term, then other stabilizing mechanismsare needed. Monetary policy is an obviouscandidate, but its effectiveness is reduced ina context of international capital mobility ifthe exchange rate is rigid. And there areother shortcomings resulting from the factthat Vietnam has not completed the reform ofits financial sector yet. That leaves fiscalpolicy as one of the main macroeconomictools available to government. Butinstitutional shortcomings in public financialmanagement, especially in relation to publicinvestment, reduce the effectiveness of thistool as well. Additional stabilizers can beconsidered in relation to trade and to short-term capital flows, but their merits are morequestionable. All of this suggests that even ifpriority is given to macroeconomic stability,Vietnam could face considerable turbulencein the near future.
Containing risk
The overheating of the Vietnameseeconomy was fortunately brief. While thefirst signs were apparent in September 2007,a strong stabilization package was adopted inMarch 2008, barely six months later. Byinternational standards, this is a remarkablyswift response. But the ensuing decline in
asset prices, combined with the surge ininterest rates and the tightening of bankingcredit, has resulted in increased levels ofstress for borrowers. The extent to whichreal estate investors and urban developerswill be able to service their debts is unclear.Growing difficulties to sell abroad could alsocreate stress for manufacturing enterprises.The resulting increase in the share of badloans is bound to affect commercial banks,especially those who lent more recklessly insupport of formerly booming sectors.
Accelerating financial sector reform mayhold the key to preventing this combinationof stress and uncertainty to drift intosystemic risk. At the risk of simplifying, fourelements need to be combined. First,authorities have to be empowered to adoptthe appropriate monetary policy, reactingquickly to market signals and avoiding thedevelopment of asset price bubbles like theone that affected Vietnam in late 2007.Second, the authorities also need to build thecapacity to implement the chosen monetarypolicy without creating unnecessary hiccupsalong the way. Third, commercial banksneed to upgrade their ability to assessborrower risk and allocate creditaccordingly. And fourth, the authorities needto be able to quickly identify sources ofborrower stress and weak bank portfolios, soas to intervene effectively.
Implementing the banking reform agendaapproved in 2005 would help on several ofthese fronts. One of the building blocks ofthe agenda is the creation of a moderncentral bank, taking out of SBV the exerciseof ownership rights on SOCBs, focusing itsmandate on price and financial sectorstability, and giving it the technical andoperational autonomy to conduct its own
ENSURING STABILITY
121

analyses, make recommendations to thegovernment and implement monetarypolicies. This should help overcome thefragmentation in responsibilities formonetary policy, currently scattered acrossfour SBV departments. Passing a new Lawon the SBV is critical to accomplish thesegoals.
The smooth implementation of monetarypolicies requires the development of themoney market, eventually leading to theemergence of a Vietnam Inter-Bank OfferRate (VNIBOR). To do so, it is crucial tominimize volatility in the level of excessreserves in the banking system. But thestabilization of reserves is made difficult bythe lack of reliable of information ongovernment cash flows. Indeed, thegovernment itself creates large demand forbank notes, but estimating how this demandwill evolve is challenging. The budgetexecution process makes it difficult toforecast future expenditures, whereas largeinflows such as petroleum income createuncertainty on the revenue side. As spendingauthorities, line ministries have depositaccounts with SOCBs, but they movedeposits from SBV to those accounts ratherunexpectedly. State Treasury deposits at thecentral and provincial levels stay within theSBV system, but those at the district leveland below are made to commercial banks,often without prior notice to SBV. On thefunding side, better coordination is neededon the issuance of government securities.While a significant volume of governmentbonds is sold by SBV on behalf of MOF, anequally significant volume is issued in theform of retail bonds through MOF’s ownoutlets. Other government bonds areauctioned at the stock trading centers. It is
not clear that SBV is well informed inadvance of those other funding activities.
Strengthening the credit culture ofcommercial banks to assess credit risksrequires bringing in strategic investors, withrecognized management capacity andtechnical skills. This is already happening inthe case of JSBs; it is one of the buildingblocks of the banking reform agenda in thecase of SOCBs. Unfortunately, the stockmarket slump prompted by the stabilizationpackage adopted in March 2008 has resultedin understandable delays in the equitizationof SOCBs. There is agreement thatmaximizing efficiency should be the mainobjective, rather than maximizinggovernment revenue. But there is a concernthat selling state assets at this point wouldamount to handing them over at bargainprices to investors who would subsequentlymake handsome capital gains. And this couldresult in criticism and suspicion, potentiallyundermining the state reform process.However, as the economy stabilizes, thegovernment should try to put SOCBequitization back on track.
Last but not least, authorities need to be ableto quickly identify borrower stress and weakbank portfolios so as to intervene and avoidaffecting market sentiment. In this respect,Vietnam is seriously lagging behind in theimplementation of its credit rating system.As part of the banking reform roadmap, in2005 it was decided that banks had toclassify all their loans based on a series ofquantitative performance indicators,including the number of days a loan wasoverdue and whether it had been rolled over.This was in line with the Basel I agreement.Banks were also instructed, within threeyears, to adopt a credit rating system well
CAPITAL MATTERS
122

suited to their customer base. The threeyears elapsed in May 2008, but only a coupleof commercial banks have abided. Settingup these qualitative credit rating systems,having them certified, and linking them toSBV, so as to have a real time picture of thestress faced by the banking system, is anurgent priority.
Improvements in accounting standards areneeded as well. Two kinds of systemic riskremain hidden under Vietnamese standards.Currently, assets and liabilities in foreigncurrency need to be converted into dong, butthey do not need to be identified separately.Based on financial reports, it is thereforeimpossible to tell whether an enterprise or abank is exposed to exchange rate risk. Or,put differently, whether it would suffer froman appreciation or a depreciation of thedong. Second, Vietnamese standards do notrequire “marking to market”. This meansthat the value of assets is recorder at facevalue, or at purchase price, not at marketprice. For example, if a commercial bankholds government bonds and these aretrading substantially below par, marking tomarket would reveal a loss. But underVietnamese standards the bank could stilllook very profitable. Marking to market isdifficult in the case of property, but feasiblein the case of financial assets.
Better credit rating systems and improvedaccounting standards should help identifywhich individual banks are facingdifficulties, but they are less well-suited toassess systemic risk. Consider, for instance,the quality of lending for real estate andurban development in the midst of a realestate bubble. As long as property priceskeep going up, the level of credit risk will
look tolerable. If anything, marking tomarket will increase the fraction of loansbeing classified as safe. However, creditrisk could increase dramatically if the bubblewas to burst. Assessing this kind of riskrequires a different approach, known asstress test. In this case, an apparentlyhealthy bank portfolio is subject tohypothetical shocks (a collapse in propertyprices, an increase in interest rates) to assesswhich fraction of outstanding credit would beat risk. In a context of increased turbulence,SBV should conduct stress tests as part of itssupervision tasks.
Communicating well
In times of financial turbulence, when marketsentiment is an important determinant offinancial decisions, adopting the rightpolicies may not be enough. It is alsonecessary to make sure that market playersunderstand both the situation and the policiesadopted, so as to avoid panic reactions anddangerous herd behavior. Market sentimentis particularly important in the case ofVietnam, a country which not yet perceivedby everybody as a market economy. Historicreasons, influencing the way in whichgovernment decisions are made andcommunicated, may easily result inmisunderstandings. And unwarrantedperceptions may easily become true, simplybecause financial markets are vulnerable toself-fulfilling prophecies.
Vietnam was perhaps close to one of thoseself-fulfilling prophecies around end-May2008. Despite the fact that a contractionarypolicy had been put in place by end-February, and a comprehensive stabilizationpackage had been announced by end-March,there was considerable uncertainty
ENSURING STABILITY
123

regarding their effectiveness at containingthe surge in inflation and reducing aballooning trade deficit. The country riskpremium, measured through the price offive-year Credit Default Swaps (CDS) wasincreasing steadily. A large devaluation ofthe dong was also expected, according to theone-year Non-Deliverable Forward (NDF)exchange rate. And none of the importantpolicy measures announced by thegovernment seemed to be able to make adent in these trends (Figure 11.2). Thevolume of transactions on these twoinstruments may not have been large, andmany of those involved were probablyforeign holders of Vietnamese bonds. Butthe message was unambiguous.
On the other hand, these trends ended upbeing sensitive to more “sensational” news.On May 29, 2008, a note by the research unitof an investment bank claimed that Vietnamwas heading towards a currency crisis. Thissent the NDF skyrocketing, to 22,500 dongper dollar, against the official 16,069 dongexchange rate. In early June, consensus by
participants at the highly visible mid-yearCG meeting that the stabilization packagewas working marked a turning point forCDS. A few days later, on June 28, at avideo-conference with investors fromaround the world, the government explainedits policy stance and for the first time everpublicly announced the level of itsinternational reserves. This was formally inviolation of the Law on State Secrets, but theimpact justified such a bold step, as the NDFplummeted.
Since then, the global financial crisis hasexacerbated perceptions about risk, pushingthe CDS up considerably. But it is encouragingthat the government has taken other importantsteps to increase policy transparency andimprove communication with markets andwith the public at large. In particular, Vietnamis by now current in its data reporting for theIMF’s International Financial Statistics. Andthe level of international reserves is nottreated as a secret anymore.
However, communication is an area wherethere is still room for improvement. Much of
CAPITAL MATTERS
124
12,000
14,000
16,000
18,000
20,000
22,000
24,000
26,000
28,000
30,000
2-Jan
-08
13-Fe
b-08
26-M
ar-08
7-May
-08
18-Ju
n-08
30-Ju
l-08
11-Se
p-08
23-O
ct-08
NDF
-VND
per$
,12
mon
ths
forw
ard
100
150
200
250
300
350
400
450
500
CDS,
coun
tryris
kpr
emium
inba
sispo
ints
NDF - 12 M CDS - 5 YR
Credittighteningbegins
8-pointpackageannounced
basic interest rateraised to 14%basic interest
rate raised to 12%
12,000
14,000
16,000
18,000
20,000
22,000
24,000
26,000
28,000
30,000
2-Jan
-08
13-Fe
b-08
26-M
ar-08
7-May
-08
18-Ju
n-08
30-Ju
l-08
11-Se
p-08
23-O
ct-08
NDF
-VND
per$
,12
mon
ths
forw
ard
100
150
200
250
300
350
400
450
500
CDS,
coun
tryris
kpr
emium
inba
sispo
ints
NDF - 12 M CDS - 5 YR
Video-conferencewith investors
Mid-term CGmeeting
Figure 11.2: Good policies are not enough
Source: World Bank.

the communication effort still relies on theannouncement of a growth target for GDP.This is certainly a succinct way for outsidersto assess whether the priority of thegovernment is to stabilize the economy or tosupport economic growth. But a target is notthe same as a forecast. More importantly, atarget is not particularly informative aboutthe concrete policies the government plansto adopt to reach it.
There is of course the expectation that lowgrowth targets will be associated with lessambitious investment plans, and thereforewith a more cautious fiscal policy stance.But in this respect, a much more effective ofcommunicating would be to produce timelyand reliable budget data. At present, as wasdiscussed earlier in this report, it is difficultto tell what the actual level of the budgetdeficit is. This is partly due to discrepanciesfrom international practice especially in theway amortization of debt is treated (it iscounted as expenditure in Vietnam and as afinancing item in the rest of the world). Butthe most important shortcomings are relatedto the carryover of both revenue andexpenditure from one year to the next.
Consider, for instance, the situation in 2007.Even after computing the amortization ofdebt according to international practice, thelevel of the budget deficit appeared to bequite high, at 5.6 percent of GDP. However,if the deficit is measured through thefinancial resources that had to be mobilizedto bridge it (domestic and foreign debt, plusbanking credit) it appears to be much moremodest, probably in the order of 2.2 percentof GDP. The difference between these twofigures is mainly due to revenue carryover.In other words, in 2006 the governmentended up spending less than it had planned
(for instance, due to poor projectimplementation) and resources stood idle ina Treasury account. The carryover could beparticularly important in 2008, a year whenmany contractors for public investmentprojects walked away due to the high cost ofcement and other construction materials.
If the government of Vietnam wants toimprove the communication of its policies andavoid potentially costly misunderstandingswith market participants, it should do forbudget statistics what it recently did forfinancial sector statistics. Namely, it shouldproduce them and release them in a timelyfashion, according to accepted internationalstandards. Doing so will be more difficultthan in the case of financial statistics, due tothe poor monitoring of the implementation ofpublic investment projects. This is an areawhere short term macroeconomic policymeets medium-term economic reform.
Social impacts
Stability has a social dimension as well. Thesurge in food and oil prices since late 2007,and the acceleration of inflation morebroadly, had an impact on the wellbeing ofmany Vietnamese households. Vietnam is anet exporter of food, and its foreign sales ofcrude oil roughly match its foreign purchasesof gasoline, implying that at an aggregatelevel the country gained from high foodprices and was not adversely affected byhigh fuel prices. Households producing foodfor the market were clearly better off. But amajority of households do not produce foodand all of them are buyers when it comes togasoline. Microeconomic simulations usingindividual records from the 2006 VHLSSsuggest that 51 percent of all households and86 percent of urban households are worse off
ENSURING STABILITY
125

when the price of rice increases. On theother hand, the deceleration of growthassociated with the stabilization policy first,and with the global financial turbulencelater, could result in jobs being lost or notbeing created rapidly enough to absorb thelarge number of entrants into the labormarket.
Ensuring stability involves addressing thesehardships. Failure to do so would not only bequestionable on ethical grounds: it could alsoundermine popular support for criticallyimportant policy choices. But effectivelymitigating the losses experienced byaffected households is difficult in practice.
The standard economic response is to providecash transfers which are commensurate withthe losses, at least in the case of poorerhouseholds. More recently, it has becomecommon to condition those transfers on thebeneficiary households taking actions whichare considered socially desirable, such askeeping their children in school. However,poverty reduction in Vietnam has not relied toany large extent on cash transfers, conditionalor not. Cash transfers at the individual or thehousehold are seen as potentiallyundermining the sense of self-reliance, if notdirectly the work ethic. Large redistributionmechanisms are in place, but thebeneficiaries are lower levels of government,from poorer provinces to disadvantagedcommunes. Budget allocation norms andProgram 135 Phase II are clear examples ofthis approach. Support to poor householdstakes a different form, namely ensuring theircapacity to be part of the mainstream
economy. Poor households get free insurancecards, are exempted from paying school feesfor their children, and can borrow withoutusing collateral, among others.
A Vietnamese response to the hardshipscreated by macroeconomic turbulence wouldthus require that two conditions be met.First, the targeting of households facinghardship should be reliable (Box 11.2). Andsecond, a sufficient amount of resourcesshould be available to ensure that thosehouseholds effectively have access to thebenefits they are entitled to.
Other possible measures to address hardshipconcern wage setting mechanisms. In 2008,high inflation has eroded the purchasingpower of wages in urban areas, especiallyaffecting the many migrants who work inindustrial zones and live barely above thepoverty line. The current collective bargainingand dispute resolution mechanisms are toorigid to process requests for wageadjustments. This has resulted in either longdelays between price increases and wageincreases or socially costly wildcat strikes.More flexible mechanisms for workers toappoint their representatives, and swifterconciliation in the event of disagreements,would contribute to more stable realearnings and more peaceful industrialrelations at the enterprise level. A betterfunctioning collective bargaining systemshould also help cushion adverse demandshocks, when wage moderation may beneeded to preserve jobs.
With the world being more uncertain and the
CAPITAL MATTERS
126

ENSURING STABILITY
127
Box 11.2: Identifying Poor and Vulnerable Households
Local authorities are requested to classify all households in their jurisdiction into a few broadcategories, typically including: hungry, poor, near poor and well-off. Households in the “poorlist” (the first two groups) are then entitled to a series of benefits. The classification isconducted at the lowest levels of government and updated once a year. Supposedly, it isguided by objective measures including the level of monthly income per person. In practice,subjective considerations by local officials and the views of the community also play a role.This subjective or social element results in a lack of consistency regarding what it is to be“poor” in different parts of the country. For this reason, the poverty rates produced byaggregating “poor household lists” tend to be unreliable. But the actual ranking ofhouseholds within a community, and even within a similar area, is much more reliable.
At present, the quality of targeting by local authorities is hampered on three fronts:
● Unknown households. This is a serious issue in rapidly urbanizing areas, which are hometo many migrants not even know to the police. These households do not show up in povertycounts, are not included in surveys, and can not be reached to channel benefits to them. InVietnam, these unregistered households do not cluster in specific locations, but instead arespread out over urban areas that are often densely populated. In urban areas, local officialshave limited knowledge of households residing in their localities, as opposed to rural areas,where mostly everybody knows each other. The number of unknown households isprobably increasing in urban areas.
● Households moving in and out of poverty. These often define an entire “grey area” inbetween the poor and near-poor categories. Households in this “grey area” may be non-poor in one period but then see their income fall below the poverty line in the next.Macroeconomic instability most probably exacerbates those movements. But the annualhousehold classification exercise may fail to capture them.
● “Undeserving” households. Local officials in Vietnam are found to exclude people from the“poor household list” because of what they consider socially reprehensible behaviour, suchas drinking, gambling or commercial sex, even when these households would be poor byobjective criteria, such as their monthly income per person.
By excluding people from the “poor household list”, authorities not only curtail their accessto benefits, they also distort poverty counts. This may not be the only source of bias though.Local authorities may be tempted to overestimate the number of poor, in the hope to attractmore resources. There is also anecdotal evidence of local officials underestimating thenumber of poor to demonstrate good performance.
These biases may be resolved by anchoring district-level aggregates of the “poor householdlist” to small-area estimates (SAE) of poverty. SAEs, also known as poverty maps, could beused to determine the budget allocation across provinces and districts, while “poorhousehold lists” would determine how district budgets are distributed further down, tocommunes, villages and households.
The use of poverty maps, however, would not resolve the three forms of exclusion listedabove. Perhaps a way to address them is to give households the opportunity to request are-assessment of their poverty status, in between scheduled assessments, if they considerthemselves poor but for any reason they have not been classified as such.

Vietnamese economy being more exposedto it, the risk of facing macroeconomicinstability is higher. This may result in aquestioning of the merits of globalintegration, which would be a mistake.Global integration has been one of the mainforces behind poverty reduction and a driverof economic reforms across a range ofsectors. Importantly, given the level of thedomestic savings rate, capital from abroadwill be needed for Vietnam to sustain rapideconomic and become an industrial countrywithin one generation. Finding acceptableways to mitigate the impact of fluctuations inworld prices, and monitoring capital inflowsin terms of their objective and time horizon,are defensible moves. But going beyondthat point could hamper Vietnam’s ability toattract the long-term capital it so much needs.To ensure macroeconomic stability, aninvestment program reconciling Vietnam’sneeds with the availability of long-termresources is needed. In the short term, thereconciliation will have to rely onmacroeconomic policy tools. Fiscal policy isone of them. In this respect, the successfulexperience with adjustment in 2008, when anumber of poorly performing projects wheredelayed or stopped, opens the door for abetter management of state-fundedinvestments. However, investment efficiencydepends on microeconomic policies muchmore than on macroeconomic rules. A
review of the investment cycle, from fundingto implementation, suggests several areas forimprovement. The shortage of long-termfinance and the lack of a proper institutionalframework for private participation ininfrastructure are the main shortcomings onthe funding side. Weakness in the preparation,appraisal and monitoring of budget-fundedprojects, and the possibility for EconomicGroups and large State Corporations to controlfinancial institutions, are the mainshortcomings on the implementation side.
Preserving integration
With the balance of payments as the mainsource of instability for the Vietnameseeconomy, the temptation to reconsiderglobal integration may arise. Massive capitalinflows were at the root of overheating inlate 2007. The surge in the internationalprice for rice fanned the flames of an alreadyhigh inflation in early 2008. Since then,market sentiment has been volatile and theglobal financial crisis is putting new strainson the Vietnamese economy. In light ofthese developments, and aware of thecontinued global turbulence ahead, somemay wonder whether the benefits fromglobal integration outweigh its costs.
Backtracking on international integrationwould be a mistake, however. Becoming afull member of the global economy has
128
12. SUSTAINING GROWTH

enormously contributed to economic growthand job creation in Vietnam. From theincreasing commercialization of agriculturalproduction to the development of labor-intensive manufacturing, participating inworld markets has helped reduce povertyrapidly. Commitments made to accede to theWTO have exposed sectors previouslydominated by large State Corporations tohealthy competition. International agreementsalso served to “lock in” economic reformsand induce policy improvements across theeconomy. FDI would not have grown as fastas it did since 2006 had it not been for thesignal that accession to the WTO sent to theworld, regarding the commitment of thegovernment to economic reform. Even thesurge in the international price of rice,certainly detrimental to urban populationgroups, was beneficial to rural households inthe deltas, many of whom are still poor.
The way in which the surge in theinternational price of rice was handled byseveral Asian countries is telling in thisrespect. Out of an understandable concernfor food security, India, Vietnam and thePhilippines took measures to increase thesupply of rice available for the domesticmarket. But these restrictive measurescompounded the problem. With only afraction of the global supply of rice tradedinternationally, attempts to redirect thesupply towards the domestic marketsharply curtailed the volume of riceavailable in the already thin internationalmarket. In this context, food security forone country becomes food insecurity foranother.
In Vietnam, an export quota of 4 million tonswas set up in March 2008 out of concern forfood security. Later in the month the
Vietnam's Food Association issued a seriesof regulations on compulsory registration ofrice export contracts. Each exporter wasallowed to register first-6-month exportstotaling no more than half of its average totalrice exports in 2006 and 2007. In April, aban on new rice export contracts wasimposed until June, in the anticipation ofpossible losses of spring crop in the North.By May, the domestic price of rice topped588 dollars per ton, an increase of 73 percentover March prices. The fever was mostnotable in the South - the major riceproduction and export region. Internalpreparation and consultation on a NationalFood Security Strategy was launched. InJune, the international price started todecline, and so did the domestic prices. InJuly, the rice export quota was raised to 4.5million tons, and the ban on the new riceexport contract was removed. The decisionwas made to apply an absolute value taxinstead of a tax on export values. Later, itwas announced that the tax would besuspended if the international price of ricewent below 600 dollars per ton.
Price-based mechanisms of this sort usuallycreate fewer distortions than quantity-basedinterventions, like the original export quota.If designed well, an export tax can smoothfluctuations in international prices withoutpreventing the operation of markets. Othercountries have designed relativelysophisticated mechanisms to stabilize theirexport earnings. It does not necessarilyfollow that Vietnam should go in the samedirection as those countries. But it would beimportant that any effort to mitigate thepotentially adverse impacts of globalintegration be conducted in accordance withinternational agreements, so that it is not
SUSTAINING GROWTH
129

perceived as an attempt to backtrack onglobal integration.
Perceptions matter even more in the case ofcapital flows than they do in the case of tradein goods and services. The capital account isthe potentially most volatile part of thebalance of payments, with surges in inflowsleading to overheating and sudden outflowsthreatening financial stability. Yet, attemptsto control inflows and outflows wouldseriously affect market sentiment and couldthus undermine Vietnam’s efforts to attractmore capital to speed up its economicgrowth.
Monitoring inflows
While attempts to manage capital flows couldbackfire, there is certainly scope to monitorthem better. A mechanism is in place toscreen FDI applications, and it might haveinfluenced the volume of approvals, or atleast its distribution over time. Indeed, MPIwas slower at processing applications in late2007, when the Vietnamese economy wasfacing overheating, and faster during 2008,when there were concerns about the balanceof payments. This might have been adeliberate attempt to smooth inflows, or itmight have occurred just by chance.However, there are more efficient ways tohandle the FDI flow of applications than tojust speed up or slow down the administrativeprocess.
While some FDI projects are clearlybeneficial to Vietnam, others have beenmore controversial. One recent example isthe hotly debated Van Phong Port, whichinvolved disagreements between the Koreanfirm Posco and Vinalines. Other projectshave raised environmental concerns,especially in relation to their management of
dangerous waste in the vicinity of residentialareas. Concerns have also been flagged onthe large number of FDI projects approvedfor golf courses, as they compete withagriculture for land and water, at a timewhen food security has been at stake.
In the drive towards decentralization, theauthority to approve a majority of FDIprojects now rests with provincialgovernments. But given the size of a typicalprovince, some of the adverse impacts fromthose projects may be felt elsewhere. Forinstance, a deep sea port in one provincemay reduce shipment volumes in the deepsea ports of neighboring provinces. Andwater discharges from industrial parks mayaffect downstream locations in otherprovinces as well. Keeping the FDI approvalprocess decentralized encourages healthycompetition among provinces, with each ofthem trying to improve its investmentclimate in order to attract more capital. Butit is also important to avoid drifting into whatsome commentators see as a race to thebottom. This calls for a stronger oversight ofFDI approvals by MPI, with a focus oncompliance with regional development plansand environmental impact assessments.
There is also room for improvement in themonitoring of short-term inflows. Theexperience of neighboring countries in thelate 1990s shows that currency mismatchescan result in systemic risk. As exchange rateflexibility increases, un-hedged currencymismatches in enterprises can result insubstantial losses, raising doubts about theirability to service their obligations. Suchdoubts can make banks more cautious intheir lending, potentially triggeringdangerous cycles of credit contraction,bankruptcies and capital outflows. To
CAPITAL MATTERS
130

minimize the risk of this happening in Vietnam,authorities should more systematically checkwhich banks and businesses are carrying un-hedged foreign exchange liabilities,particularly short-term ones, while havinglong-term assets.
Portfolio inflows should be monitored notonly in relation to their volume, but also totheir tenure, invested assets and type of end-borrowers. For example, to the extent thatthe foreign portfolio investment is channeledinto short-term assets such as bank depositsor money market instruments, the country’sinternational reserves should be built up tofully and readily counter their possiblereversals. On the other hand, short-termforeign currency borrowing by FDI firmsguaranteed by their parent companiesoverseas should cause less worry. Foreigncapital invested in illiquid, non-standardizedassets including stocks in the informal stockmarket should also be less dangerousbecause a panicked exit from such aninvestment, even if possible, would causesubstantial losses to the investor. The lossesor the difficulty to exit would be greater, thelarger the investor. Foreigners investing insuch assets knowingly of the risk tend to belong-term oriented.
To monitor portfolio inflows as they arechanneled through the financial sector, SBV,SSC and the Insurance Department of MOFwould need to regularly exchangeinformation and coordinate their actionsclosely. In this regard, the establishment ofa high level committee to monitor financialflows and ensure the stability of the financialsystem and the economy is a welcome actionby the Government.
Identifying the characteristics of the end
investors behind an investment manager,broker or nominee would also helpunderstand the nature of the inflows. So far,a significant part of the foreign portfolioinvestments in Vietnam’s stock market hasbeen long-term oriented. Yet, some hedgefunds have participated in the market, andthis needs to be watched closely. It is noteasy to identify end investors when thesource of money is overseas (and, therefore,outside the jurisdiction of Vietnam).However, the SSC’s tightening ofregistration and reporting requirements forrepresentative offices of foreign investmentmanagers was a good start. A strong anti-money laundering (AML) regime shouldalso help.
Investment volume
The domestic savings rate has been in theorder of 30 percent of GDP over the last fewyears. Even if those savings were investedin a very efficient way, they would probablynot be sufficient for Vietnam to become anindustrial country within one generation, asit aspires to. An alternative would be toincreasing the domestic savings rate. Butthis would be equivalent to decreasingdomestic consumption, which may not be thepreferred choice for a country that is barelyentering the middle-income group. And inany event, there is relatively little that policymakers can do to influence the savings rate;the age composition of the population andsubjective preferences play a much moreimportant role in this respect.
The only viable alternative to sustain rapidgrowth is therefore to mobilize capital fromabroad. However, in seeking externalfinance Vietnam should also take a cautiousstance, so as to avoid increasing is external
SUSTAINING GROWTH
131
debt beyond prudent levels, or becomingvulnerable to sudden reversals in capitalflows. This requires a well-consideredinvestment program that matches Vietnam’sneeds with the availability of long-termfinance.
Forecasting long-term capital inflows isdifficult, especially at a time of globalturbulence. But some components aredriven by relatively steady, structural trends.For instance, a significant portion ofremittances goes into long-term investments,mainly in real estate but also in smallbusinesses. The community of overseasVietnamese who left in the aftermath ofreunification is ageing, is prosperous, isincreasingly confident in the policiesadopted by the government, and is graduallyrenewing ties with relatives and with thecountry more broadly. Many members ofthis community are investing in Vietnam fortheir retirement. These long-term inflows,which may account for a third of totalremittances or more, can be expected tocontinue on a slightly upward trend despitethe global turbulence.
A better monitoring of capital inflows shouldalso help refine forecasts in relation to FDIand portfolio investments. In the case ofFDI, actual inflows are dominated by theimplementation of previously approvedprojects, not by the flow of new approvals.And some large projects account for a largeshare of the total. Adequate oversight intheir case should be informative of what canbe expected overall. In the case of portfolioinvestments, it is important to identify thosewhich are more prone to sudden reversal.
In practice, the reconciliation of totalinvestment and savings (both domestic and
external) is achieved, in one way or another,through macroeconomic policies. The moststraightforward way is through a flexibleexchange rate. By not intervening in theforeign exchange market, the authoritiesforce the current account deficit to be equalto the net capital inflow. However, thereconciliation is done in this case with theentire net inflow, including both long-termand short-term capital. Therefore, with aflexible exchange rate investment is higherin periods with large short-term inflows andlower in periods with capital outflows. Indeveloping countries, where short-terminflows and outflows may represent a largeshare of GDP, this results in a highervolatility of investment.
Regardless of the merits and demerits of fullexchange rate flexibility, Vietnam may notget there in the short term, or perhaps noteven in the medium term. This means thatother policy instruments will have to be usedto reconcile the level of investment with theavailability of long-term capital fromabroad. Monetary policy is an obviouscandidate, but its effectiveness is still limitedin Vietnam’s case. This is partly because amodern central bank is yet to be established,and the mechanisms for it to intervene in themoney market still need to be strengthened.But in addition, with a relatively rigidexchange rate it is difficult to control moneysupply, because sharp fluctuations in capitalmovements have an impact on liquidity.
That leaves fiscal policy as an important toolfor macroeconomic policy in the near future.And to some extent fiscal policy means publicinvestment policy. This is because trying toadjust to a change in capital inflows mainlythrough recurrent expenditures could be bothdifficult and inefficient. There are obvious
CAPITAL MATTERS
132

institutional rigidities on governmentemployment and salaries. And even if theycould be overcome, just freezing salaries ordownsizing personnel based on the availabilityof short-term resources would be baddevelopment policy, as it would underminelong-term efforts to improve human resourcemanagement in the civil service. Also, there isonly so much that can be accomplished bycanceling seminars or reducing the use ofofficial cars. Cuts across the board would leadto inefficiency and waste; reallocation ofresources across units takes time.
A promising way to increase flexibility inpublic investment policy is to build on theexperience of 2008, when the need tostabilize the economy required large cuts inpublic investment projects. In April, thegovernment instructed all state units toreview, reduce or postpone slow andinefficient projects. The relevance of theinvestment objectives, the availability offunding and the track record on performancewere identified as the basic criteria to guidethe review. Less than two months later, 28line ministries and central agencies, 43provincial governments and eight EconomicGroups and large State Corporations hadreported back on the projects to bepostponed or cancelled. There were 995 ofthem, accounting for roughly 4 trillion dong,or the equivalent of 7.8 percent of totalinvestments from the state budget. Inaddition, the issuance of off-budget funds forinvestment purposes was cut by 9 trilliondong, equivalent to one quarter of the annualplan. On the other hand, disbursements wereallowed for projects completed ahead oftime, and additional funding was madeavailable for highly effective projects in keysocio-economic areas.
This effective response could be easilyembedded into the routine management ofpublic investment projects. For instance, athree-tier system to monitor projectperformance could be established. Barringexceptional circumstances, publicinvestment projects that address urgentsocio-economic needs and are implementedaccording to schedule would not be subjectsto cuts in funding or delays. At the otherextreme, projects whose relevance isquestionable or whose track record onimplementation is weak would be subject toin-depth review, restructuring orcancellation, regardless of the availability ofresources. In between these two, therewould be a range of projects that would beallowed to continue in good times, but couldbe delayed in times of fiscal adjustment.
Investment efficiency
The volume of investment is determined atthe macroeconomic level, but its efficiencydepends on a number of decisions which aremicroeconomic in nature. The value chainanalogy is useful to link those decisions andunderstand where the largest efficiencygains can be made. Value chain analysestrace the price of a product through variousstages in its production process (say, fromthe farm gate to the consumer table)identifying the segments where a jump inprices occurs, and assessing whether thejump reflects genuine value added or ratherlimited competition. In the same spirit, themore detailed analyses presented earlier inthis report allow to decompose theinvestment process into a series of stages,including the raising of resources, theselection of investment projects and themanagement of their implementation. Atone end of this chain lie the cost of
SUSTAINING GROWTH
133

investment and at the other its returns. Theissue is then to identify what prevents highreturns from materializing.
In raising resources for investment, the maininefficiencies seem related to the shortageof long-term finance and the institutionalconstraints to develop PPPs in infrastructure.This means that investment projects withpotentially high returns may never see thelight simply due to the lack of funding.
The bond market is still thin, and willprobably remain that way in the absence of areliable yield curve. For the latter toemerge, more progress is needed inconsolidating the large number ofoutstanding series of government bonds andbills, each with limited trading. The mainobstacle in relation to private partnerships isthe absence of a specialized agency with thecapacity to foster competition aroundinvestment projects, and to identify thefinancial support needed for those projects tobe attractive when there is a perceivedviability gap.
Other sources of funding for investment arein relatively better shape, but efficiencygains are possible in their case too.
The tax system, which remains the mainsource of funding for public sectorinvestments, has seen considerableimprovements but could still do better in termsof efficiency and equity. Its workhorses, VATand EIT already have a good design, althoughboth would benefit from further simplification.But modern natural resource taxation and agenuine property tax are still missing, and thetax burden remains unevenly distributedbetween large taxpayers and the emergingdomestic private sector.
Banking credit has expanded remarkably
and its composition has changedsubstantially in recent years, with both thelending share of SOCBs and the borrowingshare of SOEs declining over time. Thenecessary improvement in this case has to dowith the monitoring of credit risk, so as torapidly identify borrowers under stress andweak lending portfolios.
The stock market has also shown enormousdynamism in recent years, and theaccomplishments should not be overshadowedby the slump associated with the stabilizationpackage first and the global financial crisislater. But several improvements can bemade at the level of the trading platforms.Perhaps the biggest contribution to arenewed vibrancy of the stock market in themedium term would come from a faster (butstill transparent) equitization of large SOEsand SOCBs.
While much can be done to increaseefficiency in the raising of resources forinvestment, the biggest weaknesses in theVietnamese value chain seem to lie in its lasttwo stages, namely the selection ofinvestment projects and the management oftheir implementation. The concern is notrelated to private investment projects,including those of SOEs operating in acompetitive environment, because in theircase the market punishes bad choices andpoor execution. The main concern is withpublic investment, because relying onmarkets as a correcting device is not alwayspossible in their case. In this respect, it isimportant to distinguish between budget-funded projects and projects by EconomicGroups and large State Corporations.
In relation to budget-funded projects,decentralization has brought the key
CAPITAL MATTERS
134

decisions closer to the beneficiaries, whichin principle should result in more relevantprojects being selected. But decentralizationhas also led to weaker project appraisal andimplementation processes. Cost-benefitanalyses are not always undertaken, and themonitoring of project execution is not strongenough to avoid substantial delays and costoverruns.
Two important measures can be adopted toremedy these shortcomings. First, a PublicInvestment Law could spell out morespecifically the steps through which lineministries and local governments need to goas they prepare, appraise and implementprojects. And second, MPI should developthe capacity to review feasibility studies andmonitor implementation. This second stepis particularly important at a time when theability to adjust investment volumes rapidlymay hold the key to macroeconomic
stability in an increasingly uncertain world.
Investments by Economic Groups and largeState Corporations may not be as inefficientas they are often portrayed. But this may owemuch to the economies of scale characterizingthe sectors they operate in. Also, theventuring of these groups into finance andreal estate during the overheating period oflate 2007 and early 2008 is to some extent areflection of wrong market signals comingfrom an inappropriate monetary policy.However, their initiatives to establish theirown banks and deposit-taking institutions area source of concern. Control over financialinstitutions would reduce the need for them todevelop genuinely bankable projects, andwould allow poor investment decisions to bepursued way beyond what is reasonable.Preventing this development is thus a priorityfrom the point of view of investmentefficiency.
SUSTAINING GROWTH
135

The word “processed” describes informallyreproduced works that may not be commonlyavailable through libraries.
ADB (Asian Development Bank), AFD(Agence Française de Développement),JICA (Japan International CooperationAgency), Korea Eximbank, KfW (KfWEntwicklungsbank), and World Bank.2008. Draft Matrix of Gaps betweenVietnam’s Procurement Regulations andthe Multilateral Banks (MDB)Requirements for Local Procurement inBorrowing Countries & OECD/DAC“International Good Practice”. Hanoi.Processed.
Akamatsu, Noritaka. 2008. Monetary Policyand Treasury Operations. World Bank,Hanoi. Processed.
Bangko Sentral ng Pilipinas. 2007. FAQ onInflation Targeting. Monetary StabilitySector.
Bank Indonesia. June 30, 2005. PressRelease: Bank Indonesia: New andEnhanced Monetary Policy Measuresunder the Inflation Targeting Framework,June 30, 2005.
Bank of Korea (2002). Monetary policy inKorea.
Bank of Thailand. 2000. Document forInflation Targeting Seminar.www.contrib.andrew.cmu.edu/~pocharo/Files/Inflation%20Targeting%20Framework1.ppt
Nguyen, Binh T. and Robert C. Vogel. 2008.Microfinance in the Lower MekongRegion: Learning to Catch Up, on-goingstudy. Asian Development Bank. 2008.
Bottelier, Pieter. 2006. China and the WorldBank: How a Partnership Was Built.Stanford Center for InternationalDevelopment Working Paper No. 277.
Cheong. 2005. Latifah Merican. Globalisationand the Operation of Monetary Policy inMalaysia. BIS papers, No. 23.
Cheshier, Scott and Jago Penrose. 2007.Top200: Industrial strategies for Viet Nam'slargest firms. United Nations DevelopmentProgramme Viet Nam, Hanoi.
Chiu, Becky and Mervyn K. Lewis. 2006.Reforming China’s State-OwnedEnterprises and Banks. Edward Elgar,Cheltenham, UK.
Comerica Bank. May 31, 2006. EconomicBrief, No. 5.
de Ferranti, David, Adam Lerrick andLawrence MacDonald. 2005. WhoNeeds the World Bank: The Future ofChina, India and the Middle-IncomeCountries? Presented at The Future ofthe World Bank: A CGD SymposiumSeptember 23, 2005. Center for GlobalDevelopment.
Dollar, David and Louis Kuijs. 2008. Interviewwith David Dollar and Louis Kuijs onChina Quarterly Update, February 2008.Retrieved 5 November, 2008, fromhttp://discuss.worldbank.org/content/interview/detail/5228/
136
BIBLIOGRAPHY
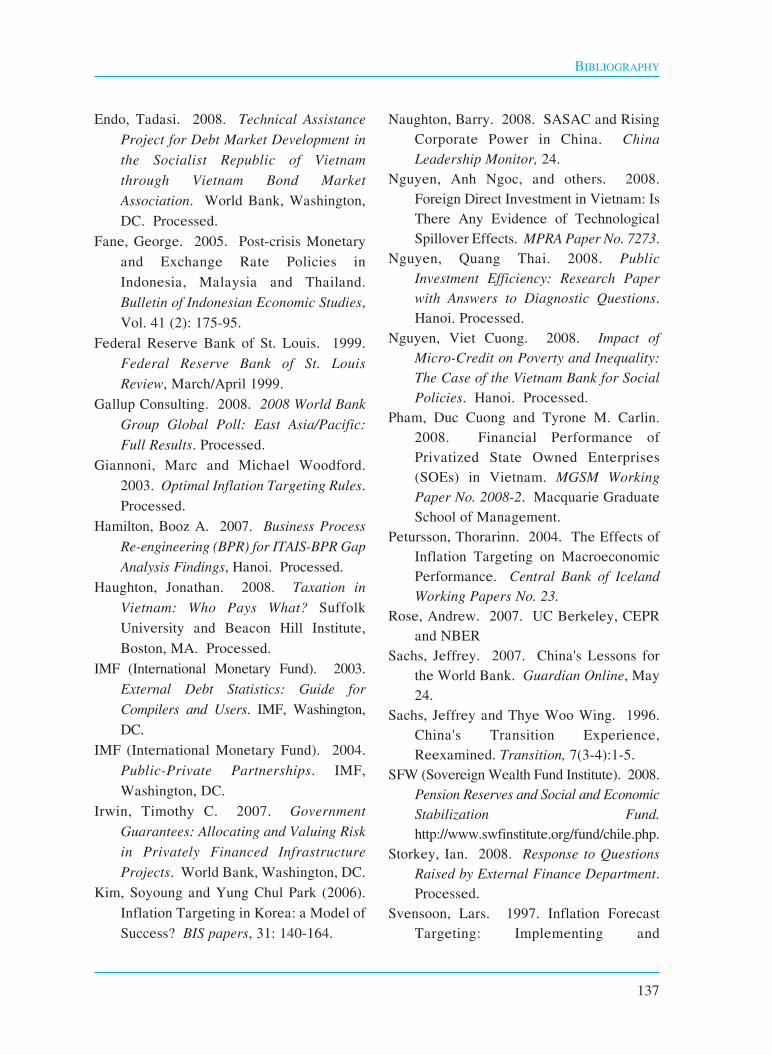
Endo, Tadasi. 2008. Technical AssistanceProject for Debt Market Development inthe Socialist Republic of Vietnamthrough Vietnam Bond MarketAssociation. World Bank, Washington,DC. Processed.
Fane, George. 2005. Post-crisis Monetaryand Exchange Rate Policies inIndonesia, Malaysia and Thailand.Bulletin of Indonesian Economic Studies,Vol. 41 (2): 175-95.
Federal Reserve Bank of St. Louis. 1999.Federal Reserve Bank of St. LouisReview, March/April 1999.
Gallup Consulting. 2008. 2008 World BankGroup Global Poll: East Asia/Pacific:Full Results. Processed.
Giannoni, Marc and Michael Woodford.2003. Optimal Inflation Targeting Rules.Processed.
Hamilton, Booz A. 2007. Business ProcessRe-engineering (BPR) for ITAIS-BPR GapAnalysis Findings, Hanoi. Processed.
Haughton, Jonathan. 2008. Taxation inVietnam: Who Pays What? SuffolkUniversity and Beacon Hill Institute,Boston, MA. Processed.
IMF (International Monetary Fund). 2003.External Debt Statistics: Guide forCompilers and Users. IMF, Washington,DC.
IMF (International Monetary Fund). 2004.Public-Private Partnerships. IMF,Washington, DC.
Irwin, Timothy C. 2007. GovernmentGuarantees: Allocating and Valuing Riskin Privately Financed InfrastructureProjects. World Bank, Washington, DC.
Kim, Soyoung and Yung Chul Park (2006).Inflation Targeting in Korea: a Model ofSuccess? BIS papers, 31: 140-164.
Naughton, Barry. 2008. SASAC and RisingCorporate Power in China. ChinaLeadership Monitor, 24.
Nguyen, Anh Ngoc, and others. 2008.Foreign Direct Investment in Vietnam: IsThere Any Evidence of TechnologicalSpillover Effects. MPRA Paper No. 7273.
Nguyen, Quang Thai. 2008. PublicInvestment Efficiency: Research Paperwith Answers to Diagnostic Questions.Hanoi. Processed.
Nguyen, Viet Cuong. 2008. Impact ofMicro-Credit on Poverty and Inequality:The Case of the Vietnam Bank for SocialPolicies. Hanoi. Processed.
Pham, Duc Cuong and Tyrone M. Carlin.2008. Financial Performance ofPrivatized State Owned Enterprises(SOEs) in Vietnam. MGSM WorkingPaper No. 2008-2. Macquarie GraduateSchool of Management.
Petursson, Thorarinn. 2004. The Effects ofInflation Targeting on MacroeconomicPerformance. Central Bank of IcelandWorking Papers No. 23.
Rose, Andrew. 2007. UC Berkeley, CEPRand NBER
Sachs, Jeffrey. 2007. China's Lessons forthe World Bank. Guardian Online, May24.
Sachs, Jeffrey and Thye Woo Wing. 1996.China's Transition Experience,Reexamined. Transition, 7(3-4):1-5.
SFW (Sovereign Wealth Fund Institute). 2008.Pension Reserves and Social and EconomicStabilization Fund.http://www.swfinstitute.org/fund/chile.php.
Storkey, Ian. 2008. Response to QuestionsRaised by External Finance Department.Processed.
Svensoon, Lars. 1997. Inflation ForecastTargeting: Implementing and
BIBLIOGRAPHY
137

Monitoring Inflation targets. EuropeanEconomic Review, 41: 111-1146
Svensoon, Lars. 2007. Inflation Targeting.The New Palgrave Dictionary ofEconomics, 2nd edition, edd. Blum,Larry and Steven Durlauf.
Sutherland, Dylan. 2007. China’s “NationalTeam” of Enterprise Groups: How HasIt Performed? University of Nottingham.China Policy Institute Discussion Paper23. University of Nottingham. ChinaPolicy Institute, Nottingham, UK.
Taylor, John. 2005. Lessons Learned fromthe Implementation of InflationTargeting. Remarks prepared for apanel discussion on “Design andLessons from the Implementation ofMonetary Policy under InflationTargeting,” at the 80th AnniversaryConference of the Bank of Mexico,November 14, 2005.
Vu, Linh and Paul Glewe. 2008. Impacts ofRising Food Prices on Poverty andWelfare in Vietnam. University ofMinesota. Department of AppliedEconomics.
Williams, Mike. 2007. Public DebtManagement Renovation in Vietnam.The Socialist Republic of VietnamPublic Financial Management ReformProject: Component 3 "StrengtheningManagement of Public Debt andMonitoring of SOE Fiscal Risks".Processed.
Williams, Mike. 2008. Institutional Arrangementsfor Effective Debt Management: WorkshopPaper. Processed.
World Bank. 1992. Commodity StabilizationFund, Working Paper WPS0835. Worldbank, Washington, DC.
World Bank. 2000. World Bank DebtorReporting System Manual. World Bank,Washington, DC.
World Bank. 2001. China: Air, Land andWater. World Bank, Washington, DC.
World Bank. 2003. China - CountryAssistance Strategy 2003-2005. WorldBank, Washington, DC.
World Bank. 2005. China: An Evaluation ofWorld Bank Assistance. World Bank,Washington, DC.
World Bank. 2006(a). Vietnam InfrastructureStrategy. World Bank, Hanoi. Processed.
World Bank. 2006(b). Corporate GovernanceCountry Assessment: Vietnam. WorldBank, Washington, DC.
World Bank. 2008a. Assessment of theVietnamese Economy and Prospects for2008-2009. World Bank, Hanoi.Processed.
World Bank. 2008b. An ExpresswayDevelopment Strategy for Vietnam:Analytical and Advisory Activity Report.Processed.
World Bank. 2008c. Leveraging PrivateCapital for Infrastructure Investments:The Case for Viability Gap Financing.Processed.
World Bank. 2008d. MacroeconomicSituation and Policy Responses. WorldBank, Hanoi. Processed.
World Bank. 2008e. Some Lessons fromDECRG Research on Financial Crises.Washington, DC. Processed.
World Bank. 2008f. Tax Policy in Vietnam:Key Issues and Reform Proposals.Hanoi. Processed.
World Bank. 2008g. Vietnam CountryFinancial Accountability Assessment.World Bank, Washington, DC.
World Bank. 2008h. VietnamInfrastructure Finance: Analytical andAdvisory Assistance (AAA) to theGovernment of Vietnam (GOV): Draftreport. Processed.
CAPITAL MATTERS
138

STATISTICALAPPENDIX
139


Population and EmploymentTable 1.1 PopulationTable 1.2 Population by localityTable 1.3 Total employment by sectors
National AccountTable 2.1 GDP by industrial origin and by economic sector in current pricesTable 2.2 A GDP by industrial origin and by economic sector in constant pricesTable 2.2 B GDP by industrial origin -- growth rateTable 2.3 A GDP deflatorTable 2.3 B Change in GDP deflatorTable 2.4A National accounts: sources and usesTable 2.4B National accounts: sources and uses
Balance of PaymentsTable 3.1 Balance of paymentsTable 3.2 Merchandise exports by commoditiesTable 3.3 Merchandise imports by commodities
Monetary SurveyTable 4.1 Monetary survey
BudgetTable 5.1 State budget revenuesTable 5.2 State budget revenues (share of GDP) Table 5.3 State budget expendituresTable 5.4 State budget expenditures (share of GDP)Table 5.5 External Debt
PricesTable 6.1 A Monthly change in consumer pricesTable 6.1 B Monthly comsumer price indexTable 6.2 A Consumer price by commodity groupsTable 6.2 B Consumer price index by commodity groups
AgricultureTable 7.1 Agriculture production in current priceTable 7.2 Agriculture production in constant priceTable 7.3 Industrial crop production and yields
IndustryTable 8.1 Industrial production outputTable 8.2 Major industrial products
STATISTICAL APPENDIX

Population GrowthYear (mid-year) Rate Male Female Urban Rural
1976 49,160 2.35 23,597 25,563 10,127 39,0331977 50,237 2.19 24,197 26,039 10,116 40,1141978 51,337 2.19 24,813 26,524 10,105 41,2261979 52,462 2.19 25,444 27,018 10,094 42,3681980 53,630 2.23 26,047 27,583 10,295 43,3351981 54,824 2.23 26,665 28,159 10,499 44,3241982 56,045 2.23 27,297 28,747 10,708 45,3361983 57,292 2.23 27,944 29,348 10,921 46,3711984 58,568 2.23 28,607 29,961 11,138 47,4291985 59,872 2.23 29,285 30,587 11,360 48,5121986 61,109 2.07 29,912 31,197 11,817 49,2921987 62,452 2.20 30,611 31,841 12,271 50,1811988 63,727 2.04 31,450 32,277 12,662 51,0651989 64,774 1.64 31,589 33,185 12,919 50,801 1990 66,017 1.92 32,203 33,814 12,880 53,136 1991 67,242 1.86 32,814 34,428 13,228 54,015 1992 68,450 1.80 33,242 35,208 13,588 54,863 1993 69,645 1.74 34,028 35,616 13,961 55,683 1994 70,825 1.69 34,633 36,191 14,426 56,399 1995 71,996 1.65 35,237 36,758 16,938 55,057 1996 73,157 1.61 35,857 37,299 15,420 57,737 1997 74,037 1.20 36,473 37,564 16,835 57,202 1998 75,456 1.92 37,090 38,367 17,465 57,992 1999 76,597 1.51 37,662 38,935 18,082 58,515 2000 77,635 1.36 38,166 39,469 18,805 58,830 2001 78,686 1.35 38,684 40,002 19,481 59,205 2002 79,727 1.32 39,197 40,530 20,004 59,723 2003 80,902 1.47 39,755 41,147 20,870 60,033 2004 82,032 1.40 40,311 41,721 21,737 60,295 2005 83,106 1.31 40,846 42,260 22,337 60,770
2006 rev 84,137 1.24 41,355 42,782 22,793 61,344 2007 est 85,155 1.21 41,855 43,300 23,370 61,785
Source : GSO (2008)
Note : Population by sex and by area may not add to the total due to the possible exclusion of the armed force and migrant workers.
Table 1.1: POPULATION
By area By sex
(Thousand persons)

TotalProvinces/ Cities Male Female Urban RuralHa Noi 3,289 1,652 1,638 2,182 1,108Hai Phong 1,828 882 946 741 1,087Ha Giang 694 344 351 76 618Tuyen Quang 738 366 372 70 668Cao Bang 523 257 266 83 440Lang Son 752 375 377 152 600Lai Chau 331 166 165 54 277Dien bien 468 235 233 77 391Lao Cai 590 294 295 123 467Yen Bai 749 371 378 147 602Bac Can 306 154 152 46 260Thai nguyen 1,138 578 560 274 864Son La 1,022 515 507 116 906Hoa Binh 830 414 416 126 703Vinh Phuc 1,190 578 613 205 985Phu Tho 1,349 663 686 214 1,135Bac ninh 1,029 502 527 136 893Bac Giang 1,609 795 813 149 1,460Quang Ninh 1,098 553 545 490 608Ha Tay 2,561 1,254 1,307 269 2,292Hai Duong 1,733 842 891 270 1,463Hung Yen 1,157 557 599 128 1,028Thai Binh 1,869 899 970 139 1,730Nam Dinh 1,991 973 1,018 323 1,668Ha Nam 825 400 425 81 744Ninh Binh 929 453 475 148 781Thanh Hoa 3,697 1,813 1,885 362 3,335Nghe An 3,103 1,520 1,584 343 2,760Ha Tinh 1,290 644 646 142 1,148Quang Binh 855 423 432 123 732Quang Tri 623 310 314 154 469Thua Thien - Hue 1,151 566 585 364 787Quang Nam 1,484 719 766 256 1,228Da Nang 805 384 422 698 107Quang Ngai 1,289 626 663 185 1,104Binh Dinh 1,579 768 811 415 1,164Phu Yen 881 438 443 179 702Khanh Hoa 1,147 570 577 467 681Ninh Thuan 575 285 290 186 389Binh Thuan 1,171 585 586 439 732Gia Lai 1,166 608 558 335 831Kon Tum 390 196 194 136 254Dac Lac 1,759 874 885 390 1,369Dac Nong 422 202 219 60 361Lam Dong 1,199 600 599 450 749Ho Chi Minh City 6,374 3,053 3,321 5,426 949Binh Duong 1,023 494 529 288 735Tay Ninh 1,054 521 533 181 873Binh Phuoc 824 420 404 126 698Dong Nai 2,253 1,120 1,134 712 1,541Baria - Vung Tau 947 476 472 419 528Long An 1,431 705 726 238 1,193Dong Thap 1,673 818 855 289 1,384An Giang 2,231 1,099 1,132 634 1,597Tien Giang 1,725 839 886 259 1,466Ben Tre 1,354 659 695 132 1,222Vinh Long 1,063 518 545 160 903Tra Vinh 1,046 511 535 152 894Can Tho 1,155 569 586 583 572Hau giang 799 394 405 133 666Soc Trang 1,284 626 658 237 1,047Kien Giang 1,705 839 866 443 1,262Bac Lieu 819 395 424 208 611Ca Mau 1,241 612 629 250 991
Note : Population by sex and by area may not add to the total due to the possible exclusion of the armed force and migrant workers.Source : GSO (2008)
Table 1.2: POPULATION BY LOCALITY(Thousand persons)
By sex By locality

rev est2001 2002 2003 2004 2005 2006 2007
Total Employment 38,563 39,508 40,574 41,586 42,527 43,339 44,172 State 3,604 3,751 4,035 4,142 4,039 3,949 3,975 Non-state 34,959 35,757 36,538 37,445 38,488 39,390 40,197
State Sector Employment 3,604 3,751 4,035 4,142 4,039 3,949 3,975Central 1,499 1,569 1,628 1,678 1,613 1,573 1,573Local 2,105 2,181 2,407 2,464 2,426 2,376 2,402
Employment by Sector Agriculture, forestry and fisheries 24,468 24,456 24,443 24,431 24,342 23,995 23,811 Industry and Construction 5,552 6,085 6,671 7,217 7,782 8,336 8,825 Services 8,542 8,967 9,460 9,939 10,402 11,008 11,536
Note : Figures are roundedSource : GSO (2008) 63.5 61.9 60.2 58.7 57.2 55.4 53.9
Table 1.3: TOTAL EMPLOYMENT BY SECTOR(Thousand persons)

rev est2001 2002 2003 2004 2005 2006 2007
Total 481,295 535,762 613,443 715,307 839,211 974,266 1,144,014 State 184,836 205,652 239,736 279,704 322,241 364,250 416,794 Non-State 296,459 330,110 373,707 435,603 516,970 610,016 727,220
Agriculture, Forestry and Fisheries 111,858 123,383 138,285 155,993 175,984 198,798 232,188 Agriculture 87,861 96,543 106,385 119,107 132,985 149,660 174,076 Forestry 6,093 6,500 7,775 9,412 10,052 10,802 12,067 Fisheries 17,904 20,340 24,125 27,474 32,947 38,335 46,045
Industry and Construction 183,515 206,197 242,126 287,616 344,224 404,697 475,680Mining 44,345 46,153 57,326 72,492 88,897 99,702 111,664Manufacturing 95,211 110,285 125,476 145,475 173,122 207,027 244,537Electricity and Water 16,028 18,201 22,224 25,091 28,929 33,464 39,862
Construction 27,931 31,558 37,100 44,558 53,276 64,503 79,617
Services 185,922 206,182 233,032 271,698 319,003 370,771 436,146Trade 67,788 75,617 83,297 96,995 113,768 132,794 156,286Hotel and Restaurant 15,412 17,154 18,472 22,529 29,329 35,861 44,953Transportation and Telecom 19,431 21,095 24,725 30,402 36,629 43,825 50,769Finance, Banking and Insurance 8,762 9,763 10,858 12,737 15,072 17,607 20,752Science and Technology 2,646 3,009 3,694 4,315 5,247 6,059 7,063Real Estate and Renting 21,589 24,452 27,287 31,304 33,635 36,814 43,509Public Administration 12,784 13,816 16,676 19,061 23,037 26,737 31,335Education and Training 16,245 18,071 21,403 23,335 26,948 30,718 34,821Healthcare and Social Welfare 6,417 7,057 8,865 10,851 12,412 14,093 16,151Culture and Recreation 2,800 2,987 3,376 3,693 4,158 4,617 5,195Party and Association 651 712 774 885 1,054 1,217 1,425Community and Social Service 10,412 11,412 12,497 14,354 16,293 18,789 21,960Private Household Employment 985 1,037 1,108 1,237 1,421 1,640 1,927
Source : GSO (2008)
Table 2.1: GDP BY INDUSTRIAL ORIGIN AND BY ECONOMIC SECTOR (VND billion at current prices)
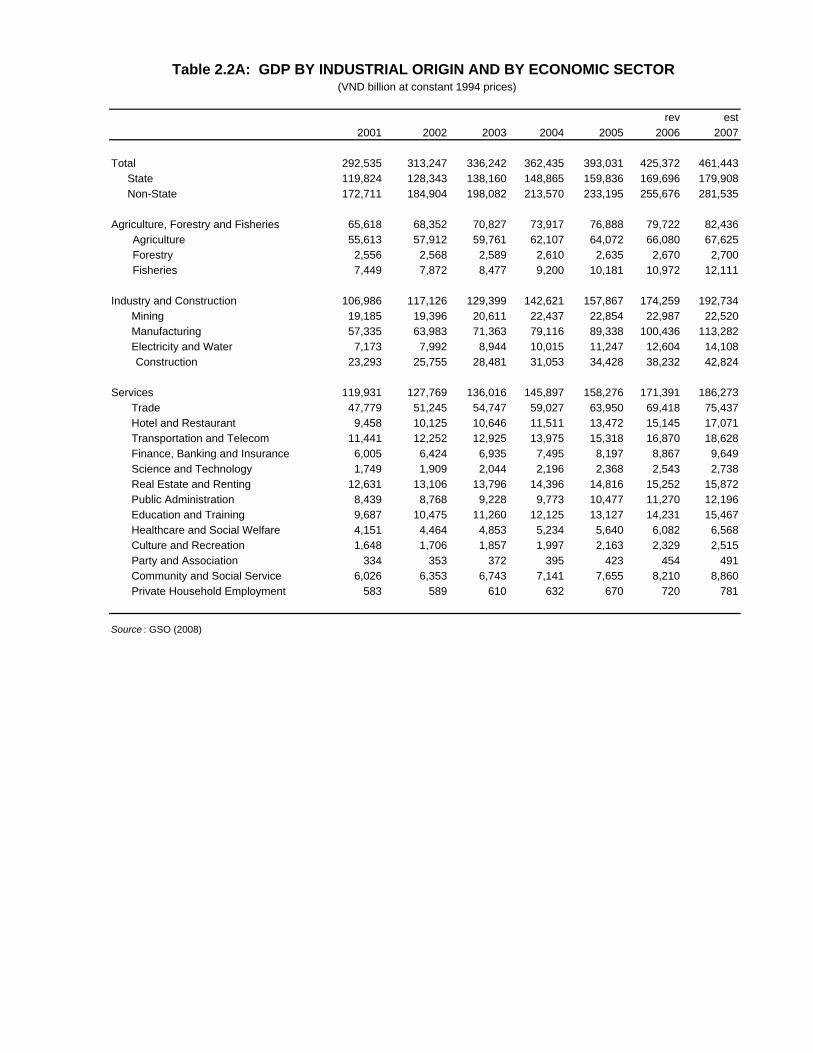
rev est2001 2002 2003 2004 2005 2006 2007
Total 292,535 313,247 336,242 362,435 393,031 425,372 461,443 State 119,824 128,343 138,160 148,865 159,836 169,696 179,908 Non-State 172,711 184,904 198,082 213,570 233,195 255,676 281,535
Agriculture, Forestry and Fisheries 65,618 68,352 70,827 73,917 76,888 79,722 82,436 Agriculture 55,613 57,912 59,761 62,107 64,072 66,080 67,625 Forestry 2,556 2,568 2,589 2,610 2,635 2,670 2,700 Fisheries 7,449 7,872 8,477 9,200 10,181 10,972 12,111
Industry and Construction 106,986 117,126 129,399 142,621 157,867 174,259 192,734Mining 19,185 19,396 20,611 22,437 22,854 22,987 22,520Manufacturing 57,335 63,983 71,363 79,116 89,338 100,436 113,282Electricity and Water 7,173 7,992 8,944 10,015 11,247 12,604 14,108
Construction 23,293 25,755 28,481 31,053 34,428 38,232 42,824
Services 119,931 127,769 136,016 145,897 158,276 171,391 186,273Trade 47,779 51,245 54,747 59,027 63,950 69,418 75,437Hotel and Restaurant 9,458 10,125 10,646 11,511 13,472 15,145 17,071Transportation and Telecom 11,441 12,252 12,925 13,975 15,318 16,870 18,628Finance, Banking and Insurance 6,005 6,424 6,935 7,495 8,197 8,867 9,649Science and Technology 1,749 1,909 2,044 2,196 2,368 2,543 2,738Real Estate and Renting 12,631 13,106 13,796 14,396 14,816 15,252 15,872Public Administration 8,439 8,768 9,228 9,773 10,477 11,270 12,196Education and Training 9,687 10,475 11,260 12,125 13,127 14,231 15,467Healthcare and Social Welfare 4,151 4,464 4,853 5,234 5,640 6,082 6,568Culture and Recreation 1,648 1,706 1,857 1,997 2,163 2,329 2,515Party and Association 334 353 372 395 423 454 491Community and Social Service 6,026 6,353 6,743 7,141 7,655 8,210 8,860Private Household Employment 583 589 610 632 670 720 781
Source : GSO (2008)
Table 2.2A: GDP BY INDUSTRIAL ORIGIN AND BY ECONOMIC SECTOR (VND billion at constant 1994 prices)

rev est2001 2002 2003 2004 2005 2006 2007
Total 6.9 7.1 7.3 7.8 8.4 8.2 8.5 State 7.4 7.1 7.6 7.7 7.4 6.2 6.0 Non-State 6.5 7.1 7.1 7.8 9.2 9.6 10.1
Agriculture, Forestry and Fisheries 3.0 4.2 3.6 4.4 4.0 3.7 3.4 Agriculture 2.1 4.1 3.2 3.9 3.2 3.1 2.3 Forestry 0.5 0.5 0.8 0.8 1.0 1.3 1.1 Fisheries 11.5 5.7 7.7 8.5 10.7 7.8 10.4
Industry and Construction 10.4 9.5 10.5 10.2 10.7 10.4 10.6Mining 4.1 1.1 6.3 8.9 1.9 0.6 -2.0Manufacturing 11.3 11.6 11.5 10.9 12.9 12.4 12.8Electricity and Water 13.2 11.4 11.9 12.0 12.3 12.1 11.9
Construction 12.8 10.6 10.6 9.0 10.9 11.0 12.0
Services 6.1 6.5 6.5 7.3 8.5 8.3 8.7Trade 7.0 7.3 6.8 7.8 8.3 8.6 8.7Hotel and Restaurant 6.7 7.1 5.1 8.1 17.0 12.4 12.7Transportation and Telecom 6.6 7.1 5.5 8.1 9.6 10.1 10.4Finance, Banking and Insurance 6.3 7.0 8.0 8.1 9.4 8.2 8.8Science and Technology 11.3 9.1 7.1 7.4 7.8 7.4 7.7Real Estate and Renting 3.3 3.8 5.3 4.3 2.9 2.9 4.1Public Administration 5.2 3.9 5.2 5.9 7.2 7.6 8.2Education and Training 5.7 8.1 7.5 7.7 8.3 8.4 8.7Healthcare and Social Welfare 5.2 7.5 8.7 7.9 7.8 7.8 8.0Culture and Recreation 2.9 3.5 8.9 7.5 8.3 7.7 8.0Party and Association 5.4 5.7 5.4 6.2 7.1 7.3 8.1Community and Social Service 5.1 5.4 6.1 5.9 7.2 7.3 7.9Private Household Employment 2.8 1.0 3.6 3.6 6.0 7.5 8.5
Source : GSO (2008)
Table 2.2B: GDP BY INDUSTRIAL ORIGIN -- GROWTH RATE(Percent)

rev est2001 2002 2003 2004 2005 2006 2007
Total 1.6 1.7 1.8 2.0 2.1 2.3 2.5 State 1.5 1.6 1.7 1.9 2.0 2.1 2.3 Non-State 1.7 1.8 1.9 2.0 2.2 2.4 2.6
Agriculture, Forestry and Fisheries 1.7 1.8 2.0 2.1 2.3 2.5 2.8 Agriculture 1.6 1.7 1.8 1.9 2.1 2.3 2.6 Forestry 2.4 2.5 3.0 3.6 3.8 4.0 4.5 Fisheries 2.4 2.6 2.8 3.0 3.2 3.5 3.8
Industry and Construction 1.7 1.8 1.9 2.0 2.2 2.3 2.5Mining 2.3 2.4 2.8 3.2 3.9 4.3 5.0Manufacturing 1.7 1.7 1.8 1.8 1.9 2.1 2.2Electricity and Water 2.2 2.3 2.5 2.5 2.6 2.7 2.8
Construction 1.2 1.2 1.3 1.4 1.5 1.7 1.9
Services 1.6 1.6 1.7 1.9 2.0 2.0 2.0Trade 1.4 1.5 1.5 1.6 1.8 1.9 2.1Hotel and Restaurant 1.6 1.7 1.7 2.0 2.2 2.4 2.6Transportation and Telecom 1.7 1.7 1.9 2.2 2.4 2.6 2.7Finance, Banking and Insurance 1.5 1.5 1.6 1.7 1.8 2.0 2.2Science and Technology 1.5 1.6 1.8 2.0 2.2 2.4 2.6Real Estate and Renting 1.7 1.9 2.0 2.2 2.3 2.4 2.7Public Administration 1.5 1.6 1.8 2.0 2.2 2.4 2.6Education and Training 1.7 1.7 1.9 1.9 2.1 2.2 2.3Healthcare and Social Welfare 1.5 1.6 1.8 2.1 2.2 2.3 2.5Culture and Recreation 1.7 1.8 1.8 1.8 1.9 2.0 2.1Party and Association 1.9 2.0 2.1 2.2 2.5 2.7 2.9Community and Social Service 1.7 1.8 1.9 2.0 2.1 2.3 2.5Private Household Employment 1.7 1.8 1.8 2.0 2.1 2.3 2.5
Source : GSO (2008)
(Percent)Table 2.3A: GDP DEFLATOR
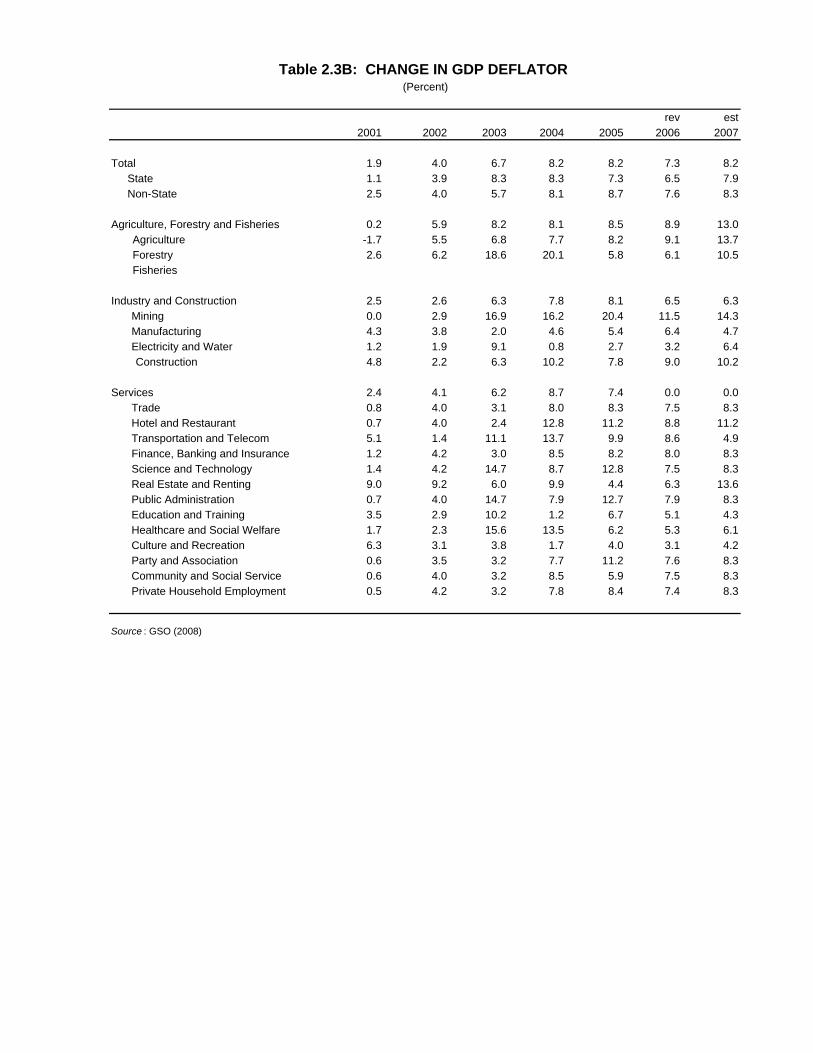
rev est2001 2002 2003 2004 2005 2006 2007
Total 1.9 4.0 6.7 8.2 8.2 7.3 8.2 State 1.1 3.9 8.3 8.3 7.3 6.5 7.9 Non-State 2.5 4.0 5.7 8.1 8.7 7.6 8.3
Agriculture, Forestry and Fisheries 0.2 5.9 8.2 8.1 8.5 8.9 13.0 Agriculture -1.7 5.5 6.8 7.7 8.2 9.1 13.7 Forestry 2.6 6.2 18.6 20.1 5.8 6.1 10.5 Fisheries
Industry and Construction 2.5 2.6 6.3 7.8 8.1 6.5 6.3Mining 0.0 2.9 16.9 16.2 20.4 11.5 14.3Manufacturing 4.3 3.8 2.0 4.6 5.4 6.4 4.7Electricity and Water 1.2 1.9 9.1 0.8 2.7 3.2 6.4
Construction 4.8 2.2 6.3 10.2 7.8 9.0 10.2
Services 2.4 4.1 6.2 8.7 7.4 0.0 0.0Trade 0.8 4.0 3.1 8.0 8.3 7.5 8.3Hotel and Restaurant 0.7 4.0 2.4 12.8 11.2 8.8 11.2Transportation and Telecom 5.1 1.4 11.1 13.7 9.9 8.6 4.9Finance, Banking and Insurance 1.2 4.2 3.0 8.5 8.2 8.0 8.3Science and Technology 1.4 4.2 14.7 8.7 12.8 7.5 8.3Real Estate and Renting 9.0 9.2 6.0 9.9 4.4 6.3 13.6Public Administration 0.7 4.0 14.7 7.9 12.7 7.9 8.3Education and Training 3.5 2.9 10.2 1.2 6.7 5.1 4.3Healthcare and Social Welfare 1.7 2.3 15.6 13.5 6.2 5.3 6.1Culture and Recreation 6.3 3.1 3.8 1.7 4.0 3.1 4.2Party and Association 0.6 3.5 3.2 7.7 11.2 7.6 8.3Community and Social Service 0.6 4.0 3.2 8.5 5.9 7.5 8.3Private Household Employment 0.5 4.2 3.2 7.8 8.4 7.4 8.3
Source : GSO (2008)
Table 2.3B: CHANGE IN GDP DEFLATOR (Percent)

rev est2001 2002 2003 2004 2005 2006 2007
Sources 492,277 563,446 664,671 769,307 874,299 1,023,441 1,297,699 GDP 481,295 535,762 613,443 715,307 839,211 974,266 1,144,015 Trade Balance 10,982 27,684 51,228 54,000 35,088 49,175 153,684
Uses 492,277 563,446 664,731 769,307 874,299 1,023,441 1,297,699 Total Consumption 342,607 382,137 445,221 511,221 584,793 675,916 811,321 Gross Capital Formation 150,033 177,983 217,434 253,686 298,543 358,629 476,450 Statistical Discrepancy -363 3,326 2,076 4,400 -9,037 -11,104 9,928
Source : GSO (2008)
rev est2001 2002 2003 2004 2005 2006 2007
Sources 304,230 334,640 367,691 392,558 417,469 455,924 540,572 GDP 292,535 313,247 336,243 362,435 393,031 425,373 461,443 Trade Balance 11,695 21,393 31,448 30,123 24,438 30,551 79,129
Uses 304,232 334,640 367,691 392,558 417,469 455,924 540,572 Total Consumption 210,029 225,610 243,515 260,940 280,104 303,520 332,456 Gross Capital Formation 92,487 104,256 116,623 128,916 143,291 160,247 199,011 Statistical Discrepancy 1,716 4,774 7,553 2,702 -5,926 -7,843 9,105
Source : GSO (2008)
Table 2.4A: NATIONAL ACCOUNTS: SOURCES AND USES (VND billion at current prices)
(VND billion at constant 1994 prices)Table 2.4B: NATIONAL ACCOUNTS: SOURCES AND USES

rev est2001 2002 2003 2004 2005 2006 2007
Current Account Balance 682 -604 -1,931 -1,591 -561 -163 -6,992Trade Balance 481 -1,054 -2,581 -3,854 -2,439 -2,776 -10,360
Exports, f.o.b. 15,027 16,706 20,149 26,485 32,447 39,826 48,561Imports, f.o.b. 14,546 17,760 22,730 30,339 34,886 42,602 58,921
Non-Factor Services (net) -572 -750 -778 61 -296 -8 -894Receipts 2,810 2,948 3,272 3,867 4,176 5,100 6,030Payments 3,382 3,698 4,050 3,806 4,472 5,108 6,924
Investment Income (net) -477 -721 -811 -891 -1,206 -1,429 -2,168Receipts 318 167 125 188 364 668 1,093Payments 795 888 936 1,079 1,570 2,097 3,261
Transfers (net) 1,250 1,921 2,239 3,093 3,380 4,050 6,430Private 1,112 1,790 2,100 2,919 3,150 3,800 6,180Official 138 131 139 174 230 250 250
Financial Account Balance 371 2,090 3,305 2,753 3,083 2,987 17,541Net FDI Inflows 1,300 1,400 1,450 1,610 1,889 2,315 6,550Medium and Long-Term Loans (net) 268 66 457 1,162 921 1,025 2,045
Disbursements 0 1,102 1,540 2,047 2,031 2,260 3,397 Amortization 0 1,036 1,083 885 1,110 1,235 1,352
Portfolio Investment 0 0 0 0 861 1,313 6,243Short-Term Capital (net) -1,197 624 1,398 -19 -588 -1,666 2,703
NFA of Commercial Banks -1,197 624 1,372 35 -634 -1,636 2,624Errors and Omissions -847 -1,038 777 -279 -391 1,398 -381
Overall Balance 206 448 2,151 883 2,131 4,222 10,168Financing -206 -448 -2,151 -883 -2,131 -4,322 -10,168Change in SBV's NFA (-, increase) -194 -464 -2,151 -883 -2,131 -4,322 -10,168
Memorandum Items:Current Account Deficit (percent of GDP) 2.1 -1.7 -4.9 -3.5 -1.1 -0.3 -9.8
Source : SBV, IMF, and World Bank
Table 3.1: BALANCE OF PAYMENTS(US$ million, unless otherwise indicated)

rev est2001 2002 2003 2004 2005 2006 2007
Total Exports 15,027 16,706 20,176 26,485 32,442 39,826 48,561
Rice 625 726 721 950 1,047 1,276 1,490 Quantity (000 tons) 3,729 3,241 3,813 4,060 5,250 4,643 4,558 Average Unit Value (US$/ton) 168 224 189 234 199 275 327
Crude oil 3,126 3,270 3,812 5,671 7,373 8,265 8,488 Quantity (000 tons) 16,732 16,879 17,143 19,501 17,967 16,419 15,062 Average Unit Value (US$/ton) 187 194 222 291 410 503 564
Coal 113 156 184 355 669 915 1,000 Quantity (000 tons) 4,290 6,049 7,246 11,624 17,986 29,307 31,948 Average Unit Value (US$/ton) 26 26 25 31 37 31 31
Rubber 166 268 378 641 804 1,286 1,393 Quantity (000 tons) 308 449 433 975 587 708 715 Average Unit Value (US$/ton) 539 597 872 658 1,370 1,817 1,948
Tea 78 83 60 96 97 110 131 Quantity (000 tons) 68 75 60 99 88 106 114 Average Unit Value (US$/ton) 1,150 1,103 1,002 961 1,103 1,045 1,143
Coffee 391 322 505 641 735 1,217 1,911 Quantity (000 tons) 931 719 749 975 892 981 715 Average Unit Value (US$/ton) 420 449 674 658 824 1,241 2,674
Cashew Nut 152 209 284 436 502 504 654 Quantity (000 tons) 44 62 84 105 109 127 153 Average Unit Value (US$/ton) 3,474 3,358 3,390 4,150 4,610 3,973 4,287
Black Pepper 91 107 105 152 150 190 271 Quantity (000 tons) 57 77 74 112 109 117 83 Average Unit Value (US$/ton) 1,601 1,399 1,416 1,362 1,381 1,632 3,269
Marine Products 1,778 2,023 2,200 2,401 2,739 3,358 3,763Vegetable & Fruits 330 201 151 179 235 259 306Textiles and Garments 1,975 2,752 3,687 4,386 4,838 5,834 7,750Footwear 1,559 1,867 2,268 2,692 3,040 3,592 3,994Handicraft 235 331 367 426 569 630 825Wood Products 335 435 567 1,139 1,563 1,933 2,404Electronic and Computer Parts 709 605 855 1,075 1,427 1,708 2,154Electric Cables and Wires 154 188 292 389 523 705 883Plastic Products 134 153 154 261 350 480 711
Source : GSO (2008)
Table 3.2: MERCHANDICE EXPORTS BY COMMODITIES(US$ million)

rev prel2001 2002 2003 2004 2005 2006 2007
Total Imports 16,162 19,733 25,227 31,954 36,978 44,891 62,682
Petroleum Products 1,828 2,017 2,433 3,574 5,024 5,970 7,710 Quantity (000 tons) 8,998 9,966 9,995 11,050 11,478 11,213 12,850 Average Unit Value (US$/ton) 203 202 243 323 438 532 600
Fertilizers 404 477 628 824 641 687 1,000 Quantity (000 tons) 3,189 3,824 4,119 4,079 2,877 3,189 3,792 Average Unit Value (US$/ton) 127 125 152 202 223 216 264
Steel and Irons 965 1,334 1,657 2,573 2,931 2,936 5,112 Quantity (000 tons) 3,938 4,951 4,574 5,186 5,524 5,707 8,027 Average Unit Value (US$/ton) 245 269 362 496 531 515 637
OthersMachinery and Equipment 2,741 3,793 5,359 5,249 5,281 6,628 11,123Textile Fiber and Yarn 247 314 298 339 340 544 741Cotton 132 97 106 190 167 219 267Material for Garment & Footwear 1,590 1,711 2,034 2,253 2,282 1,951 2,152Motor Vehicles and Parts 433 604 834 904 1,193 672 1,881Motorbikes 670 422 329 452 541 557 725Pharmaceutical Materials 69 83 76 100 116 133 158Medicine 296 320 374 410 502 548 703Paper of All Kinds 159 193 230 248 362 475 600Chemicals 352 406 510 683 865 1,042 1,466Chemical Products 361 482 582 706 841 1,007 1,285Plastic Materials 495 617 785 1,191 1,456 1,866 2,057Computer and Electronic Components 666 664 975 1,342 1,706 2,048 2,958Wood - Sawn and Log 163 179 274 539 651 775 1,016Milk and Dairy Products 247 122 164 206 311 321 462Animal Feed and Materials 179 234 421 475 594 737 1,181
Source : GSO (2008)
Table 3.3: MERCHANDICE IMPORTS BY COMMODITIES(US$ million)

rev prel2001 2002 2003 2004 2005 2006 2007
Net Foreign Assets 117.6 117.4 131.4 145.8 191.1 287.9 410.4 Foreign Assets 135.9 135.9 150.5 172.3 220.5 327.0 472.3 Foreign Liabilities -18.3 -18.4 -19.1 -26.4 -29.4 -39.1 -61.9
Net Domestic Assets 162.2 211.7 279.8 390.3 499.6 634.7 908.8Domestic Credit 191.2 239.9 316.9 435.2 585.6 730.3 1,067.7 Net Claims on Government 2.1 8.8 20.1 14.9 32.5 36.5 0.0 Credit to the Economy 189.1 231.1 296.7 420.3 553.1 693.8 1,067.7
Claims on SOEs 79.7 89.5 105.4 142.9 181.3 218.5 334.2 Claims on Other Sectors 109.4 141.6 191.3 277.4 371.8 475.3 733.5
Other Items (net) -29.0 -28.2 -37.0 -44.9 -86.0 -95.6 -159.0
Total Liquidity (M2) 279.8 329.1 411.2 536.2 690.7 922.7 1,348.2of Which: Total Deposit 213.5 254.9 320.6 427.1 559.5 763.9 1,127.7Dong Liquidity 191.1 235.5 314.1 408.1 531.5 723.2 1,089.6 Currency outside Banks 66.3 74.3 90.6 109.1 131.2 158.8 220.5 Deposits 124.8 161.2 223.6 299.0 400.3 564.4 869.1Foreign Currency Deposits 88.7 93.6 97.1 128.1 159.2 199.5 258.6
Net Foreign Assets 22.9 -0.2 11.9 11.0 31.0 50.7 42.6
Net Domestic Assets 27.5 30.5 32.2 39.5 28.0 27.0 43.2Domestic Credit 23.2 25.5 32.1 37.4 34.5 24.7 46.2 Credit to the Economy 21.5 22.2 28.4 41.7 31.6 25.4 53.9
Claims on SOEs 14.0 12.3 17.8 35.6 26.9 20.5 53.0 Claims on Other Sectors 27.5 29.4 35.1 45.0 34.0 27.8 54.3
Total Liquidity (M2) 25.5 17.6 25.0 30.4 28.8 33.6 46.1of Which: Total Deposit 25.1 19.4 25.8 33.2 31.0 36.5 47.6Dong Liquidity 25.3 23.2 33.4 29.9 30.2 36.1 50.7 Currency outside Banks 27.0 12.0 22.0 20.4 20.2 21.1 38.9 Deposits 24.4 29.2 38.7 33.7 33.9 41.0 54.0Foreign Currency Deposits 26.0 5.6 3.7 32.0 24.3 25.3 29.6
Note : Data from 1999 onwards comprise the SBV, six SOCBs and 83 non-state banksSource : SBV and IMF
Table 4.1: MONETARY SURVEY
(in VND trillion, end of period)
(Annual change in percent )

rev est2001 2002 2003 2004 2005 2006 2007
A Total Revenues and Grants 103,888 121,716 158,057 198,614 238,687 264,261 315,914
I Current Revenues 100,918 118,346 145,823 180,197 219,439 244,043 282,565
I.1 Taxes 91,688 106,154 127,948 155,579 191,725 230,565 265,8621 Corporate Income Tax 33,298 36,826 47,410 56,987 75,847 100,820 103,0542 Individual Income Tax 2,058 2,338 2,951 3,521 4,234 5,181 7,4223 Land and Housing Tax 330 336 359 438 515 592 7114 License Tax 400 407 778 657 726 794 8815 Tax on the Transfer of Properties 1,191 1,332 1,817 2,607 2,797 3,363 5,6906 Tax on Land Use Right Transfer 298 327 408 640 984 1,250 2,3317 Value Added Tax 19,327 25,916 33,130 38,814 45,878 54,773 69,8998 Special Consumption Tax 6,229 7,272 8,851 12,773 15,716 17,144 17,4549 Natural Resources Tax 8,416 8,543 9,719 17,398 21,236 20,232 19,922
10 Agricultural Tax 814 772 151 130 132 120 11311 Export & Import Tax 17,458 21,915 22,374 21,614 23,660 26,296 38,38512 Other Taxes 158 170
I.2 Fees, Charges and Non-Tax 9,230 12,192 17,875 24,618 27,714 13,478 16,70313 Revenue from Discrepancy of Import Prices 116 168 133 40 0 0 014 Fees and Charges (Include Gasoline Fee) 5,120 6,016 6,483 7,765 8,135 8,008 8,51615 Rental of Land 570 459 513 1,035 1,004 1,596 2,01716 Others 3,424 5,549 10,746 15,778 18,575 3,874 6,170
II Capital Revenues 959 1,120 9,265 15,540 15,459 16,600 29,093
III Grants 2,011 2,250 2,969 2,877 3,789 3,618 4,256
B Carry-over 3,400 2,145 19,353 26,162 45,161 8,510 26,987
Source : MOF
final account
Table 5.1: STATE BUDGET REVENUES(VND billion)

est est2001 2002 2003 2004 2005 2006 2006
A Total Revenues and Grants 21.6 22.7 25.8 27.8 28.4 27.1 27.6
I Current Revenues 21.0 22.1 23.8 25.2 26.1 25.0 24.7
I.1 Taxes 19.1 19.8 20.9 21.7 22.8 23.7 23.21 Corporate Income Tax 6.9 6.9 7.7 8.0 9.0 10.3 9.02 Individual Income Tax 0.4 0.4 0.5 0.5 0.5 0.5 0.63 Land and Housing Tax 0.1 0.1 0.1 0.1 0.1 0.1 0.14 License Tax 0.1 0.1 0.1 0.1 0.1 0.1 0.15 Tax on the Transfer of Properties 0.2 0.2 0.3 0.4 0.3 0.3 0.56 Tax on Land Use Right Transfer 0.1 0.1 0.1 0.1 0.1 0.1 0.27 Value Added Tax 4.0 4.8 5.4 5.4 5.5 5.6 6.18 Special Consumption Tax 1.3 1.4 1.4 1.8 1.9 1.8 1.59 Natural Resources Tax 1.7 1.6 1.6 2.4 2.5 2.1 1.7
10 Agricultural Tax 0.2 0.1 0.0 0.0 0.0 0.0 0.011 Export & Import Tax 3.6 4.1 3.6 3.0 2.8 2.7 3.412 Other Taxes 0.0 0.0 0.0 0.0 0.0 0.0 0.0
I.2 Fees, Charges and Non-Tax 1.9 2.3 2.9 3.4 3.3 1.4 1.513 Revenue from Discrepancy of Import Prices 0.0 0.0 0.0 0.0 0.0 0.0 0.014 Fees and Charges (Include Gasoline Fee) 1.1 1.1 1.1 1.1 1.0 0.8 0.715 Rental of Land 0.1 0.1 0.1 0.1 0.1 0.2 0.216 Others 0.7 1.0 1.8 2.2 2.2 0.4 0.5
II Capital Revenues 0.2 0.2 1.5 2.2 1.8 1.7 2.5
III Grants 0.4 0.4 0.5 0.4 0.5 0.4 0.4
B Carry-over 0.7 0.4 3.2 3.7 5.4 0.9 2.4
Source : MOF
final account
Table 5.2: STATE BUDGET REVENUES(Share of GDP)

rev est2001 2002 2003 2004 2005 2006 2007
A Total Expenditures 117,285 129,434 162,150 187,353 229,092 267,575 341,418
I Current Expenditures 77,049 84,216 102,521 121,238 149,893 181,491 229,258
1 Administration Expenditure 8,734 8,599 11,359 15,901 18,761 18,994 29,2142 Expenditure on Economic Affairs & Services 6,288 7,987 8,164 10,301 11,801 15,010 20,0823 Social Expenditures 37,369 40,747 50,185 55,185 74,458 91,409 115,837
3.1 Education 12,006 13,758 17,390 20,401 22,031 33,822 43,3963.2 Training 3,426 4,086 5,491 4,942 6,580 8,376 10,3783.3 Health 4,211 4,656 5,372 6,009 7,608 12,685 16,4263.4 Science, Technology & Environment 1,625 1,852 1,853 2,362 2,584 3,235 3,6673.5 Culture 921 1,066 1,258 1,584 2,099 2,024 2,3463.6 Radio and Television 838 681 1,056 1,325 1,464 1,140 1,4103.7 Sports 483 586 648 883 879 943 1,0053.8 Population and Family Planning 434 841 666 397 483 533 6123.9 Social Subsidies 13,425 13,221 16,451 17,282 30,730 28,651 36,5974 Interest Payment 4,485 5,330 6,395 7,217 6,621 8,913 11,1005 Defence 13,058 14,409 16,278 22,892 28,9226 Public Security 5,745 6,576 7,266 11,150 13,8177 Others 20,173 21,553 7,615 11,649 14,708 13,123 10,286
II Investment Expenditure 40,236 45,218 59,629 66,115 79,199 86,084 112,160
1 Capital Expenditure 36,139 40,740 54,430 61,746 72,842 81,730 107,4402 Others 4,097 4,478 5,199 4,369 6,357 4,354 4,720
B Carry-over 2,145 4,443 16,390 34,439 10,475 22,515 20,695
Source : MOF
Table 5.3: STATE BUDGET EXPENDITURES(VND billion)
final account

rev est2001 2002 2003 2004 2005 2006 2007
A Total Expenditures 24.4 24.2 26.4 26.2 27.3 27.5 29.8
I Current Expenditures 16.0 15.7 16.7 16.9 17.9 18.6 20.0
1 Administration Expenditure 1.8 1.6 1.9 2.2 2.2 1.9 2.62 Expenditure on Economic Affairs & Services 1.3 1.5 1.3 1.4 1.4 1.5 1.83 Social Expenditures 7.8 7.6 8.2 7.7 8.9 9.4 10.1
3.1 Education 2.5 2.6 2.8 2.9 2.6 3.5 3.83.2 Training 0.7 0.8 0.9 0.7 0.8 0.9 0.93.3 Health 0.9 0.9 0.9 0.8 0.9 1.3 1.43.4 Science, Technology & Environment 0.3 0.3 0.3 0.3 0.3 0.3 0.33.5 Culture 0.2 0.2 0.2 0.2 0.3 0.2 0.23.6 Radio and Television 0.2 0.1 0.2 0.2 0.2 0.1 0.13.7 Sports 0.1 0.1 0.1 0.1 0.1 0.1 0.13.8 Population and Family Planning 0.1 0.2 0.1 0.1 0.1 0.1 0.13.9 Social Subsidies 2.8 2.5 2.7 2.4 3.7 2.9 3.24 Interest Payment 0.9 1.0 1.0 1.0 0.8 0.9 1.05 Defence 2.1 2.0 1.9 2.3 2.56 Public Security 0.9 0.9 0.9 1.1 1.27 Others (Including Salary Increase in 2007) 4.2 4.0 1.2 1.6 1.8 1.3 0.9
II Investment Expenditure 8.4 8.4 9.7 9.2 9.4 8.8 9.8
1 Capital Expenditure 7.5 7.6 8.9 8.6 8.7 8.4 9.42 Others 0.9 0.8 0.8 0.6 0.8 0.4 0.4
B Carry-over 0.4 0.8 2.7 4.8 1.2 2.3 1.8
Source : MOF
Table 5.4: STATE BUDGET EXPENDITURES(share of GDP)
final account

rev est2002 2003 2004 2005 2006 2007
Public and Publicily Guaranteed 9,413 11,383 13,505 14,208 15,641 19,253Official Creditors
Multilaterals 3,256 4,510 5,323 5,540 6,149 9,032Of Which IDA 1,100 1,476 1,744 1,780 2,010 2,422
Bilaterals 5,427 6,142 7,294 7,070 7,772 7,594Private Creditors 730 731 888 1,598 1,721 2,626
Bonds 382 382 382 1,113 1,095 1,076Commercial Banks 184 184 350 362 516 1,407Other Private 165 165 156 122 110 144
Total Long-Term DOD 9,413 11,383 13,505 14,208 15,641 19,253Disbursement 986 1,749 1,839 2,246 1,477 2,825Payment (Debt Services) 849 776 612 698 765 886
Principal 642 573 327 435 436 505Interest 207 202 285 263 329 381
Source : MOF (2008)
Table 5.5: EXTERNAL DEBT(US$ million, unless otherwise indicated)

est.Month/ Year 2001 2002 2003 2004 2005 2006 2007
January 0.3 1.1 0.9 1.1 1.1 1.2 1.2February 0.4 2.2 2.2 3.0 2.5 2.1 2.2March -0.7 -0.8 -0.6 0.8 0.1 -0.5 -0.2April -0.5 0.0 0.0 0.5 0.6 0.2 0.5May -0.2 0.3 -0.1 0.9 0.5 0.6 0.8June 0.0 0.1 -0.3 0.8 0.4 0.4 0.9July -0.2 -0.1 -0.3 0.5 0.4 0.4 0.9August 0.0 0.0 -0.1 0.6 0.4 0.4 0.6September 0.5 0.2 0.1 0.3 0.8 0.3 0.5October 0.0 0.3 -0.2 0.0 0.4 0.2 0.7November 0.2 0.3 0.6 0.2 0.4 0.6 1.2December 1.0 0.3 0.8 0.6 0.8 0.5 2.9
Source : GSO (2008)
est.Month/ Year 2001 2002 2003 2004 2005 2006 2007
January 128.3 130.4 135.3 139.6 152.9 153.0 166.0February 128.8 133.2 138.2 143.8 156.7 156.2 169.6March 127.9 132.2 137.4 144.9 156.8 155.5 169.2April 127.3 132.2 137.4 145.6 157.7 155.7 170.1May 127.0 132.6 137.2 146.9 158.5 156.7 171.4June 127.0 132.7 136.8 148.1 159.1 157.4 172.8July 126.8 132.6 136.4 148.8 159.8 158.0 174.5August 126.8 132.6 136.3 149.6 160.3 158.6 175.4September 127.4 132.8 136.4 150.1 161.5 159.1 176.3October 127.4 133.2 136.1 150.1 162.2 159.4 177.6November 127.7 133.7 137.0 150.4 162.7 160.3 179.7December 129.0 134.1 138.0 151.2 164.0 161.0 184.9
Annual Index 127.6 132.7 136.9 147.4 159.3 157.6 174.0 Annual Growth Rate (0.4) 4.0 3.2 7.7 8.1 6.9 9.2 Dec/ Dec Growth Rate 0.8 4.0 3.0 9.5 8.5 6.5 12.7
Source : GSO (2008)
Table 6.1A: MONTHLY CHANGE IN CONSUMER PRICES
Table 6.1B: MONTHLY CONSUMER PRICE INDEX
(Percent)
(January 1995 = 100)

GOODS and SERVICES Jan-07 Feb-07 Mar-07 Apr-07 May-07 Jun-07 Jul-07 Aug-07 Sep-07 Oct-07 Nov-07 Dec-07
General Index 1.1 2.2 -0.2 0.5 0.8 0.9 0.9 0.6 0.5 0.7 1.2 2.9
Food & Foodstuff 1.1 3.5 -0.4 0.5 1.0 1.0 1.6 0.9 1.0 1.1 2.1 4.2 of which: Food 1.8 2.8 -0.1 -0.1 0.6 0.4 0.5 0.9 0.9 1.1 2.7 3.0 Foodstuff 0.9 3.8 -0.6 0.7 1.0 1.4 2.3 0.9 1.3 1.2 2.0 4.7Beverage & Tobacco 1.7 2.5 -0.7 -0.2 0.2 0.2 0.3 0.5 0.1 0.4 0.4 1.3Garment, Hats, Footwear 1.0 1.3 -0.3 0.5 0.5 0.5 0.5 0.4 0.3 0.3 0.4 1.2Housing & Construction Materials 3.1 1.9 -0.1 1.0 0.9 1.3 0.7 0.2 0.4 1.5 1.9 3.3Household Appliancies 0.5 1.1 0.1 0.4 0.6 0.4 0.5 0.3 0.3 0.2 0.2 0.5Healthcare, Pharmaceutical Items 0.2 0.4 0.3 0.5 0.6 0.8 0.7 0.7 0.9 0.8 0.3 0.6Transport & Telecommunication 0.0 0.1 0.6 1.1 0.6 0.9 0.2 0.2 -0.8 0.0 0.0 4.4Educational Items 0.2 0.2 0.1 0.2 0.1 0.2 0.1 0.3 0.4 0.2 0.1 0.1Cultural and Recreation Items 0.1 2.1 -1.2 0.0 0.4 1.3 0.3 0.2 -0.9 -0.7 -0.1 0.3Goods and Other Services 0.9 2.3 -0.5 0.5 0.7 0.5 0.5 0.5 0.4 0.5 1.0 1.6
Gold -0.1 2.1 2.6 1.1 2.3 -2.0 -0.6 1.5 1.9 6.0 8.9 2.1US Dollar -0.1 -0.2 -0.1 0.1 0.2 0.3 0.2 0.2 0.6 -0.6 -0.3 -0.2
GOODS and SERVICES Jan-07 Feb-07 Mar-07 Apr-07 May-07 Jun-07 Jul-07 Aug-07 Sep-07 Oct-07 Nov-07 Dec-07
General Index 101.1 103.2 103.0 103.5 104.3 105.2 106.2 106.8 107.3 108.1 109.4 112.6
Food & Foodstuff 101.1 104.6 104.2 104.7 105.8 106.9 108.6 109.5 110.6 111.9 114.2 119.0 of which: Food 101.8 104.6 104.6 104.5 105.1 105.6 106.1 107.0 108.0 109.2 112.1 115.4 Foodstuff 100.9 104.7 104.1 104.8 105.8 107.3 109.8 110.8 112.2 113.5 115.7 121.2Beverage & Tobacco 101.7 104.2 103.5 103.3 103.5 103.7 103.9 104.5 104.5 105.0 105.4 106.6Garment, Hats, Footwear 101.0 102.3 102.0 102.5 103.0 103.5 104.0 104.4 104.8 105.1 105.5 108.9Housing & Construction Materials 103.1 105.0 104.9 105.9 106.8 108.2 109.0 109.2 109.7 111.3 113.4 113.9Household Appliancies 100.5 101.6 101.7 102.1 102.8 103.2 103.7 104.0 104.2 104.5 104.7 105.3Healthcare, Pharmaceutical Items 100.2 100.6 100.9 101.4 102.0 102.9 103.6 104.3 105.2 106.1 106.4 111.1Transport & Telecommunication 100.1 100.1 100.7 101.7 102.3 103.3 103.4 103.6 102.7 102.8 102.8 102.9Educational Items 100.2 100.4 100.5 100.6 100.7 100.9 100.9 101.2 101.6 101.8 101.9 102.2Cultural and Recreation Items 100.1 102.2 101.0 101.0 101.5 102.7 103.0 103.2 102.2 101.5 101.4 103.0Goods and Other Services 100.9 103.2 102.6 103.1 103.8 104.3 104.8 105.3 105.7 106.2 107.3 107.3
Gold 99.9 101.9 104.6 105.7 108.2 106.1 105.4 107.0 109.1 115.7 126.0 128.6US Dollar 99.9 99.7 99.6 99.7 99.8 100.1 100.3 100.5 101.1 100.4 100.2 100.0
Source : GSO (2008)
(December 2006 = 100)
Table 6.2A: CONSUMER PRICE BY COMMODITY GROUPS
TABLE 6.2B: CONSUMER PRICE INDEX BY COMMODITY GROUPS
Source : GSO (2008)
(Monthly change in percent)

rev prel2001 2002 2003 2004 2005 2006 2007
Gross Output 130,178 145,021 153,955 172,495 183,342 197,855 236,516
Crop Cultivation 101,403 111,172 116,066 131,552 134,755 145,808 174,389
Livestock 25,501 30,575 34,457 37,344 45,226 48,487 57,742
Services 3,273 3,275 3,433 3,599 3,362 3,560 4,386
Source : GSO (2008)
rev prel2001 2002 2003 2004 2005 2006 2007
Gross Output 118,990 122,150 127,628 132,888 137,112 142,711 146,811
Crop Cultivation 92,907 98,061 101,763 106,423 107,898 111,613 114,333 Food Crops 55,066 59,619 61,029 63,621 63,853 64,186 64,685 Industrial Crops 23,109 22,247 24,175 25,612 25,586 28,422 29,148
Livestock 19,283 21,200 22,907 23,439 26,108 27,907 29,201
Services 2,800 2,890 2,958 3,027 3,107 3,191 3,277
Memorandum Items:Paddy Ouput (000 tons) 32,108 34,447 34,569 36,149 35,833 35,850 35,868Cultivated Area (000 ha) 7,493 7,504 7,452 7,445 7,329 7,325 7,201 Yield (ton/ ha) 4.29 4.59 4.64 4.86 4.89 4.89 4.98
Source : GSO (2008)
Table 7.1: AGRICULTURE PRODUCTION IN CURRENT PRICE(VND billion at current prices)
Table 7.2: AGRICULTURE PRODUCTION IN CONSTANT PRICE(VND billion at constant 1994 prices)
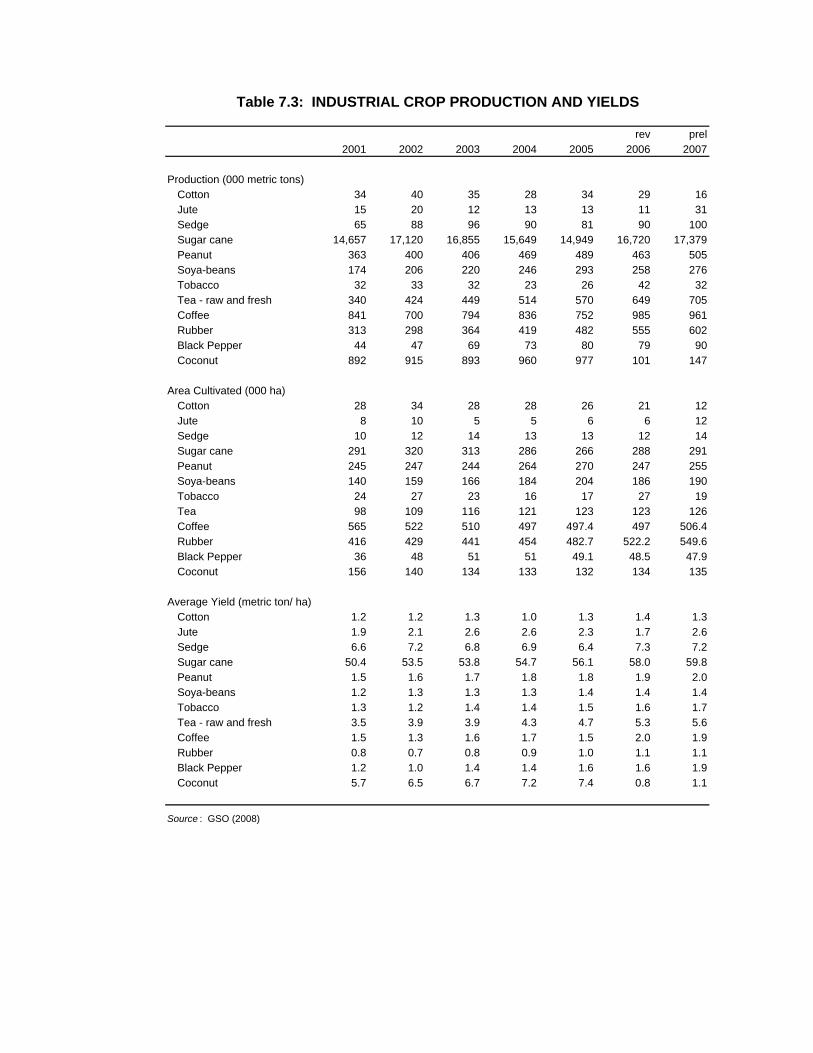
Table 7.3: INDUSTRIAL CROP PRODUCTION AND YIELDS
rev prel2001 2002 2003 2004 2005 2006 2007
Production (000 metric tons)Cotton 34 40 35 28 34 29 16Jute 15 20 12 13 13 11 31Sedge 65 88 96 90 81 90 100Sugar cane 14,657 17,120 16,855 15,649 14,949 16,720 17,379Peanut 363 400 406 469 489 463 505Soya-beans 174 206 220 246 293 258 276Tobacco 32 33 32 23 26 42 32Tea - raw and fresh 340 424 449 514 570 649 705Coffee 841 700 794 836 752 985 961Rubber 313 298 364 419 482 555 602Black Pepper 44 47 69 73 80 79 90Coconut 892 915 893 960 977 101 147
Area Cultivated (000 ha)Cotton 28 34 28 28 26 21 12Jute 8 10 5 5 6 6 12Sedge 10 12 14 13 13 12 14Sugar cane 291 320 313 286 266 288 291Peanut 245 247 244 264 270 247 255Soya-beans 140 159 166 184 204 186 190Tobacco 24 27 23 16 17 27 19Tea 98 109 116 121 123 123 126Coffee 565 522 510 497 497.4 497 506.4Rubber 416 429 441 454 482.7 522.2 549.6Black Pepper 36 48 51 51 49.1 48.5 47.9Coconut 156 140 134 133 132 134 135
Average Yield (metric ton/ ha)Cotton 1.2 1.2 1.3 1.0 1.3 1.4 1.3Jute 1.9 2.1 2.6 2.6 2.3 1.7 2.6Sedge 6.6 7.2 6.8 6.9 6.4 7.3 7.2Sugar cane 50.4 53.5 53.8 54.7 56.1 58.0 59.8Peanut 1.5 1.6 1.7 1.8 1.8 1.9 2.0Soya-beans 1.2 1.3 1.3 1.3 1.4 1.4 1.4Tobacco 1.3 1.2 1.4 1.4 1.5 1.6 1.7Tea - raw and fresh 3.5 3.9 3.9 4.3 4.7 5.3 5.6Coffee 1.5 1.3 1.6 1.7 1.5 2.0 1.9Rubber 0.8 0.7 0.8 0.9 1.0 1.1 1.1Black Pepper 1.2 1.0 1.4 1.4 1.6 1.6 1.9Coconut 5.7 6.5 6.7 7.2 7.4 0.8 1.1
Source : GSO (2008)

rev prel2001 2002 2003 2004 2005 2006 2007
Gross Industrial Output 227,342 261,092 305,080 355,624 416,563 487,256 570,771State Sector 93,434 105,119 117,637 131,655 141,117 149,951 158,341
Central 62,119 69,640 80,917 92,896 104,372 114,285 124,174Local 31,316 35,479 36,720 38,759 36,745 35,666 34,167
Non-State Sector 53,647 63,474 78,292 95,785 120,127 151,102 190,457Collectives 1,575 1,668 1,770 1,893 1,969 2,151 2,224Private, Households and Mixed 52,072 61,807 76,522 93,892 118,158 148,950 188,233
Foreign-Invested Sector 80,261 92,499 109,152 128,184 155,319 186,203 221,973
Key IndustriesCoal 2,695 3,189 3,689 4,752 6,111 6,941 7,632Oil and Gas 23,766 23,817 25,132 28,403 27,410 25,466 23,987Mining and Metal Ores 239 281 344 467 476 622 557Stones and Other Mining 2,398 3,039 3,597 3,842 4,354 4,775 4,728Food and Beverage 50,373 56,061 64,585 74,694 84,482 103,079 123,494Cigarettes and Tobacco 6,690 7,658 9,189 10,160 11,234 11,186 11,749Textile Products 10,641 12,338 14,214 16,626 19,079 23,736 28,775Garment - Apparel 6,862 8,182 10,466 12,792 15,304 19,166 23,840Leather Tanning and Processing 9,529 11,096 13,535 16,018 18,920 22,496 27,218Wood and Wood Products 3,903 4,488 5,485 6,570 8,120 8,765 9,720Paper and Paper Products 4,562 4,877 5,655 7,140 8,311 9,419 10,664Printing and Publishing 2,453 2,876 3,515 3,774 4,626 5,205 5,506Chemicals 12,852 14,714 16,323 19,029 23,848 28,688 34,096Rubber Products and Plastic 8,128 9,706 11,291 15,169 18,237 21,373 24,986Non-Metallic Products 21,625 25,913 29,855 33,483 37,055 43,793 51,319Metal Production 6,842 8,516 10,430 11,226 13,949 15,707 18,428Metallic Products 7,063 8,506 10,646 12,963 17,595 22,836 27,186Machinery and Equipment 3,421 3,711 4,612 5,371 5,495 5,561 5,847Computer and Office Equipment 977 1,003 1,538 1,846 3,206 523 7,639Electric and Electronic Equipments 5,172 6,520 7,462 9,050 11,992 15,841 20,553Radio, TV and Telecom 5,407 6,169 7,162 7,956 9,137 9,138 9,207Production & Repairing Motor Vehicles 4,265 5,774 8,306 8,692 9,753 9,344 11,714Production & Repairing Other Transport Means 7,090 8,534 9,676 12,172 15,834 20,712 25,333Furnitures 4,759 6,057 7,846 10,179 13,411 18,130 22,577Recycled Products 151 174 204 261 267 321 387Electricity and Gas 13,551 15,741 18,071 20,385 23,427 26,752 30,549Water Supply 1,152 1,328 1,361 1,409 1,570 1,756 2,018
Source : GSO (2008)
Table 8.1: INDUSTRIAL PRODUCTION OUTPUT(VND billion at constant 1994 prices)

rev prelUnit 2001 2002 2003 2004 2005 2006 2007
Assembled Automobiles unit 20,526 29,536 47,701 50,954 59,152 47,576 72,710Assembled Motorbikes 1,000 610 1,052 1,180 1,828 1,982 2,147 2,659Assembled TV Sets 1,000 1,126 1,597 2,188 2,660 2,515 2,446 2,380
Beverage mil. liters 971 940 1,119 1,343 1,461 1,547 1,845Bicycle Tires 000 Pieces 21,656 22,778 26,686 26,008 20,387 22,832 24,432
Bicycle Tubes 000 pieces 22,997 24,032 36,083 32,386 26,848 28,964 30,200Bricks mil. pieces 9,811 11,365 12,810 14,661 16,530 18,005 19,822Cement 000 tons 16,073 21,121 24,127 26,153 30,808 32,690 36,422Chemical Fertilizers 000 tons 1,270 1,158 1,294 1,714 2,190 2,183 2,424
Cigarettes mil. packs 3,075 3,375 3,871 4,192 4,485 3,941 4,298Coal mil. tons 13.4 16.4 19.3 27.3 34.1 38.8 43.2Crude oil mil. tons 16.8 16.9 17.7 20.1 18.5 16.8 15.9Diesel Engines 000 pieces 18.7 32.6 184.4 182.4 201.6 170.0 109.9Electric Engines 000 pieces 53.4 64.1 95.8 132.3 194.4 120.9 150.2
Electricity mil. kWh. 30,673 35,888 40,546 46,202 52,078 59,013 66,838Fabrics of All Kinds mil. meters 410 470 496 502 561 570 611Glass Products 000 tons 115 115 147 154 163 240 272Insecticides tons 20.0 20.7 40.9 54,523 45,877 53,113 59,151
Paper and Paper Products 000 tons 445 490 687 809 901 1,031 1,189Porcelain mil. pieces 314 284 524 404 514 407 458Rice Mill Equipment pieces 18,298 13,433 10,112 5,749 2,734 8,687 10,602Salt 000 tons 699 974 909 906 898 842 920Sawn Wood 000 m3 2,036 2,667 3,291 3,009 3,232 4,322 4,675
Soap and Detergent 000 tons 326 361 377 401 421 531 606Steel 000 tons 1,914 2,503 2,954 3,280 3,403 3,837 4,227Sugar (Refine) 000 tons 739 790 1,073 1,191 1,102 1,099 1,225Tea 000 tons 82 100 85 122 127 124 128Textile Yans 000 tons 162 227 235 241 259 269 275
Tin (Billet) Tons 1,728 1,565 1,915 2,356 1,766 2,665 2,861Transformers pieces 15,664 18,633 33,364 50,146 45,540 28,149 32,941Water Pumps for Agriculture pieces 4,238 3,578 7,787 10,038 8,298 5,118 6,293
Source: GSO (2008)
Table 8.2: MAJOR INDUSTRIAL PRODUCTS(VND billion at constant 1994 prices)