World Bank Document production began in September 1981 in the Erawan field at a ... thereby reducing...
77
Document of The World Bank . c?f> FOR OFFICIAL USE ONLY Report NO. 4201-TH STAFF APPRAISAL REPORT THAI LAND PROVINICIAL POWER DISTRIBBUTION PROJECT May i7, 1983 Proj ects Department East Asia and Pacifi c Regional Office This document hasa restricted distribution and may be used by recipients only ill the performance of their official duties. Its contents may not otherwise be disclosed without World Bank authorization. Public Disclosure Authorized Public Disclosure Authorized Public Disclosure Authorized Public Disclosure Authorized Public Disclosure Authorized Public Disclosure Authorized Public Disclosure Authorized Public Disclosure Authorized
Transcript of World Bank Document production began in September 1981 in the Erawan field at a ... thereby reducing...

Document of
The World Bank . c?f>
FOR OFFICIAL USE ONLY
Report NO. 4201-TH
STAFF APPRAISAL REPORT
THAI LAND
PROVINICIAL POWER DISTRIBBUTION PROJECT
May i7, 1983
Proj ects DepartmentEast Asia and Pacifi c Regional Office
This document has a restricted distribution and may be used by recipients only ill the performance oftheir official duties. Its contents may not otherwise be disclosed without World Bank authorization.
Pub
lic D
iscl
osur
e A
utho
rized
Pub
lic D
iscl
osur
e A
utho
rized
Pub
lic D
iscl
osur
e A
utho
rized
Pub
lic D
iscl
osur
e A
utho
rized
Pub
lic D
iscl
osur
e A
utho
rized
Pub
lic D
iscl
osur
e A
utho
rized
Pub
lic D
iscl
osur
e A
utho
rized
Pub
lic D
iscl
osur
e A
utho
rized

CURRENCY EQUIVALENTS
Currency Unit - Thai Baht (B)
US$1.00 B 23.0B 1.00 = US$0.0435
(as of April 1983)
FISCAL YEAR
October 1 to September 30
WEIGHTS AND MEASURES
km - kilometer (0.62 miles)
sq km - square kilometer (0.386 square mile)m ton - metric ton (2,204.6 pounds)kV - kilovolt (1,000 volts)
kVA - kilovolt-ampere (1,000 volt-amperes)MVA - megavolt-ampere (1,000 kilovolt-amperes)kW - kilowatt (1,000 watts)
MW - megawatt (1,000 kilowatt)k,h - kilowatt-hour (1,000 watt-hours)GWh - gigawatt-hour (1 million kilowatt-hours)cu ft - cubic foot (0.0283 cubic meter)tcf - one trillion cubic feet
MMSCFD - one million standard cuiTLc feet per dayMMBTU - one million British thermal units
ABBREVIATIONS
ADB - Asian Development Bank
ADAB - Australian Development Assistance BureauCIDA - Canadiarn International Development AgencyCPPD - Committee for Power Policy and DevelopmentEDL - Electricite du LaosEGAT - Electricity Generating Authority of ThailandKFAED - Kuwait Fund for Arab Economic DevelopmentKFW - Kreditanstalt fuir Wiederaufbau (Germany)'fEA - Metropolitan Electricity AuthorityMOF - Ministry of FinanceNREP - Normal Rural Electrification ProgramNEA - National Energy AdministrationNESDB - National Economic and Social Development BoardNEB - National Electricity Board of MalaysiaOECF - Overseas Economic Cooperation Fund (Japan)OPEC - Organization of Petroleum Exporting CountriesPEA - Provincial Electricity AuthorityPTT - Petroleum Authority of Thailand
RTG - Royal Thai Government

FOR OFFICIAL USE ONLY
THAILAND
PROVINCIAL ELECTRICITY AUTHORITY
PROVINCIAL POWER DISTRIBUTION PROJECT
Table of Contents
Page No.
I. THE ENERGY SECTOR . . . . . . . . . . . . . . . . . . . . 1
A. Energy Consumption .1... . . . . . . . . . . . . . . . IB. Energy Resources . . . . . . . . . . . . . . . . . . . . 1
Natural Gas. . . . . . . . . . . . . . . . . . . . . . 1Oil. . . . . . . . . . . . . . . . . . . . . . . . . . 1Lignite Reserves .... . . . . . . . . . . . . . . . 2Hydro Potential .... . . . . . . . . . . . . . . . 2Other Energy Resources .... . . . . . . . . . . . . 2Energy Supply Alternative ... . . . . . . . . . . . 2
C. Energy Investment Program . . . . . . . . . . . . . . . 3D. Role of the Power Sector in the Economy . . . . . . . . 3E. The Power Sector Organization . . . . . . . . . . . . . 4
General ..... . . . . . . . . . . . . . . . . . . 4The Electricity Generating Authority of Thailand
(EGAT) ...................... . 4The Metropolitan Electricity Authority (MEA). 4The Provincial Electricity Authority (PEA) . . . . . . 4Private Franchises .... . . . . . . . . . . . . . . 5Government Agencies . . . . . . . . . . . . . . . . . 5
F. Power Sector Coordination . . . . . . . . . . . . . . . 5G. Tariff Levels .... . . . . . . . . . . . . . . . . . 6H. Bank Participation in the Sector . . . . . . . . . . . . 7I. Power Market and Supply .... . . . . . . . . . . . . 7J. Degree of Electrification . . . . . . . . . . . . . . . 8K. Rural Electrification . . . . . . . . . . . . . . . . . 9L. Project Performance Audits . . . . . . . . . . . . . . . 10
II. THE BORROWER . . . . . . . . . . . . . . . . . . . . . . . . 10
A. Organization and Management . . . . . . . . . . . . . . 10B. Manpower and Training . . . . . . . . . . . . . . . . . 11C. Billing and Collections . . . . . . . . . . . . . . . . 12D. Accounting and Audit . . . . . . . . . . . . . . . . . . 12E. Taxes .13F. Insurance . . . . . . . . . . . . . . . . . . . . . . . 13G. Existing Facilities . . . . . . . . . . . . . . . . . . 13
This report was prepared by Messrs. A. Mejia and W. Cao on the basis of anappraisal conducted in July 1982.
This document has a restricted distribution and may be used by recipients only in the performance oftheir official duties. Its contents may not otherwise be disclosed without World Bank authorization.

- ii -
Page No.
III. PEA'S POWER MARKET . . . . . . . . . . . . . . . 3. . . . . . 13
A. Background . . . . . . . . . . . . . . . . . . . . . . 13B. PEA's Load Forecast . . . . . . . . . . . . . . . . . 15C. Project's Load Forecast . . . . . . . . . . .. . . . . . 16
IV. THE PROGRAM AND THE PROJECT . .. . . . . . . . .. . . . . . 17
A. PEA's Development Strategy . . . . . . . . . .. . . . . . 17B. PEA's Development Program . . . . . . . . . .. . . . . . 18C. The Project . . . . . . . . . . . . . . . . 9. . . . . . 19
Background . . . . . . . . . . . . . . . . 9. . . . . . 19Description . . . . . . . . . . . . 0. . . . . . . . . 20
Part A - Village Electrification . . . . . . . . . . . 20
Subproject Selection Criteria . . . . . . . . . . . . 21
Part B - strengthening of PEA's Operations . . . . . . 22
Cost Estimate . . . . . . . . . . . . . . . . . . . . 23Financing Plan . . . . . . . . . . . . . . . . . . . . 25Implementation ... . . . . . . . . . . . . . . . . . 25Procurement . . . . . . . . . . . . . . . . . . . . . 26Disbursement . . . . . . . . . . . . . . . . . . . . . 26Monitoring . . . . . . . . . . . . . . . . . . . . . . 26Risks .27Environmental Effects. 27
V. FINANCIAL ANALYSIS . . . . . . . . . . . . . . . . . . . . . 27
A. PEA's Financial Performance FY77 through FY81 . . . . . 27B. Future Profitability . . . . . . . . . . . . . . . . . . 29C. Tariffs .. . . . . . . . . . . . . . . . . . . . . . 30D. Financing of PEA's Development Program . . . . . . . . . 32E. Debt Control ... . . . . . . . . . . . . . . . . . . . 33F. Liquidity Position . . . . . . . . . . . . . . . . . . . 33
VI. ECONOMIC ANALYSIS . . . . . . . . . . . . . . . . . . . . . 33
Economic Rate of Return . . . . . . . . . . . . . . . . 33
VII. AGREEMENTS REACHED AND RECOMMENDATIONS . . . . . . . . . . . 35
A. Agreements . . . . . . . . . . . . . . . . . . . . . . . 35B. Recommendations .................... . 36

- iii -
ANNEXES
1. Highlights of EGAT, MEA and PEA Operations2. PEA's Organization Chart3. PEA's Market:
Table 1: Historical Evolution of PEA's MarketTable 2: PEA's Forecast of Energy Sales and Power Demands
4. PEA's Investment Program, FY82-915. Scope of Works of the NRE Program and Phases I and II6. Backlog of Applications for Electrification Under NREP as of May 19827. Cost Estimates NREP Phases I and II8. Procurement and Implementation Schedule9. Estimated Disbursement Schedule10. Description of PEA monitoring system11. PEA's Historical Financial Statements, FY77-81
Table 1: Income StatementsTable 2: Funds Flow StatementsTable 3: Balance Sheets
12. Projected Income Statements, Funds Flow, Balance Sheets, 1982-1991Tables 1 through 3: PEATables 4 through 6: EGATTables 7 thrQugh 9: MEATable 10: Power Sector - Consolidated Income Statements
13. Assumptions in Financial Forecast of PEA14. Rate of Return Calculation15. Related Documents and Data Available in Project File
MAP
IBRD 16683


THAILAND
PROVINCIAL ELECTRICITY AUTHORITY
PROVINCIAL POWER DISTRIBUTION PROJECT
I. THE ENERGY SECTOR
A. Energy Consumption
1.01 Total commercial energy consumption in Thailand has increased from5.9 million tons of oil equivalent in 1970 to over 16.2 million tons of oilequivalent in 1981, an average annual growth rate of 8.8%. In 1981, petrol-eum products accounted for 71% of total energy. Indigenous resources haveaccounted for the rest of total energy consumption, with fuelwood/charcoal,bagasse, hydro, and lignite forming 13%, 7%, 5% and 4% shares, respectively.The price of crude oil has increased almost twelvefold since 1972 and hasbecome a heavy burden on the Thai economy. After the second oil shock, theshare of Thailand's energy imports in total imports increased to 31%, and 45%of the economy's export earnings were required to finance energy imports alonein 1980.
B. Energy Resources
Natural Gas
1.02 Natural gas reserves in the Gulf of Thailand are currently esti-mated to amount to about 20 trillion cubic feet (tcf) of which about 4 tcfare proven. Gas production began in September 1981 in the Erawan field at arate of 70-80 million standard cubic feet per day (MMSCFD). During 1982production gradually increased to about 130 MMSCFD, but remained short of the200 MMSCFD which had originally been expected. The shortfall is attributableto technical difficulties and to the fact that the gas reserves aredistributed over smaller than expected reservoirs. Proven reserves arecurrently being reassessed. With the addition of further production capacityin other fields, production would increase to 600 MMSCFD by 1987. The Bankmade a loan of $107 million (Loan 1773-TH) in FY80 for the development of thefirst phase of the natural gas pipeline, and a Bank loan of $90 million (Loan2184-TH) to help finance a gas separation plant and marketing facilities wassigned on August 17, 1982. It is expected that by 1990, about 40% of EGAT-sprojected total generation of 32,950 GWh would be from thermal stations usingnatural gas, thereby reducing substantially the demand for fuel oil.
Oil
1.03 The exploration for oil in Thailand has recently led to improvedexpectations of domestic oil production beyond what was thought possibleduring the preparation of the Fifth Plan. Current finds are all in NorthernThailand. Three small oil fields in the Fang area currently yield about400 bpd, while production at Sirikit is expected to begin in 1983 at a rate of5,000 bpd, increasing to 8,000 bpd by the! end of 1983, and to 17,000 bpd by1986. Subject to positive results elsewhere in the concession productionmay reach 50,000 bpd by late 1990s. Finally, oil shae deposits have been

2-
found in Tak province near the Burmese border, which could yield anestimated 10 million tons of oil. The Department of Mineral Resources, withthe assistance of the German Government, has initiated studies to determinethe technical feasibility and economic viability of developing these oilshale resources. At present prices, however, oil shale development isunlikely to be economically viable.
Lignite Reserves
1.04 Substantial increases in Thailand-s lignite deposits have beenindicated by recent drillings. Lignite is relatively uneconomical to trans-port because of its high moisture and ash content, while :Lts tendency todecompose and self-ignite in open air makes it unsafe to store. Hence, inThailand as elsewhere, lignite is used almost exclusively for large-scalepower generation at the mine site. The present lignite reserves totalling770 million metric tons (mt) are located at Mae Moh (650 million mt), Krabi(100 million mt), and Li (20 million mt). Of the reserves at Mae Moh, 350million mt are proven and probable reserves, sufficient to sustain a totalgenerating capacity of about 1,725 MW for about 25 years. It is estimatedthat by 1990, about 25% of EGAT's total generation would be from lignitefired thermal stations.
Hydro Potential
1.05 The total hydropotential of Thailand's rivers is estimated at about9,300 MW, not including the international rivers (Mekong aLnd Salween), whosedevelopment of 25,000 MW is currently beyond reach due to major politicaland social obstacles. About 1,380 MW of hydropower are now in operation,2,100 MW are under construction, and about 2,500 MW in 25 projects are at astage of identification or feasibility study. Mini-hydro potential isestimated at about 3,290 MW at over one hundred sites. According to currentplans, hydropower production will increase at an average annual rate ofabout 13% between 1981 and 1995.
Other Energy Resources
1.06 Thailand's other energy resources include fuelwood and possiblygeothermal energy. Fuelwood resources, once plentiful, are rapidlydepleting and deforestation is becoming a serious problem. Geothermalexploration is being carried out by EGAT in the northern part of Thailandnear Chiangmai.
Energy Supply Alternatives
1.07 Prospects for reducing Thailand's dependence on imported energy inthe 1980s are good, at least for its electricty sector. The Government'spolicy is to reduce Thailand-s dependence on imported energy by (a) develop-ing indigenous energy resources such as natural gas, lignite and hydro potenr-tial; (b) pursuing a rational pricing policy; and (c) conservation programs.
-3-
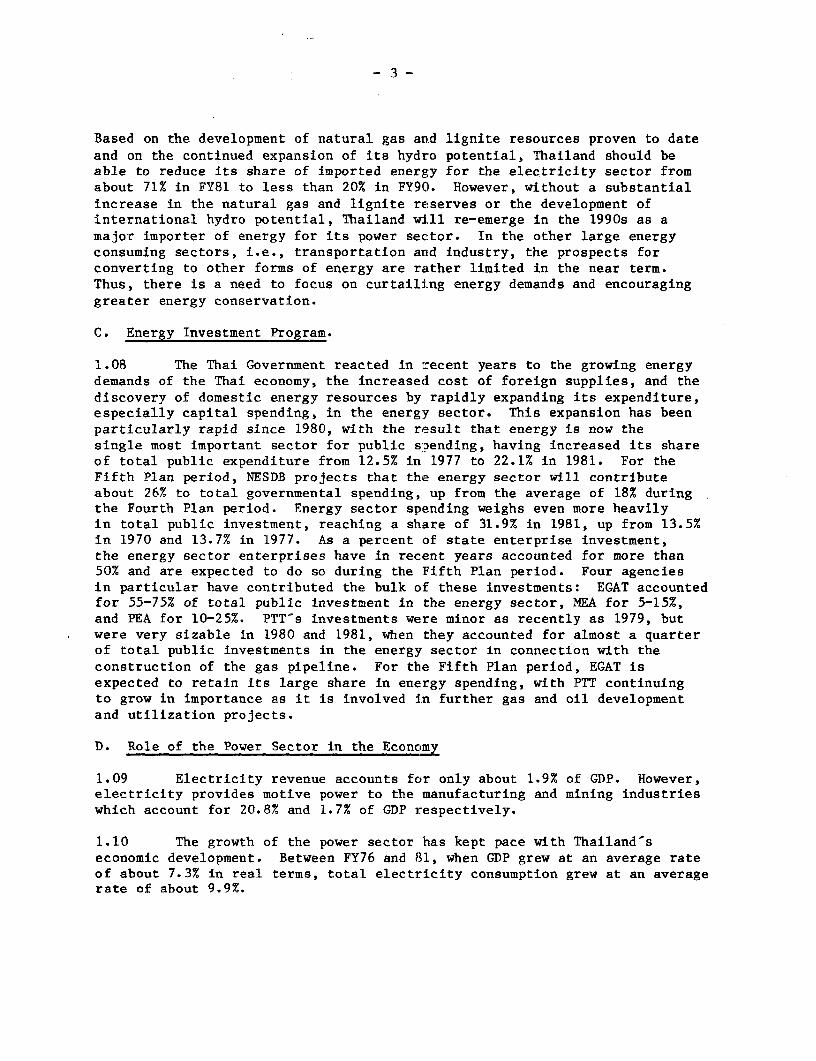
Based on the development of natural gas and lignite resources proven to dateand on the continued expansion of its hydro potential, Thailand should beable to reduce its share of imported energy for the electricity sector fromabout 71% in FY81 to less than 20% in FY90. However, without a substantialincrease in the natural gas and lignite reserves or the development ofinternational hydro potential, Thailand will re-emerge in the 1990s as amajor importer of energy for its power sector. In the other large energyconsuming sectors, i.e., transportation and industry, the prospects forconverting to other forms of energy are rather limited in the near term.Thus, there is a need to focus on curtailing energy demands and encouraginggreater energy conservation.
C. Energy Investment Program.
1.08 The Thai Government reacted in recent years to the growing energydemands of the Thai economy, the increased cost of foreign supplies, and thediscovery of domestic energy resources by rapidly expanding its expenditure,especially capital spending, in the energy sector. This expansion has beenparticularly rapid since 1980, with the result that energy is now thesingle most important sector for public spending, having increased its shareof total public expenditure from 12.5% in 1977 to 22.1% in 1981. For theFifth Plan period, NESDB projects that the energy sector will contributeabout 26% to total governmental spending, up from the average of 18% duringthe Fourth Plan period. Energy sector spending weighs even more heavilyin total public investment, reaching a share of 31.9% in 1981, up from 13.5%in 1970 and 13.7% in 1977. As a percent of state enterprise investment,the energy sector enterprises have in recent years accounted for more than50% and are expected to do so during the Fifth Plan period. Four agenciesin particular have contributed the bulk of these investments: EGAT accountedfor 55-75% of total public investment in the energy sector, MEA for 5-15%,and PEA for 10-25%. PTT-s investments were minor as recently as 1979, butwere very sizable in 1980 and 1981, when they accounted for almost a quarterof total public investments in the energy sector in connection with theconstruction of the gas pipeline. For the Fifth Plan period, EGAT isexpected to retain its large share in energy spending, with PTT continuingto grow in importance as it is involved in further gas and oil developmentand utilization projects.
D. Role of the Power Sector in the Economy
1.09 Electricity revenue accounts for only about 1.9% of GDP. However,electricity provides motive power to the manufacturing and mining industrieswhich account for 20.8% and 1.7% of GDP respectively.
1.10 The growth of the power sector has kept pace with Thailand'seconomic development. Between FY76 and 81, when GDP grew at an average rateof about 7.3% in real terms, total electricity consumption grew at an averagerate of about 9.9%.

-4-
E. The Power Sector Organization
General
1.11 The power sector consists of eight government agencies (para.1.18), three state utilities, the ministries to which they report, and foursmall private franchises (para. 1.17). The three state utLilities supplynearly all of the electricity consumed in the country, the privatefranchises and self-generating industries represented 12.9% of the installedcapacity in FY81 (Table 1.1).
1.12 The state-owned utilities are EGAT, the Metropo:Litan ElectricityAuthority (MEA), and the Provincial Electricity Authority (PEA). Highlightsof the EGAT, MEA and PEA operations are shown in Annex 1.
The Electricity Generating Authority of Thailand (EGAT)
1.13 EGAT was established in 1968 as a wholly-owned Government corpora-tion for the purpose of increasing the efficiency of electricity supplythroughout the country and coordinating the generation and transmissionsystems and is responsible to the Prime Minister's Office. EGAT generated94.6% of all electric energy in Thailand in FY81; the balance was generatedby PEA, NEA, private franchises and self-generating industries and a smallamount was purchased from Laos and Malaysia.
The Metropolitan Electricity Authority (MEA)
1.14 MEA was established in 1958 as a wholly-owned Government corpora-tion under the Ministry of Interior with responsibility for supplying elec-tricity to the Bangkok Metropolitan Area covering the provinces of Bangkok,Thon Buri, Nonthaburi and Samut Prakon. In FY81, 8,182 GW'h were sold to793,000 consumers. Compared with FY80, energy sales and number of consumersincreased by 4.0% and 7.4% respectively. Distribution losses were about3.7% in FY81. All of MEA's power is purchased from EGAT. The Bank hasnever been asked to assist MEA, as foreign funds requirements were providedby the Asian Development Bank (ADB) and commercial banks, in the past.
The Provincial Electricity Authority (PEA)
1.15 PEA was established in September 1960 as a wholly-owned Governmentcorporation under the Ministry of Interior with responsibility for providingand distributing electricity in all provinces of the country except in theareas served by MEA. PEA purchases most of its energy in bulk from EGAT butalso generates small quantities in areas not yet connected to the grid. InFY81, PEA purchased 5,761 GWh and generated 45 GWh; 5,210 GWh were sold to2.3 million consumers. Compared with FY80, GWh sold and the number of con-sumers connected increased by 11.0% and 20.4%, respectively. System losseswere about 10.2% in FY81. This is acceptable considering the size and loaddensity of its service areas.

- 5 -
1.16 PEA is the Government agency responsible for implementing theaccelerated rural electrification program (para. 1.29). The program onlysubstantially began with Loan 1527-TH made by the Bank to PEA in 1978 for thefirst major phase which will provide electricity to about 4,560 villages bythe end of 1983. Another loan (1871-TH) was made in 1980 to assist in theelectrification of about 7,800 villages by 1986.
Private Franchises
1.17 Following the fuel crisis and the Goverrment's policy of restrict-ing tariff increases, most of the franchises asked to be taken over by PEA.Since FY76, 52 franchises have been purchased leaving four in private handsat the end of FY81; two of them purchase their power needs in bulk from PEAand one directly from EGAT. The remaining franchise had an installedcapacity of only 18 KW and generated 11.5 MWh in FY81.
Government Agencies
1.18 Eight Government agencies which have a direct interest in thepower sector: Committee for Power Policy and Development (CPPD); BudgetBureau; Tariff Rate Committee (TRC); National Economic and Social DevelopmentBoard (NESDB); Ministry of Finance (MOF); National Energy Administration(NEA); Foreign Loan Committee (FLC); and Petroleum Authority of Thailand(PTT). These agencies review: tariff recommendations; capital projectproposals and budgets for submission to the Council of Ministers; annualfinancial performance; and requests for Government equity and loans. Noneof them has overall policy responsibility; decisions on the sector arearrived at after all the agencies including the state utilities reach aconsensus. The system is designed to ensure that sector capital expendituresare rigidly controlled. The interest of PTT in the sector arises from thefact that EGAT, as the utility responsible for generation, will be for sometime to come, the predominant customer for natural gas and is the largestcustomer for fuel oil.
F. Power Sector Coordination
1.19 Coordination among the different government agencies concernedwith the electricity subsector is achieved through close working relation-ships promoted by two separate arrangements. The first is the Load ForecastWorking Group, made up of representatives from the NESDB, the NEA, EGAT, PEAand MEA. The working group ensures that the subsector market developmentand the utilities' investment program requried to support it are consistentiP size, technical characteristics and timing. The second arrangement ismanifested by the current procedure for setting electricity rates wherebyattention is given to the cross-funding necessary to ensure that eachutility generates an adequate proportion of its capital investment and toprevent cash imbalances among EGAT, PEA and MEA.

-6-
1.20 The Government has been promoting further subsector coordinationin other ways. In 1977, the CPPD was formed to oversee the functioning anddevelopment of the subsector and to provide overall coordination. Inrecognition of the importance of energy issues, the Ministry'of Science,Energy and Technology was established in 1979. Coordination in the powersubsector is satisfactory while possibilities for further strengthening ofpolicy coordination of the energy sector as a whole are being pursuedthrough continuing dialogue with the Government and under the StructuralAdjustment loans to Thailand.
G. Tariff Levels
1.21 Tariff levels were adequate throughout the late 1960s and the early1970s, and the financial position of the sector remained strong. Duringthat period, the electricity sector enjoyed substantial economies of scalethrough shifts to hydroelectric and large steam generation coupled withrapid increases in the demand and number of consumers. Tariffs were reducedfrom time to time during these years. However, the fuel crisis and economicslowdown of 1973/74 necessitated large increases in tariffs, but only par-tial adjustments were politically feasible.
1.22 Severe droughts in 1977 and 1978 adversely affected the thermal/hydro generation mix, while in 1979 fuel oil prices increased some 115%.In an attempt to prevent higher energy costs from accelerating inflation,the Government chose to delay passing the rising costs of electricity toconsumers. By mid-1979, the Government, faced with mounting criticism ofits handling of the economy, introduced direct budgetary subsidies on elec-tricity tariffs, costing an estimated $9.0 million a month. In 1980, how-ever, the government agreed to a Plan of Action to remove subsidies andrestore the sector's financial viability, in connection with EGAT-s Mae MohLignite Project (Loan 1852-TH). This plan was implemented through asurcharge for heavy consumers established in August 1980 and tariffincreases in October 1980, January 1981 and April 1981. Thus, despite adifficult political climate and rapid inflation, the Government implementedoverall increases in EGAT's electricity tariff of 158% between February 1980and April 1981, and eliminated oil subsidies.
1.23 The present tariff structure contains a substantial subsidy fromlarge consumers in favor of small consumers. Although in general this isdesirable, tariffs for lower brackets group of residential consumers areunnecessarily low. As mentioned in para. 5.02, this is affecting PEA'searning power. Both PEA and the Government are aware of this situation.A Subcommittee on Tariff Structure was formed recently to look into thismatter. It is expected that adjustments will be gradually introduced asthe political and social realities of the country allow thLem.

-7-
H. Bank Participation in the Sector
1.24 The Bank has made two loans totalling US$100 million to PEA tofinance its Accelerated Rural Electrification Projects, and eleven loans toEGAT and its predecessor totalling US$542 million to help finance powerplants and transmission facilities. Another loan of US$72 million (Loan1852-TH, Mae Moh Lignite Project) was made to EGAT in June 1980 for ligniteproduction. The first eight projects made to EGAT have been completed andare operating satisfactorily. The Ninth Power Project (Loan 1690-TH, 550 MWBang Pakong Thermal Power Project) is about 46% complete. The Tenth PowerProject (Loan 1770-TH, Khao Laem Hydroelectric Project) is about 43%complete. The last loan (US$100 million) to EGAT was the Power SubsectorProject (Loan 2000-TH) which was approved by the Bank on May 21, 1981 andbecame effective on October 26, 1981. PEA's first Accelerated RuralElectrification Project (Loan 1527-TH) of $25.0 million became effective inJune 7, 1978. Of a total of 4,560 villages, 2,970 have been electrified andin another 1,060 villages construction and installation work has started. Aloan of US$75 million for PEA's Second Accelerated Rural ElectrificationProject (Loan 1871-TH) was made in FY80 but did not become effective untilAugust 20, 1981 due to delays in complying with cross-effectivenessrequirements with co-lenders. The project will cover about 7,800 villages;construction has started in the first 480 villages. Continuation of Bankfinancial assistance to PEA's development program is considered necessary topursue the support to improvements in PEA's operation.
I. Power Market and Supply
1.25 Annex 1 presents the highlights of EGAT, PEA and MEA operations.As shown in Table 1.1, at the end of FY81 EGAT represented about 83% of thecountry-s generating capacity.
Table 1.1: THAILAND - INSTALLED CAPACITY BY OWNERSHIP AT END OF FY81
Ownership Irnstalled capacity (MW) %
EGAT 3,808.4 82.8PEA & NEA 199.1 4.3Private franchises - /a -Self-generating industries 594.1 12.9
Total 4,601.6 100.0
/a With an installed capacity of 18 KW only.

-8-
1.26 From the viewpoint of sources of electricity (Table 1.2), in FY81thermal plants represented more than half of Thailand's installed capacityand generated three fourths of the total electricity available. About 71%of the electricity generated during FY81 came from imported sources ofenergy.
Table 1.2: THAILAND - DISTRIBUTION BY SOURCES OF GEIERATING CAPACITYAT THE END OF FY81 AND ENERGY AVAILABLE IN FY81
Generating capacity Energy availableSource MW % Gah %
Steam plants 2,280.8 49.6 12,574.3 74.5Hydro plants 1,361.1 29.6 2,974.4 17.6Gas turbines 610.0 13.2 383.5 2.3Diesel 349.7 7.6 200.1 1.2Purchased /a - - 739.9 4.4
Total 4,601.6 100.0 16,872.2 100.0
/a From Electricite du Laos (EDL) (Laos) and National ElectricityBoard (NEB) (Malaysia).
1.27 Total electricity consumption was 13,845 GWh in FY81 or 289 kWh percapita; 3,192.6 GWh (23.0%) were used by residential consumers; 1,564.4 GWh(11.3%) by commercial consumers; 8,968.1 Gwh (64.8%) by industrial consumersand 119.9 GWh (0.9%) by street lighting and others. Total losses were about17.9% including station services.
J. Degree of Electrification
1.28 Regional imbalances exist in the degree of electrification as wellas in per capita consumption as presented in Table 1.3.
- 9 -
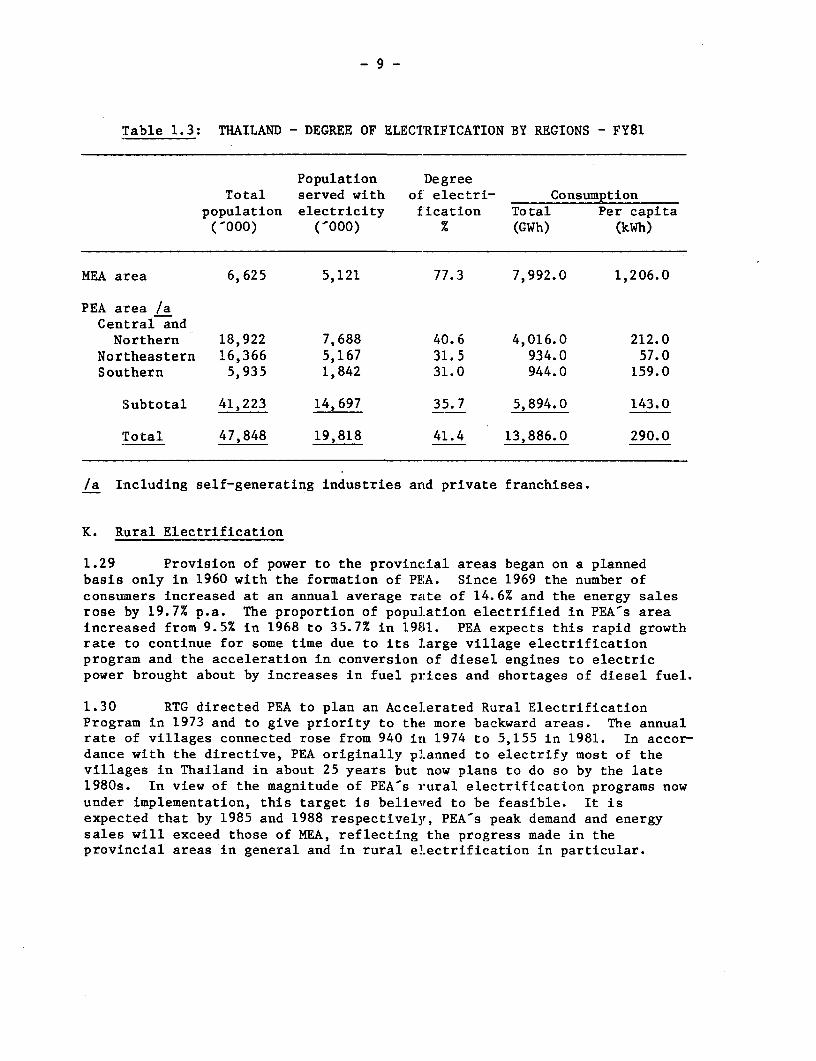
Table 1.3: THAILAND - DEGREE OF ELECTRIFICATION BY REGIONS - FY81
Population DegreeTotal served with of' electri- Consumption
population electricity f'ication Total Per capita('000) ('000) % (GWh) (kWh)
MEA area 6,625 5,121 77.3 7,992.0 1,206.0
PEA area /aCentral andNorthern 18,922 7,688 40.6 4,016.0 212.0
Northeastern 16,366 5,167 31.5 934.0 57.0Southern 5,935 1,842 31.0 944.0 159.0
Subtotal 41,223 14,697 35.7 5,894.0 143.0
Total 47,848 19,818 41.4 13,886.0 290.0
/a Including self-generating industries and private franchises.
K. Rural Electrification
1.29 Provision of power to the provincial areas began on a plannedbasis only in 1960 with the formation of PEA. Since 1969 the number ofconsumers increased at an annual average rate of 14.6% and the energy salesrose by 19.7% p.a. The proportion of population electrified in PEA's areaincreased from 9.5% in 1968 to 35.7% in 1981. PEA expects this rapid growthrate to continue for some time due to its large village electrificationprogram and the acceleration in conversion of diesel engines to electricpower brought about by increases in fuel prices and shortages of diesel fuel.
1.30 RTG directed PEA to plan an Accelerated Rural ElectrificationProgram in 1973 and to give priority to the more backward areas. The annualrate of villages connected rose from 940 in 1974 to 5,155 in 1981. In accor-dance with the directive, PEA originally planned to electrify most of thevillages in Thailand in about 25 years but now plans to do so by the late1980s. In view of the magnitude of PEA-s rural electrification programs nowunder implementation, this target is believed to be feasible. It isexpected that by 1985 and 1988 respectively, PEA's peak demand and energysales will exceed those of MEA, reflecting the progress made in theprovincial areas in general and in rural electrification in particular.

- 10 -
L. Project Performance Audits
1.31 To date no project performance audit reports (PPAR) have been pre-pared in respect to PEA's operations. PPARs have been prepared on three ofthe early loans to EGAT, the First Power Project (Loan 65i5-TH), the SouthBangkok Thermal Unit No. 4 Project (Loan 790-TH) and the Ban Chao Nen(Srinagarind) Hydroelectric Project (Loan 977-TH). The PPARs concluded thatthe major objectives of the project had been met. EGAT complied with allthe covenants, and its financial performance was satisfactory.
1.32 PEA has conducted its own post-evaluation of two projects alreadycompleted (not financed by the Bank). Both projects met or exceeded theirobjective and had Economic Rates of Return in excess of 23%.
II. THE BORROWER
2.01 The Borrower would be PEA, established in September 1960 underthe Provincial Electricity Act (BE2503) as a state enterprise reporting tothe Ministry of Interior. PEA is responsible for the distribution ofelectricity throughout the country except in the Metropolitan Bangkok areawhich is served by MEA. At the end of FY81, PEA had 965 offices grouped intwelve regional areas. In FY81 96% of PEA energy requirements werepurchased from EGAT, about 3% from MEA and NEA and the balance generatedfrom diesel plants.
A. Organization and Management
2.02 PEA's Board of Directors is appointed by the Council of Ministersand consists of up to nine members. For its operations, PEA is organizedinto three functional areas: Administration, Operations and Techniques,each headed by a Deputy General Manager. In addition, there is a smallstaff of senior officials who act as assistants to the General Manager.Annex 2 presents PEA's organization chart.
2.03 During the past five years PEA has experienced a rapid growth.The number of customers has more than doubled, the annual investment programhas increased threefold and revenues from sales in FY81 were about fourtimes those of FY77. It is expected that this pace will continue in thecoming four or five years in order to meet the RTG rural electrificationtargets.
2.04 Early in 1982 PEA retained a group of professors from a localuniversity to prepare a diagnosis of its operations and to indicate theadjustments required to improve PEA's efficiency in handling its growingvolume of activity. The diagnosis, in summary, shows that PEA needs totake actions to:

- 11 -
(a) strengthen the corporate planning system;
(b) modernize procedures for planning, purchasing and controllingconstruction materials;
(c) improve coordination in project planning and implementation;
(d) modernize the billing and collection procedures and improvecash management;
(e) strengthen and expand PEA's internal controls;
(f) improve budgeting and planning procedures; and
(g) modernize the electronic data processing equipment and expandits applications.
2.05 As part of the project, PEA is taking action to introduce adjust-ments in its operations to improve its efficiency (para. 4.14).
B. Manpower and Training
2.06 PEA personnel is experienced and well qualified. Table 2.1 showsthe growth of staff and the break-down by academic qualifications during thelast five years. Although the number of employees has grown at about thesame rate as the number of customers, the sales per employee has decreasedslightly reflecting the characteristics of PEA's expansion program.
2.07 PEA operates a modest training center which in FY81 trained about1,100 lower level staff. In addition, staff is trained in local and foreignuniversities. PEA is aware that, as the butlk of its rural electrificationis completed in 1986-87, its main activity will shift from construction tooperation and maintenance. This change will be reflected in the require-ments of PEA's work force. The Bank has provided guidance to PEA on thepreparation of a training program which is expected to be part of PEA'sinstitutional development program (para. 4.14).

- 12 -
Table 2.1: PEA-S STAFF BY CATEGORIES 1977-81
Averageannualgrowth
Category 1977 1978 1979 1980 1981 (%)
University graduates 677 775 869 990 1,098 12.8Technical diploma 1,057 1,313 1,636 2,00'5 2,326 21.8Vocational certificate 2,792 3,436 4,169 4,800 6,029 21.2Others 4,357 5,070 5,600 6,515 6,809 11.8
Total 8,883 10,594 12,274 14,310 16,262 16.3
Customers per employee 129 127 128 131 139Mwh sales per employee 357 344 346 332 320
C. Billing and Collections
2.08 Billing is made in the 12 regional offices usirLg electricaccounting machines which, although efficiently operated, lack the requiredmemory to properly record accounts receivable and are slow for the presentvolume of operations. A mini-computer is planned to be installed in ChiangMai as a pilot project to develop procedures to modernize PEA's billingsystem. PEA-s collections are efficient. Accounts receivable at the end ofFY81 represented 42 days of billings in spite of the slow collection fromGovernment entities. During negotiations, the Government agreed to makearrangements for the prompt payment of electricity bills rendered by PEA toits departments and agencies.
D. Accounting and Audit
2.09 The accounting system is adequate and the staff are competent.Accounting is carried out centrally in Bangkok, supported by 12 regionalaccounting centers.
2.10 PEA'a accounts are audited by the National Audit Council (NAC),the government entity responsible for auditing all state enterprises inThailand. In 1979 the Bank reviewed the auditing standards of the NAC asapplied to PEA. Most of the recommendations made at that time have beenimplemented. Nevertheless, there are translation difficulties which haveresulted in delays in the presentation of the auditors reports to the Bankand lack of clarity in some portions of the same. This situation will befollowed closely in the future to determine if alternative arrangements areneeded.

- 13 -
2.11 The head of the internal audit office reports directly to thegeneral manager. It is expected that as part of the activities mentioned inpara. 4.14, PEA will review its internal control procedures in order tobring them in line with the present complexity of its operations.
E. Taxes
2.12 PEA pays custom duties (from 8% t:o 40%) on imported material andequipment. Its Act also provides that any surplus funds be remitted toGovernment in lieu of corporate tax. Due to the size of PEA's investmentprogram and its needs for funds, PEA has not made any remittances and is notexpected to do so in the future.
F. Insurance
2.13 PEA carries adequate insurance protection against fire forbuildings and their contents. No third party liability insurance iscarried. This is the generalized practice in most public enterprises inThailand and given the characteristics of the risk for PEA it isacceptable. Insurance policies are reviewed and updated once a year.
G. Existinig Facilities
2.14 The energy sold to PEA from EGAT's 81 substations is distributedby PEA in 69 provinces by a radial type of distribution system of 11, 22 and33 kV design. PEA steps the high tension voltage down to low tension at400/230 volt, 3-phase, 4-wire; 230 volt, 1-phase, 2 wire or 460/230, 1phase, 3-wire (including one neutral) for supplying the energy tocustomers. Medium sized business and industrial loads are supplied at thevoltage level of 11, 22 or 33 kV.
2.15 At the end of FY81, the electric distribution systems in PEAservice areas totaled 50,650 circuit-km of primary distribution lines and3,538 MVA of transformer capacity.
III. PEA's POWER MARKET
A. Background
3.01 PEA-s market covers all of Thailand except the Metropolitan Bangkokarea which is served by MEA.

- 14 -
Table 3.1: PEA - SALES BY CATEGORY OF CUSTOMEE'S - FY81
Number of Salesconsumers GWh %
Residential 2,230,216 1,582.1 30.4Small business 28,060 528.6 10.2Large business 1, 586 537.7 10.3Small industrial 1,897 935.0 18.0Large industrial 196 1,517.6 29.0Irrigation 256 18.4 0.3Street lighting 2,569 19.8 0.4Others 5,589 70.5 1.4
Total 2,270,369 5,209.7 100.0
3.02 PEA's power market has had a long history of rapid growth, theaverage annual increase in peak demand and energy sales being 16% and 19.7%,respectively, over the period FY70-81. Growth was stimulated by an expandingeconomy and Government's emphasis on improving the standard of living inthe rural areas. A breakdown of PEA's sales is shown in Table 3.1 and PEA'sgrowth rates in energy sales and peak demand are presented in Table 3.2.Annex 3 presents the historical evolution of PEA's market by type ofconsumption as well as the growth of different groups of customers.

- 15 -
Table 3.2: PEA - HISTORICAL SALES 1969-1981
Energy sales Peak demand
Fiscal year GWh increase MW increase
1969 601.8 - 199.5 -1970 769.4 27.8 222.4 11.41971 924.3 20.1 269.4 21.11972 1,211.4 31.L 327.6 21.61973 1,557.4 28.6 375.1 14.51974 1,779.2 14.2 433.2 15.51975 2,120.0 19.2 516.9 19.31976 2,616.7 23.4 640.1 23.81977 3,174.4 21.3 740.8 15.71978 3,649.6 14.9 851.7 15.01979 4,253.7 16.5 949.1 11.41980 4,695.8 10.4 1,040.1 9.61981 5,209.7 10.9 1,180.7 13.5
Average FY70-81 19.7 16.0
B. PEA's Load Forecast
3.03 PEA's load -orecast is normally reviewed at least once a year. Itis derived from a study of trend analysis of sales to different categoriesof consumers, market surveys of new industries and the rural electrificationprogram. The review is carried out by the Load Forecast Working Group(LFWG) which is chaired by NESDB and consist of Representatives of NEA andthe three utilities.
3.04 The Bank considered that the June 1982 forecast prepared bythe LFWG did not fully take into account the recent demand slowdown.Accordingly, it was revised slightly downwards. The revised forecast issummarized in Table 3.3 and presented in detail in Annex 3.
- 16 -
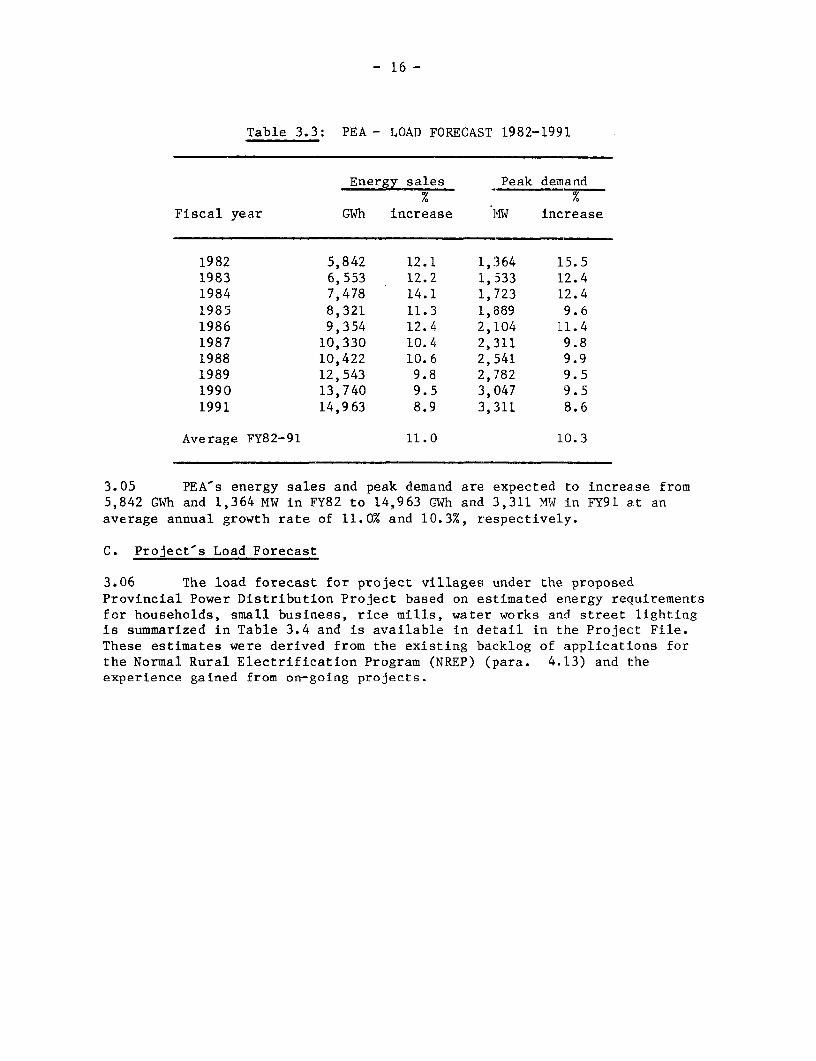
Table 3.3: PEA - LOAD FORECAST 1982-1991
Energy sales Peak demand
Fiscal year GWh increase MW increase
1982 5,842 12.1 1,364 15.51983 6,553 12.2 1,533 12.41984 7,478 14.1 1,723 12.41985 8,321 11.3 1,889 9.61986 9,354 12.4 2,L04 11.41987 10,330 10.4 2,311 9.81988 10,422 10.6 2,541 9.91989 12,543 9.8 2,782 9.51990 13,740 9.5 3,047 9.51991 14,963 8.9 3,311 8.6
Average FY82-91 11.0 10.3
3.05 PEA's energy sales and peak demand are expected to increase from5,842 GWh and 1,364 MW in FY82 to 14,963 GWh and 3,311 MW in FY91 at anaverage annual growth rate of 11.0% and 10.3%, respectively.
C. Project's Load Forecast
3.06 The load forecast for project villages under the proposedProvincial Power Distribution Project based on estimated energy requirementsfor households, small business, rice mills, water works and street lightingis summarized in Table 3.4 and is available in detail in the Project File.These estimates were derived from the existing backlog of applications forthe Normal Rural Electrification Program (NREP) (para. 4.13) and theexperience gained from on-going projects.

- 17 -
Table 3.4: PEA - NORMAL RURAL ELECTRIFICATION - LOAD FORECAST
Energy Peakrequirement demand Load
Year (GWh/year) (MW) factor
1 18.8 19.5 11.02 64.9 46.8 15.83 118.1 77.6 17.44 176.4 115.8 17.45 232.2 143.9 18.4
10 445.6 242.8 21.015 655.4 317.9 23.520 907.5 409.0 25.325 1,189.4 499.7 27.230 1,497.9 581.3 29.4
3.07 Energy requirements in the project villages are expected toincrease from about 19 GWh in FY 1983 to 1,498 GWh in FY 2012, an averageannual growth rate of 16%; and peak demand from about 20 MW in FY 1983 toabout 580 MW in FY 2012, an average annual growth rate of 12.4%. Growth isexpected to be rapid in the early years and would then taper off as connec-tion of the majority of the premises (about 80% of households) is achievedby FY 1993.
IV. THE PROGRAM AND THE PROJECT
A. PEA's Development Strategy
4.01 PEA's electrification strategy envisages development of the sectorin four consecutive stages: L.ist to electrify provincial centers and majorcities; second district centers; third, TAMBON /1 centers and fourth ruralvillages. The first two stages are completed and an effort is now beingdirected towards the last two. At the end of FY81 about 24,000 (46%) out ofa total of 52,000 villages had electricity.
/1 Thailand's lowest administrative unit consisting of a group ofvillages.

- 18 -
4.02 In developing its system PEA undertakes two groups of activities:
(a) the Power Distribution System Reinforcement program, toimprove the capacity and reliability of the backbone distributionsystem; and
(b) the Village Electrification Programs, to extend the electricservices to the population in rural areas.
4.03 There are three types of village electrification programs currentlybeing carried out by PEA: (a) Projects prepared to address the need forelectrification on a regional basis, PEA selects the villages to be electri-fied under each particular project. This group includes the First and SecondAccelerated Rural Electrification Projects (ARE I, ARE II) and the VillageElectrification Project (VEP); (b) the TAMIBON project (TEP) is intended togive power to all TAMBON headquarters and surrounding villages that can beconnected at a reasonable cost; and (c) the Normal Rural ElectrificationProgram (NREP), carried out by the regional offices connecting villageswhich are not included in other programs and request to be electrified. Inaddition, the NREP extends the electric services to groups of households invillages partially electrified under other projects.
4.04 In the past, the extension of PEA-s system has been carried outon a piecemeal basis under different projects. As part of a program forinstitutional development, PEA is planning to start a process of modernizingits Distribution System Planning in order to improve reliability, safety andeconomy (para 4.14).
B. PEA's Development Program
4.05 Under the National Plan for Total Electrification of Thailand,approved by the Council of Ministers on August 28, 1973 PEA orginally plannedto electrify all villages in Thailand in about 25 years. Later PEA embarkedon a greatly accelerated program which plans to reach most villages by thelate 1980s. A summary of the projects undertaken by PEA is presented inAnnex 4 and PEA's Village Electrification Program is shown in Table 4.1, andMap IBRD 16683 shows the regional distribution of PEA's rural electrificationprojects.
- 19 -
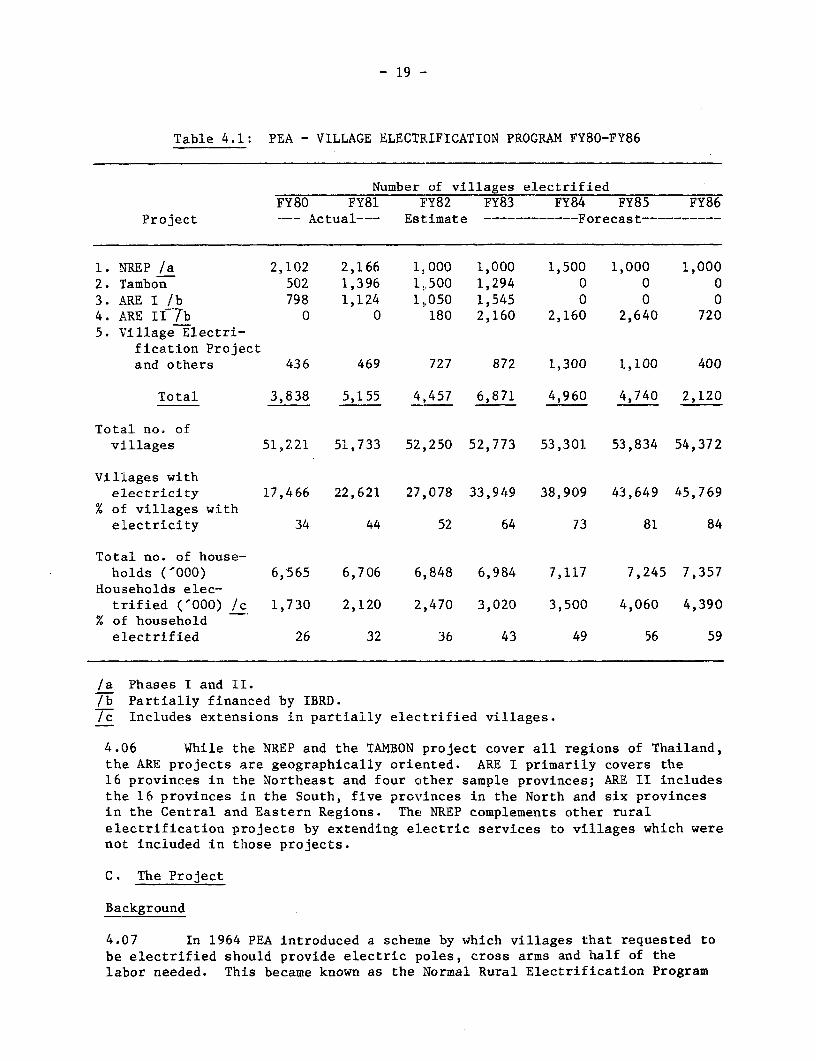
Table 4.1: PEA - VILLAGE ELECTRIFICATION PROGRAM FY80-FY86
Number of villages electrifiedFY80 FY81 FY82 FY83 FY84 FY85 FY86
Project --- Actual--- Estimate ------------Forecast----------
1. NREP /a 2,102 2,166 1,000 1,000 1,500 1,000 1,0002. Tambon 502 1,396 1,500 1,294 0 0 03. ARE I /b 798 1,124 1,050 1,545 0 0 04. ARE II7 b 0 0 180 2,160 2,160 2,640 7205. Village Electri-
fication Projectand others 436 469 727 872 1,300 1,100 400
Total 3,838 5,155 4,457 6,871 4,960 4,740 2,120
Total no. ofvillages 51,221 51,733 52,250 52,773 53,301 53,834 54,372
Villages withelectricity 17,466 22,621 27,078 33,949 38,909 43,649 45,769
% of villages withelectricity 34 44 52 64 73 81 84
Total no. of house-holds ('000) 6,565 6,706 6,848 6,984 7,117 7,245 7,357
Households elec-trified ('000) /c 1,730 2,120 2,470 3,020 3,500 4,060 4,390
% of householdelectrified 26 32 36 43 49 56 59
/a Phases I and II./b Partially financed by IBRD./c Includes extensions in partially electrified villages.
4.06 While the NREP and the TAMBON project cover all regions of Thailand,the ARF projects are geographically oriented. ARE I primarily covers the16 provinces in the Northeast and four other sample provinces; ARE II includesthe 16 provinces in the South, five provinces in the North and six provincesin the Central and Eastern Regions. The NREP complements other ruralelectrification projects by extending electric services to villages which werenot included in those projects.
C. The Project
Background
4.07 In 1964 PEA introduced a scheme by which villages that requested tobe electrified should provide electric poles, cross arms and half of thelabor needed. This became known as the Normal Rural Electrification Program
- 20 -
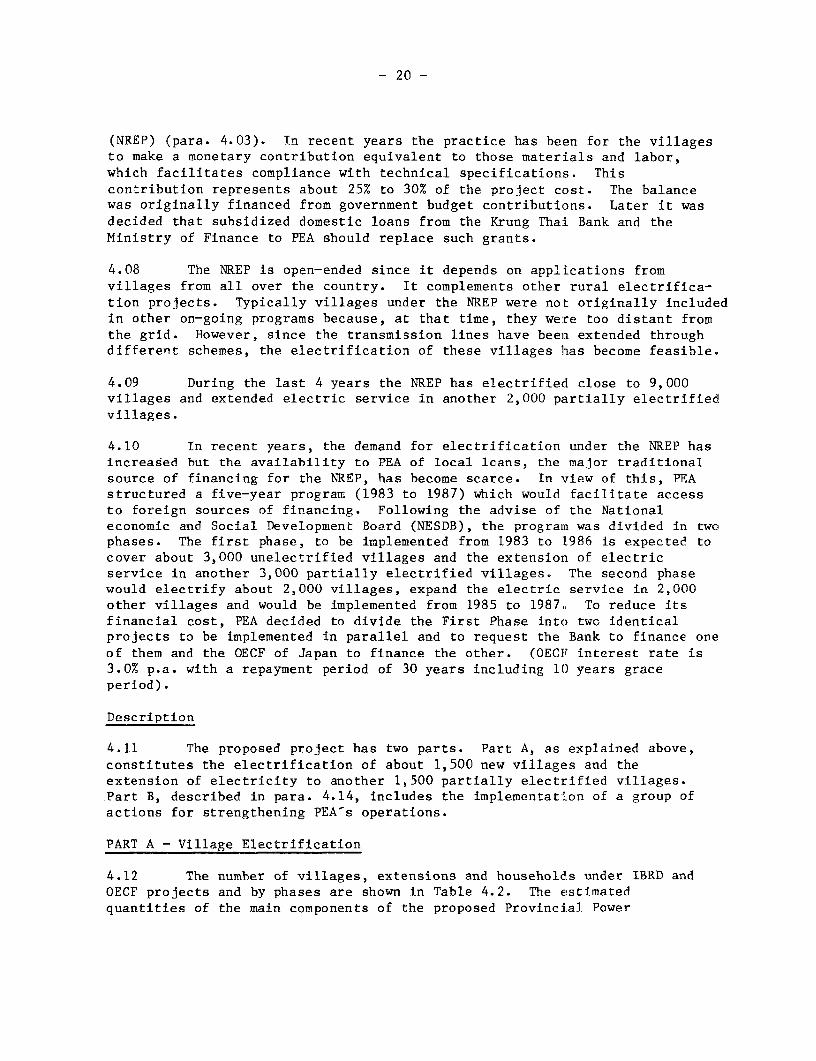
(NREP) (para. 4.03). Tn recent years the practice has been for the villagesto make a monetary contribution equivalent to those materials and labor,which facilitates compliance with technical specifications. Thiscontribution represents about 25% to 30% of the project cost. The balancewas originally financed from government budget contributions. Later it wasdecided that subsidized domestic loans from the Krung Thai Bank and theMinistry of Finance to PEA should replace such grants.
4.08 The NREP is open-ended since it depends on applications fromvillages from all over the country. It complements other rural electrifica-tion projects. Typically villages under the NREP were not originally includedin other on-going programs because, at that time, they were too distant fromthe grid. However, since the transmission lines have been extended throughdifferent schemes, the electrification of these villages has become feasible.
4.09 During the last 4 years the NREP has electrified close to 9,000villages and extended electric service in another 2,000 partially electrifiedvillages.
4.10 In recent years, the demand for electrification under the NREP hasincreased but the availability to PEA of local loans, the major traditionalsource of financing for the NREP, has become scarce. In view of this, PEAstructured a five-year programr (1983 to 1987) which would facilitate accessto foreign sources of financing. Following the advise of the Nationaleconomic and Social Development Board (NESDB), the programa was divided in twophases. The first phase, to be implemented from 1983 to 1986 is expected tocover about 3,000 unelectrified villages and the extension of electricservice in another 3,000 partially electrified villages. The second phasewould electrify about 2,000 villages, expand the electric service in 2,000other villages and would be implemented from 1985 to 1987. To reduce itsfinancial cost, PEA decided to divide the First Phase into two identicalprojects to be implemented in parallel and to request the Bank to finance oneof them and the OECF of Japan to finance the other. (OECF interest rate is3.0% p.a. with a repayment period of 30 years including 10 years graceperiod).
Description
4.11 The proposed project has two parts. Part A, as explained above,constitutes the electrification of about 1,500 new villages and theextension of electricity to another 1,500 partially electrified villages.Part B, described in para. 4.14, includes the implementatlon of a group ofactions for strengthening PEA-s operations.
PART A - Village Electrification
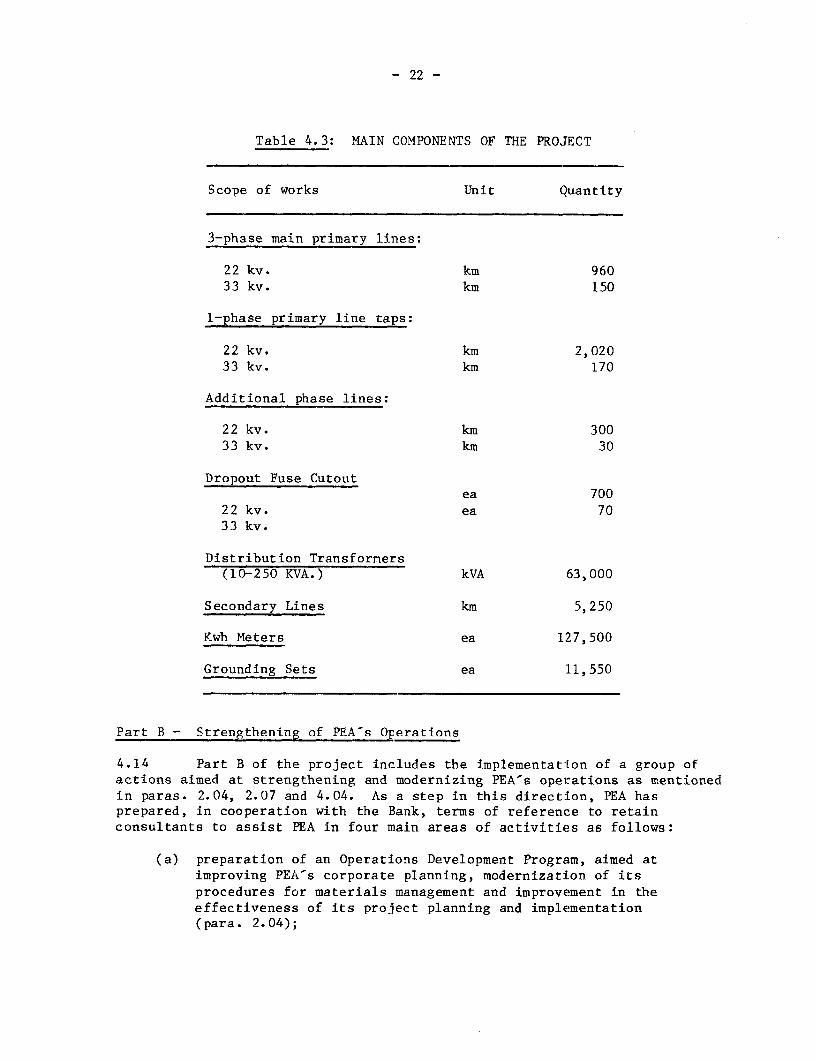
4.12 The number of villages, extensions and households under IBRD andOECF projects and by phases are shown in Table 4.2. The estimatedquantities of the main components of the proposed Provincial Power

- 21 -
Distribution Project proposed to be financed by the Bank are presented inTable 4.3. Annex 5 shows the whole program..
Table 4.2 PEA - NORMAL RURAL ELECTRIFICATION PROGRAM (NREP) FY83-87
Number Number Number ofof of initial
villages households customers
Phase I (FY83-86)(a) IBRD
1. Unelectrified villages 1,500 175,000 94,0002. Extensions 1,500 45,000 33,000
(b) OECF Japan
1. Unelectrified villages 1,'500 175,000 94,0002. Extensions 1,500 45,000 33,000
Total Phase I 6,000 440,000 254,000
Phase II (FY85-87)
1. Unelectrified villages 2,000 234,000 126,0002. Extensions 2,000 60,000 44,000
Total Phase II 4,000 294,000 170,000
Total NREP 10,000 735,000 425,000
Subproject Selection Criteria
4.13 The following criteria was agreed during negotiations for selectingthe villages to be financed under the proposed loan. Subprojects with aninvestment cost per connection equal to or less than the average investmentcost of all the different rural electrification projects now being undertakenby PEA would be eligible for financing under the project. This averageinvestment cost is about B/.8,000 ($348) per connection at 1982 prices andwould be adjusted yearly for inflation. Subprojects exceeding that averagecost could be accepted provided they have an Economic Rate of Return (ERR) ofnot less than 10%. (PEA has developed a computer program to calculate the ERRusing the information routinely collected at the time of processing theapplications from the villages.) A preliminary review indicates that of thepresent backlog of 7,640 applications, (see Annex 6), about 5,400 villageshave a cost per connection lower than B/.8,000).
- 22 -
Table 4.3: MAIN COMPONENTS OF THE PROJECT
Scope of works Unit Quantity
3-phase main primary lines:
22 kv. km 96033 kv. km 150
1-phase primary line taps:
22 kv. km 2,02033 kv. km 170
Additional phase lines:
22 kv. km 30033 kv. km 30
Dropout Fuse Cutoutea 700
22 kv. ea 7033 kv.
Distribution Transformers(10-250 KVA.) kVA 63,000
Secondary Lines km 5,250
Kwh Meters ea 127,500
Grounding Sets ea 11,550
Part B - Strengthening of PEA's Operations
4.14 Part B of the project includes the implementation of a group ofactions aimed at strengthening and modernizing PEA's operations as mentionedin paras. 2.04, 2.07 and 4.04. As a step in this direction, PEA hasprepared, in cooperation with the Bank, terms of reference to retainconsultants to assist PEA in four main areas of activities as follows:
(a) preparation of an Operations Development Program, aimed atimproving PEA's corporate planning, modernization of itsprocedures for materials management and improvement in theeffectiveness of its project planning and implementation(para. 2.04);

- 23 -
(b) review of PEA's electronic data processing activities in orderto modernize them and to expand its applications;
(c) preparation of a Training Program to help develop PEA's staff andto make the necessary adjustments in PEA's manpower in responseto the changing role of the organization (para. 2.07); and
(d) preparation of a Distribution System Planning Program to improvethe reliability, safety and economy of PEA's distribution network(para. 4.04);
4.15 It is envisaged that the consultants will work closely with PEA'sstaff. Also, during the implementation process a good amount of training onthe job is expected.
4.16 The consultants cost is estimated at US$1.0 million. It providesfor 108 man-months of consulting services. The average man-months cost,including salary, costs, fees, international travel and subsistence isUS$9,200. PEA has requested a grant equivalent to US$1.0 million from theAustralian Development Assistance Bureau (ADAB). The Australian Governmenthas approved in principle this cofinancing.
4.17 During negotiations PEA agreed that in the unlikely event that bySeptember 30, 1983, the grant from ADAB has not materialized, PEA willfurnish to the Bank, by December 31, 1983, for Bank comments, a Plan ofAction. Such Plan would contain the alternate arrangements for introducingthe necessary adjustments in PEA-s operations to improve its overallefficiency. PEA also agreed that in such event, the Plan of Action would becarried out in a timely manner, taking into account the Bank's comments.
Cost Estimate
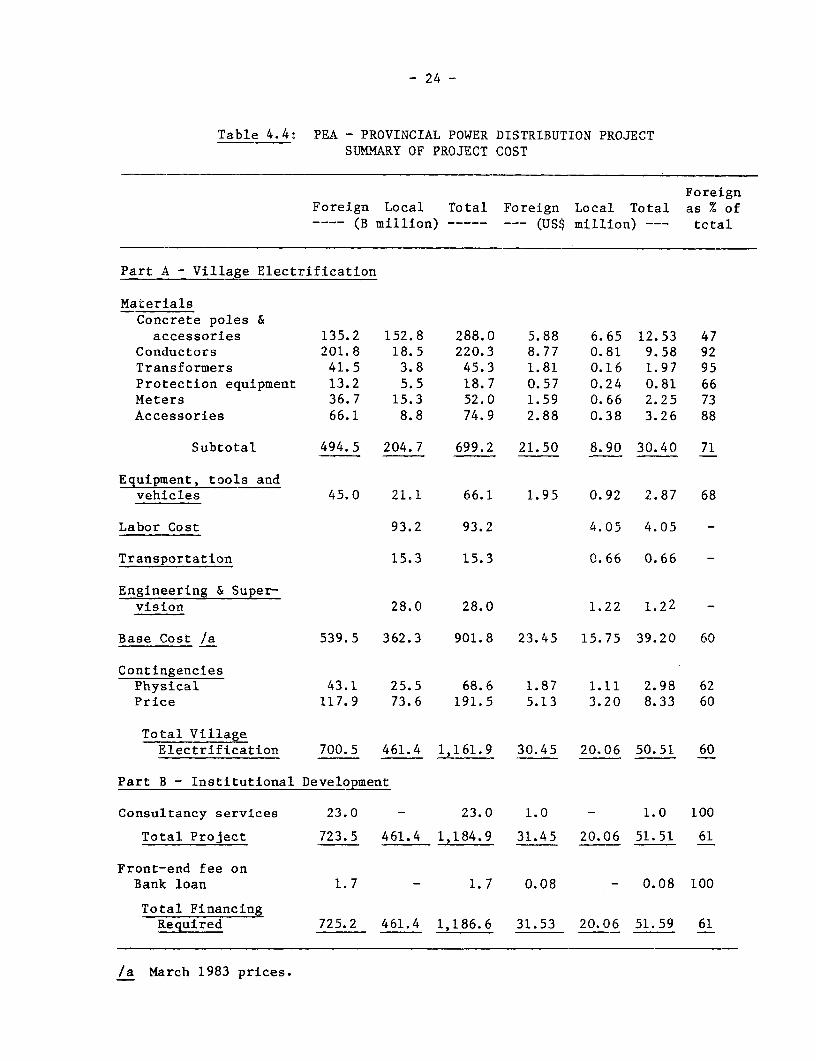
4.18 The cost estimate for the NRE Program was derived from the analysisof the existing backlog of applications for which surveys and cost estimateshave been prepared. Table 4.4 presents the total financing required for theproject, including the front-end fee on Bank loan. Annex 7 presents totalestimated costs for both Phase I and II.
- 24 -
Table 4.4: PEA - PROVINCIAL POWER DISTRIBUTION PROJECTSUMMARY OF PROJECT COST
ForeignForeign Local Total Foreign Local Total as % of
(B million) ----- --- (US'> million) --- total
Part A - Village Electrification
MaterialsConcrete poles &
accessories 135.2 152.8 288.0 5.88 6.65 12.53 47Conductors 201.8 18.5 220.3 8.77 0.81 9.58 92Transformers 41.5 3.8 45.3 1.81 0.16 1.97 95Protection equipment 13.2 5.5 18.7 0.57 0.24 0.81 66Meters 36.7 15.3 52.0 1.59 0.66 2.25 73Accessories 66.1 8.8 74.9 2.88 0.38 3.26 88
Subtotal 494.5 204.7 699.2 21.50 8.90 30.40 71
Equipment, tools andvehicles 45.0 21.1 66.1 1.95 0.92 2.87 68
Labor Cost 93.2 93.2 4.05 4.05 -
Transportation 15.3 15.3 0.66 0.66 -
Engineering & Super-vision 28.0 28.0 1.22 1.22 -
Base Cost /a 539.5 362.3 901.8 23.45 15.75 39.20 60
ContingenciesPhysical 43.1 25.5 68.6 1.87 1.11 2.98 62Price 117.9 73.6 191.5 5.13 3.20 8.33 60
Total VillageElectrification 700.5 461.4 1,161.9 30.45 20.06 50.51 60
Part B - Institutional Development
Consultancy services 23.0 - 23.0 1.0 - 1.0 100
Total Project 723.5 461.4 1,184.9 31.45 20.06 51.51 61
Front-end fee onBank loan 1.7 - 1.7 0.08 - 0.08 100
Total FinancingRequired 725.2 461.4 1,186.6 31.53 20.06 51.59 61
/a March 1983 prices.

- 25 -
4.19 Physical contingencies were assumed to be about 8% based on PEA'spast experiences in distribution projects. Price contingencies for foreigncosts were derived by applying the following annual rates of escalation: 8%for 1983, 7.5% for 1984, 7% for 1985, and 6% for 1986 and thereafter. Theprice contingencies for local costs were assumed to be 7% for 1983, 1984, and1985, and 6% for 1986 and thereafter. Price contingencies represent about 20%of basic cost, including physical contingencies. It is PEA's policy not tocapitalize interest during construction due to the usually short constructionperiod of its projects. The total cost, excluding taxes and duties, estimatedat B 77.5 million (US$3.3 million), is B 1,109.1 million (US$48.3 million).
Financing Plan
4.20 The proposed Bank loan of US$30.6 million would finance the foreigncost of Part A of the project and the front-end fee. The cost of consultancyservices for Part B of the Project, estimated at US$1.0 million, will befinanced by the ADAB (para. 4.16). The local cost of US$20 million would befinanced from consumers' contributions in an amount estimated to be US$12.6million and the balance from PEA's internally generated funds.
4.21 The proposed Bank loan is equivalent to 59% of the total financingrequirements. During negotiations it was agreed that front--end fee will becapitalized. Villages customarily pay their contribution to PEA at the timetheir applications are approved. These conl:ributions are normally collectedby the village headman from the potential initial customers, historicallyabout 60% of the total number of households.
Implementation
4.22 As mentioned in para. 4.10, the new villages to be electrified underthe First Phase of the NREP as well as the extensions to households invillages already partially electrified, are intended to be distributed in twoprojects by equal parts for financing by the Bank and OECF. Under thisarrangement each party would help finance the electrification of about 1,500unelectrified villages and extensions in another 1,500 partially electrifiedvillages (see Table 4.2).
4.23 The planning, engineering and construction of the project will becoordinated by PEA's Project and Planning Division and the subprojects willbe implemented by the regional offices. To avoid initial delays in thestarting of t-he project construction PEA is preparing the necessary actionsto ensure the availability of human resources and equipment in the provinceswhere the project will be implemented. Procurement is expected to startin June 1983 and construction will begin in January 1984, using materialsfrom PEA-s inventories if necessary. The total implementation period will befrom mid-1983 through December 1986 (see Annex 8 for implementation schedule).

- 26 -
4.24 Most of the distribution lines would follow main or village roads.For lines which cross private land no compensation is pa:Ld although suchcompensation is provided for in PEA's Act, as the experience has been thatvillagers welcome the provision of electric services. PEA has experiencedlittle difficulty in obtaining easements over farmland.
Procurement
4.25 Except for concrete poles and minor items, all equipment andmaterials to be financed under the proposed Bank loan would be procured onthe basis of international competitive bidding in accordance with the BankGuidelines. A preference of 15% of the c.i.f. price of iimported goods, orthe prevailing custom duty, whichever is lower, would be extended to quali-fied local manufacturers. Local competitive bidding procedures acceptable tothe Bank would be applied to: (a) concrete poles (as shipping charges wouldnot warrant concrete poles being procured internationally); and (b) otherminor items costing less than $100,000 each and up to an aggregate amount of$2.5 million. Bidding packages for equipment and materiaLls over $500,000will be reviewed and commented on in advance by the Bank.
Disbursement
4.26 Disbursement from the proposed loan would be made against:
(a) 100% of the foreign exchange cost of directly imported equipmentand materials;
(b) 100% of ex-factory cost for equipment and material manufacturedlocally;
(c) 65% of total expenditures for imported equipment and materialsprocured locally; and
(d) 47% of total expenditures ex-factory for concrete poles.
Since the proposed loan will finance a time-slice of an on-going program,there are no disbursement profiles available that could be compared with theone prepared for the proposed loan. The disbursement schedule presented inAnnex 9 was derived on the basis of the Implementation Schedule (Annex 8)and PEA-s experience with on-going projects. The closing date of the loanwould be June 30, 1987.
Monitoring
4.27 PEA has established an effective system to moniltor its investmentin the two Accelerated Rural Electrification projects and to assess theimpact of such projects in the electrified villages. A similar system willbe used to monitor the proposed project. Details on PEA's monitoring systemare presented in Annex 10.

- 27 -
Risks
4.28 The project risks are acceptable. The two accelerated RuralElectrification projects financed by the Bank faced start-up delays.Nevertheless, since the NREP is an on-going program, such delays are lesslikely to occur. The sensitivity analysis shows that if project _ostsincrease by 20% the Economic Rate of Return (ERR) would be reduced from 14%to 12%. On the other hand, if benefits are reduced by 20% (due to less thanexpected connection rate, load or savings) the ERR would be 11%.
Environmental Effects
4.29 The project is not expected to cause any significant environmentalproblem.
V. FINANCIAL ANALYSIS
A. PEA's Financial Performance FY77 through FY81
5.01 As shown in Table 5.1, during the past five years PEA's revenuesincreased rapidly at an annual average rate of 38% reflecting the expansionof PEA's market and the large tariff adjustments implemented in FY80 andFY81. This increase in revenues was largely offset by a substantialincrease in the cost of power purchased from EGAT which grew at an annualaverage rate of 50%. This and the fact that PEA's yearly investment trebledduring the period, explains the downward trend of PEA's rate of return(Table 5.1) and self-financing ratio (Table 5.2).
Table 5.1: SUMMARY HISTORICAL INCOME STATEMENTS, FY77-FY81(In millions of current Baht)
Averageannual
FY77 FY78 FY79 FY80 FY81 growth
Energy sales (Gwh) 3,174 3,650 4,254 4,696 5,210 13.2Revenues 2,394 3,168 3,697 5,080 8,742 38.2Average tariff B/kWh 0.75 0.87 0.87 1.08 1.62 22.3Operating expenditures 2,140 2,811 3,348 4,843 8,428 40.9Operating income 254 357 349 237 314 5.4Net income 173 354 342 146 151 -3.3Rate of return (revalued) (%) 10.3 12.0 9.3 5.0 4.8Number of connections ('000) 1,144 1,350 1,574 1,886 2,270 18.7Energy Revenue per connection (B) 1,909 2,282 2,283 2,618 3,718 18.1Operating expendituresper connection (B) 1,870 2,082 2,127 2,568 3,713 18.7

- 28 -
5.02 It is also worth noting that PEA's operating cost per connectionincreased to match the revenue from electricity sales per connection byFY81, as shown at the bottom of Table 5.1. This is the result of PEA'sexpansion into the rural market where customers are main:Ly in the lowertariff brackets. In other words, during the past few years, in order toproduce a positive net income, PEA has relied mainly on revenues fromsources other than its electricity sales such as installation and inspectionfees, construction for customers, interest, etc.
5.03 To complement its internally generated funds, (luring the periodunder consideration PEA made extensive use of its borrowing capacity andrelied on some contributions from consumers. Equity contributions from theGovernment were limited as shown in Table 5.2.
5.04 PEA has customarily relied largely on soft foreign loans from theOverseas Economic Cooperation Fund (OECF) of Japan, the Kreditanstalt FurWiederaufbau (KFW) of West Germany, the Kuwait Fund for Arab EconomicDevelopment (KFAED), the Canadian International Development Agency (CIDA)and the Organization of Petroleum Exporting Countries (OEEC) Fund forInternational Development. In addition, the Government h,as subsidized theinterest rate paid by PEA on domestic loans, mainly from the Ministry ofFinance and the Krung Thai Bank.
Table 5.2: SUMMARY HISTORICAL SOURCES AND APPLICATIONS OF FUNDS, FY77-FY81(In millions of current Baht)
Averageannual
FY77 FY78 FY79 FY80 FY81 growth
Internal sources 461 708 789 703 1,023 22.0Borrowings 673 413 740 1,344 2,516 39.0Equity investments 10 77 49 63 205 118.3Other 262 247 303 357 681 39.1
Total Sources 1,406 1,445 1,881 2,467 4,425 33.2
Capital expenditures 902 1,051 1,320 1,527 2,452 28.4Debt service 108 186 276 367 637 55.8Working capital increase 320 161 141 153 1,185 38.7Other 76 47 144 420 151 18.7
Total Applications 1,406 1,445 1,881 2,467 4,425 33.2
Debt service coverage 4.2 3.8 2.8 1.9 1.6Contribution to construc-tion (%) 39.1 49.6 38.8 22.0 15.7

- 29 -
5.05 This conservative financing policy is reflected in a debt servicecoverage ratio which, although declining, has remained above 1.6. During theperiod PEA's long-term debt as a percentage of its capital structure wasalways below 41%. (See Table 5.3.)
Table 5.3: SUMMARY HISTORICAL BALANCE SHEETS, FY77-FY81(In million of current Baht)
FY77 FY78 FY79 FY80 FY81
Net working capital 1,090 1,127 1,131 1,218 2,399Net fixed assets 4,241 5,265 6,874 9,054 11,889Other assets 125 40 152 542 492
Total Assets 5,456 6,432 8,157 10,814 14,780
Debt equity 2,372 2,528 3,029 4,302 6,563Equity 3,084 3,904 5,128 6,512 8,217
Total Liability & Equity 5,456 6,432 8,157 10,814 14,780
Debt as % of capital structure 37.3 34.4 32.7 35.3 41.0Current ratio 1.7 1.6 1.3 1.3 1.7Quick ratio 0.8 0.8 0.4 0.3 0.5
5.06 During the past five years PEA's current ratio exceeded 1.3 at alltimes. However, the quick ratio (current ratio excluding inventories) hasbeen declining reflecting the large accumulation of inventories. At the endof FY81 PEA's inventory was equivalent to 17 months of investment. This isconsidered on the high side. In addition,, the inventory is not properlybalanced presenting shortages of some key materials. PEA expects tomodernize its materials management systems as part of the program forstrengthening its operations (para. 4.14).
5.07 Detailed historical financial sltatements are presented in Annex11.
B. Future Profitability
5.08 A summary of PEA's projected income statement is presented inTable 5.4. PEA's rate of return on net revalued assets for FY82 isestimated at 7.3%.

- 30 -
Table 5.4: SUMMARY PROJECTED INCOME STATEMENTS, FY82-FY86(In millions of current Baht)
FY82 FY83 FY84 FY85 FY86
Energy sales (GWh) 5,842 6,553 7,478 8,321 9,354Revenues 10,985 13,263 15,921 18,108 21,425Average tariff B/kWh 1.80 1.94 2.06 2.11 2.23Operating expenditures /a 10,309 12,408 14,980 17,140 20,299Operating income 676 855 941 968 1,126Net income (loss) 146 189 155 165 221Rate of return (revalued) (x) 7.3 7.5 6.8 5.6 5.3Self-financing ratio (X) 17 21 19 18 19
/a Including depreciation on revalued assets.
5.09 Present covenants require EGAT and the sector to produce rates ofreturn on net revalued fixed assets of not less than 2% in FY81 and 8% inFY82 and thereafter, and PEA to earn rates of return consistent with thesector-s requirements. In FY81 the sector rate of return was 8.8% andEGAT's was 8.3%. It is now estimated that for FY82 the rates of returnfor ECAT and the sector will be 9.2% and 8.9% respectively. These covenantsas applicable to future years will be continued in the proposed loan. Underthe assumptions followed, the covenanted rates of return can be accomplishedwith modest tariff increases (para. 5.14). PEA would need to generate fundsequivalent to a rate of return of about 6% during the period FY83 throughFY86 to meet its financial requirements in terms of operating expenditures,investment, debt service and liquidity. After FY86, when the investmentprogram is expected to be substantially smaller, PEA's cash generationrequirements will decrease gradually.
5.10 The financial projections assume that some cross-funding will takeplace among EGAT, PEA and MEA by EGAT charging higher bulk tariffs to MEAthan to PEA.
C. Tariffs
5.11 PEA's Act provides that the Board of Directors has the power tofix the rates it charges for electricity. In practice, the Cabinet decideson the tariff adjustments, based on the recommendations of the Tariff RateCommittee. Under previous loans it was agreed to incorporate a fuel/powerpurchase cost adjustment clause in the Sector's and PEA-s tariff schedules.Such clause will be repeated in the proposed loan.

- 31 -
5.12 Tariffs were increased in February 1980 and, on the basis of aPlan of Action agreed under Loan 1852-TH, were further adjusted on October1, 1980, January 9, 1981 and April 1, 1981. In addition, a surcharge forheavy consumers was established in August 1980. These tariff adjustmentsrepresent an increase of about 158% between February 1980 and April 1981 onthe tariffs charged by EGAT to PEA, MEA and large direct consumers; 111% forPEA's consumers and 131% for users in MEA's service area. To reflect therecent drop in oil prices, minor reductions (about Baht 0.02 per kWh) insome categories of consumers were introduced in April 1, 1983.
5.13 Under Loan 1871-TH PEA agreed to review by April 30 every year theadequacy of its tariffs to produce the required rate of return. Similarly,under Loan 2000-TH the Government undertook to have periodic reviews of thetariffs of the three utilities to ensure that: (a) they are adequate to meetthe covenanted rates of return; and (b) they accomplish the required crossfunding among the three utilities as needed to enable them to carry outtheir respective investment programs. These covenants will be repeated inthe proposed loan.
5.14 The projected tariffs of EGAT, PEA and MEA (Baht per kWh) atcurrent prices are presented in Table 5.5.
Table 5.5: EGAT, PEA AND MEA PROJECTED TARIFFS(B/KWh)
FY82 FY83 FY84 FY85 FY86
EGATCurrent 1.43 1.48 1.57 1.59 1.66Real 1.43 1.38 1.37 1.30 1.28
PEACurrent 1.80 1.94 2.06 2.11 2.23Real 1.80 1.81 1.80 1.72 1.72
MEACurrent 1.85 1.93 2.07 2.09 2.19Real 1.85 1.80 1.81 1.71 1.69
5.15 For comparison purposes, the following are the long run marginalcosts recently estimated for each utility (B/kWh): EGAT 1.25; PEA 2.01 andMEA 1.55.

- 32 -
D. Financing of PEA's Development Program
5.16 PEA's financing plan for the period of implementation of theproposed loan, FY84-FY86, is presented in Table 5.6.
Table 5.6: PEA'S FINANCING PLAN, FY84-FY86
Baht US$ %(million) (million)
SourcesInternal sources 6,869 298.6 56.8Less: debt service 4,865 211.5 40.2
Net Internal Generation 2,004 87.1 16.6
Equity 671 29.2 5.6Borrowings 6,577 285.9 54.4Working capital decreases 1,452 63.1 12.0Other /a 1,373 59.8 11.0
Total Sources 12,077 525.1 100.0
ApplicationsProposed project 1,162 50.5 9.6Other capital expenditures 10,915 474.6 90.4
Total Applications 12,077 525.1 100.0
/a Includes consumers contributions and deposits.
5.17 Under the assumptions followed, PEA-s contribution from internallygenerated funds to its total investment program is expected to be 16.6%.If consumers contributions and deposits are included, the participation ofconsumer-related revenues rises to 27.6% of total investment.
5.18 PEA is expected to continue depending on foreign borrowings tofinance the foreign cost of its projects. Most of these loans have beencontracted, on very favorable terms, with the OECF, KFW, the KFAED, CIDA andOPEC Fund. Excluding CIDA loans which are interest free, interest rates onloans from these sources range from 2% to 6% p.a. Exchange risk on foreignloans is normally assumed by PEA. Because of the short investment period ofmost of its projects, it is PEA's policy not to capitalize! interest duringconstruction.

- 33 -
5.19 PEA expects to use in its investment program part of the inven-tories accumulated in recent years (para. 5.06); this will result in areduction of PEA's working capital.
5.20 Equity contributions are assumed to be limited to the reimburse-ment of the cost of projects sponsored by the Government for defense andsecurity purposes. As in previous loans, assurances were obtained duringnegotiations that the Government will provide adequate funds to cover anyshortfalls in financing the project.
E. Debt Control
5.21 Present covenants provide for the Bank to review PEA's borrowingswhen long-term debt as a percentage of total capitalization exceeds 60%.PEA is also required to limit its short- and medium-term debt (debt whichon issue matures within five years) to 10% of its total debt outstanding.In the past PEA has complied with both covenants and, under the assumptionsfollowed, PEA is expected to remain within these limits. It is intended torepeat both covenants in the proposed loan.
F. Liquidity Position
5.22 Under the assumptions followed, during the forecast period PEA'sliquidity is expected to remain adequate with a current ratio in excessof 1.3.
5.23 Detailed financial projections for PEA, EGAT and MEA arepresented in Annex 12 as well a consolidated projected income statement forthe sector. The assumptions followed are presented in Annex 13.
VI. ECONOMIC ANALYSIS
6.01 The Government of Thailand places a high priority to the ruraldevelopment as a key element supporting its dual objective of promotingeconomic growth and alleviating poverty. In this context, rural electri-fication in Thailand has played a decisive role in promoting economicdevelopment in rural areas. On the other hand, the NREP, by complementingother on-going rural electrification projects which extend the distributionnetwork to formally remote areas, enhances the benefits of the capitalinvestment in those projects.
Economic Rate of Return
6.02 Since the project to be financed under the proposed loan covers atime-slice of PEA's NRE Program, the economic analysis was made for the wholeprogram. The methodology followed is substantially the same as that usedfor evaluating the Second Accelerated Rural Electrification (Loan 1871-TH).

- 34 -
6.03 The economic rate of return of the project (ERR) is the discountrate that equalizes the economic costs and the direct and indirect benefitsattributable to the project over its life. In evaluating Rural electrifi-cation projects, in an attempt to better reflect the benefits of the project,it is customary to include in the ERR not only the direct benefits (derivedfrom the sales of electricity) as is done in other power projects, but alsothe so called indirect benefits. The indirect benefits are an estimate ofthe impact of the project in terms of cost savings and productivityincreases for the different groups of consumers intended to be served by theproject. The ERR so calculated is 14%. Details on the ERR calculation arepresented in Annex 14.
6.04 Sensitivity tests for variations in costs and benefits give thefollowing results:
ERR
(a) On basic assumption 14
(b) Project cost increased by:10% 1320% 12
(c) Energy cost increased by:10% 1320% 11
(d) Direct benefits decreased(due to lower sales than expected) by:
10% 1320% LO
(e) Indirect benefits decreased(due to overestimation of savings) by:
10% 1320% Li
6.05 If only direct benefits are included (including consumers contri-butions), the ERR would be -5%. This is normally the situation in ruralelectrification projects, due to the fact that they serve mostlyresidential consumers in the lower tariff brackets. In the particular caseof Thailand, as mentioned in para. 1.23, although a certain degree of crosssubsidization is desirable, it appears that tariffs for that group ofconsumers are unnecessarily low. This situation is expected to begradually corrected.
- 35 -
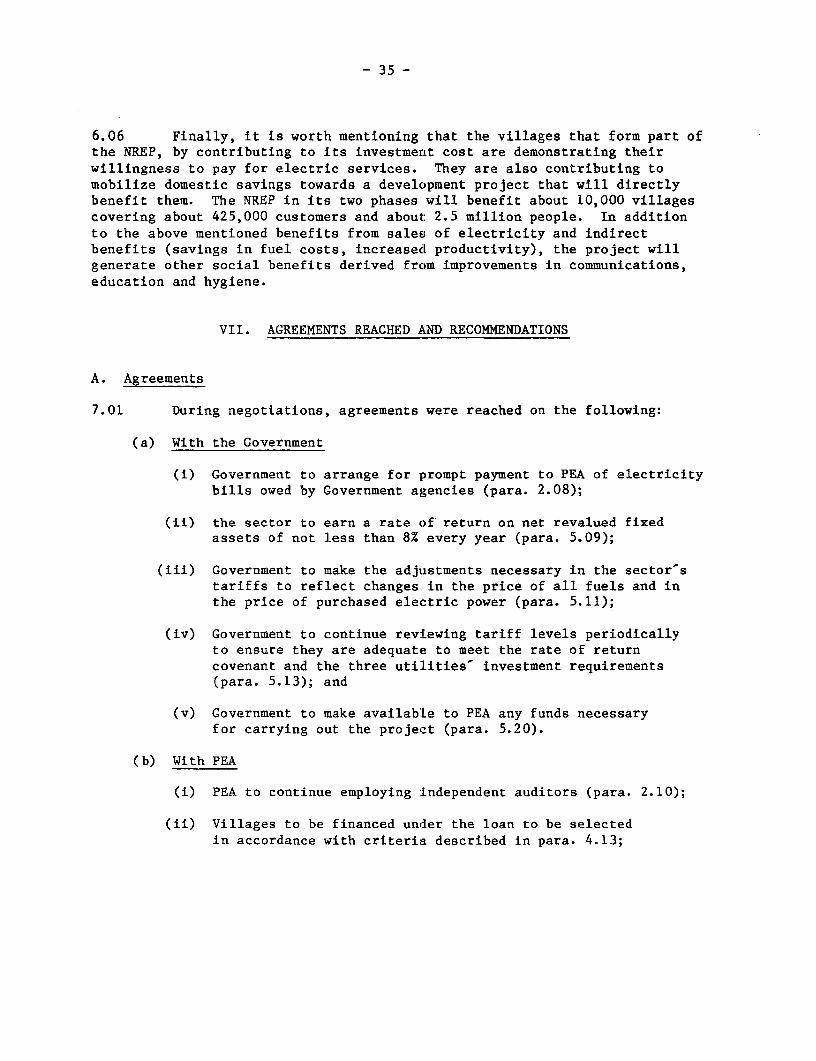
6.06 Finally, it is worth mentioning that the villages that form part ofthe NREP, by contributing to its investment cost are demonstrating theirwillingness to pay for electric services. They are also contributing tomobilize domestic savings towards a development project that will directlybenefit them. The NREP in its two phases will benefit about 10,000 villagescovering about 425,000 customers and about: 2.5 million people. In additionto the above mentioned benefits from sales of electricity and indirectbenefits (savings in fuel costs, increased productivity), the project willgenerate other social benefits derived from improvements in communications,education and hygiene.
VII. AGREEMENTS REACHED AND RECOMMENDATIONS
A. Agreements
7.01 During negotiations, agreements were reached on the following:
(a) With the Government
(i) Government to arrange for prompt payment to PEA of electricitybills owed by Government agencies (para. 2.08);
(ii) the sector to earn a rate of return on net revalued fixedassets of not less than 8% every year (para. 5.09);
(iii) Government to make the adjustments necessary in the sector'stariffs to reflect changes in the price of all fuels and inthe price of purchased electric power (para. 5.11);
(iv) Government to continue reviewing tariff levels periodicallyto ensure they are adequate to meet the rate of returncovenant and the three utilities' investment requirements(para. 5.13); and
(v) Government to make available to PEA any funds necessaryfor carrying out the project (para. 5.20).
(b) With PEA
(i) PEA to continue employing independent auditors (para. 2.10);
(ii) Villages to be financed under the loan to be selectedin accordance with criteria described in para. 4.13;

- 36 -
(iii) in the event that the grant from the ADAB cloes not materializeby September 30, 1983 PEA to prepare a Plan of Action tointroduce improvements in its operation and to submit suchPlan for Bank-s comments by December 31, 1983 (para. 4.17);
(iv) PEA to earn a rate of return consistent with the sector-srequirements (para. 5.09);
(v) PEA to continue the fuel/power purchased ccst adjustmentclause in its tariffs schedule (para. 5.11);
(vi) PEA to continue reviewing the adequacy of its tariffsby April 30 each year (para. 5.13); and
(vii) PEA to secure Bank's approval if long-term debt exceeds60% of the sum of equity and debt and to limit itsshort- and medium-term debt to 10% of its total debtoutstanding (para. 5.21).
B. Recommendations
7.02 With the agreements reached on the above, the project forms asuitable basis for a loan to PEA of US$30.6 million for a period of 20 yearsincluding 6 years grace, with the guarantee of the Royal Thai Government.

37 ANNEX 1
THAILAN!D
PROVINCIAL POWER DISTRIBUTION PROJECr
Highlights of EGAT, MEA and PEA Operations
FY75 FY76 FY77 FY78 FY79 FY80 FY81
EGATPeak generation (MW) 1,407 1,652 1,873 2,101 2,255 2,417 2,589Energy generation and purchases (GWh) 8,212 9,414 10,950 12,372 13,964 14,754 15,960
Energy sold (GWh) 7,642 8,696 10,149 11,516 12,933 13,657 14,545Losses in GWh 570 713 801 838 1,030 1,097 1,415Losses in % 6.9 7.6 7.3 6.8 7.4 7.4 8.9Annual load factor 66.6 65.0 66.7 67.2 70.7/a 69.67 70.38Number of employees 12,697 14,302 15,526 15,930 17,301 20,316 23,233Sales per employee (MWh) 602 603 653 720 747 672 626Employee per MW installed 5.2 5.9 6.4 5.7 6.0 6.3 6.2Average fuel consumption (liter/KWh) n.a. 0.259 0.263 0.257 0.260 0.264 0.260
MEAPeak demand (MW) 833 958 1,058 1,171 1,268 1,391 1,388Energy purchased (GWh) 5,051 5,607 6,392 7,146 7,951 8,286 8,476Energy sold (GWh) 4,790 5,285 6,054 6,807 7,606 7,867 8,182Losses (GWh) 261 322 338 339 345 419 311'Losses (as % of purchases) 5.2 5.7 5.3 4.7 4.3 5.0 3.7Number of consumers ('000) 506 541 580 607 678 744 793Sales/consumer (kWh) 9,466 9,769 10,510 11,214 11,218 10,524 10,296Residential sales, % of total 17.0 17.4 17.8 18.2 19.1 19.3 18.9Small business sales, Z of total 15.0 14.3 14.0 14.4 13.7 13.0 12.9Medium & large business sales,
% of total 67.0 67.8 67.7 66.3 66.7 67.2 67.8Street lighting, % of total 1.0 0.5 0.5 0.6 0.5 0.4 0.4Annual load factor (7) 69.2 66.8 68.9 69.7 71.5 67.8 69.7Number of employees 8,420 8,704 8,862 9,033 9,316 9,677 10,091Number of consumers/employee 60 62 65 67 72 74 78.6Sales per employee (MWh) 569 607 683 753 816 813 809
PEAPeak demand (MW) 517 640 741 852 949 1,040 1,181Energy purchased (GWh) 2,199 2,758 3,416 4,037 4,678 5,131 5,761Energy generated (GWh) 110 118 98 84 82 69 45Energy available (GWh) 2,309 2,876 3,514 4,121 4,760 5,200 5,806Energy sold (GWh) 2,120 2,617 3,174 3,650 4,254 4,696 5,210Losses in GWh 189 259 340 471 506 504 592Losses as % of available 9.2 9.0 9.7 11.4 10.6 9.7 10.2Consumers ('000) 780 927 1,144 1,350 1,574 1,886 2,270Average energy sales/consumer (kWh) 2,179 2,822 2,774 2,704 2,702 2,490 2,295Residential sales, % of total 26.0 24.0 25.0 27.0 27.7 29.0 30.4Small & general business, x of total 29.0 30.0 31.0 34.1 34.0 23.5 20.5Medium & large business & other
sales, % of total 44.0 45.0 43.0 38.4 37.9 47.0 48.7Street lighting, % of total 1.0 1.0 1.0 0.5 0.4 0.4 0.4Annual load factor (7) 53.2 51.3 54.1 55.2 57.3 57.1 n.a.Number of employees 7,502 8,023 8,883 10,620 12,274 14,310 16,262Number of consumers/employee 104 115 129 127 128 132 139Sales per employee (MWh) 282 326 357 344 346 328 320
/a On a generation basis.

THAILANDPROVINCIAL ELECTRICITY AUTHORITY
Orpni-SIWn CIlS ANNEX 2
|VCDINISTRATIONS RCOONOIC | CCOONTINGANDO FREOCLRTESENVSRC| AM OVIITVETONVWRIVT |INCW EIEOT,CRECR MIRISTST VS F ACNRNON ERO-NE-RIN OFERCTILII ARC SERVICES CORSTROVTION OrFFICE OF RURC,
A:D PESONNeL AND FFANCE OIA PR5FFjIN NARASCCTAlD CR VCCAIDNCL AEGOMNSRA-I ARTA ICe WVR ItATe OCGICRC;S OPRTtTDEATMN teTtICT
-| Fe~~~~~~~~~~ROSRIO WCEVOC ElCTI WORS ut |ELSCTSICWCRV I S jLEOVOIC WORK 1 | COORDINSATIWN
....... -~~~~~~~~~ ~~~~~~~~~~~~~IFINO1.l MAI, IJFRTNINIII...CC..TII0105A0
j We L FARe l Att j SLEcTRIC WDRK 2 | 0 RATHCHATHANII | j e LECTRIc wnRK v | LECI IC WORKWORELECTRIC WOVE
ILCESOVII RACAINOEW EEO S|IAFEA FAT MI| 100101
CIIL = E-EVTMICLNCF RE CISTRIFETICS | VTEF
REFAC SOA4MTIVE OLE ARMS
ES,RERN WVTFSWCPn 24I
q~~~~~~~~ff ] LE-N -AL ""'L~~~~~~~~~~~~~~~~~~~~~~~~~~~~~~~~~~~~OCOIEL CIGO W, ss SE

-39 ANNEX 3Table 1
THAILAND
THE PROVINCIAL ELECTRICITY AUTHORITY
PROVINCIAL POWER DISTRIBUTION PROJECT
Historical Evolution of PEA's Market
Average annualgrowth
Category FY77 FY78 FY79 FY80 FY81 %
A. PEA's Customers 1977-1981 ('000)
Residential 1,124.0 1,324.2 1,542.3 1,849.9 2,230.2 18.7Business 14.9 18.8 22.4 26.6 29.6 18.7Industrial 1.0 1.2 1.4 1.7 2.1 20.4Others 4.2 5.6 7.9 7.4 8.5 19.3
Total 1,144.1 1,349.8 1,574.0 1,885.6 2,270.4 18.7
B. PEA's Electricity Sales by Type of Customer 1977-1981(million kWh)
Residential 804.3 981.3 1,176.6 1,364.2 1,582.1 18.4Business 797.2 895.5 1,020.3 1,105.3 1,066.3 7.5Industrial 1,542.4 1,732.7 1,974.2 2,137.6 2,452.6 12.3Others 30.5 40.1 82.6 88.7 108.7 37.4
Total 3,174.4 3,649.6 4,253.7 4,695.8 5,209.7 13.2
Annual increase % 21.3 14.9 16.5 10.4 10.9
Peak demand MW 740.8 851.7 949.1 1,040.1 1,180.7 12.3
Annual increase % 15.7 15.0 11.4 9.6 13.5
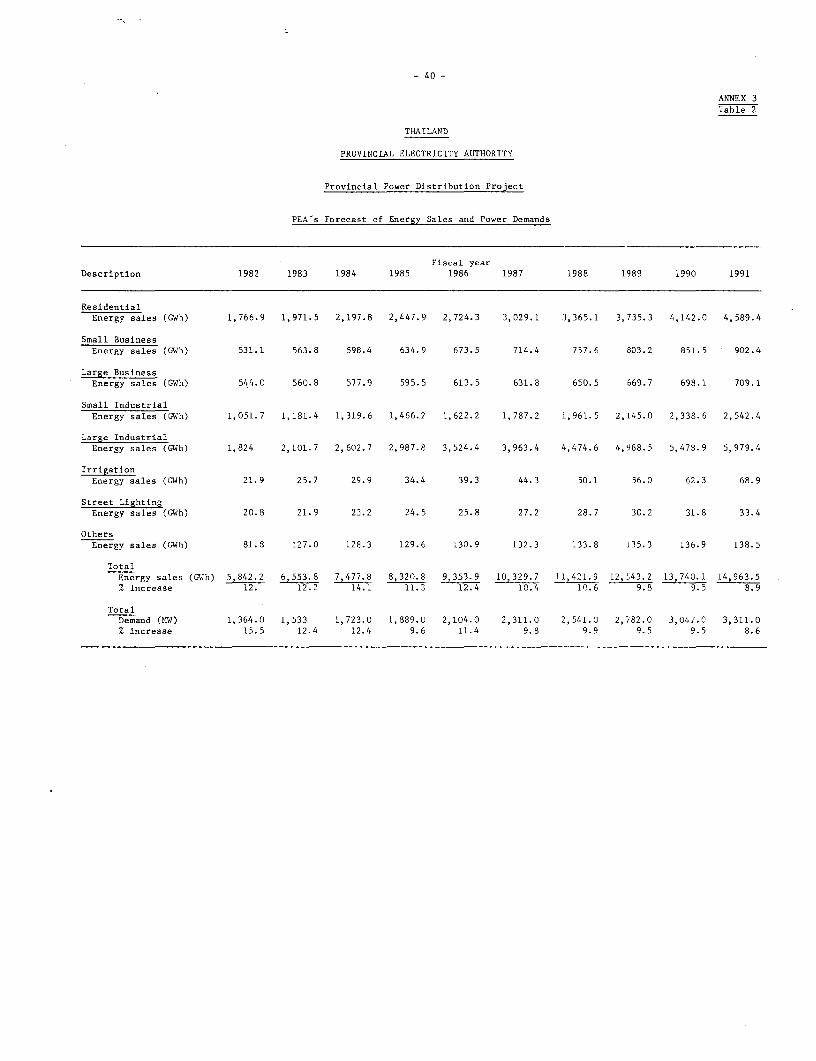
- 40 -
ANNEX 3
Table 2
THAILAND
PROVINCIAL ELECTRICITY AUTHORITY
Provincial Power Distribution Project
PEA's Forecast of Energy Sales and Power Demands
Fiscal year
Description 1982 1983 1984 1985 1986 1987 1988 1989 1990 1991
Residential
Energy sales (GWh) 1,766.9 1,971.5 2,197.8 2,447.9 2,724.3 3,029.1 1,365.1 3,735.3 4,142.0 4,589.4
Small Business
Energy sales (GWh) 531.1 563.8 598.4 634.9 673.5 714.4 757.6 803.2 851.5 902.4
Large BusinessEnergy sales (GWh) 544.0 560.8 577.9 595.5 613.5 631.8 650.5 669.7 698.1 709.1
Small Industrial
Energy sales (GWh) 1,051.7 1,181.4 1,319.6 1,466.2 1,622.2 1,787.2 1,961.5 2,145.0 2,338.6 2,542.4
Large Industrial
Energy sales (GWh) 1,824 2,101.7 2,602.7 2,987.8 3,524.4 3,963.4 4,474.6 4,968.5 5,478.9 5,979.4
Irrigation
Energy sales (GWh) 21.9 25.7 29.9 34.4 39.3 44.3 50.1 56.0 62.3 68.9
Street LightingEnergy sales (GWh) 20.8 21.9 23.2 24.5 25.8 27.2 28.7 30.2 31.8 33.4
Others
Energy sales (GWh) 81.8 127.0 128.3 129.6 130.9 132.3 133.8 135.3 136.9 138.5
Total
Energy sales (aWh) 5,842.2 6,553.8 7,477.8 8,320.8 9,353.9 10,329.7 11,421.9 12,,43.2 13,740.1 14,963.5% increase 12. 12.2 14.1 11.3 12.4 10.4 1C.6 9.8 9.5 8.9
TotalDemand (MW) 1,364.0 1,533 1,723.0 1,889.0 2,104.0 2,311.0 2,541.0 2,782.0 3,047.0 3,311.0
% increase 15.5 12.4 12.4 9.6 11.4 9.8 9.9 9.5 9.5 8.6

- 41 -ANNEX 4
THAILAND
PROVINCIAL ELECTRICITY AUTHORITY
PROVINCIAL POWER DISTRIBUTION PROJECT
PEA's Investment Program FY82-91
Estimated Source ofEstimated Cost completion foreign
Project Foreign Local Total date financing---- Baht million---
Distribution SystemReinforcement (2nd stage) - 21 21 1983
Accelerated Rural Electri-fication I 67 230 297 1983 IBRD/CIDA/OPEC
Normal Rural Electrification I 1,401 923 2,324 1985 IBRD/OECF
Accelerated RuralElectrification II 2,356 2,759 5,115 1986 IBRD/OPEC/CIDA
Saudi Fund/Norway
Village Electrification 1,202 1,194 2,396 1986 OECF
Distribution System (3 prov.) 364 330 694 1986 OECF
Minihydro Pilot Program 210 240 450 1986 Grants
Normal Rural Electrification II 812 546 1,358 1987 Undetermined
Distribution SystemReinforcement (3rd stage) 2,484 1,541 4,025 1990 OECF /a
Village Defense 913 908 1,821 1990 Government
Disribution SystemReinforcement (4th stage) 1,406 877 2,283 1991 OECF /a
Normal Rural Electrifiation2nd Stage 1,102 840 1,942 1991 Undetermined
Miscellaneous 1,456 1,231 2,687 - KfW/OECF
Total 13 773 11,640 25,413
/a Intended.

- 42 - ANNEX 5
THAILAND
PROVINCIAL ELECTRICITY AUTHORITY
PROVINCIAL POWER DISTRIBUTION PROJECT
Scope of Works of the NRE Program Phases I and II
Scope of Works Unit Quantity
3-phase main primary lines22 kV km 3,20033 kV km 500
1-phase primary line taps22 kV km 6,74033 kV km 560
Add phase lines22 kV km 1,00033 kV km 100
Drop-out Fuse Cutout22 kV ea 2,40033 kV ea 240
Distribution Transformers(10-250 kVA) kVA 210,000
Secondary Lines ea 17,500
Kwh Meters ea 425,000
Grounding Sets ea 38,500

43 ANNEX 6
THAILAND
PROVINCIAL ELECTRICITY AUTHORITY
Provincial Power Distribution Project
Backlog of Applications for Electrification under NREP-/
# Unelectrifiedvillages # Extensions
Construc- Construc- Construc- Construc- Totaltion was tion was tion was tion was # of
Region paid not paid paid not paid Villages
North 223 981 383 914 2,501Northeast 137 1,406 229 378 2,150Central 283 775 305 438 1,801South 205 474 235 273 1,187
Total 848 3,636 1,152 2,003 7,639
l/ As of May 1982.

ANNEX 7- 44-
THAILAND
PROVINCIAL ELECTRICITY AUTHORITY
PROVINCIAL POWER DISTRIBUTION PROJECT
Cost Estimate of the NREP Phases I and II
Foreign Local Total Foreign Local Total-------B millions------- ---- US$ million------
MaterialConcrete poles &
accessories 450.7 494.4 945.1 19.6 21.5 41.8Conductors 672.6 672.6 29.2 31.8Transformers 138.4 138.4 6.0 6.6Protection equipment 44.0 44.0 1.9 2.7Meters 122.3 122.3 5.3 7.5Accessories 220.3 220.3 9.6 10.9
Subtotal 1,648.3 494.4 2,142.7 71.6 21.5 93.1
Equipment, tools and vehicles 90.1 90.1 3.9 3.9
Labor Cost 310.7 310.7 13.5 13.5
Transportation 49.3 49.3 2.1 2.1
Engineering & Supervision 93.2 93.2 4.1 4.1
Duties & Taxes 230.2 230.2 10.0 10.0
Miscellaneous 75.1 39.8 115.5 3.3 1.7 5.0
Base cost/a 1,814.0 1,217.6 3,031.6 78.8 52.9 131.7
ContingenciesPhysical 63.5 43.0 106.5 2.8 1.9 4.7Price 335.4 208.5 543.9 14.6 9.1 23.7
Total Project 2,212.9 1,469.1 3,682.1 96.2 63.9 160.1
/a 3/83 prices.

- 45 -
ANNEX 8
THAILANDPROVINCIAL ELECTRICITY AUTHORITY
PROVINCIAL POWER DISTRIBUTION PROJECTProcurement and Implementation Schedule
1982 1983 1984 1985 1988 1987ITEM - … … … … … …
ITEM _~ ~~ 2 3 4 1 2 3 4 1 2 3 4 1j 3 4 1 2 34s4 1 2 3 4
1. PROCUREMENT SCHEDULE
1.1 Specification Approval Phase I
Phase 11
1.2 Bid Selling Phase I
Phase 11
1.3 Bid Opening Phase I ._ _
Phase 11
1.4 Bid Evaluation Phase I
Phase 11
1.5 Purchasing Approval Phase I _
Phase II
1.6 Letter of Intent Phase I
Phase Ii
1.7 Contract Awarding Phase I
Phase 11
1.8 Delivery Phase I - - - -_ - rtPhasel 11
2. IMPLEMENTATION SCHEDULE
a) Survey and Design Phase I -|
b) Construction Phase I -
Phase 11 _LI -
World Bank-24205
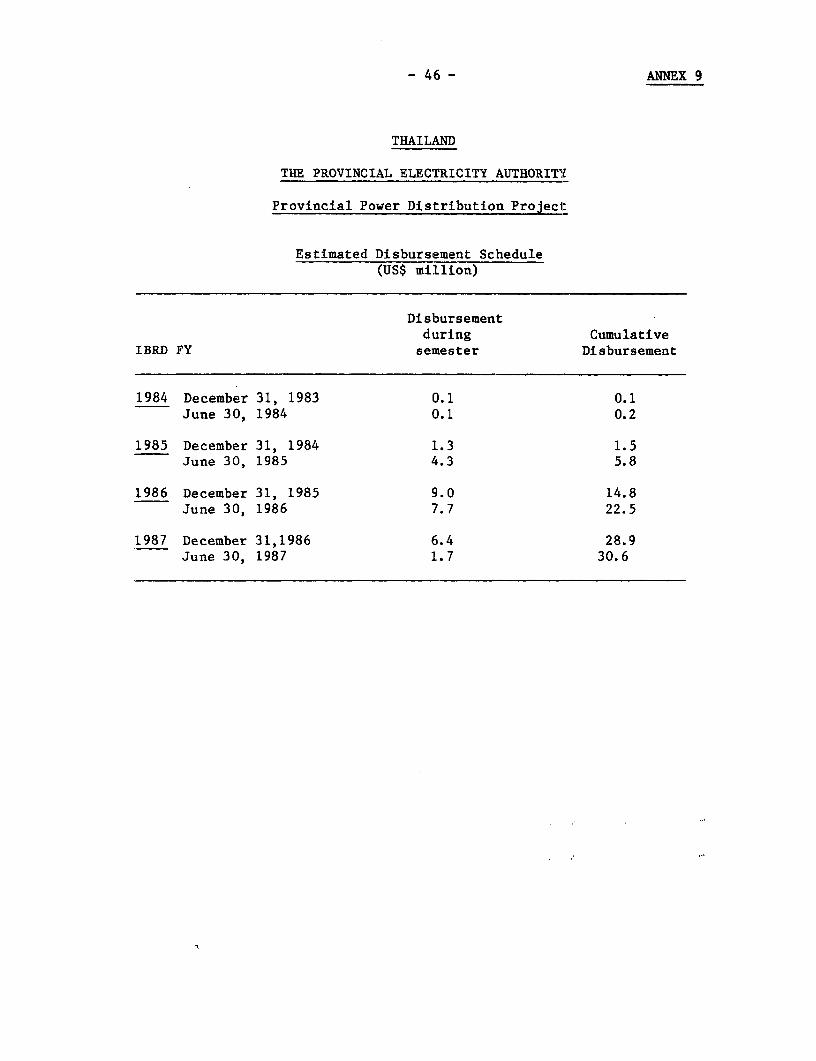
- 46 - ANNEX 9
THAILAND
THE PROVINCIAL ELECTRICITY AUTHORITYE
Provincial Power Distribution Projeci:
Estimated Disbursement Schedule(US$ million)
Disbursementduring Cumulative
IBRD FY semester Disbursement
1984 December 31, 1983 0.1 0.1June 30, 1984 0.1 0.2
1985 December 31, 1984 1.3 1.5June 30, 1985 4.3 5.8
1986 December 31, 1985 9.0 14.8June 30, 1986 7.7 22.5
1987 December 31,1986 6.4 28.9June 30, 1987 1.7 30.6

ANNEX 10Page 1
THAILAND
PROVINCIAL ELECTRICITY AUTHORITY
PROVINCIAL POWER DISTRIBUTION PROJECT
Description of PEA's Monitoring System
1. At the time the village is selected for electrification a surveyis prepared by trained staff. The following data is collected:
(a) Village Data
- Population- Number of households- Potential number of customers- Potential number of street lights- Agricultural land (in Rais)- Number and types of animals- Number of water pumps- Number of trucks, tractors and other vehicles- Information on water supply- Public buildings- Commercial shops- Number of farms by types- Rural industries
(b) Household data (sample of about 10% of the village)
- Size of the family- Sources of income- Financial information- Present consumption of energy by sources- Potential consumption of electricity
(c) Business Data
- Type of commercial activity- Financial information- Number of workers employed- Present consumption of energy by source- Potential consumption of electricity

ANNEX 10- 48- Page 2
2. One or two months after the village is electrified informationbegins to be updated. Every village headman, shop, business, ricemill andpublic building is interviewed as well as 10%' of the households. Informationon energy assumption and number of consumers is collected on a monthlybasis. The balance of the information is collected once a year.
3. Data collected is processed in a computer and significant data issummarized.
4. When the project is completed, the impact of the project isassessed in terms of number of customers connected, energy consumption bytype of use. Benefits including savings to the consumers are estimatedand economic rate of return of the project is calculated.
5. The results of the post-evaluation is submitted to the NESDB andto the Project Operation Auditors of the Prime Minister Office.
6. Post-evaluation has been done for two projects aLready completed.The Village Electrification Project in three :Southern Prov:Lnces (VES-3),implemented between 1977 to 1980, had an estimated economic rate of return(ERR) of 5% calculated at the time of appraisal. The post--evaluation showedan ERR of 23%. The second project, the Village Electrification Project in10 Northeast Provinces (VENE 10), implemented in the same period, had a ERRof 12% estimated at the time of appraisal and the post-evaluation resultedin a ERR of 28%.
7. Copies of the forms used by PEA to monitor its projects areavailable in the Project File.

ANNEX 11
-49 - Table 1
THAILAND
THE PROVINCIAL ELECTRICITY AUTHORITY
PROVINCIAL POWER DISTRIBUTION PROJECT
Income Statements, FY77-81(In millions of current Baht)
Average
annualFY77 FY78 FY79 FY80 FY81 growth
Energy sales (GWh) 3,174.4 3,649.6 4,253.7 4,695.9 5,209.7 13.2Sales increase (%) 21.3 15.0 16.5 10.4 10.9Average price (B/kWh) 0.75 0.87 0.87 1.08 1.62 22.3
Energy revenue 2,184 3,081 3,593 4,937 8,441 40.2Other operating revenue 210 87 104 143 301 9.4
Total Operating Revenue 2,394 3,168 3,697 5,080 8,742 38.2
Operating CostPurchased power 1,299 1,942 2,240 3,389 6,641 50.4Fuel and oil 98 99 100 121 119 4.9Operating and maintenance 536 530 675 925 1,077 19.0Depreciation (revalued) 207 240 333 408 591 30.0
Total Operating Expenditures 2,140 2'L811 3,348 8,428 40.9
Operating income 254 357 349 237 314 5.4Other income and expenses (net) - ill 107 58 118Interest 81 114 114 149 281 36.5
Net Income 173 354 342 146 151 3.3
Appropriations of Net IncomeEmployee bonus 15 22 31 35 23Retained earnings 158 332 311 111 128
Rate BaseNet revalued fixed assets 3,525 4,340 5,724 7,197 10,295Less: revalued consumer con-
tributions 839 1,083 1,476 1,907 2,659
Total 2 686 1 257 4,248 5,290 7,635
Average rate base 2,465 2,971 3,752 4,769 6,462Rate of return (%) 10.3 12.0 9.3 5.0 4.8
Operating ratio (%) 89 89 91 95 96

-50- ANNEX 11TabLe 2
THAILAND
THE PROVINCIAL ELECTRICITY AUTHORITY
PROVINCIAL POWER DISTRIBUTION PROJECT
Funds Flow Statement, FY77-81(In millions of current Baht)
FY77 FY78 FY79 FY80 FY81
Sources of FundsInternal SourcesOperating income 254 357 349 237 314Add: Depreciation 207 240 333 408 591
Other income - 111 107 58 118
Subtotal 461 708 789 703 1,023
Borrowings 673 413 740 1,344 2,516Equity investments 10 77 49 63 205Consumer contributions 125 188 234 139 486Grants - 6 10 8 7Consumer deposits 49 53 59 80 134Other 88 - - 130 54
Total Sources Funds 1,406 1,445 1,881 2,467 4,425
Applications of FundsCapital expenditures 902 1,051 1,320 1,527 2,452Debt service
Interest 81 114 114 149 281Repayment of loans 27 72 162 218 356
Subtotal 108 186 276 367 637
Increase in working capital 320 161 141 153 1,185Employee bonus 15 22 31 35 23Other 61 25 113 385 128
Total Applications of Funds 1,406 1,445 1,881 2,467 4,425
Debt service coverage 4.2 :3.8 '2.8 1.9 i 1.6Contribution to construction afterdebt service 39.1 49.6 38.8 22.0 15.7

ANNEX 11- 51 - TabLe 3
THAILAND
THE PROVINCIAL ELECTRICITY AUTHORITY
PROVINCIAL POWER DISTRIBUTION PROJECT
Balance Sheet, FY77-81(In millions of current Baht)
FY77 FY78 FY79 FY80 FY81
AssetsCurrent Assets
Cash 727 1,050 816 348 344Receivables - trade (net) 299 282 286 493 984Receivables - others 180 171 209 305 305Inventories 1,237 1,489 2,893 4,151 3,983
Total Current Assets 2,443 2,992 4,204 5,297 5,616
Plant in service 4,925 6,073 8,043 10,380 14,515Less: Accumulated depreciation 1,400 1,733 2,319 3,133 4,220
Net Plant in Service 3,525 4,340 5,724 7,197 10,295
Work in progress 716 925 1,150 1,857 1,594Other assets 125 40 152 542 492
Total Assets 6,809 8,297 11,230 14,893 17,997
Equity and LiabilitiesLiabilitiesCurrent Liabilities
Accounts payable - trade 751 915 1,944 2,569 1,837Accounts payable - other 29 76 59 96 136Advances from customers 530 707 765 1,044 870Current maturities 43 167 305 370 374Other current liabilities 104 - - 89 56
Total Current Liabilities 1,457 1,865 3,073 4,l68 3,273
Long-term debt (net) 1,837 2,052 2,494 3,557 5,713Consumer deposits 202 255 314 394 528Other liabilities 229 221 221 262 266
EquityPaid-in capital 638 716 765 828 1,033Retained earnings 981 1,313 1,624 1,735 1,863Grants - 34 44 52 59Consumer contributions 591 755 989 1,128 1,614Revaluation surplus 874 1,086 1,706 2,769 3,648
Total Equity 3,084 3,904 5,128 6,512 8,217
Total Equity and Liabilities 6,809 8,297 11,230 14,893 17,997
Debt as % of total capitalization 37.3 34.4 32.7 35.3 41.0Current ratio 1.7 1.6 1.3 1.3 1.7Quick ratio 0.8 0.8 0.4 0.3 0.5Net working capital 986 1,127 1,131 1,129 2,343
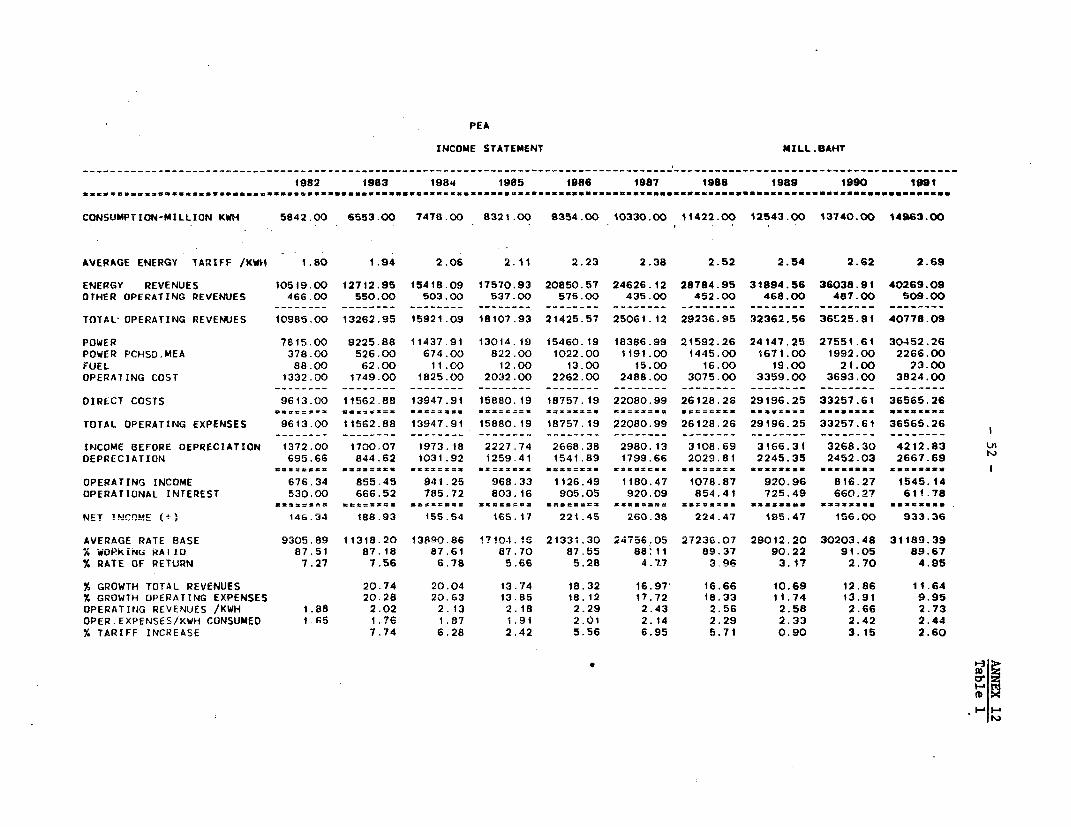
PEA
INCOME STATEMENT MILL.SAHT
----------------------------------- __-__--___----------------------------__--__-------------------------------------------------
1982 1983 1984 1985 1986 1987 1988 1989 1990 1991* = a tan, a sawn ..a W.." ......... WaWaa .................... n .a w .=as . ... - annass ... aa .a... Nun*n ........ .a.aan..a.
CONSUMPTION-MILLION KWH 5842.00 6553.00 7478.00 8321.00 9354.00 10330.00 11422.00 12543.00 13740.00 14S63.00
AVERAGE ENERGY TARIFF /KWH 1.80 1.94 2.06 2.11 2.23 2.38 2.52 2.54 2.62 2.69
ENERGY REVENUES 10519.00 12712.95 15418.09 17570.93 20850.57 24626.12 28784.95 31894.56 36038.91 40269.09OTHER OPERATING REVENUES 466.00 550.00 503.00 537.00 575.00 435.00 452.00 468.00 487.00 509.00
TOTAL OPERATING REVENUES 10985.00 13262.95 15921.09 18107.93 21425.57 25061.12 29236.95 32362.56 36c25.91 40778.09
POWER 7815.00 9225.88 11437.91 13014.19 15460.19 18386.99 21592.26 24147.25 27551.61 30452.26POWER PCHSD.MEA 378.00 526.00 674.00 822.00 1022.00 1191.00 1445.00 1671.00 1992.00 2266.00FUEL 88.00 62.00 11.00 12.00 13.00 15.00 16.00 19.00 21.00 23.00OPERATING COST 1332.00 1749.00 1825.00 2032.00 2262.00 2488.00 3075.00 3359.00 3693.00 3824.00
DIRECT COSTS 9613.00 11562.88 13947.91 15880.19 18757.19 22080.99 26128.26 29196.25 33257.61 36565.26.==.. ..a . . .... a ... =aa=se = .... = s-=..=.. S.- .=.a .w..as..... .wu .... ... a..TOTAL OPERATING EXPENSES 9613.00 11562.88 13947.91 15880.19 18757.19 22080.99 26128.26 29196.25 33257.61 36565.26
INCOME BEFORE DEPRECIATION 1372.00 1700.07 1973.18 2227.74 2668.38 2980.13 3108.69 3166.31 3268.30 4212.83DEPRECIATION 695.66 844.62 1031.92 1259.41 1541.89 1799.66 2029.81 2245.35 2452.03 2667.69
ansa annaaa att a....a natal== .. a....n.t. a .annaasa..a. .aa..a.w... aaa.an taaaOPERATING INCOME 676.34 855.45 941.25 968.33 1126.49 1180.47 1078.87 920.96 816.27 1545.14OPERATIONAL INTEREST 530.00 666.52 785.72 803.16 905.05 920.09 854.41 725.49 660.27 611.78
ans=ta== nICt==5t=t at===== nt1nn=a..= aa=ana nat:2= =s==a.=. aana nalasasa .S..t... aNET INCOME (- 146.34 188.93 155.54 165.17 221.45 260.38 224.47 195.47 156.00 933.36
AVERAGE RATE BASE 9305.89 11318.20 13890.86 1?1041.16 21331.30 24756.05 27236.07 29012.20 30203.48 31189.39% WOPKING kATIO 87.51 87.18 87.61 87.70 87.55 8811 89.37 90.22 91.05 89.67% RATE OF RETURN 7.27 7.56 6.78 5.66 5.28 4.7. 3 9S 3.17 2.70 4-95
% GROWTH TOTAL REVENUES 20.74 20.04 t3.74 18.32 16.97' 16.66 10.69 12.86 11.64% GROWTH OPERATING EXPENSES 20.28 20.63 13.85 18.12 17.72 18.33 11.74 13.91 9.95OPERATING REVENUES /KWH 1.88 2.02 2.13 2.18 2.29 2.43 2.56 2.58 2.66 2.73OPER.EXPENSES/KWH CONSUMED 1.65 1.76 1.87 i.9i 2.01 2.14 2.29 2.33 2.42 2.44% TARIFF INCREASE 7.74 6.28 2.42 5.56 6.95 5.71 0.90 3.15 2.60
*I 1 a

PEA
FLOW OF FUNDS MILL.BAHT
i92 1983 1984 1985 1986 1987 1988 1989 1990 1991
SOURCES OF FUNDS-t _== =======
INZOMSE BEFORE OEPRECIATION 1372.00 1700.07 i973.18 2227.74 2668.:38 2980.13 3108.69 3166.31 3268.30 4212.83
GROSS INTF04JAL GENERATION 1372.00 1700.07 1973.18 2227.74 2668.38 2980.13 3108.69 3166.31 3268.30 4212.83OTiHER CN'TRI8UTIONJS 231.00 240.00 273.00 201.00 133.00 20.00 18.00 15.00 15.00 15.00CUSTOMERS OJEFCSITS 155.00 359.46 221.82 176.53 263.93 309.59 341.02 254.99 339.84 346.87INCREASE OTHER LIABILITIES -113.00 97.00 -7.00 -7.00 2.00 2.00 2.00 2.00 2.C0 2.00EOUITf INCREASE 83.00 312.00 264.00 207.C0 200.00 0.0 0.0 0.0 0.0 0.0
I8RO LOAN 0.0 0.0 14.95 221.95 354.20 112.70 0.0 0.0 0.0 0.0
O;i-'Ek tO'NS 184G.00 3026.30 932.08 2355.21 2698.71 893.30 1403.00 514.00 799.00 251.00
TOTAL 1f2W'5 1846.00 3026.30 947.03 2577.16 3052.91 1006.00 1403.00 514.00 799.00 251.00
TOTAL SCURCES 3574.00 5734.83 3672.03 53S2.43 6325.21 4317.73 4872.71 3952.30 4424.14 4827.70
APPLICATION'lS OF FUNDS
P1T0JEC'T INVESTMENT 0.0 0.0 130.20 607.20 424.50. 0.0 0.0 0.0 0.0 0.0 I
GTHE. ltIVI-STMENT 2981.00 3125.30 3541.40 3896.90 3476.60 1592.00 2603.00 1238.00 1080.00 950.00
TOTtL CAPYI/L EXPENJDITURES 29L:.0o 3125.30 3671.60 4504.10 3901.10 1592.00 2603.00 1238.00 1080.00 950.0OA.S2RTI24TlN FCREIGN LOANS 0.0 0.0 0.0 O.C 0.0 0.0 0.0 0.0 43.99 50.27
AMG;ZTIZATION OTHER LOANS S30.C0 362.00 468.00 768.00 1135.00 1306.00 1506.53 1350.18 1205.91 2561.55
TOTr.1 AMORTZATION 330.00 362.00 4G8.00 768.0G 1135.00 .306.00 150G.53 1350.18 1249.90 2611.82OPERATIOtNAL INTEREST 530.00 66G652 785.72 803.16 905.04 920.09 854.41 725.49 660.27 611.78
TCrAL DEST SERVICE 860.00 1028.52 1253.72 1571.16 2040.04 2226 09 2360.94 2075.G7 1910.16 3223.60INCREASE IN WOR:<.CAPITAL 93.00 1368.01 -1218.29 -652.83 419.08 544.03 -66.22 683.63 1458.97 689.10OTHER AS;FTS -3_60 00 213.00 -35.00 -40.00 -35.00 -45.00 -25.00 -45.00 -25.00 -35.00
TOTAL '.PPLICATIO,"!S 35741.00 5734.83 3672.03 5382.43 6325.21 4317.73 4872.71 3952.30 4424.14 4827.70
DE8T SE7VICOt RATIO 1.60 1.65 1.57 1.42 1.31 1.34 1.32 1.53 1.71 1.31% CONTRIECBUON TO INVESTMENT 16.90 20.60 19.10 16.31 18.86 27.94 41.29 66.49 124.68 99.59
IS m

PEA
BALANCE SHEET MILL.BAHT
----------------------------------------------------------------- __----------__------------------------------------------------
1982 1983 1984 1985 1986 1987 1988 1989 1990 1991...ts...s..s..ass..s...................... ......asssass... ==......sa...t.S.......sW.sm.5 ........ ........ S.......SS .... .5S
A S S E T S
FIXED ASSETS IN OPERATION 16962.9 21255.4 25438.0 31540.7 38219.8 43213.0 48633.8 52965.8 57985.8 62724.0ACCUMULATED DEPRECIATION 5168.8, 6401.1 7897.1 9709.3 11833.7 14343.4 17233.9 20513.3 24196.1 28315.6
NET FIXED ASSETS 11794.0 14854.2 17540.8 21839.4 26386.0 28869.5 31399.9 32452.5 33789.7 34408.4WORK IN PROGRESS 2998.0 3103.0 4133.0 4307.0' 3430.0 2322.0 2097.0 1921.0 1159.0 850.0
CASH AND BANKS 366.0, 295.6 396.3 399.i 1278.7 1248.2 1809.9 2521.5 4000.5 4498.1ACCOUNTS RECEIVABLE 1261.0 1485.4 1783.1 2028.0 2399.6 2806.8 3274.5 3624.6 4090.9 4567.1OTHER RECEIVABLES 438.01 270.0 243.0 219.0 197.0 177.G 159.0 143.0 135.0 130.0INVENTORIES 3760.0 4495.0 3144.0 2290.0 1730.0 2383.0,. 1871.0 1963.0 2091.0 2327.0
TOTAL CURRENT ASSETS 5825.0 6546.0 5566.5 4936.2 5605.4 6615.0 7114.5 8252.1 10317.4 11522.2OTHER ASSETS 132.0 345.0 310.0 270.0 235.0 190.0 165.0. 120.0 95.0 60.0
sWass.. ss=aa.m. asnsum =.===r. C=t=s=s as..... ....f..m ...... 5. .s.... .... ..
TOTAL ASSETS 20749.0 24848.3 27550.4 31352.6 35656.4 37996.6 40776.4 42745.7_ 45361.1 46840.6
EQUITY AND LIABILITIES
EQUITY 1116.01 1428.0 1692.0 1899.0 2099.0 2099.0 2099.0' 2099.0 2099 0 2099.0 1CONTRIBUTIONS AND GRANTS 1904.0, 2144.0 2417.0' 2618.0 2751.0 2771.0 2789.0 2804.0 2819.0 2834.0REVALUAlION SURPLUS 4265.7 5150.2 6227.1 745,5.0 8765.4 10348.51 12080.7 13964.7 15911.9 17939.3'OPERATIONAL SURPLUS 2009.3 2198.2 2353.8' 2518.9 ' 2740.4 3000.7 3225.2 3420.7 3576.7 4510.0
TOTAL EQUITY 9295.0 10920.5 12689.9' 14491.0. 16355.8 18219.3 20194.0 22288.4 24406.6 27382.3
LONG TERM DEBT(NET) 7241.0 9799.3 9978.3 11420.4 13167.3 12666.8 12719.6 11983.7 10170.9 9694.8
ACCOUNTS PAYABLE 1708.0 1513.0. 1875.8 2134.3 2535.4 3015.4 3541.1' 3960.1 4518.4 4994.1PAYABLES TO MEA 60.0 86.0 110.0 134.0 167.0 195.0( 237.0 274.G 326.01 371.0CUSTOMERS ADVANCES 1191.0 713.0 565.0' 305.0 121.0 78.0 76.0 74.0 70.0 65.0CURRENT MATURITIES 362.0 468.0 768.0 1135.0 1306.C 1506.5' 1350.1 1249.9 261i.8 727.0
TOTAL CURRENT LIABILITIES 3321.0 2780.0 3318.8 3708.3 4129.4 4794.9 5204.3 5558.0 7526.2 6157.2CUSTOMERS DEPOSITS 683.0 1042.4 1264.2 1440.8 1709.7 2019.3 2360.3 2615.3 2955.1 3302.0OTHER LIABILITIES 209.0 306.0 299.0 292.0 294.0 296.0' 298.0 300.0 302.0 304.0
TOTAL LIABILITIES 11454.0 13927.8 14860.4 16861.6 19300.6 19777.4 20582.3 20457. 20954.4 19458.1.m.n... a.2..... nt.s.... . .... s. 5555.. . 5m.... a ss...ss...... ....... .5...... Sa... .
10fAt_ EQUITY-LIABILITIES 20749 0 24848.3 27550.4 31352.6 35656.4 37996.6 40776.4 42745.7 45361.1 $6840.6
NO.DAYS ACCOUNTS RECEIVABLE 41 40 40 40 40 40 40 40 40 40 %DEEr/(NET ASSETS + WIP) 48.95 54.57 46.04 43.68 44.16 40.61 37.97 34.86 29.10 27.50 (D X*WORKING CAPITAL-MILLION 2866.00 4234.01 3015.72 2362.90 2781.97 3326.61 3260.39 3944.02 5402.98 6092.08 F*CURRENT RATIO . 1.75 2.35 1.68 1.33 1.36 1.38 1.37 1.48 1.37 1, 67% DEBT/(DEBT+EQUITY) 43.79 47.29 44.02 44.07 44.60 41.01 38.65 34.97 29.41 26.15

EGAT
INCOME STATEMENT MILL.BAHT
----------------------------------------------------------------- __----------__-------------------------------------------------
1982 1983 1984 1985 1986 1987 1988 1989 1990 1991... s.....s...=.. ..ss..s..s.sfsf rlS=t=s .us..... . .. u .wt...am=s ......... asm... a ... a.... .... nSSutfcUW t=SUW s.
CONSUMPTION-MILLION KWH 15402.00 16678.00 18212.00 19906.00 21697.00 23606.00 25637.00 27816.00 30125.00 32595.00
AVERAGE ENERGY TARIFF /KWH t.43 1.48 1.57 1.59 1.66 1.78 1.89 1.92 2.00 2.05
ENERGY REVENUES 22088.00 24639.43 28622.60 31562.15 36053.17 42125.41 48389.45 53325.61 60232.84 66953.44OTHFR OPERATING REVENUES 38.00 25.00 25.00 25.00 25.00 25.00 25.00 25.00 25.00 25.00
TOTAL OPERATING REVENUES 22126.00 24664.43 28647.60 31587.15 36078.17 42150.41 48414.45 53350.61 60257.84 66978.44
POWER 12103.00 12914.00 14812.00 13369.00 14115.00 16867.00 19933.00 20602.00 20798.00 22852.00LIGNITE 682.00 676.00 986.00 1708.00 2512.00 2971.00 3240.00 3958.00 5998.00 6998.00OPERATIONS 2646.00 4333.00 4451.00 5585.00 5831.00 6479.00 7156.00 7944.00 9145.00 10189.00
DIRECT COSTS 15431.00 17923.00 20249.00 20662.00 22458.00 26317.00 30329.00 32504.00 35941.00 40039.00===w s=rs2=====n .n=tae= fl=r=n£ .s ==.-fl fle ==r fit Sssw *-S-S-.. rasn. *
TOTAL OPERATING EXPENSES 15431.00 17923.00 20249.00 20862.00 22458.00 26317.00 30329.00 32504.00 35941.00 40039.00
INCOME BEFORE DEPRECIATION 6695.00 6741.43 8398.60 10925.15 13620.17 15833.41 18085.45 20846.61 24316.84 26939.44 lDEPRECIATION 2556.78 2512.92 3258.35 4233.29 5497.80 6309.22 7169.64 8225.20 9644.86 10815.76 v
= = ===========-9== Jt=- *-==S S*=S===- .
OPERATING INCOME 4138.22 4228.51 5140.25 6691.86 8122.37 9524.19 10915.81 12621.41 14671.98 16123.68OPERATIONAL INTEREST 1937.00 2386.00 2446.00 3587.00 4648.00 5674.00 6544.52 7269.45 8253.02 9032.63
ffmmmmmfm s s T= an s ... Xt t== g =la =7n: af snu *S SSS S..mS a. U-**" WSS S *** -SS** =* *- ** *fU S *--*-* *-
NET INCOME (+) 2201.22 1842.51 2694.25 3104.86 3474.37 3850.19 4371.29 5351.96 6418.96 7091.04
AVERAGE RATE BASE 44917.06 50356.50 61677.47 77830.37 93596.19 107959.56 121085.00 137964.31 160176.37 185459.81% WORKING RATIO 69.74 72.67 70.68 65.41 62.25 62.44 62.64 60.93 59.65 59.78% RATE OF RETURN 9.21 8.40 8.33 8.60 8.68 8.82 9.01 9.15 9.16 8.69
% GROWTH TOTAL REVENUES 11.47 16.15 10.26 14.22 16.83 14.86 10.20 12.95 11.15% GROWTH OPERATING EXPENSES 16.15 12.98 2.04 8.69 17.18 15.24 7.17 10.57 11.40OPERATING REVENUES /KWH 1.44 1.48 1.57 1.59 1.66 1.79 1.89 1.92 2.00 2.05OPER.EXPENSES/KWH CONSUMED 1.00 1.07 t.11 1.04 1.04 1.11 1.18 1.17 1.19 1.23% TARIFF INCREASE 3.02 6.38 0.60 4.60 7.39 5.77 1.57 4.30 2.73
fD I

EGAT
FLOW OF FUNDS MILL.BAHT
1982 1983 1984 1985 1986 1987 1988 1989 1990 1991
SOURCES OF FUNDS
INcnME BEFORE DEPRECIATION 6695.00 6741.43 8398.60 10925.15 13620.17 t5833.41 18085.45 20846.61 24316.84 26939.44
GROSS INTERNAL GENERATION 6695.00 6741.43 8398.60 10925.15 13620.17 15833 41 18085.45 20846.61 24316.84 26939.44SELF-INSURANCE FUND 198.00 39.50 43.45 47.79 52.57 57.83 63.61 69.98 76.97 84.67EQUITY INCREASE 981.00 664.00 664.00 295.00 154.00 62.00 0.0 0.0 0.0 0.0
IBRD LOAN 0.0 80.50 701.50 860.20 938.40 664.70 469.20 195.50 0.0 0.0OTHER FOREIGN LOANS 0.0 4159.00 0.0 1644.00 1210.00 1695.00 865.00 726.00 202.00 2420.00
OTHER LOANS 9781.31 10439.00 10369.00 13094.00 13778.00 15074.00 15372.00 14123.00 15633.00 16193.00
TOTAL BORROWING 9781.31 14678.50 11070.50 15598.20 1592f.40 17433.70 16706.20 15044.50 15835.00 18613.00-==W.T== .S=S3 .. SS.S =w===2-Sl......... .... a ... ...... =.. SaSS..
TOTAL SOURCES 17655.31 22123.43 20176.55 26866.14 29753.14 33386.94 34855.26 35961.08 40228.81 45637.11
APPLICATIONS OF FUNDS
PROJECT INVESTMENT 124.31 907.50 1553.94 2523.20 3232.20 2623.06 1466.92 0.0 0.0 0.0CAPITALIZED INTEREST 1201.00 1520.15 2884,33 3199.13 3561.15 4651.81 4311.85 5524.32 5627.00 5614.28OTHER INVESTMENT 10966.00 12881.00 9051.00 11652.00 11870.00 12957.00 14476.00 15228.00 16239.00 18376.00
- _ - ___ -- ----- --- -_-- --- -- - ------------- -- --- - --- --- --- ------- -- -- - --- - -- -- - -- - -- -- --- - - -- ----- -l
TOTAL CAPITAL EXPENDITURES 12291.31 15308.65 13489.27 17374.33 18663.35 20231.87 20254.77 20752.32 21866.00 23990.28 aAMORTIZATION FOREIGN LOANS 0.0 0.0 0.0 0.0 0.0 0.0 228.08 260.67 260.67 1184.49
AMORTIZATION OTHER LOANS 1152.00 1443.00 3003.00 4769.00 5143.00 5876.00 6391.00 6264.00 7819.00 9559.00
TOTAI AMORTIZATION 1152.00 1443.00 3003.00 4769.00 5143.00 5876.00 6619.08 6524.66 8079.66 10743.49OPERATIONAL INTEREST 1937.00 2386.00 2446.00 3587.00 4648.00 5674.00 6544.52 7269.45 8253.02 9032.63
.... ..... =- .. = ........ S =: ..s..Ws Ss. S.....S..S.Sr S
TOTAL DEBT SERVICE 3089.00 3829.00 5449.00 8356.00 9791.00 11550.00 13163.60 13794.11 16332.68 19776.12INCRFASE TN WOOK CAPITAL 2077.00 2946-28 1194 83 1O08.02 1246.22 1B47.25 1373.28 1344.68 1i93 16 1786.04INSURANCE FUND 198.00 39.50 43.45 47.79 52.57 57.83 63.61 69.98 76.97 84.67
…. .......... * .*........ ........ ................. l .... . . . ....... ..... a...... ........
TOTAL APPLICATIONS i7655.3i 22123.43 20176.55 26866.14 29753.14 33386.94 34855.26 35961.08 40228.81 45637.11
OEST SERVICE RATIO 2.17 1.76 1.54 1.31 1.39 1.37 1.37 1.51 f.49 1.36% CONTRIBUTION TO INVESTMENT 27.12 21.26 19.16 15 56 20.42 21.72 24.11 33.65 35.96 30.77
I-tTXu

EGAT
BALANCE SHEET MILL.BAHT
1982 1983 1984 1985 1986 1987 1988 1989 1990 1991masts ttf.s.........ss..s..s.s.........ss s .... ' ........ S=-= . .sss......=.sst ...sCs ... s...s.ss............-.s..s.s........
A S S E T S
FIXED ASSETS IN OPERATION 68451.3 79063.8 100311.1 122846.2 145929.3 168275.0 191556.3 224488.0' 262257.3' 305499.IACCUMULATED DEPRECIATION 21344.2 25457.9' 30562.0 36934.6. 44648.5 53636.6, 64024.5. 76091.1 90301.5 106535.3
NET FIXED ASSETS 47107.1 53605.8 69749,1 85911.6 101280.8 114638.3 127531.7 t48396.8 171955.8 198963.7WORK IN PROGRESS 21066.0 30896.0 28870.0 30731.0 33682.0 40324.04 47394.0 46708.0 44274.0 40758.0
CASH AND BANKS 826.0. 788.9 1234.0' 1512.0 1790.7 2215.5' 2770.7 3324.0 4074.7 4805.9ACCOUNTS RECEIVABLE 3532.0 4044.9 ' 4698.2, 5180.2 5916.8 6912.6' 7939.9' 8749.4 9882.2 10984.4'OTHER RECEIVABLES 500.0. 555.0 611 .0 672.0 739.0. 818.0. 894.0 984.0 1082.0 1190.0OINVENTORIES 1626.0 1304.3' '496.0 1350.2' 1425.6 1703.5 2013.2 2080.8' 2100.6. 2308.0.
TOTAL CURRENT ASSETS 6484.0 6693.1' 8039.2 8714.6- 9872.2 11649.7' 13617.8 15138.2 17139.6 19288.4INSURANCE FUND 395.0 434.5 477.9 525.7 578.3 636.1 699.7 769.7 846.7 931.3
flf=... S w .... ... ...5 5=:==. .55=5555 a....S. a 5....5 U:SSS.. .Sbms.W: eSSWs
TOTAL ASSETS 75052.1 91629.4,' 107136. 125882.9. 145413.3 167248.i' 189243.3 211012.8 234216.1 259941.5.
EQUITY AND LIABILITIES
EQUITY 8827.0 9491.0 10155.0 10450.0 10604.0 10666.0 10666.0 10666.C, 10666.0 10666.04CONTRIBUTIONS AND GRANTS 0.0 0.0 0.0 0.0 0.0 0.0 0.0 0.0 0.0 0.0REVALUATION SURPLUS 18306.6 2i839.6. 25726.0 30608.4 35763.1 41840.0 48718.3 56370.3 65274.2' 75591.5 OPERATIONAL SURPLUS 6321.2 8163.7 10857.9 13962.8 17437.2 21287.3 25658.6 310106. 37429.6 44520.6
TOTAL EQUITY 33454.8 39494.3 46739.0 55021.3 63804.3 73793.4 85043.0 98046.9 113369.7 130778.1
LONG TERM DEBT(NET) 33799.3 45474.8 51776.3 62231.5 72281.8 83096.4 93277.9 100242.7 105334.2 111243.6
ACCOUNTS PAYABLE 2801 0 2117.8 2429.1 2192.5 2314.8, 2766.1 3269.0 3378.7 3410.8 3747.7'OTHER A/P 3159 0 1105.c 945.0 769.0 558.0 337.0 429.0 495.0 511.0 537. 0CURRENT MATURITIES 1443.0 3003.0 4769.0 5143.0 5876.0 6619.0' 6524.6 8079.6 10743.4 12703.5
TOlAL CURRENT LIABILITIES 7403.0 6225.8 8143.1 8104.5 8748.8' 9722.2 10222.6 11953.3 14665.3 16988.2SELF-INSURANCE FUND 395.0 434.5 477.9 525.7 578.3 636. 1' 699.7 769.7 846.7 931.3.
TOlAL LIABILITIES 41597.3 52135.2 60397.4 70861.6 81609.0 93454.8 104200.3 112965.8 120846.2 129163.2
TOTAL EQlITTY-LIABILITIES 75052.1 91629.4 107136.4 125882.9 145413.3' 167248.1 189243.3 211012.i 234216w1 259941.;
NO.OAYS ACCOUNTS RECEIVABLE 58 59 59 59 59 59 59 59 59 59%DEBT/(NET ASSETS 4 WIP) 49.58 53.82 52.50 53.35 53.56 53.62 53.32 51.38 48.71 46.41WORKING CAPITAL-MILLION 524.00 3470.28 4665.11 5753.13 6999.36 8546.60 9919.88 11264.57 13217.73 15003.77 m XCURRENT RATIO 0.88 1.08 0.99 1.08 1.13 1.20 1.33 1.27 1.17 1.14
% DEBT/(OEBT+EQUITY) 50.26 53.52 52.56 53.07 53.11 52.96 52.31 50.55 48.16 45.96

MEA
INCOME STATEMENT MILL.SAHT
----------------------------------------------------------------- __----------__-------------------------------------------------
1982 1983 1984 1985 1986 1987 1988 1989 1990 1991
CONSUMPTION-MILLION KWH 8406.00 8505.00 8890.00 9457.00 10084.00 10883.00 11699.00 12634.00 13619.00 14595.00
AVERAGE ENERGY TARIFF /KWH 1.85 1.93 2.07 2.09 2.19 2.34 2.46 2.50 2.62 2.74
ENERGY REVENUES 15580.00 16402.32 18382.26 19807.67 22110.82 25437.99 28801.42 31639.20 35628.05 39967.95OTHER OPERATING REVENUES 159.00 225.00 225.00 225.00 225.00 225.00 225.00 225.00 225.00 225.00
TOTAL OPERATING REVENUES 15739.00 16627.32. 18607.26 20032.G7 22335.82 25662.99 29026.42 31864.20 35853.05 40192.95
POWER 13631.00 14482.67 15985.38 17043.29 18958.78 21909.25 24816.37 27121.28 30481.80 34153.72OPERATIONS 1037.00 t197.00 1338.00 1497.00 1673.00 1863.00 2085.00 2335.00 2615.00 2929.00
DIRECT COSTS 14668.00 15679.67 17323.38 18540.29 20631.78 23772.25 26901.37 29456.28 33096.80 37082.72a±===rr 2s=t~s stee=== t===== =w== t2=S=_= 3Ss5U2 =w=== c==S fl=_in
TOTAL OPERATING EXPENSES 14668.00 15679.67 17323.38 18540.29 20631.78 23772.25 26901.37 29456.28 33096.80 37082.72
INCOME BEFORE DEPRECIATION 1071.00 947.65 1283.88 1492.38 1704.04 1890.74 2125.05 2407.92 2756.25 3110.23DEPRECIATION 504.36 582.09 689.99 803.85 906.66 1018.60 1152.25 1308.89 1494.39 1689.92
*t==.... t-m. s.= .==r ...... a soX ..eS .s s ...n. ..S.. =..s .. ss... aan...sa. .L
OPERATING INCOME 566.64 365.56 593.89 688.53 797.38 872.14 972.80 1099.03 1261.86 1420.31OPERATIONAL INTEREST 181.00 216.00 331.00 545.00 601.00 732.00 903.00 1135.00 1413.00 1579.00
NET INCOME (+) 385.64 149.56 262.89 143.53 196.38 140.14 69.80 -35.97 -151.14 -158.69
AVERAGE RATE BASE 5643.97 6444.64 7798.85 9106.70 9967.46 10902.03 12160.18 13738.02 15773.36 17754.10% WORKING RATIO 93.20 94.30 93.10 92.55 92.37 92.63 92.68 92.44 92.31 92.26% RATE OF RETURN 10.04 5.67 7.62 7.56 8.00 8.00 8.00 8.00 8.00 8.00
% GROWTH TOTAL REVENUES 5.64 11.91 7.66 11.50 14.90 13.11 9.78 12.52 12.10.X GROWTH OPERATING EXPENSES 6.90 10.48 7.02 11.28 15.22 13.16 9.50 12.36 12.04OPERATING REVENUES /KWH 1.87 1.96 2.09 2.12 2.21 2.36 2.48 2.52 2.63 2.75OPER.EXPENSES/KWH CONSUMED 1.74 1.84 1.95 1.96 2.05 2.18 2.30 2.33 2.43 2.54% TARIFF INCREASE 4.05 7.22 1.29 4,69 6.60 5.32 1.72 4.46 4.68
"I-
m

MEA
FLOW OF FUNDS MILL.BAHT
----------------------------------------------------------------- __----------__------------------------------------------------
1982 1983 1984 1985 1986 1987 1988 1989 1990 1991rfl.aa w......sas.--.... . ....a e............nans........... ar. - ...... aa........... nhln ........ nsasa sa
SOURCES OF FUNDS
INCOME BEFORE DEPRECIATION 1071.00 947.65 1283.88 1492.38 1704.04 1890.74 2t25.05 2407.92 2756.25 3110.23
GROSS INTERNAL GENERATION 1071.00 947.65 1283.88 1492.38 1704.04 1890.74 2125.05 2407.92 2756.25 3110.23OTHER CONTRIBUTIONS 278.00 313.00 344.00 376.00 406.00 438.00 473.00 511.00 500.00 500.00CUSTOMER DEPOSITS 30.00 28.05 39.60 28.51 46.06 66.54 67.27 56.76 79.78 86.80
LOANS 495.00 440.00 1190.00 1260.00 540.00 1037.00 658.00 2293.00 28e5.00 2351.00
TOTAL BORROWING 495.00 440.00 .1190.00 1260.00 540.00 1037.00 658.00 2293.00 2895.00 2351.00.aa... anness. ia...... sas-.... .... ., s.... .. ....... . . an...... n.a.s ma..a*
TOTAL SOURCES 1874.00 1728.69 2857.48 3156.89 2696.10 3432.28 3323.32 5268.67 6231.02 6048.03
APPLICAtIONS OF FUNDS. ma a a. a. a aa.s. a .a..
PROJECT INVESTMENT 691.00 1785.00 2045.00 1809.00 776.00 0.0 0.0 0.0 0.0 0.0
OTHER INVESTMENT 0.0 0.0 0.0 0.98 2.86 1911.62 2083.29 3276.00 3408.00 1862.00
TOTAL CAPITAL EXPENDITURES 691.00 1785.00 2045.00 1809.98 778.86 1911.62 2083.29 3276.00 3408.00 1862.00 L
".UOrIZATION - 69.00 145.00 225.00 288.00 302.00 365.00 430.00 542.00 653.-0 69i.'z
TOTAL AMORTIZATION 69.00 145.00 225.00 288.00 302.00 365.00 430.00 542.00 653.20 691.41OPERATIONAL INTEREST 181.00 216.00 331.00 545.00 601.00 732.00 903.00 1135.00 1413.00 1579.00
wS=n = waa-aaa a a==.aa .. a,aa= amassa.. na"sa... nsasa=na s"na.nas *-.a.ans *--sa----
TOTAL DEBT SERVICE 250.00 361.00 556.00 833.00 803.00 1C97.00 1333.00 1677.00 2066.20 2270.41INCREASE IN WORK.CAPITAL 976.00 -460.31 256.48 508.91 1014.24 418.66 -92.97 310.67 756.82 1910.62OTHER ASSETS -43.00 43.00 0.0 5.00 0.0 5.00 0.0 5.00 0.0 5.00.
2Sssana.sea.. .nsa.sna sussnan. ens..... sswwsans.... nan..... nassau. usanasn" nnasasaTOTAL APPLICATIONS 1874.00 1728.69 2857.48 3156.89 2696.10 3432.28 3323.32 5268.67 6231.02 6048.03
DEBT SERVICE RATIO 4.28 2.63 2.31 1.79 1.89 1.72 1.59 1.44 1.33 1.37% CONTRIBUTION TO INVESTMENT 77.77 38.93 38.72 42.69 53.40 49.88 32.68 25.01 24.22 35.33
m I-00
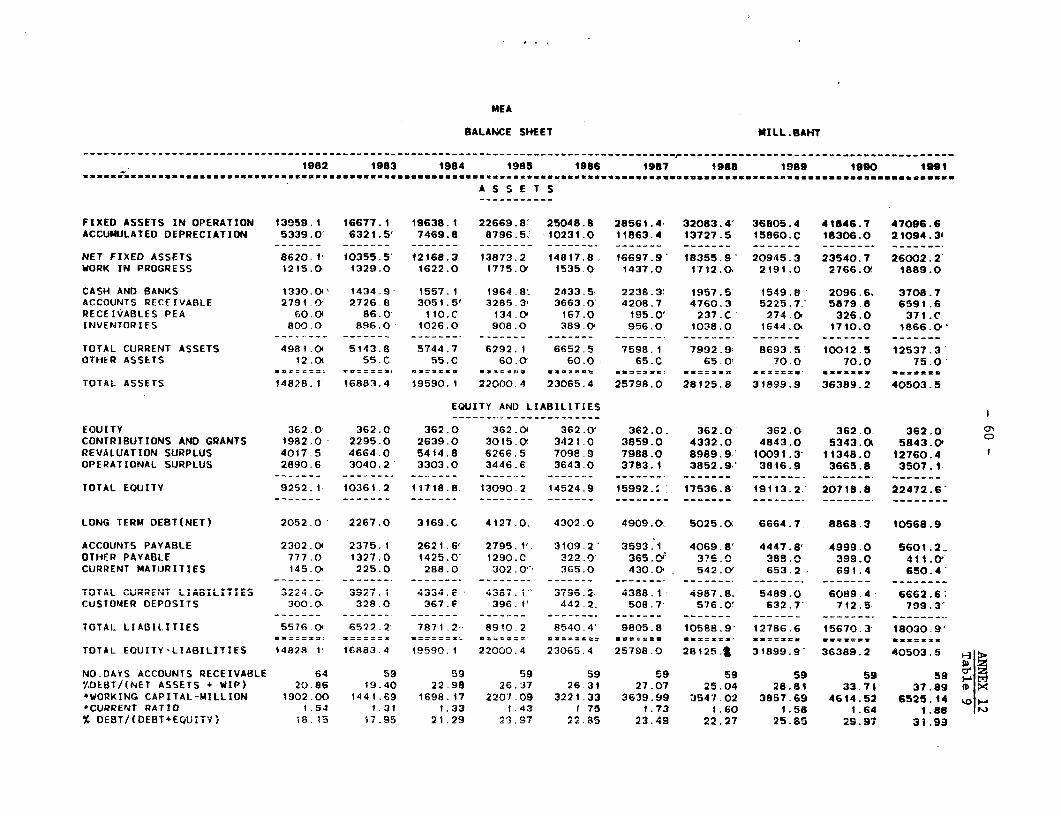
MEA
BALANCE SHEET MILL.BAHT
_______________________________________________________________________________________,________________________________________-
1982 1983 1984 1985 1986 1987 1988 1989 1990 1991uasaaaauaaaaw.mas.aam.uaaaa......... m.......ammaaa.a.maa.....*.....a.ua a... ,.......aaa= au.........s .s.. u-aaa
A S S E T S
FIXED ASSETS IN OPERATION 13959.1 16677.1 19638.1 22669.8- 25048.8 28561.4 32083.4' 36805.4 41846.7 47096.6ACCUMULATED DEPRECIATION 5339.0' 6321.5' 7469.8 8796.5.: 10231.0 11863.4' 13727.5 15860.C 18306.0 21094.3'
NET FIXED ASSETS 8620.f 10355.5' 12168.3 13873.2 14817.8. 16697.9 18355.95 20945.3 23540.7 26002.2'WORK IN PROGRESS 1215.0 1329.0 1622.0 1775.0' 1535.0 1437.0 1712.0. 2191.0 2766.00 1889.0
CASH AND BANKS 1330.0' 1434.9 1557.1 1964.8, 2433.5 2238.3' 1957.5 1549.8 2096.6. 3708.7ACCOUNTS RECEIVABLE 2791i.0 2726.8 3051.5' 3285.3, 3663.0' 4208.7 4760.3 5225.7.' 5879.8 6591.6RECEIVABLES PEA 60.-0 86.0 110.C 134.0' 167.0 195.0' 237.C 274.0O 326.0 371.CINVENTORIES 800.0 896.0 1026.0 908.0 389.0 956.0 1038.0 1644.Ot 1710.0 1866.O''
TOTAL CURRENT ASSETS 4981.0 5143.8 5744.7 6292.1 6652.5 7598.1 7992.9' 8693.5 10012.5 12537.3OTHER ASSETS 12.0( 55.C 55.C 60.0' 60.0 65.C 65.0' 70.0 70.0 75.0-
*tt==: Wf-lSt -=tw aa.mma=m.s ==z= asam=-w St=!s a rla .a=e asaXsm mm a mac
TOTAL ASSETS 14828.1 16883.4 19590.1 22000.4 23065.4 25798.0 28125.8 31899.9 36389.2 40503.5
EQUITY AND LIABILITIES
EQUITY 362.0, 362.0 362.0 3G2.01 362.0' 362.0. 362.0 362.0 362.0. 362.0' aCONTRIBUTIONS AND GRANTS 1982.0 2295.0' 2639.0 3015.0 3421.0 3859.0 4332.0 4843.0 5343.0t 5843.0 REVALUATION SURPLUS 4017.5 4664.0 5414.8 6266.5 7098.9 7988.0 8989.9' 10091.3' 11348.0 12760.4 1OPERATIONAL SURPLUS 2890.6 3040.2 3303.0 3446.6 3643.0 3783.1 3852.9.' 3816.9 3665.8 3507.1
TOTAL EQUITY 9252.1 10361.2 11718.8. 13090.2 14524.9 15992.:: 17536.8 19113.2:' 20718.8 22472.6'
LONG TERM DEBT(NET) 2052.0 2267.0 3169.C 4127.0. 4302.0 4909.0. 5025.0 6664.7 8868.3 10568.9
ACCOUNTS PAYABLE 2302.04 2375.1 2621.6' 2795.1'. 3109.2' 3593.1 4069.8' 4447.8' 4999.0 5601.2_OTHER PAYABLE 777 0. 1327.0 1425.0' 1290.C 322.0 365.& 376.0 388.0 399.0 411.0'CURRENT MATURITIES 145.0. 225.0 288.0' 'J02.0- 365.0 430.0', 542.0' 653.2 691.4 650.4'
TOTAL CURRENT LIABILITIES 3224.0. 3927.1' 4334.e 4387. ;" 3796.2. 4388.i 4987.8. 5489.0 6089.4 6662.6;CUSTOMER DEPOSITS 300.0C 328.0 367.6 396.1' 442.2. 508.7 576.0' 632.7' 712.5 799.3'
TOTAL LIABILITIES 5576.0' 6522.2 7871.2 8910.2 8540.4' 9805.8 1058B.9 12786.6 15670.3 18030.9'waa==s-: ===-== a====ut_ 5=.==s=- =-=nt=m=_ *==== UX=mma .- =nsa uamm=ma usaca
TOTAL EOUITY-LIABILITIES 14828.1U 16883.4 19590.1 22000.4 23065.4 25798.0 2B125.9 3iB99.9- 36389.2 40503.5
NO.DAYS ACCOUNTS RECEIVABLE 64 59 59 59 59 59 59 59 59 59 Z%DEBT/(NET ASSETS + WIP) 20.86 19.40 22.98 26.37 26.31 27.07 25.04 28.81 33.71 37.89 l X*WORKING CAPITAL-MILLION 1902.00 1441.69 1698.17 2207.09 3221.33 3639.99 3547.02 3857.69 4614.52 6525.14 o*CURRENT RATIO 1.54 t.31 t.33 t.43 I 75 1.73 1.60 1.58 1.64 1.88 r'% DEBT/(DEBT+EQUITY) 18.15 17.95 21.29 23.97 22,85 23.49 22.27 25.85 29.97 31.99
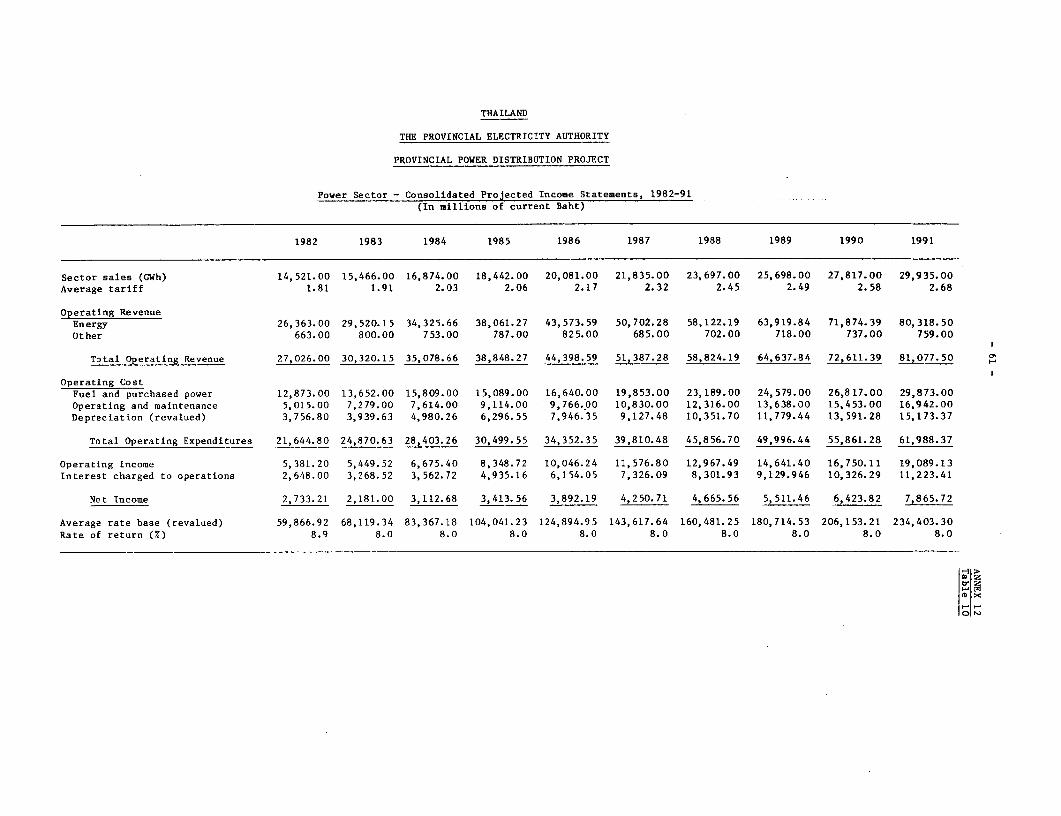
THAILAND
THE PROVINCIAL ELECTRICITY AUTHORITY
PROVINCIAL POWER DISTRIBUTION PROJECT
Power Sector - Consolidated Projected Income Statements, 1982-91(In millions of current Baht)
1982 1983 1984 1985 1986 1987 1988 1989 1990 1991
Sector sales (GWh) 14,521.00 15,466.00 16,874.00 18,442.00 20,081.00 21,835.00 23,697.00 25,698.00 27,817.00 29,935.00Average tariff 1.81 1.91 2.03 2.06 2.17 2.32 2.45 2.49 2.58 2.68
Operating RevenueEnergy 26,363.00 29,520.15 34,325.66 38,061.27 43,573.59 50,702.28 58,122.19 63,919.84 71,874.39 80,318.50
Other 663.00 800.00 753.00 787.00 825.00 685.00 702.00 718.00 737.00 759.00
Total Operating Revenue 27,026.00 30,320.15 35,078.66 38,848.27 44,398.59 51,387.28 58,824.19 64,637.84 72,611.39 81,077.50
Operating CostFuel and purchased power 12,873.00 13,652.00 15,809.00 15,089.00 16,640.00 19,853.00 23,189.00 24,579.00 26,817.00 29,873.00
Operating and maintenance 5,015.00 7,279.00 7,614.00 9,114.00 9,766.00 10,830.00 12,316.00 13,638.00 15,453.00 16,942.00Depreciation (revalued) 3.756.80 3.939.63 4,980.26 6,296.55 7,946.35 9,127.48 10,351.70 11,779.44 13,591.28 15,173.37
Total Operating Expenditures 21,644.80 24,870.63 28,403.26 30,499.55 34,352.35 39,810.48 45,856.70 49,996.44 55,861.28 61,988.37
Operating income 5,381.20 5,449.52 6,675.40 8,348.72 10,046.24 11,576.80 12,967.49 14,641.40 16,750.11 19,089.13
Interest charged to operations 2,648.00 3,268.52 3,562.72 4,935.16 6,154.05 7,326.09 8,301.93 9,129.946 10,326.29 11,223.41
Net Income 2,733.21 2,181.00 3,112.68 3,413.56 3,892.19 4,250.71 4,665.56 5,511.46 6,423.82 7,865.72
Average rate base (revalued) 59,866.92 68,119.34 83,367.18 104,041.23 124,894.95 143,617.64 160,481.25 180,714.53 206,153.21 234,403.30
Rate of return (x) 8.9 8.0 8.0 8.0 8.0 8.0 8.0 8.0 8.0 8.0
0>o
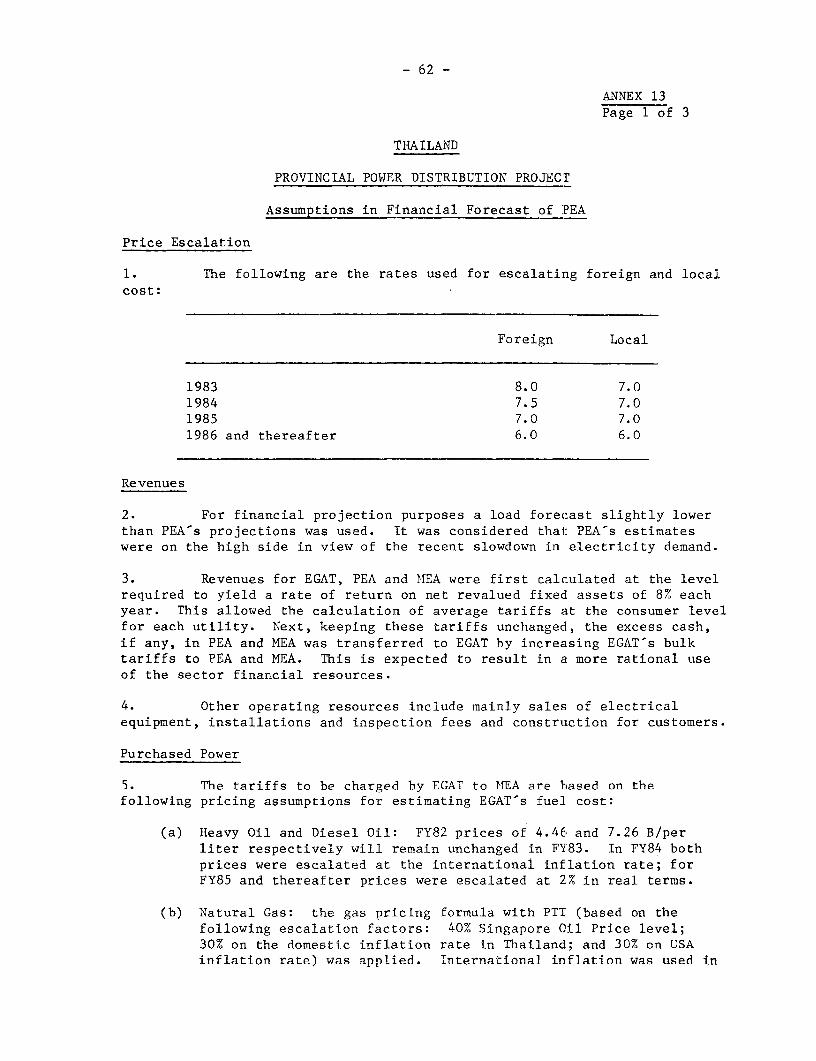
- 62 -
ANNEX 13Page 1 of 3
THAILAND
PROVINCIAL POWER DISTRIBUTION PROJECT
Assumptions in Financial Forecast of PEA
Price Escalation
1. The following are the rates used for escalating foreign and localcost:
Foreign Local
1983 8.0 7.01984 7.5 7.01985 7.0 7.01986 and thereafter 6.0 6.0
Revenues
2. For financial projection purposes a load forecast slightly lowerthan PEA's projections was used. It was considered that: PEA-s estimateswere on the high side in view of the recent slowdown in electricity demand.
3. Revenues for EGAT, PEA and MEA were first calculated at the levelrequired to yield a rate of return on net revalued fixecd assets of 8% eachyear. This allowed the calculation of average tariffs at the consumer levelfor each utility. Next, keeping these tariffs unchanged, the excess cash,if any, in PEA and MEA was transferred to EGAT by increasing EGAT's bulktariffs to PEA and MEA. This is expected to result in a more rational useof the sector financial resources.
4. Other operating resources include mainly sales of electricalequipment, installations and inspection fees and construLction for customers.
Purchased Power
5. The tariffs to be charged by EGAT to IEA are based on thefollowing pricing assumptions for estimating EGAT's fuel cost:
(a) Heavy Oil and Diesel Oil: FY82 prices of 4.46 and 7.26 B/perliter respectively will remain unchanged in FY83. In FY84 bothprices were escalated at the international inflation rate; forFY85 and thereafter prices were escalated at 2% in real terms.
(b) Natural Gas: the gas pricing formula with PTI (based on thefollowing escalation factors: 40% Singapore Oil Price level;30% on the domestic inflation rate in Thailand; and 30% on USAinflation rate) was applied. International inflation was used in
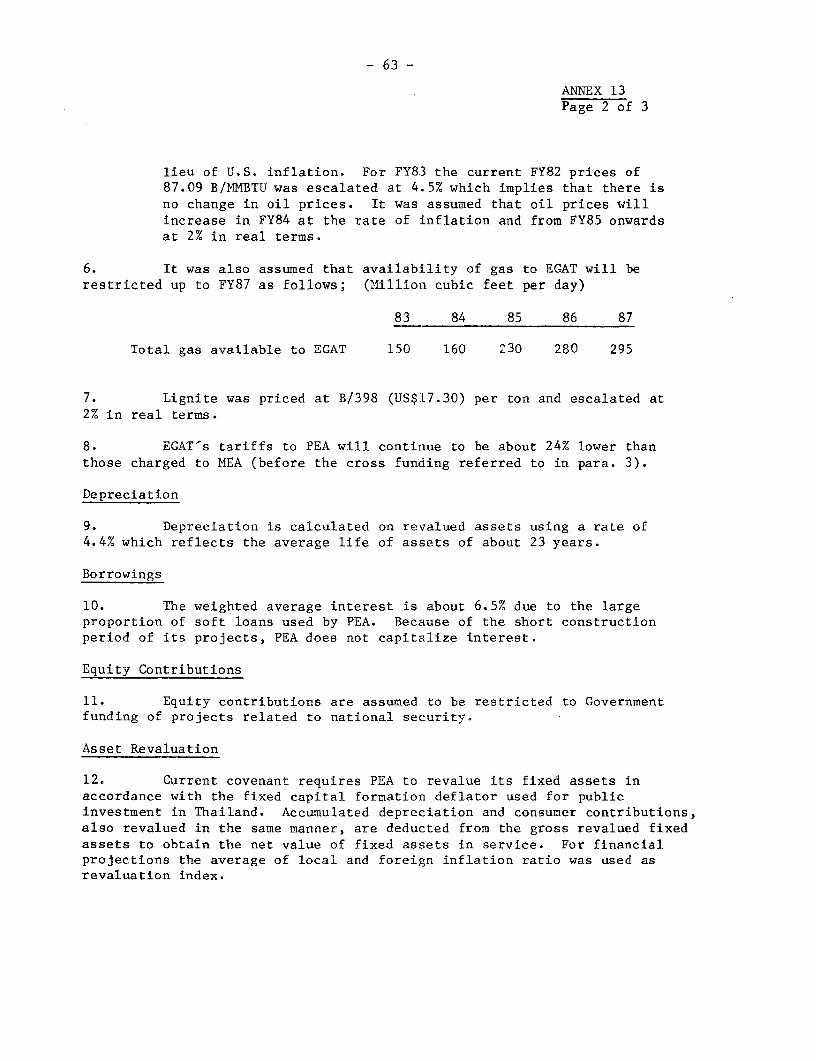
- 63 -
ANNEX 13Page 2 of 3
lieu of U.S. inflation. For FY83 the current FY82 prices of87.09 B/MMBTU was escalated at 4.5% which implies that there isno change in oil prices. It was assumed that oil prices willincrease in FY84 at the rate of inflation and from FY85 onwardsat 2% in real terms.
6. It was also assumed that availability of gas to EGAT will berestricted up to FY87 as follows; (Million cubic feet per day)
83 84 85 86 87
Total gas available to EGAT 150 160 230 280 295
7. Lignite was priced at B/398 (US$:L7.30) per ton and escalated at2% in real terms.
8. EGAT's tariffs to PEA will continue to be about 24% lower thanthose charged to MEA (before the cross funding referred to in para. 3).
Depreciation
9. Depreciation is calculated on revalued assets using a rate of4.4% which reflects the average life of assets of about 23 years.
Borrowings
10. The weighted average interest is about 6.5% due to the largeproportion of soft loans used by PEA. Because of the short constructionperiod of its projects, PEA does not capitalize interest.
Equity Contributions
11. Equity contributions are assumed to be restricted to Governmentfunding of projects related to national sec:urity.
Asset Revaluation
12. Current covenant requires PEA to revalue its fixed assets inaccordance with the fixed capital formation deflator used for publicinvestment in Thailand. Accumulated depreciation and consumer contributions,also revalued in the same manner, are deduc:ted from the gross revalued fixedassets to obtain the net value of fixed assets in service. For financialprojections the average of local and foreign inflation ratio was used asrevaluation index.

I
- 64 -
ANNEX 13Page 3 of 3
Work in Progress
13. Work in progress reflects the estimated commissioning dates ofdifferent projects. On average, it represents about one year of investmentwhich is consistent with the usual completion period of PEA's jobs.
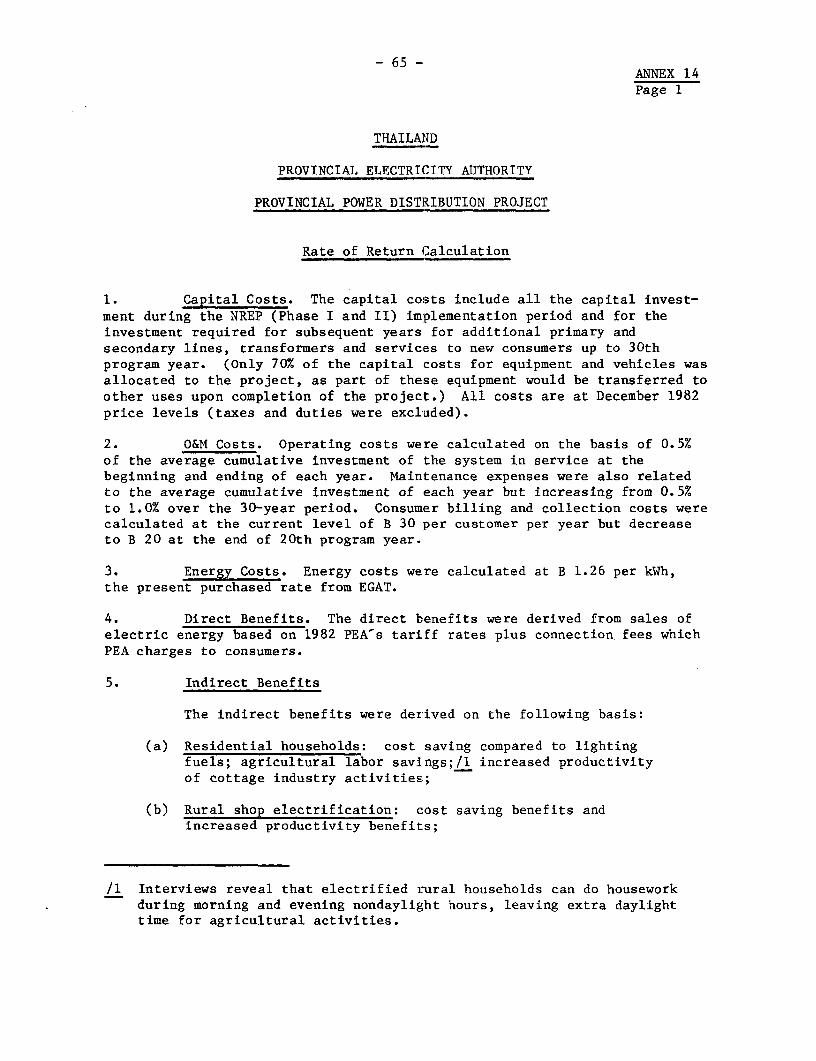
- 65 -ANNEX 14Page 1
THAILAND
PROVINCIAL ELECTRICITY AUTHORITY
PROVINCIAL POWER DISTRIBUTION PROJECT
Rate of Return Calculation
1. Capital Costs. The capital costs include all the capital invest-ment during the NREP (Phase I and II) implementation period and for theinvestment required for subsequent years for additional primary andsecondary lines, transformers and services to new consumers up to 30thprogram year. (Only 70% of the capital costs for equipment and vehicles wasallocated to the project, as part of these equipment would be transferred toother uses upon completion of the project.) All costs are at December 1982price levels (taxes and duties were excluded).
2. O&M Costs. Operating costs were calculated on the basis of 0.5%of the average cumulative investment of the system in service at thebeginning and ending of each year. Maintenance expenses were also relatedto the average cumulative investment of each year but increasing from 0.5%to 1.0% over the 30-year period. Consumer billing and collection costs werecalculated at the current level of B 30 per customer per year but decreaseto B 20 at the end of 20th program year.
3. Energy Costs. Energy costs were calculated at B 1.26 per kWh,the present purchased rate from EGAT.
4. Direct Benefits. The direct benefits were derived from sales ofelectric energy based on 1982 PEA's tariff rates plus connection fees whichPEA charges to consumers.
5. Indirect Benefits
The indirect benefits were derived on the following basis:
(a) Residential households: cost saving compared to lightingfuels; agricultural labor savings;/l increased productivityof cottage industry activities;
(b) Rural shop electrification: cost saving benefits andincreased productivity benefits;
/1 Interviews reveal that electrified rural households can do houseworkduring morning and evening nondaylight hours, leaving extra daylighttime for agricultural activities.
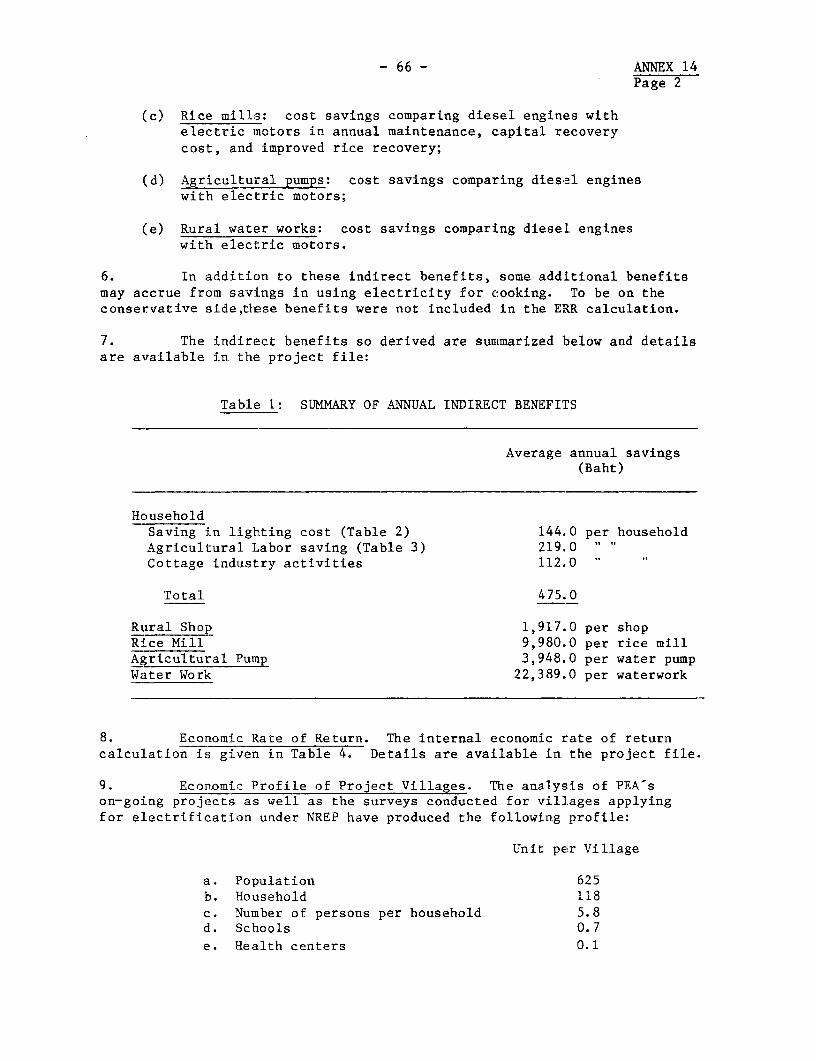
- 66 - ANNEX 14Page 2
(c) Rice mills: cost savings comparing diesel engines withelectric motors in annual maintenance, capital recoverycost, and improved rice recovery;
(d) Agricultural pumps: cost savings comparing diesel engineswith electric motors;
(e) Rural water works: cost savings comparing diesel engineswith electric motors.
6. In addition to these indirect benefits, some additional benefitsmay accrue from savings in using electricity for cooking. To be on theconservative side,these benefits were not included in the ERR calculation.
7. The indirect benefits so derived are summarized below and detailsare available in the project file:
Table 1: SUMMARY OF ANNUAL INDIRECT BENEFITS
Average annual savings(Baht)
HouseholdSaving in lighting cost (Table 2) 144.0 per householdAgricultural Labor saving (Table 3) 219.0Cottage industry activities 112.0
Total 475.0
Rural Shop 1,917.0 per shopRice Mill 9,980.0 per rice millAgricultural Pump 3,948.0 per water pumpWater Work 22,389.0 per waterwork
8. Economic Rate of Return. The internal economic rate of returncalculation is given in Table 4. Details are available in the project file.
9. Economic Profile of Project Villages. The analysis of PEA'son-going projects as well as the surveys conducted for villages applyingfor electrification under NREP have produced the following profile:
Unit per Village
a. Population 625b. Household 118c. Number of persons per household 5.8d. Schools 0.7
e. Health centers 0.1

- 67 - ANNEX 14Page 3
f. Shops 4.2g. Rice mills 1.4h. Water pumps 7.6
Table 2: ANNUAL SAVINGS IN LIGHTING COST PER HOUSEHOLD
Lighting ExpenditureCost Unelectrified Electrified Savings
---------------- Baht ---------------------
Connection cost 218 /aFuel cost 619 /b 257 7j
Total 619 475 144
/a Annual recovery cost of B 1,755 at 12% in 30 years.
/b Weighted average cost of lighting (kerosene, batteries and other fuels)derived from sample of households.
/c 131 kwh (equivalent to 3 lamps of 40 watts used 3 hours a day) atB 1.96/kWh, which produces better lighting than is possible under /babove.
Table 3: ANNUAL AGRICULTURAL LABOR SAVINGS FROM ELECTRIFIED LIGHTING
Peak agricultural labor season 30 daysAdditLonal working hours 1.5 hours per dayAverage minimum wage in provincial areas (1982) B 53 per 8 hour day% of rural households dedicated mainly to
agriculture (Source: Labor Force Survey) 73.5%
Labor savings: 30 x 1.5 x (53 - 8) x 0.73 = B 219

ANNEX 14- 68- Table 4
THAILAND
PROVINCIAL ELECTRICITY AUTHORITY
PROVINCIAL POWER DISTRIBUTION PROJECT
INTERNAL ECONOMIC RATE OF RETURN(Unit - B million)
Cost Streams Benefit streamsIndirect benefits
Agricul-Program Capital O&M Energy Direct Rice tural Water
Year cost cost cost benefits Households Shops mills pumps works Subtotal
1 273.2 4.8 23.8 71.4 60.6 17.2 - 0.7 - 78.52 1,133.6 19.8 81.2 118.4 127.2 35.1 4.1 2.7 - 169.13 869.6 38.1 147.7 158.5 179.9 47.7 13.5 5.4 - 246.54 588.0 53.2 220.5 223.7 235.7 60.5 26.7 9.2 0.7 332.85 136.1 62.1 288.0 255.1 254.8 61.5 43.4 11.6 2.3 373.66 27.7 64.5 346.7 312.7 269.8 62.4 60.7 14.2 4.3 411.47 45.7 65.3 401.7 368.3 283.1 63.3 73.0 16.8 6.9 443.18 146.0 66.4 450.2 422.4 295.1 64.3 80.2 19.4 9.6 468.69 143.0 68.3 499.9 477.1 305.7 65.3 83.9 22.2 12.2 489.3
10 101.3 69.9 548.1 532.5 316.2 66.2 84.3 25.0 14.8 506.511 101.8 76.0 598.1 593.2 327.0 67.2 84.7 28.0 17.4 524.312 17.0 76.9 647.7 653.1 337.2 68.2 85.1 30.9 20.0 541.413 17.0 77.2 692.8 715.6 347.4 69.2 85.4 34.0 22.7 558.714 38.2 77.5 745.6 781.5 357.3 70.2 85.8 37.1 25.3 575.715 112.2 78.2 799.5 849.5 366.9 71.2 86.2 40.3 27.9 592.516 113.2 84.6 856.8 923.2 377.2 72.1 86.6 43.6 30.5 610.017 82.4 85.7 908.9 999.7 387.7 73.1 87.0 47.0 33.1 627.918 82.3 86.5 970.0 1,079.0 398.0 74.1 87.3 50.4 35.7 645.519 17.6 87.1 1,033.0 1,161.5 408.4 75.0 87.7 53.9 38.4 663.420 17.1 87.1 1,097.9 1,246.5 418.5 75.9 88.1 57.4 41.0 680.921 37.6 93.6 1,162.1 1,330.8 427.8 76.9 88.5 58.1 43.6 694.922 117.3 95.3 1,217.8 1,419.1 437.5 77.8 88.9 58.8 46.2 709.223 117.4 97.6 1,285.9 1,511.4 447.1 78.7 89.2 59.5 48.8 723.324 83.8 99.8 1,355.1 1,605.3 456.8 79.6 89.6 60.1 51.5 737.625 82.5 101.6 1,427.4 1,703.6 465.5 80.5. 90.1 60.8 54.1 751.026 12.5 109.0 1,498.6 1,800.4 472.6 81.3 90.4 61.5 56.7 762.527 11.3 109.7 1,572.2 1,902.7 478.8 82.2 90.8 62.2 59.3 773.328 31.3 110.3 1,647.5 2,008.3 484.0 83.1 91.1 62.8 61.9 782.929 110.5 111.6 1,721.1 2,113.9 489.2 84.0 91.5 63.5 64.5 792.730 110.5 113.7 1,797.2 2,223.9 494.4 84.9 91.7 64.2 67.2 802.4
Internal economic rate of return = 14%.

- 69 -
ANNEX 15
THAILAND
PROVINCIAL ELECTRICITY AUTlIORITY
PROVINCIAL POWER DISTRIBUTION PROJECT
Related Documents and Data Available in the Project File
A. General Reports and Documents Related to the Sector and the Borrower
1. PEA's Annual Report, FY802. EGATs Annual Report, FY813. PEA Statistical Review 19814. Load forecast for Thailand Electric System (June 1982)5. highlights of the Study on PEA-s Operation (March 1982)6. PEA's Investment Program
B. General Reports and Documents Related to the Project
1. The Normal Rural Electrification ProjectVolume I Implementation Program & Financial AnalysisVolume II - Economic Analysis
2. PEA's Load Forecast3. Computer Printouts of Mlaterials Cost and Unit Construction Cost4. Draft Terms of Reference:
(a) Operations Development Program(b) Development Program for Electronic Data Processing(c) Distribution System Planning(d) Training Program
5. PEA's Monitoring System6. PEA's Load Promotion Program


b3f;G Jv V ETV
36,14 ~~~~~~LAO PEOPLE'S DEM. REP
19' ~ ~ ~ ~ ~ ~ ~ ~ ~ ~ ~ ~ ~ ~ ~ ~ ~ ~ ~ ~ ~ ~~~HhJaV'nun 'IC F "9 ½IOIDVDNES
~~~ ~ ~ ~ ~ 8. L~~~~S'1
OF~ ~ 0"'~t V,,AV'vJA,,(-,. ~'-Vt 11AY 14VV 4. >980N301
12' A~~~~~~T
I _W1~~~~~~~~~~~~~~~~~~
( ~~ Go/f o/' [ho//aDEMORATd
-, U~~~~~~~~~~~~~~~~~~~~~~~~~~~~~~~~~~~~~~~~~~~~~~~~~2
THAI LAND
SOUTH ~~PROVINCIAL ELECTICIklTY AUTHORITYVyVo'sa ~~~~~~~~~~~~,' ~~~RURAL ELECTRIFICATION PROJECTS
0, aT-'la3-
'¾ 7' ~~~~~~~~~~~~~ ~ ~~~~~~~~~~~~~~~~~V LLAGES 66,3 I vl LACES TO BE
90 6601>0 V EC~~~~~~~~~~~~~~~~~~~~~~~~~~~~~~~~~~~1TR C TY 091 10, ETIn dEC 398-1986,
E,A139AY0 NO-7~ROT!] EAT 076,296
019696 6 ~~~~~~~~~~~~~~h GE9OTRAL- 6,400 2.-9
NTVIM' CAL601013130 -OT. T'.9 4,918
'00 WM ' ~ 32I , 6< 0~~~~~~~~~~~~~I,A6 TOlL -CTEIF 8 TV
V 0 '99Pi, LV', ->NDER T4t 84196 II '
'~~~~~ - '4-6 ~ ~ TT~I 2 I~