World Aquaculture Performance Indicators (WAPI) · Aquaculture Technical Paper 607 (FATP 607):...
16
World Aquaculture Performance Indicators (WAPI) Information, knowledge and capacity for Blue Growth
Transcript of World Aquaculture Performance Indicators (WAPI) · Aquaculture Technical Paper 607 (FATP 607):...
World Aquaculture Performance Indicators (WAPI)Information, knowledge and capacity for Blue Growth
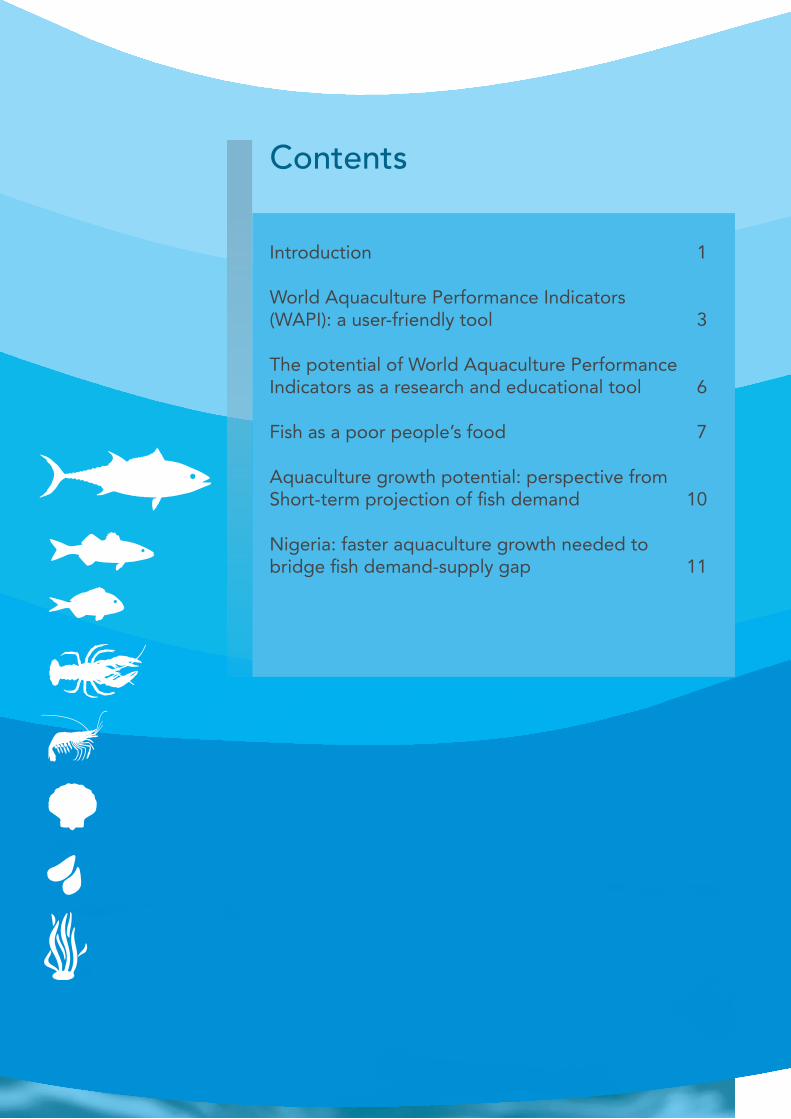
Contents
Introduction 1
World Aquaculture Performance Indicators (WAPI): a user-friendly tool 3
The potential of World Aquaculture Performance Indicators as a research and educational tool 6
Fish as a poor people’s food 7
Aquaculture growth potential: perspective from Short-term projection of fish demand 10
Nigeria: faster aquaculture growth needed to bridge fish demand-supply gap 11
1
Introduction
World Aquaculture Performance Indicators (WAPI) is an endeavour
initiated by the FAO Fisheries and Aquaculture Department to develop user-friendly tools for compiling, generating and providing easy access to quantitative information on aquaculture sector performance at the national, regional and global levels. Key elements of the initiative are synopsized in the article on pages 3–5; more detailed background documents are cited in notes 1 and 2.
Data analysis tools
As user-friendly data analysis tools built on publicly available FAO data and statistics, two WAPI modules have been formally published:
● WAPI Aquaculture Production Module (WAPI-AQPRN; note 3) analyses the status and trends (1950–2016) of aquaculture production (quantity and value) of over 650 species items in nearly 250 countries and areas under different farming environments (inland waters, marine areas and all areas).
● WAPI Fish Consumption Module (WAPI-FISHCSP; note 4) includes 10 indicators – three nutrition indicators and seven food indicators – to examine food supply and utilization patterns (with a focus on the contribution of fish to food and nutrition) in 270 countries and areas for six decades, from the 1960s to the 2010s. The module focuses on 14 fish/seafood items, but also includes 26 non-fish/seafood items.
Two draft WAPI tools have not been formally published, but are available for test use upon request: (i) the WAPI prototype that includes 72 templates on the social, economic and environmental
performance of aquaculture, as well as the status and trends of its development; and (ii) a more comprehensive, sophisticated WAPI Aquaculture Production Module that covers nearly 900 species items and that contains more advanced analytical functions.
WAPI-AQPRN and WAPI-FISHCSP will be routinely updated to the latest available data and enhanced with new or more refined analytical functions. Another three thematic WAPI modules (on fish trade, gross domestic product and employment) are in the pipeline.
Technical papers
WAPI-AQPRN and WAPI-FISHCSP are supported by FAO Fisheries and Aquaculture Technical Paper 607 (FATP 607): Short-term projection of global fish demand and supply gaps (note 5); see the policy brief on page 10 for some key results of the paper.
FATP 607 develops a model to estimate potential future fish demand-supply gaps at the country (nearly 200 countries or territories), regional (about 40 areas), and global levels for nine species groups. The projection results (in a five-year horizon) can be used to facilitate policy-making and sector management in aquaculture and fisheries.
FATP 607 serves as a background document that provides technical, contextual analyses to help users understand the quantitative information provided through various tables and charts in the two WAPI modules. On the other side, the WAPI modules serve as an electronic appendix for more detailed information that cannot be presented in the technical paper due to space limit. Such integration would be a norm for all WAPI modules – see notes 6, 7 and 8 for three WAPI technical papers in the pipeline.
2
Policy briefs
Information and knowledge in WAPI modules and associated technical papers can be tailor-made into policy briefs (in various forms) to address specific issues. Some examples are the following:
● Two thematic articles, one on the contribution of fish to animal protein (pages 7–9) and the other on growth potential in global aquaculture (page 10).
● A country brief on aquaculture potential in Nigeria (pages 11–12).
● A PowerPoint presentation on Global fish demand and supply outlook with a focus on China (note 9).
WAPI as an educational and research tool
Six FAO interns have participated, to different extents, in the WAPI initiative. Four of them have made significant
contributions to the development of WAPI-AQPRN and WAPI-FISHCSP; three of them are coauthors of forthcoming WAPI technical papers; and one of them has joined FAO as professional staff. Their experience indicates that WAPI has great potential to become an educational and research tool; see the article on page 6 for more information.
Work with us
WAPI is devoted to strengthening information, knowledge and capacity for managing Blue Growth in aquaculture and fisheries (note 10). Its methodology can be applied to fish and other food sectors for assessment and monitoring of the Sustainable Development Goals (SDGs) (note 11). We welcome your feedback and contribution to help move the initiative forward. Updated information on WAPI can be found at www.fao.org/fishery/statistics/software/wapi/en. Comments, suggestions and inquiries can be sent to [email protected].
NOTES1. COFI: AQ/VI/2012/5 – Assessing and Monitoring the Aquaculture Sector Performance: Importance, Issue and Challenges. Sixth
Session of the Sub-committee on Aquaculture, Cape Town, South Africa, 26–30 March 2012. (also available at www.fao.org/docrep/meeting/028/mc826e.pdf)
2. FAO. 2014. Report of the FAO Expert Workshop on Assessment and Monitoring of Aquaculture Sector Performance. Gaeta, Italy, 5−7 November 2012. FAO Fisheries and Aquaculture Report No. 1063. Rome. 94 pp. (also available at www.fao.org/3/a-i3539e.pdf)
3. FAO. 2018. World Aquaculture Performance Indicators (WAPI) – Aquaculture Production Module (WAPI-AQPRN v.2018.1). In: FAO Fisheries and Aquaculture Department [online]. Rome. Updated 2018. www.fao.org/fishery/statistics/software/wapi/en
4. FAO. 2018. World Aquaculture Performance Indicators (WAPI) – Fish Consumption Module (WAPI-FISHCSP v.2018.1). In: FAO Fisheries and Aquaculture Department [online]. Rome. Updated 2018. www.fao.org/fishery/statistics/software/wapi/en
5. Cai, J. & Leung, P.S. 2017. Short-term projection of global fish demand and supply gaps. FAO Fisheries and Aquaculture Technical Paper No. 607. Rome, FAO. 114 pp. (also available at www.fao.org/3/a-i7623e.pdf)
6. PowerPoint presentation on Species diversification in global aquaculture – a forthcoming technical paper for FAO WAPI module on aquaculture production. www.slideshare.net/FAOoftheUN/species-diversification-in-global-aquaculture-a-forthcoming-technical-paper-for-fao-wapi-module-on-aquaculture-production
7. PowerPoint presentation on Assessment and monitoring of global tilapia markets – a forthcoming technical paper for FAO WAPI module on fish trade. www.slideshare.net/FAOoftheUN/assessment-and-monitoring-of-global-tilapia-markets-a-forthcoming-technical-paper-for-fao-wapi-module-on-fish-trade
8. PowerPoint presentation on Understanding the contribution of aquaculture and fisheries to gross domestic product (GDP) – a forthcoming technical paper for a potential FAO WAPI module on GDP. www.slideshare.net/FAOoftheUN/understanding-the-contribution-of-aquaculture-and-fisheries-to-gdp-a-forthcoming-technical-paper-for-a-potential-fao-wapi-module-on-gdp
9. PowerPoint presentation on Global fish demand and supply outlook with a focus on China – a sample presentation based on WAPI tools and associated knowledge products. www.slideshare.net/FAOoftheUN/global-fish-demand-and-supply-outlook-with-a-focus-on-china-a-sample-presentation-based-on-wapi-tools-and-associated-knowledge-products
10. Learn more about FAO’s Blue Growth Initiative from the brochure on Achieving Blue Growth through implementation of the Code of Conduct for Responsible Fisheries. (also available at www.fao.org/fileadmin/user_upload/newsroom/docs/BlueGrowth_LR.pdf)
11. Learn more about FAO and the Sustainable Development Goals (SDGs) of the 2030 Agenda for Sustainable Development at www.fao.org/sustainable-development-goals/en
3Source: FAO Aquaculture Newsletter 51 (June 2013, pp. 34–36; article reformatted)
BA
CK
GR
OU
ND
DO
CU
ME
NT
World Aquaculture Performance Indicators (WAPI): a user-friendly tool
Background
Aquaculture is a young and fast growing sector
with complex environmental, social and economic impacts. Quantitative assessment and monitoring of the aquaculture sector performance is essential to evidence-based policy making and sector management.
There is a general lack of quantitative information on aquaculture sector performance. When available, such information tends to be scattered in the literature, leading to underutilization and sometimes misuse of available information. Misusing data from different sources (or even the same source) to create incorrect or misleading indicators is not an uncommon phenomenon.
In light of this situation, FAO has initiated the development of a user-friendly tool that compiles, generates and provides easy access to quantitative indicators on aquaculture sector performance at the national, regional and global levels. The tool is called World Aquaculture Performance Indicators (WAPI) tool.
The WAPI tool is intended to become a user-friendly instrument that helps experts utilize data and information from various sources to assess and monitor aquaculture sector performance in social, economic, environmental and governance terms and detect important trends of parameters of interest in the sector.
The primary users of the WAPI tool would be professionals in the aquaculture and fisheries sector, including policymakers, planners, managers, advisors, analysts, researchers, students, etc.
Experts often produce their own favorite tables and graphs and sometimes wish to use tables
and graphs produced by others. The WAPI tool can become a shareware that provides a way for professionals to capitalize their sporadic efforts into standardized templates for convenient use not only by themselves but also by others. The WAPI tool can also provide a venue for detail analysis and information that are unable to be accommodated by technical reports or journal articles.
A prototype WAPI tool
A prototype WAPI tool has been developed by FAO based on various official and/or publicly available data sources1. The draft WAPI tool covers 233 countries (or territories), 42 country groups
Written by:
Junning CaiE-mail: [email protected]
Nathanael HishamundaE-mail: [email protected]
FAO Fisheries and Aquaculture Department, Rome, Italy
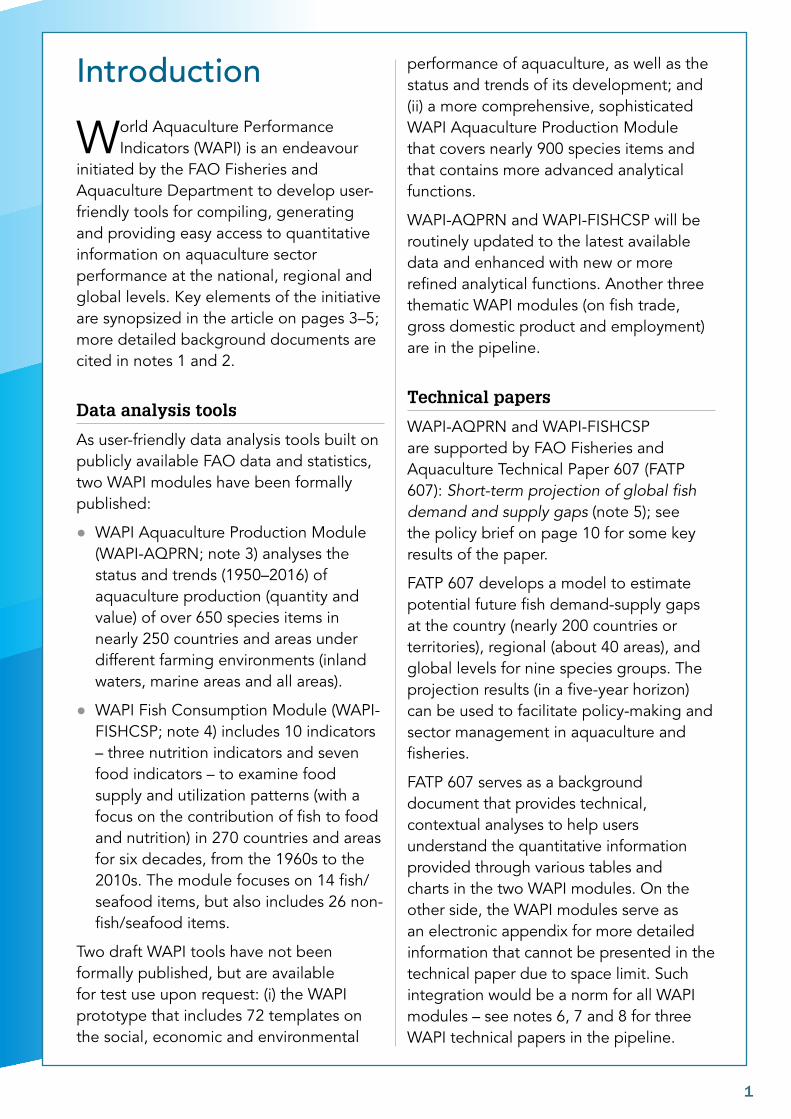
Figure 1 – An example of cross-country comparison
4 Source: FAO Aquaculture Newsletter 51 (June 2013, pp. 34–36; article reformatted)
BA
CK
GR
OU
ND
DO
CU
ME
NT
(regions, sub-regions, etc.) and major fish species groups (freshwater finfish, diadromous finfish, marine finfish, crustacean, molluscs, cephalopod, etc.).
The draft WAPI tool includes 72 templates in two sections. Section I includes templates on aquaculture’s social, economic and environmental performance2, while section II contains templates on the status and trend of aquaculture development3.
The draft WAPI tool uses these templates to analyze the data and statistics included and present the resulting quantitative indicators in well-structured tables and graphs. Simple analyses such as comparisons across time, countries, species and products have been standardized for many indicators in the draft tool (Figure 1).
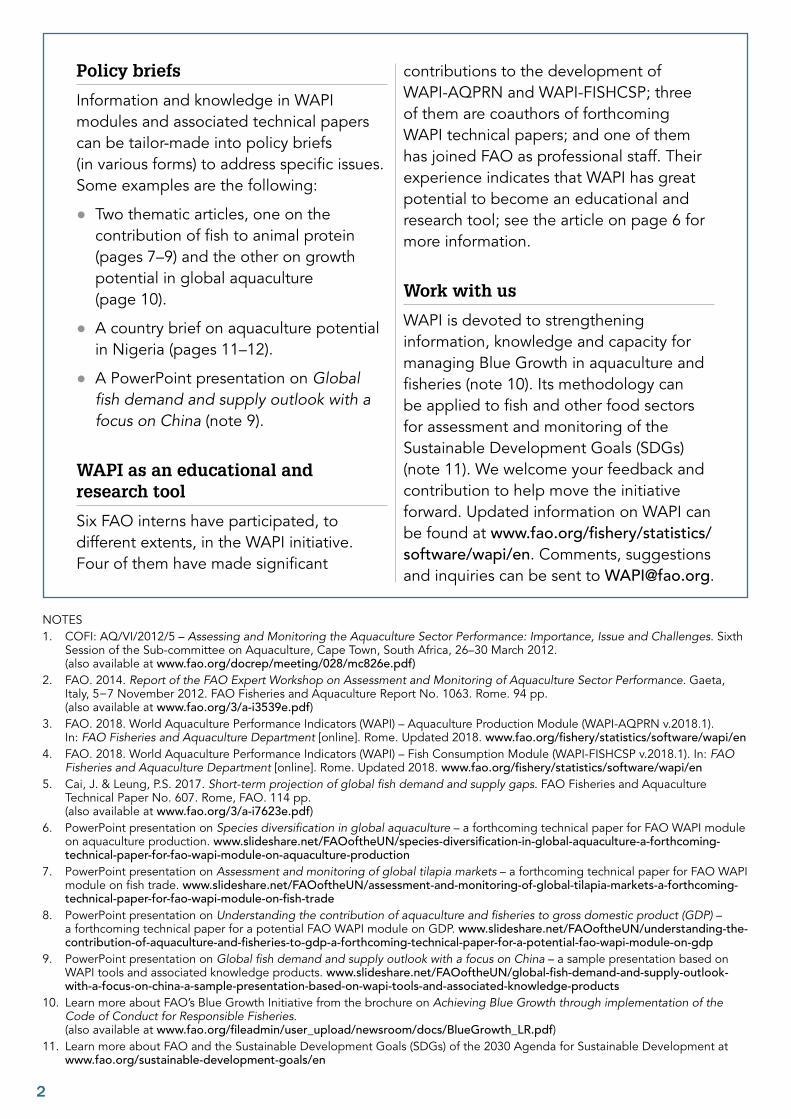
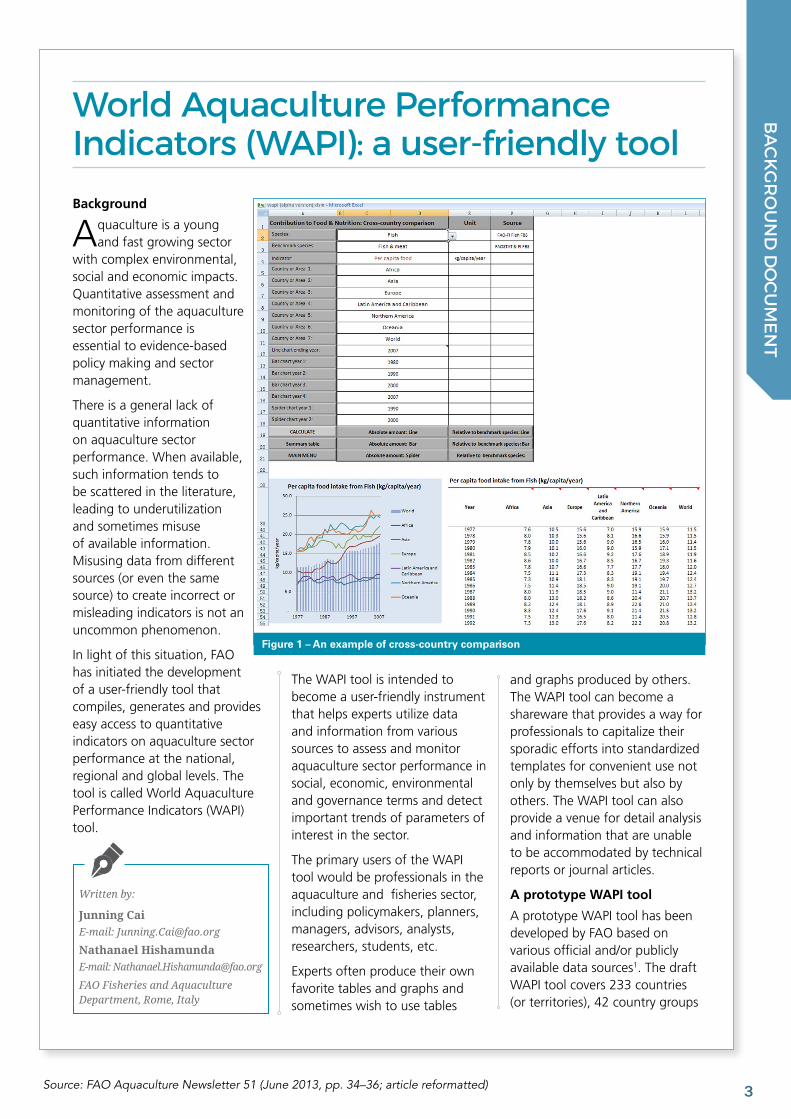
The draft tool also includes some advanced analysis such as measuring correlations between variables (Figure 2) and projection of fish demand and supply in the future (Figure 3).
The draft tool in its current status can be used to help generate policy briefs, factsheets or other thematic reports for policymaking or sector management. But there is still plenty of room for improvement and expansion. Tables and graphs in the tool can be linked to corresponding sources of information and data for users to obtain more contextual information. The tool can also be used to gain broader information and deeper understanding of specific aspects of aquaculture sector performance for a given
country, region or the entire world. As the tool consolidates enough information, templates can be developed to address specific policy or management issues. It is also feasible to develop or incorporate weighting schemes, performance index or other processes to measure the net impact (i.e., overall performance) of aquaculture sector.
The draft WAPI tool was designed to facilitate easy modification and update: Replacing or appending new data in the data templates would automatically update all the tables and graphs in the related indicator templates and hence lead to new inferences, policy and management advice on the sector.
Figure 2 – An example of illustrating correlation between indicators
Figure 3 – An example of scenario analysis
5Source: FAO Aquaculture Newsletter 51 (June 2013, pp. 34–36; article reformatted)
Feedbacks
During the FAO Expert Workshop on Assessment and Monitoring of the Aquaculture Sector Performance (November 2012, Gaeta, Italy)4, the prototype WAPI tool was presented to experts from different disciplines for comments, suggestions and collaborations.
The expert participants were generally impressed by the draft WAPI tool and recognized its value as not only a tool for sector assessment and monitoring but also a mechanism to facilitate demand-driven data collection and compilation.
However, it was noted during the workshop that accurate and reliable data are essential to functionalize the many templates included in the draft WAPI tool; without which the templates would be like “castles in the air”.
One concern was that the tool in its current format may be too complicated, even for professionals, and may be difficult
to maintain considering the enormous amount of data needed to substantiate the templates included in the tool.
A suggestion was to break the gigantic prototype WAPI tool into various components. It was believed that simpler, more tailor-made WAPI components equipped with substantial data would be easier to develop and maintain, more user-friendly, and more attractive to potential users. Another related suggestion was to develop WAPI components through a bottom-up process that starts with specific countries or regions. As such, the tool could become a vehicle to facilitate data dissemination from national to regional to global.
Way forward
The WAPI tool would be a long-term, continuing, and improving-by-using process to consolidate and promote efforts in assessment and monitoring of the aquaculture sector performance.
“Contribute and share” – this is the motto of the WAPI tool. But it entails persistent and coordinated effort to turn the idea into reality. With its unique comparative advantage in data collection and dissemination, FAO can play a major role in this endeavour. However, partnership with other stakeholders and experts is essential to its success.
The draft WAPI tool is being modified and refined according to the feedbacks received from the workshop and elsewhere. In order to make sure that the tool serves the needs of its targeted users, we welcome your comments, suggestions and collaboration on the WAPI tool.
Should you wish to learn more about the WAPI tool and/or receive a copy of the draft WAPI tool for testing, please send a request to [email protected].
More information can be obtained by writing to:
[email protected] [email protected]
1 Data sources used by the draft WAPI tool include (1) FAO Food Balance Sheet, (2) FishSTAT, (3) FAO-INFOOD data on nutrition, (4) FAO Statistics Division’s data on food security, (5) UN COMTRADE, (6) UN Population, (7) ILO’s data on employment, (8) International Monetary Fund’s World Economic Outlook (WEO) database, (9) World Bank’s World Development Indicators (WDI), (10) Global Aquaculture Performance Index (GAPI), (11) China Fishery Statistics Yearbook, among others.
2 Section I of the draft WAPI tool includes templates on (1) basic socio-economic conditions (population & demographics, food & nutrition security status, health, gross domestic product, etc.), (2) the socioeconomic contributions of aquaculture (food and nutrition, GDP, foreign exchange, employment, labor income, gender, etc.), (3) the environmental impacts of aquaculture (land, water, wild species, feed & feed ingredients, energy, etc.), and (4) performance indicators measuring the tradeoffs between the benefits and costs of aquaculture (labor productivity, land productivity, feed efficiency, energy efficiency, etc.).
3 Section II of the draft WAPI tool includes templates on (1) consumption & demand, (2) production & supply, (3) commodities & trade (including bilateral trade), (4) Food Balance Sheet, (5) resources used in aquaculture (labor, land, water, feed, seed, financial resources, etc.), (6) prices (farm-gate, wholesale, retail, trade, etc.), (7) productivity & efficiency, and (8) projections.
4 This article is based on the contents of the forthcoming FAO Report on the Gaeta workshop.
BA
CK
GR
OU
ND
DO
CU
ME
NT
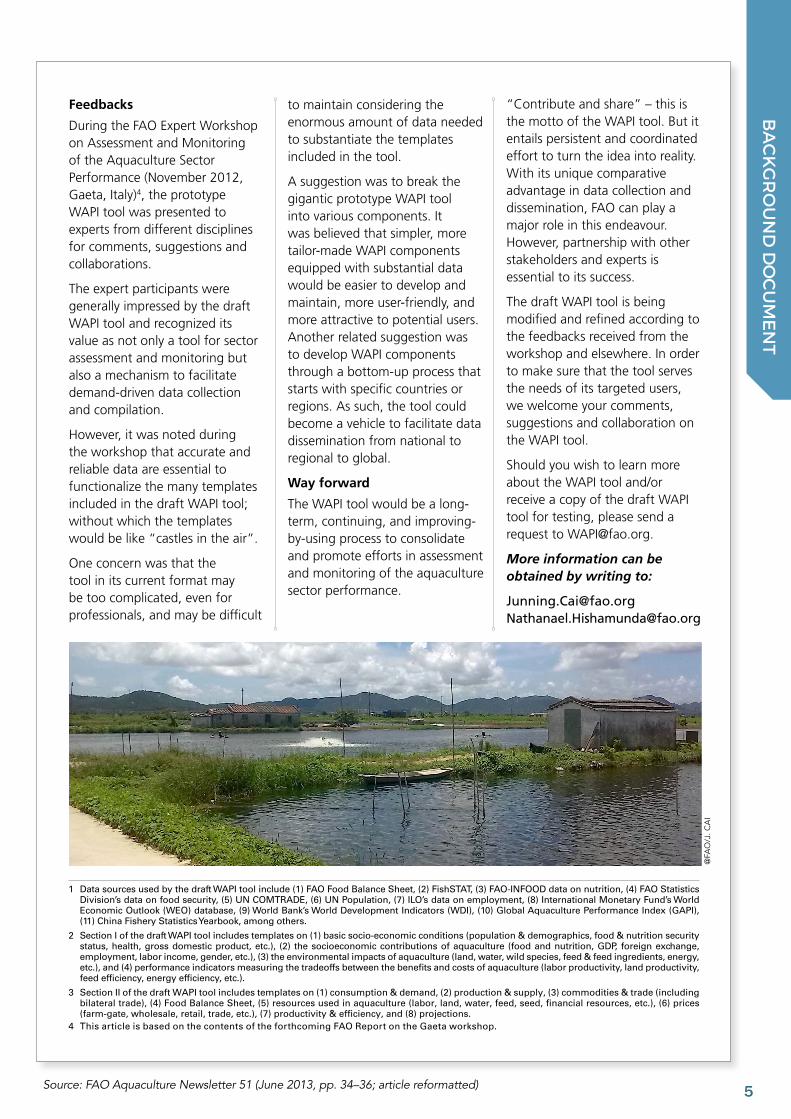
@FA
O/J
. CA
I
644 FAO AQUACULTURE NEWSLETTER No. 56 ■ APRIL 2017
TH
EM
AT
IC A
RT
ICLE
S
The Potential of World Aquaculture Performance Indicators as a Research and Educational Tool
Written by:
Junning CaiFAO Fisheries and Aquaculture Department, Rome, ItalyE-mail: [email protected]
FAO has continued its efforts in developing World Aquaculture
Performance Indicators (WAPI) to assess the economic, social and environmental performance of the sector. WAPI is an on-going initiative to develop a tool to compile, generate and disseminate knowledge and information for evidence-based policy-making and sector management in aquaculture and aquaculture value chains1. Under this initiative a WAPI prototype has been developed and tested. The prototype contains sample templates on fish production, trade and consumption as well as other social, economic and environmental aspects of aquaculture at global, regional and/or national levels. Based on the prototype, two tailor-made WAPI modules, one on fish production and the other on fish consumption, will be disseminated for public use by the end of 2017. Five technical papers that would serve as background documents for WAPI modules on various subjects are being prepared and will be published during 2017–20182.
While the ultimate goal of WAPI is to provide a tool to facilitate evidence-based decision making, its potential of becoming a research tool has become evident during its development. WAPI templates developed in Microsoft Excel3 could initially help
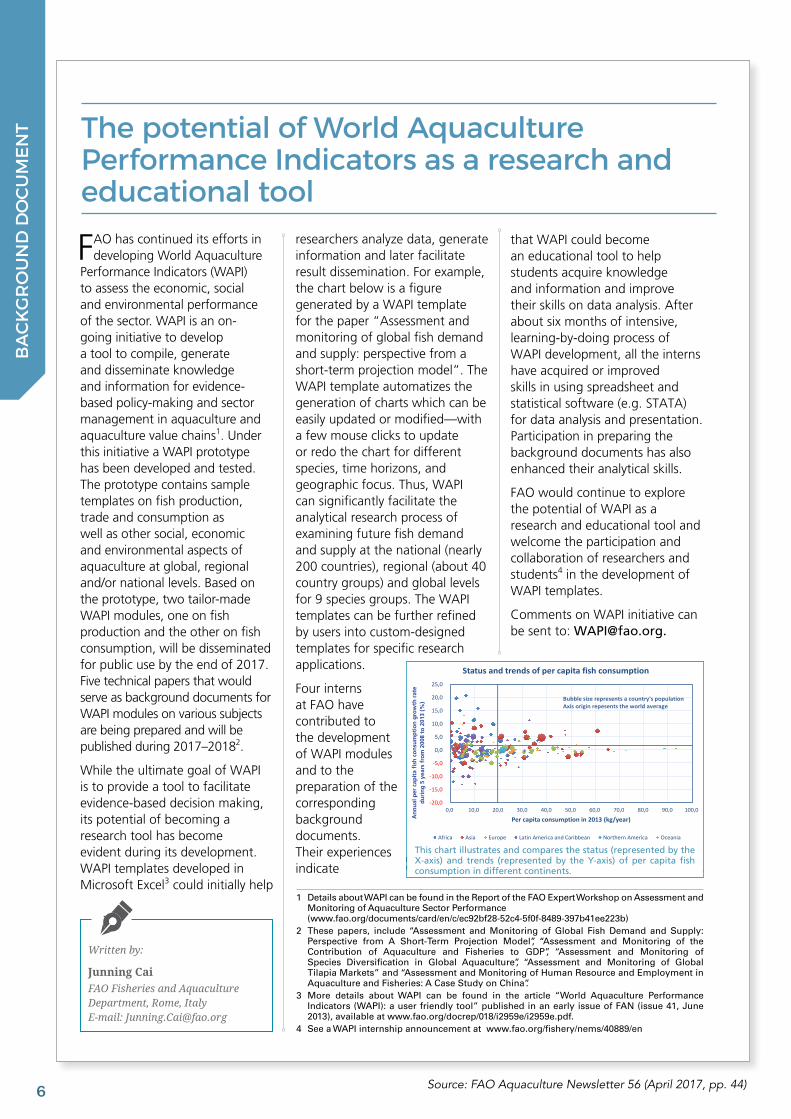
researchers analyze data, generate information and later facilitate result dissemination. For example, the chart below is a figure generated by a WAPI template for the paper “Assessment and monitoring of global fish demand and supply: perspective from a short-term projection model”. The WAPI template automatizes the generation of charts which can be easily updated or modified—with a few mouse clicks to update or redo the chart for different species, time horizons, and geographic focus. Thus, WAPI can significantly facilitate the analytical research process of examining future fish demand and supply at the national (nearly 200 countries), regional (about 40 country groups) and global levels for 9 species groups. The WAPI templates can be further refined by users into custom-designed templates for specific research applications.
Four interns at FAO have contributed to the development of WAPI modules and to the preparation of the corresponding background documents. Their experiences indicate
that WAPI could become an educational tool to help students acquire knowledge and information and improve their skills on data analysis. After about six months of intensive, learning-by-doing process of WAPI development, all the interns have acquired or improved skills in using spreadsheet and statistical software (e.g. STATA) for data analysis and presentation. Participation in preparing the background documents has also enhanced their analytical skills.
FAO would continue to explore the potential of WAPI as a research and educational tool and welcome the participation and collaboration of researchers and students4 in the development of WAPI templates.
Comments on WAPI initiative can be sent to: [email protected].
1 Details about WAPI can be found in the Report of the FAO Expert Workshop on Assessment and Monitoring of Aquaculture Sector Performance
(www.fao.org/documents/card/en/c/ec92bf28-52c4-5f0f-8489-397b41ee223b)2 These papers, include “Assessment and Monitoring of Global Fish Demand and Supply:
Perspective from A Short-Term Projection Model”, “Assessment and Monitoring of the Contribution of Aquaculture and Fisheries to GDP”, “Assessment and Monitoring of Species Diversification in Global Aquaculture”, “Assessment and Monitoring of Global Tilapia Markets” and “Assessment and Monitoring of Human Resource and Employment in Aquaculture and Fisheries: A Case Study on China”.
3 More details about WAPI can be found in the article “World Aquaculture Performance Indicators (WAPI): a user friendly tool” published in an early issue of FAN (issue 41, June 2013), available at www.fao.org/docrep/018/i2959e/i2959e.pdf.
4 See a WAPI internship announcement at www.fao.org/fishery/nems/40889/en
This chart illustrates and compares the status (represented by the X-axis) and trends (represented by the Y-axis) of per capita fish consumption in different continents.
-20,0
-15,0
-10,0
-5,0
0,0
5,0
10,0
15,0
20,0
25,0
0,0 10,0 20,0 30,0 40,0 50,0 60,0 70,0 80,0 90,0 100,0
Annu
alp
erca
pita
fish
cons
umpt
ion
grow
thra
teid
urin
g5
year
sfro
m2
008
to2
013
(%)
Percapitaconsumptionin2013(kg/year)
Statusandtrendsofpercapitafishconsumption
Africa Asia Europe LatinAmericaandCaribbean NorthernAmerica Oceania
Bubblesize representsacountry'spopulationAxisoriginrepesentstheworldaverage
This chart illustrates and compares the status (represented by the X-axis) and trends (represented by the Y-axis) of per capita fish consumption in different continents.
An
nu
al p
er c
apit
a fi
sh c
on
sum
pti
on
gro
wth
rat
e d
uri
ng
5 y
ears
fro
m 2
008
to 2
013
(%)
Source: FAO Aquaculture Newsletter 56 (April 2017, pp. 44)
BA
CK
GR
OU
ND
DO
CU
ME
NT The potential of World Aquaculture
Performance Indicators as a research and educational tool
7FAO AQUACULTURE NEWSLETTER No. 58 ■ APRIL 2018 49
TH
EM
AT
IC A
RT
ICLE
S
Fish as a Poor People’s Food
World per capita fish consumption1 increased
from 12.6 kg in the early 1970s to 14.2 kg in the early 1990s and 19.8 kg in the early 2010s.2 Fish consumption for countries vary greatly, ranging from less than 1 kg per capita per year in some inland countries to over 100 kg per capita per year in some island economies. Fish accounted for 15.6 percent of global animal protein intake in the early 1970s. The ratio declined slightly to 15.1 percent in the early 1990s and bounced back to 16.3 percent in the early 2010s. The fish share in the early 2010s is higher than poultry meat (16.1 percent), pig meat (14.5 percent), bovine meat (11.0 percent), and mutton & goat meat (2.2 percent).
These numbers are obtained from the World Aquaculture Performance Indicator (WAPI) module on fish consumption developed based on FAO Food Balance Sheet data.3 The module contains similar information at the country (more than 200 countries or territories) and regional (nearly 40 country groups) levels. This article uses a chart template in the module to illustrate some interesting patterns of the contribution of fish to animal protein in different countries or territories.
Early 1970s
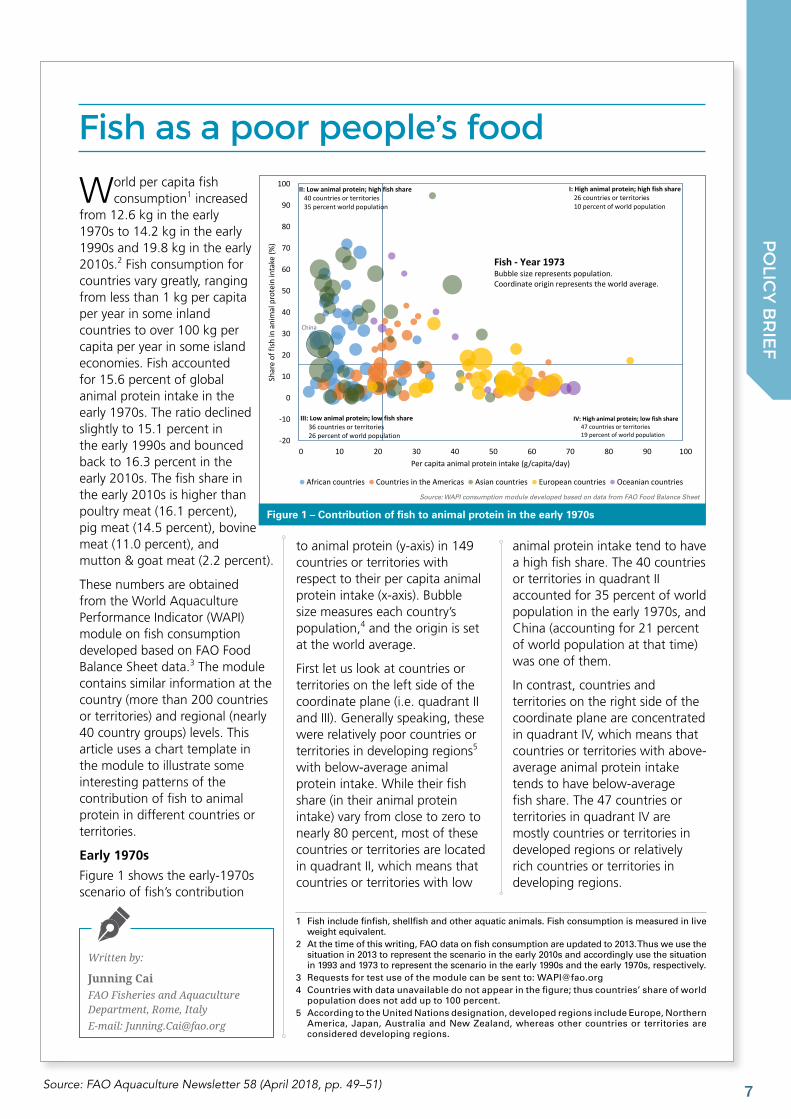
Figure 1 shows the early-1970s scenario of fish’s contribution
to animal protein (y-axis) in 149 countries or territories with respect to their per capita animal protein intake (x-axis). Bubble size measures each country’s population,4 and the origin is set at the world average.
First let us look at countries or territories on the left side of the coordinate plane (i.e. quadrant II and III). Generally speaking, these were relatively poor countries or territories in developing regions5 with below-average animal protein intake. While their fish share (in their animal protein intake) vary from close to zero to nearly 80 percent, most of these countries or territories are located in quadrant II, which means that countries or territories with low
animal protein intake tend to have a high fish share. The 40 countries or territories in quadrant II accounted for 35 percent of world population in the early 1970s, and China (accounting for 21 percent of world population at that time) was one of them.
In contrast, countries and territories on the right side of the coordinate plane are concentrated in quadrant IV, which means that countries or territories with above-average animal protein intake tends to have below-average fish share. The 47 countries or territories in quadrant IV are mostly countries or territories in developed regions or relatively rich countries or territories in developing regions.
Written by:
Junning CaiFAO Fisheries and Aquaculture Department, Rome, Italy
E-mail: [email protected]
1 Fish include finfish, shellfish and other aquatic animals. Fish consumption is measured in live weight equivalent.
2 At the time of this writing, FAO data on fish consumption are updated to 2013. Thus we use the situation in 2013 to represent the scenario in the early 2010s and accordingly use the situation in 1993 and 1973 to represent the scenario in the early 1990s and the early 1970s, respectively.
3 Requests for test use of the module can be sent to: [email protected] Countries with data unavailable do not appear in the figure; thus countries’ share of world
population does not add up to 100 percent.5 According to the United Nations designation, developed regions include Europe, Northern
America, Japan, Australia and New Zealand, whereas other countries or territories are considered developing regions.
China
-20
-10
0
10
20
30
40
50
60
70
80
90
100
0 10 20 30 40 50 60 70 80 90 100
Shar
eof
fish
ina
nim
alp
rote
inin
take
(%)
Percapitaanimalproteinintake(g/capita/day)
Africancountries CountriesintheAmericas Asiancountries Europeancountries Oceaniancountries
Fish- Year1973Bubblesizerepresentspopulation.Coordinateoriginrepresents theworldaverage.
IV:Highanimalprotein; lowfishshare47countriesorterritories19percent ofworldpopulation
III: Lowanimalprotein;lowfishshare36countriesorterritories26 percent ofworldpopulation
II:Lowanimalprotein; highfishshare40 countriesorterritories35percentworldpopulation
I:Highanimalprotein;highfishshare26countriesorterritories10 percentofworldpopulation
Figure 1 – Contribution of fish to animal protein in the early 1970s
Source: WAPI consumption module developed based on data from FAO Food Balance Sheet
Source: FAO Aquaculture Newsletter 58 (April 2018, pp. 49–51)
PO
LICY
BR
IEF
Fish as a poor people’s food
850 FAO AQUACULTURE NEWSLETTER No. 58 ■ APRIL 2018
TH
EM
AT
IC A
RT
ICLE
S
In summary, Figure 1 reveals an L-shape pattern indicating that fish was a relatively more important source of animal protein for relatively poor countries or territories yet a relatively less important source of animal protein for relatively rich countries or territories. In this sense we can say that fish were a poor people’s food in the early 1970s.
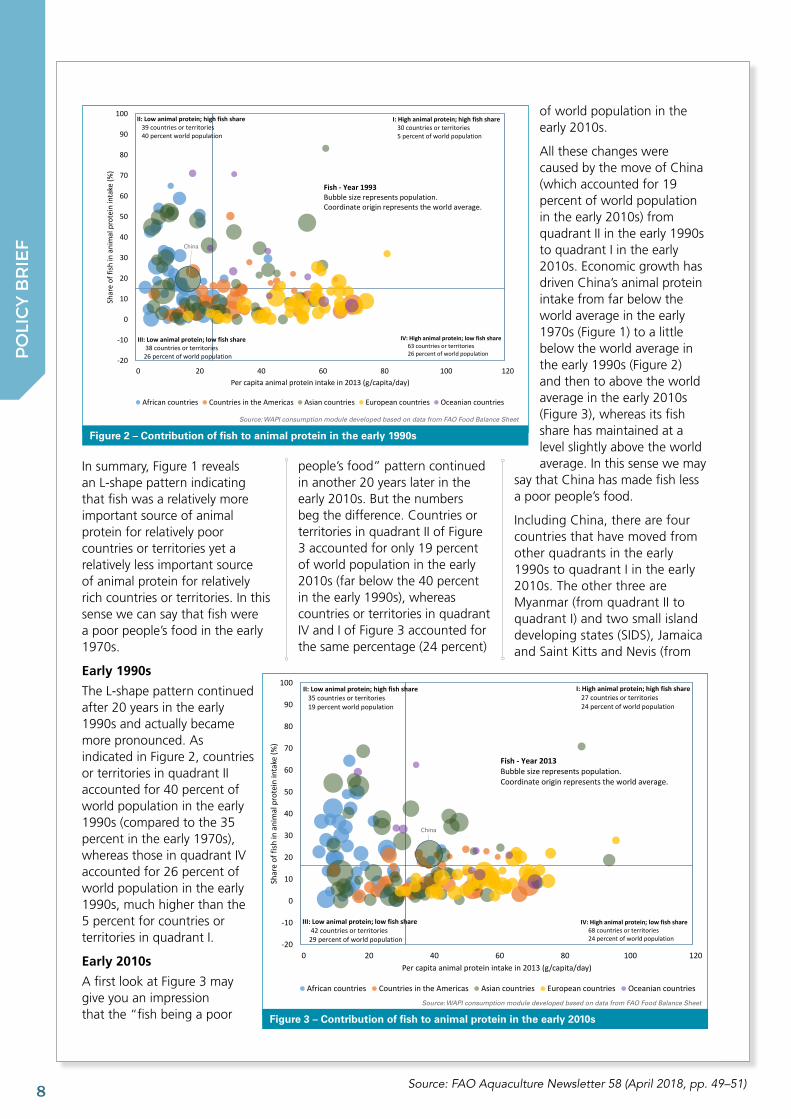
Early 1990s
The L-shape pattern continued after 20 years in the early 1990s and actually became more pronounced. As indicated in Figure 2, countries or territories in quadrant II accounted for 40 percent of world population in the early 1990s (compared to the 35 percent in the early 1970s), whereas those in quadrant IV accounted for 26 percent of world population in the early 1990s, much higher than the 5 percent for countries or territories in quadrant I.
Early 2010s
A first look at Figure 3 may give you an impression that the “fish being a poor
people’s food” pattern continued in another 20 years later in the early 2010s. But the numbers beg the difference. Countries or territories in quadrant II of Figure 3 accounted for only 19 percent of world population in the early 2010s (far below the 40 percent in the early 1990s), whereas countries or territories in quadrant IV and I of Figure 3 accounted for the same percentage (24 percent)
of world population in the early 2010s.
All these changes were caused by the move of China (which accounted for 19 percent of world population in the early 2010s) from quadrant II in the early 1990s to quadrant I in the early 2010s. Economic growth has driven China’s animal protein intake from far below the world average in the early 1970s (Figure 1) to a little below the world average in the early 1990s (Figure 2) and then to above the world average in the early 2010s (Figure 3), whereas its fish share has maintained at a level slightly above the world average. In this sense we may
say that China has made fish less a poor people’s food.
Including China, there are four countries that have moved from other quadrants in the early 1990s to quadrant I in the early 2010s. The other three are Myanmar (from quadrant II to quadrant I) and two small island developing states (SIDS), Jamaica and Saint Kitts and Nevis (from
China
-20
-10
0
10
20
30
40
50
60
70
80
90
100
0 20 40 60 80 100 120
Shar
eof
fish
ina
nim
alp
rote
inin
take
(%)
Percapitaanimalproteinintakein2013(g/capita/day)
Africancountries CountriesintheAmericas Asiancountries Europeancountries Oceaniancountries
Fish- Year1993Bubblesizerepresentspopulation.Coordinateoriginrepresents theworldaverage.
IV:Highanimalprotein; lowfishshare63countriesorterritories26percent ofworldpopulation
III: Lowanimalprotein;lowfishshare38countriesorterritories26 percent ofworldpopulation
II:Lowanimalprotein; highfishshare39countriesorterritories40percentworldpopulation
I:Highanimalprotein;highfishshare30countriesorterritories5 percentofworldpopulation
Figure 2 – Contribution of fish to animal protein in the early 1990s
China
-20
-10
0
10
20
30
40
50
60
70
80
90
100
0 20 40 60 80 100 120
Shar
eof
fish
ina
nim
alp
rote
inin
take
(%)
Percapitaanimalproteinintakein2013(g/capita/day)
Africancountries CountriesintheAmericas Asiancountries Europeancountries Oceaniancountries
Fish- Year2013Bubblesizerepresentspopulation.Coordinateoriginrepresents theworldaverage.
IV:Highanimalprotein; lowfishshare68countriesorterritories24percent ofworldpopulation
III: Lowanimalprotein;lowfishshare42countriesorterritories29 percent ofworldpopulation
II:Lowanimalprotein; highfishshare35 countriesorterritories19percentworldpopulation
I:Highanimalprotein;highfishshare27countriesorterritories24 percentofworldpopulation
Figure 3 – Contribution of fish to animal protein in the early 2010s
Source: WAPI consumption module developed based on data from FAO Food Balance Sheet
Source: WAPI consumption module developed based on data from FAO Food Balance Sheet
Source: FAO Aquaculture Newsletter 58 (April 2018, pp. 49–51)
PO
LIC
Y B
RIE
F
9FAO AQUACULTURE NEWSLETTER No. 58 ■ APRIL 2018 51
TH
EM
AT
IC A
RT
ICLE
S
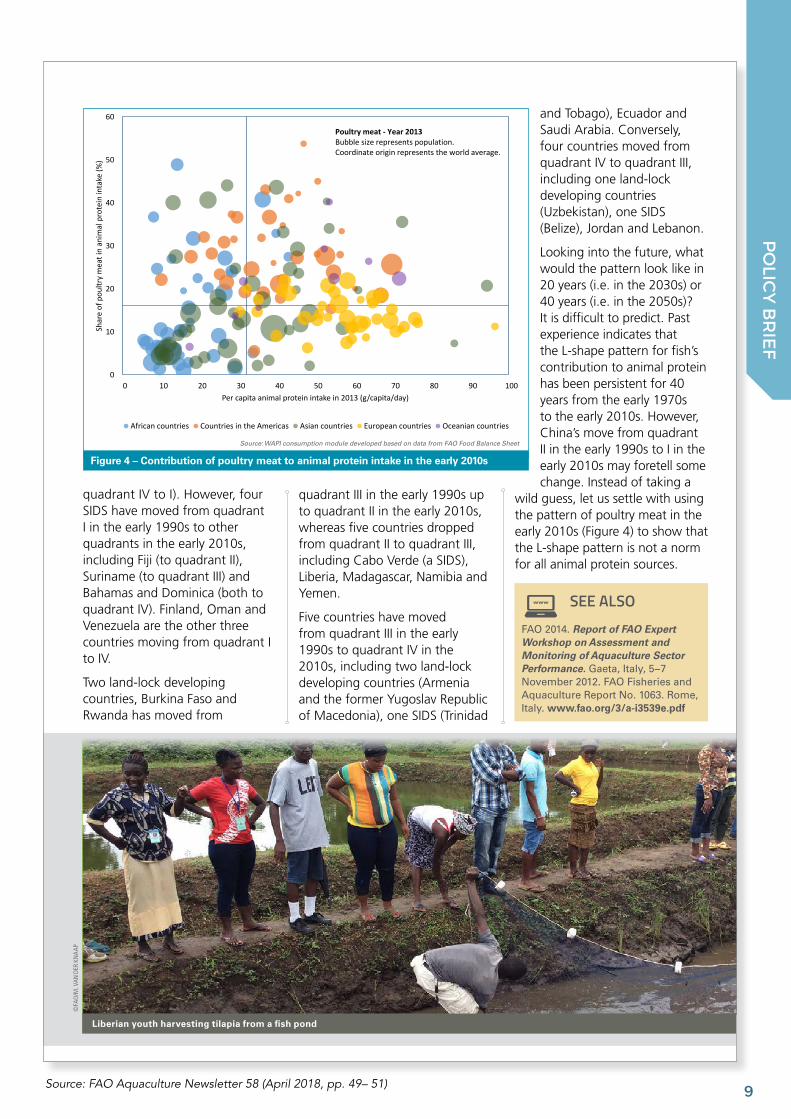
and Tobago), Ecuador and Saudi Arabia. Conversely, four countries moved from quadrant IV to quadrant III, including one land-lock developing countries (Uzbekistan), one SIDS (Belize), Jordan and Lebanon.
Looking into the future, what would the pattern look like in 20 years (i.e. in the 2030s) or 40 years (i.e. in the 2050s)? It is difficult to predict. Past experience indicates that the L-shape pattern for fish’s contribution to animal protein has been persistent for 40 years from the early 1970s to the early 2010s. However, China’s move from quadrant II in the early 1990s to I in the early 2010s may foretell some change. Instead of taking a
wild guess, let us settle with using the pattern of poultry meat in the early 2010s (Figure 4) to show that the L-shape pattern is not a norm for all animal protein sources.
quadrant IV to I). However, four SIDS have moved from quadrant I in the early 1990s to other quadrants in the early 2010s, including Fiji (to quadrant II), Suriname (to quadrant III) and Bahamas and Dominica (both to quadrant IV). Finland, Oman and Venezuela are the other three countries moving from quadrant I to IV.
Two land-lock developing countries, Burkina Faso and Rwanda has moved from
quadrant III in the early 1990s up to quadrant II in the early 2010s, whereas five countries dropped from quadrant II to quadrant III, including Cabo Verde (a SIDS), Liberia, Madagascar, Namibia and Yemen.
Five countries have moved from quadrant III in the early 1990s to quadrant IV in the 2010s, including two land-lock developing countries (Armenia and the former Yugoslav Republic of Macedonia), one SIDS (Trinidad
SEE ALSOFAO 2014. Report of FAO Expert Workshop on Assessment and Monitoring of Aquaculture Sector Performance. Gaeta, Italy, 5−7 November 2012. FAO Fisheries and Aquaculture Report No. 1063. Rome, Italy. www.fao.org/3/a-i3539e.pdf
0
10
20
30
40
50
60
0 10 20 30 40 50 60 70 80 90 100
Shar
eof
pou
ltrym
eati
nan
imal
pro
tein
inta
ke(%
)
Percapitaanimalproteinintakein2013(g/capita/day)
Africancountries CountriesintheAmericas Asiancountries Europeancountries Oceaniancountries
Poultrymeat - Year2013Bubblesizerepresentspopulation.Coordinateoriginrepresents theworldaverage.
Figure 4 – Contribution of poultry meat to animal protein intake in the early 2010s
Source: WAPI consumption module developed based on data from FAO Food Balance Sheet
Liberian youth harvesting tilapia from a fish pond
©FA
O/M
. VAN
DER
KN
AAP
Source: FAO Aquaculture Newsletter 58 (April 2018, pp. 49– 51)
PO
LICY
BR
IEF
1048 FAO AQUACULTURE NEWSLETTER No. 57 ■ SEPTEMBER 2017
TH
EM
AT
IC A
RT
ICLE
S
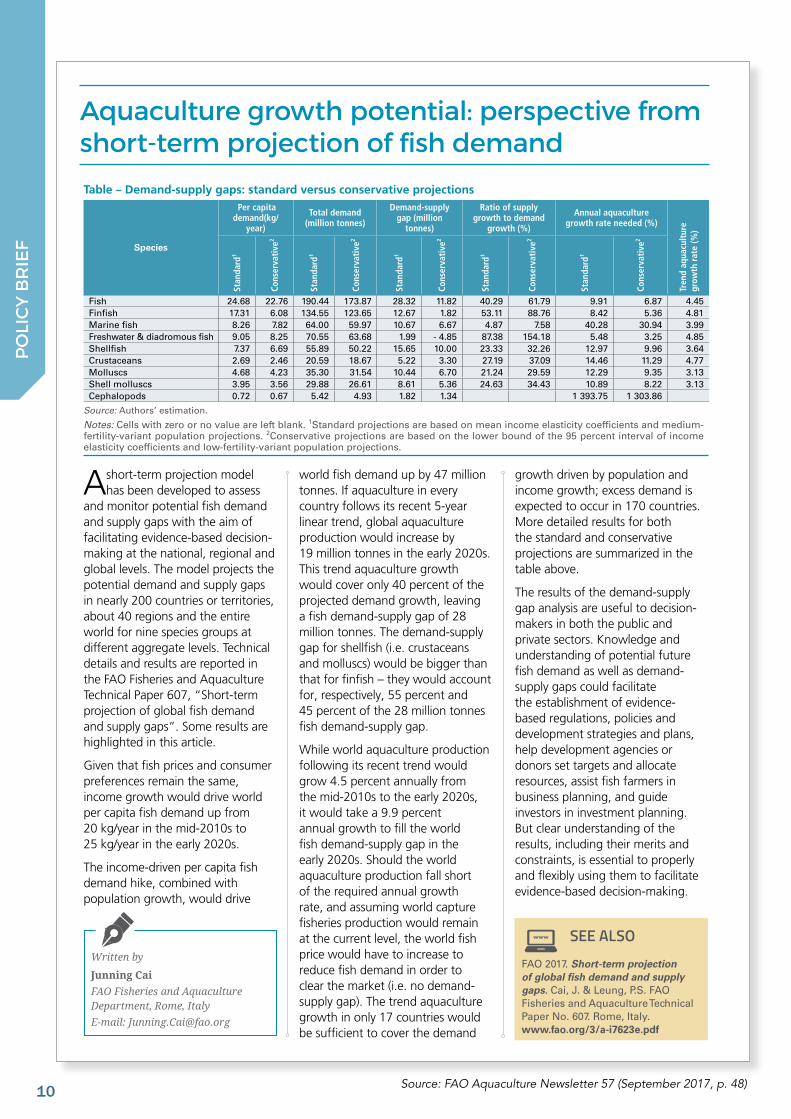
A short-term projection model has been developed to assess
and monitor potential fish demand and supply gaps with the aim of facilitating evidence-based decision-making at the national, regional and global levels. The model projects the potential demand and supply gaps in nearly 200 countries or territories, about 40 regions and the entire world for nine species groups at different aggregate levels. Technical details and results are reported in the FAO Fisheries and Aquaculture Technical Paper 607, “Short-term projection of global fish demand and supply gaps”. Some results are highlighted in this article.
Given that fish prices and consumer preferences remain the same, income growth would drive world per capita fish demand up from 20 kg/year in the mid-2010s to 25 kg/year in the early 2020s.
The income-driven per capita fish demand hike, combined with population growth, would drive
world fish demand up by 47 million tonnes. If aquaculture in every country follows its recent 5-year linear trend, global aquaculture production would increase by 19 million tonnes in the early 2020s. This trend aquaculture growth would cover only 40 percent of the projected demand growth, leaving a fish demand-supply gap of 28 million tonnes. The demand-supply gap for shellfish (i.e. crustaceans and molluscs) would be bigger than that for finfish – they would account for, respectively, 55 percent and 45 percent of the 28 million tonnes fish demand-supply gap.
While world aquaculture production following its recent trend would grow 4.5 percent annually from the mid-2010s to the early 2020s, it would take a 9.9 percent annual growth to fill the world fish demand-supply gap in the early 2020s. Should the world aquaculture production fall short of the required annual growth rate, and assuming world capture fisheries production would remain at the current level, the world fish price would have to increase to reduce fish demand in order to clear the market (i.e. no demand-supply gap). The trend aquaculture growth in only 17 countries would be sufficient to cover the demand
growth driven by population and income growth; excess demand is expected to occur in 170 countries. More detailed results for both the standard and conservative projections are summarized in the table above.
The results of the demand-supply gap analysis are useful to decision-makers in both the public and private sectors. Knowledge and understanding of potential future fish demand as well as demand-supply gaps could facilitate the establishment of evidence-based regulations, policies and development strategies and plans, help development agencies or donors set targets and allocate resources, assist fish farmers in business planning, and guide investors in investment planning. But clear understanding of the results, including their merits and constraints, is essential to properly and flexibly using them to facilitate evidence-based decision-making.
Aquaculture Growth Potential: Perspective from Short-Term Projection of Fish Demand
Written by
Junning Cai
FAO Fisheries and Aquaculture Department, Rome, Italy
E-mail: [email protected]
Table – Demand-supply gaps: standard versus conservative projections
Species
Per capita demand(kg/
year)
Total demand (million tonnes)
Demand-supply gap (million
tonnes)
Ratio of supply growth to demand
growth (%)
Annual aquaculture growth rate needed (%)
Tren
d aq
uacu
ltur
e gr
owth
rat
e (%
)
Stan
dard
1
Cons
erva
tive
2
Stan
dard
1
Cons
erva
tive
2
Stan
dard
1
Cons
erva
tive
2
Stan
dard
1
Cons
erva
tive
2
Stan
dard
1
Cons
erva
tive
2
Fish 24.68 22.76 190.44 173.87 28.32 11.82 40.29 61.79 9.91 6.87 4.45Finfish 17.31 6.08 134.55 123.65 12.67 1.82 53.11 88.76 8.42 5.36 4.81Marine fish 8.26 7.82 64.00 59.97 10.67 6.67 4.87 7.58 40.28 30.94 3.99Freshwater & diadromous fish 9.05 8.25 70.55 63.68 1.99 - 4.85 87.38 154.18 5.48 3.25 4.85Shellfish 7.37 6.69 55.89 50.22 15.65 10.00 23.33 32.26 12.97 9.96 3.64Crustaceans 2.69 2.46 20.59 18.67 5.22 3.30 27.19 37.09 14.46 11.29 4.77Molluscs 4.68 4.23 35.30 31.54 10.44 6.70 21.24 29.59 12.29 9.35 3.13Shell molluscs 3.95 3.56 29.88 26.61 8.61 5.36 24.63 34.43 10.89 8.22 3.13Cephalopods 0.72 0.67 5.42 4.93 1.82 1.34 1 393.75 1 303.86
Source: Authors’ estimation.
Notes: Cells with zero or no value are left blank. 1Standard projections are based on mean income elasticity coefficients and medium-fertility-variant population projections. 2Conservative projections are based on the lower bound of the 95 percent interval of income elasticity coefficients and low-fertility-variant population projections.
SEE ALSOFAO 2017. Short-term projection of global fish demand and supply gaps. Cai, J. & Leung, P.S. FAO Fisheries and Aquaculture Technical Paper No. 607. Rome, Italy. www.fao.org/3/a-i7623e.pdf
Source: FAO Aquaculture Newsletter 57 (September 2017, p. 48)
PO
LIC
Y B
RIE
F
Aquaculture growth potential: perspective from short-term projection of fish demand
11
36 FAO AQUACULTURE NEWSLETTER No. 57 ■ SEPTEMBER 2017
SU
B-S
AH
AR
AN
AF
RIC
A
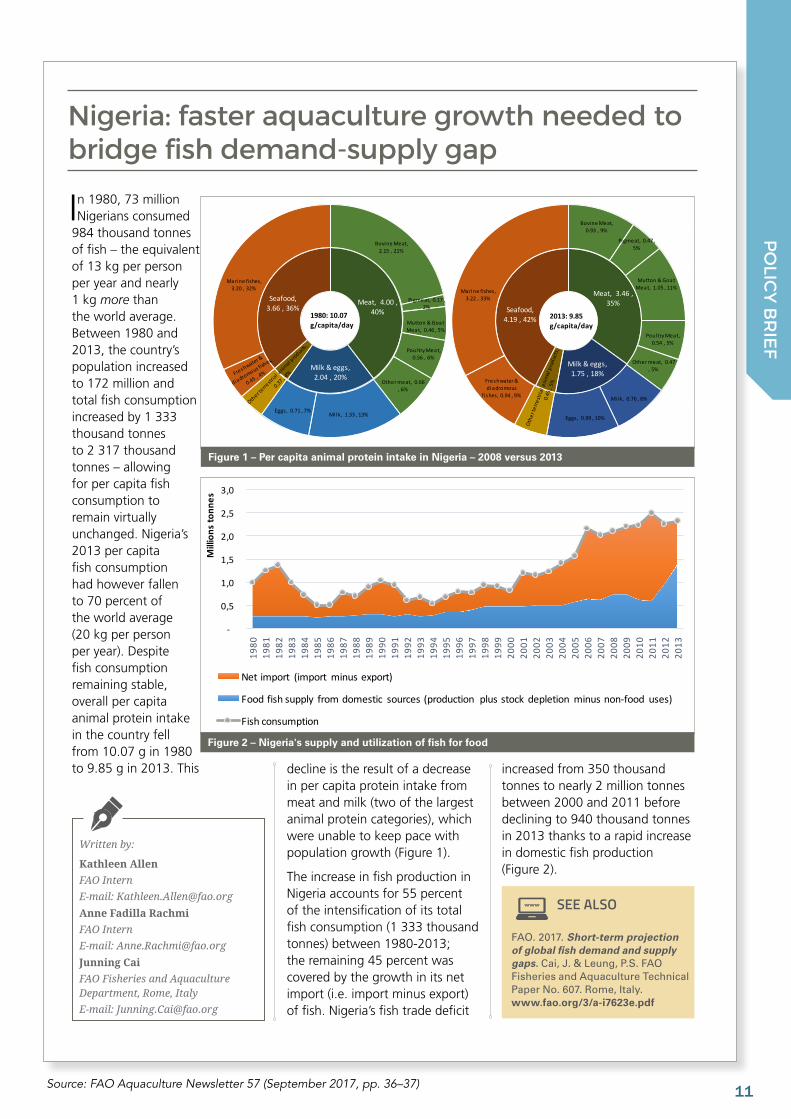
In 1980, 73 million Nigerians consumed
984 thousand tonnes of fish – the equivalent of 13 kg per person per year and nearly 1 kg more than the world average. Between 1980 and 2013, the country’s population increased to 172 million and total fish consumption increased by 1 333 thousand tonnes to 2 317 thousand tonnes – allowing for per capita fish consumption to remain virtually unchanged. Nigeria’s 2013 per capita fish consumption had however fallen to 70 percent of the world average (20 kg per person per year). Despite fish consumption remaining stable, overall per capita animal protein intake in the country fell from 10.07 g in 1980 to 9.85 g in 2013. This decline is the result of a decrease
in per capita protein intake from meat and milk (two of the largest animal protein categories), which were unable to keep pace with population growth (Figure 1).
The increase in fish production in Nigeria accounts for 55 percent of the intensification of its total fish consumption (1 333 thousand tonnes) between 1980-2013; the remaining 45 percent was covered by the growth in its net import (i.e. import minus export) of fish. Nigeria’s fish trade deficit
increased from 350 thousand tonnes to nearly 2 million tonnes between 2000 and 2011 before declining to 940 thousand tonnes in 2013 thanks to a rapid increase in domestic fish production (Figure 2).
Nigeria: Faster Aquaculture Growth Needed to Bridge Fish Demand-Supply Gap
Written by:
Kathleen Allen
FAO Intern
E-mail: [email protected]
Anne Fadilla Rachmi
FAO Intern
E-mail: [email protected]
Junning Cai
FAO Fisheries and Aquaculture Department, Rome, Italy
E-mail: [email protected]
Figure1:PercapitaanimalproteinintakeinNigeria–2008vesus2013
Meat, 4.00,40%
Milk&eggs,2.04,20%
Seafood,3.66,36%
BovineMeat,2.15,21%
Pigmeat,0.17,2%
Mutton&GoatMeat, 0.46,5%
PoultryMeat,0.56,6%
Othermeat, 0.66,6%
Milk, 1.33,13%Eggs , 0.71,7%
Marinefishes,3.20,32%
1980:10.07g/capita/day
Meat, 3.46,35%
Milk&eggs,1.75,18%
Seafood,4.19,42%
BovineMeat,0.93,9%
Pigmeat,0.47,5%
Mutton&GoatMeat, 1.05,11%
PoultryMeat,0.54,5%
Othermeat, 0.47,5%
Milk, 0.76,8%
Eggs , 0.99,10%
Freshwater&diadromous
fi shes,0.94,9%
Marinefishes,3.22,33%
2013:9.85g/capita/day
-
0,5
1,0
1,5
2,0
2,5
3,0
1980
19
81
1982
19
83
1984
19
85
1986
19
87
1988
19
89
1990
19
91
1992
19
93
1994
19
95
1996
19
97
1998
19
99
2000
20
01
2002
20
03
2004
20
05
2006
20
07
2008
20
09
2010
20
11
2012
20
13
Millionsto
nnes
Figure2:Nigeria'ssupplyandutilizationoffishforfood
Netimport (import minusexport)
Foodfishsupplyfromdomestic sources(production plusstockdepletion minusnon-food uses)
Fishconsumption
SEE ALSO
FAO. 2017. Short-term projection of global fish demand and supply gaps. Cai, J. & Leung, P.S. FAO Fisheries and Aquaculture Technical Paper No. 607. Rome, Italy.www.fao.org/3/a-i7623e.pdf
Figure 1 – Per capita animal protein intake in Nigeria – 2008 versus 2013
Figure 2 – Nigeria's supply and utilization of fish for food
Source: FAO Aquaculture Newsletter 57 (September 2017, pp. 36–37)
PO
LICY
BR
IEF
Nigeria: faster aquaculture growth needed to bridge fish demand-supply gap
12FAO AQUACULTURE NEWSLETTER No. 57 ■ SEPTEMBER 2017 37
SU
B-S
AH
AR
AN
AF
RIC
A
NIgeria
World
- 5
0
5
10
15
20
25
0 1 10 100 1000 10000 100000 1000000 10000000 100000000
Annu
alg
rowth
rate
ofA
quac
ultu
reP
rodu
ction
Qua
ntity
ofA
quat
icpr
oduc
tsfro
m1
980
to2
015(%
)
AquacultureProductionQuantityofAquaticproductsin2015(tonnes)
Figure4:Statusandtrendofglobalaquacultureproduction-2015versus1980
Africacountries Americascountries Asiacountries Europecountries Oceaniacountries NIgeria World
Bubblesizemeasuringpopulation
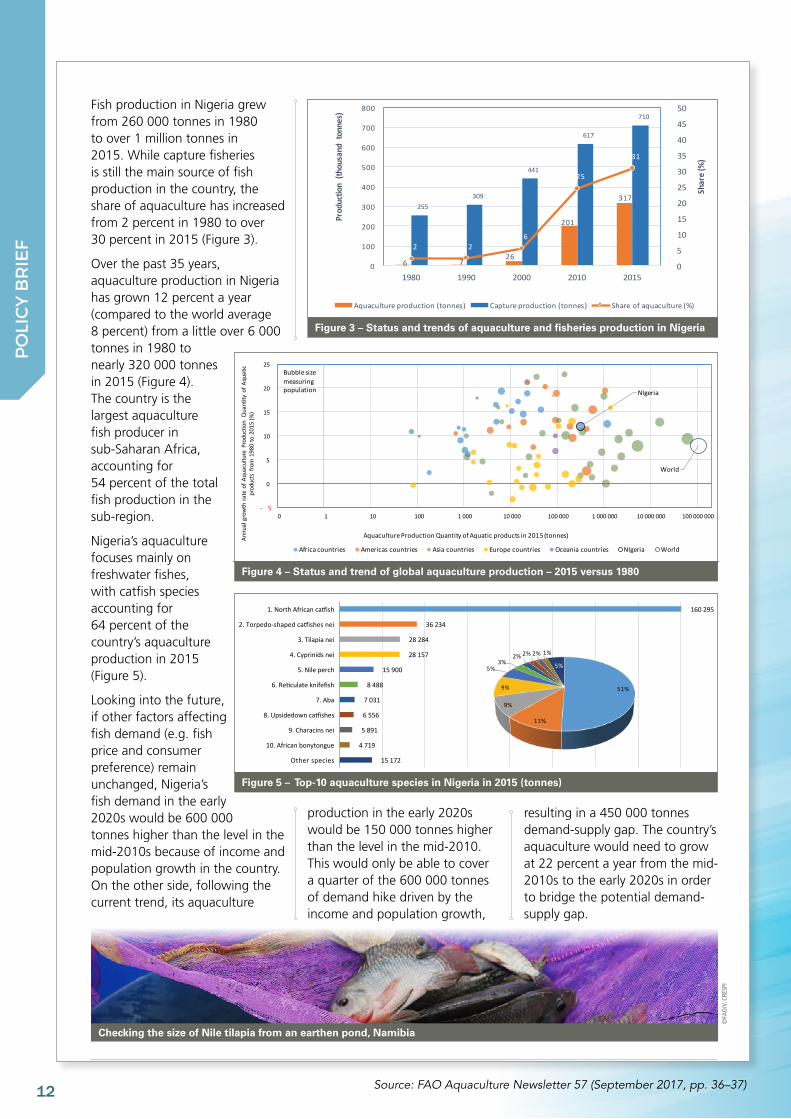
Figure 4 – Status and trend of global aquaculture production – 2015 versus 1980
160 295
36 234
28 284
28 157
15 900
8 488
7 031
6 556
5 891
4 719
15 172
1. North African catfish
2. Torpedo-shaped catfishes nei
3. Tilapia nei
4. Cyprinids nei
5. Nile perch
6. Reticulate knifefish
7. Aba
8. Upsidedown catfishes
9. Characins nei
10. African bonytongue
Other species
51%
11%
9%
9%
5%3%
2% 2% 2% 1%
5%
Figure 5 – Top-10 aquaculture species in Nigeria in 2015 (tonnes)
Fish production in Nigeria grew from 260 000 tonnes in 1980 to over 1 million tonnes in 2015. While capture fisheries is still the main source of fish production in the country, the share of aquaculture has increased from 2 percent in 1980 to over 30 percent in 2015 (Figure 3).
Over the past 35 years, aquaculture production in Nigeria has grown 12 percent a year (compared to the world average 8 percent) from a little over 6 000 tonnes in 1980 to nearly 320 000 tonnes in 2015 (Figure 4). The country is the largest aquaculture fish producer in sub-Saharan Africa, accounting for 54 percent of the total fish production in the sub-region.
Nigeria’s aquaculture focuses mainly on freshwater fishes, with catfish species accounting for 64 percent of the country’s aquaculture production in 2015 (Figure 5).
Looking into the future, if other factors affecting fish demand (e.g. fish price and consumer preference) remain unchanged, Nigeria’s fish demand in the early 2020s would be 600 000 tonnes higher than the level in the mid-2010s because of income and population growth in the country. On the other side, following the current trend, its aquaculture
production in the early 2020s would be 150 000 tonnes higher than the level in the mid-2010. This would only be able to cover a quarter of the 600 000 tonnes of demand hike driven by the income and population growth,
resulting in a 450 000 tonnes demand-supply gap. The country’s aquaculture would need to grow at 22 percent a year from the mid-2010s to the early 2020s in order to bridge the potential demand-supply gap.
6 726
201
317255
309
441
617
710
2 26
25
31
0
5
10
15
20
25
30
35
40
45
50
0
100
200
300
400
500
600
700
800
1980 1990 2000 2010 2015
Share(%)
Production(th
ousandtonnes)
Figure3:Statusand trendofaquacultureand fisheriesproduction inNigeria
Aquacultureproduction(tonnes) Captureproduction(tonnes) Shareofaquaculture(%)
Figure 3 – Status and trends of aquaculture and fisheries production in Nigeria
©FA
O/V
. CRE
SPI
Checking the size of Nile tilapia from an earthen pond, Namibia
Source: FAO Aquaculture Newsletter 57 (September 2017, pp. 36–37)
PO
LIC
Y B
RIE
F
FAO Fisheries and Aquaculture Report No. 1063 FIRA/R1063 (En) ISSN 2070-6987
Report of the
FAO EXPERT WORKSHOP ON ASSESSMENT AND MONITORING OF AQUACULTURE SECTOR PERFORMANCE Gaeta, Italy, 5−7 November 2012
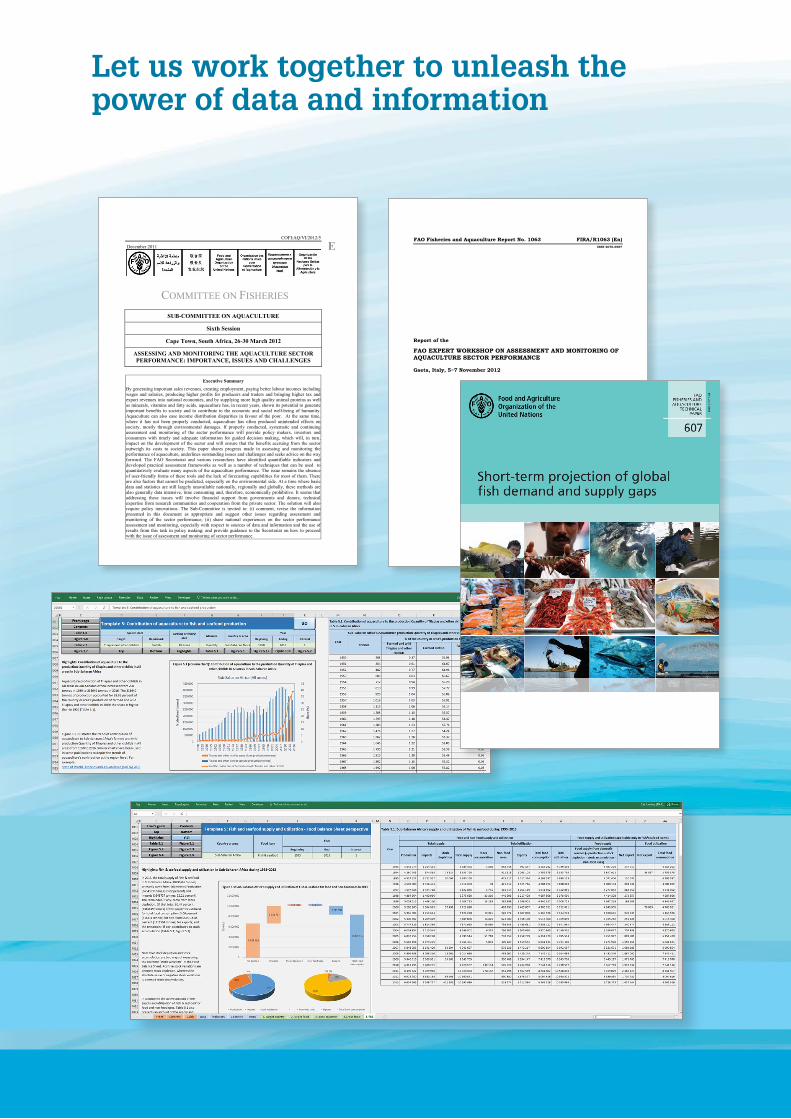
Let us work together to unleash the power of data and information
COFI:AQ/VI/2012/5
December 2011
E
COMMITTEE ON FISHERIES SUB-COMMITTEE ON AQUACULTURE
Sixth Session
Cape Town, South Africa, 26-30 March 2012
ASSESSING AND MONITORING THE AQUACULTURE SECTOR PERFORMANCE: IMPORTANCE, ISSUES AND CHALLENGES
Executive Summary
By generating important sales revenues, creating employment, paying better labour incomes including wages and salaries, producing higher profits for producers and traders and bringing higher tax and export revenues into national economies, and by supplying more high quality animal proteins as well as minerals, vitamins and fatty acids, aquaculture has, in recent years, shown its potential to generate important benefits to society and to contribute to the economic and social well-being of humanity. Aquaculture can also ease income distribution disparities in favour of the poor. At the same time, where it has not been properly conducted, aquaculture has often produced unintended effects on society, mostly through environmental damages. If properly conducted, systematic and continuing assessment and monitoring of the sector performance will provide policy makers, investors and consumers with timely and adequate information for guided decision making, which will, in turn, impact on the development of the sector and will ensure that the benefits accruing from the sector outweigh its costs to society. This paper shares progress made in assessing and monitoring the performance of aquaculture, underlines outstanding issues and challenges and seeks advice on the way forward. The FAO Secretariat and various researchers have identified quantifiable indicators and developed practical assessment frameworks as well as a number of techniques that can be used to quantitatively evaluate many aspects of the aquaculture performance. The issue remains the absence of user-friendly forms of these tools and the lack of forecasting capabilities for most of them. There are also factors that cannot be predicted, especially on the environmental side. At a time where basic data and statistics are still largely unavailable nationally, regionally and globally, these methods are also generally data intensive, time consuming and, therefore, economically prohibitive. It seems that addressing these issues will involve financial support from governments and donors, technical expertise from research communities and cooperation from the private sector. The solution will also require policy innovations. The Sub-Committee is invited to: (i) comment, revise the information presented in this document as appropriate and suggest other issues regarding assessment and monitoring of the sector performance; (ii) share national experiences on the sector performance assessment and monitoring, especially with respect to sources of data and information and the use of results from this task in policy making; and provide guidance to the Secretariat on how to proceed with the issue of assessment and monitoring of sector performance.
www.fao.org/fishery/statistics/software/wapi/en | [email protected]
©
FAO
, 201
8 I
9622
EN/1
/05.
18