
Contact: [email protected] @sharmelsheikhrealestate.com Contact: [email protected].

$
WORKSHOP FIELD COORDINATOR
NOVEMBER 17–20, 2014 WASHINGTON DC, USA
How to Write a Baseline Report
November 20, 2014
Maria Ruth Jones & Michell Dong

Purpose
Present main findings from the baseline survey
Descriptive not persuasive
Audience
Government officials & donor agencies
In plain language
Emphasize the main findings
What is a baseline report?
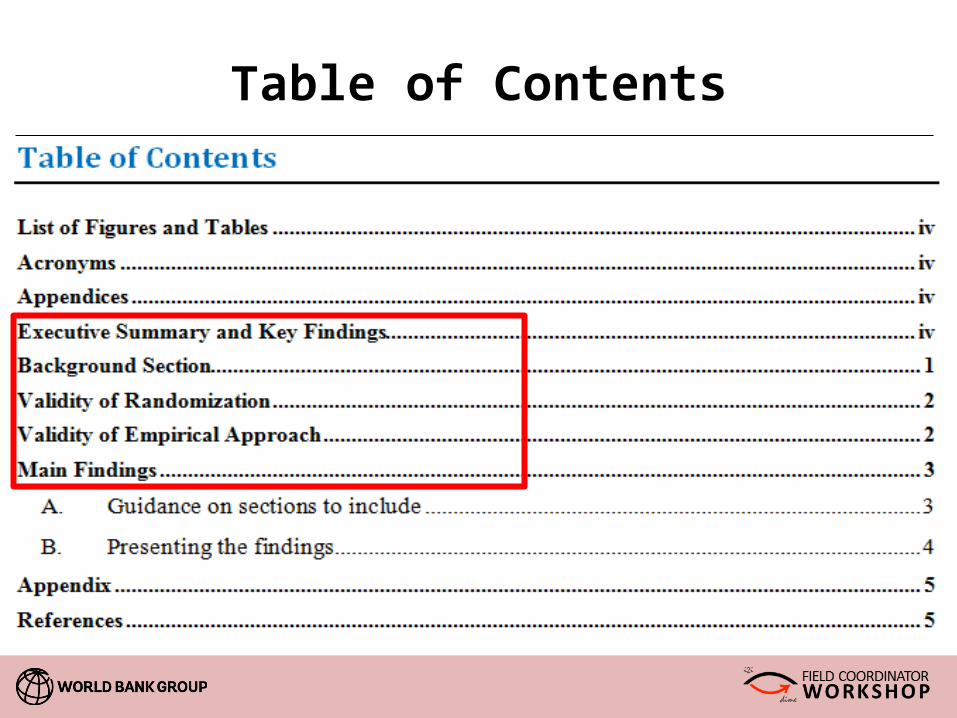
Table of Contents
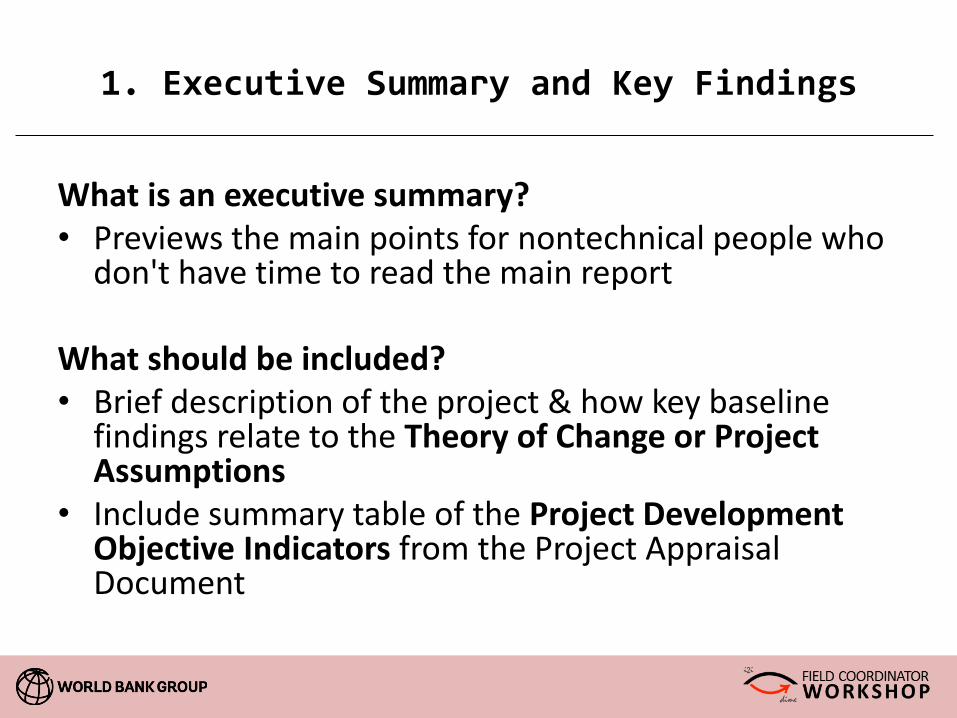
What is an executive summary? • Previews the main points for nontechnical people who
don't have time to read the main report What should be included? • Brief description of the project & how key baseline
findings relate to the Theory of Change or Project Assumptions
• Include summary table of the Project Development Objective Indicators from the Project Appraisal Document
1. Executive Summary and Key Findings

“If the project is successful, what will be its principal outcome for the primary target group?”
Project Development Objective Indicators?
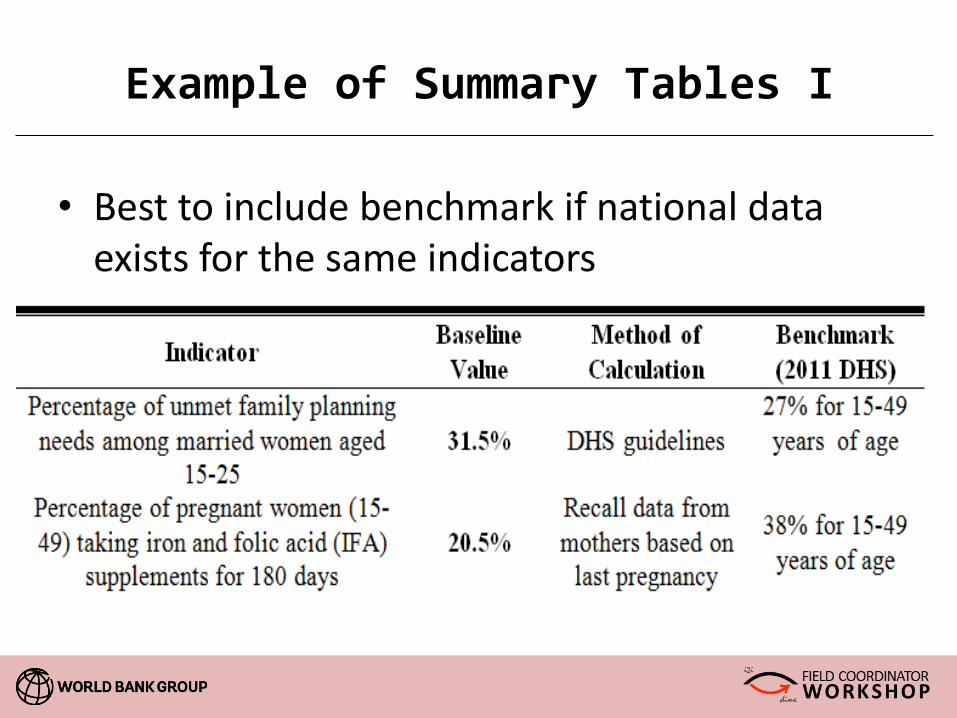
• Best to include benchmark if national data exists for the same indicators
Example of Summary Tables I

• Indicators may be divided by region/ gender of household head depending on the project design
Example of Summary Tables II

What to include in the background
section?
• Policy Context
• Description of Intervention
• IE Design
• Baseline Data Collection Overview
2. Background Section
Details on data collection
• Timeline
• Modality: PAPI/CAPI
• Field team set-up, data quality protocols
Sample
Sampling weights (if applicable)
Baseline Data Collection

• Balance tests for the main indicators
3. Validity of Randomization

• Present the power calculation results
4. Validity of Empirical Approach
Redo power calculation presented in the concept note using the baseline data

Main Findings
• Guidance on sections to include
• Analysis
• Presentation of the findings
• Key findings
• Description of the population of interest
• Household characteristics, gender of household head, age, education, literacy rate, access to water/ sanitation, etc.
• Baseline status of the PDO indicators and all other outcome variables identified in research questions
• Knowledge, attitude and practice (KAP) related to the intervention
• Other factors that may positively or negatively affect the intervention, or be affected by the intervention
Which sections to include?

1. Does the sample differ in terms of gender of household head, income quartile or geographic region?
Figure: Proportion of Women Taking Iron Supplement
How to analyze?

2. How does the sample differ from the national average?
How to analyze?
Figure: Malnutrition by Gender
– Figures are best for any points you want to emphasize; more likely to be read
– Note that colors should be chosen such that figures will still be legible if printed out in grayscale
Tables vs. Figures?

Table vs. Figure I
MCBP Sample 2013 NDHS
Boys Girls Boys Girls
Underweight 20.2% 28.9% 17.8% 16.5%
Severely underweight 13.9% 12.4% 12.4% 10.8%
Easier to read with figures

When there are too many fields, better to present with table
Table vs. Figure II
20
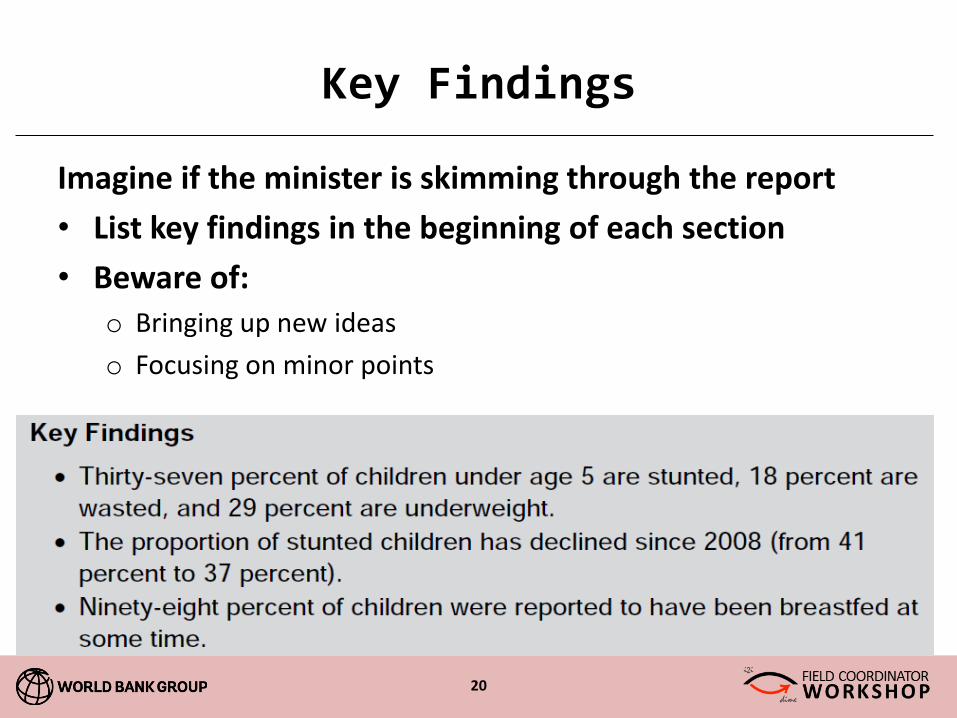
Imagine if the minister is skimming through the report
• List key findings in the beginning of each section
• Beware of:
o Bringing up new ideas
o Focusing on minor points
Key Findings

Which one is better?
1. The most common source of drinking water in Nepal is water piped into the dwelling/yard/plot (42%), followed by tube well or borehole (31%).
2. The vast majority of households in Nepal (89 percent) have access to an improved source of drinking water.
Key Findings Example I

Which one is better? 1. 90% of households in Gombe Central and North are Muslim, compared to 19% of households in Gombe South. Also, 30% of households in Gombe speak Fulfulde, 14% speak Tangale and 11% speak Hausa. 2. The population of Gombe State is diverse. Gombe South is predominantly Christian while Gombe Central and Gombe North are mostly Muslim. Linguistically, there is a great deal of heterogeneity, with the top four languages accounting for only 63% of surveyed households.
Key Findings Example II
Any questions or other suggestions on writing the baseline report?

$
WORKSHOP FIELD COORDINATOR
NOVEMBER 17–20, 2014 WASHINGTON DC, USA


![armenian - World Banksiteresources.worldbank.org/.../cks_armenian.pdffirrwurarfrnqbßpba ffmurnrlmlJQmt1 prnqrnrrlrnrurnnl_nrnaurblrna Jprlmrlrnbqrntl mournrfrnnmburblurcû' ril]burblrnc](https://static.fdocuments.us/doc/165x107/5adb9cbd7f8b9aee348e42d0/armenian-world-ffmurnrlmljqmt1-prnqrnrrlrnrurnnlnrnaurblrna-jprlmrlrnbqrntl-mournrfrnnmburblurc.jpg)


