Workshop Summary - OECD · Workshop Summary . Workshop on “Corresponding Adjustment” as part of...
35
Workshop Summary Workshop on “Corresponding Adjustment” as part of Article 6 accounting Ottawa, Canada, 20 February 2017 OECD/IEA Project for the Climate Change Expert Group
Transcript of Workshop Summary - OECD · Workshop Summary . Workshop on “Corresponding Adjustment” as part of...

Workshop Summary
Workshop on “Corresponding Adjustment” as part of Article 6 accounting
Ottawa, Canada, 20 February 2017
OECD/IEA Project for the Climate Change Expert Group

2
Introduction
On 20 February 2017, a group of negotiators from developed and developing countries met in Ottawa for a one-day workshop focused on “corresponding adjustment” for Internationally Transferred Mitigation Outcomes (ITMOs) as part of Article 6 accounting guidance under the Paris Agreement.
Christina Hood of the International Energy Agency led the event, with the workshop materials drawing on concepts developed in previous work for the OECD-IEA Climate Change Expert Group (http://www.oecd.org/env/cc/ccxg.htm). The workshop was based around a series of worked examples, which are presented in a background document (Annex to this summary). Participants divided into small groups to discuss the examples and provide their perspectives on the discussion questions posed, and the pros and cons of various accounting approaches.
The workshop was held under the Chatham House rule, with negotiators invited on an individual basis. These notes present a compilation of participants’ comments and do not represent any consensus or agreed outcome from the workshop.
This workshop was made possible by financial support from Environment and Climate Change Canada, and special thanks are extended to Martin Lajoie, Sara Fortin, Stefan Wesche, and Benjamin Hayes for their stellar support. Sara Moarif (IEA); Richard Baron, Andrew Prag and Jane Ellis (OECD); and Amy Steen and Phillip Eyre (UNFCCC) provided helpful comments on the background materials, and extra thanks are extended to Andrew Howard (Koru Climate) for substantial and valuable input.
Session 1: Basic Transfers
In this introductory session participants considered two worked examples, the first a simple transfer of Nationally Determined Contribution (NDC) “surplus” between two Parties, and the second a crediting system in one Party selling units to companies in the other (with both Parties recognising the trade toward their NDCs).
Worked Example 1
In this example, participants explored the concept that “adjustment” can start either from inventory emissions, or from the target level. They were asked to consider the information needed to be able to make such adjustments, the timing of this information, and whether consistency is needed in the adjustment approach Parties employ.
Participants raised a range of information that would potentially be needed to be able to make adjustments:
• Inventory emissions: greenhouse gas (GHG) inventory from both Parties, base and target year, consistent time series in a first report, by gas, global warming potential (GWP)
• NDCs: scope (sectors, gases), base year and target year quantity, GDP data for intensity targets, trajectories and whether the NDC had been updated. Several participants noted that as the NDC needs to be compared with emissions and adjusted with ITMOs, quantification is important, as are the units used to express the NDC (GWP).
• ITMOs: types and quantities received/transferred/used/banked/holdings (net transfers and/or all transactions), definition of units (GWPs), serialised units, origin, year of transfer, info/conditions on reversals of temporary reductions.

3
With regard to the timing of information, points raised included that
• National inventory reports should eventually be available “regularly”, potentially at least every two years, although data is two years delayed in these, and verification is still later by technical review teams. With five-yearly NDC cycles, the timing of biennial reports under the Paris Agreement may not align with NDC target years.
• Information on emissions and ITMOs would be needed during biennial tracking of progress (under Article 13), and after the target year. Some expressed a strong view that information on emissions and the NDC should be available before ITMO trades occur. Some participants suggested that where trades are done on a Government-to-Government basis, the Parties involved would decide what information they need and the timing of the trade.
Views were split on the necessity of having a common approach (emissions-based or target-based accounting) by both Parties. Many felt that this is essential to provide transparency and avoid confusion (which could lead to double counting), while others noted that the two approaches are mathematically equivalent giving the same end result.
Worked Example 2
The second worked example was that of a crediting system in one Party selling units to companies in the other Party. Some units were banked for potential later use by both Parties. Participants were asked to discuss the pros and cons of the Party hosting the crediting system accounting for all units transferred and banked, or only accounting for those units that are used by the acquiring Party towards its current NDC.
Each of the breakout groups had mostly positive comments regarding accounting for all transfers and banking – this was seen as having greater clarity, simplicity, and comprehensiveness, and better reflecting current practice. Because all units are counted in this approach (including those that could be used in future) some participants noted that it provides better visibility for the Global Stocktake process. It was noted that there would be a benefit to the environment if a traded unit never ends up being used, as the host Party in this case does not reclaim the emission reductions if the units are never used. One issue that participants felt needed further discussion was whether banking of units by the host Party should be adjusted for in its NDC accounting, including the case where units are held by companies in (rather than the government of) the host Party.
Comments in relation to the host Party accounting only for units “used” by the other Party were mainly negative: this approach was seen to provide incomplete information, and insufficient transparency for Parties and for the Global Stocktakes. A key concern raised here is that the NDC position of the host Party is dependent on the actions of the acquiring Party (i.e. whether the transferred units are used or banked). This creates risk for the host Party’s NDC position in the current and future NDC periods, as it is unclear when banked units might be used. This was also seen to add administrative complexity, with some participants noting that the host Party would need to check with buyers whether units had been used or not. One participant suggested that the confusion arising from this complexity raised a risk of environmental integrity and potential inadvertent double counting. There was a sense among many participants that the host Party (seller) should not be bound by what the buyer does with ITMOs.
Although not part of the workshop questions, this example also prompted a short discussion about how to account for the emission reductions associated with conservative baselines in a crediting system. In the worked example presented, the extra emission reductions resulting from the crediting

4
system (beyond those that are credited) are captured by the host Party as inventory emission reductions, although participants pointed out that alternative approaches would be possible (e.g. crediting of all reductions, with some units cancelled so the reductions are not captured by either Party). This discussion suggests that a worked-example approach could be useful tool in exploring options for delivering “overall mitigation”.
Finally, some of the breakout groups considered an (optional) question relating to revision of business-as-usual (BAU) baselines within NDC targets that are referenced to BAU. Most participants felt that revision of NDCs is not ideal but manageable as long as methodologies and assumptions for calculating BAU are transparent, though a few felt that revision is not an issue, and others that all NDCs should be fixed for Parties wishing to account for ITMO transfers.
Session 2: Challenges with single-year targets
In this session, participants again worked in small groups and considered four examples (A-D) of ITMO trade across a five-year period. For each example, it was assumed that the Parties had only a single-year NDC target in the fifth year, and that only information from the target year is “counted”.
Example A was a transfer between the two Parties only in the target year, with corresponding adjustment in that year. Views of participants on this simple case were split: many felt that the adjustment is fully corresponding so there is no problem from a strict accounting perspective (i.e. things “add up”). Other participants put forward views based on wider environmental integrity concerns, noting that an adjustment only in the target year ignores the trend in other years, so the target year is not representative of ongoing activity. As such, they did not see the target-year-only accounting as appropriate.
Example B had the same target-year transfers as Example A, but also had transfers in the other years, scaling up linearly toward the target year. More participants were comfortable with this example, as the Parties are involved in steady unit activity over time rather than a one-off in the target year. Some participants noted however a converse concern: as there is only reporting in the target year, the unit activity in other years is missed, giving an unrepresentative picture of overall achievement. One participant expressed a view that although the unit activity in this example happens to be more continuous, it is still not acceptable to account only in the target year because there is no guarantee that activity in other years would be consistent.
In Example C, units purchased across several years are used by the buying Party in the target year. The majority of participants felt that in this case looking at the target-year only was problematic, as the target year provides a misleading snapshot of overall activity, and there is no “corresponding” adjustment by the seller in the target year. Participants also noted that total reported emissions in the target year are lower in this case than the other scenarios due to the mis-match in adjustments between buyer and seller. One suggested solution was to limit accounting to current-year vintages, though other participants noted this would be open to gaming and that the uneven demand for units over time would be difficult for markets to manage.
Example D related to an emissions trading system (ETS) with uneven compliance cycles. Almost all participants saw accounting in the target year only as unrepresentative, and noted the trading across years leads to the adjustments of the two Parties in the target year not being equal. A participant noted that where the ETS is controlled by the government, it would be possible to manage the timing of unit retirement to better match NDC cycles.
5
During the general discussion of the four examples, many participants noted that there would be value in the accounting of ITMOs being cumulative or continuous, in order to ensure that single year targets do not distort the understanding of a Party’s achievement or distort carbon market demand for units. Contrary to this, the reality of Paris Agreement NDCs being nationally determined was also clear, creating the need to manage single-year targets. A number of participants saw a value in the concept of “IMTO-adjusted emissions” as a tracking tool, potentially reported as part of the Article 13 transparency framework.
Session 3: Options for accounting
Session 3 started with a presentation of possible alternatives for dealing with the challenges of single-year accounting explored in session 2: methods to account only in the target year (averaging, linearising) or accounting with carbon budgets. Discussions were held in plenary setting rather than small breakout groups.
There was a considerable discussion on the relative merits (and acceptability to Parties) of approaches that convert single-year targets to a trajectory. For some, this is seen as counter to the Paris Agreement’s nationally-determined framework, and led them towards thinking instead about averaging or linearising approaches to make accounting of ITMOs in the target year more representative. Conversion of all NDCs to carbon budgets was seen as unrealistic, but some felt that there may be a third approach where trajectories are used as an accounting reference only (and the nature of the underlying NDCs is not changed).
A concern was raised that given the bottom-up nature of the Paris Agreement, there could be a trade-off with lower participation in markets if accounting rules do not fit with Parties’ NDCs, many of these being single year.
The examples discussed in Session 3 also highlighted the interplay between environmental integrity broadly and a narrower perspective on whether transfers “add up”. If the narrow perspective (i.e. considering only how each tonne is counted) is taken, mathematically things can add up but that is not necessarily the whole story. Parties may wish to use the accounting framework to achieve outcomes with environmental integrity as well as simply making sure things “add up”.
Some participants noted that this discussion was essentially looking at how to account without AAUs. Looking at adjusted emissions (and agreeing on the need for clear terminology), was seen as a potential alternative to AAU accounting. One delegate emphasised that this is about adjusting one part of reporting and not talking about NDCs, and falls under regular information in Article 13. \
Session 4: Closing discussion
In the closing discussion participants reflected on key takeaways from the day, and issues that would benefit from further exploration. Some of the perspectives raised include:
• One participant noted that the accounting system should be about getting to action: the system will only be useful if easy to understand, so there needs to be capacity to explain the system and not too much complexity, being careful to only regulate what is necessary.
• Another participant reflected that Article 6 has the potential to be a strong investment signal, and minimal guidance could undersell what it could achieve. Rules that provide predictability to private sector markets were seen as important.

6
• The accounting system needs to manage a succession of NDCs, facilitating a long-term transition. This means thinking about how NDCs might progress over subsequent cycles, and also how capacity will be built over time. The function of accounting is both to give certainty and also to build capacity.
• Many developing countries do not yet have detailed NDC implementation plans, and there is a great deal of work ahead to develop such plans. For developed countries that had Kyoto Protocol targets there is institutional memory on accounting; for developing countries without this experience the development and implementation of accounting rules is very challenging.
• Accounting rules need to be feasible given that information will be available at different times (e.g. there is a 2-year delay in inventory emissions data, while information on unit transfers could be available more quickly)
• Best-practice guides (for example on accounting for single-year NDCs targets) could be a useful supplement to more formal accounting rules
• Participants raised a number of issues that were not discussed at the workshop, that some felt warranted future discussion:
o Pre-2020 credits (including CDM transition) o Accounting for ITMOs arising from sectors or activities outside the host’s NDC o Different types of co-operation beyond market-based approaches o Implementing a “share of proceeds” (along the lines of the CDM) o Options for implementing an “overall mitigation in global emissions” (Art 6.4d) o Discounting / cancellations o Trade between multiple Parties o Common timeframes.
Overall, there was some convergence that there is value in cumulative information on ITMO activity, while acknowledging the need to respect the reality of single-year NDCs and the fundamentals of the Paris Agreement. Looking back to the earlier sessions, there had also been a general view that Parties issuing units should account for all transfers, not just units used.
Many participants thanked the IEA for what was seen as a helpful event that made a meaningful contribution to Parties’ understanding of this difficult issue, also noting that it was a good demonstration of why observers are important to the UNFCCC process.

7
Annex – Background Paper

8
Workshop on “Corresponding Adjustment”
as part of Article 6 accounting
Introduction This one-day workshop will explore issues in and options for UNFCCC markets accounting, with a specific focus on how “corresponding adjustment” could be interpreted. While the negotiations process is some distance away from considering this level of detail, it is useful to think ahead on what options exist for accounting under Article 6. The concepts discussed could be relevant to both Article 6.2 and 6.4 negotiations.
The approach taken will be to work through a series of case studies in small groups – in that sense this is a true “workshop”: participants will be doing the work! You are encouraged to read through and think about the case studies and questions ahead of the Workshop. The focus is on thinking through the technical implications, and pros and cons, of all approaches.
These worked examples consider two countries with NDCs under the Paris Agreement, Party A and Party B, which are involved in international trade of ITMOs. In most of these examples units from market mechanisms are traded, however this is not intended to prejudge that this is the only form that ITMOs could take – rather the intention is to start with cases that are likely to arise such as crediting systems and linked emission trading systems.
There are many issues that will NOT be addressed in this workshop:
• Issues of sustainable development benefits or unit quality (baselines, governance, “hot air”) • Whether and how units from pre-2020 should be accounted for • Registry arrangements to ensure robust accounting • ITMOs expressed in units other than tCO2-eq • Quantification of NDCs as a basis for accounting • Cancellation of units associated with climate finance (or as voluntary effort) • ITMOs generated outside NDC boundaries (all examples considered here are for ITMOs from
within NDCs)
The discussion does not assume that only a carbon budget approach will be used for accounting: it will also explore the (sometimes messy) possibilities for accounting only in the target year.
Participants in this workshop are invited in an individual capacity, and discussions will be held under the Chatham House Rule. After the workshop, it is intended to publish a workshop report containing this background paper and a collation of key points raised by participants (in an anonymous format).
This content of this workshop builds on previous work under the OECD-IEA Climate Change Expert Group on accounting and carbon markets.
This workshop is possible thanks to support from Environment and Climate Change Canada.
http://oe.cd/ccxg

9
Workshop on “Corresponding Adjustment”
as part of Article 6 accounting
Agenda
9.00-9.15 Registration
9.15-9.30 Welcome and Introduction to the Workshop
9.30-11.00 Session 1: Basic transfers
• presentation • discussion in small groups • report-backs and discussion
11.00-11.30 Coffee break
11.30 - 13.00 Session 2: ITMO trading across multiple years: concepts and tracking progress
• presentation • discussion in small groups • report-backs and discussion
13.00-14.00 Lunch
14.00-15.30 Session 3: ITMO trading across multiple years: options for accounting
• presentation • discussion in small groups • report-backs and discussion
15.30-16.00 Coffee break
16.00-17.00 Closing discussion: Linkages to Paris decisions and implications for SBSTA accounting guidance
http://oe.cd/ccxg

10
Session 1
Worked Example 1: Direct government to government trade
Background Information
Party A • NDC = fixed-level target 90Mt CO2-eq • Inventory emissions 94Mt CO2-eq
Party B
• NDC = target below BAU (equivalent to 115Mt CO2-eq) • Inventory emissions 109Mt CO2-eq
ITMOs Party B’s inventory emissions are below its NDC target level, so it sells 4Mt CO2-eq of its “surplus” to Party A. The transfer is counted against each Party’s NDC.
Accounting and “Corresponding Adjustment”
Under the Paris Agreement, Parties will need to account for the transfer of mitigation outcomes against their NDCs, so that if one Party claims an emission reduction towards its NDC, then another Party does not. What is “adjusted”? There are two mathematically equivalent approaches:
Emissions Basis: Adjustment could start from inventory emissions, then add/subtract ITMOs to reach an “ITMO-adjusted emissions” level, which can be compared to the NDC target level [Note: the inventory itself is NOT adjusted],
OR
Target Basis: Adjustment could start from the NDC target level, then add/subtract ITMOs to reach an adjusted target level, which can be compared to inventory emissions
The calculation on an emissions basis is shown first. For Party A (the acquiring Party) there is a deduction, and for Party B (the transferring Party) there is an addition. For Party A, the 4Mt purchased exactly covers the gap between inventory emissions and the target level, so Party A meets its target exactly. Party B’s inventory emissions of 109Mt CO2-eq are 6Mt lower than its target of 115Mt CO2-eq, so even after selling 4Mt to Party A it still over-achieves its target by 2Mt.
Adjustments on a target basis are shown next. For Party A there is an addition to its target level, for Party B a subtraction from its target level. Inventory emissions are compared to adjusted target level.

11
Figure 1. Adjustments made starting from inventory emissions. There is a deduction from inventory emissions for the acquiring Party and an addition for the transferring Party.
Figure 2. Adjustments made starting from NDC target levels. There is an addition to the target level for the acquiring Party and a deduction for the transferring Party.

12
Questions for Discussion:
• What information in relation to emissions, the NDC, and ITMOs would need to be reported
to be able to undertake this accounting? When would this information be available?
• What are the consequences for accounting if NDC targets are revised?
• Do countries need to adopt the same approach consistently?
13
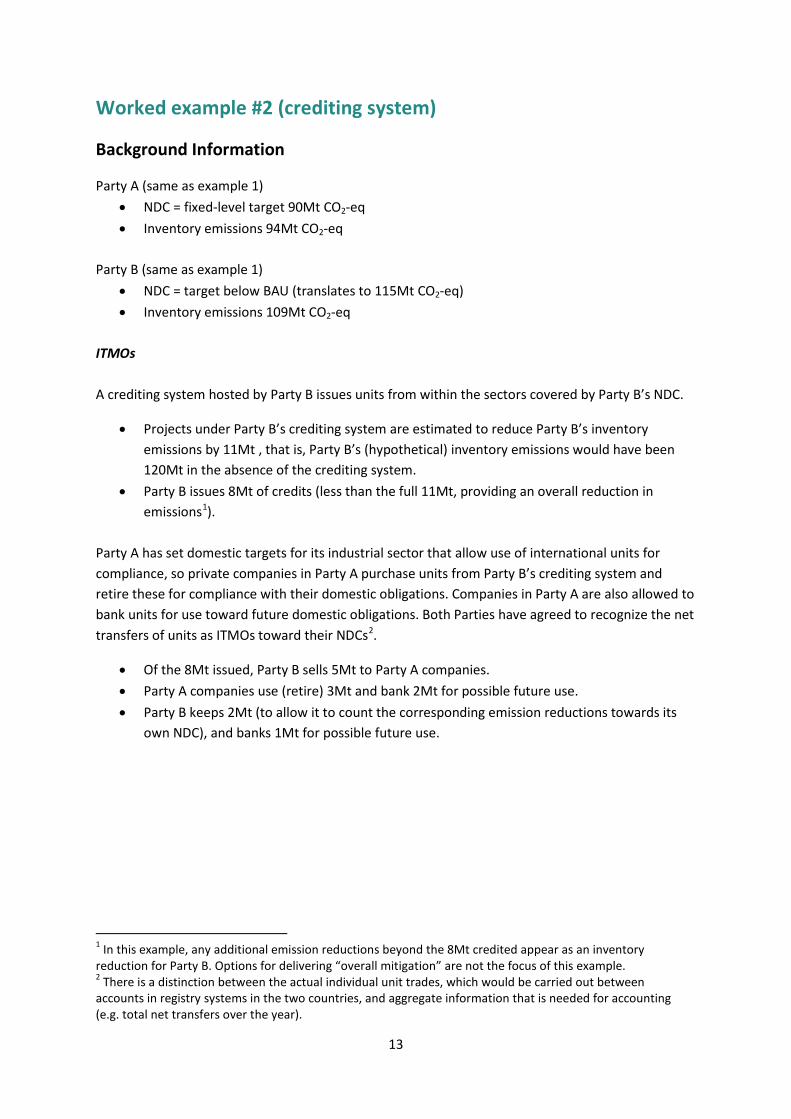
Worked example #2 (crediting system)
Background Information
Party A (same as example 1) • NDC = fixed-level target 90Mt CO2-eq • Inventory emissions 94Mt CO2-eq
Party B (same as example 1)
• NDC = target below BAU (translates to 115Mt CO2-eq) • Inventory emissions 109Mt CO2-eq
ITMOs A crediting system hosted by Party B issues units from within the sectors covered by Party B’s NDC.
• Projects under Party B’s crediting system are estimated to reduce Party B’s inventory emissions by 11Mt , that is, Party B’s (hypothetical) inventory emissions would have been 120Mt in the absence of the crediting system.
• Party B issues 8Mt of credits (less than the full 11Mt, providing an overall reduction in emissions1).
Party A has set domestic targets for its industrial sector that allow use of international units for compliance, so private companies in Party A purchase units from Party B’s crediting system and retire these for compliance with their domestic obligations. Companies in Party A are also allowed to bank units for use toward future domestic obligations. Both Parties have agreed to recognize the net transfers of units as ITMOs toward their NDCs2.
• Of the 8Mt issued, Party B sells 5Mt to Party A companies. • Party A companies use (retire) 3Mt and bank 2Mt for possible future use. • Party B keeps 2Mt (to allow it to count the corresponding emission reductions towards its
own NDC), and banks 1Mt for possible future use.
1 In this example, any additional emission reductions beyond the 8Mt credited appear as an inventory reduction for Party B. Options for delivering “overall mitigation” are not the focus of this example. 2 There is a distinction between the actual individual unit trades, which would be carried out between accounts in registry systems in the two countries, and aggregate information that is needed for accounting (e.g. total net transfers over the year).

14
Figure 3. Party B’s crediting system results in an estimated 11Mt of emission reductions, and 8Mt of unit issuances. Some of these units are sold to companies in Party A.
“Corresponding Adjustment”
In this example, Party A would count towards its NDC the 3MT of units that its companies use (retire). However as the gap between Party A’s inventory emissions and its target level is 4Mt, so it will miss its NDC target level by 1MT if it does not acquire units from another source (Figure 4). Figure 4. Party A’s ITMO-adjusted emissions compared to the NDC target level (Adjustment in emissions basis, i.e. starting from inventory emissions)

15
For Party B it is less intuitively obvious what to add/subtract. Party B has benefited from 11Mt of inventory emission reductions associated with projects under the crediting mechanism – which of these should it be allowed to count towards its current NDC? If credits (and the emission reductions they represent) are acquired by Party A, then Party B
doesn’t have these reductions available any more to count toward its NDC.
Similarly, if Party B banks units (representing reductions) into a future time period, they would no longer available for use by Party B as part of the current NDC period.
This implies that Party B should adjust for units transferred to Party A (some of which are used/retired and some of which are banked) and units banked by Party B3 4:
ITMO-adjusted emissions = inventory emissions + transfers + banking
Figure 5. Party B’s ITMO-adjusted emissions compared to the NDC target level (Adjustment in emissions basis)
In the current example, Party B’s ITMO-adjusted emissions = 109 + 5 + 1 = 115Mt, so in this example Party B happens to meet its target exactly. Does this same logic work for Party A? Party A’s net transfers would be -5Mt (as units are transferred in rather than out), and its banking is 2Mt: the difference between these is precisely the 3Mt units “used”. This approach of counting units transferred and banked is equivalent to deducting the units “used” that was shown in Figure 4.
3 If any units are cancelled, these may also need to be adjusted for. For simplicity, this is not included here. 4 The formulation that is shown counts net transfers between Parties A and B. There is another approach that relabels individual units as “international units” when they are first transferred, and then the creation and retirement of these “international units” is accounted for.

16
Alternative Framing:
Note that ITMO-adjusted emissions can be expressed in a fully mathematically equivalent way as
ITMO-adjusted emissions = inventory emissions + units issued – units used
i.e. for the current example
• Party A issues no units and retires 3Mt, so the result for ITMO-adjusted emissions is 94+0-3=91Mt, and Party A misses its target by 1Mt
• Party B issues 8Mt and uses (keeps) 2Mt of units towards its own NDC, the result for ITMO-adjusted emissions is 109+8-2 = 115Mt, and Party B meets its target exactly.
This is equivalent to counting transfers and banking, because the difference between number of units issued and those used is equal to those that are either transferred or banked.
A further question to consider is whether Party B’s adjustment should depend on what Party A companies choose to do with the units they have purchased.
• The approach taken so far assumes that units transferred or banked will eventually be used, so emission reductions should not be also counted by Party B for its current NDC. If some of the transferred or banked units are never used, this would result in a benefit to the atmosphere.
• Another approach would be to not assume that banked units will necessarily be used against an NDC in the future period, so Party B would adjust only for units “used” by Party A in the current period. In this case, the adjustment would need to be done in the future NDC period, as and when the units are used towards an NDC (though at cost of significant uncertainty, as described below).
Figure 5. Party B’s ITMO-adjusted emissions compared to the NDC target level if ONLY units “used” by Party A are accounted for
Going back to the example, if Party B only accounts for the 3MT that are used by Party A, it now seems to over-achieve its target by 3MT. This is essentially because 3MT of units that have been banked have not resulted in an adjustment in the current period.
Party B has less control over its NDC achievement, because Party A companies decide whether to use the units they purchased, and Party B has to adjust based on those decisions.
If the banked units ARE used in later time periods, Party B would need to adjust for them at that time. As Party B cannot predict when or what quantity of units Party A companies might use in the future, this creates added uncertainty for Party B’s ability to manage future NDC targets.

17
Questions for discussion:
• What are the pros and cons of Parties adjusting for
o All units transferred and banked? o Only units “used” by another Party?
• Do the adjustments need to be completely symmetrical to be considered “corresponding”?
• Party B’s emissions would have been 120Mt (5Mt above its target) if it had not
implemented its crediting system. Should a Party issue units when its inventory emissions are above its NDC target level?

18
Session 2
ITMO trading across multiple years: Concepts
Many Parties have NDCs for a single year (e.g. 2025 or 2030). Given the uncertainty of the pathways that emissions could follow up to this target year, there is uncertainty in the total emissions that would be released into the atmosphere between the start of the period and the end of the target year. This uncertainty can be exacerbated if Parties use ITMOs.
For Parties that are net exporters of ITMOs, a concern could be that transfers are lower in the target year than in the other years, which would give an impression of better achievement in the target year than in surrounding years. For net buyers, if ITMOs are used only in the target year, then again the target year position looks better than surrounding years.
This session will explore the complications arising across time when Parties are involved in transfer of mitigation outcomes while they have a single-year NDC target, .and the next (Session 3) will explore solutions.
Background information
In all the examples in this Session, Party A and Party B have single-year NDC targets at the end of a five-year period (Year 5). Party A’s target is 90Mt and Party B’s target is 115Mt (as a reduction against BAU). Year 5 (the target year) is the same as the previous example explored in Session 1.
A time series of the two Parties’ inventory emissions is show below. • Both Parties have 100Mt inventory emissions the reference year (Year 0). • Party A’s inventory emissions (in blue) are above its target level in year 5, finishing at 94Mt • Party B’s inventory emissions (in red) are below its target level in year 5, finishing at 109Mt
90
95
100
105
110
115
Year 0 Year 1 Year 2 Year 3 Year 4 Year 5
Party BInventoryemissionsParty Ainventoryemissions lineartrajectoryto target
Party B target
Party A target

19
Transfers with single-year targets: 4 examples
The four examples below are presented to illustrate some of the challenges that could arise from use of units across multiple years.
Example A
This example is the same as the first considered in Session 1: a government-to-government trade of 4Mt of NDC “surplus” from Party B to Party A in Year 5. Looking in the target year (Year 5) only, Party A appears to meet its target exactly, and Party B over-achieves its target by 2Mt. The red and green arrows in the figure represent the adjustments made by Party A and Party B.
90
95
100
105
110
115
Year 0 Year 1 Year 2 Year 3 Year 4 Year 5
Party BInventoryemissionsParty Ainventoryemissions lineartrajectoryto targetParty Alineartrajectory
Party B target
Party A target
4Mt

20
Example B
In this example units from a crediting system in Party B are traded. The Party A government purchases and uses units from the Party B crediting system on an annual basis, starting in Year 1 at 0.8Mt and scaling up linearly to reach 4Mt transferred and used in Year 5.
90
95
100
105
110
115
Year 0 Year 1 Year 2 Year 3 Year 4 Year 5
Party BInventoryemissions
Party Ainventoryemissions
lineartrajectoryto target
Party Alineartrajectory
Party B target
Party A target
4Mt
3.2Mt
2.4Mt
1.6Mt 0.8Mt

21
Example C
Party A has an emission trading system (ETS) covering its whole economy. Units from Party B’s crediting system are purchased by companies in Party A’s ETS.
Party B transfers 1Mt each year from its crediting system to Party A companies from Year 1 to Year 4. There are no transfers in Year 5. Party A companies use all the 4Mt of units in Year 5.
90
95
100
105
110
115
Year 0 Year 1 Year 2 Year 3 Year 4 Year 5
Party BInventoryemissionsParty Ainventoryemissions lineartrajectoryto targetParty Alineartrajectory
Party B target
Party A target

22
Example D
Party A and Party B have linked ETS systems, trading allowances that are used for compliance across both ETSs.
• Party B’s ETS covers around half of its emissions, and has annual compliance obligations. • Party A’s ETS covers its whole economy, and has 3-year compliance cycles. Party A
companies are only required to retire allowances for a portion of their emissions in the first two years of each compliance period, then must submit remaining allowances in the 3rd year. In this example Year 3 is an ETS compliance year (Year 6 would be the next one).
There is a net transfer of 2Mt each year from Party B’s ETS to Party A’s ETS (shown in red).
After the adjustment shown in Year 5, Party A’s ITMO-adjusted emissions are above its target level. This is because Year 5 is not an ETS compliance year (and therefore fewer units are used). If Year 5 of the NDC cycle did fall on an ETS compliance year, Party A would instead appear to overachieve its NDC due to the additional units retired in that year.
90
95
100
105
110
115
Year 0 Year 1 Year 2 Year 3 Year 4 Year 5
Party BInventoryemissions
Party Ainventoryemissions
lineartrajectoryto target
Party B target
Party A target

23
Tracking progress toward NDC targets
Parties will report on progress toward their NDC every two years. There will therefore need to be a way to provide a snapshot on progress for those Parties that are involved in multi-year cooperative approaches that involve transfer and use of ITMOs, even if their NDC target is only for a single year.
Suppose that there is a progress report covering the information for Years 1 and 2, and the next progress report also covers information for Years 3 and 4. In this example, looking at inventory emissions alone would give the impression that Party A (blue) is not on track toward its target, while Party B (red) is likely to significantly over-achieve.
1st Report 2nd Report
To provide a snapshot of how emissions are trending after taking into account ITMO activity, “ITMO-adjusted emissions” could be calculated for each year. The “ITMO-adjusted emissions” quantity is used here as a tracking tool: this is NOT the same as accounting for the NDC (The NDC target is for year 5 only; the next session of this workshop will consider options for accounting for the NDC). As a tracking tool, ITMO-adjusted emissions could be a useful way to demonstrate progress toward the NDC target.
In addition to the “snapshot” provided by ITMO-adjusted emissions, Parties may also be in the position to estimate inventory emissions and ITMO activity for future years up to the target year. If so, these estimates could be used (along with the agreed accounting rules) to provide a forward-looking estimate of target-year performance.
Example: calculation of ITMO-adjusted emissions
In this example, Party A and Party B have linked ETS systems (each with annual compliance obligations), and a crediting system in Party B provides credits to both ETSs. No credits are kept by Party B’s government. The Figure below shows credit unit flows (orange) and ETS allowance flows (white). Further details are included as an Annex, but are not needed for this discussion. This example will be revisited in Session 3.
90
95
100
105
110
115
Year 0 Year 1 Year 2 Year 3 Year 4 Year 590
95
100
105
110
115
Year 0 Year 1 Year 2 Year 3 Year 4 Year 5

24
As discussed in Session 1, ITMO-adjusted emissions can be calculated as:
ITMO-adjusted emissions = inventory emissions + transfers + banking5
In the current example, ETS units from Party A and Party B’s ETS systems as well as crediting units can be traded internationally and counted toward NDCs by another Party, so are all included in the calculation of ITMO-adjusted emissions, shown in the Figure below.
1st Report (transfers and banking) 2nd Report transfers and banking)
For Party B, the ITMO-adjusted emissions level (red dashed line) is very slightly higher than a trend line towards its Year 5 target level. This suggests that if inventory emissions trends and ITMO use continue in a similar manner for the rest of the period, Party B will be close to its target but might miss it by a small amount.
For Party A, ITMO-adjusted emissions (blue dashed line) are exactly on track towards its target: this is because the economy-wide annual ETS cap enforces this emissions trajectory once unit use is taken into account.
5 Or equivalently, ITMO-adjusted emissions = inventory emissions + issuances - retirements
90
95
100
105
110
115
Year 0 Year 1 Year 2 Year 3 Year 4 Year 590
95
100
105
110
115
Year 0 Year 1 Year 2 Year 3 Year 4 Year 5

25
Adjusting only for units that are “used” by the other Party
As was discussed in Session 1, if only units “used” by the other Party are accounted for, then Parties’ results appear better in the current NDC period: this is because they have benefited from the inventory emission reductions associated with the unit or allowance creation, but have not made an adjustment in the current period for the corresponding units. If the banked units are used in later time periods, Parties would have to adjust for them at that time, potentially causing challenges for meeting future targets.
The figures below show the outcome in this example if the Parties were to only adjust for their units “used” by the other Party. In the example there is a significant balance of units that are banked (and therefore not adjusted for in the current NDC period), so the performance of both Parties looks better in the current period.
1st Report (“used” units only) 2nd Report (“used” units only)
Tracking progress for carbon-budget type targets
If Parties were to convert their single-year NDCs into a carbon budget over the full period of five years, this would significantly simplify tracking: Inventory emissions and unit activity to date could be compared to the carbon budget – leaving a “balance” left for the remaining year(s) which could be compared to expected inventory emissions and unit activity.
90
95
100
105
110
115
Year 0 Year 1 Year 2 Year 3 Year 4 Year 590
95
100
105
110
115
Year 0 Year 1 Year 2 Year 3 Year 4 Year 5

26
Challenges with single-year NDC targets:
• For each Example A-D, is it robust in each case to count only the unit transfers from the target year? Why or why not?
• Parties with Kyoto Protocol targets designed their domestic market mechanisms to align with KP obligations. In the new context of the Paris Agreement, is it likely that Parties will amend their domestic ETS systems to match the timeframes of Paris Agreement NDC cycles, or will the Paris Agreement accounting system need to cope with domestic trading that is mis-matched with NDC cycles?
Tracking Progress toward NDC targets:
• What type of forward estimates of unit activity might Parties be able to provide (to help track progress toward the NDC in the target year)?
• If adjustments were made on a target basis (starting from the NDC target) rather than an emissions basis (starting from inventory emissions), how could progress be tracked in years before the target year?
• For Parties with linked ETS systems that are exporting allowances that can be used toward other Parties’ NDCs, is it more feasible to report:
o Net international transfers and net banking of ETS allowances, or o Issuances and retirements of ETS allowances?

27
Session 3
Options for accounting
Session 2 considered some of the challenges of combining single-year targets with ITMO trade, and also looked at tracking progress toward the NDC target. This Session will look at options for accounting at the end of the period (i.e. for the target year if a single-year NDC, or across the period if a carbon budget) that go beyond using the target-year information only.
This session will explore
1. Options for accounting in the target year only, but making ITMO accounting more “representative” of ongoing trends.
o Using a simple multi-year average o Using a more complex averaging to “linearise” ITMO activity over time
2. Accounting by introducing a budget for allowed emissions (a “carbon budget”)
across the five-year period
Accounting only in the target year
Using a multi-year average of ITMO activity in the target year instead of actual target-year values
To make the unit activity reported in the target year more representative of ongoing trends, an average over several years’ ITMO activity could be calculated.
Returning to examples A-D of the previous session and using a simple average over the final two years, Year 4 and 5:
In Example A from the previous section, the average ITMO activity across the final two years is 2Mt (0Mt in Year 4, and 4Mt in Year 5), so Party A and Party B would each adjust by 2Mt instead of 4Mt in the target year.
If Party A wished to count 4Mt in the target year, it would have to purchase and retire an additional 4Mt for Year 4, as the 2-year average would then be 4Mt.
The length of averaging chosen will strongly affect the outcome.

28
In Example B, the average unit activity over the final two years is ½(3.2+4)=3.6Mt, so Party A and Party B would each adjust by 3.6Mt instead of 4Mt in the target year.
If Party A wished to count 4Mt in the target year, it would have to purchase and retire another 0.8Mt for Year 4, so that the 2-year average for ITMOs would be 4Mt.
In Example C, Party A’s average unit activity over the final two years is 2Mt (0Mt in Year 4, 4Mt in year 5), so it would adjust by 2Mt in the target year.
Party B’s average unit activity over the final two years is 0.5Mt (1Mt in Year 4, 0Mt in Year 5), so it would adjust by 0.5Mt in the target year.
In Example D, Party B’s two-year average unit activity is 2Mt, so Party B would adjust by 2Mt in the target year. Because Party A’s unit activity is steady, the time period for averaging does not matter.
For Party A, a two-year average would clearly not give a representative picture, given the three-year ETS compliance cycle. A three-year average could however be useful to help smooth over the cyclical effects.

29
Mapping ITMO activity onto a linear path
If ITMO activity has not been steady but is instead scaling up or down, a simple average may not be a fair representation in the target year, and instead unit activity could be mapped to a linear path6.
In Example A from the previous section, Party A used 4Mt in Year 5 only (light green arrow on the left). In this “linearising” approach, the 4Mt are spread across a linear trajectory scaling up over time (the dark green arrows). In the target year, Party A would adjust for the “linearized” Year 5 value of 1.3Mt. Party B’s 4Mt of transfers would similarly be mapped onto a linear path, so Party B would also adjust by 1.3Mt (instead of 4Mt) in Year 5.
Still in Example A, if Party A wished to adjust by 4Mt in Year 5, it would need to purchase and use additional ITMOs so that there is a linear scale-up across the five years. It would need an additional 0.8+1.6+2.4+3.2=8Mt to create a linear scale up in Year 1 to Year 4.
In Example B, the unit use already scales up linearly, so no additional unit purchases would be needed. Party A and B would each adjust by 4Mt in the target year.
In Example C, there was a concern that Party B transferred units in Year 1 to Year 4, but not in the target year. If the unit activity is linearized, then the transfers scale up smoothly and would be counted at 1.3Mt (instead of zero) in the target year.
6 See “Single-year mitigation targets: Uncharted territory for emissions trading and unit transfers”, M. Lazarus, A. Kollmuss and L. Schneider, Stockholm Environment Institute Working Paper 2014-01

30
Carbon budget accounting
Carbon budget accounting will be explored with a more realistic example (the details of which are outlined in the Annex). The two Year 5 single-year targets are converted to emissions budgets (“carbon budgets”) using a linearly increasing (for Party B) or decreasing (For Party A) target trajectory from the base year to the target year. The emissions budget is the sum of the emissions under this linear trajectory over the five years.
ITMO-adjusted emissions for this example across the five years are shown below.
• Party A’s ITMO-adjusted emissions equals the target linear trajectory exactly each year, because its economy-wide ETS enforces this cap. Its total emissions over the five years therefore exactly equal the emissions budget.
• Party B’s ITMO-adjusted emissions are 1MT over the linear target trajectory in Year 1 and Year 3, and 1Mt under in Year 4 and Year 5 (orange arrows). Summing these across the five year period, in this example Party B therefore precisely meets its target emissions budget. It makes less sense to talk about the emissions level in the target year, as the target is across the five years.
Note that conversion of a single-year target to a carbon budget would not solve the challenge of a mis-matched ETS compliance cycle shown in Example D in the previous Session: for this, averaging would be needed in addition to the carbon budget, or else the domestic ETS would need to be modified to align it to the NDC cycle.
90
95
100
105
110
115
Year 0 Year 1 Year 2 Year 3 Year 4 Year 5
Party BITMO-adjustedemissionsParty BInventoryemissions
Party Ainventoryemissions
Party AITMO-AdjustedEmissionslineartrajectory totarget
31
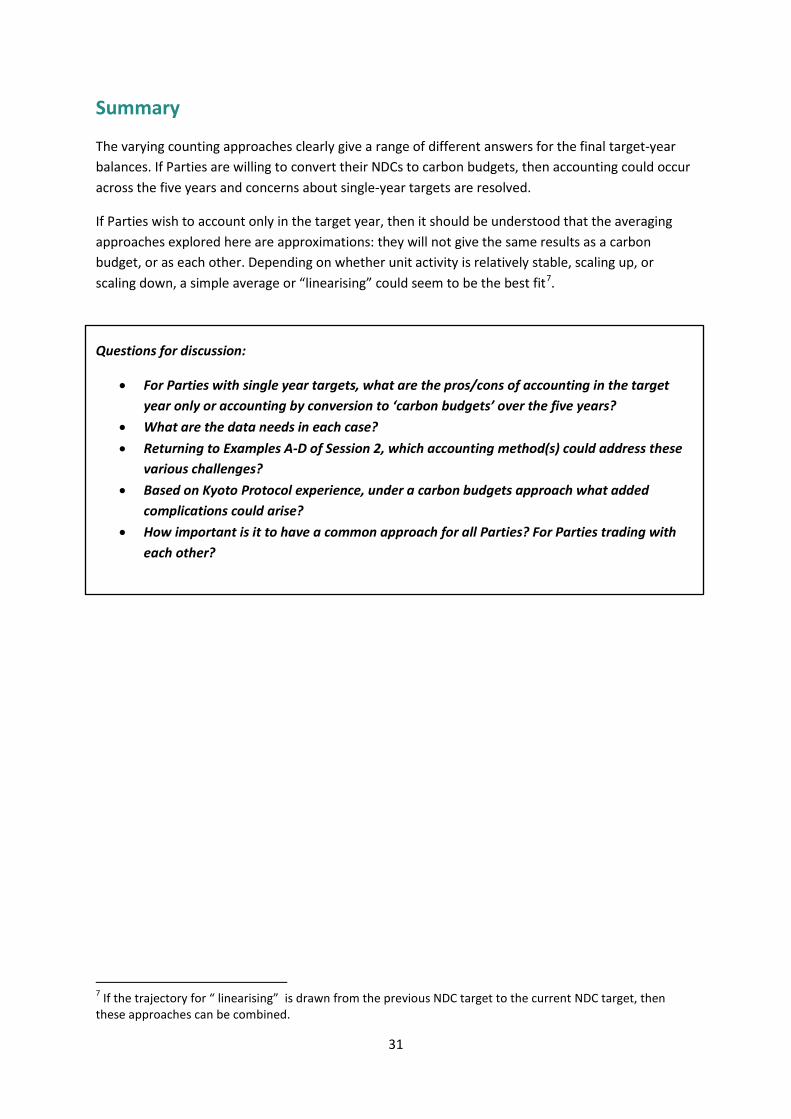
Summary
The varying counting approaches clearly give a range of different answers for the final target-year balances. If Parties are willing to convert their NDCs to carbon budgets, then accounting could occur across the five years and concerns about single-year targets are resolved.
If Parties wish to account only in the target year, then it should be understood that the averaging approaches explored here are approximations: they will not give the same results as a carbon budget, or as each other. Depending on whether unit activity is relatively stable, scaling up, or scaling down, a simple average or “linearising” could seem to be the best fit7.
Questions for discussion:
• For Parties with single year targets, what are the pros/cons of accounting in the target year only or accounting by conversion to ‘carbon budgets’ over the five years?
• What are the data needs in each case? • Returning to Examples A-D of Session 2, which accounting method(s) could address these
various challenges? • Based on Kyoto Protocol experience, under a carbon budgets approach what added
complications could arise? • How important is it to have a common approach for all Parties? For Parties trading with
each other?
7 If the trajectory for “ linearising” is drawn from the previous NDC target to the current NDC target, then these approaches can be combined.

32
Session 4
Closing Discussion: Linkages to Paris decisions and implications for SBSTA accounting guidance
Questions for discussion:
• Does the language of the Paris Agreement and Decisions constrain the accounting options that could be considered?
• In the context of the range of examples examined, what does it mean for adjustment to be “corresponding”?
• How do Parties’ views of the fundamental nature of NDCs (are they milestones/check-points, or budgets to be met precisely) affect the way they might approach accounting?
• Given many NDCs target years are not until 2030, how much weight should be given to the accounting approaches that facilitate tracking progress towards NDCs vs accounting at the end of the period?
• What other issues would you like to raise?

33
ANNEX – Detailed example of linked ETS and crediting systems NDCs:
• Party A NDC = fixed-level single-year target 90Mt • Party B NDC = single-year target below BAU (translates to 115Mt)
Inventory emissions: In the base year (Year 0), Party A and Party B both have inventory emissions of 100Mt. Party A’s inventory emissions fall to 94Mt by the target year, and Party B’s inventory emissions rise to 109Mt. ITMOs: The two Parties begin linked Emissions Trading Systems (ETS) in Year 1, covering 100% of Party A’s emissions and 50% of Party B’s emissions. Party A has a linearly declining annual ETS cap towards its 90Mt target in Year 5. Party B’s ETS has a flat cap of 50Mt for the covered sectors. Both ETS systems have annual compliance obligations. A crediting system also operates in Party B, in sectors not covered by the ETS (but still within the NDC). Companies in Party A and Party B can use the credits toward their ETS obligations. Inventory emissions in both Parties’ ETS sectors are higher than their respective ETS caps so both will use some credits for ETS compliance. The Party B government sells all credits that are generated, (they are banked by companies in Party A and in Party B rather than Party B’s government).
There is steady trade of both ETS and crediting units between Party A and Party B, with only NET transfers over each year considered here.
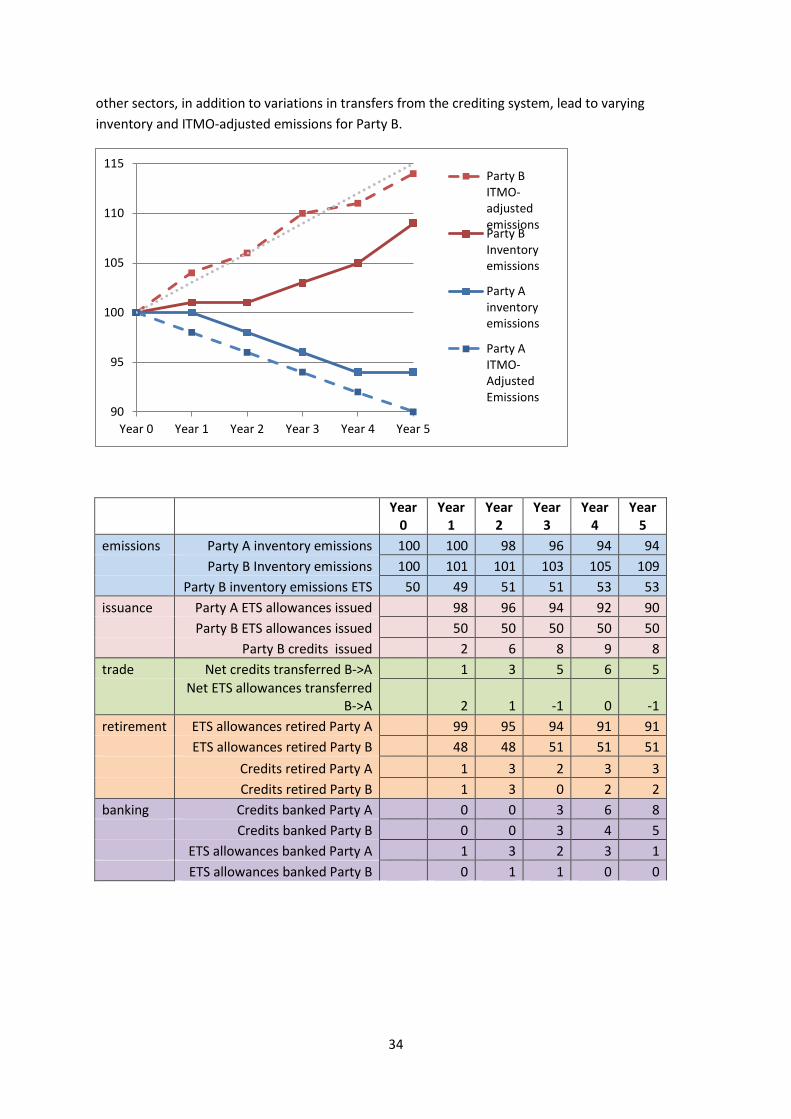
Taking into account the trades and unit use in this example, ITMO-adjusted emissions are as shown in the Figure below. Party A’s ITMO-adjusted emissions track its ETS cap exactly (because the ETS is economy-wide). Only half of Party A’s emissions are covered by its ETS, so variations in emissions in
34
other sectors, in addition to variations in transfers from the crediting system, lead to varying inventory and ITMO-adjusted emissions for Party B.
Year
0 Year
1 Year
2 Year
3 Year
4 Year
5 emissions Party A inventory emissions 100 100 98 96 94 94 Party B Inventory emissions 100 101 101 103 105 109 Party B inventory emissions ETS 50 49 51 51 53 53 issuance Party A ETS allowances issued 98 96 94 92 90 Party B ETS allowances issued 50 50 50 50 50 Party B credits issued 2 6 8 9 8 trade Net credits transferred B->A 1 3 5 6 5
Net ETS allowances transferred
B->A 2 1 -1 0 -1 retirement ETS allowances retired Party A 99 95 94 91 91
ETS allowances retired Party B 48 48 51 51 51 Credits retired Party A 1 3 2 3 3 Credits retired Party B 1 3 0 2 2 banking Credits banked Party A 0 0 3 6 8 Credits banked Party B 0 0 3 4 5
ETS allowances banked Party A 1 3 2 3 1 ETS allowances banked Party B 0 1 1 0 0
90
95
100
105
110
115
Year 0 Year 1 Year 2 Year 3 Year 4 Year 5
Party BITMO-adjustedemissionsParty BInventoryemissions
Party Ainventoryemissions
Party AITMO-AdjustedEmissions

35
Accounting results:
• Considering the target year only o Party A meets its target exactly in the target year. o Party B over-achieves its target by 1Mt in the target year.
• Using a two-year average of unit activity
o Party A’s two year average of ITMO activity (the difference between inventory and ITMO-adjusted emissions) is 3Mt, so its target year position is 94-3=91Mt, missing its target by 1Mt
o Party B’s two year average is 5.5Mt, so its target year position is 109+5.5=114.5Mt, overachieving its target by 0.5Mt.
This is sensitive to the timeframe chosen: with a three-year average Party B would meet its target exactly rather than over-achieve.
• Linearising unit activity o Party A’s total ITMO activity of 12Mt is mapped to scale up 0.8, 1.6, 2.4, 3.2, 4 Mt. In
this case, Party A would adjust by 4Mt in the target year so meets its target exactly. o Party B’s total ITMO activity of 26Mt is mapped to scale up 1.7, 3.5, 5.2, 6.9, 8.7 Mt.
Party B would adjust by 8.7Mt in the target year, so its position would be 109+8.7=117.7Mt, missing its target by 2.7Mt.
• Under a carbon budget across the five years
o Party A meets its target exactly (because its ETS cap enforces annual targets in line with the five-year emissions budget)
o Party B is 1Mt over the target level in Year 1 and Year 3, 1Mt under in Year 4 and Year 5. Summing across the period, Party B meets its emissions budget exactly.