Workshop Report on Eutrophication Modelling
69
2nd OSPAR Workshop on Eutrophication Modelling 10-12 September 2007 OSPAR WORKSHOP ON EUTROPHICATION MODELLING Workshop Report Disclaimer This document presents the outcome of a workshop held within the auspices of the OSPAR Commission. Caution should be exercised when using this report since the views expressed represent those of the workshop participants and may not necessarily reflect the formal views of the OSPAR Commission or the views of the individual Contracting Parties. Agenda Item 1 - Opening, Welcome and Adoption of theAgenda ........................................................................ 2 Agenda Item 2 - Introduction to the Workshop .......................................................................................................... 2 Agenda Item 3 - National Presentations on Model Applications .............................................................................. 3 3.1 Introduction ................................................................................................................................................... 3 3.2 National presentations of model applications .......................................................................................... 3 3.3 Discussion and conclusions ....................................................................................................................... 10 Agenda Item 4 - Transboundary nutrient transport ................................................................................................. 11 4.1 Introduction ................................................................................................................................................ 11 4.2 Presentations ............................................................................................................................................. 12 4.3 Discussion and conclusions ..................................................................................................................... 14 Agenda Item 5 - Report of the Workshop .................................................................................................................. 17 Annex 1 List of Participants .................................................................................................................................... 18 Annex 2 Annotated Agenda and Time Table ......................................................................................................... 21 Annex 3 Terms of reference for an OSPAR workshop oneutrophication modelling ....................................... 25 Annex 4 Draft assessment of the predicted environmentalconsequencesfor problem areas following nutrient reductions ....................................................................................................................................... 29 Annex 5 Draft Work Programme for Calculating Transboundary Nutrient Transport in the North Sea and Adjacent Sea Areas ...................................................................................................................................... 63 Workshop Report 1
Transcript of Workshop Report on Eutrophication Modelling

2nd OSPAR Workshop on Eutrophication Modelling 10-12 September 2007
OSPAR WORKSHOP ON EUTROPHICATION MODELLING
Workshop Report
DisclaimerThis document presents the outcome o f a workshop held within the auspices o f the OSPAR Commission. Caution should be exercised when using this report since the views expressed
represent those o f the workshop participants and may not necessarily reflect the formal views of the OSPAR Commission or the views o f the individual Contracting Parties.
Agenda Item 1 - Opening, Welcome and Adoption o f the Agenda........................................................................ 2Agenda Item 2 - Introduction to the W orkshop.......................................................................................................... 2Agenda Item 3 - National Presentations on Model Applications..............................................................................3
3.1 Introduction................................................................................................................................................... 33.2 National presentations o f model applications..........................................................................................33.3 Discussion and conclusions....................................................................................................................... 10
Agenda Item 4 - Transboundary nutrient transport................................................................................................. 114.1 Introduction................................................................................................................................................ 114.2 Presentations............................................................................................................................................. 124.3 Discussion and conclusions..................................................................................................................... 14
Agenda Item 5 - Report o f the W orkshop.................................................................................................................. 17
Annex 1 List o f Participants.................................................................................................................................... 18Annex 2 Annotated Agenda and Time Table.........................................................................................................21Annex 3 Terms of reference for an OSPAR workshop on eutrophication modelling....................................... 25Annex 4 Draft assessment of the predicted environmental consequences for problem areas following
nutrient reductions....................................................................................................................................... 29Annex 5 Draft Work Programme for Calculating Transboundary Nutrient Transport in the North Sea and
Adjacent Sea Areas......................................................................................................................................63
Workshop Report
1

2nd OSPAR Workshop on Eutrophication Modelling 10-12 September 2007
Workshop Report on Eutrophication Modelling
Agenda Item 1 - Opening, Welcome and Adoption of the Agenda1.1 The OSPAR Workshop on Eutrophication Modelling was held at the Cefas Laboratories at Lowestoft (UK) on 10 - 13 September 2007, at the kind invitation o f the Centre for Environment, fisheries & Aquaculture Science (Cefas), an agency o f the UK Government's Department for Environment, Food and Rural Affairs (DEFRA). Dr Bill Camplin, the head o f the Cefas Ecosystem Interaction Group welcomed the participants to the laboratories at Lowestoft which are one o f currently three laboratory sites o f Cefas. He highlighted the importance o f the workshop's work, especially on transboundary nutrient fluxes, to provide the necessary scientific basis for policy and legal discussion relating to eutrophication (e.g. under the Urban Waste W ater Treatment Directive). He also pointed to changes in the field o f marine science and that the workshop showed that this discipline is well alive. He wished the workshop luck in their work and looked forward to an opportunity to welcome participants back to a new Cefas building in the centre o f Lowestoft which is envisaged to be ready by 2010.
1.2 The workshop was chaired by Dr David Mills (United Kingdom) and was attended by representatives from the following seven Contracting Parties: Belgium, France, Germany, the Netherlands, Norway, Portugal and the United Kingdom. A list o f participants is at Annex 1.
1.3 The chairman welcomed the participants to the meeting and whished the meeting good discussions and fruitful results.
1.4 The draft agenda for the meeting (ICG-EMO 05/1/1) was adopted without amendment. The agenda of the meeting is at Annex 2.
Agenda Item 2 - Introduction to the Workshop2.1 The workshop noted its terms o f reference at Annex 3 as agreed by EUC(l) 2006.
2.2 The chairman Dr David Mills (UK) set the scene for the workshop (click here for the presentation).He recalled the role o f the Intersessional Correspondence Group on Eutrophication Modelling (ICG-EMO), the background to the ICG-EMO work, the various activities with which the ICG-EMO and the workshop had been tasked by the OSPAR Eutrophication Committee (EUC), and the requirements for reporting the results to OSPAR. The objective o f the workshop was to contribute to the work under the OSPAR Joint Assessment and Monitoring Programme on:
a. an assessment o f the expected eutrophication status o f the OSPAR maritime area following the implementation o f agreed measures (JAMP product EA-5), addressed under agenda item 3;
b. an overview of predictive models for eutrophication assessment and nutrient reduction scenarios, including transboundary nutrient fluxes within the OSPAR area and o f the possibilities o f adopting relevant models for use by OSPAR Contracting Parties (JAMP product ET-7). The use o f models to calculate transboundary nutrient fluxes in an assessment context is addressed under agenda item 4.
2.3 On JAMP product EA-5 and nutrient reduction scenarios, the chairman recalled the results o f the 2005 workshop on eutrophication modelling held in Hamburg (Germany) in September 2005. The workshop report and presentations o f that workshop are available on the Cefas website http ://www.cefas ,co .uk/eutmod. The chairman highlighted that the main conclusions from that workshop remained still valid but that a number o f uncertainties identified by that workshop needed to be addressed to build confidence in the model results. This was partly achieved through intersessional work in preparation o f this 2007 workshop, compiling the forcing and validation data necessary for consistent model applications. This involved a considerable effort and resource restrictions had to be recognised.
2.4 On JAMP product EA-7, the main task o f the workshop was to set up a detailed Work Programme that allows to progress work on transboundary nutrient transport with a view to delivering calculations for their use in an eutrophication assessment context.
2
Workshop Report

2nd OSPAR Workshop on Eutrophication Modelling 10-12 September 2007
Agenda Item 3 - National Presentations on Model Applications
3.1 Introduction3.1 Dr Hermann Lenhart (Germany) gave an introduction to the specifications for the work on nutrient reduction scenarios carried out for this workshop (click here for the presentation). The specification of methods and data to be used in the model applications by participants had been prepared by the organising group in form of a User Guide, and data compilations, including a Data Description. He highlighted that within the conceptual approach to the workshop specifications, it had been necessary to strike a balance between the need to achieve comparable results from the different national model applications and the feasibility to achieve these results, keeping in mind that most o f the participants were not funded specifically for this work.
3.2 Dr Lenhart pointed out that the message from the last workshop in Hamburg remained thatimprovement in model performance could only be achieved by the participants if the necessary spin-up was carried out for the models to reach equilibrium (as a minimum a spin up time of three years had been recommended), and if a consistent set o f boundary conditions was used. He thanked Dr Roger Proctor from the Proudman Oceanographic Laboratory (POL) for providing a consistent set o f boundary conditions derived from a large area model. In addition, data for river loads, atmospheric inputs data (from EMEP1) and meteorological forcing data (from ECMWF2) were compiled to provide consistent forcing for the models. Data were collected for the year 1988/1989 for calibration and 2002 for validation. Following a proposal from the organising group, EUC agreed in a written procedure in the 2006/2007 cycle o f meetings that reduction scenarios will be performed for the year 2002, taking into account the reductions achieved in the period 1985 to 2002. The reason for the change in the reference year as agreed in the terms o f reference was that no validation data were available for 1985. Another change in the conditions for model applications compared to the last 2005 workshop concerned the definition o f target areas; these were changed to allow future work on transboundary nutrient fluxes to build on the results o f this workshop. There were still a number o f open questions which the organising group had identified and on which participants were asked to give their feedback. This included for example the question on the need for a common set o f forcing data on suspended matter to calculate light attenuation for use in future model applications.
3.2 N ational presentations o f m odel applications
a. United Kingdom - model application
act. Presentation by Cefas
3.3 Dr Sonja van Leeuwen (UK) presented the results o f the Cefas GETM-BFM model application toone calibration station (out o f five used), five target areas for validation, and the six target areas for the reduction scenarios (click here for the presentation). The General Estuarine Transport Model GETM is a three-dimensional hydrodynamics model, and includes the one-dimensional model GOTM to resolve processes in the vertical. Biogeochemical Flux Model BFM is an ecosystem model developed from the ERSEM model, and includes nutrients, phytoplankton, micro and mesozooplankton, bacteria and organic matter, and also a benthic module including nutrients, filter feeders, bacteria, zoobenthos and organic matter. The basic variables are nitrogen, phosphorus, silicate and carbon. In the pelagic system, biological material is transported by the hydrodynamic model. For the workshop, the model was amended to specifically include a North Sea diatom type as one o f the 4 phytoplankton functional groups, and a parameterisation was implemented for local SPM resuspension by surface waves. The model was run on a 6 nautical mile grid, with 25 layers in the vertical, spanning the North Sea, English Channel, and part o f the Baltic Sea. The model was calibrated for 1989 by tuning the SPM parameterisation on five widely separated stations o f the NERC North Sea Project data set. The spin up procedure included ten years for the standard run, and a subsequent 9 and 7 years for the 50% and 70% reduction scenarios respectively. Spin up achieved approximate equilibrium for the pelagic system, but not for the benthic system. Further spin up was not carried out because o f time constraints.
1 The Co-operative Programme for Monitoring and Evaluation of the Long-range Transmissions of Air Pollutant in Europe (EMEP), set up under the UNECE Convention on Long-range Transboundary Air Pollution.2 The European Centre for Medium-Range Weather Forecasts (ECMWF).
3
Workshop Report

2nd OSPAR Workshop on Eutrophication Modelling 10-12 September 2007
3.4 The validation o f the hydrodynamics showed good performance for temperature and stratification, and reasonable results for salinity. Largest deviations were found near the Norwegian coast in the Skagerrak. The results suggest that the model may overestimate the mean northward residual flow through the Strait of Dover. The validation of the biology for the target areas showed reasonable model performance, but results were poorer than those achieved for the calibration. The results were particularly good for phosphate. For nitrate, offshore values were too high through-out (in contrast to the calibration), whereas near-shore winter values were too low. Oxygen levels were under predicted in some areas and overpredicted in others. Offshore summer mean chlorophyll levels were overpredicted. The SPM parameterisation captured the seasonal cycle, and some o f the observed high frequency variability. It was suspected that at least a number o f the discrepancies between model results and observations were related to the reduced ability o f the model to transfer nutrients from the pelagic to the benthic system, which, in combination with the spin up procedure o f repeating a year with high runoff lead to saturation o f the pelagic system with non-limiting nutrients. The benthic-pelagic coupling was still regarded as requiring further development.
3.5 The reduction scenarios showed the largest effect in terms of reductions o f winter nitrate and phosphate concentrations. Mean chlorophyll, minimum oxygen and net primary production were much less responsive to reducing nutrient inputs. These results were evident both from maps o f the spatial distribution, and from the results for the target areas. Maximum chlorophyll concentrations showed an intermediate response. Apart from maximum chlorophyll, all variables, which had exceeded the thresholds in the standard run, fell beneath the threshold for a 50% reduction. The strong influence o f the reductions seemed to suggest that the suspected saturation with nutrients that we suspected in the standard run did not occur in the reduction runs.
3.6 In the discussion, the following views were expressed:
a. the results suggested that for model purposes chlorophyll maximum was not a meaningfulparameter. The use o f the 90th percentile would be more appropriate;
b. there were only limited effects in response to nutrient reductions at the boundaries. This couldbe explained by the negligible effect o f river inputs on nutrients received from the Atlantic asspecified by the boundary condition;
c. the inconsistent spatial distribution patterns o f DIN and DIP could be explained by the spin-up for the year 2002 which was a particularly wet year, resulting in stronger than normal near-shore salinity gradients. By repeating the year in the spin up, the system might have been biased towards higher spatial distribution.
bb. Presentation by POL
3.7 Dr. Roger Proctor presented the results o f the Atlantic Margin Model (POLCOMS-ERSEM), which was also used to derive boundary conditions for the application o f the national models presented at this workshop (click here for the presentation)3. The physical model POLCOMS calculates hydrodynamics, temperature and salinity. The biological model ERSEM calculates nitrogen, phosphorus, silicate and carbon cycling in coupled pelagic and benthic systems. The pelagic includes 4 types o f phytoplankton, bacteria and 3 types o f Zooplankton. The benthic system includes suspension feeders, bacteria, deposit feeders and meiobenthos. The model spans the North-East Atlantic ocean and North Sea, and is nested in FOAM, which covers the North and South Atlantic. It has approximately 12 km resolution, and 34 s-levels in the vertical. Inherent Optical Property (IOP) fields from SeaWiFSs remote sensing data were used to represent non-biotic absorption concentrations (a proxy for SPM). Spin-up included a realistic run from 1988 to 2001, with subsequent repeated runs o f 2001 and 2002 (both 3 times). The model is routinely used at the UK Met Office for forecasting, and was modified for the workshop by adopting the supplied river data.
3.8 The following comparisons o f output from the physical model with observations were presented:
• winter and summer S ST fields compared with AVHRR satellite observations
• summer temperature and salinity cross-sections compared with the provided observations.
3.9 The S ST fields showed that the model reproduced the spatial distribution o f the general features with an annual mean underestimation o f approximately 0.5°C and an RMS of 1°C. The cross-sections indicated
3 Following the workshop, the model results presented at the workshop were recalculated to correct calculation errors; at the time of adopting the workshop report, the recalculated results were still under review by UK-POL.
4
Workshop Report
2nd OSPAR Workshop on Eutrophication Modelling 10-12 September 2007
that the model captured the main density structures, although underestimating the depth o f the thermocline by about 5m.
3.10 Graphs o f the seasonal cycle of standard and reduction scenarios at stations C S northwest o f Dogger Bank and West Gabbard in the southern Bight showed negligible change at CS and very limited change in the nutrient concentrations at West Gabbard but not in chlorophyll, silicate and oxygen.
3.11 The assessment results showed no change in the offshore target areas, and only minor changes in coastal target areas.
3.12 In the discussion, general consideration was given to methods for validating SPM. It was observed that satellite imagery often showed lower SPM values than observed. This was linked to uncertainties of satellite images which would miss high values, usually associated with cloudy conditions. Also ship-based monitoring missed these values. Only appropriately located buoys with continuous measurements could pick up realistic values..
b. Belgium - model application
3.13 Dr. Geneviève Lacroix (Belgium) presented the results o f the Belgian MIRO&CO-3D model appliedto the Belgian and adjacent French waters (Channel) for validation and to one o f the five target areas (UK- C l) for reduction scenarios (click here for the presentation)4. MIRO&CO-3D is a biogeochemical model designed to study eutrophication in the Channel and the Southern Bight o f the North Sea. It simulates the annual cycle o f inorganic and organic carbon and nutrients (nitrogen, phosphorus and silica), phytoplankton (diatoms, nanoflagellates and Phaeocystis), bacteria and Zooplankton (microzooplankton and copepods) with realistic forcing (meteorological conditions and river loads). A spin-up o f three years was sufficient to reach equilibrium. The model was set up in accordance with the Workshop User Guide.
3.14 Validation was with monitoring data showed adequate agreement with model results in the assessed areas, with the model tending to;
• underestimate nitrogen (except for an overestimation for UK waters);
• overestimate phosphate concentrations, and;
• delayed onset o f the spring bloom and possibly chlorophyll maximum concentrations.
3.15 Reduction scenarios were run for Belgian and French (Channel) waters and target area UK-C1. With the exception o f chlorophyll, hardly any change was observed in the reduction scenarios for target area UK- C 1. This could be explained by the fact that the model had not been calibrated for UK waters and by the proximity o f the area to the boundary condition. For the Belgian waters, reduction o f nutrient loads and primary production showed clear reduction responses in winter nitrogen concentrations. Winter DIN concentrations moved below the assessment level only at a reduction at 70%. Responses o f chlorophyll concentrations were less explicit but resulted in concentrations below assessment levels.
3.16 For assessment and nutrient reduction purposes, three scenarios were applied showing the role of Phaeocystis in the classification o f Belgian waters under the Common Procedure if (i) the parameter was not taken into account, and if it was taken into account using (ii) the national assessment level agreed under the Common Procedure (IO6 cells/1) or (iii) an "ecological" criterion o f >150 mg C/m3 (Rousseau, personal communication).
3.17 The model results showed that the model was sensitive to the choice o f spatial dimensions. This raised the question how to derive an acceptable spatial dimension to better support policy conclusions. The model also showed sensitivity to total suspended matter (TSM); this was demonstrated in the different results when applying either the Belgian TSM forcing data or the TSM forcing provided for the workshop.
3.18 In the discussion, it was noted that model performance could be improved by avoiding any attempt to smooth TSM (suspended particulate matter is regarded as equivalent to TSM) derived from observations. Approaches that introduced random fluctuations in the TSM field were recognised to be desirable rather than imposition o f any smoothing. An alternative to using observations, that were often sparse in spatial and temporal resolution, was to use a simple model of the type developed and implemented by Cefas. The
4 Following the workshop, the model results for UK-C1 were recalculated for their scoring to ensure comparability with the scoring method used by other participants.
5
Workshop Report

2nd OSPAR Workshop on Eutrophication Modelling 10-12 September 2007
modelled TSM (SPM) fields generated by the model provided a sufficiently good fit with field observations to provide confidence in its wider use.
c. Netherlands - model application
3.19 Mr Hans Los and Ms Nicki Villars (the Netherlands) presented the results o f the Dutch Delft3D- ECO/GEM model application (click here for the presentation). GEM is part of DELWAQ and is based on a suite o f models with hydrodynamics supplied by Delft3D-Flow, nutrients and primary production from Deflt3D-ECO, and suspended particulate matter (SPM) from Deflt3D-SED. SPM forcing was used from a dynamic SPM model to simulate the weekly SPM fluctuation and the subsequent availability o f light for phytoplankton growth. The model system is highly flexible in terms of the grid size and resolution, the time step, the processes that are modelled and the ability to include other user defined processes. The variables modelled include nitrate, phosphorus, silicate and oxygen with three forms o f detritus at different decay rates. The biological model simulates primary production and includes 4 phytoplankton functional groups, including Phaeocystis, but secondary production was not included. The model set up and the calibration for 1989 followed the instructions o f the Workshop User Guide. Validation was done for the year 2002, based on two series of simulations: (i) results from a model run using Dutch data for boundary conditions was compared to observations from six Dutch monitoring stations, for the period 1981 - 2003; monthly mean data were used for calculating the cost function; and (ii) a calculation using the workshop boundary conditions was compared to the data from target boxes, using the cost function.
3.20 Validation for Dutch stations showed adequate agreement between simulations and observations with some delay in modelled depletion o f silicate and higher winter phosphorus and low winter chlorophyll concentrations in some areas. The result o f the validation for Dutch stations using OSPAR forcing data was generally very good with the exception o f S i02 and P 0 4 at northern stations which was related to the use of the boundary condition. In conclusion, model results when forced with observed (Dutch) data provided better results than use o f OSPAR forcing data. The cost function values resulting from this exercise for the individual Dutch monitoring stations were good. Surprisingly, the cost functions derived for the OSPAR target areas did not reflect the good agreement seen when measured and modelled data were plotted on the same graphs. Overall, the validation results gave confidence in the model for reductions scenarios and related results.
3.21 The reduction scenarios for 50% and 70% showed that the nutrient parameters were particularly sensitive to reduction in nutrient loads. Reduction of nutrient concentrations were most apparent where freshwater formed a significant component o f the water fraction. Chlorophyll mean concentrations showed only small changes in the reduction experiments, including in (coastal) areas where reductions in nitrogen concentrations were highest. This suggested that light limitation may be responsible. The light regime was strongly influenced by SPM and it raised the question how light regimes were derived in the different models presented at the workshop. Another factor to take into account was the potential importance o f phosphorus limitation which may occur in these (continental) coastal areas as a result o f the reduction in load since the 1980s. Responses o f chlorophyll maximum concentrations were even smaller and showed hardly any improvement in the scenarios. The results for primary production showed, similar to chlorophyll, a correlation with the combined factors o f significant nutrient reduction and light availability. Finally, the reduction scenarios showed that Channel water and North Atlantic water had a significant influence on the nutrient input and concentrations for large areas o f the North Sea for which sources were not significantly reduced in the boundary condition. Overall, the reduction scenarios for the five target areas suggested some but modest improvement o f nutrient parameters (DIN and DIP) at the coastal boxes NL-C2, G-C1 and UK- C l. For chlorophyll load reductions had limited effect on scoring against the assessment levels: maximum chlorophyll was mostly above the assessment level except for UK-C1, whereas mean chlorophyll was mostly scored as below or at the assessment level, except for G-C 1. Phaeocystis remained above assessment levels at G -Cl, G -02 and NL-C and showed only modest improvement in areas in relation to load reductions. Oxygen was consistently above assessment levels.
Workshop Report
6
2nd OSPAR Workshop on Eutrophication Modelling 10-12 September 2007
3.22 In the discussion, the following views were expressed:
a. the different responses o f chlorophyll mean and maximum concentrations to nutrient reductions indicated that mean chlorophyll was not primarily controlled by nutrients but by light limitation in the simulation;
b. lack o f sensitivity to chlorophyll (mean/max) may also be linked to silicate which is being reduced in the model.
d. Germany - model application
3.23 Dr Wilfried Kühn (Germany) presented the results o f the application o f the ECOHAM4 model to the five target areas (click here for the presentation)5. The model is a further developed version of the model used for the first workshop in 2005 which is more complex including more state variables. The model includes the state variables nitrate, phosphorus, carbon, silicate, 2 phytoplankton groups (flagellates and diatoms), 2 Zooplankton groups (micro/meso), bacteria and detritus. The model was calibrated with the year 1995 with an overall satisfactory result. There was only some deviation due to high simulated chlorophyll concentrations in the central North Sea. For the spin up the year 2002 was run three times. The model was set up in accordance with the Workshop User Guide. It was noted that 2002 was a special year as it had a positive winter NAOI (North Atlantic Oscillation Index). In the future, improvements were planned o f the benthic model and in the development o f a dynamic silt module.
3.24 Validation for the year 2002 was carried out for the five target areas. The results indicated an underestimation o f winter nutrients which might be a consequence o f the boundary conditions, especially at the northern boundary with the open North Atlantic. Nitrogen, but also phosphorus and chlorophyll, behave differently depending on the boundary data used either from the POLCOMS model or from WOD (World Ocean Database). In the standard run, problems occurred in relation to oxygen which has subsequently been excluded from the German assessment.
3.25 In general, the reduction scenarios resulted in considerable reductions o f nutrients, especially winter DIN (up to 50%); responses o f winter DIP were much less pronounced in the reduction scenario. North-West o f the Danish coast, a remarkable reduction (25 - 25%) in phytoplankton carbon biomass could be observed as response to 50% nitrogen reduction. The results o f the reduction scenarios varied for the target areas, with pronounced reductions in nutrient concentrations in NL-C2 and less pronounced reduction in environmental parameters in the German and Dutch offshore areas (G-02 and NL-02). For G-Cl modelled assessment parameters were still above assessment levels (thresholds) even at a nutrient reduction o f 70%.
3.26 In the discussion, the following views were expressed:
a. UK-POF doubted that the use o f forcing from POFCOMS had significant impact on the winter nutrient concentrations along the boundaries. A comparison o f the POFCOMS winter nutrients with World Ocean Database data showed that there was an underestimation but not an unreasonable agreement;
b. there was a pronounced reduction o f nitrogen concentrations in response to nutrient reductions North-West o f the Danish coast. It was not clear whether this could be explained by light limitation in the German Bight. Another explanation could be rapid export o f nutrient rich water that washed out nutrients from the inner German Bight and were subsequently transported further North;
c. the simulated reduction in nutrient concentrations o f up to, and even higher than, 50% (with only a 50% nutrient load reduction scenario) could be explained if riverine nutrient inputs in 2002 were greater than in 1985;
d. the results for chlorophyll confirmed Dutch model results in which no phosphorus reduction was applied in the reductions scenarios, as a 70% reduction in actual riverine nutrient inputs had already been achieved. In a situation o f large nitrogen surplus, phosphorus becomes the limiting growth factor. When reducing nitrogen loads in the scenario, the N/P ratio changed. This explains why chlorophyll is not responsive.
5 Following the workshop, the model results presented at the workshop were recalculated to correct calculation errors.7
Workshop Report
2nd OSPAR Workshop on Eutrophication Modelling 10-12 September 2007
e. Norway - model application
3.27 Dr Morten Skogen (Norway) presented the results o f the NORWECOM model application to the five target areas (click here for the presentation). The model is a coupled physical-chemical-biological model for the whole North Sea. The set up o f the model, the boundary conditions and the forcing used did not follow the Workshop User Guide. The model had been set up with time series for the period 1985 - 2005 in one run and with a spin-up o f 4 years based on 1985.
3.28 For the reduction scenario o f 50%, the year 2002 was used with 1985 river loads with a spin-up o f 5 years. For validation a realistic run was carried out for the period 1985 - 2005 o f time series for nutrient concentrations, chlorophyll and oxygen. The long time series showed that in coastal boxes the reductions in winter DIP concentrations were larger than for winter DIN whereas in the offshore boxes no trends could be detected. This was probably due to too many different water masses influencing the offshore boxes and UK- C l; for the Netherlands and Germany, the mean values were not much affected by river inputs. Similarly, chlorophyll and oxygen showed only weak trends.
3.29 The nutrient reduction by 50% resulted in very little environmental response offshore, especially in the UK box. The scoring o f the model results did not necessarily reflect the absolute reduction achieved due to the applicability of different assessment levels in the various boxes. This was illustrated for example for chlorophyll maximum, which was scored below assessment level for the Netherlands but above for Germany although the values simulated for Germany were lower than those for the Netherlands.
3.30 In the discussion, the following views were expressed:
a. the mean of the oxygen minimum concentration over large boxes like the target areas waslimited in its meaning and interpretation. The more appropriate scale would be to look at the values for example at the scale o f the river plume;
b. the model results showed that offshore areas were not affected by riverine nutrient reductions butonly coastal areas were. This raised the question about the usefulness o f assessing offshore areas for anthropogenically induced eutrophication;
c. the lack o f trends in the minimum oxygen concentrations pointed to the fact that this parameterwas mainly driven by meteorological conditions (e.g. wind) and not by nutrients;
d. the capability o f oxygen to indicate a cause-effect relationship in the eutrophication process waslimited (especially in the offshore region) and would need to be carefully considered in the light o f the environmental factors o f the area concerned in cases in which the oxygen concentration would determine a shift in the area classification under the Common Procedure.
f. Portugal - model application
3.31 Professor Ramiro Neves and Mr Bartolomeu Bemardes (Portugal) presented the results o f theMOHID model application to the Tagus estuary and the five target areas (click here for the presentation). MOHID is a hydrographical model with a suite of modules for water properties, water quality module (i.e. ecological processes), bottom interface module, sediment consolidation and bioturbation, sediment properties and quality. The model is designed to assess water quality following the implementation o f the Water Framework Directive, Urban Waste Water Treatment Directive, Nitrates Directive and under the OSPAR Common Procedure. By dividing an area into volume boxes, the fluxes o f water masses in time (residence time) and space (transboundary transport) can be simulated.
3.32 The application o f the model to the Tagus estuary showed good agreement with monitoring resultswith a slight overestimation o f nitrogen. A 50% reduction o f nitrogen in the Tagus estuary showed a clearresponse o f nitrate (~ -50%) but hardly any effects on phytoplankton, organic matter and ammonium. In the light o f the environmental situation o f the Tagus estuary this confirmed that reduction o f nitrogen discharges under the Urban Waste W ater Treatment Directive would not modify the trophic level o f the estuary. The reason for this was that primary production was light limited. As a consequence, nitrate had a conservative behaviour that was demonstrated by a linear evolution along the salinity gradient. The absence o f any correlation between chlorophyll and nutrient was also a consequence o f light limitation. The limiting factor for chlorophyll was turbidity resulting in chlorophyll responses mainly in areas with low turbidity. The N/P ratio indicated that in the last 25 years the system had been shifting towards a situation where phosphorus was becoming the limiting factor.
8
Workshop Report

2nd OSPAR Workshop on Eutrophication Modelling 10-12 September 2007
3.33 For application in the North Sea, a 3D ecological model was set up for the year 1998. Therefore, the model did not use the forcing data (except for riverine inputs) and boundary conditions provided for the workshop. The model was nested into a 2D hydrodynamical model that had been validated at tide and showed good comparison with observation data. The spin-up was 1 year. River channels were set up to identify freshwater fluxes. The model was validated with observations from the monitoring stations in the target boxes and with satellite imagery (phytoplankton). The model fitted well with observations in temperature, salinity, ammonium and phytoplankton concentration and distribution (except for the most northern Dutch station) but overestimated nitrogen and phosphorus. The difficulty in validating the model for phytoplankton distribution was the short life time of the bloom (~ 4 days from start to end) and the difficulty for satellite images to capture this event (clouds masking the surface). The model seemed to fit well with early and late summer observations but was overestimating phytoplankton in the time between. It was not expected that phytoplankton reacted to nutrient reductions as light was a limiting factor; SPM played a key role in the region. The limitations of the model were the boundary conditions used and the model's complexity (it can simulate more species).
3.34 In the discussion, the following views were expressed:
a. before adding more complexity to the model to improve results, a more detailed analysis o f the model's behaviour would be advised;
b. the use o f a 2D hydrographic model was not recommended in relation to investigation o f nutrient reduction scenarios. Experience in use o f such models showed that they have problems in simulating the flow through the Channel affecting the Dutch coast; the flow was mostly underestimated and deviated from known transport pathways;
c. caution should be observed in considering the role o f light and nutrients. The way the model was set up enhanced the role o f light and did not support a global conclusion o f light being the limiting factor. Fight levels had not changed over the last decades;
d. nitrogen was still the limiting factor in the North Sea. This may have been masked in the model because o f its high level of nutrients which resulted in any other factor being the limiting one.
g. France - model application
3.35 Dr Alain Ménesguen (France) presented the application o f ECO-MARS3D (3D code using finite difference ADI and anti-diffusive TVD schemes) to the Bay o f the Seine, the northern coast o f France and the Belgian coast, and target area UK-C1 (click here for the presentation). The model was designed to simulate the primary production in the Channel with focus on the bloom of two harmful algal species: Phaeocystis which is relevant for the eutrophication in the eastern English Channel and the Southern Bight o f the North Sea, and Karenia mikimotoi whose occurrence is not linked to eutrophication. The models also quantified the contribution o f the main river inputs along the French and Belgian coast to primary production. The model outputs winter DIN and DIP, N/P ratio, chlorophyll mean and maximum concentration and the diatom/non-diatom ratio. It had not been possible to follow the instructions o f the Workshop User Guide to full extent. Therefore the set up o f the model, the boundary conditions and the forcing applied did not fully comply with the workshop specification.
3.36 Validation was done using satellite imagery for temperature for 2003. This was an especially hot summer resulting in stratified water. For chlorophyll satellite imagery was used and in-situ observations for Phaeocystis, respectively, for 2002. The model compared well with observations, tending to
a. overestimate temperature by 1°C. In the Bay of Seine, temperature seemed to be slightly too low;
b. overestimate time and concentrations o f chlorophyll in April and May in the Bay o f Seine;
c. overestimate Phaeocystis, especially in the Bay o f Seine.
3.37 The standard run for 2002 showed high nutrient concentrations, especially o f nitrogen in the Bay ofSeine. Mean chlorophyll concentrations were surprisingly low, except in estuaries (e.g. Somme), given the high productivity in the area. Chlorophyll maximum was very high for the plumes o f Seine, Scheldt, Rhine and Thames. Primary production could be particularly high in the Bay of Seine. The diatom/non-diatom ratio could be low in some areas due to blooming o f Karenia which is not related to nutrient enrichment.
9
Workshop Report

2nd OSPAR Workshop on Eutrophication Modelling 10-12 September 2007
3.38 The reduction scenarios included a reduction o f both nitrogen and phosphorus, by 30% and 70% each. Results for a 50% reduction were derived from interpolation o f the 30% and 70% reduction. The 70% reduction showed clear effects on winter DIN concentrations along the French, Belgian and Dutch coast with less pronounced reductions in winter DIP concentrations. The reduction in nutrient concentrations was particularly high off the UK coast in surface water; this pointed to the in-homogeneity o f the area (salinity range o f 30 - 34.5). While there were clear reductions in chlorophyll maximum concentrations relating to Seine, Scheldt and Rhine this was not so much the case for the Thames, and was less pronounced for chlorophyll mean concentrations in all areas. At a 70% reduction, the French coastal strip responded with a clear decrease in nutrient concentrations, a non-linear response o f chlorophyll, and a strong response in Phaeocystis but no change in diatom/non-diatom ratio. For the Belgian coastal zone, there was a reduction in winter DIN but not for DIP, a better reduction for Phaeocystis but hardly any difference in response of chlorophyll to the 30% and 70% reduction. This is surprising as reduction was mainly linked to nitrogen reductions; through excess o f diatom bloom even very low levels o f phosphorus were taken up. One possible explanation could be that the Phaeocystis module o f the model was too sensitive as it was designed to simulate the different stages o f the life cycle o f Phaeocystis (e.g. linking to silicate).
3.39 In the discussion, the following views were expressed:
a. comparability with the Belgian results on Phaeocystis was difficult as both loads - nitrogen and phosphorus - were reduced;
b. the limiting factor for Phaeocystis may be different in local systems, e.g. nitrogen in Belgian waters and phosphorus in French waters.
h. Wadden Sea model application
3.40 Dr Bert Brinkman (the Netherlands) presented the results of the EcoWasp model application to the Western part o f the Dutch Wadden Sea area (click here for the presentation). The model is set up for the Wadden Sea and designed to simulate effects o f human activities, including fisheries, shellfish research, extension o f the Rotterdam harbour, or effects o f harbour sludge disposal. The model uses a simple hydrodynamic model coupled with an ecological module (including filter feeders). For suspended particulate matter computed forcing data had been used from a simple sediment model to simulate high frequency data. For Lake Ijssel the boundary conditions provided for the workshop were used which matched well with the conditions normally used; boundary conditions for the North Sea were compiled separately. A spin up o f 20 - 30 years was needed. Reduction scenarios showed good response o f nitrogen. Due to nitrogen removal, phosphorus became the limiting factor and the N/P ratio increased. The results were sensitive for organic matter input from Lake Ijssel.
3.3 D iscussion and conclusions
3.41 The workshop critically reviewed the conditions provided for the model applications, the performance o f the models and their results. Among the main issues discussed were:
a. forcing data provided for the workshop;
b. a need for forcing models with organic riverine load and suspended particulate matter;
c. the boundary conditions provided for the workshop;
d. the spin-up results and lessons leamt;
e. validation o f model results;
f. the use o f cost-fimctions for comparing model performance;
g. the sensitivity o f parameters in the reduction scenarios;
h. the results o f the reduction scenarios.
3.42 The workshop also considered a request from Belgium and France to extend the reduction scenarios to the Belgian and French areas they had assessed to allow a better comparison o f model results. The representatives from Germany, the Netherlands and the UK indicated that they were willing to prepare such reductions.
10
Workshop Report

2nd OSPAR Workshop on Eutrophication Modelling 10-12 September 2007
3.43 Based on the discussion, the workshop agreed:
a. on the draft assessment o f the environmental consequences for problem areas following nutrientreductions at Annex 4;
b. that the organising group should update Annex 4 and circulate it for comments to the workshop participants. The update should include a review o f sections 3 and 4 in the light o f confirmed UK-POL model results and primary production values reported by participants for inclusion in the report. The update in written procedure should be complete by 30 November 2007;
c. to invite participants to prepare reduction scenarios for two additional target areas for theBelgian and the French coast by 18 January 2008. To facilitate this, the organising group o f the ICG-EMO will provide to the participants by 2 November 2007 a definition o f the target areasand forcing data for these areas from Belgium and France;
d. that the organising group of the ICG-EMO should prepare a further update o f Annex 4 of the workshop report with results for reduction scenarios o f the two additional target areas and will
(i) circulate it to those participants who took part in this additional exercise by 15 February for comments;
(ii) finalise the updated report by 10 March for presentation to EUC in April 2008;
e. to publish the results o f the workshop in a common paper in a peer reviewed scientific journal.
Agenda Item 4 - Transboundary nutrient transport
4.1 Introduction
4.1 The workshop noted the agenda for the discussion o f transboundary nutrient transport (Annex 2).
4.2 Dr David Mills (UK) introduced the aspects o f the terms o f reference on transboundary nutrient transport set out by EUC(l) 2006 (Annex 3) that need to be addressed by the workshop (click here for the presentation). He recalled that the priority would be to agree the basic concepts and approaches for calculating transboundary nutrient transport as the basis for further work, and to set up a work programme for implementing this. He recalled the definition o f eutrophication in the OSPAR framework requiring anthropogenic nutrient enrichment causing accelerated algae growth to produce undesirable disturbance to the balance o f organisms present in the water and to the quality o f water concerned. This definition meant that not only the fluxes o f nutrient but also their subsequent consequences in terms o f eutrophication status for the receiving target area needed to be considered. The objective was to present results to OSPAR in time so that these could be taken into account in the Quality Status Report (QSR) in 2010. For this purpose, it was crucial to achieve further input from EUC on how the results from transboundary nutrient transport calculations should be presented to best contribute to EUC's work and the QSR.
4.3 Mr Richard Moxon (UK) set out the policy perspective for work on transboundary nutrient transport (click here for presentation). He illustrated the different general policy drivers (sustainable use, precautionary principle, prudent use o f tax-payers money) and more specific drivers such as the OSPAR Eutrophication Strategy and EC legislation (including for example the Urban Waste W ater Treatment Directive, the Nitrates Directive, the W ater Framework Directive and related implementation instruments, and the proposed Marine Strategy Directive). Under the OSPAR Common Procedure as well as EC legislation, areas needed to be identified, which may be affected by nutrient inputs where these may cause undesirable disturbance, with a view to informing actions to combat eutrophication. In this context, transboundary transport o f nutrients may play a role in identifying the sources o f nutrients and where the priorities for action should be. A practical use o f results from transboundary nutrient transport calculations may be to provide evidence base in disputes over identifying such areas or implementing related measures where a state claims that eutrophication in its waters is caused by nutrient inputs o f another state. Such disputes may arise under the OSPAR Common Procedure and EC legislation. In conclusion, the question to which policy makers sought answers was: How significant are the nutrient loads from different sources, and will reductions o f loads from these sources solve the eutrophication problem in a particular area? This would help guiding decision where actions were most cost-efficient.
11
Workshop Report

2nd OSPAR Workshop on Eutrophication Modelling 10-12 September 2007
4.4 In the discussion, the following views were expressed:
a. a simple mass balance o f loads, comparing relevant river loads with e.g. Channel inputs could give a indication of sources and their contributions to nutrient loads without need for modelling;
b. there was a good understanding o f physical process to address mass balance components and simulate residence time;
c. the current understanding o f the ecosystem in relation to organic matter had not yet sufficiently developed to adequately address matter in nutrient budgets;
d. there was a need to define what a "significant load” is which is received through transport by an area; otherwise any contributions through transport (e.g. in the order o f 10%) could be used as an excuse for not reducing inputs from upstream sources.
4.2 Presentations
a. United Kingdom
4.5 Dr Liam Fernand (UK) presented results from the 2002 Dutch project "Plume and Bloom” on thetransport and fate o f UK nutrient inputs into the southern North Sea (click here for the presentation). The project had been set up to provide evidence on the question raised by the Netherlands with the UK that nutrient inputs from English East-coast rivers were transported to the Dutch coast where they contributed to eutrophication effects. It was the task o f the project to address the questions whether the water from English East-coast rivers was transported to the Dutch coast, whether it contained nutrients, whether growth occurs and what limited it, what else might be occurring and how important this was in comparison to other sources. These questions were addressed based on observations from fixed and drifting buoys, current meter mooring, and scanfish and CD lines. One o f the challenges in assessing these observations was to tackle the different time scales, an issue which would also need to be addressed by models. For biological variables in models, correct timing would be essential; small errors may be critical for the outcome. The messages from the project were that:
a. particulate nutrient transport was important and a distinction needed to be made between the local sources, riverine loads and the loads coming from other sea areas;
b. the role o f nutrient regeneration needed to be considered to give a better understanding of chlorophyll observations. A quantification could for example be achieved by nitrate/ammonium ratio giving an indication o f the nutrients taken up and those regenerated;
c. there was a need to better combine models and observations from operational oceanography;
d. effective use could be made o f existing ecosystem models provided that an appropriate scale was used. Models were for example well suited to calculate land-based sources to the total flux across a given maritime area;
e. what were the best parameters to use in an eutrophication assessment framework? For example, what was gained by focussing on chlorophyll which was not a natural product o f models and would it be more useful to measure rates than states?
4.7 In the discussion, the following views were expressed:
a. there was also an issue o f spatial scale for models given the possible small spatial extent of blooms which might not be supported by the grid;
b. the oxygen observations provided a good example o f time resolution needed for validating model results;
c. the observations showed a persistent slight oxygen under-saturation in winter which pointed to ongoing remineralisation or benthic activities in this part o f the year and to oxygen production being dominated by oxygen consumption over the years.
Workshop Report
12

2nd OSPAR Workshop on Eutrophication Modelling 10-12 September 2007
b. Norway
4.8 Dr Morten Skogen (Norway) presented the outcome of a master thesis6 to identify long-term effects of reducing nutrient loads to the North Sea (click here for the presentation). The work draws on the results of nutrient reduction scenarios o f the 2005 OSPAR workshop on eutrophication modelling in Hamburg. One aspect o f particular interest was to identify main forcing for observed interannual variability. A comparison o f oxygen depletion with the North Atlantic Oscillation (NAO) confirmed that oxygen concentrations were primarily driven by wind. The observed interannual variability also indicated possible nutrient transports. Dr Skogen illustrated examples that models were already capable of tracking water masses. This included different ways o f using conservative tracers to calculate transport rates for water masses through North Sea sections, to reconstruct winter DIN fluxes and their interannual variability, to label water masses to track their passage through the sea, and to use salinity-based tracers o f monthly transport o f German Bight water fractions.
4.9 In the discussion, the following views were expressed:
a. there was a difficulty in scales for comparing oxygen concentration with NAO;
b. oxygen depletion was biologically controlled, and only at the endpoint o f the processes windevents played an important role in defining what the oxygen minimum was;
c. tracing water masses might be straight forward but it did not say anything about the sources ofthe water or their contribution to eutrophication effects. These latter two issues were demanding to implement through models.
c. Netherlands
4.10 Dr Meinte Blaas (Netherlands) presented three available methods to address transboundary nutrient transport (click here for the presentation). Passive tracer transport models helped to trace inert substances and water masses while process-based models helped to relate local responses to sources when non-linear and interacting biogeochemical processes acted. Tracer model methods included:
a. a derivative method which was based on sensitivity testing and would work for any type of conceptual model. It gave insight in response in terms o f ecological effects but only in linearised sense. It was only applicable for small changes in loads and only for one source at a time (per run). This needed considerable computing resources;
b. a decay method which was based on simulation o f total nitrogen and phosphorus removal. It only gavei estimates on contribution o f sources to total nitrogen and phosphorus but not in terms of specific ecological effects (primary production, chlorophyll);
c. a nutrient labelling (nutrient tracer) method. It labelled substances per groups o f sources and initial water like isotopes. The model could be run once for all sources and could distinguish effects on all relevant variables at once. It would give information on effects during (species specific) bloom.
The faster and easier decay method yielded similar results as the labelling method but no breakdown into parameters. All methods had already been implemented and applied at Delft. The difficulty was how to validate these model tools.
4.11 In the discussion, it was noted that the presented methods could take into account background loads to distinguish between natural and anthropogenic loads. Based on the presented methods, a two step approach was advised, in which first the contributing source (e.g. river) o f concern was identified and then further scrutiny o f the river loads was undertaken and their sources upstream were traced.
d. Belgium
4.12 Dr Geneviève Lacroix (Belgium) presented in a case study for the Belgian waters the capability of the MIRO&CO-3D model to trace the origin and fate o f nutrients through salinity and passive tracer simulations and through sensitivity testing (click here for the presentation). In a three step approach the model traced water mass origin, nutrients origin and the transboundary transport o f nutrients. Applied to the
6 Lene Rokke Alaihi sen, Modelling the long-tenn effects of reducing nutrient inputs to the North Sea, Master Thesis, submitted to the University of Bergen (Norway), Biological Institute, 1 June 2007.
13
Workshop Report

2nd OSPAR Workshop on Eutrophication Modelling 10-12 September 2007
Belgian waters, the study showed that the influence o f the Seine was less pronounced for Belgian coastal waters than thought but that it critically impacted the central North Sea. The main contributing freshwater sources to the Belgian coast were the Rhine/Meuse (1.3%) and the Scheldt and Seine (both around 0.9%). Using reduction scenarios (1%) o f river loads (DIN/P04) on surface concentrations, the models simulated the origin o f the nutrients. For the Belgian waters, Atlantic water supplied the biggest single fraction of nutrients. The sum of rivers supplied more DIN (53.7%) than P 04 (38%) compared to the Atlantic (46.3% and 62% respectively). In the third step the transport o f nutrients was computed by means o f net nutrient budgets for Belgian waters, showing a net export o f P 0 4 and a net import o f DIN. The case study pointed to the importance o f the period chosen for computing fluxes (integer number o f tidal cycles/whole year) and the interannual variability (there was always an export of P 0 4 but export/import o f DIN varied each year).
4.13 In the discussion, the workshop noted that caution was needed in interpreting nutrient transport results as these did not indicate the contribution o f the nutrients to eutrophication effects (e.g. algae growth) elsewhere.
e. France
4.14 Dr Alain Ménesguen (France) presented a study on how to compute the chemical part o f nitrogen of any ecological compartment in any specified marine area which comes from a particular source using the role of French river loads in the eutrophication o f the French and Belgian coastal zones as example (click here for the presentation). He presented a new method for tracking nitrogen in the trophic network which is based on computing a changing property attached to a state variable in a marine ecosystem. This method had been applied for instance to identify the river mainly responsible for nitrogen fuelling of Ulva blooms in the Bay o f Brest. The method applied there was to break down diatom or Phaeocystis nitrogen into nitrogen from French rivers and nitrogen of Belgian and Dutch rivers. The study also explored the role o f benthos in the tagging process: benthos did not alter steady state percentages o f origin in water state variables, but only delayed the convergence to the steady state values. Thanks to the same technique, computing the age of nitrogen content would provide a valuable assessment o f the time necessary to observe the full effect in the North Sea if the load in one river was reduced. Further work on the presented methods should focus for a next workshop to
a. add a complete cycle of nitrogen (or phosphorus) for each national loading;
b. flag the non-living nitrogen (or phosphorus) coming from all the rivers o f a nation, all the year long, or only during a season;
c. map the % of each national nitrogen (or phosphorus) in the phytoplanktonic state variables, and;
d. integrate those % in target areas.
4.15 In the discussion, it was proposed that the relative importance o f sources for eutrophication effects could be tested by suppressing one source, as commonly done in the past. Against this, it was argued that the response o f an over-enriched ecosystem would not be linear: when one source is suppressed, living variables o f the system compensate by taking up surplus nutrients from other sources, and possibly no effect to the nutrient reduction can be observed. This, however, did not mean that the suppressed source o f nutrient did not contribute any way to the eutrophication. For the given task o f tracing transport o f nutrients and their actual contribution to eutrophication effects, it seemed therefore important that the model system remained unchanged.
4.3 D iscussion and conclusions4.16 Dr Hanneke Baretta-Bekker (Netherlands) introduced a discussion paper on transboundary nutrient transport which had been prepared by the organising group and circulated to workshop participants prior to the workshop. She introduced the various questions o f detail that would need to be answered to determine the comer stones o f the work on transboundary nutrient transport in a work programme and to allow intersessional work to proceed. This comprised issues o f defining transboundary nutrient fluxes, definition of target areas, application years, validation protocols, the sources to be addressed, the variables to be taken into account and the conceptual approach to model application (click here for the presentation). In this context, Dr Dave Mills (UK) recalled the definition o f eutrophication and with its three elements o f nutrient enrichment, accelerated growth and undesirable disturbance to the balance o f organisms and made available
14
Workshop Report

2nd OSPAR Workshop on Eutrophication Modelling 10-12 September 2007
to the workshop recent results o f the UK Defra-funded Undesirable Disturbance Study Team, to provide further background to discussion.
4.17 In the discussion, the following main points were made:
On “transboundary flux ”
a. flux means integrating concentration multiplied by velocity over a certain time interval and over a certain cross-sectional surface (e.g. o f a box or a transect);
b. the interest was to determine the contribution of a load from one particular source to a specific area. W hat needed to be computed was what crosses the boundary and where it does come from;
c. a number o f participants supported the view that fluxes needed to be computed in both directions across the boundary (i.e. gross fluxes). Some participants did not share this view because what was o f interest was residual transport.
d. the right time scale was essential. Small time step would be important to compute a particular flux across the boundary (e.g. using model time steps) but for multi-year simulation o f fluxes monthly averaged fluxes could be suitable, provided they were calculated using small timesteps;
e. as a minimum, fluxes should be computed over 1 year or a minimum number o f tides;
f. flux computation would need to be done online;
g. there was a challenge in temporal and spatial integration o f fluxes.
On target areas and subdivision o f the North Sea
h. the EUROGOOS/NOOS transects should be included to allow validation o f model results with NOOS observations;
i. smaller target areas may be advised to facilitate use o f observation data for validation (see sub- paragraph r below);
j . national boundaries should be followed to ensure that policy driven questions about transportscould be answered;
k. to satisfy various demands it might be desirable to use smaller boxes on which nationalboundaries and NOOS transects could be imposed;
On years fo r the calculation
1. as 2002 was a fairly wet year, the year 2001 should be used in addition for the spin-up. If it wasfeasible to gather forcing data for more years (e.g. 2003), this should be included in the spin-up to improve models on interannual variability;
m. participants with models with multi-decadal runs should be invited to provide and share data.
On validation
n. NOOS observations should be used;
o. for suspended particulate matter (SPM), it was desirable to share the same data set;
p. interpolated data from satellite imagery and measurements on a daily/weekly basis should beused. The uncertainty linked to data sets derived in this way needed to be flagged;
q. for the southern part o f the North Sea, SPM data at hourly temporal resolution for 2003 wouldbecome available by end of 2007;
r. in additional smaller target areas, validation could also be done at a station level, or for acollection of station locations, especially in heterogeneous areas with sufficient sample coverage (high frequency measurements from e.g. smart buoys);
s. where measurement data were scarce, data for longer time periods should be included tocompensate for that and provide the necessary variability in the data;
15
Workshop Report

2nd OSPAR Workshop on Eutrophication Modelling 10-12 September 2007
t. due to the large effort and resources required, a climatology based on observations, regarded by some participants as a desirable data set for comparison with model results, could not be done for every target area but only for some selected ones;
On sources
u. rivers could be aggregated by box. Alternatively rivers could be addressed individually;
Variables
v. not all models could simulate the full range o f variables required and there might be a need toshare tasks;
w. among the form of nutrients (dissolved, particulate, organic, total) the minimum to addresswould be dissolved and particulate nutrients but an attempt should be made to address all forms;
X . in the light o f an improved understanding o f undesirable disturbance, information onphytoplankton community structure is highly relevant. However, it needed to be recognized that there are limitations in the number o f variables to be addressed by some models.
4.18 On possibilities how to present model results on transboundary nutrient transport to EUC, the following proposals were noted:
a. tabular form presenting the transports in winter and summer;
b. a pie chart could be used to provide the relative contribution o f each sources in the given area;
c. a horizontal map summarizing for each box the import from a source. An example will be provided by Dr Alain Menésguen (France);
d. examples from the presentations o f the Belgian, Dutch and French presentation could be compiled and presented to EUC as examples for further consideration;
e. it is desirable to provide a weighting tool for putting measured impacts and transported water masses and environmental features in relation.
4.19 Following discussion, the workshop agreed:
a. to recommend to EUC that in a first step towards calculating transboundary nutrient transport,
(i) a run with the coupled hydrodynamic-ecosystem model in the standard set-up should be prepared in order to calculate
• the nutrient dynamics,
• the nutrient loads, transported over specified boundaries,
• the nutrient budgets in the defined areas.
(ii) on a voluntary basis, where workshop participants have the capability, to add on to (i) the use of a ‘tagged variable’ system (e.g., Ménesguen, 2006; Wijsman, 2003) that allows tracking of specific nutrients from specific rivers through the nutrient cycle and to calculate:
• the nutrient loads from a specified river, transported over specified boundaries,
• the proportions o f the nutrient budgets in the defined areas originating from a specifiedrivers;
(iii) where workshop participants have the additional capability, multi-year runs which would repeat part or all o f the above (i) and (ii) simulations.
b. on the work programme at Annex 5;
c. to recommend to EUC that an OSPAR workshop on transboundary nutrient transport should be held in May 2009;
d. that the organising group should prepare a document to EUC for options and with examples of presenting model results drawing on paragraph 4.19 above and workshop presentations, and to invite EUC to specify how the results o f the proposed future workshop should be reported to OSPAR tomeet the needs o f EUC’s work and the QSR2010.
16
Workshop Report

2nd OSPAR Workshop on Eutrophication Modelling 10-12 September 2007
A genda Item 5 - R eport o f the W orkshop
5.1 The report o f the workshop on eutrophication modelling was adopted by a written procedure.
Workshop Report
17

2nd OSPAR Workshop on Eutrophication Modelling 10-12 September 2007
ANNEX 1 (Ref. § 1.2)
List of Participants
HOST AND CHAIRMANDr David Mills CEFASLowestoft Laboratory UK-Lowestoft NR 33 OHT Tel: 00 44 1502 524253Fax: 00 44 1502 513865E-mail: [email protected]
BELGIUMDr Geneviève LacroixMUMMGulledelle, 100B-1200 BrusselsTel: 00 32 2 773 21 00Fax: 00 32 2 770 69 72E-mail: g .lacroix@mumm .ae .be
FRANCEDr Alain MénesguenDépartement Dynamiques de l'Environnement CôtierLaboratoire Ecologie Benthique IFREMER/Centre de Brest B.P. 70F-29280 Plouzané Tel: 00 33 2 98 22 43 34Fax: 00 33 2 98 22 45 48E-mail: [email protected]
GERMANYDr Wilfried KühnZentrum für Meeres- und KlimaforschungInstitut für MeereskundeUniversität HamburgBundesstr. 53D-20146 HamburgTel: 00 49 40 42838 5768Fax: 00 49 40 42838 7485E-mail: kuehn @i fm.uni-hamburg .de
NETHERLANDSMs Hanneke Baretta-BekkerRijkswaterstaat Rijksinstituut voor Kust en ZeePostbus 20907NL-2500 EX Den HaagTel: 00 31 70 311 4439Fax: 00 31 70 311 4200E-mail: [email protected]
FRANCEMr Mare SourisseauDépartement Dynamiques de l'Environnement CôtierLaboratoire Ecologie Benthique IFREMER/Centre de Brest B.P. 70F-29280 PlouzanéTel: 00 33 2 98 22 43 61Fax : 00 33 2 98 22 45 48E-mail : [email protected]
GERMANYDr Hermann LenhartZentrum für Meeres- und KlimaforschungInstitut für MeereskundeBundesstr. 53D-20146 HamburgTel: 00 49 40 42838 5743Fax: 00 49 40 42838 7485E-mail: lenhart// ifin. uni -hamburg .de
NETHERLANDSDr Bert Brinktnan University o f Wageningen IMARES / Texel Department o f Ecology NL-Pb 167 1790 AD Den Burg Tel: 00 31 222 369728Fax: 0031 222 319235E-mail: bert [email protected]
18
Workshop Report Annex 1

2nd OSPAR Workshop on Eutrophication Modelling 10-12 September 2007
NETHERLANDSMr Hans LosWL / Delft HydraulicsPO Box 177NL-2600 MH DelftTel: 00 31 15 2858585Fax: 00 31 15 2858582E-mail: [email protected]
NETHERLANDS
Mr Piet Ruardij [NIOZ]Postbus 59NL - 1790 AB Den Burg Tel: 00 31 222 369475Fax:E-mail: [email protected]
NETHERLANDS
Dr Theo PrinsRijkswaterstaat Rijksinstituut voor Kust en Zee Postbus 8039 NL-4330 Middelburg Tel: 00 31 118 62 28 41
00 31 653 79 43 06 Fax: 00 31 118 651046E-mail: [email protected]
NORWAYDr Morten D Skogen Institute o f Marine Research PO Box 1870, Nordnes N-5817 Bergen Tel: 00 47 55 23 84 61E-mail: [email protected]
PORTUGALProf Ramiro Neves Instituto Superior Téchnico Universidade Téchnica de Lisboa Av. Rovisco Pais P -1049-001 Lisboa Tel:Fax: 00 351 218 41 94 23E-mail: [email protected]
UNITED KINGDOMDr Sonja van Leeuwen CEFASLowestoft Laboratory UK-Lowestoft NR 33 0HT Tel: 00 44 1502 52 77 04Fax: 00 44 1502 51 38 65E-mail: s . vanleeuwen@cefas .co.uk
NETHERLANDSMs Monique VillarsWL / Delft HydraulicsPO Box 177NL-2600 MH DelftTel: 00 31 15 285 8792Fax: 00 31 15 285 8710E-mail: [email protected]
NETHERLANDS
Dr Meinte Blaas WL / Delft Hydraulics PO Box 177 'NL-2600 MH Delft Tel: 00 31 15 285 8439Fax: 00 31 15 285 8710E-mail: [email protected]
NETHERLANDS
Mr Job Baretta Independent science adviser Tel: 0031 624601 044E-mail: noctiluca@xs4all .ni
PORTUGALMr Bartolomeu Bemardes Instituto Superior Téchnico Universidade Téchnica de Lisboa Av. Rovisco Pais P -1049-001 Lisboa Tel:Fax:E-mail: [email protected]
UNITED KINGDOMDr Johan van der Molen CEFASLowestoft LaboratoryUK-Lowestoft NR 33 OHTTel: 00 44 1502 52 77 68Fax: 00 44 1502 51 38 65E-mail: i ohan.vandennolen@cefas ,co .uk
19
Workshop Report Annex 1

2nd OSPAR Workshop on Eutrophication Modelling 10-12 September 2007
UNITED KINGDOMDr Liam Fernand CEFASLowestoft Laboratory UK-Lowestoft NR 33 OHT E-mail: liarn. femand@cefas .co.uk
UNITED KINGDOM
Mr Richard Moxon*Department for Environment, Food and Rural AffairsMarine and Waterways DivisionArea E/623-8 Whitehall PlaceUK- London SW1A 2HHTel: +44 20 7270 8558Fax: +44 20 7270 8510E-mail: richard .moxon@defra. gsi. gov .uk
UNITED KINGDOMDr Sarah WakelinProudman Oceanographic Laboratory 6 Brownlow Street UK-Liverpool L3 5DA Tel: 00 44 151 795 4800Fax: 00 44 151 795 4801E-mail: [email protected]
OSPAR SecretariatMs Andrea Weiss OSPAR Commission New Court 48 Carey Street UK-London WC2A 2JQ Tel: 00 44 20 7430 5209Fax: 00 44 20 7430 5225E-mail: [email protected]
UNITED KINGDOMDr Rodney Forster CEFASLowestoft Laboratory UK-Lowestoft NR 33 OHT E-mail: rodnev. forster@cefas .co.uk
UNITED KINGDOMDr Roger ProctorProudman Oceanographic Laboratory 6 Brownlow Street UK-Liverpool L3 5DA Tel: 00 44 151 795 4856Fax: 00 44 151 795 4801E-mail: [email protected]
UNITED KINGDOMDr Boris Kelly-GerreynNational Oceanography Centre SouthamptonWaterfront CampusEuropean WaySouthamptonUK-Hampshire SO 14 3ZH Tel: 00 44 2380 59 63 34Fax: 00 44 2380 59 62 47E-mail: [email protected]
Workshop Report
20
Annex 1

2nd OSPAR Workshop on Eutrophication Modelling 10-12 September 2007
ANNEX 2 (Ref. §2.1)
Annotated Agenda and Time Table
2nd O SPA R W orkshop on E utrophication M odelling (ICG-EMO)
10-12th September 2007 at the Centre for Environment, Fisheries and Aquaculture Sciences (Cefas)
Lowestoft Laboratory NR33, OHT
Monday, 10th Septem ber 2007 - Nutrient Reduction Scenarios
Agenda item 1: Opening, Welcome and Adoption of the Draft Agenda
13:00 Workshop opening by HostHousekeeping arrangements and local information
13:15 Welcome address by Chair Adoption of Agenda
Agenda item 2: Introduction to Workshop
13:30 Background to the meeting - Dave Mills
• Review o f the scope, aims and desired outcomes o f the meeting• Reporting requirements for OSPAR• Arrangement for initial report to OSPAR EUC
Agenda item 3: Nutrient Reduction Scenario Testing
Session 1 Presentation of Results of Model Applications
14:00 Introduction to session - Hermann Lenhart
• see Appendix 1 (attached) for suggested format for presentations
14:30 UK, Cefas presentation
15:00 Dutch presentation - North Sea
15:30 Tea and Coffee
Continued: Session 1
16:00 Germany - Presentation
16:30 Belgium - Presentation
17:00 France - Presentation
17:30 Norway - Presentation
18:00 Close of Day 1
21
Workshop Report Annex 2

2nd OSPAR Workshop on Eutrophication Modelling 10-12 September 2007
Tuesday, 11th Septem ber 2007 - Nutrient Reduction Scenarios continued
Continued: Agenda item 3 - Session 1
09:00 Portugal - Presentation
09:30 UK, POL - Presentation
10:00 Dutch presentation - Wadden Sea
10:30 Coffee and Tea
Session 2: Issues arising from model applications
11:00 Discussion
Structured discussion in which participants may bring forward items for discussion arising from their experience in carrying the nutrient reduction scenarios or issues concerning underlying limitation either scientific or technical. Examples could include:
• implications of not including organic loads in reduction scenarios
• sensitivity of model to nutrient reductions, system memory
• significance of common boundary conditions in aiding comparison of model derived assessments
• causes of divergence between model results
12:30 Lunch
Session 3: Conclusions
13:30 Discussion
Synthesis of results and conclusions
15:00 Tea and Coffee
15:30 Session 3 continued
Session 4: Publication of Workshop Results
16:30 Publication of the workshop results in the scientific literature
• Presentation from organizing committee on options and possible approaches topublishing the workshop results
• Open discussion on ‘straw man’ proposal for publication
17:30 Close of Day 2
Social Evening!
Workshop Report
22
Annex 2

2nd OSPAR Workshop on Eutrophication Modelling 10-12 September 2007
Wednesday, 12th Septem ber 2007 - Transboundary nutrient transport
Agenda item 4: Transboundary nutrient transport
Session 1 : Setting the Scene
09:00 Welcome & Housekeeping matters
09:10 Background to the meeting (Aims, Objectives and Terms of Reference and outcomes)
09:25 Policy perspective on Transboundary Nutrient Transport - Richard Moxon, UK
Session 2: What do measurements tell us?
09:45 Fate and transport of UK nutrients in the North Sea - Liam Fernand, UK
10:05 Transboundary nutrient transports, and long-term effects of reduced nutrient inputs to theNorth Sea, Morten Skogen, N
10 :25 What have we learnt from observations, Discussion
10:40 Tea and coffee
Session 3: What do the models tell us?
11:00 TBNT model study with GEM (WL) - Meinte Blaas, NL
11:20 Origin and fate of nutrients in the Belgian waters with M IR0&C03D - Geneviève Lacroix, B
11:40 How to compute the part of nitrogen of any ecological compartment in a specified marinearea which comes from a particular source; application to the role of French loadings in the eutrophication of the French and Belgian coastal zones-A la in Ménesguen & Mare Sourisseau, F
Session 4: Discussion and conclusions
12:00 Calculating transboundary nutrient fluxes in the North Sea - Planning Group Representative
• Review o f background document and the questions to be addressed in subsequent discussion
12:30 Lunch
Continued: Session 4
13:30 Discussion and conclusions
The remaining session aims to deliver a set of recommendations to OSPAR in the form of a report. The report will provide an agreed specification for future work on calculating nutrient fluxes. It will also provide a suggested timetable for Implementation and identify the responsibilities for the key tasks required. The discussion will be structured around the document on calculating transboundary nutrient fluxes and will focus upon:
• Definitions to include sources, definition of fluxes, selection o f predefined areas and agreed boundaries
• Variables to be simulated• Simulation period
Datao Calibration and validationo River loadso Boundary conditionso Met Datao Atmospheric data
• Detailed approach• Anticipated results
23
Workshop Report Annex 2

2nd OSPAR Workshop on Eutrophication Modelling 10-12 September 2007
The discussion needs to take account of the specific requirements of OSPAR and the Contracting Parties, what we have learnt from prior observations and from prior modelling of nutrient transport.
15:30 Tea and coffee
Continued: Session 4
16:00 Summing up
Agenda item 5: Report of the workshop
16:30 Close of workshop
Following the close of the workshop a report drafting team will remain in Lowestoft for 13 and 14th September. Any volunteers to joint this team that currently consists of Andrea Weis (OSPAR secretariat), Hanneke Baretta, Hermann Lenhart, Johan van der Molen, and Dave Mills will be most welcome.
Appendix 1 - Suggested Format for Presentations of Model Applications on Nutrient Reduction Scenarios
1. Model Overview (see S. 14 User Guide)
2. Forcing
3. Present spinup used
4. Surface T und S Distribution (other physical parameters?)
5. Calibration run: Calibration of ecological parameters
6. Standard run: Validation of ecological parameters
7. Standard run: CP-model-assessment (User guide S. 8+9)
8. Reduction run 50 %: new CP-model-assessment
9. Reduction runs with 70%,
10. Individual perspectives on OSPAR ICG-EMO topic (e.g. sensitive parameter or processes) that may be used to stimulate discussion in session 4.
24
Workshop Report Annex 2

2nd OSPAR Workshop on Eutrophication Modelling 10-12 September 2007
A N N EX 3 (Ref. §2.1)
Terms of reference for an OSPAR workshop on eutrophication modelling(Source: EUC(l) 2006 Summary Record — EUC(l) 06/9/1, Annex 5)
1. The Joint Assessment and Monitoring Programme (JAMP) requires
a. an assessment in 2006 of the expected eutrophication status o f the OSPAR maritime area following the implementation o f agreed measures (JAMP product EA-5);
b. an overview by 2006 o f predictive models for eutrophication assessment and nutrient reduction scenarios, including transboundary nutrient fluxes within the OSPAR area and o f the possibilities of adopting relevant models for use by OSPAR Contracting Parties (JAMP product ET-7).
2. In reviewing the results o f the eutrophication modelling workshop held in Hamburg in September 2005 to assist the preparation of the assessment o f the expected eutrophication status (JAMP product EA-5), EUC(2) 2005 had agreed to delay the assessment until 2008 and to carry out further intersessional work (EUC(2) 2005 Summary Record - EUC(2) 05/10/1, Annex 8) in which priority should be given to activities:
a. aiming at improved model performance and activities which are essential for a robust prediction of the eutrophication status o f the OSPAR maritime area following nutrient reductions;
b. directly supporting the delivery o f JAMP product EA-5 as part o f the preparation and the carrying out o f a second eutrophication modelling workshop;
c. initiating work on modelling transboundary nutrient fluxes.
3. OSPAR 2006 endorsed the arrangements agreed by EUC(2) 2005 for further intersessional work on eutrophication modelling and agreed that an OSPAR workshop should be held in spring 2007 to assist the delivery o f JAMP product EA-5 by OSPAR 2008. Detailed terms of reference for this workshop should be prepared by the ICG EMO and adopted by EUC 2006.
4. Based on these arrangements, this document sets out the terms of reference for an OSPAR workshop on eutrophication modelling, and for related intersessional preparatory work. The workshop is hosted by the United Kingdom at the Cefas Lowestoft Laboratory, Lowestoft (UK) on [7 - 10 May 2007]1. It is convened by Dr David Mills (UK) (contact for nutrient reduction scenarios), assisted by Dr Alain Menesguen (France), Dr Hanneke Baretta-Bekker (Netherlands) (contact for tranboundary transport fluxes) and Dr Herman Lenhart (Germany) (contact for workshop data).
1. Objectives
5. The objective of intersessional work is to prepare and hold a workshop on eutrophication modelling which will prepare
a. nutrient reduction scenarios showing the predicted consequences for selected eutrophication assessment parameters in problem areas if nutrient reduction was achieved by 50% and 70%, or any other voluntary reduction scenarios predicting the reduction required for eutrophication effect parameters to be at or below the relevant assessment levels o f the Common Procedure;
b. specifications for OSPAR model applications o f a step-wise comparison o f model results and for validation with data;
c. specifications for the application o f models for transboundary nutrient fluxes in the context o f the eutrophication assessment under the Common Procedure, taking into account any recent or forthcoming results from calculating transboundary fluxes, and a Work Programme for such work giving priority, in a first phase, to calculating nutrient budgets for defined areas.
7 Date is subject to confirmation.25
Workshop Report Annex 3

2nd OSPAR Workshop on Eutrophication Modelling 10-12 September 2007
6. In preparing specifications for these activities (for example on target areas or reference years), ICG EMO should give consideration to the assessment needs under the JAMP, in particular under the Common Procedure and for the QSR 2010, with a view to exploring how future results o f intersessional work on transboundary nutrient transport could possibly inform these assessments.
7. Participants to the workshop will be asked to prepare a nutrient reduction scenario. The planning group will aim to ensure that all target areas defined following the first application o f the OSPAR Comprehensive Procedure are covered by reduction scenarios for the purpose o f JAMP product EA-5.
2. Nutrient reduction scenarios
8. The objective o f the preparatory work is to address limitations in nutrient reduction scenarios experienced at the 2005 Hamburg workshop through activities designed to improve the quality o f model results which are essential for a more robust prediction o f the status o f eutrophication parameters following nutrient reductions. The planning group will prepare data sets for consistent use by participants comprising data sets for boundary and forcing conditions and instructions on their use. These include:
(i) one set o f boundary conditions for all models extracted from a shelf-wide model; the different sensitivity o f models to boundary conditions would need to be addressed in the presentation o f the model results;
(ii) quality assured extended river discharge and nutrient load data compiled by the Institut fü r Meereskunde, University o f Hamburg, from recognised sources being as compatible as possible with RID data held by OSPAR;
(iii) atmospheric deposition data from EMEP (including, as appropriate, EMEP data on nutrient deposition in the OSPAR maritime area which are forthcoming under the cooperation programme with OSPAR in 2007);
(iv) meteorological data for example from the European Centre for Medium-Range Weather Forecasts (ECMWF).
9. A separate user guide describing the procedure for model applications will be provided that will include the following items:
a. data sets for calibration and validation will be generated from NERC North Sea Project data set, from the Dutch database (http ://www.waterbase ,nl). and from additional sources such as from research programmes. Formats for the model comparison will be specified;
b. definitions for target areas in form of adjacent boxes. Overlapping model domains will allow comparison o f model results o f nutrient reductions;
c. specification for calibration and validation. Calibrated models should only be used. Where calibration has not already been carried out, data for years 1988/89 are provided. Validation is a requirement with data provided for the year 2002;
d the year 1985 is used for nutrient reduction scenarios based on 50% and 70% nutrient reductionsin order to determine the effects on selected harmonised assessment parameters under the Common Procedure;
e. a spin-up procedure is required in order to allow the model to reach a steady state;
f. detailed description o f the required output format together with an example output and example post-processing routines used to generate the example output;
g. use of the same calculation for cost-functions as applied at the ASMO workshop "Modelling of Eutrophication Issues'’ held in The Hague on 5-8 November 1996;
h. initial specifications for a step-wise comparison o f model results and validation with data;
Workshop Report
26
Annex 3

2nd OSPAR Workshop on Eutrophication Modelling 10-12 September 2007
10. The workshop will carry out the following tasks:
a. to report the results o f the reduction scenarios for 1985 in the form of tables showing percentage differences compared to the reference year, with a view to facilitating easier and more effective comparison for the different models;
b. to compare and explain differences between model results and, for 2002, between model resultsand measured data, and to report on the reliability of model predictions o f the consequences of nutrient reduction scenarios taking into account changes to the procedure for model application;
c. to evaluate the results and report the conclusions that can be drawn from modelling theconsequences o f the nutrient reduction scenarios;
d. to report on a comparison between new work carried out by the ICG EMO and previous workcarried out and reported in the 1996 ASMO workshop and the 2005 Hamburg workshop;
e. to prepare specifications for OSPAR model applications of a step-wise comparison o f modelresults and validation with data.
3. Work Programme on transboundary nutrient transport11. The purpose o f JAMP product EA-7 is described by the JAMP implementation plan to develop models showing a quantitative relationship between inputs into the maritime area, transboundary fluxes within areas o f the maritime area and their eutrophication effects in order to provide the necessary understanding of the outcome to possible reduction scenarios.
12. The Common Procedure recognises that despite large anthropogenic nutrient inputs and high nutrientconcentrations, an area may exhibit few if any direct and/or indirect effects. There is, however, a risk, that nutrient inputs may be transferred to adjacent areas where they can cause detrimental environmental effects and Contracting Parties should recognise that they may contribute significantly to so-called “transboundary affected” problem areas and potential problem areas with regard to eutrophication outside their national jurisdiction.
13. OSPAR work on transboundary nutrient transport will therefore need to address the issues in thefollowing prioritised list:
a. nutrient fluxes between areas within the OSPAR maritime area and the calculation o f related nutrient budgets;
b. quantifying the relative contributions o f the various nutrient sources, with their natural and anthropogenic fractions, to transboundary transport and the consequences for the eutrophication status;
c. tracking nutrients back to source.
14. In doing so, the workshop should look at examples o f applications o f available models (for example that o f the Bundesamt fü r Seeschiffahrt und Hydrographie (BSH)) to inform the discussion.
15. The objective o f the intersessional work is to prepare the necessary material for detailed discussions at the workshop on specifications o f model applications for transboundary nutrient transport in the context of the eutrophication assessment under the Common Procedure and a related Work Programme (products C l and C2 of the Terms o f Reference for eutrophication modelling - EUC(2) 2005 Summary Record, Annex 8). The planning group will identify specific locations o f boxes (target areas) within maritime areas. Participants with models capable o f calculating transboundary fluxes are invited to present these, as far as possible, and the results o f their application to the workshop.
16. The workshop will prepare a Work Programme for work on transboundary nutrient transport described in § 13 above with a focus on delivering, with the assistance o f a workshop if necessary, calculations o f nutrient budgets for a number o f defined target areas in 2007/2008. To this end, the workshop will carry out the following tasks:
a. agree a working definition for transboundary nutrient transport;
b. agree an approach to identify locations for estimation o f transport flows (transects alongmaritime boundaries) and determine a suite o f adjacent target areas (for example adjacent areasSkagerrak/German Bight, France/Belgium and UK/Netherlands);
27
Workshop Report Annex 3
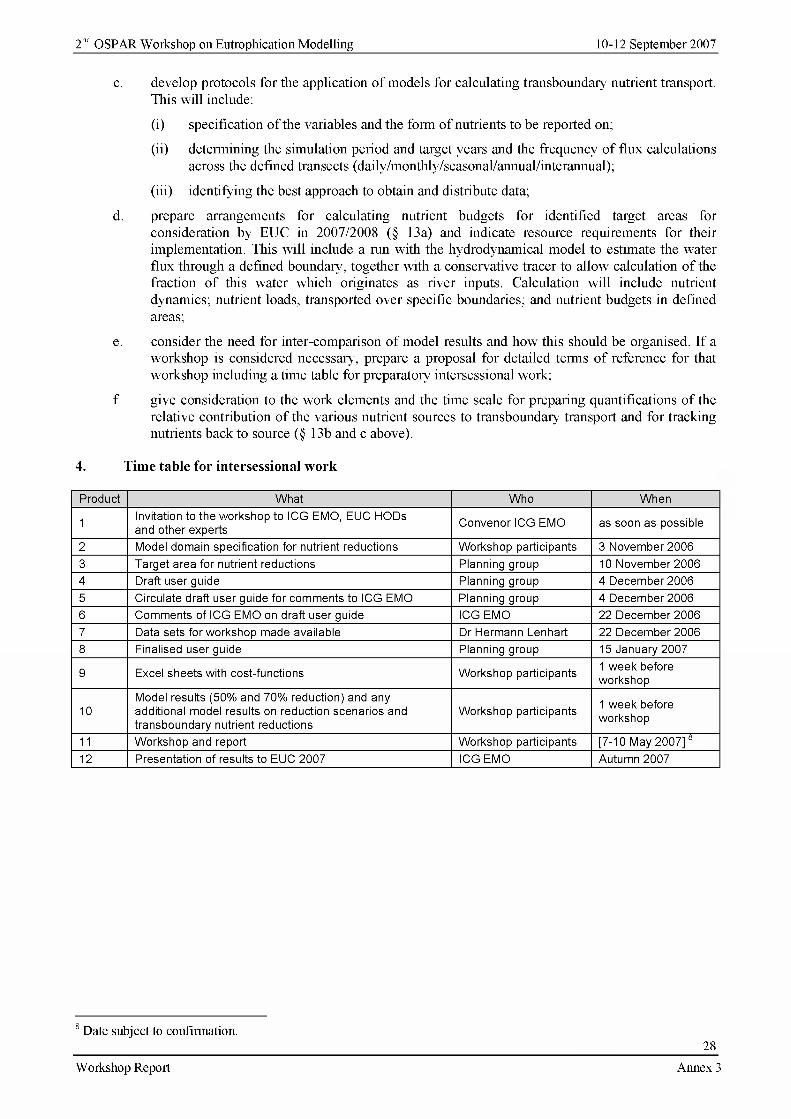
2nd OSPAR Workshop on Eutrophication Modelling 10-12 September 2007
c. develop protocols for the application o f models for calculating transboundary nutrient transport. This will include:
(i) specification o f the variables and the form of nutrients to be reported on;
(ii) determining the simulation period and target years and the frequency o f flux calculations across the defined transects (daily/monthly/seasonal/annual/interannual);
(iii) identifying the best approach to obtain and distribute data;
d. prepare arrangements for calculating nutrient budgets for identified target areas for consideration by EUC in 2007/2008 (§ 13a) and indicate resource requirements for their implementation. This will include a run with the hydrodynamical model to estimate the water flux through a defined boundary, together with a conservative tracer to allow calculation o f the fraction o f this water which originates as river inputs. Calculation will include nutrient dynamics; nutrient loads, transported over specific boundaries; and nutrient budgets in defined areas;
e. consider the need for inter-comparison o f model results and how this should be organised. If a workshop is considered necessary, prepare a proposal for detailed terms o f reference for that workshop including a time table for preparatory intersessional work;
f. give consideration to the work elements and the time scale for preparing quantifications o f the relative contribution o f the various nutrient sources to transboundary transport and for tracking nutrients back to source (§ 13b and c above).
4. Time table for intersessional work
Product W hat W ho W hen
1Invitation to the workshop to ICG EMO, EUC HODs and other experts
Convenor ICG EMO as soon as possible
2 Model domain specification for nutrient reductions W orkshop participants 3 Novem ber 2006
3 Target area fo r nutrient reductions Planning group 10 Novem ber 20064 Draft user guide Planning group 4 Decem ber 2006
5 Circulate draft user guide fo r com m ents to ICG EMO Planning group 4 Decem ber 20066 Com m ents of ICG EMO on draft user guide ICG EMO 22 Decem ber 2006
7 Data sets for w orkshop made available Dr Hermann Lenhart 22 Decem ber 2006
8 Finalised user guide Planning group 15 January 2007
9 Excel sheets w ith cost-functions W orkshop participants 1 w eek before workshop
10Model results (50% and 70% reduction) and any additional model results on reduction scenarios and transboundary nutrient reductions
W orkshop participants 1 w eek before workshop
11 W orkshop and report W orkshop participants [7-10 May 2007] 8
12 Presentation o f results to EUC 2007 ICG EMO Autum n 2007
8 Date subject to confinnation.28
Workshop Report Annex 3

2nd OSPAR Workshop on Eutrophication Modelling 10-12 September 2007
A N N EX 4 (Ref. 3.43)
Draft assessment of the predicted environmental consequences for problem areas following nutrient reductions
1. Introduction...................................................................................................................................................302. M ethods......................................................................................................................................................... 31
2.1 River loads.................................................................................................................................................... 312.2 Spin-uptim e.................................................................................................................................................. 332.3 Boundary condition...................................................................................................................................... 342.4 Meteorological Forcing............................................................................................................................... 342.5 Atmospheric N-deposition..........................................................................................................................342.6 Suspended particulate matter (SPM)......................................................................................................... 342.7 Target areas................................................................................................................................................... 342.8 Validation data ..............................................................................................................................................34
3. Model performance.......................................................................................................................................353.1 Calibration and validation...........................................................................................................................353.2 Cost functions...............................................................................................................................................36
4. Reduction scenarios..................................................................................................................................... 394.1 German offshore target area: G -0 2 ........................................................................................................... 414.2 Netherlands offshore area: N L -0 2 ............................................................................................................ 434.3 Netherlands coastal waters: N L -C 2 .......................................................................................................... 454.4 Netherlands coastal waters: N L -C 3 .......................................................................................................... 474.5 German coastal waters: G - C l .................................................................................................................... 494.6 UK coastal waters: UK-C1..........................................................................................................................514.7 Summary........................................................................................................................................................53
5. Discussion...................................................................................................................................................... 536. Conclusions...................................................................................................................................................557. Recommendations........................................................................................................................................558. Acknowledgements..................................................................................................................................... 559. References.....................................................................................................................................................56
Appendix 1 Overview o f models used in the reduction scenarios................................................................... 57Appendix 2 Scoring tables o f target area assessments in the format o f the Common Procedure............... 60
Workshop Report
29
Annex 4

2nd OSPAR Workshop on Eutrophication Modelling 10-12 September 2007
1. Introduction1. This report presents the results of nutrient reduction scenarios for the North Sea to provide an insight in the response o f selected eutrophication assessment parameters to the reduction o f nutrient loads to the marine environment. The purpose o f this assessment is to assist delivery under the 2003 Strategy for a Joint Assessment and Monitoring Programme (JAMP) of an assessment o f the expected eutrophication status o f the OSPAR maritime area following the implementation o f agreed measures (JAMP product EA-5).
1.1 Policy context
2. The objective o f the revised 2003 OSPAR Eutrophication Strategy is to combat eutrophication in the OSPAR maritime area, in order to achieve and maintain, by 2010, a healthy marine environment where eutrophication does not occur.
3. The 2003 Eutrophication Strategy builds on long-standing work o f OSPAR on eutrophication. This includes the commitment of Contracting Parties to achieve a substantial reduction at source, in the order of 50% compared to 1985, in inputs o f phosphorus and nitrogen into areas where these inputs are likely, directly or indirectly, to cause pollution (PARCOM Recommendation 88/2). To assist Contracting Parties in identifying those areas in a consistent way, OSPAR adopted the Common Procedure for the Identification of the Eutrophication Status o f the OSPAR Maritime Area (the "Common Procedure”) in order to characterise marine areas in terms o f problem areas, potential problem areas and non-problem areas with regard to eutrophication. A first application o f the Common Procedure was finalised in 2002 resulting in the 2003 OSPAR integrated report on the eutrophication status o f the OSPAR maritime area (OSPAR publication 189/2003). In 2007, Contracting Parties had been invited to report their results o f the second application o f the Comprehensive Procedure o f the Common Procedure to OSPAR to contribute to a second integrated report for adoption by OSPAR 2008.
4. By 2003, Contracting Parties had not yet achieved the 50% reduction target for nitrogen. The purpose o f the nutrient reduction scenarios under the 2003 JAMP is to assist evaluation o f the effectiveness o f this measure on the quality o f the marine environment and to provide indication o f progress towards achieving the objectives agreed under the Eutrophication Strategy.
1.2 OSPAR work on eutrophication modelling
5. A first assessment o f the expected eutrophication status o f the OSPAR maritime area following implementation o f agreed measures was carried out by OSPAR in 2001 (OSPAR publication 140/2001). That assessment built on the results o f a 1996 OSPAR workshop which already showed good performance o f the various models with regard to hindcast.
6. To assist the delivery o f JAMP product EA-5, an OSPAR workshop was held in Hamburg in September 2005 to produce an assessment in the format o f the Common Procedure (tables, maps and text) showing the predicted environmental consequences for problem areas if the 50% nutrient reduction target was achieved and, where this does not indicate non-problem area status, to predict the reduction target needed to achieve non-problem area status. The results o f this workshop are available from the Cefas homepage (http : //www. cefas ,co .uk/eutmod).
7. The 2005 workshop built on the previous 1996 workshop experience, the results o f the EU funded project on European catchment, catchment changes and their impact on the coast (EUROCAT) and on intersessional work to provide the necessary specification for an intercomparison exercise of model applications in nutrient reduction scenarios. The workshop identified a number o f issues to improve confidence in model results.
8. This work resulted in an interim report on the use o f eutrophication modelling for predicting expected eutrophication status o f the OSPAR maritime area following the implementation o f agreed measures (OSPAR publication 286/2006) which informs about progress achieved in using models in a eutrophication assessment context. OSPAR agreed that further intersessional work should be carried out to prepare a second OSPAR workshop in September 2007 to assist the preparation for OSPAR 2008 of an assessment o f the expected eutrophication status o f the OSPAR maritime area following agreed measures.
Workshop Report
30_
Annex 4

2nd OSPAR Workshop on Eutrophication Modelling 10-12 September 2007
I.3 2007 OSPAR workshop
9. Following intersessional work to address limitations to model performance identified at the 2005 workshop, the task of the 2007 OSPAR workshop was:
a. to report the results o f the reduction scenarios for 1985 in the form of tables showing percentagedifferences compared to the reference year, with a view to facilitating easier and more effective comparison for the different models;
b. to compare and explain differences between model results and, for 2002 , between model resultsand measured data, and to report on the reliability o f model predictions o f the consequences of nutrient reduction scenarios taking into account changes to the procedure for model application;
c. to evaluate the results and report the conclusions that can be drawn from modelling theconsequences o f the nutrient reduction scenarios;
d. to report on a comparison between new work carried out by the ICG EMO and previous workcarried out and reported in the 1996 ASMO workshop and the 2005 Hamburg workshop;
e. to prepare specifications for OSPAR model applications o f a step-wise comparison o f modelresults and validation with data.
10. These results are reported in this assessment. The full report from the workshop is available on theCefas website http : //www. cefas ,co .uk/eutmod.
2. MethodsII . A full description o f the methods and data used in the workshop is set out in a User Guide and DataDescription.
12. These documents implement the tasks identified by OSPAR to enhance performance o f modelapplications and the comparability o f their results. This includes:
a. the use o f a common set of river load data;
b. specification for a recommended three-year spin-up o f models for the year 2002 ;
c. the provision o f common boundary condition provided from the model POLCOMS-ERSEM;
d. the use o f the ERA operational data from ECMWF as meteorological forcing, and;
e. the use o f the EMEP monthly data for atmospheric nitrogen deposition.
13. The forcing data compiled for common use in the model applications are available on the ftp site of the University o f Hamburg ftp ://ftp .ifm .uni-hamburg .de/outgoing/lenhart/OSPAR/.
14. The workshop reviewed the methods and data used with a view to evaluating their fitness-for-purposein the light o f experience obtained and to identify any additional issues on conditions for model applications that would need to be addressed in future.
2.1 River loads
15. The reference year for the reduction target set in PARCOM Recommendation 88/2 is 1985. Novalidation data were available for that year so that it could not be used in the model application. Instead, the 50% and 70% reduction scenarios were carried out for the year 2002 but taking into account the nutrient load reductions that had already been achieved by Contracting Parties in the period 1985 - 2002. To this end, the available river load data were grouped by country to estimate regionally differing reduction percentages.
16. The time series o f annual loads for the countries are presented in Figures 2.1 and 2.2 for ToxN and PO4 (NH4 is not presented here). While TOxN (NO3+NO2) displays considerable interannual variability, P 0 4 has less variability and for most countries a clear reduction signal. The variability in data is caused by interannual variability in river discharges, data availability and changes in monitoring practice.
Workshop Report
31_Annex 4

2nd OSPAR Workshop on Eutrophication Modelling 10-12 September 2007
P 04 annual loads
3.5
2.5
0.5
1975 1980 1985 1990 1995 2000 2005time
Figure 2.1. Available annual river loads of P 0 4, cumulative by country. Data for Norway prior to 2001 and for Ireland were absent and taken as zero.
X 10 TOxN annual loads6
5
1
0'— 1975 1980 1985 1990 1995 2000 2005
time
Figure 2.2. Available annual river loads of TOxN (N 03+N 02), cumulative by country. Low values for the Netherlands in the mid 1990s are related to missing data. Data for Norway prior to 2001 and for Ireland were absent and taken as zero.
17. Given the interannual variability and minor apparent changes o f TOxN (NCL+NCL). 2002 and 1985 loads were considered as equal (no change). For P 0 4 and NH4 proportional reductions were calculated as follows:
a. percentage change calculated between 1985 and 2002;
b. rounded to nearest 10% interval to account for variability (uncertainty);
c. only the countries with major rivers for which sufficient data was available were taken into account.
18. The so calculated reductions for 2002 are presented in Table 2.1. Where the reduction target o f 50%was already met in 2002 , the corresponding additional reduction for this scenario was set to zero.
Workshop Report
32_
Annex 4

2nd OSPAR Workshop on Eutrophication Modelling 10-12 September 2007
Table 2.1: Reductions in nitrogen and phosphorus loads achieved by Contracting Parties for target areas in their waters in the period 1985 - 2002 and resulting % reduction to be applied for the year 2002 to achieve a 50% and 70% reduction scenario for nitrogen and phosphorus.
Contracting Party T O xN (%) NH4 (%) PO4 (%)
Reductions achieved between 1985 and 2002Netherlands 0 70 70Germ any 0 90 50UK 0 2 0 0France 0 10 60
Reductions of 2002 national loads necessary to achieve 50% reduction compared to 1985Netherlands 50 0 0Germ any 50 0 0UK 50 40 50France 50 40 0
Reductions of 2002 loads necessary to achieve 70% reduction compared tO 1985Netherlands 70 0 0Germ any 70 0 40UK 70 60 70France 70 70 2 0
19. Since no load reduction was prescribed for the organic part o f the load, a point for discussion at the workshop was how the organic load should be reduced in relation to the lowering o f the prescribed inorganic loads. First it was considered that organic load comprises o f the organic matter which is degradable within a reasonable time-scale and the refractory part, but that only the degradable part is relevant. The common feeling among the group was that the organic load is negligible and even that potential shortfalls in organically derived nutrients might be compensated for by the models. Only in local areas, such as shallow areas like the Wadden Sea or Lake Ijssel or deposition areas, may the organic load become an important factor, but this does not hold for the selected target areas. The argument was brought forward that measurements tend to underestimate the particulate load o f rivers since they are flow dependent and that the organic load is mainly found in the bedload. The general view o f the group was that estuary models were needed to better understand these processes. However, studies o f the Humber estuary showed within an UK project (LOIS) that, using a catchment, estuarine and coastal model, models were unable to reconstruct the organic load. Taking into account the differences between the estuaries which are too variable to allow for a generalized conclusion, one way to address this problem would be to carry out sensitivity analysis to identify the importance o f the organic load and determine the required complexity o f the ecosystem model (e.g. the incorporation o f Zooplankton or bacteria). The general conclusion so far from the group was that organic degradable load seems to be negligible and does not bias the model results.
2.2 Spin-up tim e
20. The participants had been asked to run their models repeatedly for one year for a sufficient number o f years (with a minimum of 3 years) to achieve a repeating seasonal cycle. The year 2002 using 2002 nutrient inputs and boundary conditions was suggested to be repeated 3 times in order to reach a repeating annual cycle indicating that the model is in equilibrium. The end state o f this spin-up should be used as a starting condition for the reference (or standard) year 2002 and all reduction scenarios.
21. In the discussion it was pointed out that more complex models, e.g. with detailed benthic modules, as well as model applications in deeper waters needed more spin-up time than the proposed 3 years. The experience with the use o f longer spin-up times in comparison to the Hamburg workshop resulted in a larger reduction in the N/P ratios. In order to demonstrate that a "stable equilibrium'’ had been reached the results for a number o f relevant variables should show that the simulated time series converged.
22. For the purpose o f validating the standard run it would be desirable in future to do the spin up for the years previous to the standard run for 2002, otherwise the comparison with January/February observations are biased. Forcing data are currently available for 2001 and 2002 while future spin-ups with a series of years will be restricted to availability o f data and resources for aggregation o f common forcing data for application.
33
Workshop Report Annex 4

2nd OSPAR Workshop on Eutrophication Modelling 10-12 September 2007
23. Finally, the participants were convinced that the spin-ups applied for the individual models were carried out successfully to reach a “stable equilibrium”, either by applying longer spin-up times for more complex models or, in shallower coastal areas, by using the proposed 3 years. The spin-up procedure using the year 2002 was accepted to be suitable for reaching a balance between river loads and the system and provided a reliable basis for the simulation. Prolonging the spin-up for a series o f years would achieve a further robustness to enhance the model capability to reproduce interannual variability, however, differences in the model results to the proposed adjustments o f the spin-up procedure would only be in minor details.
2.3 B oundary condition
24. In order to achieve a consistent set of boundary data for all model application as suggested by the last workshop, the only feasible approach was to extract these data from a wider area model whose domain covered the spatial extent o f all the other models. Therefore, the boundary data were provided by AMM POLCOMS-ERSEM model runs for 51 pelagic parameters for each boundary location o f the different national models (Belgium, France, Germany, the Netherlands, Norway, Portugal and the UK (Cefas and POL)). In addition, 12 benthic parameters for the initialisation fields were made available. This consistent dataset was not only provided for the standard run but also for both reduction runs on a daily basis for the year 2002.
2.4 M eteorological Forcing
25. To ensure consistency with the boundary conditions, the same meteorological forcing data used by POL (ECMWF ERA 40 operational data for the years 2001 and 2002) were supplied, with the kind permission o f ECMWF, to workshop participants for use in their simulations.
2.5 A tm ospheric N -deposition
26. The data fields for the atmospheric nitrogen deposition were provided by EMEP (CooperativeProgramme for Monitoring and Evaluation o f the Long-range Transmission o f Air Pollutants in Europe) on a monthly basis for the years 2001 and 2002. The variables provided included: dry deposition o f oxidized nitrogen (NOx); wet deposition o f oxidized nitrogen (NOx); dry deposition o f reduced nitrogen (NEE); and wet deposition o f reduced nitrogen (NEE).
2.6 Suspended particulate m atter (SPM )
27. Difficulties were reported by the participants in forcing the models with SPM data in order toachieve reliable light attenuation especially for the coastal region. Since observations were not fit for purpose, different methods were used for SPM forcing o f the national model applications. It was observed that while satellite imagery carried uncertainties due to cloud conditions, model based SPM concentrations were limited due to the size o f the area over which SPM was computed. There is a need to look further into the best way of resolving this issue e.g. by combining the best features o f satellite imagery (i.e. the gradients and spatial extent) with in-situ observations or by using simple SPM model routines that could be shared by all participants.
2.7 Target areas28. One important change in procedure since the 2005 workshop is the choice o f a new set o f target areas. These areas roughly correspond to the target areas used in the previous workshop in terms o f their location and in their definition as coastal and offshore boxes. However, their shapes have been significantly modified in anticipation o f the subsequent work on transboundary nutrient transport. Most o f the target areas correspond to areas classified as a Problem Area in German and Dutch maritime waters following the first application o f the OSPAR Common Procedure. One UK non-problem area has been added. The workshop also agreed arrangements for preparing reduction scenarios for two additional target areas covering the Belgian continental shelf and the French coastal waters and for updating this draft assessment with the additional model results.
2.8 V alidation data
29. For validation the year 2002 was chosen as it is the year in which the first application o f the OSPARCommon Procedure was carried out and it is also the standard year for this modelling workshop. A data set to validate the models was provided. In contrast to the first workshop the raw data were made available in a
34
Workshop Report Annex 4

2nd OSPAR Workshop on Eutrophication Modelling 10-12 September 2007
common format for the target areas. For the six target areas an excel spreadsheet was set up to enable the participants to calculate cost functions that had to be used for the validation. This enabled more rigorous comparison o f model performance in order to gauge the uncertainty in model results.
3. Model performance30. Details o f all the models used at the workshop are given in table format at Appendix 1. The technical details presented can provide the further information necessary to appreciate the model results.
3.1 C alibration and validation
31. The calibration procedures adopted by participants are described in the national reports. Details ofthe validation are given in the full reports for each application available on the Cefas website (Eutmod).
32. Data from all kind o f sources have been used for validation. Details on the data are given in the DataDescription. In Figure 3.1 the spatial distribution o f all sample locations are given. For each target area and each variable data from 0 - 15 m deep are combined in surface data, while the deeper samples are combined in bottom samples. Monthly means have been calculated per variable and per target area.
65
60
55
50
-10 ■5 0 5 10 15
Figure 3.1 Spatial distribution of sampling locations from which 2002 data for validation were generated.
33. As can be seen from Table 3.1 the standard deviations for some of the assessment variables are very large, especially in two of the coastal boxes. A possible explanation can be the heterogeneity o f these areas concerning salinities and subsequently nutrient concentrations. In Table 3.2 also the ranges o f the monthly salinities are given. For the areas NL-C3 and G-Cl the ranges are well below salinity 30, indicating an overrepresentation o f low-salinity samples which can also be traced back to the sampling stations in Figure 3.1.
Workshop Report
35_
Annex 4

2nd OSPAR Workshop on Eutrophication Modelling 10-12 September 2007
Table 3.1: Observation data for validation of model results in the target boxes giving the mean value (mean), the standard deviation (std) and the number of observations (n) for 2002. The salinities of the data of the areas NL-C3 and G-Cl were very low, which explains (partly) the high nutrient values.
Targetareas
Winter DIN (pmol/l) Winter DIP (pmol/l) Summer chlorophyll a (pg/l)
02minimum
(mg/l)
Salinity in January and February
mean std n mean std* n mean std* n mean std* n Range**UKC1 40.6 21.4 85 1.9 124 7.9 257 5.27 33.5 318 3 3 .0 -3 3 .8NLC2 51.6 11.7 8 1 .0 8 11.55 61 6.93 31.9 36 3 0 .7 -3 1 .9NLC3 84.9 56.5 28 1.3 28 4.9 46 6.7 24.2 27 2 3 .6 -2 4 .7NL0 2 3.1 0 .8 3 0.5 3 0.59 171 7.49 32.1 2 0 1 32.1 -3 2 .1GC1 127.0 124.7 29 1.4 29 1.87 6 4.61 27.6 124 2 3 .7 -2 8 .9G 0 2 8 .2 3.6 6 0.56 6 0.64 40 5.48 34.4 8 6 3 4 .3 - 3 4 .4
* Note: the table will be updated with the values fo r the standard deviations after 1 November 2007.** Note: This is the range o f the monthly means, so the actual range will be larger. The table will be updated after 1 November 2007.
34. There were some generic findings from the validation. In general the models perform better in the offshore areas than in the coastal areas. Winter DIN and DIP (defined as mean January and February concentrations) at the surface are in the range o f observations or slightly overestimated, while the mean growing season chlorophyll concentrations are overestimated in the offshore areas. All models underestimated winter DIN at the surface and mean growing season chlorophyll coastal concentrations for coastal target areas. Winter DIP is also underestimated in the coastal areas, but to a much lesser extent than winter DIN.
35. Four o f the six models (Germany, Netherlands, UK-Cefas and UK-POL) were three-dimensional and provided nutrient concentrations at the surface as well as at the bottom. In most models the differences between surface concentrations and bottom concentrations were zero or negligible. Only the German model gave differences between surface and bottom nutrient concentrations, which were in the range o f -7 to +30%. A comparison with measurements has not been made.
36. One possible explanation for the discrepancy in coastal target areas was cited by a number of participants as due to the heterogeneity o f these areas that encompass salinities from 30-34.5. The large standard deviations observed in the monitored winter DIN concentrations give credibility to this view (Table 3.1). There was also some misunderstanding o f the participants o f the guidance provided such that data associated with salinities outside o f the appropriate range for a specific water body type (coastal or offshore) may have been included in calculations. There are also some suggestions from the presenters. Dr Lacroix noted that their model results were sensitive to the spatial dimensions o f the target area. Nevertheless, these validation results were not fully understood and further work is required to establish the reasons for these systematic differences and whether these are specific to each model or result from externally imposed conditions.
3.2 C ost functions37. To quantify the difference between model results and measurement data we have made use o f the cost function as described in Villars & de Vries (1998). The cost function is a mathematical function and gives a non-dimensional number which is indicative o f the correspondence between two sets o f data. This method makes also comparison between results o f different models possible.
38. For each target area and each variable the participants calculated monthly means o f their model results. The monthly means are compared with monthly means of measurements o f that variable and in that target area. The outcome of these monthly cost functions can be positive (over-estimation) or negative (underestimation). A value zero means that the model results are exactly equal to the measurements. The absolute value depends critically on the standard deviation o f the observations. Figure 3.2 shows an example o f the performance o f three models in the target area NL-C2 for the parameters included in the cost function.
Workshop Report
36_
Annex 4

2nd OSPAR Workshop on Eutrophication Modelling 10-12 September 2007
N L C 2 T em p
NL ♦ — U K -C ef - - - X - - - UK-POL
NLC2 Sal
0.5
-0.5
NL -■ -•■ --U K -C e f — X- — UK-POL
NLC2 Din
14
12
10864
2
0■2■4
■6
X-
■8
-4— NL -■■ •■-■ UK-Cef -----9 ----- DE — X -— UK-POL
NLC2 DIP
50
40
30
20
10
— -X— X-0
-10
NL - - - - - - -U K -C e f — e DE — X — UK-POL
Figure 3.2. Monthly cost functions for temperature ("C), salinity, DIN, DIP, chlorophyll, and SPM for four models (Gennany, the Netherlands, UK-Cefas and UK-POL) in target area NL-C2. No validation data were available for cost functions for temperature, salinity and SPM from Gennany, and for SPM from UK-POL. [Note: The graphs will be updated following completion o f the review o f UK-POL model results.]
Workshop Report
37_
Annex 4

2nd OSPAR Workshop on Eutrophication Modelling 10-12 September 2007
39. An annual mean has been calculated from the absolute values o f the monthly means. For a number o f variables in each o f the target areas the annual mean cost functions according to four o f the models are given in Figure 3.3. For the performance o f a model, Radach and Moll (2006) defined four classes for the values o f the cost function: 0-1: excellent; 1-2: good; 2-3: reasonable and values >3: poor.
UKC1 NLC28
6
4
2
0
20
15
10
5
uUKc BE NL DE
NLC3
I IIn n n IL Iríll. BnUKc BE NL DE
GC120
15
10
5
0 i IM
4
3
11 LUKc BE NL DE
NL02
UKc BE NL DE
25
20
15
10
5
0
60
40
20
0
M nUKc BE NL DE
G02
UKc BE NL DE
Tem perature Salinity
j DIN IP04 Chia 02 SPMRadach & Moll (2006)
Figure 3.3: Annual mean cost functions for the models presented by, UK/Cefas (UKc), Belgium, the Netherlands and Gennany for each target areas. The red line indicates the boundary between reasonable and poor according to Radach & Moll (2006). [Note: The graphs will be updated with UK-POL model results, following completion o f their review.]
Workshop Report
38_
Annex 4
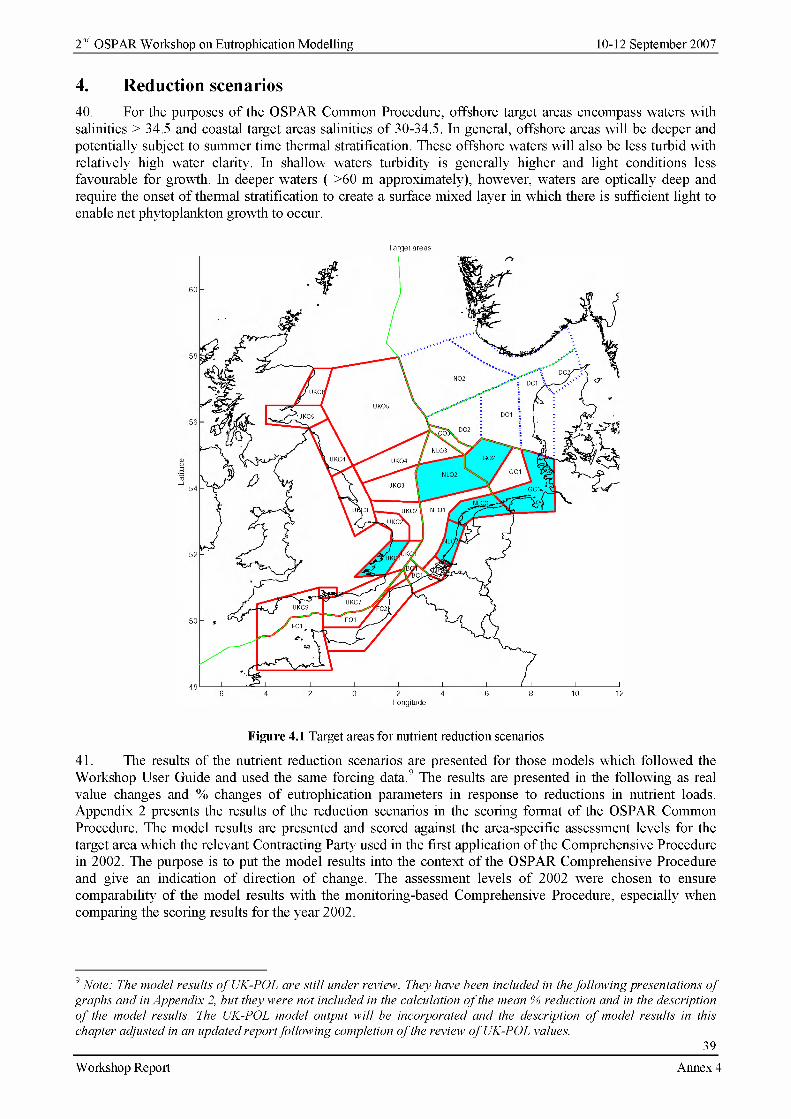
2nd OSPAR Workshop on Eutrophication Modelling 10-12 September 2007
4. Reduction scenarios40. For the purposes o f the OSPAR Common Procedure, offshore target areas encompass waters withsalinities > 34.5 and coastal target areas salinities o f 30-34.5. In general, offshore areas will be deeper and potentially subject to summer time thermal stratification. These offshore waters will also be less turbid with relatively high water clarity. In shallow waters turbidity is generally higher and light conditions less favourable for growth. In deeper waters ( >60 m approximately), however, waters are optically deep and require the onset o f thermal stratification to create a surface mixed layer in which there is sufficient light to enable net phytoplankton growth to occur.
Target areas
60
58
<T
56
0)"D3
54
52
50
48
Longitude
Figure 4.1 Target areas for nutrient reduction scenarios
41. The results of the nutrient reduction scenarios are presented for those models which followed the Workshop User Guide and used the same forcing data.9 The results are presented in the following as real value changes and % changes o f eutrophication parameters in response to reductions in nutrient loads. Appendix 2 presents the results o f the reduction scenarios in the scoring format o f the OSPAR Common Procedure. The model results are presented and scored against the area-specific assessment levels for the target area which the relevant Contracting Party used in the first application o f the Comprehensive Procedure in 2002. The purpose is to put the model results into the context o f the OSPAR Comprehensive Procedure and give an indication o f direction o f change. The assessment levels o f 2002 were chosen to ensure comparability o f the model results with the monitoring-based Comprehensive Procedure, especially when comparing the scoring results for the year 2002.
9 Note: The model results o f UK-POL are still under review. They have been included in the following presentations o f graphs and in Appendix 2, but they were not included in the calculation o f the mean % reduction and in the description o f the model results. The UK-POL model output will be incorporated and the description o f model results in this chapter adjusted in an updated report following completion o f the review o f UK-POL values.
39
Workshop Report Annex 4

2nd OSPAR Workshop on Eutrophication Modelling 10-12 September 2007
42. For each o f the target areas two sets o f figures are presented. The first set presents a summary of the % reduction achieved in selected assessment variables for the two (50% and 70%) reduction scenarios and include a mean % reduction derived from all o f the model results available for that variable and target area. The first set o f figures (e.g. Figure 4.1), termed response plots, enables more ready comparison between models in terms o f sensitivity and the robustness o f conclusions drawn from the nutrient reduction scenarios. Calculation o f the % reduction is carried out in the following manner:
For a given model the concentration o f the simulated assessment variable in the 50% and 70% reduction scenario is converted to a percentage where the standard run (for the year 2002 without reduction in riverine nutrients) is regarded as representing the 100% value. This calculation is carried out for each target area, for each model and the results presented separately for winter DIN, winter DIP, mean chlorophyll and minimum dissolved oxygen concentration.
43. The second set of figures (e.g. Figure 4.2) presents the results o f reduction scenarios in terms of concentrations for each o f the assessment variables for all o f the models for each target area. This second set o f figures makes it possible to better judge the differences between model results based on simulated concentrations.
44. The new steps introduced into the procedures for this work on testing nutrient reduction scenarios have increased comparability between model results. In particular, the specification o f a minimum spin-up of 3 years (a number o f participants used a larger number o f years), shared boundary conditions and improvements in forcing data all contributed to the increase in comparability and in confidence in the individual model application.
45. With regard to OSPAR requirements there is a need to indicate a level o f confidence in the outcome to nutrient reduction scenarios. Therefore, a tentative assessment of confidence is made based upon the following criteria:
Criteria 1: the level o f agreement, in terms of simulated concentrations, between model results for thesame assessment parameters;
Criteria 2: the degree o f similarity between the gradients o f the response plots.
46. So, where the range o f simulated values (criteria 1) from all o f the model results available, for example, o f winter DIN for the UK coastal target area, is similar (based on a visual inspection o f the data), and where there is an acceptable degree o f similarity (established by visual inspection o f the data) between the slopes o f the response lines (criteria 2), then a high confidence is attributed to that set o f results. I f only one o f the two criteria be reached, the attributed confidence is medium. If both criteria are not deemed to have been fulfilled, only a low confidence can be attributed. The limitations of this approach to determining the level o f confidence in the results of the reduction scenario are recognised, and it may be that further work is carried out to improve the method. It should also be noted that failure to attribute high confidence to the ensemble of model results for certain target areas and/or parameters does not mean that the results are unreliable rather that more caution may be required in drawing conclusions about the specific outcome to a nutrient reduction scenario. A deliberately cautious method has been taken to the assessment o f confidence.
Workshop Report
40
Annex 4

2nd OSPAR Workshop on Eutrophication Modelling 10-12 September 2007
4.1 G erm an offshore target area: G -0 2
47. This is an offshore water body that is situated close to the northern boundary o f the models. It is relatively deep and is subject to summer time thermal stratification.
DIN
48. On average a 29% reduction in winter DIN is achieved with 50% reduction in loads and 45%reduction with 70% reduction in loads There is a wide range o f simulated concentrations in the standard run but much less variability in concentrations for the reduction scenarios. Differences in the gradients o f the response plots result in designating the results as o f low confidence.
DIP
49. On average a 7% reduction in winter DIP is achieved with 50% reduction in loads and 12%reduction with 70% reduction in loads. Model responsiveness is low and similar for the 4 models applied. It should be noted that the DIP reductions in the river loads are small in the German rivers. However, the range o f simulated concentrations that vary by a factor o f >2 lead to classification as results with a medium confidence level.
Chlorophyll
50. On average a 19% reduction in chlorophyll is achieved with 50% reduction in loads and 23%reduction with 70% reduction in loads. Model sensitivity is low and similar for the 4 models applied. Agreement between the model results provides high confidence in this result.
Oxygen
51. On average a 6% increase in mean minimum dissolved oxygen concentration is achieved with 50%reduction in loads and 9% increase with 70% reduction in loads. Model responsiveness is very similar for the 3 sets o f model results considered. The relatively limited range o f simulated concentrations leads to a high confidence in this result.
G -02 - param eter response to 50% nutrient load reduction
o 3 0
DIN DIP Chi 0 2 min
H U K -C ef B D E B NL B NO B UK-POL O rn ean
G -0 2 - param eter response to 70% nutrient load reduction
70
60
50
c 40 oO 30
T3 2? 20
10
0
H U K -C ef B D E B NL B NO B UK-POL □ m ean
DIN DIP Chi 02m in
Figure 4.2 % reduction in mean winter DIN and DIP and mean summer chlorophyll, and % increase in annualminimum oxygen computed by the different models as a response to the reduction of nutrient loads to G-02 by 50% and 70% respectively. Norway did not simulate a 70% reduction scenario; there are no mean oxygen data for Gennany.[Note: The calculation o f the mean % reduction does not include UK-POL model results. The chart, including the mean calculation, be updated following completion o f the review o f UK-POL values].
Workshop Report
44
Annex 4

2nd OSPAR Workshop on Eutrophication Modelling 10-12 September 2007
G -0 2 - mean winter DIN at surface
1614121086420
0 20 40 60 80nutrient load reduction (%)
G -0 2 - mean winter DIP at surface
1
8
0.6
0.4
0.2
00 20 40 60 80
nutrient load reduction (%)
G -0 2 - mean sum m er chlorophyll at surface
7
65
43
2 L1
00 20 40 60 80
nutrient load reduction (%)
- - - - - - - -L K C e f ----- ■------DE ------ A— ISL • NO ------------- LK-PCL................... æ s. la/d
G -0 2 - annual oxygen m inimum at bottom
8
7
6
5
40 20 40 60 80
nutrient load reduction (%)
• LKCef ----- ■------DE ------A— NL * NO ------------- LKPCL................... ass. Is/el
Figure 4.3 Concentrations of mean winter DIN and DIP at the surface, mean summer chlorophyll at the surface, and annual minimal oxygen concentration at the bottom for the year 2002 (standard ran at 0% reduction) and for nutrient load reduction of 50% and 70% respectively. Norway did not simulate a 70% reduction scenario and there are no mean oxygen data from Gennany. The concentrations are shown against the assessment levels (ass. level) used by Gennany for their areas reflected in the target box in the first application of the Comprehensive Procedure (OSPAR publication 189/2003). [Note: UK-POL concentrations are under review.]
Workshop Report
42
Aimex 4

2nd OSPAR Workshop on Eutrophication Modelling 10-12 September 2007
4.2 N etherlands offshore area: N L -0 2
52. This is an offshore (>34 salinity) water body with summer thermally stratified waters, ranging fromapproximately 40 - 80 m depth.
DIN
53. On average a 24% reduction in winter DIN is achieved with 50% reduction in loads and 38%reduction with a 70% reduction in loads. Model responsiveness varied and despite different starting concentrations in the standard run for each model the results tended to converge resulting in a similar simulated concentration for each model for each scenario. Although criteria 1 is fulfilled, criteria 2 is only partially fulfilled and consequently only a medium confidence is attributed to these results.
DIP
54. On average a 7% reduction in winter DIP is achieved with 50% reduction in loads and 12%reduction with 70% reduction in loads. Model responsiveness is similar between 3 o f the 4 models considered. However, the range o f simulated concentrations showed a degree o f variability that on balance fails to fulfil criteria 1, therefore a medium confidence in assigned.
Chlorophyll
55. On average an 11 % reduction in chlorophyll is achieved with 50% reduction in loads and 15%reduction with a 70% reduction in loads. Low and similar responsiveness was apparent in all model results accounting for the relatively small changes in simulated chlorophyll concentrations observed. However, the range o f simulated concentrations showed a degree o f variability that on balance fails to fulfil criteria 1 leading to a classification o f the result as having medium confidence.
Oxygen
56. On average a 4% increase in mean minimum dissolved oxygen concentration is achieved with 50%reduction in loads and 7% increase with 70% reduction in loads. Model responsiveness is very similar for 2 o f the 3 model results. The range of simulated concentrations is <1 mg/1. A precautionary approach does not lead to a conclusion o f high confidence in this result.
N L-02 - parameter response to 50% nutrient load reduction
70
60
50
40
30
20
10
0DIN DIP Chi 02m in
□ UK-Cef ■ DE ■ NL ■ NO H UK-POL □ mean
N L-02 - parameter response to 70% nutrient load reduction
70
60
~ 50 S3^ 40og 30TJ 2 20
10
0
H UK-Cef ■ DE ■ NL ■ NO H UK-POL □ mean
Ik02m in
Figure 4.4 % reduction in mean winter DIN and DIP and mean summer chlorophyll, and % increase in annualminimal oxygen computed by the different models as a response to the reduction of nutrient loads to NL-02 by 50% and 70% respectively. Norway did not simulate a 70% reduction scenario; there are no mean oxygen data from Gennany. Percentage increase in oxygen for UK-POL at 50% is too small to show in the graph. [Note: The calculation o f the mean % reduction does not include UK-POL model results. The chart, including the mean calculation, will be updated following completion o f the review o f UK-POL values].
Workshop Report
43_
Annex 4

2nd OSPAR Workshop on Eutrophication Modelling 10-12 September 2007
N L-02 - mean winter DIN at surface
12
0 20 40 60 80nutrient load reduction (%)
N L-02 - mean sum m er chlorophyll at surface
7
65
43
21
00 20 40 60 80
nutrient load reduction (%)
- - - - - - - -L K C e f ----- ■------DE ------ A— ISL • NO ------------- LKPCL................... ass. la/el
N L-02 - mean winter DIP at surface
1
0.8
0.6
0.4
0.2
00 20 40 60 80
nutrient load reduction (%)
N L-02 - annual oxygen m inimum at bottom
8
7
6
5
40 20 40 60 80
nutrient load reduction (%)
- - - - - - - -L K C e f ----- ■------DE ------* — M_ * NO ------------- LKPCL................... ass. level
Figure 4.5 Concentrations of mean winter DIN and DIP at the surface, mean summer chlorophyll at the surface, and annual minimal oxygen concentration at the bottom for the year 2002 (standard ran at 0% reduction) and for nutrient load reduction of 50% and 70% respectively. Norway did not simulate a 70% reduction scenario and there are no mean oxygen data for Gennany. The concentrations are shown against the assessment levels used by the Netherlands for their areas reflected in the target box NL-02 in the first application of the Comprehensive Procedure (OSPAR publication 189/2003). [Note: UK-POL concentrations are under review.]
Workshop Report
44
Annex 4

2nd OSPAR Workshop on Eutrophication Modelling 10-12 September 2007
4.3 N etherlands coastal waters: N L-C 2
57. This is a coastal water body that includes Rhine waters with salinities at a range from 32 - 33 and depths from 5 m close to the coast to 20 m farther from the coast (source: http://www.noordzeeatlas.nl) .
DIN
58. On average a 44% reduction in winter DIN is achieved with 50% reduction in loads and 59%reduction with 70% reduction in loads. Model responsiveness was very similar for the 4 simulations considered. The range o f simulated concentrations for the reduction scenarios varies by a factor o f about 2 and therefore the results are classified as o f medium confidence.
DIP
59. On average a 12% reduction in winter DIP is achieved with both a 50% and a 70% reduction inloads. There is a relatively large range in model results for the reduction scenarios. Responsiveness of 3 ofthe 4 models considered is similar. Therefore, it is possible to designate the result as o f medium confidence.
Chlorophyll
60. On average a 13% reduction in chlorophyll is achieved with 50% reduction in loads and 14%reduction with 70% reduction in loads. Low responsiveness was apparent in all model results accounting for the relatively small changes observed. One model showed a slightly higher degree o f responsiveness. There is a relatively large range in model results between the reduction scenarios. Therefore, the results are classified as o f medium confidence.
Oxygen
61. On average a 1% increase in mean minimum dissolved oxygen concentration is achieved with 50%reduction in loads and 2% increase with 70% reduction in loads. Model responsiveness is very similar for the 2 model results. The range o f simulated oxygen concentrations is relatively narrow. The agreement between the models results provides medium confidence in this result.
NL-C2 parameter resp on se to 50% nutrient load reduction
DIN DIP Chi 0 2 min
H UK-Cef I D E ■ NL ■ NO S UK-POL D m ean
NL-C2 parameter resp on se to 70% nutrient load reduction
0 2 min
H UK-Cef « D E ■ NL ■ NO H UK-POL D m ean
Figure 4.6 % reduction in mean winter DIN and DIP and mean summer chlorophyll, and % increase in annualminimal oxygen computed by the different models as a response to the reduction of nutrient loads to NL-C2 by 50% and 70% respectively. Norway did not simulate a 70% reduction scenario; there are no mean oxygen data from Gennany. For UK-POL, % reduction in chlorophyll and % increase in oxygen is zero. [Note: The calculation o f the mean % reduction does not include UK-POL model results. The chart, including the mean calculation, will be updated following completion o f the review o f UK-POL values].
Workshop Report
45_
Annex 4
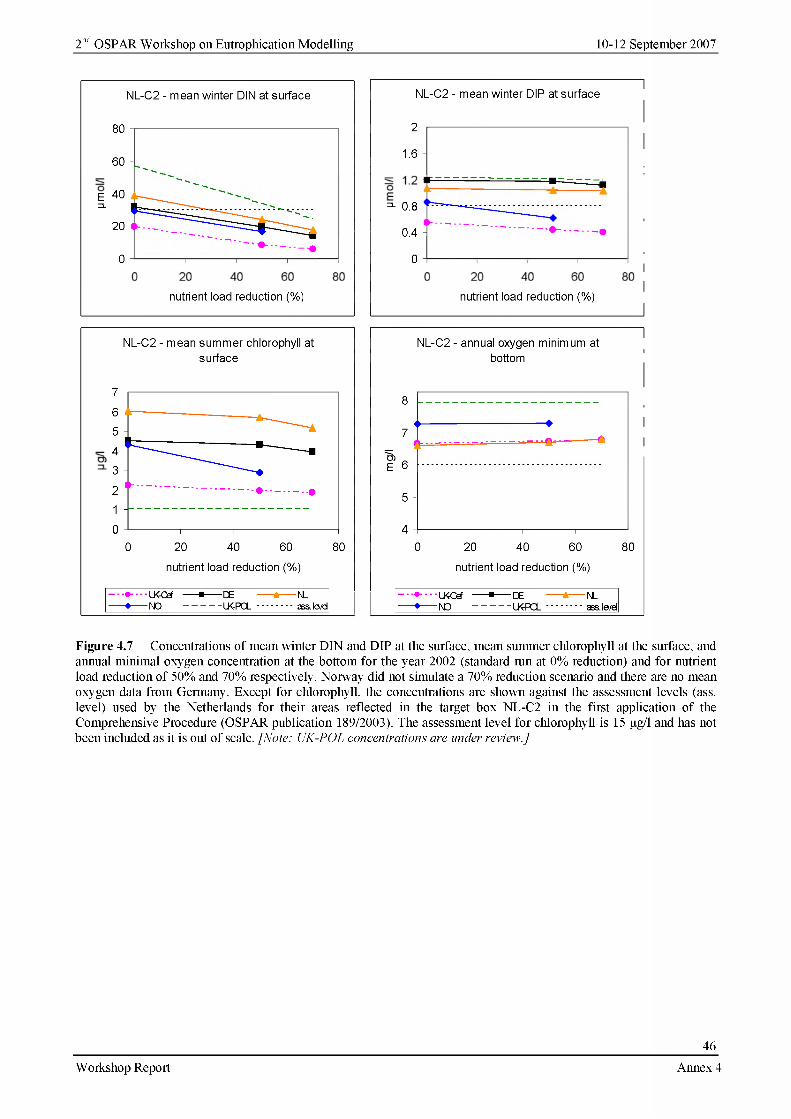
2nd OSPAR Workshop on Eutrophication Modelling 10-12 September 2007
NL-C2 - mean winter DIN at surface
80
60
E 40zl
20
0
NL-C2 - mean winter DIP at surface
2
1.6
^ 0.8
0.4
0
nutrient load reduction (%)
NL-C2 - mean sum m er chlorophyll at surface
7
65
4
3
21
00 20 40 60 80
nutrient load reduction (%)
-■■•-■■■LKCef ----- ■------DE ------A— NL ♦ NO ------------- LKPCL................... æ s. la/d
nutrient load reduction (%)
NL-C2 - annual oxygen m inimum at bottom
8 -
5 -
4 - I - - - - - - - - - - - - - - - - - - - - - 1- - - - - - - - - - - - - - - - - - - - - 1- - - - - - - - - - - - - - - - - - - - - 1- - - - - - - - - - - - - - - - - - - - -
0 20 40 60 80
nutrient load reduction (%)
-■■•-■■■LKCef — ■— DE — a — nl♦ NO ------------ LKPCL.....................ass, la/d
Figure 4.7 Concentrations of mean winter DIN and DIP at the surface, mean summer chlorophyll at the surface, and annual minimal oxygen concentration at the bottom for the year 2002 (standard run at 0% reduction) and for nutrient load reduction of 50% and 70% respectively. Norway did not simulate a 70% reduction scenario and there are no mean oxygen data from Gennany. Except for chlorophyll, the concentrations are shown against the assessment levels (ass. level) used by the Netherlands for their areas reflected in the target box NL-C2 in the first application of the Comprehensive Procedure (OSPAR publication 189/2003). The assessment level for chlorophyll is 15 pg/1 and has not been included as it is out of scale. [Note: UK-POL concentrations are under review.]
___________________________________________________________________________________________________ 46
Workshop Report Annex 4

2nd OSPAR Workshop on Eutrophication Modelling 10-12 September 2007
4.4 N etherlands coastal waters: N L-C 3
62. This is a coastal water body outside the barrier islands without Wadden Sea and Ems estuary. Salinities are in the range o f 30 - 34.5 and depths are from 5 m close to the coast to 30 m farther from the coast (source: www.noordzeeatlas.nl).
DIN
63. On average a 41% reduction in winter DIN is achieved with 50% reduction in loads and 56%reduction with 70% reduction in loads. Model responsiveness was very similar for the 4 simulations and there was good agreement between simulated concentrations for the two scenarios. In conclusion there is high confidence in the model results.
DIP
64. On average a 12% reduction in winter DIP is achieved with 50% reduction in loads and 13%reduction with 70% reduction in loads. Model responsiveness is similar between the 4 models with 3 o f the 4 models in close agreement for the 50% reduction. There is medium confidence in the result as after an initial small reduction in DIP no further reduction in DIP is achieved with 70% reduction in nutrient loading.
Chlorophyll
65. On average a 15% reduction in chlorophyll is achieved with 50% reduction in loads and 20%reduction with 70% reduction in loads. A similar responsiveness was apparent in all model results accounting for the relatively small changes observed. Agreement between the 4 models results provides high confidence in this result.
Oxygen
66. On average a 1% increase in mean minimum dissolved oxygen concentration is achieved with 50%reduction in loads and 3% increase with 70% reduction in loads. Model sensitivity is low and very similar for the 3 model results. The range of model results varies by <1 mg/1 and are regarded as fulfilling the requirements o f criteria 1. Therefore, the results are regarded as having high confidence.
NL-C3 parameter resp on se to 50% nutrient load reduction
Chi 02min
B UK-Cef ■ DE ■ NL ■ NO H UK-POL □ mean
NL-C3 parameter resp on se to 70% nutrient load reduction
70 -,
DIN DIP Chi 02min
□ UK-Cef « D E ■ NL ■ NO B UK-POL □ mean
Figure 4.8 % reduction in mean winter DIN and DIP and mean summer chlorophyll, and % increase in annualminimal oxygen computed by the different models as a response to the reduction of nutrient loads to NL-C3 by 50% and 70% respectively. Norway did not simulate a 70% reduction scenario; there are no mean oxygen data from Gennany. For UK-POL, % reduction in DIP, chlorophyll and oxygen is zero (DIP concentrations increased in the 50% reduction scenario). [Note: The calculation o f the mean % reduction does not include UK-POL model results. The chart, including the mean calculation, will be updated following completion o f the review o f UK-POL values].
Workshop Report
47
Annex 4

2nd OSPAR Workshop on Eutrophication Modelling 10-12 September 2007
NL-C3 - mean winter DIN at surface
80
60
40
20
00 20 40 60 80
nutrient load reduction (%)
NL-C3 - mean sum m er chlorophyll at surface
7
65
43
21
00 20 40 60 80
nutrient load reduction (%)
- - - - - - - -L K C e f ----- ■------DE ------ A— ISL • NO ------------LKPCL.....................æ s. la/d
NL-C3 - mean winter DIP at surface
2
1.6
1.2
0.8
0.4
00 20 40 60 80
nutrient load reduction (%)
NL-C3 - annual oxygen m inimum at bottom
8
7
6
5
40 20 40 60 80
nutrient load reduction (%)
- - - - - - - -L K C e f ----- ■------DE ------* — NL ♦ NO ------------- LKPCL................... ass. Is/el
Figure 4.9 Concentrations of mean winter DIN and DIP at the surface, mean summer chlorophyll at the surface, and annual minimal oxygen concentration at the bottom for the year 2002 (standard run at 0% reduction) and for nutrient load reduction of 50% and 70% respectively. Norway did not simulate a 70% reduction scenario and there are no mean oxygen data from Gennany. Except for chlorophyll, the concentrations are shown against the assessment levels (ass. level) used by the Netherlands for their areas reflected in the target box NL-C3 in the first application of the Comprehensive Procedure (OSPAR publication 189/2003). The assessment level for chlorophyll is 15 pg/1 and has not been included as it is out of scale.[Note: UK-POL concentrations are under review.]
Workshop Report
48
Aimex 4

2nd OSPAR Workshop on Eutrophication Modelling 10-12 September 2007
4.5 G erm an coastal waters: G -C l
67. The target area G-C1 is located within the German Bight, a shallow bight with a water depth mostly below 40 m. This coastal water body with salinities between 30 and 34.5 receives large amounts o f nutrients from the rivers Elbe, Weser and Ems, and from transboundary transport along with the coastal currents.
DIN
68. On average a 47% reduction in winter DIN is achieved with 50% reduction in loads and 64% reduction with 70% reduction in loads. Model responsiveness was quite pronounced and very similar for the 4 simulations. The good agreement between the 4 models in terms o f the range o f values for the simulations together with similar model responsiveness provides high confidence in this result.
DIP
69. On average a 14% reduction in winter DIP is achieved with 50% reduction in loads and 20%reduction with 70% reduction in loads. Model responsiveness tends to vary down to the 50% reduction and thereafter is similar. The simulated DIP concentrations are relatively widespread. Consequently, these results are regarded as having low confidence.
Chlorophyll
70. On average a 16% reduction in chlorophyll is achieved with 50% reduction in loads and 19%reduction with 70% reduction in loads. Low and to some extent variable responsiveness was apparent in model results accounting for the relatively small changes observed. The range o f simulated chlorophyll concentrations varies by a factor of approximately 3. Consequently, these results are regarded as having low confidence.
Oxygen
71. On average a 2% increase in mean minimum dissolved oxygen concentration is achieved with 50%reduction in loads and 4% increase with 70% reduction in loads. Model responsiveness is very similar for the 3 model results and the range o f results varies by less than 1 mg/1. Consequently, these results are regarded as having high confidence.
G-C1 - parameter response to 50% nutrient load reduction
70
60
~ 50
^ 40O'o 30~ a
2 2010
0
H UK-Cef ■ DE ■ NL ■ NO H UK-POL □ mean
Chi 02min
G-C1 - parameter response to 70% nutrient load reduction
Chi 02min
□ UK-Cef « D E ■ NL ■ NO H UK-POL □ mean
Figure 4.10 % reduction in mean winter DIN and DIP and mean summer chlorophyll, and % increase in annual minimal oxygen computed by the different models as a response to the reduction of nutrient loads to G-Cl by 50% and 70% respectively. Norway did not simulate a 70% reduction scenario, and there are no mean oxygen data from Gennany. For UK-POL, % reduction in DIP, chlorophyll and oxygen is zero (DIP reduction in the 70% scenario is too small to show in the graph). [Note: The calculation o f the mean % reduction does not include UK-POL model results. The chart, including the mean calculation, will be updated following completion o f the review o f UK-POL values].
Workshop Report
49
Annex 4

2nd OSPAR Workshop on Eutrophication Modelling 10-12 September 2007
G-C1 - mean winter DIN at surface
80
60
40
20
00 20 40 60 80
nutrient load reduction (%)
G-C1 - mean sum m er chlorophyll at surface
7654321
00 20 40 60 80
nutrient load reduction (%)
•-■■■LKCef ----- ■------DE ------ A— NL • NO ------------UKPCL.....................ass. la/el
G-C1 - mean winter DIP at surface
2
1.6
1.2
0.8
0.4
00 20 40 60 80
nutrient load reduction (%)
G-C1 - annual oxygen m inimum at bottom
8
7
6
5
40 20 40 60 80
nutrient load reduction (%)
• LKCef ----- ■------DE ------A— NL * NO ------------- LKPCL................... ass. la/el
Figure 4.11 Concentrations of mean winter DIN and DIP at the surface, mean summer chlorophyll at the surface, and annual minimal oxygen concentration at the bottom for the year 2002 (standard ran at 0% reduction) and for nutrient load reduction of 50% and 70% respectively. Norway did not simulate a 70% reduction scenario and there are no mean oxygen data from Gennany. The concentrations are shown against the assessment levels used by Gennany for their areas reflected in the target box G-Cl in the first application of the Comprehensive Procedure (OSPAR publication 189/2003). [Note: UK-POL concentrations are under review.]
Workshop Report
50
Annex 4

2nd OSPAR Workshop on Eutrophication Modelling 10-12 September 2007
4.6 U K coastal waters: UK -C1
72. This is a coastal water body with salinities of 30-34.5. It is well mixed with respect to density and relatively turbid.
D IN
73. On average a 28% reduction in winter DIN is achieved with 50% reduction in loads and 46%reduction with 70% reduction in loads. There are differences in model responsiveness with the range of simulated DIN concentrations varying by a factor of approximately 2. Consequently, these results are regarded as having medium confidence.
DIP
74. On average a 19% reduction in winter DIP is achieved with 50% reduction in loads and 33%reduction with 70% reduction in loads. There is considerable variability in the starting concentrations and, although there is some convergence in model results at 70%, large differences remain. The variability in model results leads to a medium confidence in the result.
Chlorophyll
75. On average a 20% reduction in chlorophyll is achieved with 50% reduction in loads and 36%reduction with 70% reduction in loads. Model responsiveness varies between models and the range of simulated DIP concentrations is quite wide. In conclusion, the results are regarded as having low confidence.
Oxygen
76. On average a 1% increase in mean minimum dissolved oxygen concentration is achieved with 50%reduction in loads and 2% increase with 70% reduction in loads. Model responsiveness is very similar for the 4 model results. The range o f simulated dissolved oxygen is < 1 mg/1 and thus the results are regarded as having high confidence.
UK-C1 - parameter response to 50% nutrient load reduction
70 1 60 -
_ 50 -I
DIN DIP Chi 02min
■ BE ES UK-Cef 1 NL ■ NO B UK-POL □ mean
UK-C1 - parameter resp on se to 70% nutrient load reduction
Chi 02min
B BE □ UK-Cef I NL I NO B UK-POL □ mean
Figure 4.12 % reduction in mean winter DIN and DIP and mean summer chlorophyll, and % increase in annual minimal oxygen computed by the different models as a response to the reduction of nutrient loads to UK-C1 by 50% and 70% respectively. Norway did not simulate a 70% reduction scenario. There are no mean oxygen data from Belgium. For UK-POL, % reduction of chlorophyll and % increase in oxygen is zero. [Note: The calculation o f the mean % reduction does not include UK-POL model results. The chart, including the mean calculation, will be updated following completion o f the review o f UK-POL values].
Workshop Report
51_Annex 4

2nd OSPAR Workshop on Eutrophication Modelling 10-12 September 2007
UK-C1 - mean winter DIN at surface
nutrient load reduction (%)
UK-C1 - mean winter DIP at surface
UK-C1 - mean sum m er chlorophyll at surface
7654O)
^ 3210
20 40 60 80
nutrient load reduction (%)
- be- no
----LKCef LK-PCL
NLæs. la/d
oE
20 40 60 80nutrient load reduction (%)
UK-C1 - annual oxygen m inimum at bottom
8
7
O)E 6
5
40 20 40 60 80
nutrient load reduction (%)
-BE — • — UKCef-NO --------------UKPCL
NLass. la/el
Figure 4.13 Concentrations of mean winter DIN and DIP at the surface, mean summer chlorophyll at the surface, and annual minimal oxygen concentration at the bottom for the year 2002 (standard ran at 0% reduction) and for nutrient load reduction of 50% and 70% respectively. Norway did not simulate a 70% reduction scenario and there are no mean oxygen data from Belgium. Except for chlorophyll, the concentrations are shown against the assessment levels (ass. level) used by the UK for their areas reflected in the target box UK-C1 in the first application of the Comprehensive Procedure (OSPAR publication 189/2003). The assessment level for chlorophyll is 10 pg/1 and has not been included in the graph as it is out of scale. [Note: UK-POL concentrations are under review.]
Workshop Report
52
Annex 4
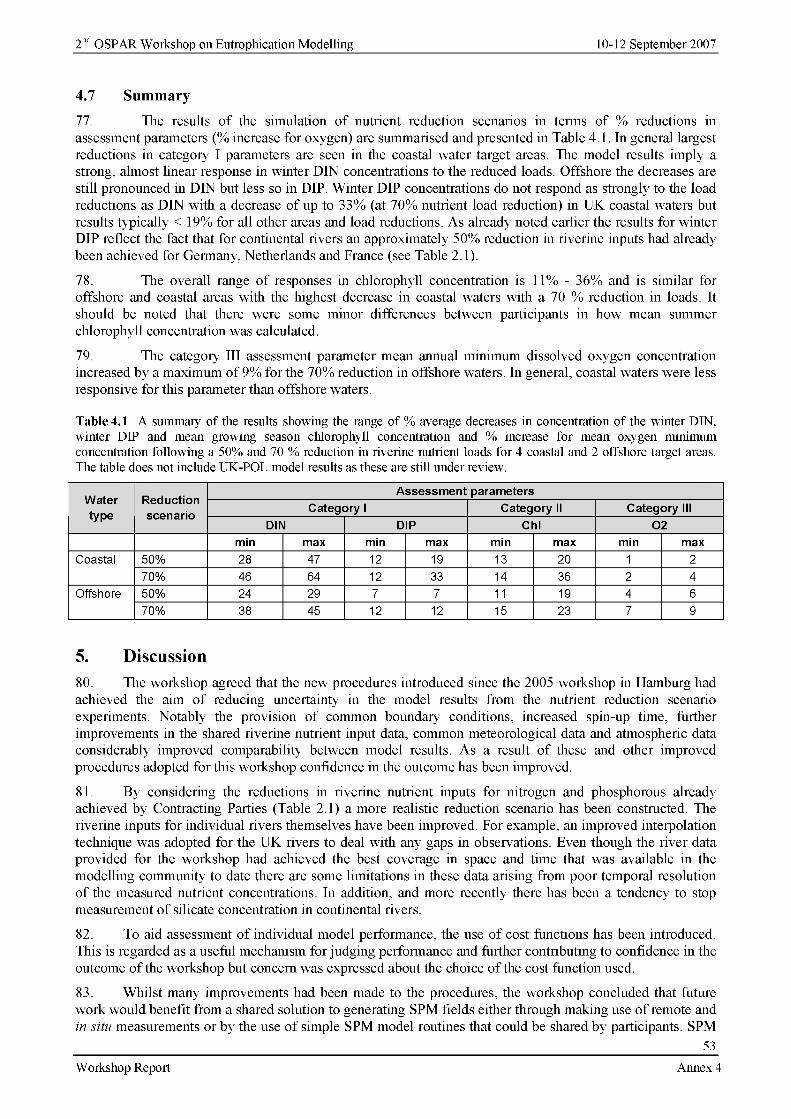
2nd OSPAR Workshop on Eutrophication Modelling 10-12 September 2007
4.7 Sum m ary
77. The results o f the simulation o f nutrient reduction scenarios in terms of % reductions in assessment parameters (% increase for oxygen) are summarised and presented in Table 4.1. In general largest reductions in category I parameters are seen in the coastal water target areas. The model results imply a strong, almost linear response in winter DIN concentrations to the reduced loads. Offshore the decreases are still pronounced in DIN but less so in DIP. Winter DIP concentrations do not respond as strongly to the load reductions as DIN with a decrease of up to 33% (at 70% nutrient load reduction) in UK coastal waters but results typically < 19% for all other areas and load reductions. As already noted earlier the results for winter DIP reflect the fact that for continental rivers an approximately 50% reduction in riverine inputs had already been achieved for Germany, Netherlands and France (see Table 2.1).
78. The overall range o f responses in chlorophyll concentration is 11% - 36% and is similar for offshore and coastal areas with the highest decrease in coastal waters with a 70 % reduction in loads. It should be noted that there were some minor differences between participants in how mean summer chlorophyll concentration was calculated.
79. The category III assessment parameter mean annual minimum dissolved oxygen concentration increased by a maximum of 9% for the 70% reduction in offshore waters. In general, coastal waters were less responsive for this parameter than offshore waters.
Table 4.1 A summary of the results showing the range of % average decreases in concentration of the winter DIN, winter DIP and mean growing season chlorophyll concentration and % increase for mean oxygen minimum concentration following a 50% and 70 % reduction in riverine nutrient loads for 4 coastal and 2 offshore target areas. The table does not include UK-POL model results as these are still under review.
Watertype
Reductionscenario
Assessment parametersCategory 1 Category II Category III
DIN DIP Chi 02min max min max min max min max
Coastal 50% 28 47 12 19 13 20 1 270% 46 64 12 33 14 36 2 4
Offshore 50% 24 29 7 7 11 19 4 670% 38 45 12 12 15 23 7 9
5. Discussion80. The workshop agreed that the new procedures introduced since the 2005 workshop in Hamburg had achieved the aim of reducing uncertainty in the model results from the nutrient reduction scenario experiments. Notably the provision of common boundary conditions, increased spin-up time, further improvements in the shared riverine nutrient input data, common meteorological data and atmospheric data considerably improved comparability between model results. As a result o f these and other improved procedures adopted for this workshop confidence in the outcome has been improved.
81. By considering the reductions in riverine nutrient inputs for nitrogen and phosphorous already achieved by Contracting Parties (Table 2.1) a more realistic reduction scenario has been constructed. The riverine inputs for individual rivers themselves have been improved. For example, an improved interpolation technique was adopted for the UK rivers to deal with any gaps in observations. Even though the river data provided for the workshop had achieved the best coverage in space and time that was available in the modelling community to date there are some limitations in these data arising from poor temporal resolution o f the measured nutrient concentrations. In addition, and more recently there has been a tendency to stop measurement o f silicate concentration in continental rivers.
82. To aid assessment o f individual model performance, the use o f cost functions has been introduced. This is regarded as a useful mechanism forjudging performance and further contributing to confidence in the outcome of the workshop but concern was expressed about the choice o f the cost function used.
83. Whilst many improvements had been made to the procedures, the workshop concluded that future work would benefit from a shared solution to generating SPM fields either through making use o f remote and in situ measurements or by the use o f simple SPM model routines that could be shared by participants. SPM
53
Workshop Report Annex 4

2nd OSPAR Workshop on Eutrophication Modelling 10-12 September 2007
is important as it is the most important explanatory variable for light attenuation in the models. Nevertheless, most participants had made advances since the previous workshop.
84. The reduction scenarios demonstrated clear differences between coastal and offshore target areas in terms o f the response o f assessment variables to reduction in nutrient loads. For winter DIN highest percentage reductions took place in coastal waters while for winter DIP much smaller reductions were evident for coastal and offshore areas. The highest reductions in winter DIP occurred in the UK and German coastal target areas and the least reductions in Dutch waters. The result reflects the fact that the Netherlands and Germany had already achieved significant reductions in their riverine loads o f phosphorus as noted earlier (see section 2.1). The 50% reduction scenario for the Netherlands and Germany required no change in the actual river load for phosphorus since the reduction, in comparison to 1985, had already reached this level. For the Netherlands this was also the case for the 70% reduction, while for Germany a reduction o f 40 % in phosphorus load was still required.
85. For mean summer chlorophyll concentrations greatest reductions took place in coastal target areas with a much greater reduction in the UK box. However, apart from this target area this parameter was not highly responsive to reduced nutrient loading. This does not imply that there is no reaction in the modelled biological system, but only that the parameter mean summer chlorophyll concentration is relatively insensitive to the level o f the nutrient load. It was recognised by the participants that net primary production could serve as a more suitable parameter for indicating accelerated growth, but it was also noted that this parameter is not routinely monitored. In this context the question should be raised in which way the ecosystem models will be used to support management questions. Therefore biological parameters should be tested to reflect the information needed to judge the change in the ecosystem related to nutrient reduction scenarios. The participants also recognised that, as phytoplankton biomass is represented in most models as carbon and a conversion to chlorophyll is required (either simply or using a dynamic formulation), a better method of inter-comparison would be to use carbon content directly. Such an approach avoids the introduction o f complications in cases where incomparable units would need changing to chlorophyll content.
86. The least sensitive parameter was mean minimum dissolved oxygen concentration. Highest increases in this parameter occurred offshore and in the largest reduction scenario. In all models, oxygen had a low responsiveness to nutrient reductions. The general question was raised as to whether the mean oxygen content calculated over a relative large target area is the correct method to represent this parameter. While some participants argued that the occurrence o f low oxygen concentrations is mainly driven by meteorological factors (especially wind), others did not agree and pointed out that it is also related to the biological degradation process o f organic matter by bacteria in the model. A correct representation o f this process is important and differences between models in terms o f the complexity o f the benthic modules are a likely source o f disagreement between model results. In discussion, it was noted that monitoring of an oxygen minimum was a difficult task and only achievable with continuous (buoy) measurements. However, models do have the capability to resolve small scale events such as oxygen minima. Bearing in mind the importance o f oxygen as an assessment parameter, well validated models could play a role in bolstering the ‘monitoring’ based assessments by providing information not only on the oxygen minima but also on the duration of ‘above-threshold’ levels and their spatial extent in water bodies. Such an approach would add value to the monitoring effort and provide (supplementary) information to help interpret monitoring data.
87. The workshop identified specific issues for consideration with regard to modelling dissolved oxygen concentration:
• Can models address whether oxygen deficiency is o f anthropogenic nature? Models can point to areas which are sensitive to oxygen deficiency and where anthropogenic causes may have impact and where not. Models can help constructing and evaluating cause-effect relationships.
• Models can also help optimize monitoring programmes by identifying those areas where oxygen measurements are most cost-efficient in relation to the sensitivity o f an area to eutrophication effects.
• Infrequent monitoring makes it difficult to detect the actual oxygen concentration minimum. This could be achieved by models in combination with monitoring.
88. The capability o f models to better resolve the spatial and temporal variability o f simulated dissolved oxygen concentration also applies to other assessment parameters. For example, short lived events such as phytoplankton blooms are particularly difficult to detect with in situ measurements unless they are
54Workshop Report Annex 4

2nd OSPAR Workshop on Eutrophication Modelling 10-12 September 2007
continuous or at least o f sufficient temporal resolution to capture episodic events o f a few days’ duration. Consequently, validated models can be used to provide supplementary information to bolster the monitoring- based assessments o f eutrophication and, therefore, contribute to increased confidence in the outcome of assessments of eutrophication status.
89. Model results presented from Norway included a multi-year model run and demonstrated important inter-annual variability in assessment parameters. Such an approach deals with the possibility of bias in the results to nutrient scenario testing, for example, as a result o f dealing with extreme years (wet and dry years) by putting results into a wider temporal context.
6. Conclusions90. We have reduced uncertainty and within the context o f limitations of modelling have confidence in our results.
• The participants convincingly demonstrated that through the recommended spin-up procedure the models used had reached a stable state and were therefore fit for reduction scenario testing.
• Sharing common boundary conditions and other forcing data together with the spin-up procedure enhanced comparability o f model results.
• A range o f changes have been introduced to the nutrient reduction scenario testing that have contributed to a significant reduction in uncertainty associated with the use o f models and therefore contributed to an increase in confidence to the results reported here.
• In general winter DIN and DIP were most responsive in coastal target areas with about half a reduction in DIN achieved compared to the % reduction in riverine nitrogen load.
• Mean summer chlorophyll concentration was less responsive to load reduction than DIN or DIP and generally had a similar response in offshore and coastal target areas.
• Mean minimum dissolved oxygen concentration was the least responsive o f all parameters but with greatest response offshore. Questions were raised about the robustness o f this parameter as an indicator o f eutrophication especially offshore where wind speed was regarded as an important explanatory variable.
91. The above conclusions should be set against the known merits and limitations o f numerical modelling. The model results should be regarded as indicating the direction of changes in levels and effects but do not forecast the exact results o f the eutrophication status in the marine environment with respect to nutrient enrichment (nutrient concentrations and N/P ratios), and direct and indirect effects following the achievement o f the 50 % reduction targets for nutrient inputs.
7. Recommendations92. To achieve further improvements in the use o f models by reducing uncertainty the following improvements should be considered:
• In order to improve the simulation of the water column light climate in the model in future, SPM fields should be supplied either by using remote and in situ measurements or by supplying model routines to simulate the SPM accurately.
• To take into account inter-annual variability, the use o f multi-year simulations should be encouraged but recognising that the additional data needs (e.g. multi-year riverine nutrient inputs) to support such an approach are substantial.
• To improve the quality o f model results more data from measurements are required with the appropriate spatial and temporal resolution for validation purposes.
8. Acknowledgements93. The Workshop organisers gratefully acknowledge the ECMWF (European Centre for Medium Range Weather Forecasting) for allowing us to provide meteorological data to the participants for specific use at this workshop.
55
Workshop Report Annex 4

2nd OSPAR Workshop on Eutrophication Modelling 10-12 September 2007
9. ReferencesVillars, M. and de Vries, I., 1998. Report of the ASMO Modelling Workshop on Eutrophication Issues 5-8 November 1996, The Hague, The Netherlands. M. Villars & I. de Vries editors. Assessment and Monitoring, OSPAR Commission 1998.
Radach, G. and Moll, A., 2006. Review o f three-dimensional ecological modelling related to the North Sea shelf system - Part 2: Model validation and data needs. Oceanography and Marine Biology; an Annual Review, Vol. 44:1-60.
Workshop Report
56
Annex 4

2nd OSPAR Workshop on Eutrophication Modelling 10-12 September 2007
Appendix 1 Overview of models used in the reduction scenarios
Model name MIRO&CO-3D(Belgium)
ECO-MARS3D(France)
ECOHAM4(Germany)
Deft3D-GEM(Netherlands)
NORWECOM(Norway)
MOHID System (Portugal)
GETM-BFM (Cefas - United
Kingdom)
POLCOMS- ERSEM (P O L -
United Kingdom)
GeneralcharacteristicsNamehydrodynamicmodel
COHERENS MARS-3D HAMSOM Delft3D Based on Princeton Ocean Model
MOHID GETM POLCOMS
Namebiogeochemicalmodel
MIRO ECO-MARS-3D ECOHAM4 GEM NORWECOM M O H ID -M odu le W ater Quality
BFM ERSEM
Spatial Resolution Ah (km)
5' longitude (5.6 km) X 2.5' latitude (4.6 km) 4 x 4 km
20 km Variable (min. 2x4 km, max 20x20km)
10 Variable (11 km to 4km)
approx. 6 nautical miles
12
Vertical resolution 5 sigma layers12 sigma levels
24 z-layers 10 sigma layers 21 sigma layers 10 Cartesian 25 layers, General Coordinates
32 s-levels
Longitude (degree) 4 .0 °W - 5.0°E -5.5, 5.0 15° W - 14° E 4°W 10°E 12W-12E 1,5°W, 6.5°E 5 .15W - 18E 20W-13ELatitude (degree) 48.5°N - 52.5°N 47.85, 52.50 47,5° N - 64° N 49°N - 57°N 48N-64N 49°N, 54,5°N 48.5N -60N 40-65 NSpatial extent (km) 500 km
W-E: 750, N-S: 5201800x 1800 -7 .2 *102x -5 *1 02
m = 3.6*105 km2-600x800km 2376 x 2688
Temporal resolution At (sec)
900 sec
variable ~400 s
60s Transport timestep (from D3D-FLOW) 30 min. Ecological processes timestep: 24 hrs
900 60s 45 sec (stored dayly)
15s (barotropic), 300s (baroclinie), 1200s(biochemical)
Temporal range (years)
1991-2004 (2005 for hydrodynamics)
1999-2003
1y (2002) 1 (2002) Years1 9 7 5 -2 0 0 3modelled
1985-2005 i y 1 1987, 1988-2005
Spin up time 2 years 2 times the year 1999
3 years 5 years 4 years I y 10 years 6
Meteo data Real 6 hours reanalysed forecasts from UKMO / ECMWF (2002) for ICG- EMO workshop
real data : ARPEGE MODEL (METEO- France) + irradiance from METEOSAT/AJON C (METEO-France)
NCEP Air temperature: time series Light Vessel Goeree; air pressure, humidity, cloudcover, wind: ERA40 ECMWF; (solar radiation is computed from these)
ECMWF Wind, Solar Radiation,Humidity, Air Temperature, Cloud Cover;FromERA40(ECMWF)+NCEP(NOAA)
ECMWF ECMWF era-40 + analyses
Oxygen dynamics No Yes yes Included in model yes Yes calculatedTemperature &Salinity diagnostic or prognostic
Weekly 20 km x 20 km gridded SST (BSH) imposed - salinity prognostic
T and S are prognostic (= simulated state variables)
T: prognostic; S: diagnostic
Both are simulated prognostic Temperature: Forced in the boundary and initial conditions from
calculated Prog
57
Workshop report Annex 4

2nd OSPAR Workshop on Eutrophication Modelling 10-12 September 2007
NOAA OISSTV2; Temperature evolution is computed considering also surface fluxes between water and atmosphere. Salinity:Forced in the boundary and initial conditions from WOA2005 (NODC/NOAA); Evolution computed by the model.
SPM dynamics Seasonal TSM from SeaWiFS climatology (1997- 2003) imposed at the surface / bimonthly for ICG- EMO
SÍAM3D model and satellite forcing (SeaWiFS, monthly averages)
climatology Simulated Delft3- Sed.
no Sediment transport model computing settling velocity and erosion/deposition processes
local resuspension by waves
IOP assim
Inclusion of tides yes Yes no Yes M2, S2, K1, 01 FES2004 forced at the borders
yes Yes
PelagicdescriptionPelagic matter cycle (C, N, P, Si)
C, N, P, SiN, P, Si, O
C, N, P, Si N, P, Si complete.C organic part only.
N, P, Si, 0 C, N, P (Si optional) C, N, P, Si Yes
No. o f Pelagic state variables
3219
24 Variable. This application: 23
9 12 (18 available) 45 51
Pelagic Nutrients (bulk or explicit)
Explicit (N 0 3, NH4, PO4 , SiO) explicit
Explicit Explicit DIN, P04, S Í02 Explicit ? Explicit
Types of Phytoplankton
Nanoflagellates (3), Diatoms (3), Phaeocystis (4)
diatoms,dinoflagellates,smallphytoplankton, Karenia mikimotoi, Phaeocystis globosa (4 variables needed)
Diatoms and flagellates
12. Functional groups: diatoms, microflagellates, dinoflagellates, Phaeocystis
DIA, FLA Flagellates (diatoms optional)
? Diatoms, pico,flagellates,dinoflagellates
Types of Zooplankton
Microzooplankton,Copepods microzooplankton,
mesozooplankton
Micro- and mesozooplankt
Variable. This application: 0
Mesozooplankton(microzooplanktonoptional)
? Micro, meso, heterotrophic nanoflagellates
Types of bacteria Fleterotrophicbacteria
None Bacteria 0 No (Optional) ? Fleterotrophic
Pelagic POM Particulate organic C, N & P of high (1) and low(2) biodegradability, Biogenic Silica
Yes Slow and fast sinking detritus (7 state variables)
Not included this application
yes ? Yes
58
Workshop report Annex 4

2nd OSPAR Workshop on Eutrophication Modelling 10-12 September 2007
BenthicdescriptionBenthic matter cycle (C, N, P, Si)
C, N, P
N, P, Si, 0
C, N, P, Si C, N, P, Si N, P, Si C, N, Pand (Si optional), simple model
C, N, P, Si Yes
No. o f benthic state variables
610
5 Variable. This application: 4
6 8 ? 7
Benthic Nutrients (bulk or explicit)
Diagenetic model (N 0 3, NH4, P 0 4) explicit
Bulk Explicit DIN, P04, S Í02 Explicit ? Yes
Types of Zoobenthos
one goup of suspendeed feeders
No Variable. This application: 0
No ? Suspension feeders, deposit feeders, meiofauna
DOM none No 0 Yes ? YesTypes of Bacteria none No 0 No (simple
mineralizationmodel)
? Aerobic, anaerobic
Benthic POM yes 5 state variables 0 Yes ? YesParticipant to add furthercharacteristics if required
yes Model is application constructed within general framework Delft3D-Eco. Level o f detail ecological processes can easily be modified. Available options include various sediment modules, fleterotrophic phytoplankton,DOM and several grazer modules
Light Extinction of visible light is a function of: inorganicsuspended matter, yellow substances (freshwater), detritus, and phytoplankton SPM
Light penetration is SPM and phytoplankton dependent
Variable c:chl ratios
Area Southern North Sea - English Channel
Nesting ability Yes. Can be used to nest higher resolution models to simulate areas with more detail.
Workshop report
59_
Annex 4

2nd OSPAR Workshop on Eutrophication Modelling 10-12 September 2007
Appendix 2 Scoring tables of target area assessments in the format of the Common Procedure
German offshore target area - G -02____________________________ ________________ ________________ ________________Harmonised assessment
parameters of the Common Procedure
DataCommon
Procedure2002
GermanyECOHAM4
NetherlandsDelft3D-GEM
NorwayNORWECOM
UK (Cefas) GETM-BFM
UK (POL) POLCOMS-
ERSEM2002 50% 70% 2002 50% 70% 2002 50% 70% 2002 50% 70% 2002 50% 70%
Cat.1
W inter DIN - - - - - - - - - n/a ? - - + - -
W inter DIP - - - - - - - - - n/a - - - - - -
N:P ratio - - - - - - - - - n/a + - - - - -
Cat.II
Chi mean ? 0 - - 0 0 0 - - n/a ? ? ? - - -
Chi max 3 ? + - - + + + + + n/a + + + + + +
Indicator species ? n/a n/a n/a + 0 0 n/a n/a n/a n/a n/a n/a n/a n/a n/a
Cat.Ill
Oxygen min ? n/a n/a n/a - - - + + n/a + - - + + +
Organic matter n/t n/a n/a n/a n/a n/a n/a n/a n/a n/a n/a n/a n/a n/a n/a n/a
“+ ’ : above the assessment level; below the assessment level; ‘O’ : mean below the assessment level but mean + standard deviation above assessment level; not enough data to perform an assessment or the data available is not fit for purpose; n/a: not applied; n/t: transboundary import.
Netherlands offshore area - N L -02Harmonised assessment
parameters of the Common Procedure
DataCommon
Procedure2002
GermanyECOHAM4
NetherlandsDelft3D-GEM
NorwayNORWECOM
UK (Cefas) GETM-BFM
UK (POL) POLCOMS-
ERSEM2002 50% 70% 2002 50% 70% 2002 50% 70% 2002 50% 70% 2002 50% 70%
Cat.1
W inter DIN - - - - - - - - n/a - - - - - -
W inter DIP - - - - - - - - - n/a - - - - - -
N:P ratio - - - - - - - - n/a + - - - - -
Cat.II
Chi mean - - - - - - - - - n/a - - - - - -
Chi max - + - - + + + - - n/a + + + + + +
Indicator species -/+ n/a n/a n/a 0 0 0 n/a n/a n/a n/a n/a n/a n/a n/a n/a
Cat.Ill
Oxygen min + n/a n/a n/a - - - + + n/a + - - + + +
Organic matter + n/a n/a n/a n/a n/a n/a n/a n/a n/a n/a n/a n/a na na na
n/a not applied; above the assessment level; below the assessment level; ‘O’ : mean below the assessment level but mean + standard deviation above assessment level;
Workshop report
60
Annex 4

2nd OSPAR Workshop on Eutrophication Modelling 10-12 September 2007
Netherlands coastal waters - NL-C2Harmonised assessment
parameters of the Common Procedure
DataCommon
Procedure2002
GermanyECOHAM4
NetherlandsDelft3D-GEM
NorwayNORWECOM
UK (Cefas) GETM-BFM
UK (POL) POLCOMS-
ERSEM2002 50% 70% 2002 50% 70% 2002 50% 70% 2002 50% 70% 2002 50% 70%
Cat.1
W inter DIN + + - - + - - - - n/a - - - + + -W inter DIP + + + + + + + + - n/a - - - + + +
N:P ratio + + - - + - - + + n/a + - - + + -
Cat.II
Chi mean + - - - - - - - - n/a - - - - - -Chi max + - - - + + + - - n/a - - - - - -Indicator species + /+ n/a n/a n/a 0 0 0 n/a n/a n/a n/a n/a n/a n/a n/a n/a
Cat.Ill
Oxygen min + n/a n/a n/a - - - + + n/a - - - - - -
Organic matter n/t n/a n/a n/a n/a n/a n/a n/a n/a n/a n/a n/a n/a n/a n/a n/a
n/a not applied; “+’ : above the assessment level; below the assessment level; ‘O’ : mean below the assessment level but mean + standard deviation above assessment level; n/t: transboundary import.
Netherlands coastal waters - NL-C3Harmonised assessment
parameters of the Common Procedure
DataCommon
Procedure2002
GermanyECOHAM4
NetherlandsDelft3D-GEM
NorwayNORWECOM
UK (Cefas) GETM-BFM
UK (POL) POLCOMS-
ERSEM2002 50% 70% 2002 50% 70% 2002 50% 70% 2002 50% 70% 2002 50% 70%
Cat.1
W inter DIN + - - - - - - - - n/a - - - + + +
W inter DIP + + 0 0 + + + - - n/a - - - + + +
N:P ratio + - - - + - - + 0 n/a + - - + + -
Cat.II
Chi mean + - - - - - - - - n/a - - - - - -
Chi max + - - - + + + - - n/a + + - + + +
Indicator species + /+ n/a n/a n/a + + 0 n/a n/a n/a n/a n/a n/a n/a n/a n/a
Cat.Ill
Oxygen min + n/a n/a n/a - - - + + n/a - - - - - -Organic matter n/t n/a n/a n/a n/a n/a n/a n/a n/a n/a n/a n/a n/a n/a n/a n/a
n/a not applied; “+’ : above the assessment level; below the assessment level; ‘O’ : mean below the assessment level but mean + standard deviation above assessment level;
Workshop report
61_Annex 4

2nd OSPAR Workshop on Eutrophication Modelling 10-12 September 2007
German coastal waters - G-ClHarmonised assessment
parameters of the Common Procedure
DataCommon
Procedure2002
GermanyECOHAM4
NetherlandsDelft3D-GEM
NorwayNORWECOM
UK (Cefas) GETM-BFM
UK (POL) POLCOMS-
ERSEM2002 50% 70% 2002 50% 70% 2002 50% 70% 2002 50% 70% 2002 50% 70%
Cat.1
W inter DIN + + (+ ) (+ ) + + 0 + + n/a + - - + + +
W inter DIP + + + + 0 0 - + + n/a - - - + + +
N:P ratio - - - - + + - + + n/a + + - + + +
Cat.II
Chi mean ? 0 0 (+ ) + + 0 - - n/a - - - - - -
Chi max ? - + + + + + + + n/a + + + + + +
Indicator species + n/a n/a n/a + + + n/a n/a n/a n/a n/a n/a n/a n/a n/a
Cat.Ill
Oxygen min - /+ * n/a n/a n/a - - - + + n/a - - - - - -
Organic matter ? n/a n/a n/a n/a n/a n/a n/a n/a n/a n/a n/a n/a n/a n/a
n/a not applied; “+’ : above the assessment level; below the assessment level; ‘O’ : mean below the assessment level but mean + standard deviation above assessment level; '? ’: not enough data to perform an assessment or the data available is not fit for purpose
* In the first application o f the Comprehensive Procedure the area covered by G-C1 was reflected in two coastal areas, one o f which scored '+ ’ and one ‘- ‘ for oxygen.
UK coastal waters - UK-C1
Harmonised assessment parameters of the Common Procedure
DataCommon
Procedure2002
Belgium NetherlandsDelft3D-GEM
NorwayNORWECOM
UK (Cefas) GETM-BFM
UK (POL) POLCOMS-ERSEM
2002 50% 70% 2002 50% 70% 2002 50% 70% 2002 50% 70% 2002 50% 70%
Cat. 1
Winter DIN + + + + + + 0 - - n/a + - - + + +
Winter DIP + + + + + + + + + n/a ? - - + + +
N:P ratio + - - - - - - - - n/a - - - - - -
Cat. II
Chi mean + - - - - - - - - n/a - - - - - -
Chi max + + - - - - - - - n/a + - - - - -
Indicator species - n/a n/a n/a - - - n/a n/a n/a n/a n/a n/a n/a n/a n/a
Cat. IllOxygen min - n/a n/a n/a - - - + + n/a - - - - - -
Organic matter n/a n/a n/a n/a n/a n/a n/a n/a n/a n/a n/a n/a n/a n/a n/a n/a
n/a not applied; “+’ : above the assessment level; below the assessment level; ‘O’ : mean below the assessment level but mean + standard deviation above assessment level;
Workshop report
62
Annex 4

2nd OSPAR Workshop on Eutrophication Modelling 10-12 September 2007
A N N EX 5 (Ref. § 4.20b)
Draft Work Programme for Calculating Transboundary Nutrient Transport in the North Sea and Adjacent Sea Areas
1. Introduction............................................................................................................................................................... 642. Context.......................................................................................................................................................................643. Objectives................................................................................................................................................................. 654. Approach................................................................................................................................................................... 655. Definitions................................................................................................................................................................. 65
5.1 Sources......................................................................................................................................................... 655.2 Transboundary fluxes and predefined areas............................................................................................655.3 Validation.......................................................................................................................................................665.4 Variables to be simulated...........................................................................................................................675.5 Simulation period(s).................................................................................................................................... 685.6 Data ...............................................................................................................................................................685.7 Detailed Approach...................................................................................................................................... 685.8 Anticipated Results..................................................................................................................................... 69
6. Arrangements for intersessional w o rk ..................................................................................................................69
Workshop Report
63
Annex 5

2nd OSPAR Workshop on Eutrophication Modelling 10-12 September 2007
1. Introduction
1. This document provides the relevant background, rationale and a draft programme of work for the determination o f transboundary nutrient transport in the context o f assessments o f marine eutrophication carried out for OSPAR. Its purpose is to address the tasks identified by EUC(2) 2005 for the ICG EMO in carrying out further work on transboundary nutrient transport (EUC(2) 2005 Summary Record, Annex 8) and to deliver the items EUC(l) 2006 identified as tasks for the workshop on eutrophication modeling held in Lowestoft (UK) on 10-12 September 2007 (click here for the workshop terms o f reference). The terms of reference are also available from the Cefas website (Eutmod).
2. The workshop was invited to prepare specifications for model applications, including a working definition for transboundary nutrient transport, selection o f suitable locations for estimating nutrient fluxes, development o f protocols for model applications and agreement o f arrangements for calculating nutrient fluxes for identified target areas including dynamics, nutrient loads, transported over specific boundaries and nutrient budgets in defined areas with a view to comparing model results if necessary through a workshop.
2. Context
3. For the past two decades marine eutrophication has been one of the major issues tackled by OSPAR. OSPAR has agreed measures committing Contracting Parties to achieve a substantial reduction at source, in the order o f 50% compared to 1985, in inputs o f phosphorus and nitrogen into areas where these inputs are likely, directly or indirectly, to cause pollution.1" To assist Contracting Parties in identifying those areas in a consistent way and setting priorities for implementing measures to combat eutrophication, OSPAR developed a common assessment framework: the Common Procedure for the Identification o f the Eutrophication Status o f the OSPAR Maritime Area (the "Common Procedure”)- This is essentially achieved through classifying waters as problem areas, potential problem areas and non-problem areas with regard to eutrophication.
4. Eutrophication in the North Sea may arise as a result o f excessive inputs o f anthropogenic nutrient loads that are discharged into the sea mainly from the large rivers. In addition to the river loads, atmospheric deposition plays a (limited) role and there are potentially significant point sources arising from the discharges from Waste W ater Treatment Plants. Point sources are generally not quantified for most countries bordering the North Sea whilst diffuse sources have largely been neglected. A further contribution of nutrients to national maritime regions results from the transboundary transport o f nutrients. These latter inputs are potentially important for downstream areas with coastal currents, and (temporarily) offshore depositional areas receiving nutrient inputs from adjacent marine areas. Identification and quantification of source(s) o f these transboundary inputs is critical in order to be able to identify and take cost-effective measures to combat eutrophication in the OSPAR maritime area.
5. For example, for the Dutch Continental Shelf the river Rhine is the largest, anthropogenically- influenced source, but to a lesser extent the rivers Meuse, Scheldt and Ems also play a role. For these rivers the nutrient loads are not only determined by emissions in the Dutch sector o f the catchment area, but also by emissions in the upstream areas o f these rivers. Additionally, the nutrient loads to the Dutch Continental Shelf are also influenced by transport from the Belgian coastal zone and possibly by discharges from UK rivers. Other relevant sources include the background loads delivered through the Channel and from the Atlantic Ocean. In their turn nutrient transports from the Dutch Continental Shelf influence the German Bight.
6. As a consequence o f various transport mechanisms, multiple sources and other contributions it is not straight forward to directly link effects (e.g. resulting in an assessment as a Problem Area) in maritime areas to cause in terms o f the individual nutrient sources. The identification o f appropriate management measures is hampered by this lack o f clarity and requires further work in order to identify all potential sources/contributions and the flows o f the nutrients. This proposed work programme describes how models can be used to estimate the flows o f nutrients through the North Sea and to determine the relative contributions o f the major sources to these flows.
111 PARCOM Recommendation 88/2 on the reduction in inputs of nutrients to the Paris Convention; PARCOM Recoimnendation 89/4 on a coordinated programme for the reduction of nutrients; and PARCOM Recoimnendation 92/7 on the reduction of nutrient inputs from agriculture into areas where these inputs are likely, directly or indirectly, to cause pollution.
64
Workshop Report Annex 5

2nd OSPAR Workshop on Eutrophication Modelling 10-12 September 2007
3. Objectives
7. The objectives are:
a. to quantify the relative contributions o f the various nutrient sources, with their natural and anthropogenic fractions, to transboundary nutrient transports and the consequences on ecosystem function and behavior;
b. to construct nutrient budgets for a number o f predefined areas;
c. to determine consequences for target areas o f any nutrient transport in terms o f eutrophication status and in particular accelerated growth and undesirable disturbance.
8. The third objective (paragraph 6c) is included to take into account the recognition by the workshop participants o f the need to consider not only the transport o f nutrients but their subsequent consequence in terms o f eutrophication status for the downstream target area.
4. Approach
9. To carry out the work the participants will compute a number o f defined simulations using dynamical ecological hydrodynamical models. The range o f nutrient sources to be quantified are:
a. the major rivers;b. the North Atlantic ocean and the Channel boundaries;c. the atmosphere.
5. Definitions
5.1 Sources
10. In the framework o f this work programme ‘sources’ are the different discharges into the North Sea.
11. For the southern North Sea the important loads are from:
• the Channel and the northern North Sea• Belgian rivers• Dutch rivers• German rivers• British rivers
12. For the northern North Sea:
• the Atlantic Ocean and the southern North Sea• Scottish rivers• Danish coast• Norwegian coast
13. And for both
• Atmospheric deposition• Substantial outflows from waste water treatment plants have to be taken into account.
14. In general diffuse sources are neglected.
15. Besides aggregating rivers on a national basis the rivers could be aggregated by box (target area) in order to be able to differentiate between e.g. UK Channel vs. river input from region UK-C1. This will be determined in intersessional work.
5.2 Transboundary fluxes and predefined areas
16. Fluxes across a boundary are called transboundary fluxes. Flux is the integration o f concentrations over a box boundary by time and velocity. Calculating fluxes are the means to determine the contribution of a load from one particular source to a specific area. The flux to be computed is the quantity that crosses the
65Workshop Report Annex 5

2nd OSPAR Workshop on Eutrophication Modelling 10-12 September 2007
boundary with the additional need to identify source. These fluxes will be measured as water volumes per unit time (Sv) or amounts o f nutrients, expressed as weight per time, e.g. mol/d or mol/y.
17. Fluxes will be calculated in both directions across the national maritime boundaries. The minimum requirement for participants is to compute fluxes over one year or a minimum number o f tides (yet to be agreed). The length o f simulation and method of calculation needs to ensure mass balance. The flux computation will need to be done online. Whether the calculation results should be presented to EUC as fluxes in both directions or as the residual flux only still needs to be specified.
18. The right time scale is essential to computing realistic fluxes. A small time step will be important to accurately compute fluxes across the boundary (e.g. using the minimum model time step). In addition, there may be a need to present results from multi-year simulations where data may better be presented on a monthly basis.
19. Targeted measures that may be required by Contracting Parties to reduce nutrient inputs to their maritime area require information on the national origin o f the nutrients and on the source. Further information on the relative contribution o f nutrients arising from anthropogenic and natural sources is also required.
20. The areas o f particular interest for work on transboundary nutrient transport are the nationalmaritime areas designated as problem areas following the [second11] application o f the OSPAR Common Procedure and where transboundary nutrient transport has been cited as a causative factor in the assessment. Prime candidates are the German Bight and the Dutch Oyster Grounds. However, calculation o f fluxes across all national maritime boundaries within the model domains (areas) is a feasible outcome for the proposed work.
5.3 Validation
21. Calculation o f water transport and if possible nutrient fluxes will be carried out for establishedEuroGOOS/NOOS transects where calculations o f water transport are routinely carried out.
22. The use o f smaller target areas than those initially proposed should be considered by the ICG-EMO in order to facilitate use o f observation data for and comparison with budget calculations and to allow for comparison with budgets that are derived from measurements. Smaller target areas could be selected that include both national boundaries and EuroGOOS/NOOS transects.
11 Note: This will depend on the timely agreement by OSPAR on the results from the second application of the Comprehensive Procedure.
66
Workshop Report Annex 5

2nd OSPAR Workshop on Eutrophication Modelling 10-12 September 2007
U K 0 5UKC5
UKC4 U K 0 4
NL02U K 0 3
NLC3U K 0 2 \ N L01
UKC1
UKC7UKC9
Target a reas
-6 -4 -2 0 2 4 6 8 10Longitude
5
Fig. 1. Target areas for the inter-comparison of the CP assessment. Red lines and blue dotted lines delineate target areas, green lines are the national marine boundaries. The blue shaded (highlighted) areas are the designated target areas for the nutrient reduction scenario testing for the second workshop in September 2007. The non-shaded areas are potentially available for calculation of fluxes but only a subset of these will be selected following discussion at the workshop. The target areas delineated in red lines have been discussed previously with the contact person for modelling of each country involved, the ones delineated with blue dotted lines are a first proposal.
5.4 Variables to be simulated
23. The minimum requirement is for nitrogen, phosphorus, and phytoplankton biomass (expressed as chlorophyll and/or as phytoplankton carbon or nitrogen, depending on the unit, used in the model), and primary production to be prognostic variables in the models used. It is also recommended to include benthic variables, as prognostic variables or as a closure function.
24. Nutrients exist in a variety o f forms (dissolved, particulate, organic, total) but the minimum required for this work would be to simulate dissolved and particulate nutrients. However, dependant upon model capability an attempt should be made to address all forms.
25. In the light o f an improved understanding o f undesirable disturbance (in the context o f the OSPAR definition o f eutrophication), relevant variables such as those relating to phytoplankton community (structure and size) should be simulated and reported. Not all o f the ecosystem models include variables relevant to the detection o f undesirable disturbance but where they do they should be reported. The ICG-EMO will provide further guidance to participants on the detection o f undesirable disturbance in model results arising from anthropogenic nutrient input.
67Workshop Report Annex 5

2nd OSPAR Workshop on Eutrophication Modelling 10-12 September 2007
5.5 Simulation period(s)
26. The calculation o f fluxes will be carried out for 2002 and in addition the year 2001 should be used for the spin-up. Data for additional years, for example 2003, should be made available if resources permit in order to investigate interannual variability in nutrient fluxes. Some participants have multi-year model runs and it is proposed that such groups be invited to provide and share data with other participants.
5.6 Data
27. Data for 2002 for the 2nd ICG-EMO Workshop have been made available on the web site (ftp://ftp.ifm.uni-hamburg .de/outgoing/lenhart/OSPAR). These data comprise:
a. Calibration and validation
b. River loads
c. Boundary conditions
d. Meteorological data
e. Atmospheric data
28. For detailed description o f the data, see the Data Description file for the 2nd ICG-EMO Workshop. In the case o f a different or additional years being proposed, new data will have to be made available.
28bis. Following the procedure adopted for the 2nd OSPAR workshop in September 2007 a larger-areamodel will be used to provide common boundary conditions to other participants running smaller domains.
29. It is desirable to have a shared dataset o f SPM (Suspended Particulate Matter) for use by the participants. A methodology for development and distribution o f such a dataset based upon remote and in situ measurements will be developed by the ICG EMO. A method o f inclusion in the models is also required.
5.7 Detailed Approach
30. Each participant is asked to carry out several model runs and to present their results to a workshop tobe held in May 2009.
31. A run with the hydrodynamical and transport model is required to estimate the water flux through adefined boundary. Where possible, participants are asked to carry out additional work to run the transport model together with a conservative tracer to allow calculation o f the fraction o f this water which originates as river input and to carry out m ulti-year simulations to investigate interannual variability.
32. The recommended work programme is to carry out:
a. a model run with a coupled hydrodynamic-ecosystem model in the ‘standard' set-up should be prepared in order to calculate:
• the nutrient dynamics,
• the nutrient loads, transported over specified boundaries,
• the nutrient budgets in the defined areas.
b. where workshop participants have the capability, to add on to (a) the use o f a ‘tagged variable' system (e.g., Ménesguen, 2006; Wijsman, 2003) that allows tracking o f specific nutrients from specific rivers through the nutrient cycle and to calculate:
• the nutrient loads from a specified river, transported over specified boundaries,
• the proportions o f the nutrient budgets in the defined areas originating from specified rivers;
c. where workshop participants have the additional capability, multi-year runs which would repeat part or all o f the above (a) and (b) simulations.
33. Detailed terms o f reference for the workshop will be developed intersessionally and presented to EUC in April 2008.
Workshop Report
68
Annex 5

2nd OSPAR Workshop on Eutrophication Modelling 10-12 September 2007
5.8 Anticipated Results
34. The proposed workshop should result in a description of:
• the relative contribution o f the different sources to the water mass o f the relevant areas;• the relative contribution o f the different sources to the nutrient concentrations and -loads o f the
relevant areas;• the relative contribution o f the different sources to phytoplankton blooms (preferably their share in
primary production, their share in biomass) in the areas chosen;• detailed presentation o f the results during the growing season (March to September).
35. Specification for the presentation o f the workshop results still needs to be developed.
6. Arrangements for intersessional work
36. The following task list for the ICG-EMO12 has been drawn up for progressing work on calculatingtransboundary nutrient fluxes and preparing a workshop in May 2009:
No. Task Target Date Task leader
1 Agree Organising Group m em bership O ctober 2007 Mills(convenor)
2 SPM specification Decem ber 2007 Van der Molen
3 Identify assessm ent/m odelled variab les for diagnosing Undesirable D isturbance
Decem ber 2007 Mills
4 Detailed arrangem ent for an OSPAR workshop for presentation to EUC April 2008
7 March 2008 Organisinggroup
5Draft User Guide incorporating agreed specification for calculation o f transboundary nutrient fluxes (including a glossary)
August 2008Organisinggroup
6 Specification for presentating results August 2008
7 Boundary conditions for 2001 spinup, for the sim ulation year 2002, and any additional years
O ctober 2008 Proctor
8 Update river loads to m ost recently available data Novem ber 2008 Lenhart
9 Extend EMEP data fo r m ulti-year model runs Novem ber 200810 Draft Data Description Novem ber 2008
11 Seek perm ission from ECMW F Decem ber 2008
12 SPM im plem entation April 2009
13 Subm it results for com pilation prior to workshop April 2009 All14 Hold W orkshop [Belg ium ?] May 2009
15 Report on 3rd OSPAR ICG-EM O W orkshop June 2009Reportingteam
ReferencesMénesguen, A. & P. Cugier, 2006. A new numerical technique for tracking chemical species in a m ulti
source coastal ecosystem applied to nitrogen causing Ulva blooms in the Bay o f Brest (France). Limnol. Oceanogr. 51: 591-601.
W ijsman, J., H. Los, J. Van Beek, 2003. Filtering capacity o f an estuary for nutrients. WL report Z2836. 51pp.
12 Members are: Dr David Mills (UK) (convenor), Dr Genenviève Lacroix (Belgium), Mr Michael Kyramarios (Belgium), Mr Kevin Ruddick (Belgium), Mr Henning Kamp (Denmark), Dr Alain Ménesguen (France), Dr Hermann Lenhart (Germany), Dr Hanneke Baretta-Bekker (Netherlands), Dr Wanda Zevenboom (Netherlands), Dr Morten Skogen (Norway), Prof. Ramiro Neves (Portugal), Dr Stephen Malcolm (UK), Mr Richard Moxon (UK).
69
Workshop Report Annex 5