Workshop Physical modeling supporting a storyline approach · The storyline approach can support...
29
Workshop Physical modeling supporting a storyline approach Oslo, April 24‐26, 2019 Organizers: Jana Sillmann, Ted Shepherd, Bart van den Hurk, Wilco Hazeleger, Olivia Martius, Jakob Zscheischler. Local Host: Center for International Climate Research (CICERO), Oslo, Norway Workshop website: https://www.cicero.oslo.no/en/publications‐and‐events_twex/workshop‐on‐physical‐modeling‐ supporting‐a‐storyline‐approach Supported by:
Transcript of Workshop Physical modeling supporting a storyline approach · The storyline approach can support...
Workshop
Physical modeling supporting a storyline approach Oslo, April 24‐26, 2019
Organizers: Jana Sillmann, Ted Shepherd, Bart van den Hurk, Wilco Hazeleger, Olivia Martius,
Jakob Zscheischler.
Local Host: Center for International Climate Research (CICERO), Oslo, Norway
Workshop website:
https://www.cicero.oslo.no/en/publications‐and‐events_twex/workshop‐on‐physical‐modeling‐
supporting‐a‐storyline‐approach
Supported by:

2
Table of Content
1. Introduction 3 Scope 4
What is a storyline of physical climate change? 5
2. Summary of Plenary Sessions 6 Session 1: Physical climate storyline approaches 6 Session 2: Generic/sector-based approaches 8 Session 3: Storylines as evidence 9 Session 4: Wider perspectives on storylines 11 Early Career Presentations 13
3. Summary of Breakout Group Discussions 14 Session 1: Physical climate storyline approaches 14 Session 2: Generic/sector-based approaches 17 Session 3: Storylines as evidence 20 Session 4: Wider perspectives on storylines 22
4. Participants 26
5. References 28

3
1. Introduction The concept of analyzing and communicating high-impact events in the climate change context via storylines has recently gained popularity in the climate modeling community. For instance, the use of case studies or storylines that could illustrate climate risk narratives has been discussed in the recent IPCC expert meeting for regional climate information (IPCC 2018a). This also calls for an expert discussion on challenges and best practices for the creation of credible storylines of high-impact weather or climate features using physical modeling and knowledge creation. The storyline approach can support decision-making processes by explicitly referring to personalized experiences with recent events, or creating unprecedented combinations of conditions that may change the impact of weather events (e.g., Bruijn et al. 2016). Storylines can help to describe and understand complex interactions between the physical, ecological, economic and societal aspects of climate change related to a specific extreme or compound event. Interestingly, the same term of storyline and narratives has been used for decades in another part of climate research, i.e. scenario analysis (e.g. IPCC Special Report on Emission Scenarios (SRES), Shared Socioeconomic Pathways (SSPs). Here, the term refers to similar underlying idea (a logical based order of events) but in the broader context of overall development. Further in this report we discuss this in more detail.
The TWEX project1 provides an example of the event-based storyline approaches where model experiments have been performed to simulate one particular storyline about a high-impact flooding event in Norway based on current process-understanding. Particular emphasis was given on exploiting a full model chain from a high-resolution Earth System model to a convection permitting Numerical Weather Prediction model to hydrological impact modeling. Various challenges as well as surprises have been experienced when simulating such a very localized event under present and future conditions. Storylines are also a useful way to investigate and communicate compound events, which are in the focus of the COST Action (CA17109) DAMOCLES “Understanding and modeling compound climate and weather events”. As a cross-Working Group meeting of DAMOCLES, this meeting is co-funded by COST. The outcome of the workshop further provides a critical component to the implementation of the WCRP Strategic Plan 2019-2028, in support of innovation in the generation of decision-relevant information and knowledge about the evolving Earth system through the framework of the WCRP Grand Challenge on Weather and Climate Extremes.
1 Translating Weather Extremes into the Future – a case for Norway (funded by the Research Council of Norway grant #255037)

4
Scope The focus of the workshop was to review the current approaches to generate climate-relevant storylines using physical modelling, and explore how they can be most effectively integrated into the wider climate information landscape in a way that helps climate communication and policies. The workshop was divided into thematic sessions, consisting of a series of short talks followed by breakout sessions, in which the participants discussed a number of questions and formulated recommendations for future application of storylines to physical aspects of climate change. The range of topics covered included:
● What are the challenges and advantages of this storyline approach (based on a particular type of event or impact selected a priori) compared to a full probabilistic approach?
● How can storylines or narratives of specific events be combined with probabilistic approaches?
● What kinds of models (GCM, RCM, convection-permitting, impact models) are required to support the storyline approach, and are useful to include in a model chain approach?
● What should be considered when designing the model experiments for localized events (e.g., resolution, ensemble size and design, choice of scenario/forcing/initial conditions)?
● What are useful approaches to combine physical with statistical modeling and the knowledge from other domains (e.g., social sciences, impact modeling)?
5
What is a storyline of physical climate change?
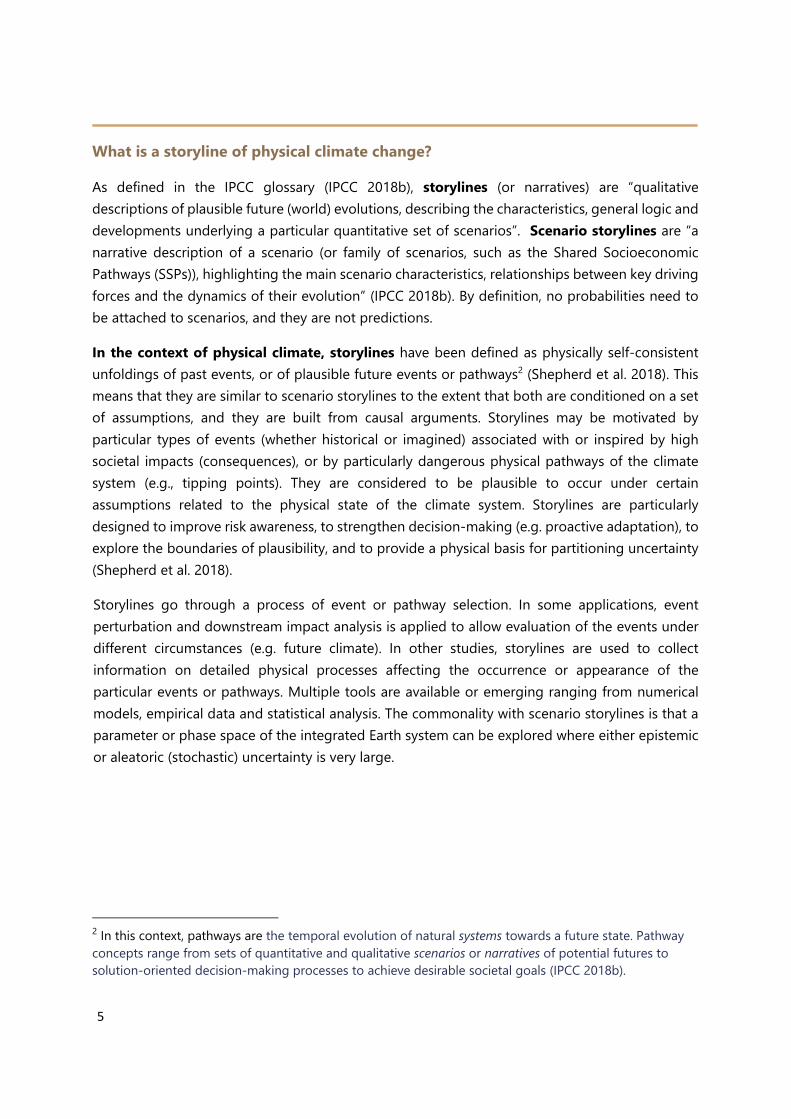
As defined in the IPCC glossary (IPCC 2018b), storylines (or narratives) are “qualitative descriptions of plausible future (world) evolutions, describing the characteristics, general logic and developments underlying a particular quantitative set of scenarios”. Scenario storylines are “a narrative description of a scenario (or family of scenarios, such as the Shared Socioeconomic Pathways (SSPs)), highlighting the main scenario characteristics, relationships between key driving forces and the dynamics of their evolution” (IPCC 2018b). By definition, no probabilities need to be attached to scenarios, and they are not predictions.
In the context of physical climate, storylines have been defined as physically self-consistent unfoldings of past events, or of plausible future events or pathways2 (Shepherd et al. 2018). This means that they are similar to scenario storylines to the extent that both are conditioned on a set of assumptions, and they are built from causal arguments. Storylines may be motivated by particular types of events (whether historical or imagined) associated with or inspired by high societal impacts (consequences), or by particularly dangerous physical pathways of the climate system (e.g., tipping points). They are considered to be plausible to occur under certain assumptions related to the physical state of the climate system. Storylines are particularly designed to improve risk awareness, to strengthen decision-making (e.g. proactive adaptation), to explore the boundaries of plausibility, and to provide a physical basis for partitioning uncertainty (Shepherd et al. 2018).
Storylines go through a process of event or pathway selection. In some applications, event perturbation and downstream impact analysis is applied to allow evaluation of the events under different circumstances (e.g. future climate). In other studies, storylines are used to collect information on detailed physical processes affecting the occurrence or appearance of the particular events or pathways. Multiple tools are available or emerging ranging from numerical models, empirical data and statistical analysis. The commonality with scenario storylines is that a parameter or phase space of the integrated Earth system can be explored where either epistemic or aleatoric (stochastic) uncertainty is very large.
2 In this context, pathways are the temporal evolution of natural systems towards a future state. Pathway concepts range from sets of quantitative and qualitative scenarios or narratives of potential futures to solution-oriented decision-making processes to achieve desirable societal goals (IPCC 2018b).
6
2. Summary of Plenary Sessions3
Session 1: Physical climate storyline approaches
Four presentations were given in this session.
Ted Shepherd (on behalf of Julia Slingo) A recent assessment of UK flood risk, performed by the Met Office, was presented. It was stimulated by major floods in the UK, which raised questions within the UK Government about whether the existing flood risk maps were fit for purpose. Thus the question was not about climate change per se, but about how much worse the flooding might have been under current climate conditions. To address this question, the decadal hindcast archive (1400 years of data) was used to search for black swan events and to put the historical flood events into a more robust probability context for the present climate. The probabilities were necessarily attached to a proxy indicator rather than to flooding itself, in this case of monthly averaged precipitation over large regions of the UK. The results showed that in each winter there is a 5-10% probability to experience a precipitation event in the UK of unprecedented intensity (Thompson et al. 2017). The worst-case precipitation uplift factors determined from the hindcast ensemble were then applied to high resolution weather forecasts of historical storms in combination with flood models, to stress test the flood risk maps. The assessment thus employed a storyline approach, where the counter-factual perturbations were determined from probabilistic information.
Douglas Maraun presented an event-based storyline approach to study high impact precipitation events by keeping the large-scale circulation fixed (through nudging) but changing the thermodynamic conditions. The changes in thermodynamic conditions were informed from RCP8.5 AR5 simulations and introduced during a 9 month spin-up. However, the detailed procedure of how to extract the changing thermodynamics from AR5 remains an open question. Should the changes be based on the mean changes or on changes on high-precipitation days? Also how should changes in temperature and humidity and related changes in stability be applied? How to treat the soil moisture?
Andreas Zischg presented a flood loss model for a meso-scale Swiss catchment based on a model chain that feeds gridded precipitation fields into hydrological models that are coupled to a hydraulic model and a flood impact model (Zischg et al. 2018a, b; Felder et al. 2018). The main goal was to identify the spatiotemporal rainfall pattern leading to the possible maximum loss in the river basin. Variability in the rainfall pattern has been demonstrated as one of the main
3 All presentations can be found on the website: https://www.cicero.oslo.no/en/presentations-held-during-the-workshop-on-physical-modeling-supporting-a-storyline-approach

7
determinants of flood impacts. The rainfall pattern controls the magnitude and timing of the flood peaks coming from the sub-catchments. The model experiment showed that the peak flow coming from a single sub-catchment or superimposition of peak flows can be responsible for a relevant share of the total sum of exposed buildings and flood losses. Thus, the physical variability of the river basin is connected with the topological situation of the main settlements within the river basin, i.e. the spatial pattern of exposure. The spatial setup of the values at risk within the floodplains leads to the basin-specific sensitivity to a certain event characteristic. The results show a strong sensitivity to the vulnerability curves and a non-monotonic relationship between inner-catchment flood loss and catchment outflow. This has implications for identifying the storyline of a precipitation event leading to the flood event with the highest flood losses. The knowledge of such an event supports bridging top-down modelling approaches and bottom-up sensitivity studies and is a prerequisite for stress test analyses and insurance portfolio analyses (see also Figure 1).
Geert Lenderink introduced the pseudo global warming (or surrogate global warming) approach where a historical high impact rain event is simulated with a regional climate model with superimposed global warming conditions, e.g., an increase of the temperature of the lateral boundary and initial conditions by a given value. This approach captures thermodynamic changes driven by moisture increases but does not account for changes in circulation and it can hence not capture events that do not have an analogue in the past. When events are selected that produce an extreme rainfall amount for a given circulation, the risk of an asymmetric response to perturbations provided via the initial and lateral boundary conditions is present. A system that is already selected for giving high rainfall will possibly respond weaker to a warming perturbation (that would produce even more rain) than to a cooling perturbation. It is recommended to always carry out both warming and cooling experiments.
In summary, this session gave several examples on how different physical modeling approaches can be used to provide quantitative data to support event-based storylines. Besides using different models, from global to regional and impact models, a difference also appeared in the way the events of interest are selected or physically simulated. For instance, events can be selected from a set of climate simulations (or impact simulations) (e.g., by analogues or thresholds) or climate models can be “forced” to produce the desired event (e.g. constraining some parameters in the model).

8
Session 2: Generic/sector-based approaches
Three presentations were given in this session.
Alex Hall reported on the vulnerability of the highly managed California water system to major floods. In the “waterscape” of California, large artificial diversions of water have been implemented, basically moving water from the wet North to support a large population and agriculture in the Central Valley and the dry South. The highly variable hydroclimate was abruptly distorted by a major winter storm sequence in the 1861-1862 season, which is not well captured in the instrumental records. However, it may be considered as a black swan event which is also plausible under current climate conditions, with a roughly 200-year return period. If it were to occur again, it would have a devastating impact given the current reliance on the human managed water system.
A large climate model ensemble was used to search for 1861-1862 analogues during the remainder of the 21st century (Swain et al. 2018). The single-model, multi-realization ensemble indicates that such an event is nearly certain to occur at least once due to local manifestations of global hydrologic cycle intensification. A separate study (Schwartz et al. 2017) demonstrates that climate warming will also change runoff characteristics in California’s Sierra Nevada, increasing runoff flashiness, partly due to a shift in precipitation from snow to rain. Ongoing high-resolution modeling of atmospheric rivers over California indicates an increase in their frequency and intensity over the 21st Century.
The implications of these studies are that the California water system, “calibrated” upon the historical record of natural variability and extreme events, is not designed to cope with events analogous to the 1861-1862 case. The demonstrated plausibility of such an event and the credible physical narrative suggests this poses a serious risk to the local society.
Gordon Woo discussed the use of storylines of compound events in the insurance business. Here a potential gap exists between the so-called “Maximum Credible Loss” (based on probabilistic or historical analysis of past events) and “Maximum Possible Loss” where storytelling techniques are needed to also fill in events that have no precedent in the historical record. The storylines may be rooted in observed extreme events, but perturbed to account for different expressions of the event (an even more eastward trajectory of the European hurricane Ophelia, for instance) or for physical climate change factors. They can also be used to explore how much more extreme a historical event could have been. A hierarchy between actual, plausible alternative and extreme alternatives may be defined to explore the risk profile of the asset portfolio.
Trine Jahr Hegdahl presented an event-based storyline related to the impacts of climate change on floods associated with atmospheric rivers in Western Norway (Hegdahl et al. 2019). The event-

9
based approach is considered to give additional detail and recognition for stakeholders and people affected. Based on a spatial analysis of present climate precipitation over western Norway, extreme precipitation events were selected in the EC-Earth climate model for both present and future climate conditions. Analogue events were reproduced in the EC-Earth climate model as an ensemble by perturbing some characteristics in the simulations. The ensembles were generated for both the present and a future climate, and downscaled with a limited area weather prediction model. Discharge levels were calculated with the hydrological model for a range of catchments in Western Norway. Using flood warning thresholds and visuals that are very well recognized and used in practice in national flood warnings under current conditions, the hydrological simulations were used to produce flood alerts for the future analogues. Changes in the flood warnings indicate that future floods associated with atmospheric river events will be more intense (trigger more severe flood warnings) and occur in many more catchments at the same time.
In summary the session reported on chasing unprecedented events either in the present or in the future climate, aiming at a better “alert awareness” of the fact that even if these events have not yet taken place, it does not imply they’re not plausible.
Session 3: Storylines as evidence Four presentations were given in this session.
Liese Coulter presented a case study of the water resources management in the Cowichan Valley on Vancouver Island, British Columbia. The water resources are used by a variety of competing interests: agriculture, a pulp and paper mill, residential use, and salmon fishing. The fishing itself serves a variety of stakeholders, including First Nations, both the commercial and recreational industries, and tourism. An unprecedented low water level was reached in the Cowichan River in the spring of 2019, which required heroic efforts in order to rescue the year’s salmon stock. Climate change can be expected to alter the hydrological cycle in this region in a number of ways, which together suggest there will be less water available to sustain summer flows, with a higher likelihood of water-stressed communities and increased conflicts. However, the region is used to heavy rain, with a history of severe flooding events in recent memory, making it difficult for stakeholders to imagine the need to manage drought. One way to address this is to develop models of water resources, such as the Agriculture Water Demand Model, which can be used to explore scenarios and raise risk awareness and competing demands among participants.
Lisa Lloyd discussed the current lawsuit, ‘Juliana vs US’, where 21 plaintiffs have sued the US Government for violating their fundamental rights (e.g. to health, property, recreational interests, etc.) by failing to mitigate carbon emissions. Because the US Government has accepted the IPCC reports, it cannot deny that there has been climate change. Therefore the case rests on whether

10
climate change can be shown to have caused the damages in question. Importantly, the plaintiffs are not requesting financial compensation, but only a no-cost response from the Government: a US carbon plan. As a result, the value of the damages does not need to be assessed, and the burden of proof is only ‘the preponderance of evidence’. The plaintiffs have called Kevin Trenberth as an expert witness, who has used a storyline approach to attribute the specific damages (e.g. Alaskan wildfires and permafrost loss) to climate change, drawing on statements from the IPCC reports concerning those kinds of damages. The Government expert witness, John Weyant, has argued that it is not possible to draw inferences from the general to the specific because of the inevitable presence of confounding factors. It will be interesting to see how this argument plays out in a context where the burden of proof is much lower than in a conventional scientific context (e.g. 95% confidence).
Adam Sobel discussed an imagined scenario under which a tropical cyclone hit the city of Mumbai (Sobel et al. 2019). This has not happened in recorded memory; a Wikipedia entry describing a tropical cyclone in 1882 turned out to have been an urban legend. Thus, Mumbai is not prepared for such an event, but would be extremely vulnerable, since it is mainly built on landfill with a narrow access corridor, and has a very large population. Indeed, the city has been shown to be flood-prone by recent events in 2005 and 2017, and is in the top 5 coastal cities most at risk from flooding, even before worrying about tropical cyclones. Tropical cyclones do occur in the Arabian Sea, but are rare (one or two per year). They can track northwards past Mumbai, but mostly don’t turn right. However, the left turn exhibited by Hurricane Sandy, which brought it onto New York City, also had not happened before. To explore potential tropical cyclone risk, large ensembles of synthetic tracks can be generated, some of which do hit Mumbai. Also, there are general expectations of increased tropical cyclone risk in the Arabian Sea from climate change. Yet because of the absence of historical evidence, it seems to be difficult to communicate this risk.
Pascal Yiou addressed the issue of how to sample rare events with climate models (Yiou&Jézéquel 2019). The issue is that with conventional free-running simulations (even with atmosphere-only models), tail probabilities of dynamical extremes are not well sampled, and extreme events are necessarily characterized with rather blunt statistical indices (typically univariate, or at most bivariate). Yet stakeholders relate to physically realistic weather events, which can also allow evaluation of compound risk. Circulation analogues are a well-established (and easily communicated) method of representing extreme weather risk conditional on the dynamical setting. Recently developed rare event algorithms, based on the mathematical concept of importance sampling, provide a way of focusing simulation efforts on events that are selected for their importance for a particular climate risk, e.g. atmospheric blocking in the case of heat waves. A proof-of-concept calculation was presented where 100 such events were simulated with return periods of around 1000 years, at the cost of only having to simulate 100 summer seasons.

11
In summary, the presentations illustrated that the concept of evidence is very contextual and can take a variety of forms, yet is crucial for decision-making. As the eminent British hydrologist Keith Beven has written “Decision and policy makers are . . . far more interested in evidence than uncertainty” (Beven 2016).
Session 4: Wider perspectives on storylines
Three presentations were given in the session with a wider perspective and a particular focus on impacts and drivers of climate change. Hence sectoral considerations were given, each plausible and self-consistent.
Melissa Bukovsky took a physical storyline approach to describe the changes in the hydrological cycle in the Southern Great Plains of the USA (Bukovsky et al. 2017). This region includes part of the catchment basin of the Mississippi River, is a ‘hot spot’ for land-atmosphere coupling, and experiences an active severe convective weather season. Her work stressed the use of existing model ensembles, and analysis within and across the simulations in the ensemble, to explain projections and determine their credibility. The storyline focused on the physical understanding of changes in complex processes that govern specific weather event types, not an individual event, to determine whether the projections of warm-season precipitation by the NARCCAP (North American Regional Climate Change Assessment Program) ensemble were physically plausible. The processes examined included, but were not limited to, the moisture flux from the Gulf of Mexico associated with a low-level jet, a mid-to-upper troposphere anticyclone, an upper-level jet, and land-atmosphere coupling strength. The resulting physically plausible narrative for projections in this region could be leveraged in the production and analysis of event-based storylines, which could, for example, include the 2015 spring flooding that was caused by an anomalously high number of mesoscale convective systems.
Detlef van Vuuren presented the scenario approaches from the integrated assessment community point of view. This community has a long history in storylines and scenarios, used for instance by IPCC and it has shown the relevance for exploring policy options and linking communities. For IPCC such scenarios are narratives or storylines that constitute qualitative descriptions of plausible future world evolutions, describing the characteristics, general logic and developments underlying a particular quantitative set of scenarios. Detlef explained the relation between Representative Concentration Pathways and Shared Socioeconomic Pathways, the latter being possible stories of future socio-economic developments and interactions. The characteristics of probabilistic risk-based approaches and scenario storyline based approaches were presented. There is a long-standing debate about the usefulness of these (e.g., Schneider 2001, Grübler & Nakicenovic 2001). There are clear relations to the event-based storylines on
12
which this workshop focused on. Event-based storylines are clearly more specific than e.g. SSPs, however there are similarities on the use and attractiveness of the approaches.
Katja Frieler focused on the impact of climate climate change for various sectors. Starting with the damages and losses as reported by reinsurance companies, she explained how various sectoral impact models can be used to widen storylines from the physical picture to the impacts for sectors in a self-consistent manner. This includes sectors and models of agricultural production, coastal infrastructure, fisheries etc. The ISIMIP impact model intercomparison provides a wide range of information to include the sectoral impacts in the storyline approaches. She compared the ISIMIP approach to a fruit basket of which event-based storylines could be picked as “fruits” to look closer in the respective impacts associated with certain high-impact events.
In summary, in this session a wider physical climate change perspective, a wider sectoral climate impact perspective and a wider scenario methodology perspective were presented and discussed. The physical and impact perspectives were useful as they can enrich the event-based storyline with a plausible physical explanation of a future change and the model tools can be evaluated for accuracy and credibility. The impact perspectives widen the story and the relevance. Event-based storylines share characteristics with the known RCP and SSP scenario pathways, but are much more specific because they address events in a self-consistent and plausible manner. Also, they really are storylines, in contrast to probabilistic scenarios.
13
Early Career Presentations
William Ball: Continued decreases in the ozone layer: unfortunate timing of events or a serious threat?
Marisol Osman: Activity of the Southern Annular Mode during the Strong El Niño 2015-2016: less unusual than it used to be?
Karin van der Wiel: Extreme impacts from moderate meteorology
Francesco Ragone: Studying extreme climatic events with rare event algorithms applied to numerical climate models
Aglaé Jézéquel: The storyline approach for extreme event attribution

14
3. Summary of Breakout Group Discussions
Session 1: Physical climate storyline approaches Q1: Reasons for working with “event-based” or physical climate storylines? The starting point is often an inciting event (an anchor, a specific adaptation question, a trigger) and ideally, event-based storylines can be pictured as being real, thus give a powerful motivation. A crucial step in the process is to isolate and describe the “event” to reduce or disentangle the complexity. Event-based storylines are readily inspired by impacts (including social impacts), expressed by an impact metric (quantitative / qualitative) and involve a broad range of stakeholders and experts to build a common understanding of the problem or questions to be answered in an iterative process (see Figure 1). The scope of the event-based storyline has to be locally accepted and questions of equity, cultural aspects and social justice need to be considered.
Advantages of event-based storylines are that people tend to better relate to high-impact events that they have experienced or observed, and probably can then better understand projections of future impacts of similar events. Furthermore, climate change is not a necessary component of the storyline approach, which aims at explaining processes that lead to extremes not always incorporating the influence of global warming on these processes (e.g., dynamics, system sensitivity). Event-based storylines are a useful method to describe and understand the complexity of drivers behind a «high-impact» event.
While there may be different motivations behind using (scenario versus physical climate) storylines they all have in common to step back from the probabilistic framing that climate change has generally used so far. A good example of the use of storylines are stress-tests, which are usually designed without probability attached, but relying on a plausible chain of causal assumptions.
Often enough stories or narratives of climate change exist that are not told by scientists (e.g., mainstream movies). Thus, scientists could and should provide more credible stories (based on science), and be more illustrative (e.g., using movies or other communication means) in communicating climate change (e.g., go beyond changes in return values or colorful maps). However, a storyline of an event could provide the impression of certainty due to the specificity, which may pose a challenge for communication.
Several opportunities for the use of event-based storylines have been pointed out. One example is the decision context related to infrastructure, which in many cases is maladapted to current climate, let alone climate change. Focusing on current risk may increase plausibility for future events. Furthermore, event-based storylines could be constructed for disasters possibly happening in regions with conflicted water ownership and management, for example addressing

15
the question of at what point a situation becomes unmanageable. Following the Day Zero near-miss in Cape Town, one could construct Day Zero storylines elsewhere, e.g. for the Metropolitan Water District in Southern California which is the agency of last resort for water in that region. Focusing on that agency removes much of the “upstream” complexity (causal effects become local). Event-based storylines are helpful in handling discordant information to support decision making, but model fidelity issues may still affect certain aspects, e.g. extreme event intensity, persistent circulation regimes, and land-surface feedbacks, which undermines their credibility and usefulness.
Figure 1: Connecting top-down and bottom-up approaches via iterative processes between scientists and stakeholders. From Zischg 2019 Q2: Is a categorization or typology useful and can we work with that? It is certainly useful to distinguish between the terms pathways, storylines or narratives, scenario storylines and physical climate storylines. The latter has not yet been represented in the IPCC glossary (e.g., IPCC 2018b).
There are different methods to model the physical events as a basis for the event-based storylines, for instance event simulations (where the model is physically constrained to produce a particular event) versus event sampling from physical models (where the physical models are run freely and analogues of the desired events are selected from the model simulations). The latter is often based on our understanding of the dynamical drivers of a particular event (e.g., presentations by Trine

16
Hegdahl, Ted Shepherd and Alex Hall ). The concept of event can be broadened to pathways such as trends and slow changes if they result in tipping points of natural or human systems.
The level of machinery we need to set up to create effective storylines that are based on physical modeling depends on what the purpose and use of the storyline is and how much time and resources there are to do the modeling (e.g. Julia Slingo’s presentation). Pragmatically seen, we should use what is good enough, also referred to as the «soft Bayesian» approach, or “Bayesianism with a human face”. The art of looking at multiple lines of evidence is inherent in the Bayesian approach, but a strict application of Bayesian methods requires the assumption that we know the prior probabilities. In a soft Bayesian approach, it needs to be articulated what confidence can be gained by incorporating new knowledge, without having a concise prior.
Storylines are particularly useful for addressing type 2 errors (falsely rejecting signs of climate change) while avoiding a more alarmist perspective risk of being wrong (type 1 error). By focusing on the avoidance of type 1 error, climate science has traditionally prioritized the avoidance of false positives (e.g., overstating the effects of climate change) over false negatives (Shepherd 2019).
Q3: What are the limitations of starting from a physical modeling /hazard perspective? Starting from a physical modeling perspective should not narrow an event to its climate change aspect, but rather focus on an impact oriented sampling (hunt for extreme events that give higher losses, find the relevant parameter space). The modeling of event-based storylines should start from an impact-driven bottom-up approach to define the event, the impact metric and the scope of the storyline and then relevant stakeholders and modelers can define a credible, plausible and trusted manipulation of the events, for instance to simulate or find a similar event in a different climate (or socio-economic) setting.
Starting with a question about plausibility can be an entry point for discussions with users and learning about their questions. Developing event-based storylines with users makes it the most sensible strategy to ensure co-ownership and relevance to the user. Probably a lot of users find this way of starting a collaboration/conversation with physical scientists very appealing, and it’s more the physical scientists who struggle with the concept of a storyline, because they are already stuck in a predetermined probabilistic way of thinking.
As for the scenario storylines, there are no probabilities attached to it. Thus, there is no need to put a probability on event-based storylines (i.e. it is plausible based on the tools we have used). But a notion of credibility (physical plausibility) must be delivered. Tools producing events must be verified, physical processes must be understood and make sense, details of location, timing and interaction of processes and drivers must be realistic.

17
Session 2: Generic/sector-based approaches Q1: What are good examples of where storylines have been useful in decision making contexts? The following examples have been discussed:
● Hurricane Sandy: Studies on near misses started 20 years ago –> informed emergency response
● Extreme storm in Copenhagen: other cities learn from experience and assess vulnerability to similar events (transfer of awareness)
● Portugal fires 2018: unprecedented (too fast) future conditions will facilitate fires; villages took action, e.g. installed a fire marshal
● Extreme event attribution statements based on storylines are used more often in the media (US), helping to convince climate deniers.
In general, good examples of storylines are those that start from the vulnerability of a considered system (vulnerable places, weak points, potential societal and economic impacts and losses), highlight extreme but plausible scenarios, and are convincing or appealing to stakeholders. Most success stories identified in the workshop were related to historical events, downscaling and impacts (see summary of presentations in the plenary session above). Q2: Which criteria do storylines need to fulfill to “work”, e.g. ability to include local information and reach out to other aspects than the hazard element? The following criteria have been identified:
● Familiarity with audience ● Ability to connect impact and hazard (modeling) approaches ● Framing in terms of impacts (e.g., economic impacts, casualties, cultural) ● Include more aspects than just hazards (e.g., vulnerability, exposure, perception) ● Need to be physically consistent ● Could also be informed by “near misses” (events that did not result in high consequences,
but could have if some aspects in the storyline would have been changed) ● Ability or potential to provide actionable information ● Stakeholders are fully engaged and interact (not only receiver of information) ● Plausibility, but this is subjective in itself, for instance is it tangible (see it, feel it, touch it..);
visible and memorable, appeal to past experience generally helps ● Provides metrics and indicators relevant to stakeholder (e.g. design criteria infrastructure,
operational systems use) ● Brings attention to different sources of uncertainties, but need to be explicit about whether
addressing Type 1 and Type 2 error (and why) as this will always be contextual

18
● Need for multiple storylines, to avoid appearing over-confident
There are some challenges associated with storylines if used inappropriately resulting in adverse environmental or legal effects as would be the case with any type of environmental information. They could be interpreted as forecasts and considered too representative, or forced into a probabilistic design concept. And caution has to be given to probabilistic statements about very rare events (e.g., extreme surge in Netherlands or events leading to a collapse of insurance companies). In addition, counterfactuals (with more negative outcomes) are often very difficult to convey. Another challenge is related to “cherry-picking” when focusing on particular events, which however is defensible when one is targeting the answer to a particular question. The most elegant form of mathematical proof is “proof by contradiction”, which is cherry-picking! Hence, when developing storylines some good practices should be followed. First, an inventory of researchers’ and stakeholders’ values (where one needs to be explicit about differences between beliefs and values) should be established. While storylines can be an effective way to influence decisions, they need to stay attached to the decision-making processes that can be subject to different value sets (e.g., the selection of events may be subject to certain values). Second, a careful documentation of underlying assumptions and methods leading up to the storylines needs to be undertaken. The boundaries of what is considered to be part of the event and what is outside should be defined carefully, and it should be ensured that it is adequate for purpose. Third, the credibility of the scientific method to generate the storyline must be demonstrated (i.e. solid reasoning, peer review, plausibility check by model validation, etc.). The “precision” (physical credibility) needs to be carefully communicated, which includes a confirmation of plausibility and some sense of probability. Fourth, storylines should be transparent, can be audited and changed, and allow exploiting impacts and effects well beyond the physical realm. This is relevant when combining them with for instance adaptation pathways. That is, choices in actions change the storyline, while the actual meteorological event itself mostly is not affected (unless there are feedbacks). After all, storylines are a combination of subjective and objective elements, but the analysis needs to be reproducible (under the same assumptions). Last but not least, what defines successful storylines should be taken from experience. Indicators for the success need to be identified. We could learn from other domains where storylines are used, for instance for emergency planning related to earthquakes (e.g. Great Shake Out (hypothetical large earthquake), nuclear disasters or pandemics). When designing storylines, decision makers should take into account multiple hazards, not just atmospheric hazards, and their potential cascading effects to get a comprehensive risk assessment. For instance in risk registers the same procedure is used for all hazards.

19
Overall, creating a storyline takes a lot of effort, including interaction between scientists and decision makers, technically in designing and performing model computations, in representation of results, etc. Construction of storylines is not the same as just telling a story, but involves consideration of how to physically simulate the event or pathway and get a sense of its plausibility, but the art of storytelling is very useful for communicating the results. It would be helpful to have some generally supported guidance on developing storylines. Q3: How can storylines be linked to some sense of probability (conditional probability) by e.g. dependence on external drivers? This seemed to be a difficult question to address. Many other questions were raised in the discussions, for instance:
● How to explore the parameter space of conditioning? ● Can probabilistic reasoning be replaced by logistic reasoning? ● Can we define “external” drivers (atmospheric circulation) to which probabilities can be
assigned? ● How to shift events between locations (or how to treat the probability of an event at
different locations) to communicate potential risk?
Probability estimates based on model ensembles (e.g., global and regional climate models) are known to be of limited quality or complexity, due to model biases, sampling issues and insufficient representation of relevant process interactions. Real events also often require incidents that are not included in the probabilistic equation (e.g. forest fires usually need to be ignited by people). Storylines can raise awareness of the limitations of this approach, mapping unexpected vulnerabilities using stress-tests. These may lead to refined (engineering) design decisions, which heavily rely on probabilistic approaches, such as return value estimates. Engineering methods have a large persistence, which helps getting to actual decisions. It is advisable to give context to a storyline, and this may include the probability of occurrence, e.g. via sampling from a large ensemble and then downscaling or based on observed records (as in Julia Slingo’s presentation). If the event is not or cannot be credibly simulated (e.g., because it is too fine scaled for traditional models), other (physical and empirical) knowledge should be included. Some ways forward were suggested. A scenario setting needs to be used (e.g., SSPs) or generated in which the storylines can be effectively used to map potential consequences of climate change, protection measures, socio-economic drivers, etc. By conditioning, e.g. given the boundaries of an event, the probability space can be explored from there. However, the dimensionality of the “stress test” conditions in the storylines are governed by the available budget (e.g. use and setting

20
up of regional (let alone convection-permitting) climate models is costly and can currently not be done for an unlimited number of locations). Lastly, using a Bayesian approach can aid in factorizing probabilities and get more of a grip on probability.
Session 3: Storylines as evidence Q1: Do we need to associate storylines with probabilities? Is plausibility enough? It should be asked first when designing an event-based storyline (with a stakeholder) what is needed to make a decision or what can the decision be based on and (to what extent) does it include or need knowledge of probabilities. In some cases, assigning probability may not be useful or could even be counterproductive if there is a very low probability. In those cases, plausibility is more relevant (e.g., in the context of stress testing or creating public support for adaptation measures). Using a Bayesian approach (i.e. Bayesian with a human face) also qualitative probabilities can be sufficient (e.g. one event or outcome is perceived to be more likely than another). To avoid having to give exact probabilities, also graphical communication (color coding, as in “burning embers” in IPCC (2018b) and use of categories of events could be used, such as fire categories or the Norwegian rubber boots for flood warning levels (see Hegdahl’s presentation). Q2: How can probabilities be added to storylines to define their relevance for decision making? What actually means probability? This can be different for different people and stakeholders (e.g., return periods, very precise numbers, or just a loose sense of likelihood). Probabilities can also be derived from expert judgements (e.g., Mastrandrea et al. 2010), but that can be subject to biases depending on the composition and size of the expert group. It is also possible to place probabilities on conditional statements, in the sense of “if this happens, then this would be the consequence if all conditions are met, and the probability of impact becomes this much”. Again, a Bayesian approach (i.e. Bayesian with a human face or soft Bayesian) could be used, which is based on the ingredients of the events. Q3: Will people trust storylines? If yes, when and why? A range of criteria are relevant for building trust in storylines:
● personal experience is important ● historical analogues ● story seems logical ● transparency of assumptions ● physical plausibility ● authority of the experts

21
● ownership by the stakeholders (i.e. key stakeholders need to be engaged from the beginning)
● possibility of generalizations (from case studies), for instance when out of experience or observations the same weather pattern leads to extreme heatwaves, or atmospheric rivers lead to heavy precipitation events.
Storylines should be seen as educational, thus can be used complementarily to an engineering approach that is based on a probabilistic framing (i.e. deriving return periods). Conditioning provides for more robust statistics in the tail of the distribution, essentially by controlling for confounding factors. Event-based storylines then enable to interpret the data in a particular context, rather than trying to remove confounding factors through e.g. regression (which is prone to the Yule-Simpson effect4). Accounting for non-climatic causal factors is important in establishing the causal role of climate change. Storylines can help do this, by controlling for confounding factors through conditioning and necessary causation (Shepherd 2019). Storylines can also account for events changing over time (e.g., summer 2003 in a future setting) under different assumptions of climate warming and socio-economic development. If storylines are used as evidence then the level of evidence required depends on what is at stake (high stakes require higher levels of evidence), but also is different from the liability perspective which is becoming increasingly topical (see Lisa Lloyd’s presentation). Q4: What counts as evidence? Evidence in support of storyline plausibility can come from various sources:
● Expert judgment ● Observations / empirical data ● Statistical, conceptual, and/or numerical models ● Predictive capabilities / skill ● Empirical support for the parametrizations ● Laws of physics ● Evidence for correlations (in the model) ● Evidence for causation ● Independent confirmation of results ● Evidence in support of the models (e.g., evaluation)
4 a phenomenon in probability and statistics, in which a trend appears in several different groups of data but disappears or reverses when these groups are combined. This result is often encountered in social-science and medical-science statistics and is particularly problematic when frequency data is unduly given causal interpretations. The paradox can be resolved when causal relations are appropriately addressed in the statistical modeling. Simpson's paradox has been used as an exemplar to illustrate to the non-specialist or public audience the kind of misleading results mis-applied statistics can generate. Source: https://en.wikipedia.org/wiki/Simpson%27s_paradox

22
In general, evidence depends on the audience (scientists vs. lawyers). It was cautioned that it is difficult to decide what is credible (e.g., by peer-review?) and by whom (e.g., scientists, stakeholders, a judge?). Storylines are case-specific, and it is unclear how many peer-reviewed publications are needed to make it a generally accepted method for creating evidence. First of all, the climate science community needs to support and accept the storyline approach as a credible way to produce knowledge and provide evidence by zooming in to particular events using climate models complemented by other contextual information.
Session 4: Wider perspectives on storylines Q1: How can (physical climate) storylines be connected to the wider perspective of scenario storylines and narratives? Climate models can be used to provide data for event-based storylines, e.g. referring to future events or reconstructing past events. However, physical climate storylines are not necessarily event-based. The original motivation came from extreme event attribution, but the concept discussed here is more general. For example, one could consider storylines of high or low climate sensitivity (which would affect carbon budgets), or storylines of changes in extreme precipitation and consequences for adaptation without attribution to climate change. Furthermore, process-based model selection (and culling) is important for many impacts, e.g. hydrology (as seen in various presentations in this workshop). Storylines can further be put in the (regional) SSP context, where climate and socio-economic impacts (cost/options) vary with the chosen SSP. National interpretation of SSPs can be a useful reference in this context as risk assessments often have to be made at local and national scales, so organisations at a national/political level can give strong mandates to the use of physical climate storylines. However, more objective methods should be applied than just consulting a limited number of experts in a group think setting, which can result in individual expert judgement being ingested in a storyline and ignoring other perspectives and values (e.g., of minorities). Storylines could also be a very useful way of looking at local adaptation options. These could be cast within SSPs, if desired; however, local communities will probably want to use their own scenarios. At the end, the relevant scale should be determined by the stakeholders as they need to take decisions related to adaptation. It is however challenging to bridge scales as SSPs are designed to express generic aspects, although SSPs can also have a local expression. They can be connected to local socio-economic developments using ‘local’ data and information consistent with SSPs. It is possible to use the data

23
from the global model (i.e. integrated assessment models) or maybe better, just use the underlying narrative of the SSPs, and combine them with local information on socio-economics. Q2: Can storylines be useful within scientific assessments, e.g. IPCC? Can they serve as an effective bridge between WGI science and the science of WG’s II and III? Working Group 1 (WG1), currently in the process of writing the 6th Assessment Report of the Intergovernmental Panel on Climate Change (IPCC), is challenged to present more risk based approaches that include low-probability, high-consequence situations (Sutton 2019). Storylines could be a way to address this challenge in situations where credible probabilities are not available. Given that scenario storylines are well known, it would be helpful to connect physical climate storylines to scenario storylines and underline their differences and similarities. Since the storyline concept is not yet widely established in the climate science community, it needs explanation and additional proof-of-concepts. More particularly, to help establish the storyline concept and terminology the general principles and methodology should be assessed and documented. However, the various examples presented in this workshop have illustrated that there are many approaches and applications for storylines already in the literature. There are also examples of storylines in the recent IPCC Special Report on 1.5 degree (IPCC SR1.5 Cross-chapter Box 8, Table 2 (Hoegh-Guldberg et al. 2018)). In AR6, examples of storylines could also fit well in the IPCC WG2 context and also in the regional chapters of WG1. Additional benefits of using storylines could be gained in regions where the uncertainty of the response to global warming is unclear, and where the use of different counterfactual storylines may be helpful, such as in illustrating different plausible outcomes of changes in West African rainfall under global warming (current models disagree on the sign of change in this region). In this case they can be embedded in global storylines of future warming and socioeconomic development. As case studies are a standard way of working in the social sciences, this could provide a useful link to WG2, but also to WG3. For instance, they could be useful in the context of extreme events acting as a trigger for mitigation actions or for illustrating that mitigation efforts can be affected by climate extremes which would limit their effectiveness (e.g., afforestation could be affected by extreme droughts). Storylines could also be more generically applied to large uncertainties, for example related to the carbon budget or to climate sensitivity (where probabilities change from one report to the other based on the same or very similar data). This said, storylines can facilitate cross-WG collaboration and communication of complex interactions between physical climate change (and related uncertainties) and related adaptation

24
and mitigation efforts. Thus, storylines could be particularly effective and would be well placed in IPCC Special Reports and Synthesis Reports. Q3: Can storylines provide a means of combining information from multiple, conflicting sources (i.e. “distillation” challenge)? Overall, storylines are well suited to combine information from multiple, conflicting sources. Several approaches were proposed how to do this, for instance:
● Providing a matrix of storylines along different dimensions of physical response and socioeconomic factors (Example: The urban development of Houston for different hurricane strength changes were motivated by the RCP-SSP matrix.)
● Multiple storylines could be connected to multiple adaptation pathways. Multiple counterfactuals may be very useful in this perspective. Storylines need to keep developing while time (and adaptation decision and action) develops. Also, there may be an associated temporal component or feedback.
The challenge could be to collect and combine the different nature of information and evidence (for instance, qualitative and quantitative information or different scales) to keep the messages of the storylines robust.
Storylines can also be useful to resolve conflicting information, for instance they can be used to filter for plausibility (emergent constraints) as illustrated in the presentation by Melissa Bukovsky. Or as Katja Frieler in her presentation showed, storylines can be used to attribute trends in various impacts using the simulations provided by the Inter-Sectoral Impact Model Intercomparison Project (ISIMIP). By definition, storylines are conditional explanations of the causal chain leading to a high impact event or pathway, so they should be useful to understand discrepancies between information sources which themselves can be subject to conditions that are not always made explicit. For example, a single realization of a high-resolution regional simulation is conditional on the sampling of variability and on the driving conditions of the global model. In that context, storylines that include process-based understanding of internal variability and model uncertainties can be used to identify implausible aspects of certain information sources (such as coarse-resolution models). Regional climate models should be considered with caution, because there could be coupling (or boundary) issues that are important for the physical plausibility of the storyline. Q4: How to make use of existing large data pools (ISIMIP, CORDEX, CMIP) and non-climate data sources for storyline development? Storylines can help to improve the connection from global climate simulations to local impacts. The underlying datasets, such as from global and regional climate and impact models, could be a

25
conversation starter as long as we can stay away from the technicalities underlying the data set and as long as proper context can be guaranteed (e.g., online availability of data without transparent documentation and user guidance can generate very unproductive interpretations and feedbacks). But documentation of guidance on best practice seems intermittent and continuity is often lost. A general data mining of impact model archives could be helpful, but a demonstration of realism is needed, as limited complexity or spatial and temporal resolution of these models can limit their ability to represent the actual magnitude of impacts. The robustness of results could be shown by browsing multiple events and models and evaluation against observed events. In that context,storylines could provide ways of categorizing clusters of simulations within ensemble archives. A particular aspect of event-based storylines is that they imply a refocus from a climate perspective to a weather perspective (and thus to something that is less abstract to people), and the scientists should make that part of model evaluation (i.e. using (statistical) methods that are applied routinely in evaluating weather models also in the climate context). Bias adjustment plays a significant role in that context as we need to know what variables are bias-adjustable, and what are not, and which variables are most crucial for the impact modeling. The top-down or physical-science driven approach (i.e. from global and regional models) can be a catalizer (e.g. hotspots from ISIMIP), but it is only a start and should result in further interaction with stakeholders to distill relevant information and develop a storyline. Ideally, a storyline should start with the actual stakes of users of climate information and then we select from available data pools. We can also work backward and use models to investigate if multiple-hazard combinations with severe impacts are physically plausible or not. In this process, knowledge brokers between stakeholders and scientists have an important role to play, and are more and more acknowledged in the context of climate services, which however are often still too climate-centric. A refocusing from climate to impact-driven approaches is required, and storylines can facilitate this process by allowing for the integration of multiple sources of information, including aspects of vulnerability and exposure.

26
4. Participants
Name Affiliation Country
Adam Sobel Columbia University USA
Aglaé Jézéquel LMD-IPSL France
Alex Hall UCLA USA
Alexandre M. Ramos Instituto Dom Luiz, University of Lisbon Portugal
Andreas Paul Zischg University of Bern Switzerland
Bart Van den Hurk KNMI / Deltares Netherlands
Ben Clarke Environmental Change Institute, University of Oxford UK
Christopher White University of Strathclyde UK
Detlef van Vuuren PBL Netherlands
Douglas Maraun University of Graz Austria
Elisabeth Lloyd Indiana University USA
27
Emanuele Bevacqua University of Reading UK
Fiachra O’Loughlin University College Dublin Ireland
Francesco Ragone ENS-Lyon France
Geert Lenderink KNMI Netherlands
Gordon Woo RMS UK
Jakob Zscheischler University of Bern Switzerland
Jana Sillmann CICERO Norway
Julia Slingo Cabot Institute, University of Bristol UK
Katharine Reich UCLA Center for Climate Science USA
Karin van der Wiel KNMI Netherlands
Katja Frieler Potsdam Institute for Climate Impact Research Germany
Liese Coulter B.C. Ministry of Agriculture Canada
Marisol Osman Centro de Investigaciones del Mar y la Atmósfera Argentina
Melissa Bukovsky National Center for Atmospheric Research USA
Olivia Martius University of Bern Switzerland
Pascal Yiou Laboratoire des Sciences du Climat et de l’Environment France
Pedro Soares Instituto Dom Luiz, Universidade de Lisboa Portugal
Rita M Cardoso Instituto Dom Luiz, Universidade de Lisboa Portugal
Sarah D’haen Climate Analytics Germany
Ted Shepherd University of Reading UK
Trine Jahr Hegdahl Norwegian Water Resources and Energy Directorate Norway
Wilco Hazeleger Netherlands eScience Center Netherlands
William Ball IAC/ETH Zurich & PMOD/WRC Switzerland
28
5. References
1. Beven, K. (2016), Facets of uncertainty: epistemic uncertainty, non‐stationarity, likelihood,
hypothesis testing, and communication, Hydrological Sciences Journal, 61:9, 1652‐1665, DOI:
10.1080/02626667.2015.1031761.
2. Bruijn, K. M. de, Lips, N., Gersonius, B., and Middelkoop, H., (2016), The storyline approach: A
new way to analyse and improve flood event management, Nat Hazards, 81, 99–121,
doi:10.1007/s11069‐015‐2074‐2.
3. Bukovsky, M.S., R.R. McCrary, A. Seth, L.O. Mearns, 2017: A mechanistically credible, poleward
shift in warm‐season precipitation projected for the U.S. Southern Great Plains? J. Climate, 30,
8275‐8298, doi: 10.1175/JCLI‐D‐16‐0316.1.
4. Felder, G., Gómez‐Navarro, J. J., Zischg, A. P., Raible, C. C., Röthlisberger, V., Bozhinova, D.,
Martius, O., and Weingartner, R., (2018), From global circulation to local flood loss: Coupling
models across the scales, Science of The Total Environment, 635, 1225–1239,
doi:10.1016/j.scitotenv.2018.04.170.
5. Grübler, A. and N. Nakicenovic (2001), Identifying dangers in an uncertain climate, Nature, 412,
page 15, doi: 10.1038/35083752.
6. Hegdahl, T. J., Engeland, K, Müller, M, and Sillmann, J (2019), Atmospheric River induced floods
in western Norway ‐ under present and future climate, Journal of Hydrometeorology (in review)
7. Hoegh‐Guldberg, O., D. Jacob, M. Taylor, M. Bindi, S. Brown, I. Camilloni, A. Diedhiou, R.
Djalante, K. Ebi, F. Engelbrecht, J. Guiot, Y. Hijioka, S. Mehrotra, A. Payne, S. I. Seneviratne, A.
Thomas, R. Warren, G. Zhou (2018), Impacts of 1.5ºC global warming on natural and human
systems. In: Global warming of 1.5°C. An IPCC Special Report on the impacts of global warming
of 1.5°C above pre‐industrial levels and related global greenhouse gas emission pathways, in the
context of strengthening the global response to the threat of climate change, sustainable
development, and efforts to eradicate poverty [V. Masson‐Delmotte, P. Zhai, H. O. Pörtner, D.
Roberts, J. Skea, P.R. Shukla, A. Pirani, W. Moufouma‐Okia, C. Péan, R. Pidcock, S. Connors, J. B.
R. Matthews, Y. Chen, X. Zhou, M. I. Gomis, E. Lonnoy, T. Maycock, M. Tignor, T. Waterfield
(eds.)].
8. IPCC (2018a), Expert Meeting of the Intergovernmental Panel on Climate Change on Assessing
Climate Information for Regions [Moufouma‐Okia, W, Masson‐Delmotte,.V, Zhai, Pörtner, H.‐O.
.P, Roberts, .D, Howden, M., Pichs‐Madruga, R., Flato, G., Vera, C., Pirani, A.,Tignor, M.,
Poloczanska, E. (eds)], IPCC Working Group I Technical Support Unit, Université Paris Saclay,
Saint Aubin, France, pp.50.
9. IPCC (2018b), Global warming of 1.5°C. An IPCC Special Report on the impacts of global warming
of 1.5°C above pre‐industrial levels and related global greenhouse gas emission pathways, in the
context of strengthening the global response to the threat of climate change, sustainable
development, and efforts to eradicate poverty [V. Masson‐Delmotte, P. Zhai, H. O. Pörtner, D.
Roberts, J. Skea, P.R. Shukla, A. Pirani, W. Moufouma‐Okia, C. Péan, R. Pidcock, S. Connors, J. B.
29
R. Matthews, Y. Chen, X. Zhou, M. I. Gomis, E. Lonnoy, T. Maycock, M. Tignor, T. Waterfield
(eds.)].
10. Mastrandrea, M.D., C.B. Field, T.F. Stocker, O. Edenhofer, K.L. Ebi, D.J. Frame, H. Held, E.
Kriegler, K.J. Mach, P.R. Matschoss, G.‐K. Plattner, G.W. Yohe, and F.W. Zwiers (2010), Guidance
Note for Lead Authors of the IPCC Fifth Assessment Report on Consistent Treatment of
Uncertainties. Intergovernmental Panel on Climate Change (IPCC).
11. Schneider, S. H. (2001), What is 'dangerous' climate change? Nature, 411, pages 17–19, doi:
10.1038/35075167.
12. Schwartz, M., A. Hall, F. Sun, D.B. Walton, and N. Berg (2017), Significant and inevitable end‐of‐
21st‐century advances in surface runoff timing in California's Sierra Nevada. Journal of
Hydrometeorology, 18(12), 3181–3197.
13. Shepherd, T.G., Boyd, E., Calel, R.A., Chapman, S.C., Dessai, D., Dima‐West, I.M., Fowler, H.J.,
James, R., Maraun, D., Martius, O., Senior, C.A., Sobel, A.H., Stainforth, D.A., Tett, S.F.B.,
Trenberth, K.E., van den Hurk, B.J.J.M., Watkins, N.W., Wilby, R.L. and Zenghelis, D.A. (2018),
Storylines: an alternative approach to representing uncertainty in physical aspects of climate
change. Climatic Change, 151, 555–571.
14. Shepherd, T.G. (2019), Storyline approach to the construction of regional climate change
information. Proc. R. Soc. A, 475, 20190013 (doi: 10.1098/rspa.2019.0013)
15. Sobel, A.H., C. Lee, S.J. Camargo, K.T. Mandli, K.A. Emanuel, P. Mukhopadhyay, and M. Mahakur
(2019), Tropical Cyclone Hazard to Mumbai in the Recent Historical Climate. Mon. Wea. Rev.,
147, 2355–2366.
16. Swain, D.L., B. Langenbrunner, J.D. Neelin, and A. Hall (2018), Increasing precipitation volatility
in twenty‐first‐century California. Nature Climate Change, 8, 427–433.
17. Thompson, V., N.J. Dunstone, A.A. Scaife, D.M. Smith, J.M. Slingo, S. Brown, and S. E. Belcher
(2017), High risk of unprecedented UK rainfall in the current climate. Nature Communications,
DOI: 10.1038/s41467‐017‐00275‐3.
18. Yiou, P., Jézéquel, A., (2019). Simulation of Extreme Heatwaves with Empirical Importance
Sampling. Geosci. Model Dev. Discuss. 2019, 1–26. https://doi.org/10.5194/gmd‐2019‐16
19. Zischg, A. P., Felder, G., Weingartner, R., Quinn, N., Coxon, G., Neal, J., Freer, J., and Bates, P.,
(2018a), Effects of variability in probable maximum precipitation patterns on flood losses,
Hydrol. Earth Syst. Sci., 22, 2759–2773, doi:10.5194/hess‐22‐2759‐2018, 2018.
20. Zischg, A. P., Felder, G., Mosimann, M., Röthlisberger, V., and Weingartner, R., (2018b),
Extending coupled hydrological‐hydraulic model chains with a surrogate model for the
estimation of flood losses, Environmental Modelling & Software, 108, 174–185,
doi:10.1016/j.envsoft.2018.08.009.