© Crown copyright 2009 00912-2009PPT-EN-01 Workshop 1 Narrowing gaps – setting the scene.

woodmac.com Trusted Intelligence
Alan Gelder, VP Refining, Chemicals & Oil Markets
Global outlook for refining and olefins Workshop 1 – Setting the scene
2
woodmac.com
Agenda
1 Middle East & Asian refining to 2025
2 Energy Transition
3 Ethylene market outlook
4 Downstream conversion industry

4
woodmac.com
Middle East refined product demand profile (kbd)
The East of Suez region is the key location for refined product demand growth Asian demand growth outpaces the Middle East due to its growing ranks of the middle class, particularly in India
Asian refined product demand profile (kbd)
-
2,000
4,000
6,000
8,000
10,000
12,000
KBD 2010 2015 2020 2025
History: IEA Energy Statistics, Forecast:Wood Mackenzie
-
2,000
4,000
6,000
8,000
10,000
12,000
KBD 2010 2015 2020 2025
History: IEA Energy Statistics, Forecast:Wood Mackenzie

5
woodmac.com
The Middle East is undertaking major refining investments, both in terms of
capacity and quality improvement Major projects are typically delivered slower than their original schedules
Greenfield refinery investments Brownfield refinery investments
Persian Gulf, Iran 480 kb/d, January 2017- 2024
Karbala, Iraq 140 kb/d, January 2021
Jazan, Saudi Arabia 400 kb/d, October 2019
Clean Fuels, Kuwait 64 kb/d, Jan 2020 Al-Zour, Kuwait
615 kb/d, June 2020
Bahrain, Bahrain 93 kb/d, January 2023
Ras Tanura, Saudi Arabia Clean Fuels April 2020
Abadan, Iran New refinery train January 2022
Jebel Ali, UAE Refinery Upgrade January 2020
Bazian, Iraq 50 kb/d, June 2020
Duqm, Oman 230 kb/d, January 2023
Basrah, Iraq 70 kb/d, January 2021
Al-Zour, Kuwait Phase 2 Upgrade January 2025
Laffan, Qatar Zekreet Project January 2019
Rabigh, Saudi Arabia Clean Fuels January 2020
Ruwais, UAE CFP Project January 2023
Bandar Abbas, Iran Clean Fuels April 2019
Riyadh, Saudi Arabia Clean Fuels January 2019
6
woodmac.com
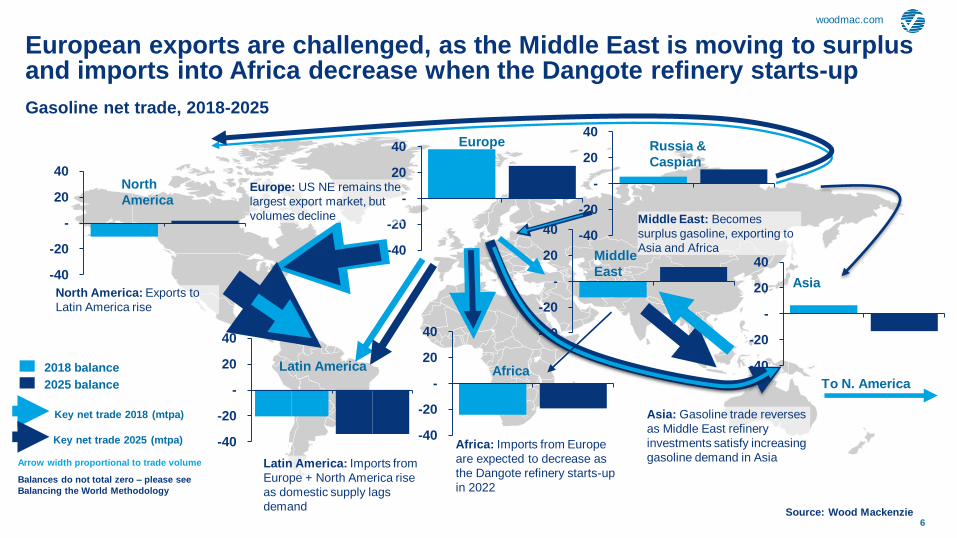
European exports are challenged, as the Middle East is moving to surplus and imports into Africa decrease when the Dangote refinery starts-up
-40
-20
-
20
40
-40
-20
-
20
40
-40
-20
-
20
40
-40
-20
-
20
40
-40
-20
-
20
40
-40
-20
-
20
40
-40
-20
-
20
40
Europe
Latin America
Russia &
Caspian
Middle
East Asia
North
America
Africa To N. America
Key net trade 2018 (mtpa)
Key net trade 2025 (mtpa)
2018 balance
2025 balance
Arrow width proportional to trade volume
Balances do not total zero – please see
Balancing the World Methodology
North America: Exports to
Latin America rise
Europe: US NE remains the
largest export market, but
volumes decline
Latin America: Imports from
Europe + North America rise
as domestic supply lags
demand
Asia: Gasoline trade reverses
as Middle East refinery
investments satisfy increasing
gasoline demand in Asia
Middle East: Becomes
surplus gasoline, exporting to
Asia and Africa
Gasoline net trade, 2018-2025
Source: Wood Mackenzie
Africa: Imports from Europe
are expected to decrease as
the Dangote refinery starts-up
in 2022
7
woodmac.com
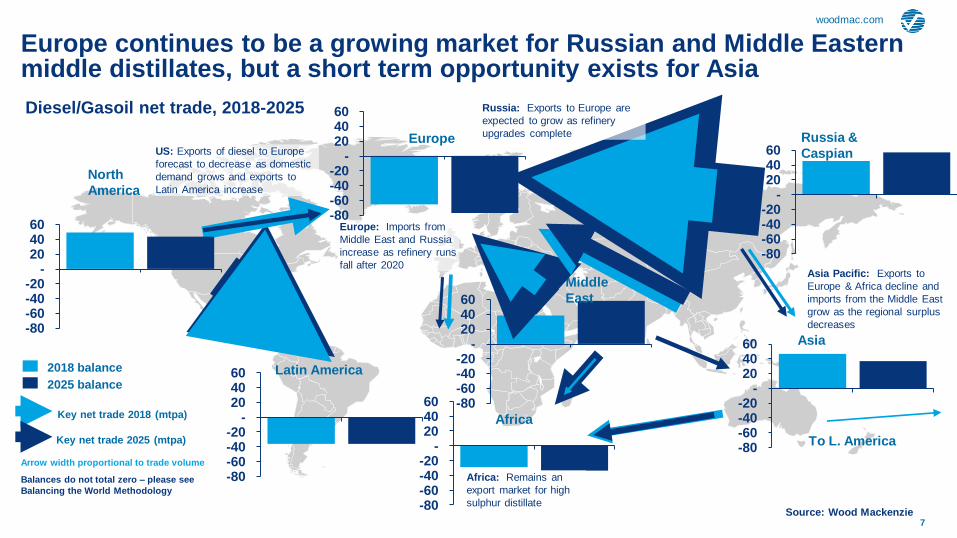
Europe continues to be a growing market for Russian and Middle Eastern middle distillates, but a short term opportunity exists for Asia
-80-60-40-20
-204060 -80
-60-40-20
-204060
-80-60-40-20
-204060
-80-60-40-20
-204060
Russia &
Caspian Europe
Africa
Asia
North
America
Middle
East
To L. America
US: Exports of diesel to Europe
forecast to decrease as domestic
demand grows and exports to
Latin America increase
Russia: Exports to Europe are
expected to grow as refinery
upgrades complete
Europe: Imports from
Middle East and Russia
increase as refinery runs
fall after 2020 Asia Pacific: Exports to
Europe & Africa decline and
imports from the Middle East
grow as the regional surplus
decreases
Key net trade 2018 (mtpa)
Key net trade 2025 (mtpa)
2018 balance
2025 balance
Arrow width proportional to trade volume
Balances do not total zero – please see
Balancing the World Methodology
Diesel/Gasoil net trade, 2018-2025
Source: Wood Mackenzie
Latin America
Africa: Remains an
export market for high
sulphur distillate
-80-60-40-20
-204060
-80-60-40-20
-204060
-80-60-40-20
-204060

8
woodmac.com
Middle East Gross Reference Refining Margins (US$/bbl, real 2018$)
IMO boosts refining margins for 2020, but global refining over-build weakens margins thereafter The IMO uplift is primarily for distillate oriented, deep conversion configurations
-5
0
5
10
15
20
200
1
200
3
200
5
200
7
200
9
201
1
201
3
201
5
201
7
201
9
202
1
202
3
202
5
ME Gulf Dubai FCC $/bbl (Real) ME Gulf Dubai Hydrocracker Coker $/bbl (Real) ME Gulf Dubai Hydroskimming $/bbl (Real)
$/bbl
Source Wood Mackenzie
$/bbl
Source Wood Mackenzie
$/bbl

10
woodmac.com
Global liquids* demand
Global liquids demand to reach 110 million b/d in 2040, an increase of 11 million b/d from 2018 Annual growth decelerates steadily through mid-2030s, moving into a slow decline after 2037
Source: Wood Mackenzie * liquids includes oil products, NGLs, and biofuels
Annual growth in global liquids demand
-500
-
500
1,000
1,500
2,000
000 b
/d
2020 growth includes one-time 100
kbd increase in total demand caused
by IMO-related shift from marine fuel
oil to gasoil (when measured in
volume terms)
Global GDP growth eases from 3.1%
in 2017 to 2.5% by 2021 as China,
Europe and US lose momentum. Risk
to GDP is to the downside from
US/China trade war
Oil demand
increasingly displaced
by electrified vehicles
and natural gas in
transport
Global liquids demand grows 11
million b/d to 2040
-
20
40
60
80
100
120
2000 2010 2020 2030 2040
millio
n b
/d
H2 update actual linear trend
Source: Wood Mackenzie
11
woodmac.com
0
200
400
600
800
1,000
1,200
1,400
1,600
1,800
2,000
2015 2020 2025 2030 2035 2040
millio
n
0
20
40
60
80
100
120
140
2015 2020 2025 2030 2035 2040
mill
ion
Others AEVs EVs/PHEVs HEVs Conventional
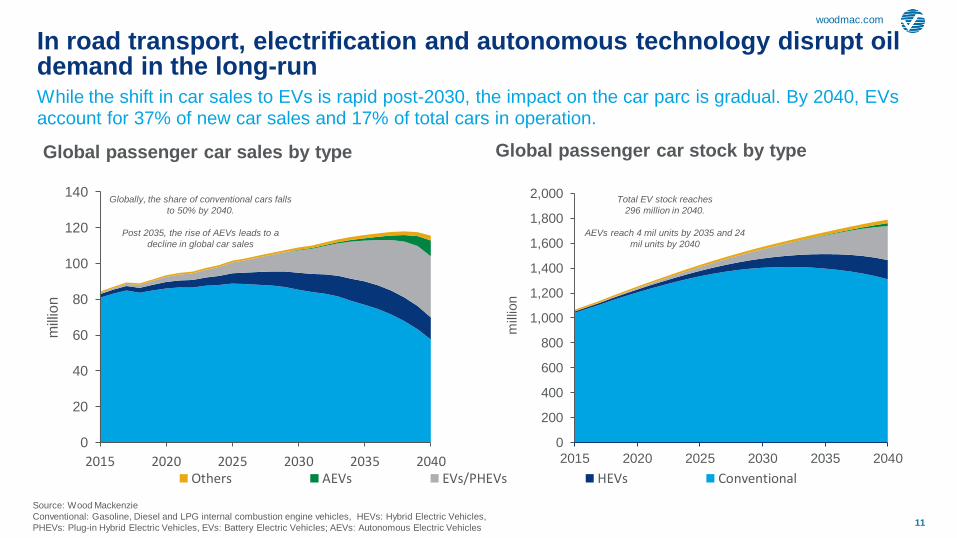
In road transport, electrification and autonomous technology disrupt oil demand in the long-run While the shift in car sales to EVs is rapid post-2030, the impact on the car parc is gradual. By 2040, EVs account for 37% of new car sales and 17% of total cars in operation.
Global passenger car sales by type
Source: Wood Mackenzie
Conventional: Gasoline, Diesel and LPG internal combustion engine vehicles, HEVs: Hybrid Electric Vehicles,
PHEVs: Plug-in Hybrid Electric Vehicles, EVs: Battery Electric Vehicles; AEVs: Autonomous Electric Vehicles
Global passenger car stock by type
Total EV stock reaches
296 million in 2040.
AEVs reach 4 mil units by 2035 and 24
mil units by 2040
Globally, the share of conventional cars falls
to 50% by 2040.
Post 2035, the rise of AEVs leads to a
decline in global car sales

woodmac.com
12
-40%
-20%
0%
20%
40%
60%
80%
100%
-4
-2
0
2
4
6
8
10
00-05 05-10 10-15 15-20 20-25 25-30 30-35
Che
mic
als
Millio
n B
arr
els
Pe
r D
ay
Transport Petrochemicals
Resid/Comm/Agric Electricity
Other Chemicals Proportion
0%
20%
40%
60%
0
40
80
120
2000 2005 2010 2015 2020 2025 2030 2035
Che
mic
als
Millio
n B
arr
els
Pe
r D
ay
Transport Petrochemicals
Res/Comm/Agri Electricity
Other Chemicals Proportion
Global Crude Oil Demand ABSOLUTE
Peak transport demand for oil changes the investment focus
As transportation demand for crude oil peaks, petrochemicals become more important part of oil companies’ strategies.
Source: Wood Mackenzie Refined Products Market Service
Global Crude Oil Demand GROWTH

woodmac.com
14
0
5
10
15
20
25
05 10 15 20 25
$/m
mb
tu
Brent Crude Oil US Natural Gas US Ethane
China Naphtha Europe Naphtha
-5
0
5
10
15
05 10 15 20 25
M t
on
, N
ew
Eth
yle
ne
Ca
pa
city
North America West Europe
Middle East Asia (Ex China)
China Other
Energy & Feedstock Price Benchmarks
Ethylene investments are influenced by feedstock advantage and proximity to demand centres
Low natural gas & coal/methanol prices relative to global crude oil prices resulted in many new ethane crackers in North America & MTO/CTO units in China.
Source: Wood Mackenzie Global Ethylene Supply/Demand Analytics Service
New Global Ethylene Investments
North America
Closes
Capacity
North
America
Adds 1st
Wave
Large Asia &
North
America 2nd
Wave
Crude &
Natural
Gas Parity
Crude &
Natural
Gas
Separate
Gas still
Favored,
but closer

woodmac.com
15
North America Ethylene Capacity 1st Wave of Crackers (Built / Firm / Likely): » Debottleneck & expansions of existing facilities
» 2016: Braskem-Idesa – Mexico (1000 kta)
» 2017: Oxychem/Mexichem – Texas (544 kta)
» 2017: DowDupont – Texas (1500 kta)
» 2018: ChevronPhillips – Texas (1500 kta)
» 2018: ExxonMobil – Texas (1500 kta)
» 2018: Indorama – Louisiana (440 kta)
» 2019: Formosa – Texas (1500 kta)
» 2019: Sasol – Louisiana (1500 kta)
» 2019: Shintech – Louisiana (500 kta)
» 2019: Lotte-Westlake – Louisiana (1000 kta)
» 2021: Total/Nova/Borealis – Texas (1000 kta)
» 2022: Shell – Pennsylvania (1500 kta)
2nd Wave of Crackers (pre-FID):
» ExxonMobil/Sabic – Corpus Christi, Texas
» Formosa – St. James, Louisiana
» Motiva – Port Arthur, Texas
» ChevronPhillips – Cedar Bayou, Texas
» PTT/Daelim – Dilles Bottom, Ohio
» Alberta, Canada Petrochemical Diversification Program
North America is making significant ethylene investments
North America is doubling ethylene capacity in two investment waves, with most of this new capacity additions occurring in Texas and Louisiana, with only Shell in Northeast US
Source: Wood Mackenzie Global Ethylene Supply/Demand Analytics Service
0%
25%
50%
75%
100%
0.0
20.0
40.0
60.0
2005 2010 2015 2020 2025
HypotheticalAdditions
Firm & LikelyAdditions
ExistingCapacity (mid-18)
% from Ethane& LPG
Million Tons Alt Feed Proportion

woodmac.com
16
Middle East Ethylene Capacity 2018-2025 Firm & Likely Crackers (6):
» 2019: Ilam PC, Iran (458 kta)
» 2021: Bushehr PC, Iran (1000 kta)
» 2021: Liwa Plastics, Oman (880 kta)
» 2023: Gachsaran PC, Iran (1000 kta)
» 2024: Dehloran Sepehr PC, Iran (500 kta)
» 2024: Aramco/Total, Saudi Arabia (1500 kta)
Post 2024 Hypothetical Pre-FID Crackers:
» KPIC Refinery & Mixed Feed Cracker, Kuwait
» DUQM Refinery & Mixed Feed Cracker, Oman
» QAPCO Ethane Cracker, Qatar
» Borouge/ADNOC Mixed Feed Cracker, UAE
» Saudi Aramco/Sabic JV COTC, Saudi Arabia
» Multiple Projects, Iran
Integrated refinery developments are emerging in the Middle East Slower growth after 2008-2010 investment wave. Iran continues to invest, although uncertainty due to US sanctions. A large volume of oil-to-chemical or mixed feed projects nearing FID.
Source: Wood Mackenzie Global Ethylene Supply/Demand Analytics Service
0%
25%
50%
75%
100%
0.0
20.0
40.0
60.0
2005 2010 2015 2020 2025
HypotheticalAdditions
Firm & LikelyAdditions
ExistingCapacity(mid-18)
% fromEthane &LPG
Million Tons Alt Feed Proportion
woodmac.com
17
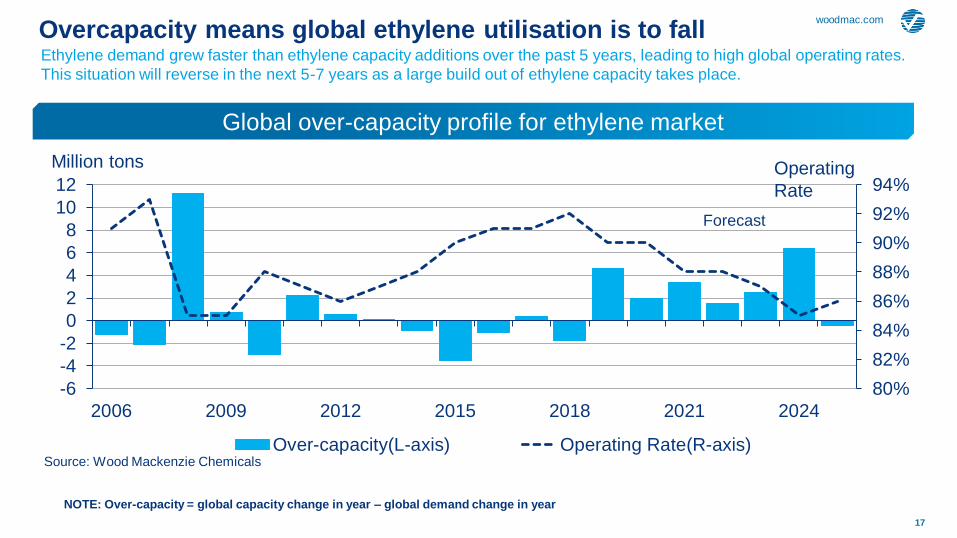
Overcapacity means global ethylene utilisation is to fall Ethylene demand grew faster than ethylene capacity additions over the past 5 years, leading to high global operating rates.
This situation will reverse in the next 5-7 years as a large build out of ethylene capacity takes place.
Global over-capacity profile for ethylene market
NOTE: Over-capacity = global capacity change in year – global demand change in year
80%
82%
84%
86%
88%
90%
92%
94%
-6
-4
-2
0
2
4
6
8
10
12
2006 2009 2012 2015 2018 2021 2024
Over-capacity(L-axis) Operating Rate(R-axis)Source: Wood Mackenzie Chemicals
Million tons
Forecast
Operating
Rate
woodmac.com
18
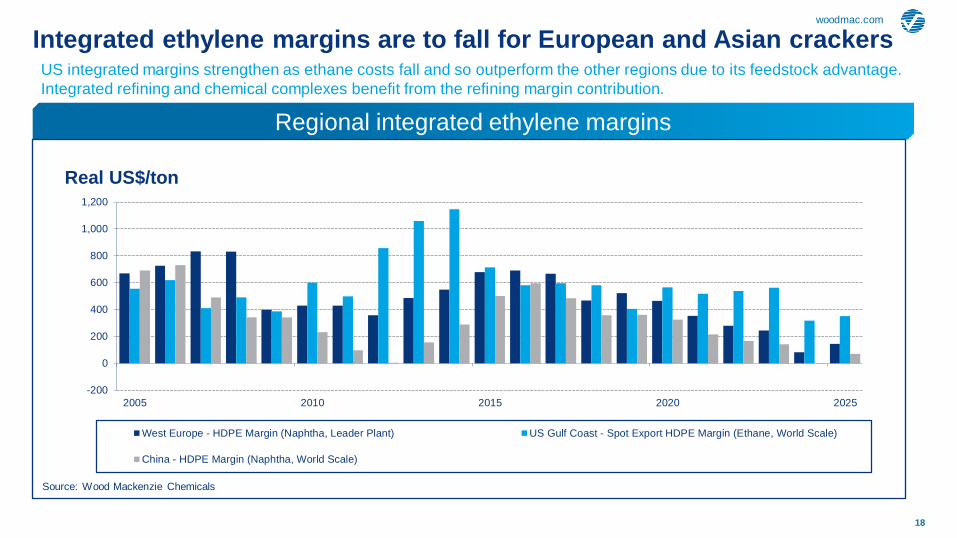
Integrated ethylene margins are to fall for European and Asian crackers US integrated margins strengthen as ethane costs fall and so outperform the other regions due to its feedstock advantage.
Integrated refining and chemical complexes benefit from the refining margin contribution.
Regional integrated ethylene margins
-200
0
200
400
600
800
1,000
1,200
2005 2010 2015 2020 2025
West Europe - HDPE Margin (Naphtha, Leader Plant) US Gulf Coast - Spot Export HDPE Margin (Ethane, World Scale)
China - HDPE Margin (Naphtha, World Scale)
Source: Wood Mackenzie Chemicals
Real US$/ton

woodmac.com
20
Polyolefin supply by end use segment
The Middle East conversion industry is growing strongly, but the required regional transformation is starting
The common themes are regional growth, innovation and diversification, but recent global developments have added complexity to investment considerations.
0
2
4
6
8
10
12
2005 2010 2015 2020 2025
millio
n tons
Blow Moulding Cable/Wire Extrusion Extrusion Coating Fibre Extrusion Film Extrusion Injection Moulding
Other Processes Pipe/Tube Extrusion Raffia Rotational Moulding Sheet Extrusion
Source: Wood Mackenzie
Key opportunities
• Move further downstream via product
diversification
• Grow partnerships with European and Asian
specialty players
• Step change in chemicals supply via crude to
chemicals

woodmac.com
21
Key challenges are:
Global economic health: The risk of a global economic recession are rising, which challenges
the funding available to Middle East governments. Nonetheless, petrochemical margins are
forecast to weak through to 2025
Regional shift towards a heavier feed slate: This challenges the magnitude of the regional
cost advantage and its availability down the value chain
Attracting and Developing Talent: There is a serious concern about the talent available in the
region to manage and operate petrochemical projects. Many of the projects are located in
remote places so difficult to staff
The growth of the Middle East downstream conversion industry is not without its challenges
Many of the regional governments are also following similar strategies, so developing a differentiated offer is essential
22
woodmac.com
Connect with
Alan Gelder
VP Refining, Chemicals and Oil Markets Downstream Global Content Lead Biography
Alan
+44 20 3060 0520
Alan is VP Refining, Chemicals and Oil Markets. As Downstream Global Content Lead,
he is responsible for formulating Wood Mackenzie’s research outlook and integrated
cross-sector perspectives on this global sector.
Alan Gelder joined Wood Mackenzie’s Downstream Consulting team in 2005 and became
global head in 2009. He transitioned into research upon his return from Houston in 2011 and
was Global Head of Refining and Chemicals.
Prior to joining Wood Mackenzie, Alan had 10 years of industry consulting after working for
ExxonMobil in a variety of project planning and technical process design roles.
Alan has a first class Master Degree in Chemical Engineering from Imperial College, London,
supplemented by an MBA from Henley Management College.
23
woodmac.com
Disclaimer
Strictly Private & Confidential
These materials, including any updates to them, are published by and remain subject to the copyright of the Wood Mackenzie group ("Wood
Mackenzie"), and are made available to clients of Wood Mackenzie under terms agreed between Wood Mackenzie and those clients. The use of
these materials is governed by the terms and conditions of the agreement under which they were provided. The content and conclusions contained
are confidential and may not be disclosed to any other person without Wood Mackenzie's prior written permission. Wood Mackenzie makes no
warranty or representation about the accuracy or completeness of the information and data contained in these materials, which are provided 'as is'.
The opinions expressed in these materials are those of Wood Mackenzie, and nothing contained in them constitutes an offer to buy or to sell
securities, or investment advice. Wood Mackenzie's products do not provide a comprehensive analysis of the financial position or prospects of any
company or entity and nothing in any such product should be taken as comment regarding the value of the securities of any entity. If,
notwithstanding the foregoing, you or any other person relies upon these materials in any way, Wood Mackenzie does not accept, and hereby
disclaims to the extent permitted by law, all liability for any loss and damage suffered arising in connection with such reliance.
Copyright © 2018, Wood Mackenzie Limited. All rights reserved. Wood Mackenzie is a Verisk business.

Wood Mackenzie™, a Verisk business, is a trusted intelligence provider, empowering decision-makers with unique insight
on the world’s natural resources. We are a leading research and consultancy business for the global energy, power and
renewables, subsurface, chemicals, and metals and mining industries. For more information visit: woodmac.com
WOOD MACKENZIE is a trademark of Wood Mackenzie Limited and is the subject of trademark registrations and/or
applications in the European Community, the USA and other countries around the world.
Europe
Americas
Asia Pacific
Website
+44 131 243 4400
+1 713 470 1600
+65 6518 0800
www.woodmac.com