Workplace pensions and remuneration in the public … · Workplace pensions and remuneration in the...
39
Workplace pensions and remuneration in the public and private sectors in the UK Jonathan Cribb Carl Emmerson IFS Briefing Note BN151
Transcript of Workplace pensions and remuneration in the public … · Workplace pensions and remuneration in the...

Workplace pensions and remuneration in the public and private sectors in the UK
Jonathan CribbCarl Emmerson
IFS Briefing Note BN151
Workplace pensions and remuneration in the public and private sectors in the UK1
Jonathan Cribb and Carl Emmerson
Institute for Fiscal Studies
© The Institute for Fiscal Studies, October 2014 ISBN: 978-1-909463-59-2
Executive summary
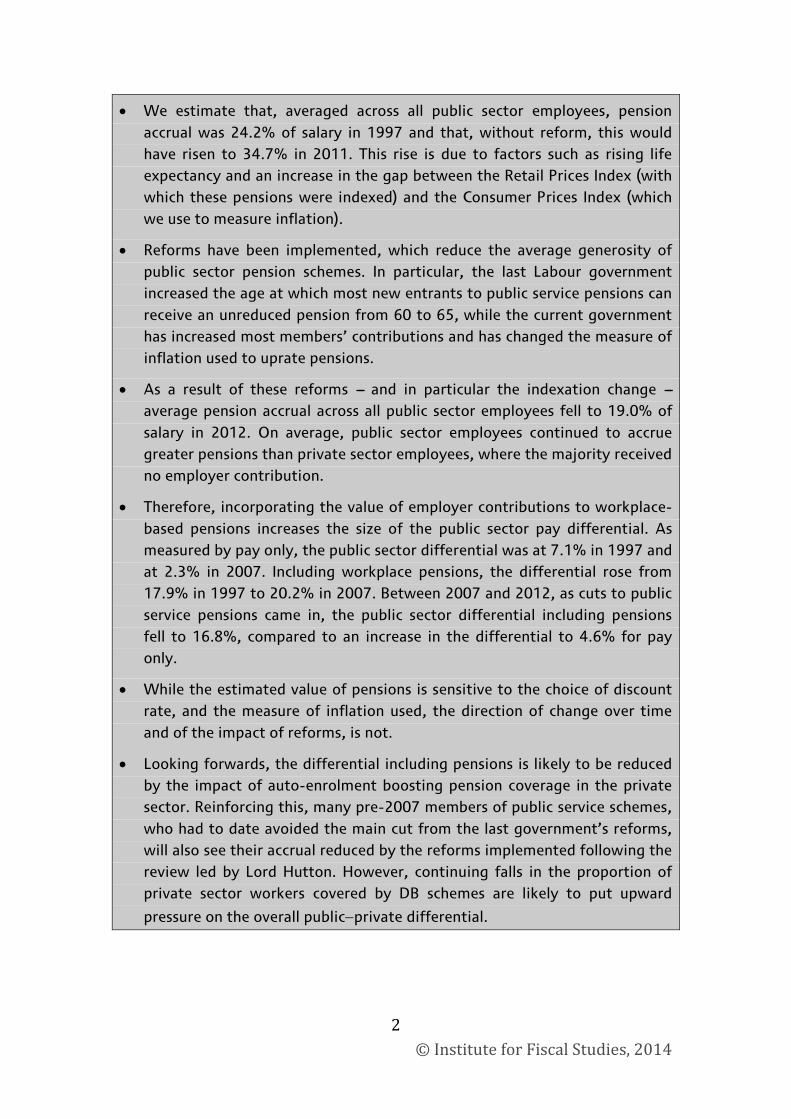
• Pay comparisons between public and private sector workers ignore the valueof employer-provided pensions. This is an important omission because, onaverage, these pensions are more valuable in the public sector than in theprivate sector and, furthermore, over time this relative difference in valuehas changed considerably.
• In the public sector, coverage has been stable over the last 15 years withmost employees being members of a defined benefit (DB) pension. Incontrast, in the private sector, coverage of DB schemes has declined from38% in 1997 to just 12% in 2012, with growth in (typically less generous)defined contribution schemes not being sufficient to prevent a decline inoverall coverage.
1 The work is funded by the Joseph Rowntree Foundation. The authors also gratefully acknowledge co-funding from the Centre for the Microeconomic Analysis of Public Policy at IFS (grant number RES-544-28-0001), which is funded by the Economic and Social Research Council (ESRC). The authors would like to thank Rowena Crawford, Richard Disney, Paul Johnson, Luke Sibieta and Gemma Tetlow for helpful comments. The Joseph Rowntree Foundation has supported this project as part of its programme of research and innovative development projects, which it hopes will be of value to policymakers, practitioners and service users. The facts presented and views expressed in this briefing note are, however, those of the authors and not necessarily those of the Foundation. Any errors and all views expressed are those of the authors.
This work uses data from the Annual Survey of Hours and Earnings produced by the Office for National Statistics (ONS) and supplied by the Secure Data Service at the UK Data Archive. The Labour Force Survey and British Household Panel Study data were supplied through the UK Data Archive. The data are Crown Copyright and reproduced with the permission of the controller of HMSO and Queen’s Printer for Scotland.
© Institute for Fiscal Studies, 2014 1
• We estimate that, averaged across all public sector employees, pension accrual was 24.2% of salary in 1997 and that, without reform, this would have risen to 34.7% in 2011. This rise is due to factors such as rising life expectancy and an increase in the gap between the Retail Prices Index (with which these pensions were indexed) and the Consumer Prices Index (which we use to measure inflation).
• Reforms have been implemented, which reduce the average generosity of public sector pension schemes. In particular, the last Labour government increased the age at which most new entrants to public service pensions can receive an unreduced pension from 60 to 65, while the current government has increased most members’ contributions and has changed the measure of inflation used to uprate pensions.
• As a result of these reforms --- and in particular the indexation change --- average pension accrual across all public sector employees fell to 19.0% of salary in 2012. On average, public sector employees continued to accrue greater pensions than private sector employees, where the majority received no employer contribution.
• Therefore, incorporating the value of employer contributions to workplace-based pensions increases the size of the public sector pay differential. As measured by pay only, the public sector differential was at 7.1% in 1997 and at 2.3% in 2007. Including workplace pensions, the differential rose from 17.9% in 1997 to 20.2% in 2007. Between 2007 and 2012, as cuts to public service pensions came in, the public sector differential including pensions fell to 16.8%, compared to an increase in the differential to 4.6% for pay only.
• While the estimated value of pensions is sensitive to the choice of discount rate, and the measure of inflation used, the direction of change over time and of the impact of reforms, is not.
• Looking forwards, the differential including pensions is likely to be reduced by the impact of auto-enrolment boosting pension coverage in the private sector. Reinforcing this, many pre-2007 members of public service schemes, who had to date avoided the main cut from the last government’s reforms, will also see their accrual reduced by the reforms implemented following the review led by Lord Hutton. However, continuing falls in the proportion of private sector workers covered by DB schemes are likely to put upward
pressure on the overall public−private differential.
© Institute for Fiscal Studies, 2014
2
1. Introduction
There has been considerable interest in recent years in the level of pay in the public sector, and how it compares to that in the private sector, particularly in a context in which the coalition government is limiting nominal growth in public sector pay as part of its fiscal consolidation strategy.2 However, pay in the form of a wage or salary is not the only form of remuneration that employees receive. The promises made by employers in the form of pension rights, or the contributions made by employers to pension schemes, are an important form of remuneration, albeit of a deferred form, and one that varies between the public and private sectors.
In this briefing note, we estimate the value of employer-provided pensions and compare their value between public and private sector workers, and over time. We then assess what effect the incorporation of the value of workplace pensions has on the estimated differential between remuneration in the public and private sectors when measured just using pay. We also document how this changes over time and how it varies across different groups of the population.
One of the most important factors to account for in recent years is the change in the proportion of workers who are in workplace pension schemes, in particular the declining proportion of private sector workers in a defined benefit (DB) pension.3 Differential trends in pension coverage will certainly have an important impact on the average differential in remuneration between public and private sector workers.
The value, as well as coverage, of pensions has changed. There have been reforms by successive governments to public sector pension schemes. We also consider the effects of changing life expectancy, annuity rates and the composition of the workforce on the value of pension provision.
2 See J. Cribb, C. Emmerson and L. Sibieta, ‘Public sector pay in the UK’, Institute for Fiscal Studies (IFS) Report 97, 2014, http://www.ifs.org.uk/publications/7395, for a report that accompanies this briefing note. This report sets out in detail how hourly pay in the public sector compares to the private sector, and the extent to which this difference varies across types of workers, time and geography.
3 R. Crawford, C. Emmerson and G. Tetlow, ‘Occupational pension value in the public and private sectors’, Institute for Fiscal Studies (IFS), Working Paper 10/03, 2010 (http://www.ifs.org.uk/wps/wp1003.pdf); hereafter, Crawford, Emmerson and Tetlow (2010).
© Institute for Fiscal Studies, 2014
3

This briefing note builds upon a literature of other work that estimates the value of elements of remuneration other than headline pay. Our work is most closely related to the analysis in Disney, Emmerson and Tetlow (2009)4 and Crawford, Emmerson and Tetlow (2010), who use the British Household Panel Survey (BHPS) to measure the value of workplace pensions. A more comprehensive measure of remuneration is considered by Danzer and Dolton (2012),5 who estimate a measure of total reward to working in the private or public sector, incorporating pensions, paid holidays, benefits in kind and health insurance.
The contribution of the analysis in this paper, relative to these studies, is that we consider how the difference in a broader measure of remuneration between public and private sector workers changes over time. Our focus is on accounting for deferred remuneration in the form of pensions (alongside pay), in part because the trends in coverage imply that the relative importance of pensions in each sector has changed over time, and because in recent years successive governments have sought to reform public sector pensions to reduce their cost to the Exchequer. We do not – unlike the Danzer and Dolton analysis – incorporate other differences in benefits.6
The rest of this briefing note is organised as follows. In Section 2, we set out the background to our analysis, in terms of trends in pension coverage and recent policy changes. In Section 3, we describe the methodology we employ to value employer contributions to pension schemes. In Section 4, we estimate the value of pensions under different scheme rules and over
4 R. Disney, C. Emmerson and G. Tetlow, ‘What is a public sector pension worth?’, Economic Journal, 2009, 119 (541), F517---35.
5 A. Danzer and P. Dolton, ‘Total reward and pensions in the UK in the public and private sectors’, Labour Economics, 2012, 19, 584---94.
6 Benefits other than pay and pensions might also vary between public and private sectors. Examples include: maternity and paternity pay; provision of company cars or private health insurance; chances of job loss from bankruptcy; chances of redundancy and the level of redundancy pay should that occur; annual leave and the flexibility of the employer over hours or working from home. There is a significant literature examining the effect of non-pay elements on remuneration, such as pension and fringe benefits. For example, S. A. Woodbury, ‘Substitution between wage and nonwage
benefits’, American Economic Review, 1983, 73(1), 166−82, examines the substitution between wage and non-wage benefits using American data.
© Institute for Fiscal Studies, 2014
4
time, and in Section 5, we consider these values alongside pay in order to obtain a more comprehensive measure of remuneration and, in particular, the difference between public and private sector remuneration. We conclude in Section 6.
2. Trends in pension coverage and policy background
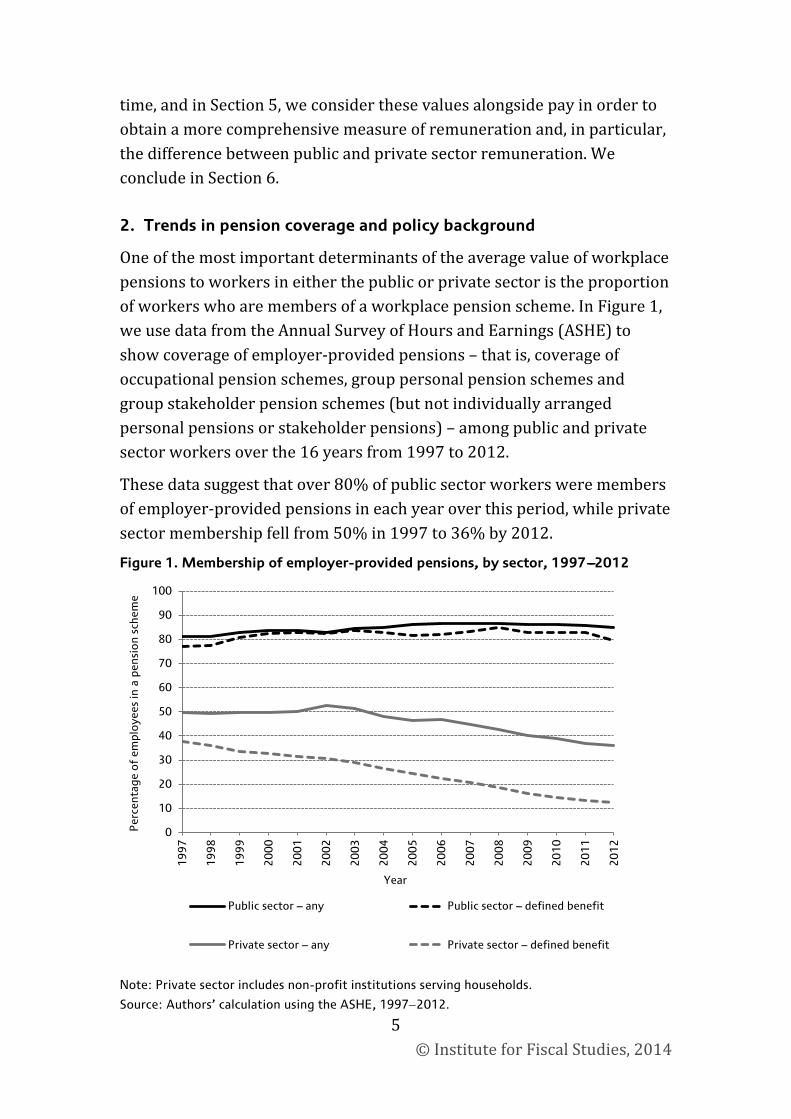
One of the most important determinants of the average value of workplace pensions to workers in either the public or private sector is the proportion of workers who are members of a workplace pension scheme. In Figure 1, we use data from the Annual Survey of Hours and Earnings (ASHE) to show coverage of employer-provided pensions – that is, coverage of occupational pension schemes, group personal pension schemes and group stakeholder pension schemes (but not individually arranged personal pensions or stakeholder pensions) – among public and private sector workers over the 16 years from 1997 to 2012.
These data suggest that over 80% of public sector workers were members of employer-provided pensions in each year over this period, while private sector membership fell from 50% in 1997 to 36% by 2012.
Figure 1. Membership of employer-provided pensions, by sector, 1997---2012
Note: Private sector includes non-profit institutions serving households.
Source: Authors’ calculation using the ASHE, 1997−2012.
0
10
20
30
40
50
60
70
80
90
100
19
97
19
98
19
99
20
00
20
01
20
02
20
03
20
04
20
05
20
06
20
07
20
08
20
09
20
10
20
11
20
12
Per
cent
age
of
empl
oye
es in
a p
ensi
on
sche
me
Year
Public sector – any Public sector – defined benefit
Private sector – any Private sector – defined benefit
© Institute for Fiscal Studies, 2014
5
In itself, higher coverage in the public sector would tend to widen the estimated public sector pay differential. The widening of the difference in pension coverage over time would tend to increase the estimated differential.
However, the generosity of schemes does vary both between sectors and, as we will document, over time. One key difference, which is shown in Figure 1, is that the vast majority of public sector workers are members of a DB scheme rather than a defined contribution (DC) scheme, with no obvious change in this over the period shown.7 However private sector employers are increasingly moving away from DB schemes with coverage of such schemes among private sector employees falling from 38% in 1997 to just 12% in 2012.
To the extent to which DB schemes are more generous than DC schemes, this would tend to push up estimates of the public sector pay differential further, and to do this by an increasing amount over time.
However, public sector schemes have been the subject of much reform in recent years with, in part, the intention of reducing the future cost to the taxpayer relative to the benchmark of unreformed schemes.
The actual reforms have varied from scheme to scheme, but the changes introduced by the last Labour government typically involved increasing the Normal Pension Age (NPA) − that is, the age at which one can normally draw a full unreduced pension − from age 60 to age 65 for new entrants to these schemes. For example, this change was made to the three largest public service schemes: the NHS pension plan, the Teachers’ Pension Scheme, which applies in England and Wales, and the Principal Civil Service Pension. While initially only a minority of public sector workers have been affected by this change, those who are affected will have experienced a significant drop in the value of their pension because they will need to work for five more years in order to receive (roughly) the same pension for five fewer years.
7 There are two main types of employer-provided pension schemes in the UK. DB schemes are those where the benefits paid out are related to the number of years the employee has been in the scheme and a measure of salary. DC schemes are those where benefits are dependent on the amount of contributions made by the employee and employer, the rate of return achieved on the investment and the annuity rate at retirement.
© Institute for Fiscal Studies, 2014
6

More recently, the coalition government has increased the pension contributions that have to be made by individual members of these schemes and has changed inflation indexation to the Consumer Prices Index (CPI) rather than the Retail Prices Index (RPI). It has also implemented the recommendations of a review of public service pensions carried out by Lord Hutton at the coalition government’s request.8 For those more than 10 years from their NPA, the most important of these changes were, first, that future accrual should be based on average earnings rather than final salary and, second, that the NPA should – with the notable exception of the armed forces, police and fire fighters – be equal to the State Pension Age (SPA). As we show in Section 4, the increases in employee contributions and, in particular, the change in inflation indexation implemented by the coalition government have significantly reduced the average generosity of these schemes.9
3. Methodology to estimate value of workplace pensions
This section provides more detail on our methodology for estimating the value of pensions, including the data sources used and assumptions needed to make these calculations. For readers who are less interested in the methodology but would like to skip straight to the results of our analysis, please see Section 4.
In order to estimate the value of employer-provided pensions, we take information from different surveys and make some simplifying assumptions over the rules of the scheme. This methodology, and most of what we do, follows fairly closely the methodology of Crawford, Emmerson and Tetlow (2010), who use the BHPS waves of 2001 and 2005 to compare the changing generosity of public and private sector pension
8 The final report of the Independent Public Service Pensions Commission (‘‘The Hutton Report’’) can be found at https://www.gov.uk/government/uploads/system/uploads/attachment_data/file/207720/hutton_final_100311.pdf.
9 This was also shown in C. Emmerson and W. Jin, ‘Public sector pensions and pay’, in C. Emmerson, P. Johnson and H. Miller (eds), The IFS Green Budget: February 2012, Institute for Fiscal Studies, London, 2012.
© Institute for Fiscal Studies, 2014
7
arrangements between those two years (with those waves of the BHPS being the only ones that contain the key information).10
As Disney and Whitehouse (1996)11 set out, there are various different ways of measuring the value of pension rights. In this paper, the value that we attribute to being a member of a scheme in a particular year is the increase in the estimated present discounted value (PDV) of the pension income between now and one year’s time, less any employee contributions that are paid to be a member of the scheme.
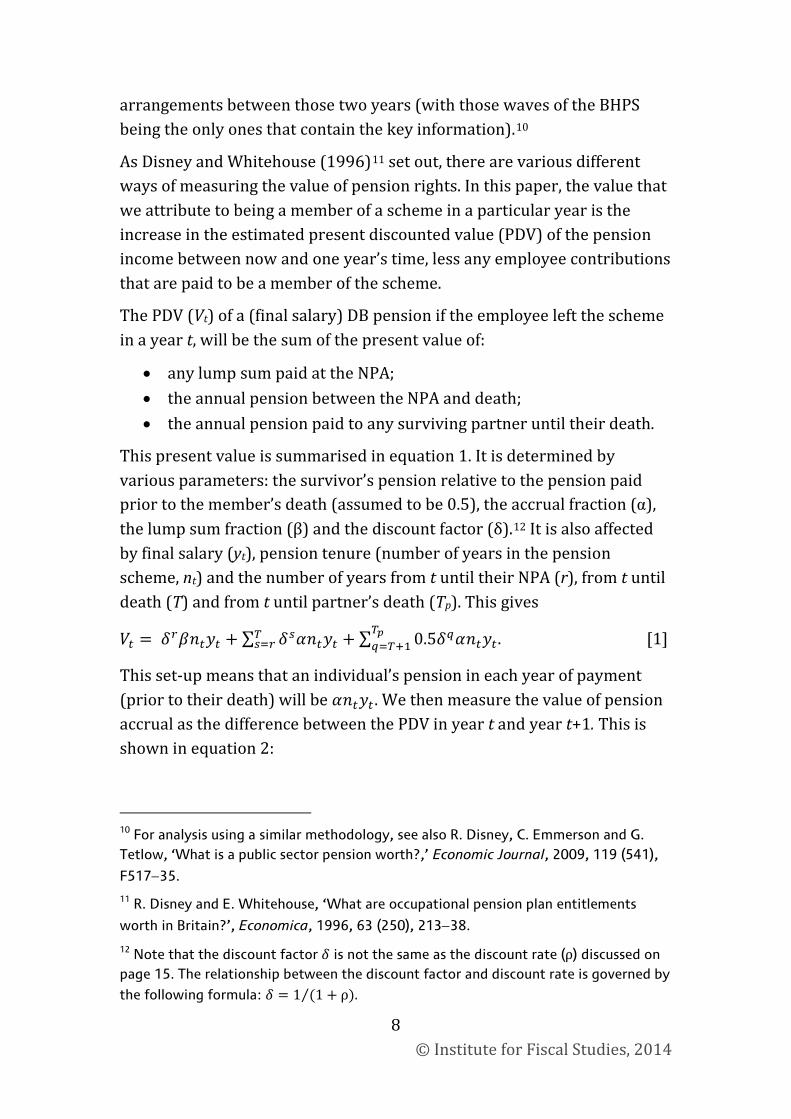
The PDV (Vt) of a (final salary) DB pension if the employee left the scheme in a year t, will be the sum of the present value of:
• any lump sum paid at the NPA; • the annual pension between the NPA and death; • the annual pension paid to any surviving partner until their death.
This present value is summarised in equation 1. It is determined by various parameters: the survivor’s pension relative to the pension paid prior to the member’s death (assumed to be 0.5), the accrual fraction (α), the lump sum fraction (β) and the discount factor (δ).12 It is also affected by final salary (yt), pension tenure (number of years in the pension scheme, nt) and the number of years from t until their NPA (r), from t until death (T) and from t until partner’s death (Tp). This gives
𝑉𝑡 = 𝛿𝑟𝛽𝑛𝑡𝑦𝑡 + ∑ 𝛿𝑠𝛼𝑛𝑡𝑦𝑡𝑇𝑠=𝑟 + ∑ 0.5𝛿𝑞𝛼𝑛𝑡𝑦𝑡
𝑇𝑝𝑞=𝑇+1 . [1]
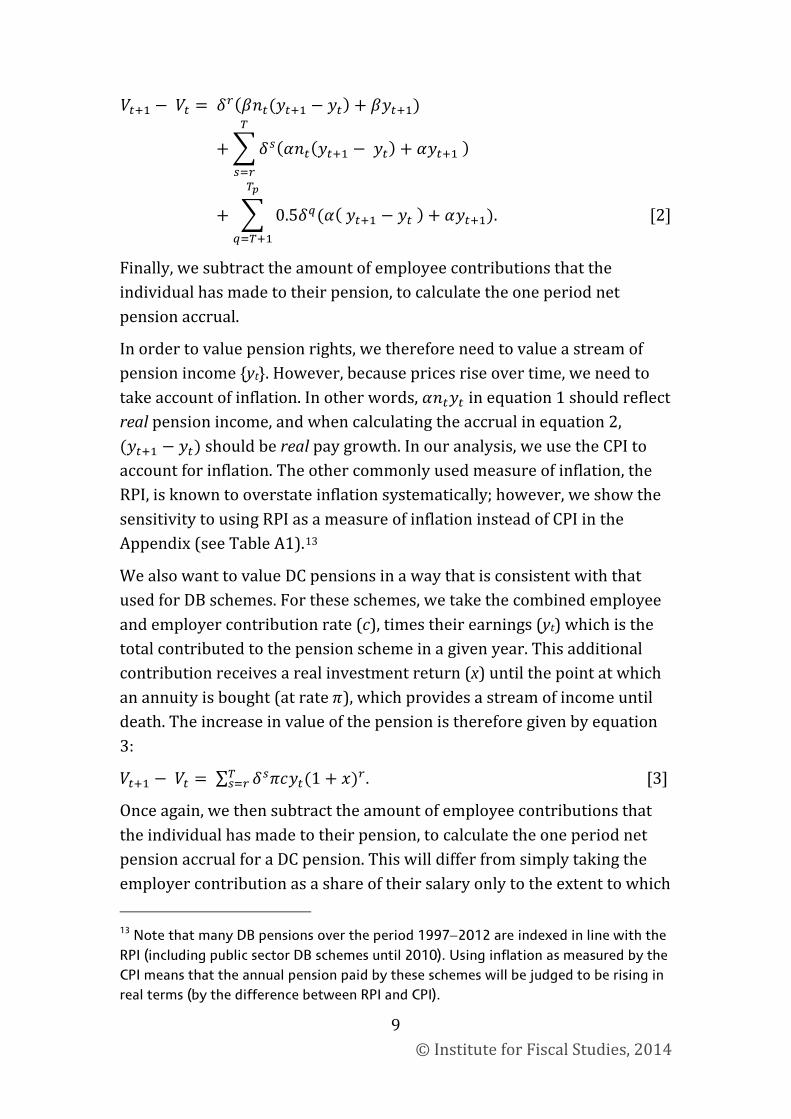
This set-up means that an individual’s pension in each year of payment (prior to their death) will be 𝛼𝑛𝑡𝑦𝑡 . We then measure the value of pension accrual as the difference between the PDV in year t and year t+1. This is shown in equation 2:
10 For analysis using a similar methodology, see also R. Disney, C. Emmerson and G. Tetlow, ‘What is a public sector pension worth?,’ Economic Journal, 2009, 119 (541),
F517−35.
11 R. Disney and E. Whitehouse, ‘What are occupational pension plan entitlements
worth in Britain?’, Economica, 1996, 63 (250), 213−38.
12 Note that the discount factor 𝛿 is not the same as the discount rate (ρ) discussed on page 15. The relationship between the discount factor and discount rate is governed by
the following formula: 𝛿 = 1 (1 + ρ)⁄ .
© Institute for Fiscal Studies, 2014
8
𝑉𝑡+1 − 𝑉𝑡 = 𝛿𝑟(𝛽𝑛𝑡(𝑦𝑡+1 − 𝑦𝑡) + 𝛽𝑦𝑡+1)
+ �𝛿𝑠(𝛼𝑛𝑡(𝑦𝑡+1 − 𝑦𝑡) + 𝛼𝑦𝑡+1 )𝑇
𝑠=𝑟
+ � 0.5𝛿𝑞(𝛼( 𝑦𝑡+1 − 𝑦𝑡 )
𝑇𝑝
𝑞=𝑇+1
+ 𝛼𝑦𝑡+1). [2]
Finally, we subtract the amount of employee contributions that the individual has made to their pension, to calculate the one period net pension accrual.
In order to value pension rights, we therefore need to value a stream of pension income {yt}. However, because prices rise over time, we need to take account of inflation. In other words, 𝛼𝑛𝑡𝑦𝑡 in equation 1 should reflect real pension income, and when calculating the accrual in equation 2, (𝑦𝑡+1 − 𝑦𝑡) should be real pay growth. In our analysis, we use the CPI to account for inflation. The other commonly used measure of inflation, the RPI, is known to overstate inflation systematically; however, we show the sensitivity to using RPI as a measure of inflation instead of CPI in the Appendix (see Table A1).13
We also want to value DC pensions in a way that is consistent with that used for DB schemes. For these schemes, we take the combined employee and employer contribution rate (c), times their earnings (yt) which is the total contributed to the pension scheme in a given year. This additional contribution receives a real investment return (x) until the point at which an annuity is bought (at rate 𝜋), which provides a stream of income until death. The increase in value of the pension is therefore given by equation 3:
𝑉𝑡+1 − 𝑉𝑡 = ∑ 𝛿𝑠𝜋𝑐𝑦𝑡(1 + 𝑥)𝑟𝑇𝑠=𝑟 . [3]
Once again, we then subtract the amount of employee contributions that the individual has made to their pension, to calculate the one period net pension accrual for a DC pension. This will differ from simply taking the employer contribution as a share of their salary only to the extent to which
13 Note that many DB pensions over the period 1997−2012 are indexed in line with the RPI (including public sector DB schemes until 2010). Using inflation as measured by the CPI means that the annual pension paid by these schemes will be judged to be rising in real terms (by the difference between RPI and CPI).
© Institute for Fiscal Studies, 2014
9
high (low) investment returns and annuity rates relative to the discount rate boost (depress) the value of employer and employee contributions to a DC pension.
Our final aim is to compare the joint value of pay and pension rights across public and private sectors. To do this, we use the Labour Force Survey (LFS) as our base data. This contains the information on hourly pay that we use for our estimates of the public sector pay differential. The principle behind our methodology is that, for each worker in the LFS, we calculate the value to them of the pension rights that accrue in the year they are observed, using the formulae set out above. However, we need to make a number of assumptions, and combine information from different data sources in order to do this.
Pension coverage
The first additional piece of information that we need − but which is not available in the LFS − is pension coverage. Specifically, we need to know whether or not an individual is a member of an employer-provided pension scheme and, if so, whether that scheme is a DB or a DC scheme. To do this, we use ASHE data to estimate mean membership rates of workplace DB and DC schemes among certain groups. Then, we assign to individuals observed in those groups in the LFS those probabilities of being in a DB or a DC pension arrangement.14 To do this, the groups need to be defined using factors that can be observed in both the LFS and ASHE and, in order for our estimates to be accurate, need to reflect groups within which pension coverage is relatively constant (or at least does not vary systematically with other characteristics that affect the estimated value of these pensions).
For this exercise (and for each year of data) we first split individuals according to whether they work in the public sector and, if they work in the private sector, into one of six different broad occupational
14 Specifically, if for a certain group of people (e.g., female public sector workers aged
30−39 in 2012), X% have a DB pension, Y% have a DC pension and (100 − X − Y)% have no pension as recorded in ASHE, then X% of the observations in this group in the LFS will be ‘allocated’ as having a DB pension, and (different) Y% will be allocated as having a DC pension. The three states ‘DB pension’, ‘DC pension’ and ‘No pension’ are mutually exclusive and exhaustive.
© Institute for Fiscal Studies, 2014
10
classifications.15 Within each of these groups, we also split the data by sex and by the age group of the individual (split into 10-year bands). This latter split is done to try to capture the fact that the fall in DB membership among private sector employees over time is greater among younger individuals than older individuals, as one would expect given that many schemes are closed to new members.
Pension accrual
Accrual in defined benefit schemes
As shown in equation 2, to estimate the annual pension accrual within DB pension schemes, the additional pieces of information that we need are pension tenure (𝑛𝑡), pay growth (𝑦𝑡+1 − 𝑦𝑡) and the rules of the scheme (accrual rate 𝛼, lump sum fraction 𝛽 and the NPA). For pension tenure, we use data from the 2001 and 2005 waves of the BHPS, which contain a question specifically on how long an individual has been a member of their pension arrangement, alongside questions on whether the scheme operates on a DB or a DC basis. For each individual in the LFS who is a member of pension scheme, we find an individual in the BHPS who is a member of the same type of scheme (DB or DC), who works in the same sector (public or private), is in the same age band (five-year bands) and is of the same sex.16 For years up to and including 2001, we impute pension
15 These are based on one-digit Standard Occupational Codes. The six occupational groups are: Managers, directors and senior officials (SOC group 1); Professional occupations (SOC group 2); Associate professional and technical occupations (SOC group 3); Administrative and secretarial occupations (SOC group 4); Skilled trades occupations, sales and customer service occupations, and process, plant and machine operatives (SOC groups 5, 7 and 8); Caring, leisure and other service occupations, and elementary occupations (SOC groups 6 and 9). The latter groups are aggregated to achieve sufficient sample size in ASHE and are aggregated in such a way that the SOC groups that are aggregated together have similar mean pension coverage and contributions. Because of the low numbers of managers, directors and senior officials
for workers aged 20−29, we combine SOC groups 1 and 2 for these young adults only.
For the years 1997−2000, we use the SOC 1990 classifications, from 2001 to 2010 the SOC 2000 classification and for 2011 and 2012 the SOC 2010 classifications
16 In order to ensure that we have a similar distribution of pension tenures in the LFS as in the BHPS, we use a multiple imputation process, which means that the dataset is expanded tenfold prior to imputation of pension coverage and tenure. This means that we create 10 versions of each individual, and when regressions are run, we cluster the standard errors at the individual level.
© Institute for Fiscal Studies, 2014
11
tenure from the 2001 BHPS, and for years from 2005 to 2012, we impute pension tenure from the 2005 BHPS. For the years in between, for each individual, we impute from either the 2001 or 2005 BHPS, with an appropriate probability of drawing from each year.
For pay growth, we apply to each individual the estimated average (median) hourly wage growth observed at different ages over the period from 1994 to 2006 in the LFS. Following Crawford, Emmerson and Tetlow (2010), this is done separately by sex, sector and education group. Getting the shape of these pay profiles is important because final salary schemes are relatively more generous in jobs where pay is relatively backloaded, and this is more common in the public sector than in the private sector (perhaps driven by the greater use of incremental scales in the former).17 Higher (lower) growth in pay would increase (reduce) the estimated value of DB pension arrangements.
For the scheme rules, we make some stylised assumptions. For private sector DB schemes, we assume that these schemes operate on a final salary basis, have a 1/60th accrual rate and an NPA of 65. So, for example, an individual with a 40-year pension tenure could receive a pension worth two-thirds of their final salary from age 65. For these schemes, we assume that both deferred pensions and pensions-in-payment are uprated annually in line with the RPI.18 For public sector DB schemes, we assume that prior to 2007 these had a 1/80th accrual rate, that the schemes also paid a lump sum worth 3/80ths of final salary and that they had an NPA of 60. So, for example, an individual with a 40-year pension tenure could receive a pension worth half of their final salary from age 60 and would also receive a lump sum on retirement worth 1.5 times their final salary. Initially, at least, we also assume that both deferred pensions and pensions-in-payment from these schemes are uprated annually in line with the RPI (and therefore increase relative to inflation as measured by
17 See Crawford, Emmerson and Tetlow (2010) for the details of the exact details of the earnings profiles estimated. Given the shape of these profiles, some workers are expected to see a fall in their earnings. We restrict the largest fall in real earnings to be at most 2.5%, given that, in practice, workers are unlikely to receive a reduction in their nominal hourly pay.
18 In practice, these schemes may offer individuals the opportunity to take a tax-free lump sum in return for a lower annual pension; implicitly, we are assuming that this is done in a way that does not affect the PDV of the pension.
© Institute for Fiscal Studies, 2014
12
the CPI). We also assume that all DB pensions (in both the public and private sector schemes) pay out half the pension to any spouse who outlives the recipient of the pension, up until the death of the spouse.
We should note that there are other public sector pension schemes, such as those of the police, which provide a pension after a fixed number of years of service, as well as more generous health-related retirement benefits.19 The heterogeneity in the rules of some public sector schemes – and, in particular, some of the relatively more generous features of these schemes – is therefore missed in this analysis and is likely to lead us to underestimate the value of public service pensions relative to private sector pensions.
Following Emmerson and Jin (2012),20 we also estimate the value of public sector pension schemes after different reforms have come into force. From April 2008 onwards, we increase the NPA for new entrants to public service pension schemes from age 60 to 65.21 We also model the impact of the coalition government’s change in indexation from the RPI to the CPI. Finally, we also assess the impact of implementing the recommendations of the Hutton Review by assessing a scheme that operates on a Career Average Revalued Earnings (CARE) basis, with an accrual rate of 1/54th, benefits accrued being revalued annually by CPI plus 1.5 percentage points and with an NPA set equal to the SPA. These are, broadly speaking, the rules of the new NHS scheme, which is one of the largest public service pension schemes.22 In contrast, we do not allow for any reforms to private sector DB schemes. To the extent that private sector DB schemes have
19 For more details, see R. Crawford and R. Disney, ‘Reform of police pensions in
England and Wales’, Journal of Public Economics, 2014, 116, 62−72.
20 C. Emmerson and W. Jin, ‘Public sector pensions and pay’, in C. Emmerson, P. Johnson and H. Miller (eds), The IFS Green Budget: February 2012, Institute for Fiscal Studies, London, 2012.
21 The NHS pension scheme and local government pension scheme introduced the NPA of 65 for new entrants to the scheme from April 2008. The Teachers’ Pension Scheme introduced it from January 2007. For more details, see Pensions Policy Institute, ‘The implications of the Coalition Government’s public service pension reforms’, 2013 (http://www.pensionspolicyinstitute.org.uk/publications/reports/the-implications-of-the-coalition-governments-public-service-pension-reforms). 22 The new Teachers’ Pension Scheme has fairly similar parameters. See Pensions Policy Institute (2013) in the previous footnote for more details.
© Institute for Fiscal Studies, 2014
13
been made less generous, then we will, over time, increasingly understate the average value of public sector pensions relative to private sector pensions.
Accrual in defined contribution schemes
As discussed above, we want to measure accrual in DC pensions in a way that is consistent with the way in which we estimate accrual in DB pensions. To do this, the additional pieces of information that we need, which are not available in the LFS, are the amounts being contributed by the employer and the employee, the investment return being achieved each year and the annuity rate at retirement.
The rates of employee and employer contributions are inputted from ASHE in the same way as DB and DC pension coverage: that is, for each year, we take the average contribution rate observed for each group, with groups defined on the basis of age (10-year bands), sex, sector and, for private sector workers, which of six occupational classifications they work in.23 We assume that the annual investment return is CPI inflation plus 2 percentage points. For annuity rates, we take the mean sex-specific (no guarantee) age 65 RPI-linked annuity rates in each year.24
Converting pension incomes into pension wealth
In order to convert the estimated pension incomes into a pension wealth figure, we take the PDV of the pension income from retirement until death. This requires an estimate of the life expectancy of the individual (and, where relevant, their partner), and we also need to assume a discount rate.
23 The ASHE only contains contributions to pensions from 2005 onwards. We assume that the contribution rates within each age/sex/sector/occupation ‘cell’ are unchanged between the years of 1997 and 2005.
24 We are very grateful to Edmund Cannon for making available to us historic data on annuity rates. These data only cover the period September 1998 to April 2009. For the period from January 1997 to August 1998, we assume that the mean sex-specific no guarantee age 65 RPI-linked annuity rates change by the same amount as the non-RPI-linked mean sex-specific age 65 annuity rates (i.e. annuity rates that provide a fixed nominal income in each year rather than increasing by RPI). For the period from May 2009 to December 2012, we assume that the RPI-linked annuity rates change by the same amount as the 10-year UK government bond yields, downloaded from the St Louis Federal Reserve (http://research.stlouisfed.org/fred2).
© Institute for Fiscal Studies, 2014
14
For life expectancy, we first take the age- and sex-specific cohort life expectancies from the Office for National Statistics.25 We then adjust these for the mortality gradient in socio-economic class that was observed between 2002 and 2006.26 This will increase the average life expectancy of (for example) high earners relative to low earners, making the assumption that the gradient observed with socio-economic class in the recent past will continue to persist into the future. We then assume that all individuals will die exactly at their life expectancy. For those in DB schemes, we also estimate the value of survivor benefits based on the assumption that their partner will also die at their own life expectancy and that, where relevant, half the pension will be received by the surviving spouse.27
We assume a real discount rate of 2% (i.e. in nominal terms 2% higher than CPI inflation).28
Finally, the estimate of pension accrual is calculated by taking the difference between the estimated current value of the pension and the estimated value of the pension in one year’s time. In order to compute the value of the employer’s contribution to this pension scheme, we deduct
25 In each year from 2004 onwards, we use the cohort life expectancies in that year. Therefore, we not only account for an increase in life expectancy for each cohort, but any upward revisions to life expectancy. Prior to 2004, we use 2004-based cohort life expectancies, because they have not been produced prior to that.
26 In the LFS, social class is measured by Registrar General’s Social Class up to and including 2000, and by the National Statistics Socio-Economic Classification (NS-SEC) from 2001 onwards. We use the mortality gradients at age 65, which are reported in http://www.ons.gov.uk/ons/rel/health-ineq/health-inequalities/trends-in-life-expectancy--1982---2006/trends-in-life-expectancy-by-the-national-statistics-socio-economic-classification-1982-2006.pdf.
27 Annuity rates are significantly determined by life expectancy; see, for example, E. Cannon and I. Tonks, ‘Money’s worth of pension annuities’, Department of Work and Pensions Research Report No. 563, 2009 (http://webarchive.nationalarchives.gov.uk/20130128102031/http://www.dwp.gov.uk/asd/asd5/rports2009-2010/rrep563.pdf). Therefore, for individuals with DC pensions, we assume that their life expectancy, and their partner’s life expectancy, is the age 65 (cohort) life expectancy in the year that they are observed.
28 In order to check the sensitivity of our results, in Figure A2, Figure A3 and Table A1, we present results based on a higher real discount rate of 3 percentage points above the CPI.
© Institute for Fiscal Studies, 2014
15

from this the amount that the employee has contributed (and we describe this as the one-period net pension accrual).
4. Value of workplace pensions for public and private sector workers
Using the methodology set out in Section 3, we are able to calculate the value of employer-provided pensions under different scheme rules. Figure 2 shows the average (mean) one-period net pension accrual to public sector workers under different scheme rules, and our estimates for mean net pension accrual for private sector workers in DB schemes, as well as workers in DC schemes in each sector. This is shown for 2012.
The first row shows that a public sector DB pension scheme with an NPA of 60, indexed to the RPI and with the employee contributions observed in 2010, is estimated to be worth an average of 41% of a year’s salary. One driver of this figure (which might seem large) is that this is for an RPI-linked pension where inflation is taken as being measured by the CPI and the gap between the RPI and the CPI is assumed to run at 1.4 percentage points per year (the rationale for this assumed RPI−CPI gap is discussed below). The equivalent figure for when inflation is assumed to be measured by the RPI is 25% of salary (as is shown in Figure A1 in the Appendix).
Changing the NPA to 65 reduces the value of a public service pension significantly from 41% of salary to 34% of salary, with a slight further reduction from moving to the employee contribution rates observed in the data in 2012.29 This is the same value as the average estimated value of private sector DB schemes (which, by assumption, have an NPA of 65 and are indexed to the RPI).
The effect of moving from RPI to CPI indexation is determined by the long-run difference between the CPI and the RPI. The RPI tends to be higher than the CPI because it includes housing costs, which are expected to rise faster than other prices in the future, and because of differences in the formula used to calculate inflation. Therefore, moving to a scheme where pensions are indexed by a lower measure of inflation will reduce the estimated value of the pension. The Office for Budget Responsibility (OBR)
29 On average, employee contributions to public sector DB schemes rose from 6.0% to 6.7% of earnings between 2011 and 2012.
© Institute for Fiscal Studies, 2014
16
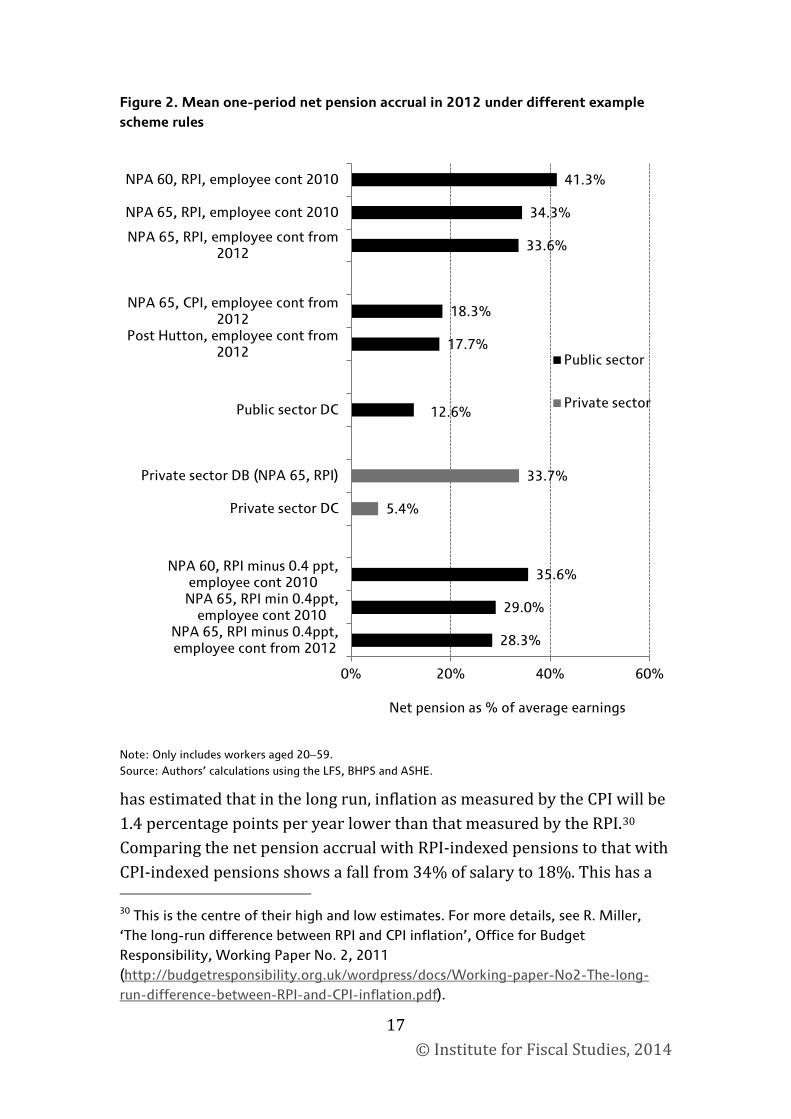
Figure 2. Mean one-period net pension accrual in 2012 under different example scheme rules
Note: Only includes workers aged 20−59. Source: Authors’ calculations using the LFS, BHPS and ASHE.
has estimated that in the long run, inflation as measured by the CPI will be 1.4 percentage points per year lower than that measured by the RPI.30 Comparing the net pension accrual with RPI-indexed pensions to that with CPI-indexed pensions shows a fall from 34% of salary to 18%. This has a
30 This is the centre of their high and low estimates. For more details, see R. Miller, ‘The long-run difference between RPI and CPI inflation’, Office for Budget Responsibility, Working Paper No. 2, 2011 (http://budgetresponsibility.org.uk/wordpress/docs/Working-paper-No2-The-long-run-difference-between-RPI-and-CPI-inflation.pdf).
5.4%
33.7%
28.3%
29.0%
35.6%
12.6%
17.7%
18.3%
33.6%
34.3%
41.3%
0% 20% 40% 60%
NPA 65, RPI minus 0.4ppt, employee cont from 2012
NPA 65, RPI min 0.4ppt, employee cont 2010
NPA 60, RPI minus 0.4 ppt, employee cont 2010
Private sector DC
Private sector DB (NPA 65, RPI)
Public sector DC
Post Hutton, employee cont from 2012
NPA 65, CPI, employee cont from 2012
NPA 65, RPI, employee cont from 2012
NPA 65, RPI, employee cont 2010
NPA 60, RPI, employee cont 2010
Net pension as % of average earnings
Public sector
Private sector
© Institute for Fiscal Studies, 2014
17
large impact on the estimated value of pensions because of the compounding impact of uprating the annual pension by 1.4 percentage points less each year (with this being done both in deferral – i.e. between the individual leaving their employer and the NPA − and in payment − i.e. between their NPA and their death (or that of their spouse)).
One reason why the difference between the RPI and the CPI is so large is that the RPI is known to overstate inflation systematically because of the formula it uses, and as a result it has recently lost its National Statistics status. (This is why we use the CPI rather than the RPI when estimating the real value of employer-provided pensions; see Figure A1 in the Appendix for the equivalent analysis relative to inflation as measured by the RPI.)
Changes in the way prices were sampled increased the RPI measure of inflation in 2010,31 and meant that, according to the OBR,32 the ‘formula effect’ (i.e. the difference between CPI and RPI inflation that is driven purely by the formulae used to calculate them) increased by 0.4 percentage points from 0.5 percentage points to 0.9 percentage points. Therefore, one could have imagined an alternative indexation policy, of RPI minus 0.4 percentage points, coming into force from 2010 onwards, which would have been sufficient to offset the unforeseen increase in the formula effect. Such a reform would have preserved the generosity of public service pension schemes, relative to CPI, with what might have been expected prior to 2010 (i.e. we would continue to expect pensions to be uprated by, on average, 1 percentage point more each year than the CPI). Indexing pensions in deferral and payment to RPI minus 0.4 percentage points would have led to net pension accrual being an average of 28% of
31 For more details on the RPI measure of inflation and the problems with it, see P. Levell, ‘Is the Carli index flawed?: assessing the case for the new Retail Price Index RPIJ’, Journal of the Royal Statistical Society: Series A, 2015, 178, forthcoming, and D. Morgan and P. Gooding, ‘CPI and RPI: increased impact of the formula effect in 2010’, Office for National Statistics, Newport, 2010 (http://www.ons.gov.uk/ons/guide-method/user-guidance/prices/cpi-and-rpi/cpi-and-rpi---increased-impact-of-theformula-effect-in-2010.pdf).
32 See R. Miller, ‘The long-run difference between RPI and CPI inflation’, Office for Budget Responsibility, Working Paper No. 2, 2011 (http://budgetresponsibility.org.uk/wordpress/docs/Working-paper-No2-The-long-run-difference-between-RPI-and-CPI-inflation.pdf).
© Institute for Fiscal Studies, 2014
18
salary rather than 34% under RPI indexation, and compared to this counterfactual (of pension indexed to RPI minus 0.4 ppt) implies that the effect of CPI indexation is to reduce net pension accrual by 10 percentage points rather than by 15 percentage points. In other words, of the 15 percentage point reduction in the average estimated generosity of public service pension schemes as a result of the move from RPI to CPI uprating, about one-third is an unwinding of the increased gap between the RPI and CPI, which materialised after 2010. The other two-thirds is a reduction relative to the gap between the RPI and CPI that might have been expected prior to 2010.
Finally, changes made in response to the Hutton Review only led to a slight reduction in the estimated average generosity of these schemes. The OBR, when estimating the long-run taxpayer cost of public service pensions, also concluded that the shift from RPI to CPI indexation reduced future costs considerably, whereas the subsequent reforms following the Hutton Review reduced them only slightly.33
The estimates also suggest that while public sector DC schemes are less generous, on average, than public sector DB schemes, they are still more generous than private sector DC schemes. This is primarily because public sector employers, on average, contribute more towards the DC pension pots than do private sector employers.
Figure 2 is for one snapshot in time and assumes that each of these schemes is fully in place. Over time, the generosity of a given scheme can change – for example, an unanticipated increase in longevity would increase the generosity of a given DB pension arrangement. In addition, some of the reforms to public service pensions are being phased in gradually over time – specifically, the rise in the NPA for many schemes implemented by the last Labour government in 2007/08 only applied to new entrants to these schemes. While the reforms that the coalition government is implementing as a response to the Hutton Review do apply to both existing members of public sector schemes as a well as new entrants (although with an exemption of those within 10 years of their NPA), the reforms only affect future accrual, not the value of pension
33 See Appendix A, in particular Chart A.3, of Office for Budget Responsibility, Fiscal sustainability report, The Stationary Office, London, July 2012 (http://budgetresponsibility.org.uk/wordpress/docs/FSR2012WEB.pdf).
© Institute for Fiscal Studies, 2014
19
promises made in earlier years. Therefore, the reforms have no impact on the period for which we have data (1997−2012).
We now examine the changing generosity of employer-provided pensions in the public and private sectors over time. In all of this analysis, we take the average value, as a share of salary, over all employees; that is, it includes those workers (often the majority in the private sector) who do not have an employer-provided pension scheme.
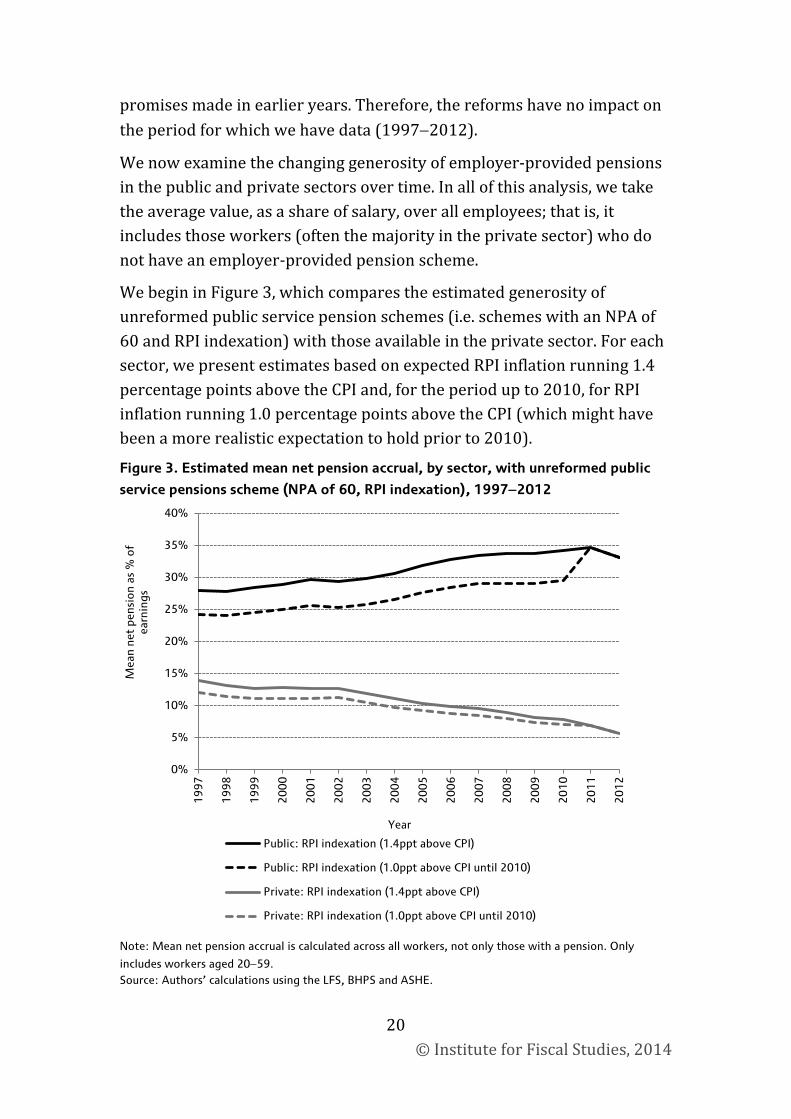
We begin in Figure 3, which compares the estimated generosity of unreformed public service pension schemes (i.e. schemes with an NPA of 60 and RPI indexation) with those available in the private sector. For each sector, we present estimates based on expected RPI inflation running 1.4 percentage points above the CPI and, for the period up to 2010, for RPI inflation running 1.0 percentage points above the CPI (which might have been a more realistic expectation to hold prior to 2010).
Figure 3. Estimated mean net pension accrual, by sector, with unreformed public
service pensions scheme (NPA of 60, RPI indexation), 1997−2012
Note: Mean net pension accrual is calculated across all workers, not only those with a pension. Only
includes workers aged 20−59. Source: Authors’ calculations using the LFS, BHPS and ASHE.
0%
5%
10%
15%
20%
25%
30%
35%
40%
19
97
19
98
19
99
20
00
20
01
20
02
20
03
20
04
20
05
20
06
20
07
20
08
20
09
20
10
20
11
20
12
Mea
n ne
t pe
nsio
n as
% o
f
earn
ings
Year
Public: RPI indexation (1.4ppt above CPI)
Public: RPI indexation (1.0ppt above CPI until 2010)
Private: RPI indexation (1.4ppt above CPI)
Private: RPI indexation (1.0ppt above CPI until 2010)
© Institute for Fiscal Studies, 2014
20
Among private sector employees, with RPI inflation running 1.4 percentage points above CPI, the average value of employer-provided pensions has fallen from 14% of salary in 1997 to 6% in 2012, reflecting not only the fall in coverage but the fall in generosity where schemes do exist, in large part down to the replacement of more generous DB schemes with less generous DC schemes. Because only a minority of private sector employees are members of (RPI-indexed) DB pensions, changing the expected indexation of these schemes to 1.0% above CPI (rather than 1.4% above CPI) for the period up to 2010 only leads to a slight reduction in the estimated value of these schemes over this period.
In contrast to the decline in estimated average pension accrual among private sector employees over the period between 1997 and 2012, an unreformed public sector scheme would have led to an estimated increase in average accrual. For example (and as shown in Figure 3), across all public sector workers, assuming an NPA of 60 combined with RPI indexation and an RPI−CPI gap of 1.4 percentage points, the average generosity would have increased from 28% of salary in 1997 to 35% in 2011. It then noticeably dips to 33% in 2012, in part as a result of the increase in employee contributions observed in the last year of the data, as shown in Figure 2. As discussed above, for much of this period, the expectation might have been that the gap between the RPI and CPI would run at around 1 percentage point rather than the 1.4 percentage points that has materialised since 2010. The use of this lower gap suggests that the value of public service pensions, again averaged across all employees, increased from 24% of salary in 1997 to 29% in 2009. Considered in this way, the generosity of these schemes then appears to jump up in 2010 when the expected gap between the RPI and CPI measures of inflation increases significantly.
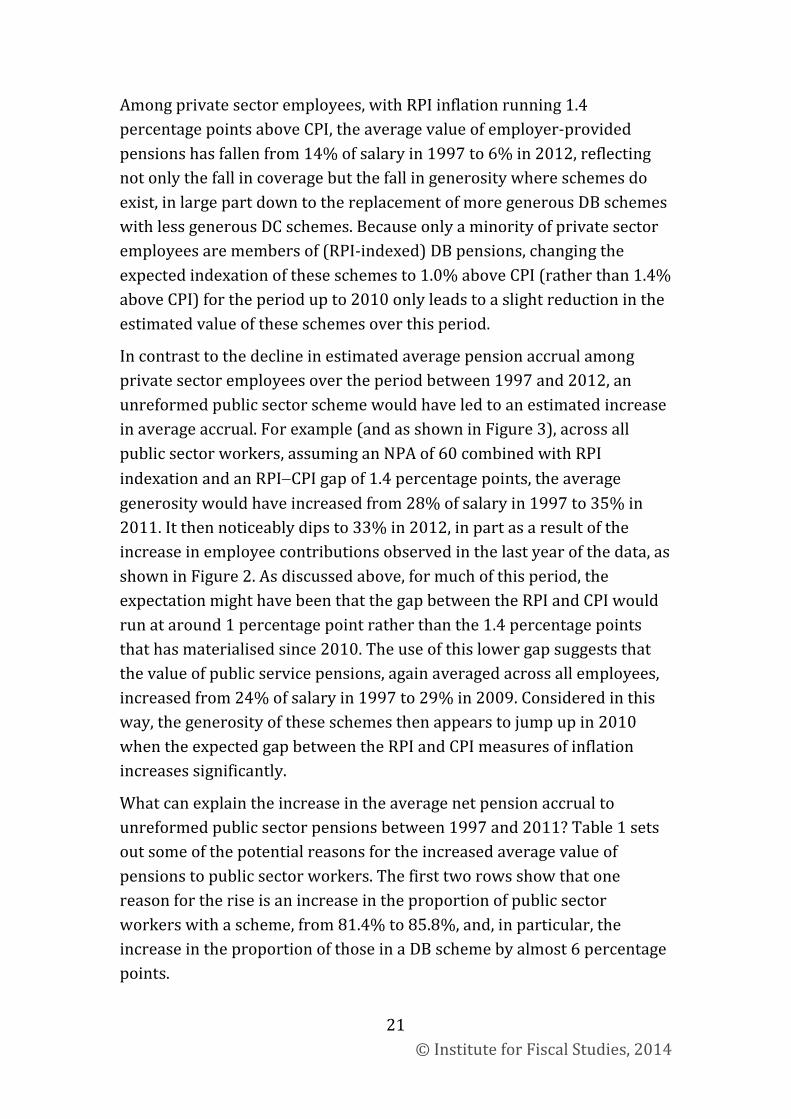
What can explain the increase in the average net pension accrual to unreformed public sector pensions between 1997 and 2011? Table 1 sets out some of the potential reasons for the increased average value of pensions to public sector workers. The first two rows show that one reason for the rise is an increase in the proportion of public sector workers with a scheme, from 81.4% to 85.8%, and, in particular, the increase in the proportion of those in a DB scheme by almost 6 percentage points.
© Institute for Fiscal Studies, 2014
21
Table 1. Characteristics of workforce and people with DB pensions in the public and private sectors, 1997 and 2011
Private sector Public sector
1997 2011 1997 2011 % of workforce:
Has a pension 49.0% 37.9% 81.4% 85.8% Has a DB pension 36.9% 13.6% 77.3% 83.2% Of those with DB pension:
Female 37.6% 40.5% 60.5% 67.8% Mean male life expectancy at 60 21.8 24.8 26.0 29.5 Mean female life expectancy at 60 24.6 27.8 28.8 32.5 Mean pension tenure 8.5 12.8 10.3 14.0 Mean age 39.0 44.2 40.5 42.9 Highest qualification:
GCSE or lower 47.5% 37.2% 34.3% 29.4%
Highest qualification:
A-level or equivalent 32.3% 26.8% 34.5% 29.8%
Highest qualification:
higher education 20.3% 36.0% 31.2% 40.8%
Note: Only includes workers aged 20−59. Source: Authors’ calculations using the LFS, BHPS and ASHE.
Of those with a public sector DB pension, there are changes in characteristics that lead to higher pension accrual. The increase in the proportion of members of public sector DB schemes with higher education qualifications from 31.2% to 40.8% in 2011 will lead to higher estimated mean accrual, because, on average, more educated workers have higher pay growth and longer life expectancy. Similarly, there has been an increase in the proportion of members of public sector DB schemes who are female from 60.5% to 67.8%, which will increase costs because of the greater average longevity of women than men. There has also been a sizeable increase in longevity at age 60 for both men and women over this period, which will also contribute to the rising costs of DB schemes. Finally, the increase in average age has been one reason that average pension tenure has risen, from 10.3 years to 14.0 years in 2011. Increased pay growth, pension tenure and life expectancy are all important in increasing the average value of pensions for public sector workers.
Building on the analysis presented in Figure 3, we now consider the impact of the reforms that have been implemented, which have affected the estimated value of pension accrual over the period from 1997 to 2012. First, we consider the effect of increasing the NPA from age 60 to age 65
© Institute for Fiscal Studies, 2014 22
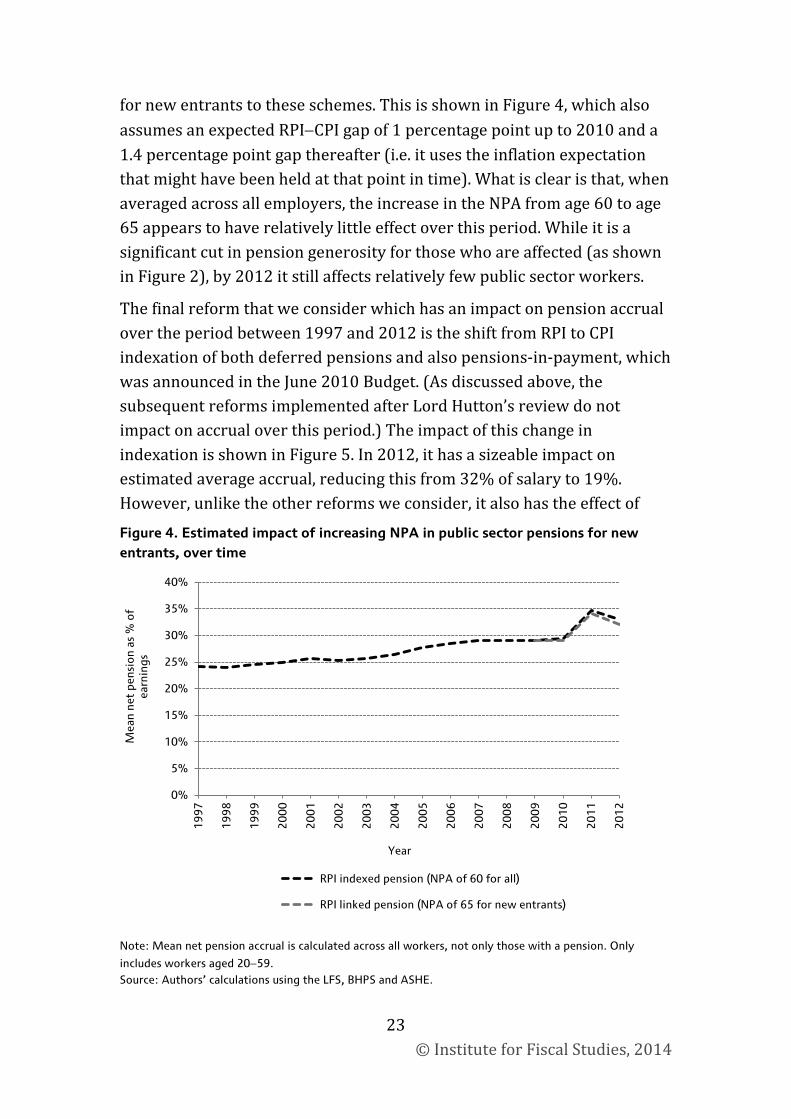
for new entrants to these schemes. This is shown in Figure 4, which also assumes an expected RPI−CPI gap of 1 percentage point up to 2010 and a 1.4 percentage point gap thereafter (i.e. it uses the inflation expectation that might have been held at that point in time). What is clear is that, when averaged across all employers, the increase in the NPA from age 60 to age 65 appears to have relatively little effect over this period. While it is a significant cut in pension generosity for those who are affected (as shown in Figure 2), by 2012 it still affects relatively few public sector workers.
The final reform that we consider which has an impact on pension accrual over the period between 1997 and 2012 is the shift from RPI to CPI indexation of both deferred pensions and also pensions-in-payment, which was announced in the June 2010 Budget. (As discussed above, the subsequent reforms implemented after Lord Hutton’s review do not impact on accrual over this period.) The impact of this change in indexation is shown in Figure 5. In 2012, it has a sizeable impact on estimated average accrual, reducing this from 32% of salary to 19%. However, unlike the other reforms we consider, it also has the effect of
Figure 4. Estimated impact of increasing NPA in public sector pensions for new entrants, over time
Note: Mean net pension accrual is calculated across all workers, not only those with a pension. Only
includes workers aged 20−59. Source: Authors’ calculations using the LFS, BHPS and ASHE.
0%
5%
10%
15%
20%
25%
30%
35%
40%
19
97
19
98
19
99
20
00
20
01
20
02
20
03
20
04
20
05
20
06
20
07
20
08
20
09
20
10
20
11
20
12
Mea
n ne
t pe
nsio
n as
% o
f
earn
ings
Year
RPI indexed pension (NPA of 60 for all)
RPI linked pension (NPA of 65 for new entrants)
© Institute for Fiscal Studies, 2014
23
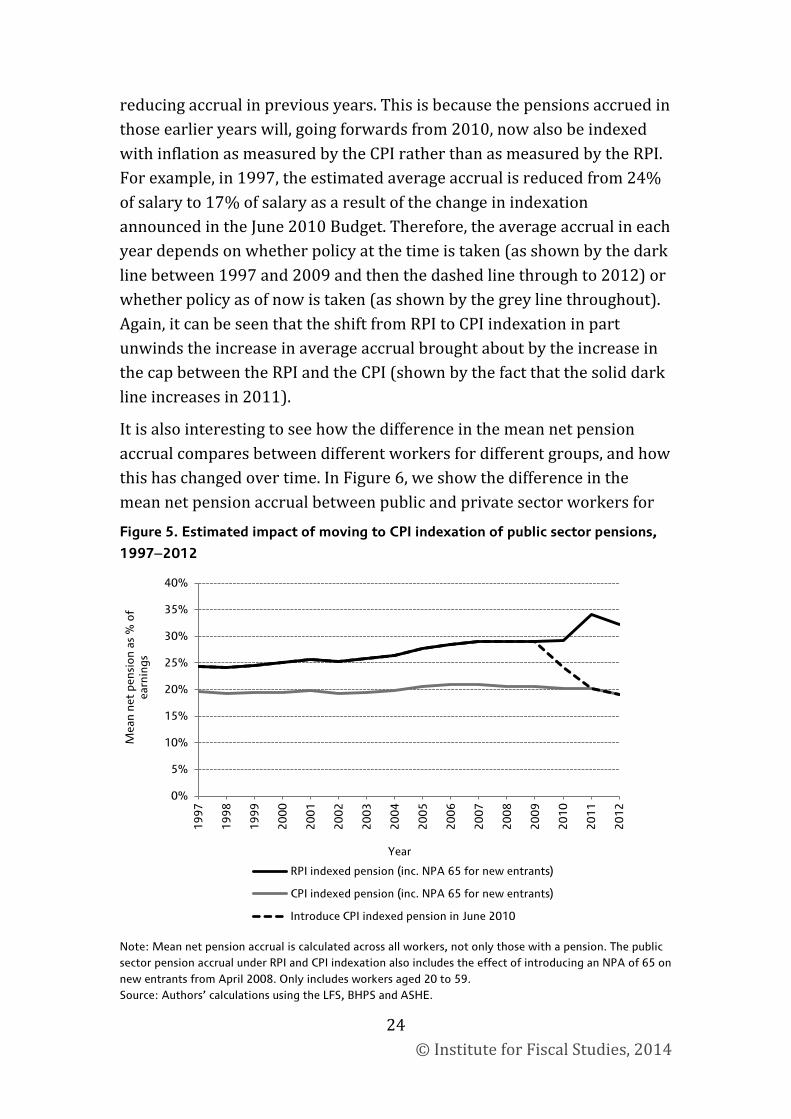
reducing accrual in previous years. This is because the pensions accrued in those earlier years will, going forwards from 2010, now also be indexed with inflation as measured by the CPI rather than as measured by the RPI. For example, in 1997, the estimated average accrual is reduced from 24% of salary to 17% of salary as a result of the change in indexation announced in the June 2010 Budget. Therefore, the average accrual in each year depends on whether policy at the time is taken (as shown by the dark line between 1997 and 2009 and then the dashed line through to 2012) or whether policy as of now is taken (as shown by the grey line throughout). Again, it can be seen that the shift from RPI to CPI indexation in part unwinds the increase in average accrual brought about by the increase in the cap between the RPI and the CPI (shown by the fact that the solid dark line increases in 2011).
It is also interesting to see how the difference in the mean net pension accrual compares between different workers for different groups, and how this has changed over time. In Figure 6, we show the difference in the mean net pension accrual between public and private sector workers for
Figure 5. Estimated impact of moving to CPI indexation of public sector pensions,
1997−2012
Note: Mean net pension accrual is calculated across all workers, not only those with a pension. The public sector pension accrual under RPI and CPI indexation also includes the effect of introducing an NPA of 65 on new entrants from April 2008. Only includes workers aged 20 to 59. Source: Authors’ calculations using the LFS, BHPS and ASHE.
0%
5%
10%
15%
20%
25%
30%
35%
40%
19
97
19
98
19
99
20
00
20
01
20
02
20
03
20
04
20
05
20
06
20
07
20
08
20
09
20
10
20
11
20
12
Mea
n ne
t pe
nsio
n as
% o
f
earn
ings
Year
RPI indexed pension (inc. NPA 65 for new entrants)
CPI indexed pension (inc. NPA 65 for new entrants)
Introduce CPI indexed pension in June 2010
© Institute for Fiscal Studies, 2014
24
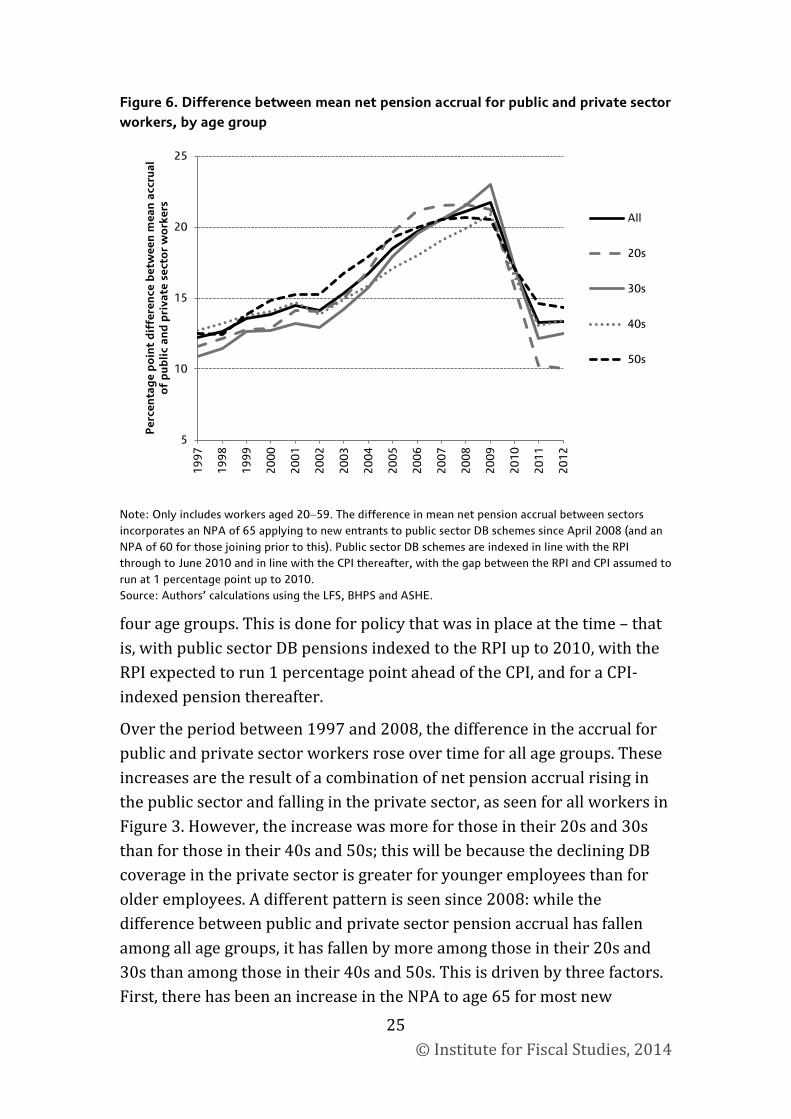
Figure 6. Difference between mean net pension accrual for public and private sector workers, by age group
Note: Only includes workers aged 20−59. The difference in mean net pension accrual between sectors incorporates an NPA of 65 applying to new entrants to public sector DB schemes since April 2008 (and an NPA of 60 for those joining prior to this). Public sector DB schemes are indexed in line with the RPI through to June 2010 and in line with the CPI thereafter, with the gap between the RPI and CPI assumed to run at 1 percentage point up to 2010. Source: Authors’ calculations using the LFS, BHPS and ASHE.
four age groups. This is done for policy that was in place at the time – that is, with public sector DB pensions indexed to the RPI up to 2010, with the RPI expected to run 1 percentage point ahead of the CPI, and for a CPI-indexed pension thereafter.
Over the period between 1997 and 2008, the difference in the accrual for public and private sector workers rose over time for all age groups. These increases are the result of a combination of net pension accrual rising in the public sector and falling in the private sector, as seen for all workers in Figure 3. However, the increase was more for those in their 20s and 30s than for those in their 40s and 50s; this will be because the declining DB coverage in the private sector is greater for younger employees than for older employees. A different pattern is seen since 2008: while the difference between public and private sector pension accrual has fallen among all age groups, it has fallen by more among those in their 20s and 30s than among those in their 40s and 50s. This is driven by three factors. First, there has been an increase in the NPA to age 65 for most new
5
10
15
20
25
19
97
19
98
19
99
20
00
20
01
20
02
20
03
20
04
20
05
20
06
20
07
20
08
20
09
20
10
20
11
20
12
Per
cent
age
po
int
dif
fere
nce
bet
wee
n m
ean
accr
ual
of
pub
lic a
nd p
riva
te s
ecto
r w
ork
ers
All
20s
30s
40s
50s
© Institute for Fiscal Studies, 2014
25
entrants to the public sector from 2007/08 onwards, which affects young people more because new entrants to the public sector are particularly likely to be in their 20s. Second, there has also been falling pension coverage among young workers in the public sector since 2007.34 Third, the impact of the shift from RPI to CPI indexation reduces expected pension accrual among younger workers by more than among older workers because under RPI-indexed pensions younger individuals are able to benefit from the gap between CPI and RPI compounding for more years.
Overall, it is interesting to note that the difference in the mean net pension accrual between the public and private sectors in 2012 is at a similar level – in fact slightly above – what it was in 1997. Within this, the difference seen among those in their 20s has fallen slightly, whereas the difference among those in their 50s has risen slightly.
Finally, it is important to think about how net pension accrual in the public and private sectors is likely to evolve in the future. Looking beyond 2012, the introduction of auto-enrolment, which will progressively affect more private sector employees, is likely to increase the proportion of private sector workers in a pension scheme.35 Offsetting this, at least to some extent, will likely be a continued decline in membership of private sector DB schemes, because most DB schemes are closed to new entrants, and those with a DB pension retire or move jobs.
However, in 2013 and 2014, everything else equal, the increase in the proportion of public sector workers who have joined since 2007/08 will increase the proportion with an NPA of 65, continuing to reduce mean pension accrual across the public sector. It is likely to fall again as the Hutton reforms come into effect. Although these reforms are not significantly less generous than the CPI-indexed pension with an NPA of
34 The proportion of public sector workers in their 20s with an employer-provided pension fell from 80.8% in 2007 to 75.5% in 2012, and this fall was a result of falling DB coverage, which declined from 77.3% in 2007 to 69.4% in 2012.
35 See R. Crawford, C. Emmerson and G. Tetlow, ‘Pensions for the masses’, Institute for Fiscal Studies (IFS) observation, 2012 (http://www.ifs.org.uk/publications/6343) for a discussion of some of the issues with auto-enrolment. It should be noted that one reaction of employers to mandated pension contributions could be to limit pay growth or to cut back on remuneration in some other way. This could mean that, while the introduction of auto-enrolment might increase the average pension accrual for private sector workers, it might have less effect on total remuneration.
© Institute for Fiscal Studies, 2014
26
65, they are less generous than accruals based on an NPA of 60 (and CPI-indexed), which many public sector workers will still have because they joined their scheme before the 2007/08 reforms came into force. (The Hutton reforms apply to future accrual of all workers who are more than 10 years from their NPA, regardless of when they joined the scheme.)
In summary, pension accrual is higher, on average, in the public sector than in the private sector. This reflects the fact that more public sector workers are covered by an employer-provided scheme and because the rules of public sector pension schemes tend to be more generous than those in the private sector (with more public sector workers covered by DB schemes that are typically more generous than DC schemes). The gap between pension accrual levels across the public and private sectors also increased over time between 1997 and 2010 as coverage fell in the private sector and many private sector DB schemes closed to new entrants. Recent reforms have significantly reduced the generosity of public sector schemes, particularly the shift from RPI to CPI indexation and, for new entrants, the increase in the NPA from age 60 to 65. However, public sector pension schemes remain more generous, on average, than those in the private sector, even after these reforms.
5. Incorporating the value of employer pension contributions into public sector pay differentials
We now to turn to estimates of the public sector pay differential once the estimated value of employer-provided pensions is included.36 The first assessment of the impact of making this change is shown in Table 2. The first row shows the raw public sector pay differential for hourly wages. The estimates suggest that, on average, public sector workers are paid 15.1% more per hour than their private sector counterparts. Once controls for age, sex, education, experience and region are included, the estimated public sector pay differential is 4.6%.
36 We ‘include’ the value of employer-provided pensions in remuneration by taking hourly pay and increasing by the amount of the net pension accrual; that is, if an individual has an estimated net pension accrual of 15%, we increase their hourly pay by 15% to account for the remuneration in the form of pensions.
© Institute for Fiscal Studies, 2014
27
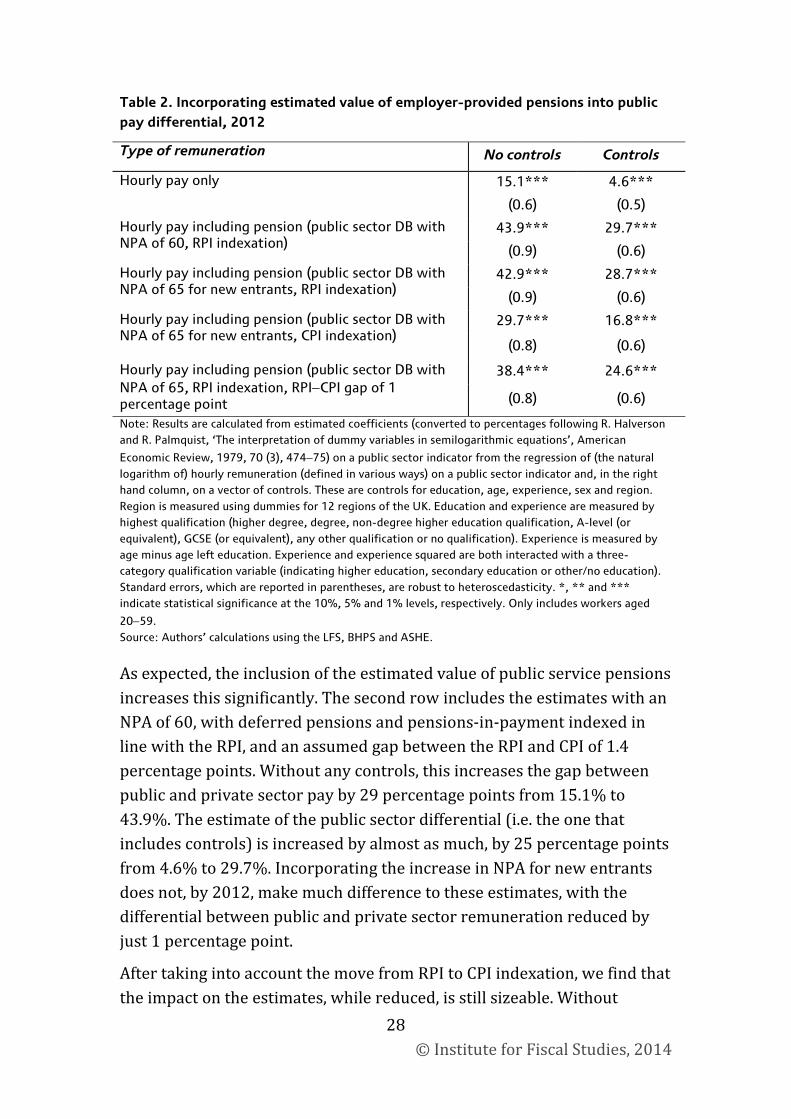
Table 2. Incorporating estimated value of employer-provided pensions into public pay differential, 2012
Type of remuneration No controls Controls
Hourly pay only 15.1*** 4.6***
(0.6) (0.5)
Hourly pay including pension (public sector DB with NPA of 60, RPI indexation)
43.9*** 29.7***
(0.9) (0.6)
Hourly pay including pension (public sector DB with NPA of 65 for new entrants, RPI indexation)
42.9*** 28.7***
(0.9) (0.6)
Hourly pay including pension (public sector DB with NPA of 65 for new entrants, CPI indexation)
29.7*** 16.8***
(0.8) (0.6)
Hourly pay including pension (public sector DB with NPA of 65, RPI indexation, RPI−CPI gap of 1 percentage point
38.4*** 24.6***
(0.8) (0.6)
Note: Results are calculated from estimated coefficients (converted to percentages following R. Halverson and R. Palmquist, ‘The interpretation of dummy variables in semilogarithmic equations’, American
Economic Review, 1979, 70 (3), 474−75) on a public sector indicator from the regression of (the natural logarithm of) hourly remuneration (defined in various ways) on a public sector indicator and, in the right hand column, on a vector of controls. These are controls for education, age, experience, sex and region. Region is measured using dummies for 12 regions of the UK. Education and experience are measured by highest qualification (higher degree, degree, non-degree higher education qualification, A-level (or equivalent), GCSE (or equivalent), any other qualification or no qualification). Experience is measured by age minus age left education. Experience and experience squared are both interacted with a three-category qualification variable (indicating higher education, secondary education or other/no education). Standard errors, which are reported in parentheses, are robust to heteroscedasticity. *, ** and *** indicate statistical significance at the 10%, 5% and 1% levels, respectively. Only includes workers aged
20−59. Source: Authors’ calculations using the LFS, BHPS and ASHE.
As expected, the inclusion of the estimated value of public service pensions increases this significantly. The second row includes the estimates with an NPA of 60, with deferred pensions and pensions-in-payment indexed in line with the RPI, and an assumed gap between the RPI and CPI of 1.4 percentage points. Without any controls, this increases the gap between public and private sector pay by 29 percentage points from 15.1% to 43.9%. The estimate of the public sector differential (i.e. the one that includes controls) is increased by almost as much, by 25 percentage points from 4.6% to 29.7%. Incorporating the increase in NPA for new entrants does not, by 2012, make much difference to these estimates, with the differential between public and private sector remuneration reduced by just 1 percentage point.
After taking into account the move from RPI to CPI indexation, we find that the impact on the estimates, while reduced, is still sizeable. Without
© Institute for Fiscal Studies, 2014 28
controls, adding in the estimated value of employer-provided pensions increases the difference by 15 percentage points (from 15.1% to 29.7%), whereas once some observed background characteristics are controlled for it increases by 12 percentage points (from 4.6% to 16.8%). The final row of Table 2 shows the differential under RPI indexation but with an expected gap between RPI and CPI inflation of 1 percentage point rather than 1.4 percentage points (as might have been anticipated prior to 2010). This shows that one-third of the reduction in the public sector pay differential brought about by the shift from RPI to CPI indexation is an unwinding of the increase in generosity of RPI-indexed schemes brought about by the unexpected 0.4 percentage point increase in the gap between RPI and CPI seen since 2010.
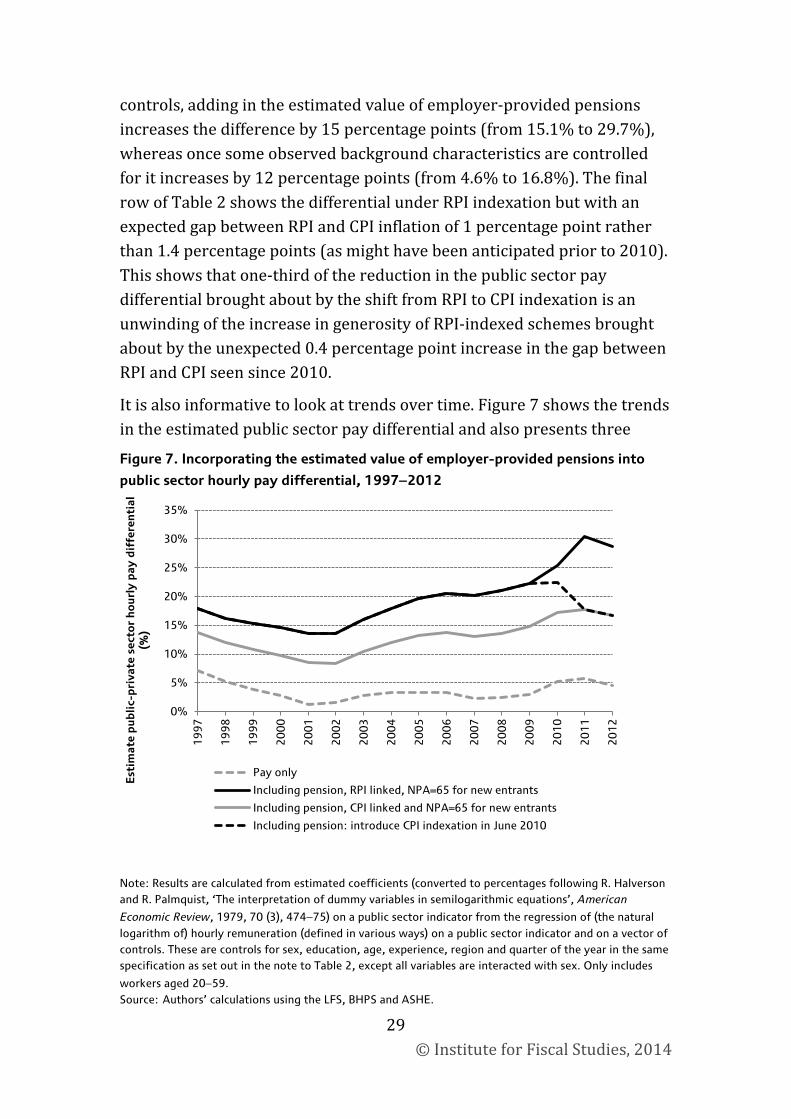
It is also informative to look at trends over time. Figure 7 shows the trends in the estimated public sector pay differential and also presents three
Figure 7. Incorporating the estimated value of employer-provided pensions into
public sector hourly pay differential, 1997−2012
Note: Results are calculated from estimated coefficients (converted to percentages following R. Halverson and R. Palmquist, ‘The interpretation of dummy variables in semilogarithmic equations’, American
Economic Review, 1979, 70 (3), 474−75) on a public sector indicator from the regression of (the natural logarithm of) hourly remuneration (defined in various ways) on a public sector indicator and on a vector of controls. These are controls for sex, education, age, experience, region and quarter of the year in the same specification as set out in the note to Table 2, except all variables are interacted with sex. Only includes
workers aged 20−59. Source: Authors’ calculations using the LFS, BHPS and ASHE.
0%
5%
10%
15%
20%
25%
30%
35%
19
97
19
98
19
99
20
00
20
01
20
02
20
03
20
04
20
05
20
06
20
07
20
08
20
09
20
10
20
11
20
12
Est
imat
e p
ublic
-pri
vate
sec
tor
hour
ly p
ay d
iffe
rent
ial
(%)
Pay only
Including pension, RPI linked, NPA=65 for new entrants
Including pension, CPI linked and NPA=65 for new entrants
Including pension: introduce CPI indexation in June 2010
© Institute for Fiscal Studies, 2014
29
alternatives that include estimates of employer-provided pensions. The solid black line shows that including the estimated value of these pensions, but ignoring the shift from RPI to CPI indexation, leads to a much higher value of the estimated differential throughout the period and one that is growing over time. This latter effect will be a result of the decline in coverage and generosity of employer pension schemes in the private sector offset, and the increase in the gap between RPI and CPI of 0.4 percentage points from 2010, only slightly reduced by the increase in employee contribution rates for public sector workers observed in 2012 and the move to an NPA of 65 for new entrants to public sector DC schemes from 2007/08 onwards.
The dashed black line shows the differential over time, given knowledge of the scheme rules that was available at the time; this assumes that the value of public sector pensions fell in June 2010, when CPI indexation was announced. According this measure, the differential in remuneration has fallen from 22.3% in 2009 to 16.8% in 2012, although it is still above the 13.5% level seen in 2001 and 2002. Finally, the solid grey line shows that, because of CPI indexation, the differential between remuneration in the public and private sectors is now lower than it was previously thought to be. This is because CPI indexation lowers the value of pension rights accrued in previous years.
It is also of interest to see whether the inclusion of the estimated value of employer-provided pensions has a different effect on the public sector differential across different groups. Table 3 splits the data by sex and by age group, and presents both the raw public sector differential and the differential after controlling for observed background characteristics such as age, education, experience and region. The inclusion of employer-provided pensions, with public service schemes being indexed to the RPI rather than the CPI (with a gap between the RPI and CPI of 1.4 percentage points), adds 22.3 percentage points to the estimated (conditional) differential for men (increasing it from –0.4% to 21.9%) and increases it by 25.3 percentage points for women (increasing it from 7.9% to 33.2%). Moving from RPI to CPI indexation is estimated to reduce the (conditional) differential by 11.4 percentage points among men (from 21.9% to 10.5%) and by 12.3 percentage points among women (from 33.2% to 20.9%).
© Institute for Fiscal Studies, 2014
30
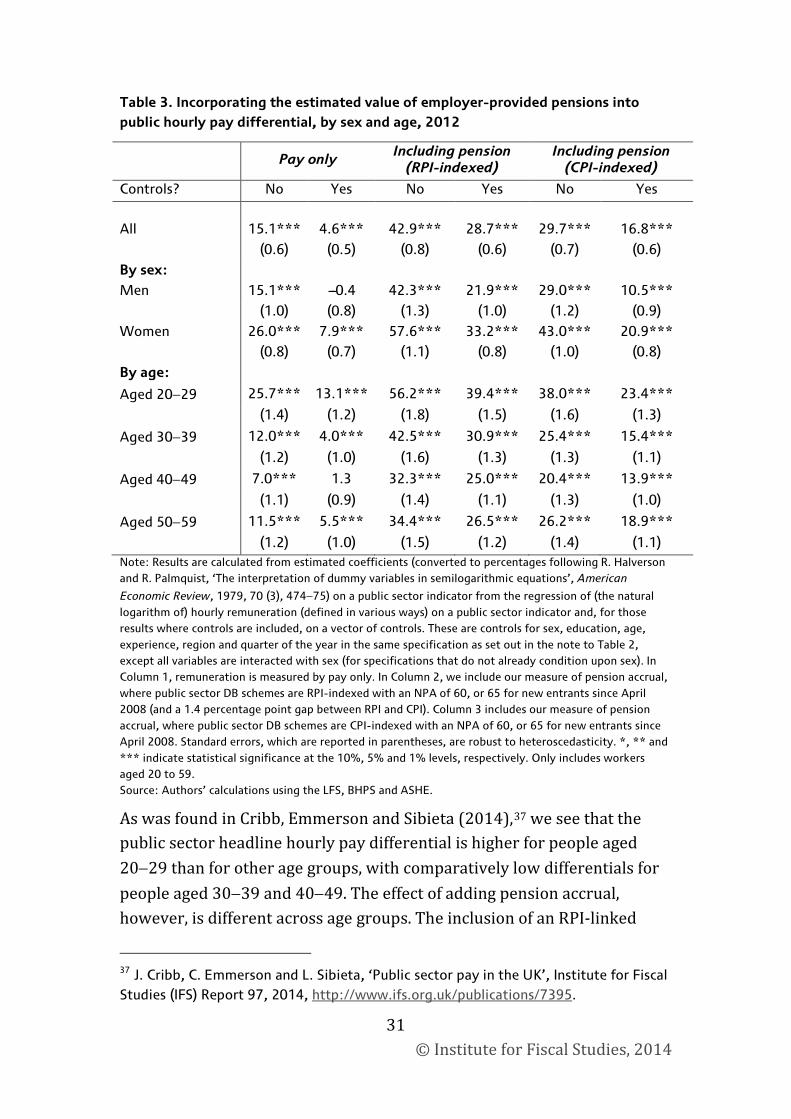
Table 3. Incorporating the estimated value of employer-provided pensions into public hourly pay differential, by sex and age, 2012
Pay only
Including pension (RPI-indexed)
Including pension (CPI-indexed)
Controls? No Yes No Yes No Yes
All 15.1*** 4.6*** 42.9*** 28.7*** 29.7*** 16.8***
(0.6) (0.5) (0.8) (0.6) (0.7) (0.6)
By sex:
Men 15.1*** ---0.4 42.3*** 21.9*** 29.0*** 10.5***
(1.0) (0.8) (1.3) (1.0) (1.2) (0.9)
Women 26.0*** 7.9*** 57.6*** 33.2*** 43.0*** 20.9***
(0.8) (0.7) (1.1) (0.8) (1.0) (0.8)
By age:
Aged 20−29 25.7*** 13.1*** 56.2*** 39.4*** 38.0*** 23.4***
(1.4) (1.2) (1.8) (1.5) (1.6) (1.3)
Aged 30−39 12.0*** 4.0*** 42.5*** 30.9*** 25.4*** 15.4***
(1.2) (1.0) (1.6) (1.3) (1.3) (1.1)
Aged 40−49 7.0*** 1.3 32.3*** 25.0*** 20.4*** 13.9***
(1.1) (0.9) (1.4) (1.1) (1.3) (1.0)
Aged 50−59 11.5*** 5.5*** 34.4*** 26.5*** 26.2*** 18.9***
(1.2) (1.0) (1.5) (1.2) (1.4) (1.1) Note: Results are calculated from estimated coefficients (converted to percentages following R. Halverson and R. Palmquist, ‘The interpretation of dummy variables in semilogarithmic equations’, American
Economic Review, 1979, 70 (3), 474−75) on a public sector indicator from the regression of (the natural logarithm of) hourly remuneration (defined in various ways) on a public sector indicator and, for those results where controls are included, on a vector of controls. These are controls for sex, education, age, experience, region and quarter of the year in the same specification as set out in the note to Table 2, except all variables are interacted with sex (for specifications that do not already condition upon sex). In Column 1, remuneration is measured by pay only. In Column 2, we include our measure of pension accrual, where public sector DB schemes are RPI-indexed with an NPA of 60, or 65 for new entrants since April 2008 (and a 1.4 percentage point gap between RPI and CPI). Column 3 includes our measure of pension accrual, where public sector DB schemes are CPI-indexed with an NPA of 60, or 65 for new entrants since April 2008. Standard errors, which are reported in parentheses, are robust to heteroscedasticity. *, ** and *** indicate statistical significance at the 10%, 5% and 1% levels, respectively. Only includes workers aged 20 to 59. Source: Authors’ calculations using the LFS, BHPS and ASHE.
As was found in Cribb, Emmerson and Sibieta (2014),37 we see that the public sector headline hourly pay differential is higher for people aged 20−29 than for other age groups, with comparatively low differentials for people aged 30−39 and 40−49. The effect of adding pension accrual, however, is different across age groups. The inclusion of an RPI-linked
37 J. Cribb, C. Emmerson and L. Sibieta, ‘Public sector pay in the UK’, Institute for Fiscal Studies (IFS) Report 97, 2014, http://www.ifs.org.uk/publications/7395.
© Institute for Fiscal Studies, 2014
31
pension raises the differential by more for those in their 20s (about 26 percentage points) than it does for those in older age groups. This is because the indexation in line with the RPI (which implies increases of 1.4 percentage points per year above inflation as measured by the CPI) compounds for more years for younger individuals than for older individuals.
Compared with a system with RPI-indexed pensions, the inclusion of CPI-indexed pensions reduces the estimated public pay differential by 16.0 percentage points for people aged 20−29, by 15.5 percentage points for those aged 30−39, by 11.1 percentage points for those aged 40−49 and by 7.6 percentage points for those aged 50−59. Compared to just pay alone, this means that adding CPI-linked pensions increases the differential by slightly more for older age groups than for younger age groups (e.g. by 13.4 percentage points among those in their 50s and by 10.3 percentage points among those in their 20s). This is consistent with the analysis shown in Figure 6, which showed that the difference between mean net pension accrual among public and private sector workers in 2012 was greater for those in their 50s than those in their 20s.
In general, it is relatively unsurprising that shift from RPI to CPI indexation reduces the premium more for younger groups, because they have to wait longer until retirement, and therefore there is a greater effect of the CPI indexation, because the lower rate of indexation compounds over time. However, this analysis leaves out the fact that the move to CPI indexation also reduces the value of previously accrued rights, which will be larger for older people who have longer pension tenures. Thus, the move to CPI indexation will have decreased the pension wealth of older age groups more than that of younger age groups.
The results presented so far in this briefing note are estimated using a nominal discount rate, which is CPI plus 2%. However, we might be interested in the sensitivity of these results to the discount rate and, therefore, in Table A1 in the Appendix, we replicate the analysis shown in Table 3 but instead use a discount rate of CPI plus 3%.
Because the discount rate does not affect our measure of headline pay, the estimated differential for headline pay only does not change. However, comparing the first row of Table 3 with that of Table A1, we see that the estimate of the public pay differential incorporating pensions falls from
© Institute for Fiscal Studies, 2014
32
28.7% (for an RPI-indexed pension) and 16.8% (for a CPI-indexed pension) with a 2% discount rate to 21.5% and 13.1%, respectively, with a 3% discount rate. This is because, with a higher discount rate, pensions are less valuable and, because pay in the form of pensions is more important for public sector workers, this reduces the estimated differential between public and private remuneration.
Moreover, differences in the value of pensions by age will be particularly sensitive to the choice of discount rate: a lower (higher) discount rate would mean that pensions were worth more (less) to younger people compared to older people because they are further from receiving their pension. This logic is confirmed in our results. Whereas the conditional differential incorporating RPI-linked public sector pensions is 39.4% for 20−29 year olds with a 2% discount rate, it is 27.9% with a 3% discount rate, a difference of 11.5 percentage points. For older workers, the effect of the higher discount rate is smaller, with the differential incorporating RPI-indexed pensions rising from 26.5% to 22.4% under a 3% discount rate, a fall of only 4.1 percentage points.
6. Conclusion
This briefing note has estimated the effect of incorporating the value of employer-provided pensions into estimates of the public pay differential. As was previously known − for example, in Crawford, Emmerson and Tetlow (2010) − remuneration in the form of pensions is more important for public sector workers than for private sector workers. Unsurprisingly, combining pay and pensions significantly increases the estimated difference in remuneration between public and private sector workers. However, it is important to acknowledge that there could be further differences between the sectors in the provision of other fringe benefits or non-pecuniary benefits.
This briefing note has therefore focused not only on the levels of pension accrual in the public and private sectors, but also on how these have changed over the last 16 years. We incorporate changing trends in pension coverage in the public and private sectors, how coverage differs across DB and DC pensions, how employee contributions have changed, and how successive reforms to public sector DB pensions implemented by the last Labour government and the current coalition government have affected
© Institute for Fiscal Studies, 2014
33
the value of employer pensions. Moreover, we allow for changes in life expectancy, annuity rates and composition of the workforce, which can affect the estimated generosity of pensions. Even when incorporating the effects of recent reforms, on average, public sector pensions are still more generous than in the private sector and look set to remain so.
From 1997 to 2009, the average net pension accrual in the public sector rose. In contrast, it fell significantly in the private sector, particularly because many private sector DB pensions were closed to new entrants. As a result, the change in the public sector pay differential underestimates the increase in the differential in remuneration over this period. As measured by pay only, the public sector differential fell from 7.1% in 1997, fluctuated between 1% and 4% in the 2000s, reaching 3.1% in 2009. Including (RPI-linked) pensions, the differential rose from 17.9% in 1997 to 22.3% in 2009.
From 2010 onwards, the value of pensions in the public sector has been reduced, primarily because of the decision to CPI-index both deferred pensions and pensions-in-payment. Combined with increases to employee contributions in 2012, this means from 2009 to 2012, the public sector differential including pensions fell from 22.3% to 16.8%, compared to an increase from 3.1% to 4.6% for pay only.
It is, as yet, not fully clear what the effect of some of the more recent reforms will be on the public sector remuneration differential over the next few years. One important influence will be the reforms implemented as a result of Lord Hutton’s review (reducing the future accrual of pensions among those who still have an NPA of 60 but reach their NPA after 2025, but having relatively little change, on average, among those who already have an NPA of 65). In addition, auto-enrolment should lead to an increase in pension membership among private sector employees and will likely lead to an increase in the value of their DC pensions. However, because most private sector DB pension schemes are closed to new entrants, the trend in falling numbers with DB pensions continues.
© Institute for Fiscal Studies, 2014
34
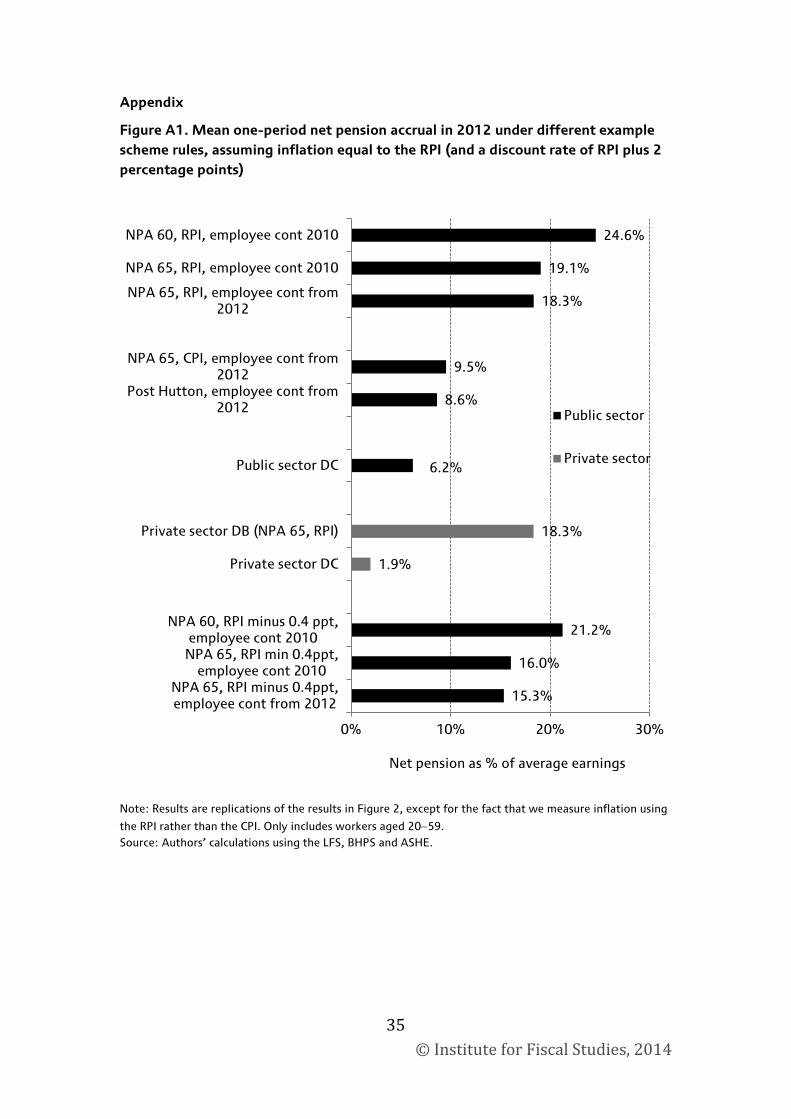
Appendix Figure A1. Mean one-period net pension accrual in 2012 under different example scheme rules, assuming inflation equal to the RPI (and a discount rate of RPI plus 2 percentage points)
Note: Results are replications of the results in Figure 2, except for the fact that we measure inflation using
the RPI rather than the CPI. Only includes workers aged 20−59. Source: Authors’ calculations using the LFS, BHPS and ASHE.
1.9%
18.3%
15.3%
16.0%
21.2%
6.2%
8.6%
9.5%
18.3%
19.1%
24.6%
0% 10% 20% 30%
NPA 65, RPI minus 0.4ppt, employee cont from 2012
NPA 65, RPI min 0.4ppt, employee cont 2010
NPA 60, RPI minus 0.4 ppt, employee cont 2010
Private sector DC
Private sector DB (NPA 65, RPI)
Public sector DC
Post Hutton, employee cont from 2012
NPA 65, CPI, employee cont from 2012
NPA 65, RPI, employee cont from 2012
NPA 65, RPI, employee cont 2010
NPA 60, RPI, employee cont 2010
Net pension as % of average earnings
Public sector
Private sector
© Institute for Fiscal Studies, 2014
35
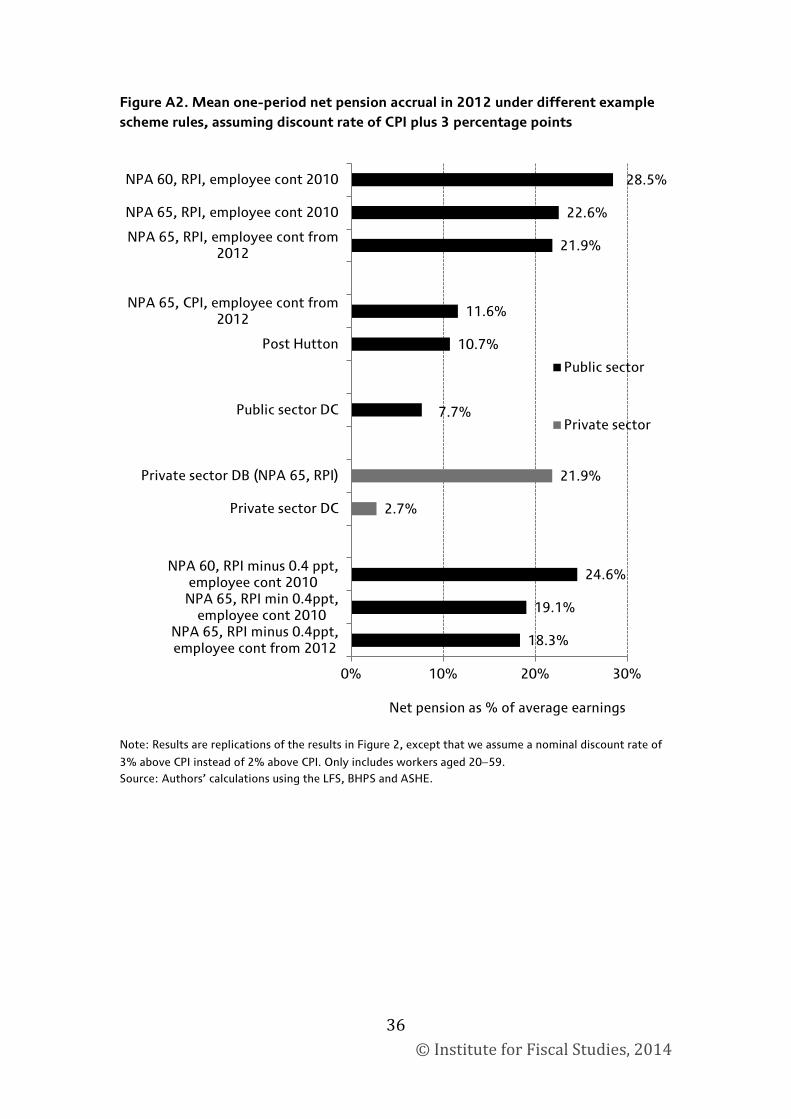
Figure A2. Mean one-period net pension accrual in 2012 under different example scheme rules, assuming discount rate of CPI plus 3 percentage points
Note: Results are replications of the results in Figure 2, except that we assume a nominal discount rate of
3% above CPI instead of 2% above CPI. Only includes workers aged 20−59. Source: Authors’ calculations using the LFS, BHPS and ASHE.
2.7%
21.9%
18.3%
19.1%
24.6%
7.7%
10.7%
11.6%
21.9%
22.6%
28.5%
0% 10% 20% 30%
NPA 65, RPI minus 0.4ppt, employee cont from 2012
NPA 65, RPI min 0.4ppt, employee cont 2010
NPA 60, RPI minus 0.4 ppt, employee cont 2010
Private sector DC
Private sector DB (NPA 65, RPI)
Public sector DC
Post Hutton
NPA 65, CPI, employee cont from 2012
NPA 65, RPI, employee cont from 2012
NPA 65, RPI, employee cont 2010
NPA 60, RPI, employee cont 2010
Net pension as % of average earnings
Public sector
Private sector
© Institute for Fiscal Studies, 2014
36
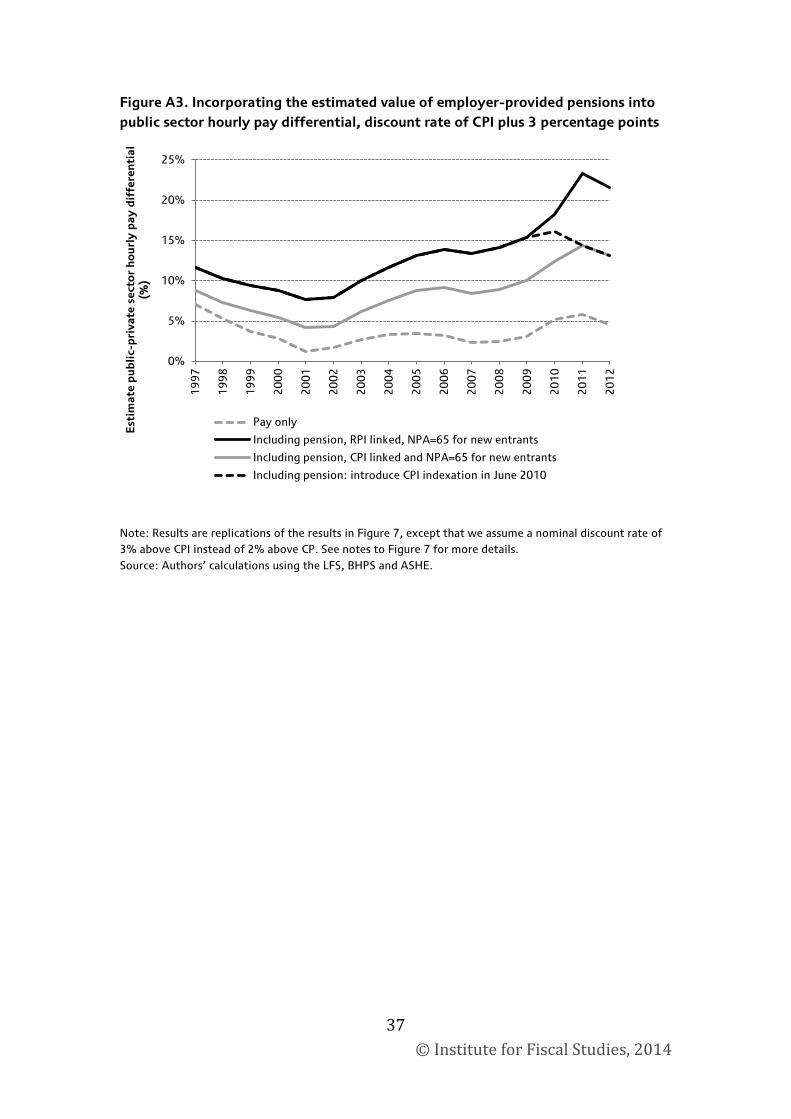
Figure A3. Incorporating the estimated value of employer-provided pensions into public sector hourly pay differential, discount rate of CPI plus 3 percentage points
Note: Results are replications of the results in Figure 7, except that we assume a nominal discount rate of 3% above CPI instead of 2% above CP. See notes to Figure 7 for more details. Source: Authors’ calculations using the LFS, BHPS and ASHE.
0%
5%
10%
15%
20%
25%
19
97
19
98
19
99
20
00
20
01
20
02
20
03
20
04
20
05
20
06
20
07
20
08
20
09
20
10
20
11
20
12
Est
imat
e p
ublic
-pri
vate
sec
tor
hour
ly p
ay d
iffe
rent
ial
(%)
Pay only
Including pension, RPI linked, NPA=65 for new entrants
Including pension, CPI linked and NPA=65 for new entrants
Including pension: introduce CPI indexation in June 2010
© Institute for Fiscal Studies, 2014
37
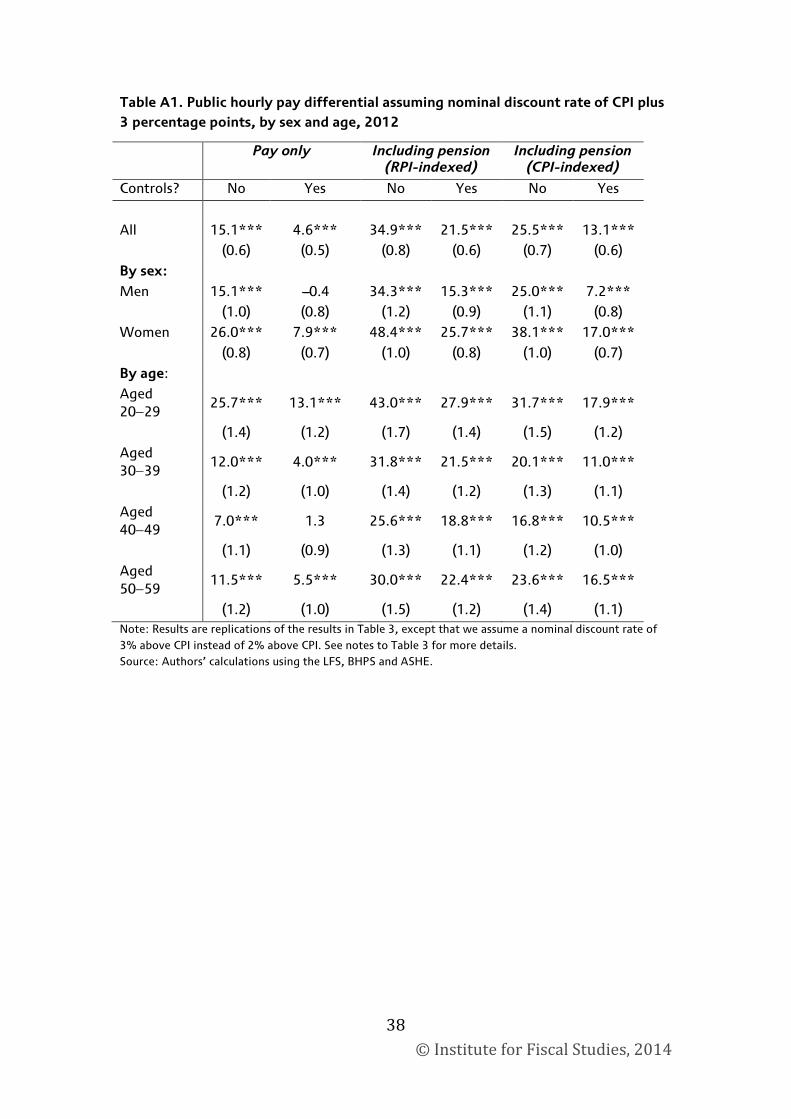
Table A1. Public hourly pay differential assuming nominal discount rate of CPI plus 3 percentage points, by sex and age, 2012
Pay only Including pension (RPI-indexed)
Including pension (CPI-indexed)
Controls? No Yes No Yes No Yes
All 15.1*** 4.6*** 34.9*** 21.5*** 25.5*** 13.1*** (0.6) (0.5) (0.8) (0.6) (0.7) (0.6) By sex:
Men 15.1*** ---0.4 34.3*** 15.3*** 25.0*** 7.2*** (1.0) (0.8) (1.2) (0.9) (1.1) (0.8) Women 26.0*** 7.9*** 48.4*** 25.7*** 38.1*** 17.0*** (0.8) (0.7) (1.0) (0.8) (1.0) (0.7) By age:
Aged 20−29
25.7*** 13.1*** 43.0*** 27.9*** 31.7*** 17.9***
(1.4) (1.2) (1.7) (1.4) (1.5) (1.2) Aged 30−39
12.0*** 4.0*** 31.8*** 21.5*** 20.1*** 11.0***
(1.2) (1.0) (1.4) (1.2) (1.3) (1.1) Aged 40−49
7.0*** 1.3 25.6*** 18.8*** 16.8*** 10.5***
(1.1) (0.9) (1.3) (1.1) (1.2) (1.0) Aged 50−59
11.5*** 5.5*** 30.0*** 22.4*** 23.6*** 16.5***
(1.2) (1.0) (1.5) (1.2) (1.4) (1.1) Note: Results are replications of the results in Table 3, except that we assume a nominal discount rate of 3% above CPI instead of 2% above CPI. See notes to Table 3 for more details. Source: Authors’ calculations using the LFS, BHPS and ASHE.
© Institute for Fiscal Studies, 2014
38