Work/life balance and trade unions - TUC WERS WLB new format... · 1 Work/life balance and trade...
27
1 Work/life balance and trade unions Evidence from the Workplace Employment Relations Survey 2011
-
Upload
truongnhan -
Category
Documents
-
view
221 -
download
2
Transcript of Work/life balance and trade unions - TUC WERS WLB new format... · 1 Work/life balance and trade...

1
Work/life balance and trade unions
Evidence from the Workplace Employment Relations Survey 2011

2
THE AUTHORS
Alex Bryson is Professor of Quantitative Social Sciences at the Institute of Education, University College London.
John Forth is a Fellow at the National Institute of Economic and Social Research.
We are grateful to the Trades Union Congress who funded this work.
DISCLAIMER
The views in this report are the authors’ own and do not necessarily reflect those of the Trades Union Congress.
© Trades Union Congress
Congress House, Great Russell Street, London WC1B 3LS 020 7636 4030 www.tuc.org.uk
For more copies call 020 7467 1294 or email [email protected]
Please ask if you need an accessible format.
Cover image by Jess Hurd/reportdigital.co.uk
3
Contents
Introduction .................................................................................................................................. 4
Data and methodology .................................................................................................................. 6
Union effects on what employers do and what they think ........................................................ 10
Union effects on employee perceptions of work/life balance .................................................... 13
Work/life balance summary and conclusions ............................................................................. 18
Bibliography ................................................................................................................................ 19

4
Section 1
Introduction
To inform debate following the passage of the 2016 Trade Union Act the TUC commissioned UCL/NIESR to undertake a three-pronged investigation into the nature of unions and their effects on employers and employees:
a review of existing literature on union effects
new analyses of the Workplace Employment Relations Surveys (WERS) on issues such as wages, training and workplace performance
a more detailed investigation of the links between unionisation and work/life balance (WLB).
This report focuses on the third element, a detailed investigation of the links between unionisation and WLB based on new analyses of the 2011 WERS.
The prior review of existing evidence (Bryson and Forth, 2016) focused on quantitative research for Britain. It found that in the late 1990s unionised workplaces had higher levels of provision of family-friendly practices – notably parental leave, paid family leave, child-care and job sharing – compared with “like” workplaces without unions (Budd and Mumford, 2004; Dex and Smith, 2002). Provision of parental and paid family leave rose with union density, suggesting the presence of these policies reflected union bargaining power. Unions also increased employee awareness of such practices through information provision, thus facilitating their use. However, the options to work at home or have flexible working hours were less common in a union setting, perhaps reflecting what some view as union concerns about employer-led flexible working and the challenge it can pose to collective rights (Gregory and Milner, 2009). Qualitative research has shed light on factors increasing union effectiveness on work/life balance issues, such as the importance of female union reps (Rigby and O’Brien-Smith, 2010). However, most of the quantitative research is now dated and precedes substantial legislative changes, including the introduction of a statutory right to request flexible working arrangements in 2002.
Despite these legislative changes, preliminary analyses of the 2011 WERS indicated that the percentage of employers who agreed that "it is up to individual employees to balance work and family responsibilities" rose significantly between 2004 and 2011 and there was no consistent pattern in the changing availability of flexible working arrangements between 2004 and 2011 (Van Wanrooy et al., 2013a: 32-33). Our focus is on the relationship between unionisation and WLB in 2011.
In examining links between WLB and unionisation we focus on a summary measure of union strength which combines union recognition, high union density and the presence of an on-site union representative. We have sought to isolate the independent effect of unions on different measures of WLB through multivariate regression analysis, using a common set of control variables. This allows the reader to compare union effects across different outcomes.

5
In Section Two we outline the data and methodology used in the analysis. In Section Three we present analyses of employer data showing the incidence of WLB practices across workplaces and its association with unionisation, and employer attitudes to WLB issues and how these are related to unionisation. Section Four switches to employee-level analyses: here we first present descriptive analyses on the percentage of employees with caring responsibilities in Britain, together with their attitudes towards WLB and their perceptions of employer attitudes to WLB; we then move on to multivariate analyses of the links between unionisation and WLB as perceived by employees before concluding with an assessment of the links between job-related anxiety, WLB and unionisation.
We cannot claim that our results definitively capture the causal effects of unionisation. Instead, we present point-in-time comparisons between union and non-union workers (or their workplaces), with account taken of the differences between them on other observable characteristics. Nevertheless, this is the standard approach adopted in much of the literature and, since we also know a great deal about the factors that influence unionisation in Britain, we can make reasonable inferences about unions' effects on WLB outcomes.

6
Section 2
Data and methodology
The Workplace Employment Relations Surveys 2011
We analyse linked employer-employee data from the Workplace Employment Relations Surveys (WERS) for 2011. Appropriately weighted, the data are nationally representative of workplaces in Britain with 5 or more employees, covering all sectors of the economy except agriculture and mining (Van Wanrooy et al., 2013).
The analysis exploits two elements of the survey. The first is the management interview, conducted face-to-face with the most senior workplace manager responsible for employee relations. Interviews for the 2011 survey were conducted in 2,680 workplaces between March 2011 and June 2012 with a response rate of 46 per cent.
The second element is the survey of employees, distributed in workplaces where a management interview was obtained. In 2011 self-completion questionnaires were distributed to a simple random sample of 25 employees (or all employees in workplaces with 5-24 employees) in the 2,170 workplaces (81 per cent) where management permitted it. Of the 40,513 questionnaires distributed, 21,981 (54 per cent) usable ones were returned. Weights are provided with the survey data to correct for the sample design and any observable non-response biases.
7
Methodology
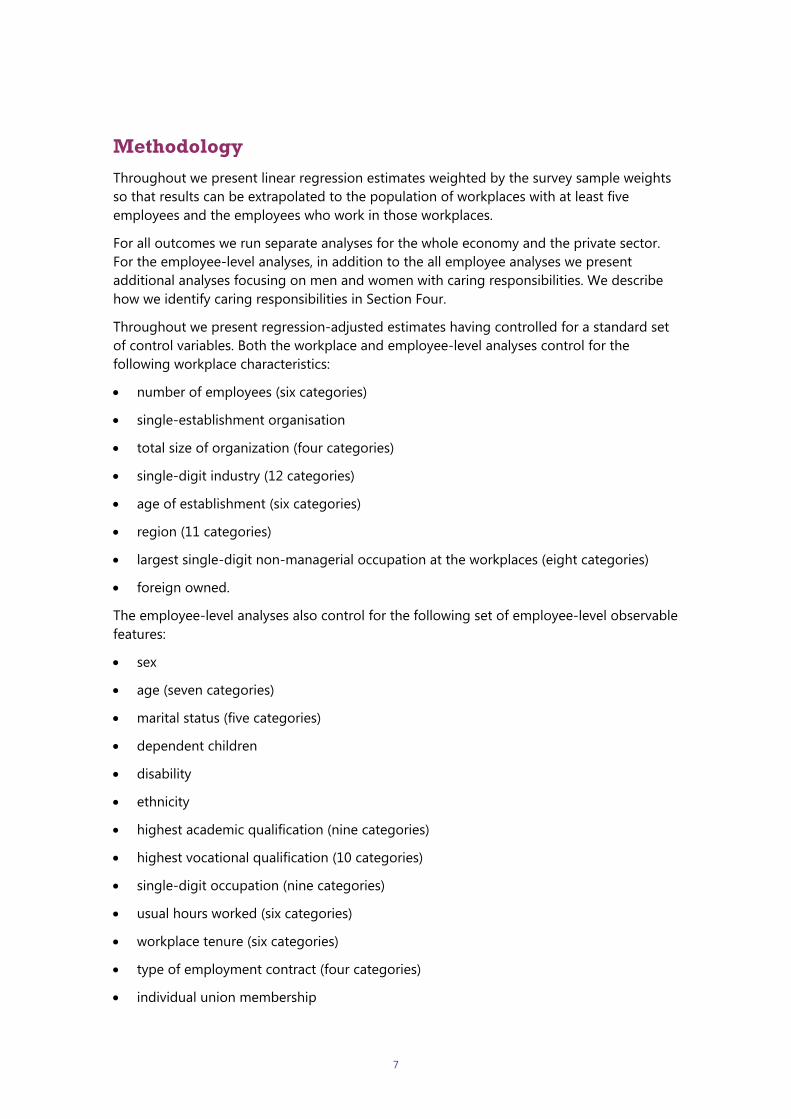
Throughout we present linear regression estimates weighted by the survey sample weights so that results can be extrapolated to the population of workplaces with at least five employees and the employees who work in those workplaces.
For all outcomes we run separate analyses for the whole economy and the private sector. For the employee-level analyses, in addition to the all employee analyses we present additional analyses focusing on men and women with caring responsibilities. We describe how we identify caring responsibilities in Section Four.
Throughout we present regression-adjusted estimates having controlled for a standard set of control variables. Both the workplace and employee-level analyses control for the following workplace characteristics:
number of employees (six categories)
single-establishment organisation
total size of organization (four categories)
single-digit industry (12 categories)
age of establishment (six categories)
region (11 categories)
largest single-digit non-managerial occupation at the workplaces (eight categories)
foreign owned.
The employee-level analyses also control for the following set of employee-level observable features:
sex
age (seven categories)
marital status (five categories)
dependent children
disability
ethnicity
highest academic qualification (nine categories)
highest vocational qualification (10 categories)
single-digit occupation (nine categories)
usual hours worked (six categories)
workplace tenure (six categories)
type of employment contract (four categories)
individual union membership

8
Our union variables are presented in Table 2.1. Columns 1 and 3 present the incidence of unionisation at employee level in the private sector and whole economy respectively, while columns 2 and 4 present the same information at workplace-level.
See table 2.1 in appendix A.
The first row shows the percentage of workplaces recognising at least one trade union for pay bargaining. Across the economy just over one-fifth (22 per cent) of workplaces recognised a union, compared to only 12 per cent in the private sector. Because it tends to be larger workplaces that recognise trade unions, employee coverage is higher than workplace coverage: half (51 per cent) of employees work in a workplace with at least one recognised trade union, but this falls to around one-third (35 per cent) in the private sector.
Around four-fifths of workplaces had no union members in the whole economy, a figure that rises to nearly nine-tenths (86 per cent) in the private sector. Only one-tenth (10 per cent) of workplaces are heavily unionised (50 per cent+ density) but they account for around one-quarter (24 per cent) of employees. These figures are much lower in the private sector (3 per cent of workplaces and 13 per cent of employees).
Only a small minority of workplaces in Britain have a recognised union with an on-site union representative: 7 per cent in the whole economy and 3 per cent in the private sector. However, because union representatives tend to be present in larger workplaces four-in-ten employees work in these workplaces in the whole economy, as do over one-quarter (28 per cent) of employees in the private sector.
The measure of unionisation we tend to focus on when presenting the multivariate results is the count measure of union strength ranging from 0 (no union presence) to 6 where workplaces score a point for:
having a recognised union
having an on-site union lay representative
union density of at least 25 per cent
union density of at least 50 per cent
union density of at least 75 per cent
union density of 100 per cent.
The mean workplace score on this (0,6) summary index is 0.57 in the whole economy, but it is half this (0.25) in the private sector. But it is noteworthy that, even at the 75th percentile in the workplace distribution of this variable the union strength score was zero. Although the median score for union strength among employees was zero, those at the 75th percentile in the distribution were exposed to unions scoring 3 on the index (2 in the private sector).
The final union measure presented at the bottom of the table is individual union membership taken from the employee survey: it is 30 per cent across the whole economy and 19 per cent in the private sector.
9
Outcome variables are discussed when we present the results in Sections Three and Four.
The tables that follow focus on the key variables of interest. For the management analyses, we present separate models where we first use a basic indicator of the presence of recognised unions and, second, use our count variable of union strength. Different specifications show raw correlations and then the regression-adjusted associations after adding controls. In the employee analyses we show the results for the union strength variable with a full set of workplace and employee controls. Subsequent specifications add the employer attitude to WLB and the WLB count variable which is first presented in Section Three. Full models are available from the authors on request.
The statistical significance of any union effect is indicated with asterisks as noted in the footnotes to the tables. Since the models are Ordinary Least Squares (OLS), model coefficients can be interpreted as indicating the absolute difference in the dependent variable when comparing across categories of the union indicator. In the bottom row of each table is the number of unweighted observations appearing in the model.

10
Section 3
Union effects on what employers do and what they think
Introduction
Unions may affect employees' WLB through their effects on what employers do and what they think. To test this we investigate the associations between unionisation and two outcomes, namely the number of WLB practices available to employees at a workplace and the HR Manager's attitudes towards employer and employee responsibilities in achieving a work/life balance.
The number of WLB practices at the workplace
There are a number of practices employers may wish to use which might improve WLB for employees, even if they are not primarily intended for that purpose. WERS identifies fifteen such practices, namely:
working at or from home in normal working hours
flexi-time (where an employee has no set start or finish time but an agreement to work a set number of hours per week or per month
job sharing schemes (sharing a full-time job with another employee)
the ability to reduce working hours (e.g. switching from full-time to part-time employment)
compressed hours (i.e. working standard hours across fewer days)
ability to change set working hours (including changing shift pattern)
working only during school term times
workplace nursery or nursery linked with workplace
financial help with child care (e.g. childcare vouchers, loans, repayable contributions to fees for childcare outside the workplace, subsidised places not located at the workplace)
financial help with the care of older adults
a specific period of leave for carers of older adults (in addition to time off for emergencies)
a specific period of paid parental leave (in addition to maternity or paternity leave, and time off for emergencies)
maternity pay above statutory minimum

11
paternity pay above statutory minimum
paid emergency care leave.
Figure 3.1 shows the number of WLB practices present in British workplaces in 2011 based on a count measure summing the total number of the 15 practices available at the workplace. The dotted line shows the distribution across workplaces in the whole economy, while the sold line represents the distribution across workplaces in the private sector.
See figures 3.1 and 3.2 in appendix A.
Most workplaces have some WLB practices but do not score highly on the count measure: in the whole economy the modal score is 4 and the median is 3. Only about 3 percent of workplaces scored 10 or more on the WLB count. The number of WLB practices is marginally lower in the private sector than in the economy as a whole. The mean scores are 3.1 and 3.5 respectively.
See table 3.1 in appendix A.
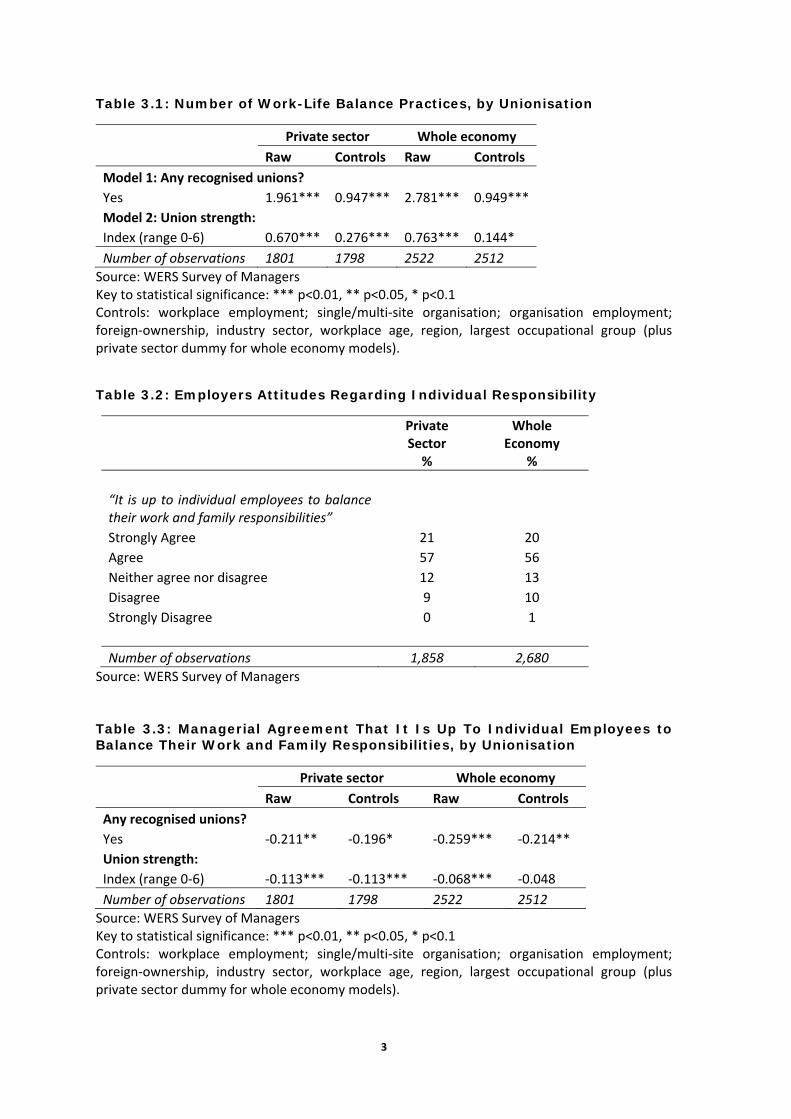
The number of WLB practices is higher in the presence of a union: the mean number is twice as high where a union recognises a trade union for bargaining purposes (Figure 3.2). In the whole economy workplaces with a recognised trade union have 2.8 more WLB practices than non-unionised workplaces. In the private sector they have 2.0 more WLB practices (Table 3.1). However, these differentials shrink when controlling for factors such as workplace size which are positively correlated with both unionisation and the number of WLB practices. After controlling for other workplace characteristics, workplaces with recognised unions have, on average, 1 more WLB practice (out of a possible 15) than workplaces without recognised unions. This is the case in both the whole economy and the private sector. The strength of unionisation also matters. When we replace the recognition indicator with our measure of union strength, we find that every one-point increase on the (0, 6) union strength scale is associated with an increase of about 0.7 WLB practices. Again, the effect weakens having controlled for other workplace characteristics, but it remains statistically significant. In the private sector an increase of 1 point in the union strength index is associated with an extra 0.28 of a WLB practice after controlling for other factors. So a shift from zero to four on the union strength index would result in one extra WLB practice on our count of 15 practices.
Employer attitudes regarding WLB
Managers were asked how much they agreed to the statement, "It is up to individual employees to balance their work and family responsibilities". Around one-fifth "strongly agreed" with the statement, and roughly three-quarters either "strongly agreed" or "agreed" (Table 3.2). Only around one-in-ten disagreed. Managerial attitudes were broadly similar in the whole economy and the private sector.

12
See table 3.2 in appendix A.
In both the whole economy and the private sector managers in unionised workplaces were significantly less likely to think it was up to individual employees to balance their work and family responsibilities than managers in non-unionised workplaces (Table 3.3). This difference persists and remains statistically significant when comparing observationally-equivalent workplaces. In the private sector, union strength lowers the likelihood than a manager agrees with the statement but in the whole economy the significance of the effect disappears having controlled for other features of the workplace.
See table 3.3 in appendix A.
In summary, then, we find that unionised workplaces have greater levels of provision of WLB practices. Managers in unionised workplaces are also less likely to feel that it is their employees’ responsibility to balance their work and non-work commitments.
13
Section 4
Union effects on employee perceptions of work/life balance
Introduction
In this section we investigate the association between unionisation and five aspects of WLB as measured from the point of view of employees:
long hours working
the perception of a long-hours culture
the belief that the job affects life outside of work
beliefs about how understanding managers are about employees' responsibilities outside of work
feelings of job-related anxiety.
We present analyses for the whole economy and the private sector separately. In each case we run separate analyses for three groups, namely all employees, women with caring responsibilities and men with caring responsibilities, on the assumption that those most likely to have difficulties balancing work and non-work commitments are those with caring responsibilities. However, when we examine the role of caring for job-related anxiety we run models for men and women separately, then men and women together, conditioning on their caring responsibilities. This approach is merited in the analyses of job-related anxiety because the distinction between having dependent children, on the one hand, and actual hours spent caring for the elderly or sick, proves to be important.
Employees are identified as having caring responsibilities if they have any dependent children or if they say "yes" in response to the question: "Do you look after or give help or support to any family members or friends who have a long-term physical or mental illness or disability, or who have problems related to old age?" In the whole economy, almost half (47 per cent) of employees had caring responsibilities: the figure was 47 per cent among male employees and 46 per cent among females. In the private sector, the percentage of employees with caring responsibilities was slightly lower overall (44 per cent), primarily due to a lower incidence of caring responsibilities among female employees (42 per cent, compared with 46 per cent among men). Overall, 23 per cent of all employees were men with caring responsibilities and 24 per cent were women with caring responsibilities (25 per cent and 20 per cent respectively within the private sector).
Union members were more likely to have caring responsibilities than non-members, and this was true in the whole economy (where 53 per cent of union members had caring responsibilities, compared with 44 per cent of non-members) and in the private sector (where the figures were 51 per cent and 43 per cent).

14
The first four tables presented below follow a similar format. There are 12 models presented in each table. Of the first six, three are for the whole economy and three are for the private sector. For both sectors models are run for three groups: female employees with caring responsibilities; male employees with caring responsibilities; and all employees (males and females, with and without caring responsibilities). These first six models include the standard set of control variables listed under the table. The second six models on the right-hand side of each table are identical, except that they also incorporate the count measure for the number of WLB practices at the workplace and managers' attitudes towards WLB. The tables on job-related anxiety follow a slightly different format, as discussed in Section 4.5
Long-hours working
Asked "how many hours do you usually work in your job each week, including overtime or extra hours (excluding meal breaks and time taken to travel to work)?" one-in-ten (11 per cent) of employees said more than 48 hours. But long-hours working was more prevalent among men with caring responsibilities (19 per cent) than among women with caring responsibilities (5 per cent). Long-hours working was a little more common in the private sector where 13 per cent of employees usually worked more than 48 hours (21 per cent among men with caring responsibilities, but only 4 per cent among women with caring responsibilities).
See table 4.1 in appendix A
The probability that an employee usually works more than 48 hours per week falls with union strength (Table 4.1, row 1). This is the case for all employees and those with caring responsibilities, and in the whole economy and the private sector. Although the effect is statistically significant for both men and women with care responsibilities, it is weaker for women.
The probability of long hours working falls with the number of WLB practices at the workplace (Table 4.1, columns 6-12). This association is apparent in the whole economy and the private sector, for all employees and for men with caring responsibilities. It is only apparent for women with caring responsibilities in the whole economy, not the private sector.
Employees were asked whether they agreed or disagreed with the statement "People in this workplace who want to progress usually have to put in long hours". Four-in-ten (41 per cent) of employees in the whole economy either "agreed" or "strongly agreed" with the statement. But the percentage agreeing or strongly agreeing was higher among men with caring responsibilities than it was among women with caring responsibilities (45 per cent compared with 38 per cent). The situation was very similar in the private sector.
See table 4.2 in appendix A.
Union strength is associated with a lower likelihood of being exposed to a long-hours culture. This is the case in the whole economy, the private sector, among all employees and among carers, whether they are men or women.

15
Although there is some evidence that workplaces with more WLB practices are less likely to have a long-hours culture, this was only statistically significant for all employees in the whole economy (Table 4.2 column 12).
Does the job affect life outside work?
To see whether the demands of the job affect employees' life outside of work employees were asked how much they agreed with the statement "I often find it difficult to fulfil non-work commitments because of the time I spend on my job". Just over one-quarter (27 per cent) of employees in the whole economy "agreed" or "strongly agreed" with the statement. But the percentage agreeing or strongly agreeing was higher among men with caring responsibilities than it was among women with caring responsibilities (34 per cent compared with 25 per cent). The figures were nearly identical in the private sector.
See table 4.3 in appendix A.
In general, union strength is not associated with employees' perceptions of whether their job affects their life outside work. The exception is in relation to all employees in the whole economy where union strength is negatively associated with perceptions of the job affecting life outside work for all employees in the whole economy (Table 4.3, column 6). This result should be treated with caution because it is the only statistically significant association with union strength in the twelve models presented and is only statistically significant at a 10 per cent confidence level.
The number of WLB practices available at the workplace is associated with a lower likelihood that employees think their job affects life outside work. However, this effect is not apparent for women with caring responsibilities.
Are managers understanding about employees' non-work responsibilities?
Employees are asked how much they agree or disagree with the statement: "Managers here understand about employees having to meet responsibilities outside work". Around six-in-ten (62 per cent) "agreed" or "strongly agreed" that they were understanding whereas 16 per cent disagreed. Caring responsibilities made little difference to employee perceptions of managerial understanding. In the private sector 61 per cent of men with caring responsibilities "agreed" or "strongly agreed" with the statement as did 60 per cent of men without responsibilities. Among women the figures were 68 per cent and 65 per cent respectively.
See table 4.4 in appendix A.

16
Job-related anxiety and work/life balance
Difficulties balancing work and family life can create stress and anxiety. WLB practices and effective trade unionism may be able to alleviate such feelings by helping employees to manage potentially conflicting responsibilities. The negative association between the number of WLB practices at the workplace and employee perceptions that their job affects life outside of work (see Table 4.3) is consistent with this proposition. But we can test this proposition more directly by looking at the independent association between caring responsibilities and job-related anxiety, and whether WLB practices are linked to lower anxiety.
To investigate factors associated with job-related anxiety we use employee responses to the following question: “Thinking of the past few weeks how much of the time has your job made you feel each of the following: tense, calm, relaxed, worried, uneasy, content?” Responses are coded on a 5-point scale: “all of the time”, “most of the time”, “some of the time”, “occasionally”, “never”. These measures have their origins in Warr’s (2007: 19-49) anxiety-contentment axis. Warr distinguishes between the two ends of this axis along the two dimensions of pleasure and mental arousal. Anxiety, as measured by feeling tense, worried or uneasy, is associated with negative psychological affect but entails a high level of arousal. Contentment, on the other hand, as measured by feeling calm, contented or relaxed, is associated with positive affect and entails low levels of arousal. Following Wood (2008) we combine the six items into a single scale. The single summative job-related anxiety score rescales the five-point scores for each measure into (-2, 2) scales where ‘-2’ is “never” and ‘2’ is “all of the time” having reverse-coded the positive affect items such that higher scores indicate higher job anxiety. The scale thus runs from (-12, 12).
See table 4.5 in appendix A.
Controls: Employee level: gender, age, marital status, disability, white ethnicity, highest academic qualification, highest vocational qualification, occupation, hours, tenure, contract type, individual union membership. Workplace level: workplace employment; single/multi-site organisation; organisation employment; foreign-ownership, industry sector, workplace age, region, largest occupational group. Models containing the WLB practices also include a control for manager’s view of individual responsibility for work/life balance. The whole economy models contain a private sector dummy.
Table 4.5 presents twelve models estimating the associations between job-related anxiety, caring responsibilities, WLB practices and unionisation. The first six models are run on employees in workplaces with recognised unions (columns 1-6), while the second six (columns 7-12) are identical but are run solely on employees in workplaces without a recognised union. In both the union and non-union sectors we run separate models for the whole economy and the private sector, and for men and women separately as well as together.
Employees’ job-related anxiety falls with the number of dependent children they have. These effects are more pronounced in the non-union sector and in both the union and non-union sectors the association is only statistically significant in the case of women (Table 4.5 row 1). One possible explanation for this finding is that paid work offers respite from the stress and anxiety parents face at home when responsible for dependent children.

17
Alternatively, it may be that women with two or more children are employed in less stressful jobs.
In contrast, time spent caring for the sick, disabled or elderly is associated with higher levels of job-related anxiety (Table 4.5 row 2). In the non-union sector this association is apparent in the private sector and the whole economy, and for men and women. In the union sector, on the other hand, the association is only apparent among men, suggesting unionisation may ameliorate the anxiety women feel when trying to combine responsibilities at work with onerous caring responsibilities at home. Union strength has little bearing on job-related anxiety among workplaces where unions are absent or lack union recognition. However, it is associated with reduced anxiety in unionised workplaces in the private sector, particularly among women. This finding is consistent with other research suggesting unions can ameliorate feelings of job-related anxiety (Bryson et al., 2013).
The number of WLB practices at the workplaces is associated with lower job-related anxiety, but the effect is only statistically significant in unionised workplaces and is driven by men. There is no significant association between the number of WLB practices and reduced anxiety in the non-union sector. One possible interpretation of these results is that unionisation improves the effectiveness of WLB practices in combating employees’ job stress and anxiety.
18
Section 5
Work/life balance summary and conclusions
This study updates and extends research on the links between unionisation and WLB in Britain. We have six major findings.
First, unionisation is positively associated with the number of WLB practices at the workplace and with more progressive employer views regarding WLB.
Second, union strength is associated with a lower likelihood of employees working long hours and perceiving a long-hours culture.
Third, the probability of long hours working falls with the number of WLB practices at the workplace.
Fourth employee perceptions of whether their job affects life outside work are not directly associated with union strength, but the number of WLB practices at the workplace does reduce the degree to which the job affects life outside work.
Fifth, even though union strength is positively associated with employers’ recognition of their responsibilities for WLB it was not associated with employee perceptions of whether managers were understanding about non-work responsibilities. However, the number of WLB practices at the workplace was positively associated with employee perceptions of how understanding managers were regarding non-work responsibilities, suggesting employees attach more credence to what employers do than what they say.
Sixth, union recognition plays an important role in the degree to which employee’s express job-related anxiety. Union strength is associated with lower anxiety among women in the private sector, independently of their care responsibilities. WLB practices are only linked to lower anxiety in unionised workplaces. And caring for the ill, disabled or aged is much more strongly linked to higher job-related anxiety in the non-union sector than the union sector – in the union sector the association disappears in the case of women.
Taken together these findings suggest an important role for both unions and WLB practices in assisting employees balance work and non-work commitments

19
Section 6
Bibliography
Bell, A. and Bryson, C. (2005) "Work-life balance - still a 'women's issue'?", in Park, A., Curtice, J., Thomson, K., Bromley, C., Phillips, M. and Johnson, M. (eds.) British Social Attitudes: The 22nd Report. Two terms of Labour: the public's reaction
Bryson, A., Dale-Olsen, H. and Barth, E. (2013) 'The Effects of Organizational Change on Worker Wellbeing and the Moderating Role of Trade Unions', Industrial and Labor Relations Review, 66, 4: 989-1011
Bryson, A. and Forth, J. (2016) The Added Value from Trade Unions: A Review of Existing Research, TUC
Budd J and Mumford K (2004) “Trade unions and family-friendly policies in Britain”, Industrial and Labor Relations Review, 53: 204-22.
Dex, S. and Smith, C. (2002) The nature and pattern of family friendly employment policies in Britain, The Policy Press
Gregory, A. and Milner, S. (2009) “Trade Unions and Work-life Balance: Changing Time in France and the UK?”, British Journal of Industrial Relations, 47, 1: 122-146
Rigby, M. and O'Brien-Smith, F. (2010) “Trade union interventions in work-life balance”, Work, Employment and Society, 24, 2: 203-220
van Wanrooy, B., Bewley, H., Bryson, A., Forth, J., Freeth, S., Stokes, L. and Wood, S. (2013a) The 2011 Workplace Employment Relations Study First Findings, ESRC/ACAS/NIESR/DBIS
van Wanrooy, B., Bewley, H., Bryson, A., Forth, J., Freeth, S., Stokes, L. and Wood, S. (2013b) Employment Relations in the Shadow of Recession: Findings from the 2011 Workplace Employment Relations Study, Palgrave MacMillan.
Warr, P. (2007), Work, Happiness, and Unhappiness, Mahwah: New Jersey.
Wood, S. (2008), “Job characteristics, employee voice and wellbeing in Britain”, Industrial Relations Journal, 39: 2, 153-168

1
Table 2.1: Union membership and organisation in Britain, 2011
Cell percentages Private sector Whole economy Employees Workplaces Employees Workplaces Workplace has recognised unions
35 12 51 22
Workplace union density:
Zero 60 86 47 78 1-49% 27 11 30 13 50-100% 13 3 24 10 Workplace union rep: No recognition 65 88 49 78 Recognition without on-site rep
7 9 11 15
Recognition + on-site rep
28 3 40 7
Union strength index (range 0-6):
Mean 1.03 0.25 1.58 0.57 Median 0 0 0 0 75th percentile 2 0 3 0 Union Member 19 - 30 - Number of observations (minimum)
13,094 1,801 20,481 2,522
Source: WERS Survey of Managers Base: Workplaces with 5 or more employees

2
Figure 3.1: Number of Work-Life Balance Practices
Source: WERS Survey of Managers Figure 3.2: Number of Work-Life Balance Practices in Unionised and Non-unionised Workplaces, Whole Economy
0.0
5.1
.15
Pro
por
tion
of w
orkp
lace
s
0 5 10 15Number of practices
Private sector (mean=3.1)Whole economy (mean=3.5)
0.0
5.1
.15
Pro
por
tion
of w
orkp
lace
s
0 5 10 15Number of practices
Union recognised (mean=5.7)Non-union (mean=2.9)
3
Table 3.1: Number of Work-Life Balance Practices, by Unionisation
Private sector Whole economy
Raw Controls Raw Controls
Model 1: Any recognised unions?
Yes 1.961*** 0.947*** 2.781*** 0.949***
Model 2: Union strength:
Index (range 0‐6) 0.670*** 0.276*** 0.763*** 0.144*
Number of observations 1801 1798 2522 2512
Source: WERS Survey of Managers Key to statistical significance: *** p<0.01, ** p<0.05, * p<0.1 Controls: workplace employment; single/multi‐site organisation; organisation employment; foreign‐ownership, industry sector, workplace age, region, largest occupational group (plus private sector dummy for whole economy models).
Table 3.2: Employers Attitudes Regarding Individual Responsibility
Private Sector %
Whole Economy
%
“It is up to individual employees to balance their work and family responsibilities”
Strongly Agree 21 20
Agree 57 56
Neither agree nor disagree 12 13
Disagree 9 10
Strongly Disagree 0 1
Number of observations 1,858 2,680
Source: WERS Survey of Managers
Table 3.3: Managerial Agreement That It Is Up To Individual Employees to Balance Their Work and Family Responsibilities, by Unionisation
Private sector Whole economy
Raw Controls Raw Controls
Any recognised unions? Yes ‐0.211** ‐0.196* ‐0.259*** ‐0.214**
Union strength: Index (range 0‐6) ‐0.113*** ‐0.113*** ‐0.068*** ‐0.048
Number of observations 1801 1798 2522 2512
Source: WERS Survey of Managers Key to statistical significance: *** p<0.01, ** p<0.05, * p<0.1 Controls: workplace employment; single/multi‐site organisation; organisation employment; foreign‐ownership, industry sector, workplace age, region, largest occupational group (plus private sector dummy for whole economy models).

4
Tab
le 4
.1:
Pro
bab
ility
th
at t
he
emp
loye
e w
orks
mor
e th
an 4
8 h
ours
per
wee
k
Private sector
Whole economy
Private sector
Whole economy
Female
+ caring
Male +
caring
All
employees
Female
+ caring
Male +
caring
All
employees
Female
+ caring
Male +
caring
All
employees
Female
+ caring
Male +
caring
All
employees
Union strength:
Index (range 0‐6)
‐0.009**
‐0.022**
‐0.017***
‐0.005*
‐0.022***
‐0.015***
‐0.009**
‐0.018*
‐0.015***
‐0.005*
‐0.019**
‐0.013***
Number of WLB
practices:
Number (range 0‐15)
0.000
‐0.013**
‐0.006**
‐0.003*
‐0.011**
‐0.006***
R‐squared
0.143
0.135
0.114
0.128
0.120
0.110
0.144
0.140
0.115
0.129
0.123
0.112
Number of observations
2679
2953
12660
5269
4233
19715
2679
2953
12660
5269
4233
19715
Source: W
ERS Survey of Em
ployees
Key to statistical significance: ***
p<0.01, ** p<0.05, *
p<0.1
Controls: Em
ployee level: gen
der, age, m
arital status, any dep
endent children, disability, white ethnicity, highest academ
ic qualification, highest vocational
qualification, occupation, tenure, contract type; individual union m
embership. Workplace level: workplace employm
ent; single/multi‐site organisation;
organisation employm
ent; foreign‐ownership, industry sector, w
orkplace age, region, largest occupational group; number of work‐life balance practices.
Models containing the W
LB practices also include a control for manager’s view of individual responsibility for work‐life balance. Th
e whole economy models
contain a private sector dummy.

5
Tab
le 4
.2:
Emp
loye
es’ p
erce
pti
ons
of lo
ng
-hou
rs c
ult
ure
at
thei
r w
orkp
lace
Private sector
Whole economy
Private sector
Whole economy
Female
+ caring
Male +
caring
All
employees
Female +
caring
Male +
caring
All
employees
Female +
caring
Male +
caring
All
employees
Female
+ caring
Male +
caring
All
employees
Union strength:
Index (range 0‐6)
‐0.048**
‐0.040*
‐0.048***
‐0.029**
‐0.037**
‐0.038***
‐0.047**
‐0.040*
‐0.047***
‐0.028**
‐0.037**
‐0.037***
Number of WLB
practices:
Number (range 0‐15)
‐0.002
‐0.010
‐0.005
‐0.010
‐0.010
‐0.010*
R‐squared
0.128
0.136
0.095
0.121
0.121
0.096
0.129
0.140
0.096
0.122
0.123
0.097
Number of observations
2727
2990
12880
5395
4284
20120
2727
2990
12880
5395
4284
20120
Source: W
ERS Survey of Em
ployees
Key to statistical significance: ***
p<0.01, ** p<0.05, *
p<0.1
Controls: Em
ployee level: gen
der, age, m
arital status, any dep
endent children, disability, white ethnicity, highest academ
ic qualification, highest vocational
qualification, occupation, hours, ten
ure, contract type, individual union mem
bership. W
orkplace level: workplace employm
ent; single/multi‐site organisation;
organisation employm
ent; foreign‐ownership, industry sector, w
orkplace age, region, largest occupational group; number of work‐life balance practices.
Models containing the W
LB practices also include a control for manager’s view of individual responsibility for work‐life balance. Th
e whole economy models
contain a private sector dummy.

6
Tab
le 4
.3:
Emp
loye
es’ p
erce
pti
ons
of w
het
her
job
aff
ects
life
ou
tsid
e w
ork
Private sector
Whole economy
Private sector
Whole economy
Female
+ caring
Male +
caring
All
employees
Female +
caring
Male +
caring
All
employees
Female
+ caring
Male +
caring
All
employees
Female +
caring
Male +
caring
All
employees
Union strength:
Index (range 0‐6)
‐0.006
‐0.025
‐0.016
‐0.005
‐0.029
‐0.015*
‐0.007
‐0.020
‐0.013
‐0.004
‐0.025
‐0.013
Number of WLB
practices:
Number (range 0‐15)
0.004
‐0.017
‐0.010*
‐0.003
‐0.016*
‐0.010**
R‐squared
0.210
0.180
0.159
0.206
0.160
0.159
0.210
0.181
0.159
0.207
0.161
0.159
Number of observations
2732
3000
12919
5418
4304
20200
2732
3000
12919
5418
4304
20200
Source: W
ERS Survey of Em
ployees
Key to statistical significance: ***
p<0.01, ** p<0.05, *
p<0.1
Controls: Em
ployee level: gen
der, age, m
arital status, any dep
endent children, disability, white ethnicity, highest academ
ic qualification, highest vocational
qualification, occupation, hours, ten
ure, contract type, individual union mem
bership. W
orkplace level: workplace employm
ent; single/multi‐site organisation;
organisation employm
ent; foreign‐ownership, industry sector, workplace age, region, largest occupational group. M
odels containing the W
LB practices also
include a control for manager’s view of individual responsibility for work‐life balance. Th
e whole economy models contain a private sector dummy.

7
Tab
le 4
.4:
Emp
loye
es’ p
erce
pti
ons
of w
het
her
man
ager
s ar
e u
nd
erst
and
ing
ab
out
non
-wor
k re
spon
sib
iliti
es
Private sector
Whole economy
Private sector
Whole economy
Female
+ caring
Male +
caring
All
employees
Female +
caring
Male +
caring
All
employees
Female
+ caring
Male +
caring
All
employees
Female +
caring
Male +
caring
All
employees
Union strength:
Index (range 0‐6)
0.008
‐0.020
‐0.019
‐0.004
0.000
‐0.011
0.003
‐0.027
‐0.024*
‐0.007
‐0.006
‐0.015
Number of WLB
practices:
Number (range 0‐15)
0.021*
0.020
0.015*
0.015*
0.020*
0.012**
R‐squared
0.143
0.194
0.115
0.118
0.166
0.105
0.145
0.196
0.116
0.119
0.167
0.105
Number of observations
2699
2946
12630
5345
4239
19759
2699
2946
12630
5345
4239
19759
Source: W
ERS Survey of Em
ployees
Key to statistical significance: ***
p<0.01, ** p<0.05, *
p<0.1
Controls: Em
ployee level: gen
der, age, m
arital status, any dep
endent children, disability, white ethnicity, highest academ
ic qualification, highest vocational
qualification, occupation, hours, ten
ure, contract type, individual union mem
bership. W
orkplace level: workplace employm
ent; single/multi‐site organisation;
organisation employm
ent; foreign‐ownership, industry sector, workplace age, region, largest occupational group. M
odels containing the W
LB practices also
include a control for manager’s view of individual responsibility for work‐life balance. Th
e whole economy models contain a private sector dummy.

8
Tab
le 4
.5:
Job
-rel
ated
An
xiet
y, C
arin
g R
esp
onsi
bili
ties
an
d W
LB
Private sector
Whole Economy
Private sector
Whole Economy
Women
Men
All
Women
Men
All
W
omen
Men
All
Women
Men
All
Union Sector
N
on‐union sector
N dep
enden
t child
ren
‐0.129
‐0.179
‐0.135
‐0.269***
‐0.093
‐0.175**
‐0.594***
‐0.153
‐0.326***
‐0.581***
‐0.15
‐0.322***
Time caring for ill, d
isab
led, aged:
Categorical hours p w (range 1‐6)
‐0.03
0.353**
0.131
0.058
0.220*
0.121*
0.330***
0.274**
0.315***
0.329***
0.301**
0.326***
Union strength:
Index (range 0‐6)
‐0.244*
‐0.18
‐0.203**
‐0.062
‐0.138
‐0.091
‐0.158
‐0.13
‐0.131
‐0.105
0.076
‐0.001
Number of WLB
practices:
Number (range 0‐15)
‐0.054
‐0.112**
‐0.098**
‐0.044
‐0.077*
‐0.071**
‐0.051
‐0.079
‐0.067
‐0.051
‐0.082
‐0.068
R‐squared
0.157
0.123
0.103
0.112
0.095
0.088
0.141
0.106
0.098
0.139
0.107
0.099
Number of observations
1845
2772
4617
6039
5115
11154
4287
3393
7680
4587
3503
8090
Source: W
ERS Survey of Em
ployees
Key to statistical significance: ***
p<0.01, ** p<0.05, *
p<0.1
The caring variable is based on responses to the question: “Do you look after or give help or support to any family m
embers or friends who have a long‐
term
physical or men
tal illness or disability, or who have problems related to old age?” where 1 = “no” 2=<5 hours a week 3=5
‐9 hours a week 4=10‐19
hours a week, 5=20‐34 hours a week, and 6=35+ hours a week.
Controls: Em
ployee level: gen
der, age, m
arital status, disability, w
hite ethnicity, highest academ
ic qualification, h
ighest vocational qualification, occupation,
hours, tenure, contract type, individual union membership. Workplace level:
workplace employm
ent; single/m
ulti‐site organisation; organisation
employm
ent; foreign‐ownership, industry sector, w
orkplace age, region, largest occupational group. Models containing the W
LB practices also include a
control for manager’s view of individual responsibility for work‐life balance. The whole economy models contain a private sector dummy.