Visualizing space-time uncertainty of dengue fever outbreaks

Working with Space-time DataAileen Buckley, PhD
Slides are on Slideshare.net – search for my name

This session
• The nature of temporal data
• Visualizing temporal data
• Managing temporal data
• Analyzing temporal data
• Sharing temporal data
• Best practices are highlighted
with a check mark
• ArcUser article – Spring 2018
has a high level overview
✓

Demo
Visualizing space-
time data

What is space-time data and why is it important?
Moving
featuresFeatures that move
over space
• Airplanes, boats,
vehicles
• People, animals
• Storm centers
Discrete
eventsEvents that happen at
specific locations
• Crimes
• Accidents
• Earthquakes,
lightening strikes,
volcanic events
Stationary
recordersFeatures that stay in one
place and record changes
• Weather stations
• Traffic sensors
• Stream gauges
Change /
growthFeatures that change
condition over time
• Demographics
• Fire perimeters
• Flood extents

The nature of space-time data
• Conceptualizations of time vary
- Linear (unique, directional time periods)
- Cyclic (repeating after a specific range in time)
- Others
• ArcGIS assumes that time is linear
http://www.businessinsider.com/how-different-cultures-understand-time-2014-5

The nature of space-time data
• Time is relative to something
- Clock-driven time – synchronized to a specific clock
- 15-minute readings from stream gauges
- Crime occurrences
- Event-driven time – synchronized to an event
- Before or after an economic event (e.g., stock market crash)
- Before or after an environmental disaster (e.g., flood or hurricane)
- Planning a military exercise
- State-driven time – synchronized to a change in state
- Melting of ice sheets
- Changes in the economy, such as inflation
The nature of space-time data
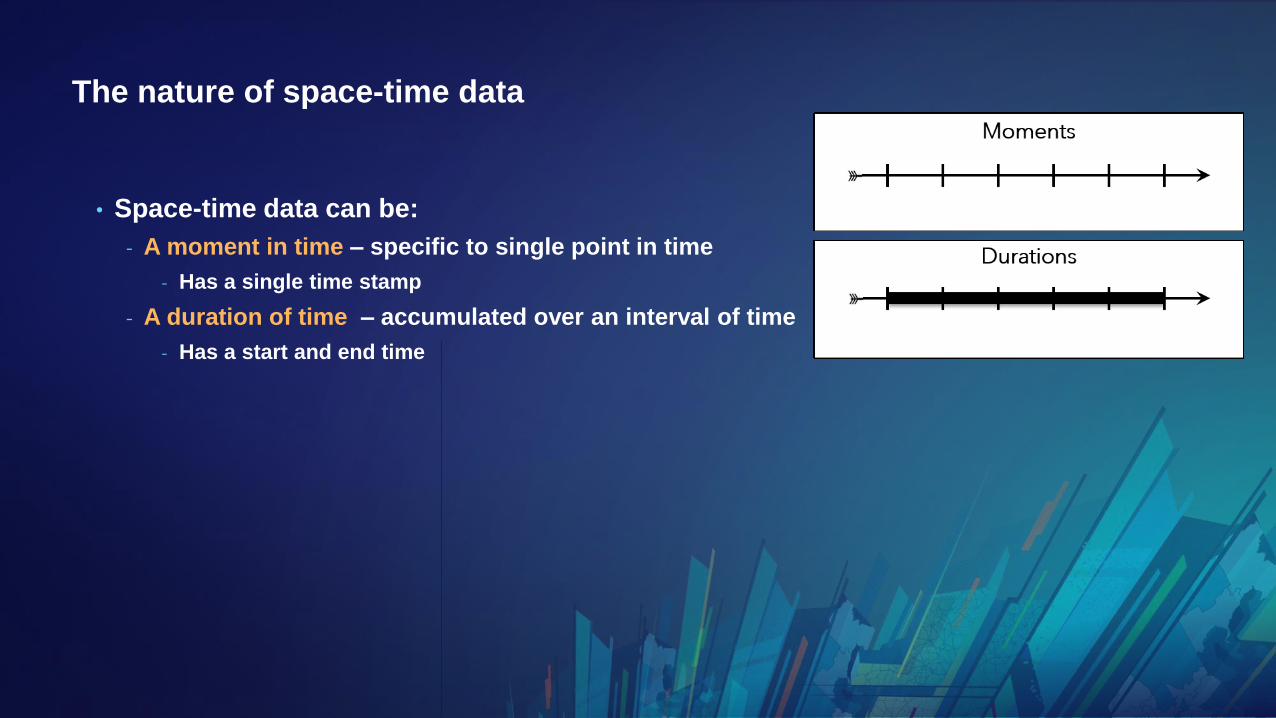
• Space-time data can be:
- A moment in time – specific to single point in time
- Has a single time stamp
- A duration of time – accumulated over an interval of time
- Has a start and end time

The nature of space-time data
• Space-time data can be:
- A moment in time – specific to single point in time
- Has a single time stamp
- A duration of time – accumulated over an interval of time
- Has a start and end time
- Regular frequency – the time extents are constant
- Regularly scheduled GPS fixes from animal tracking devices
- A decade for a census
- Irregular frequency – the time extents are different
- The occurrence of crimes
- Change in political boundaries

GIS integrates space-time data
• ArcGIS integrates time across
the platform
- ArcGIS for Desktop
- ArcGIS Pro
- ArcGIS Portal
- ArcGIS Online
- …
• ArcGIS can be used to:
- Manage
- Visualize
- Analyze
- Share
T1
Analysis, simulation, & modeling
Fixed time space-time
data
Space-time maps
Stationary
Mobile
Real-time
sensor network
x
y
T
Multidimensional(x,y,z,t)
Time stamps / time extents
Data Sources
space-time data

Demo
Visualizing space-
time data

Raster data example
Visualizing space-
time data

Visualizing space-time data

Visualizing space-time data in ArcGIS
1. Enable time on a layer and configure the associated time properties
2. Use the time slider to control the visualization
The time slider control will automatically appear in any map or scene with time-
enabled layers

Visualizing space-time data in ArcGIS
1. Enable time on a layer and configure the associated time properties
- Specify the time attribute or attributes
- Set the time extent
- Indicate the refresh rate for live feed data
- Manage for differing time zones and daylight saving time
Visualizing space-time data in ArcGIS
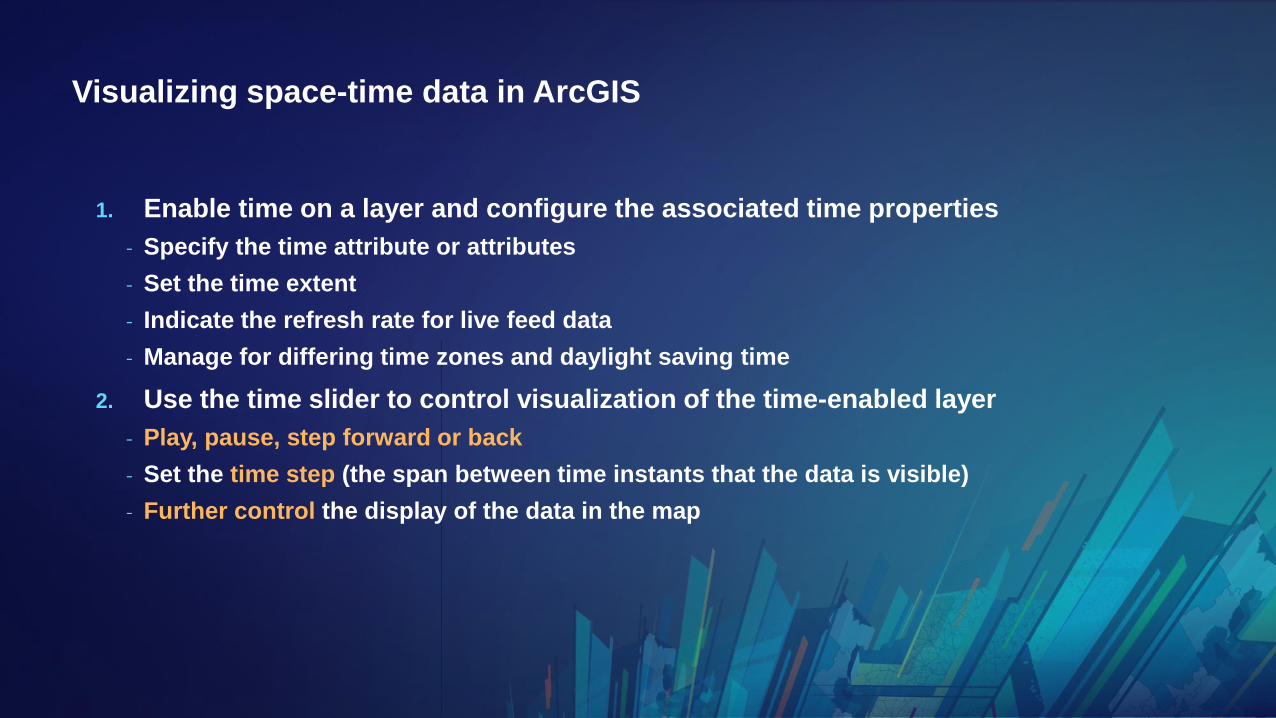
1. Enable time on a layer and configure the associated time properties
- Specify the time attribute or attributes
- Set the time extent
- Indicate the refresh rate for live feed data
- Manage for differing time zones and daylight saving time
2. Use the time slider to control visualization of the time-enabled layer
- Play, pause, step forward or back
- Set the time step (the span between time instants that the data is visible)
- Further control the display of the data in the map

Managing space-time data

Storing temporal data
• Store time values in a date field
- A field type that stores dates, times, or dates and times
- Especially for large data
- Most efficient format for query / display performance
- Supports more sophisticated database queries
• Index the date field for faster query performance
ArcGIS supports
a wide range of
standard formats
and custom
formats
✓
✓
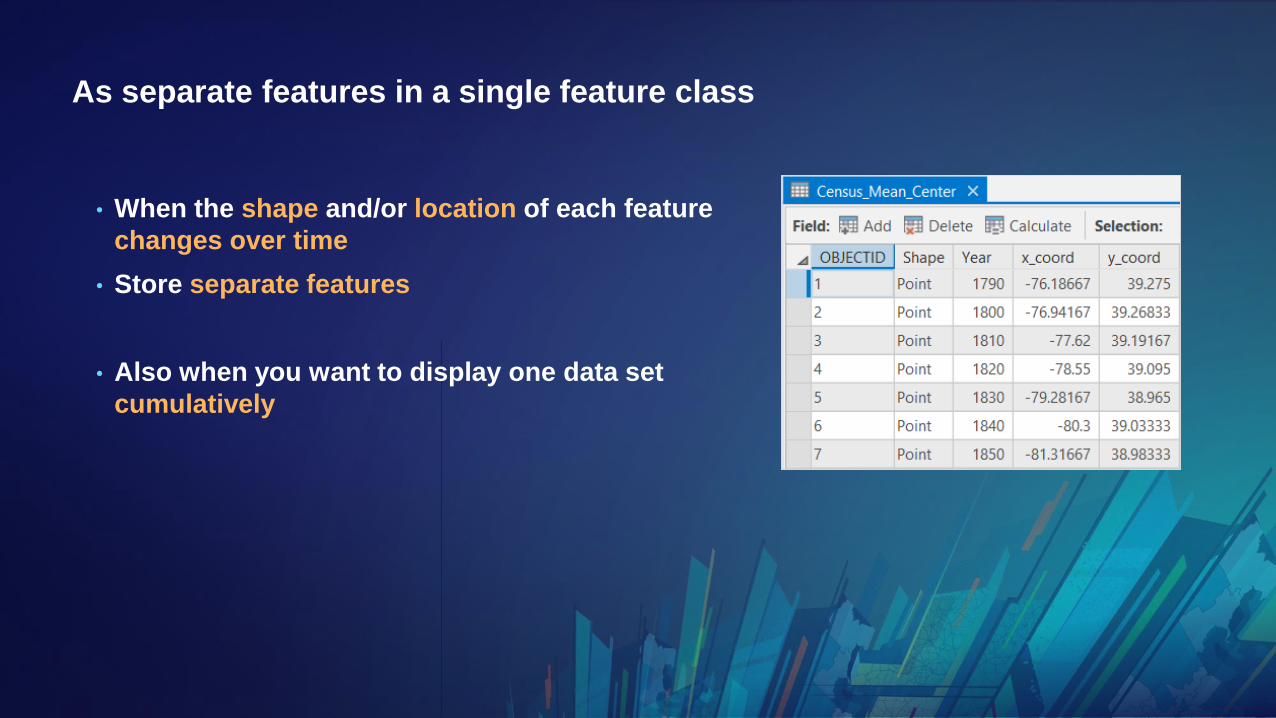
As separate features in a single feature class
• When the shape and/or location of each feature
changes over time
• Store separate features
• Also when you want to display one data set
cumulatively
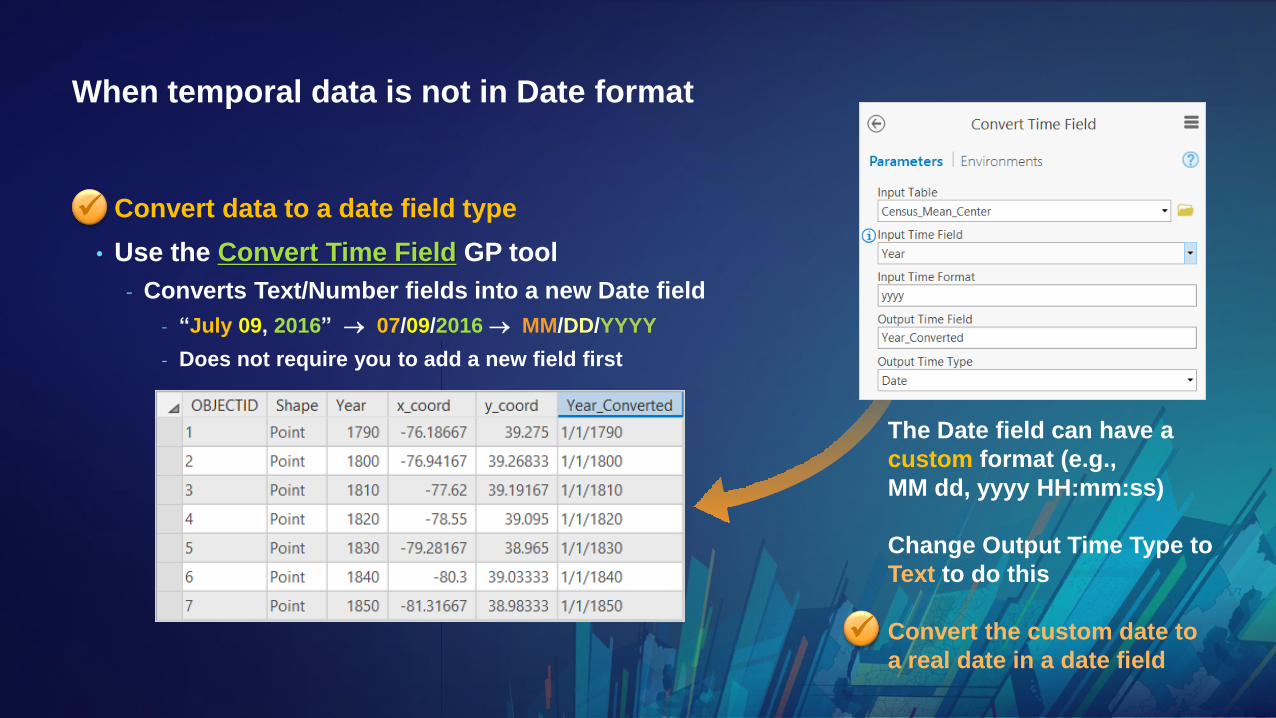
When temporal data is not in Date format
• Convert data to a date field type
• Use the Convert Time Field GP tool
- Converts Text/Number fields into a new Date field
- “July 09, 2016” 07/09/2016 MM/DD/YYYY
- Does not require you to add a new field first
The Date field can have a
custom format (e.g.,
MM dd, yyyy HH:mm:ss)
Change Output Time Type to
Text to do this
Convert the custom date to
a real date in a date field
✓
✓

When point space-time data needs to be converted to range data
• Create an end time from the exiting start times
• Use the Calculate End Time GP tool
- Populates an end time field with the next record’s start time
- The last record will have
- Manually edit the end time if you know what it should be
✓
✓
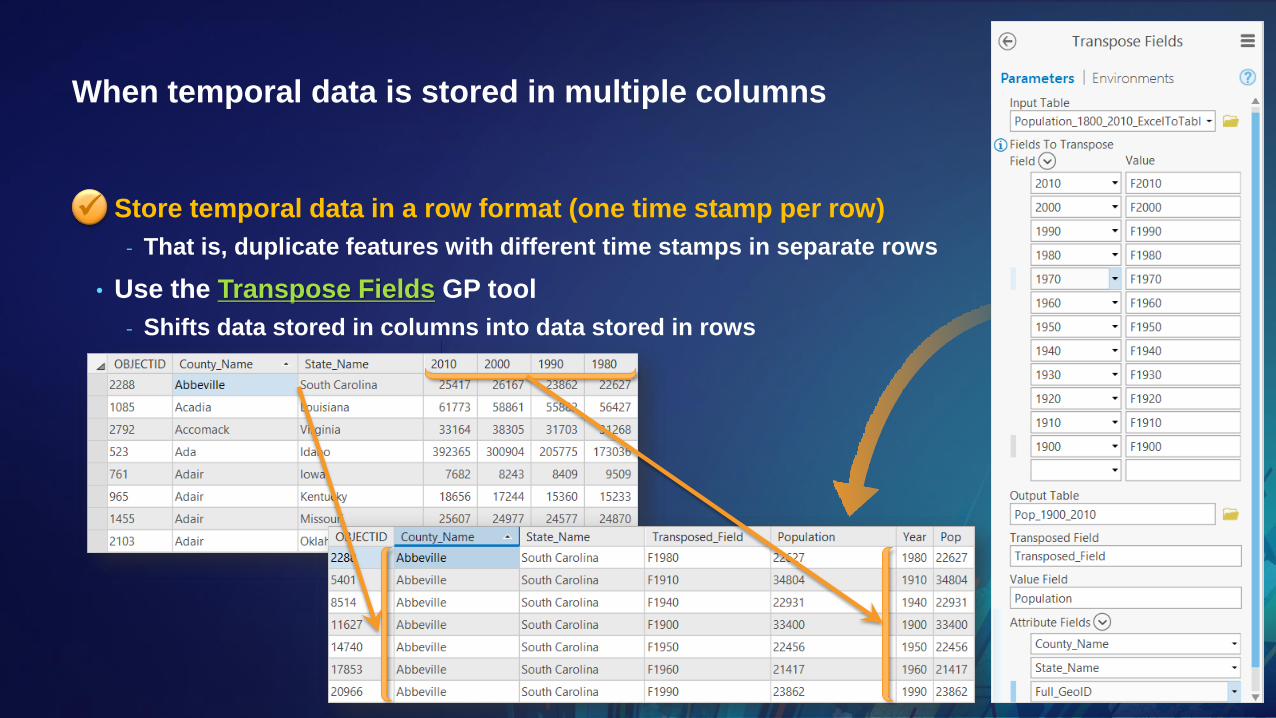
When temporal data is stored in multiple columns
• Store temporal data in a row format (one time stamp per row)
- That is, duplicate features with different time stamps in separate rows
• Use the Transpose Fields GP tool
- Shifts data stored in columns into data stored in rows
✓

As features joined to a table
• When the shape and/or location of each feature is constant but attribute values
change over time
• Store the changing attributes in a separate (one-to-many) joined table

When temporal data is in a separate table
• Create a one-to-one, many-to-one, or one-to-many join
• Use the Add Join GP tool
• For some GP tools, you will need to export the features (Copy Features GP tool) to
create a new feature class
- For example, Spatial Statistics and Space-Time Pattern Mining tools
✓
✓

When temporal data is in different time zones
• ArcGIS integrates data in different layers
across different time zones
- Layers in map can be in different time zones
• Convert data for same layer into the same time
zone
• Use the Convert Time Zone GP tool
- Converts time values recorded in a date field from
one time zone to another time zone
✓
New York Los Angeles

When temporal data is stored in daylight savings time
• Store temporal data in standard time
- Multiple problems with DST
- Storing the time values in standard time
prevents loss or overlaps of data
- Prevents ambiguity in visualizations and
errors in analyses
• Use the Calculate GP tool to add or
subtract time
• Standardize on UTC1 or GMT2
- 1 Coordinated Universal Time
- 2 Greenwich Mean Time
✓
• Regional differences
• Rules and boundaries change frequently
• Some DST zones adjust less than an hour
• 30 minute offset
• 45 minute offset
✓

When you need to add or subtract from temporal data
• Use the Calculate GP tool to add or subtract time
- Python 3: !timefield!.replace(year=!timefield!.year + 10)
- Arcade: DateAdd( date, addValue, units)
https://docs.python.org/3/library/datetime.html
https://developers.arcgis.com/arcade/function-reference/date_functions/
✓

Demo
Managing space-
time data

Analyzing space-time data

Supported data types
• Feature layers
• Mosaic datasets
• NetCDF layers
• Tables
• Raster catalogs
• Tracking layers / Streaming layers
• Network dataset layers with traffic data
• Plus service layers with historical content and updating data feeds
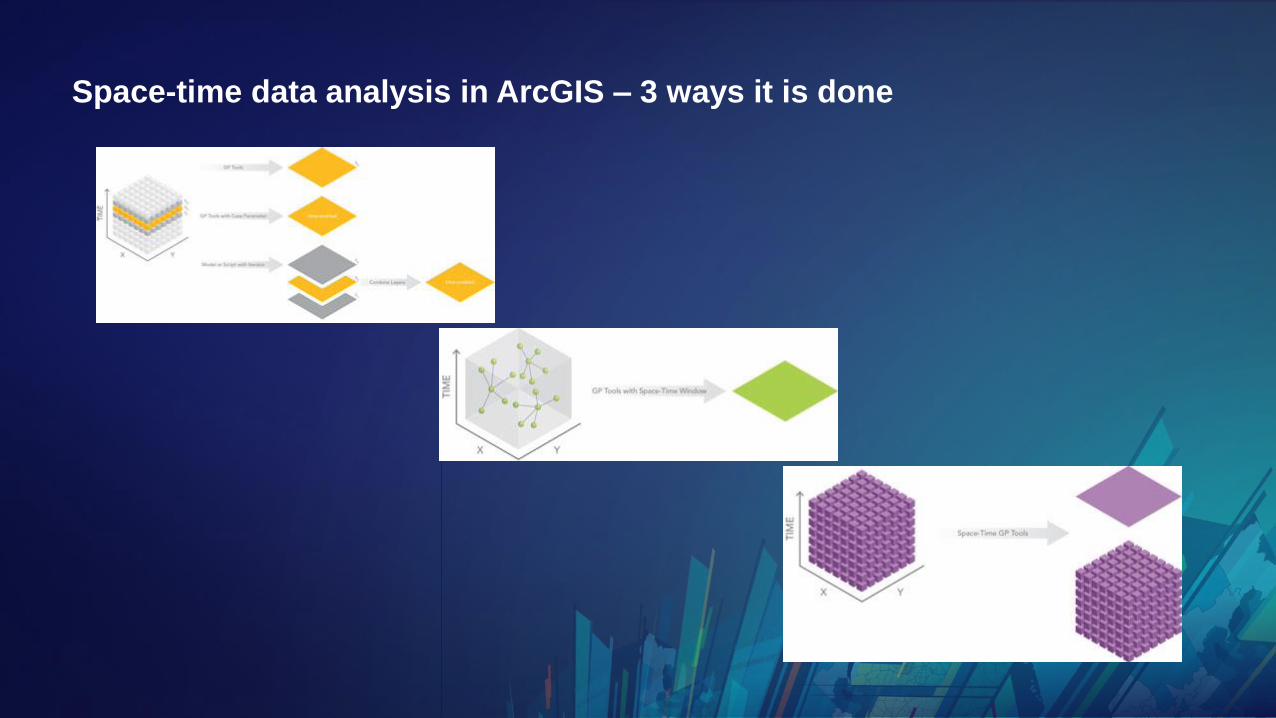
Space-time data analysis in ArcGIS – 3 ways it is done

1st approach
• Data for each time step is analyzed separately
• Results are presented as a single time step layer or a set of layers, one for each time step

1st approach – 3 ways it is done
1. All GP tools honor the time settings
- For time-enabled layers, only those features that fall temporally within the time extent set
in the time slider will be processed
- Similar to a selection or definition query
- Results are then displayed as a single layer on a map

1st approach – 3 ways it is done
1. All GP tools honor the time settings
2. With some GP tools, the time attribute can be used as the case field to repeat the
analysis for each time step
- The case field is used to calculate statistics separately for each unique attribute value
(that is, each time step)
- Results are presented as a single layer, and time can be enabled on the case field in the
output feature class
- e.g., Mean Center and Directional Distribution

1st approach – 3 ways it is done
1. All GP tools honor the time settings
2. With some GP tools, the time attribute can be used as the case field to repeat the
analysis for each time step
3. A model or script with an iterator to specifies that the analysis should be repeated
for each time step
- Results are presented as separate outputs, one for each time step
- The separate outputs can then be combined so that the final result can be time enabled
and visualized using the time slider control
- For feature classes, use Merge or Append
- For rasters, use a mosaic dataset

2nd approach
• Data is analyzed using space-time constraints
• Results are presented as a single layer

The second approach
• Certain GP tools use a spatial weights matrix
• This defines feature relationships in terms of a
space-time window
- Specified critical distance and fixed interval in time
• Tools:
- Hot Spot Analysis – creates a map of clusters in both space
and time of significantly high (hot) or low (cold) values
- Cluster and Outlier Analysis – identifies the similarity (as the
spatial clustering of either high or low values) or the
dissimilarity (as spatial outliers) of features
- Spatially Constrained Multivariate Clustering – finds
spatially contiguous clusters of features based on a set of
feature attribute values and optional cluster size limits

3rd approach
• Data for all time steps is analyzed both spatially and temporally
• Results are presented as a single layer or a space-time cube

3rd approach
• Space-Time Pattern Mining Tools
- Require that the data be in a space-time cube
format
- Emerging Hot Spot Analysis – identifies hot and cold
spots and determines if they have a temporal trend
(new versus persistent versus historic hot spots)
- Local Outlier Analysis – determines if features have
belonged in clusters or been outliers over the entire
time extent of the dataset
- Time Series Clustering – partitions a collection of
time series, stored in a space-time cube, based on
the similarity of time series characteristics


3rd approach
• Space-Time Pattern Mining Tools - Utilities
- Working with space-time cubes
- Create the cube from points or polygons
- Visualize the cube in 2D or 3D
- Fill Missing Values (Utilities toolset) – replaces
missing values with estimates based on spatial
neighbors, space-time neighbors, or time-series
values
• Space Time Cube Explorer Add-In can also be
used for visualization

More traditional time series analysis
• Take advantage of the extensibility of the ArcGIS platform
• Capabilities to easily transfer data to open-source analytical software
- Use ArcPy utility functions to analyze the data in Python
- For example, FeatureClassToNumPyArray
- Use the R-ArcGIS Bridge to analyze the data using R

Sharing space-time maps

Share your space-time maps as
• A map or layer package
• A set of exported images
• A video
• A time-enabled map layer for the web
• A time-enabled image service for the web (Portal only)
• A space-time map book (using data-driven pages)

Space-time web maps
• When creating time-enabled web maps
- Publish from Pro directly to ArcGIS Online
• Known issues with ArcGIS Online requires two edits before publishing:
- Avoid group layers)
- Do not use a definition query on a time field
✓
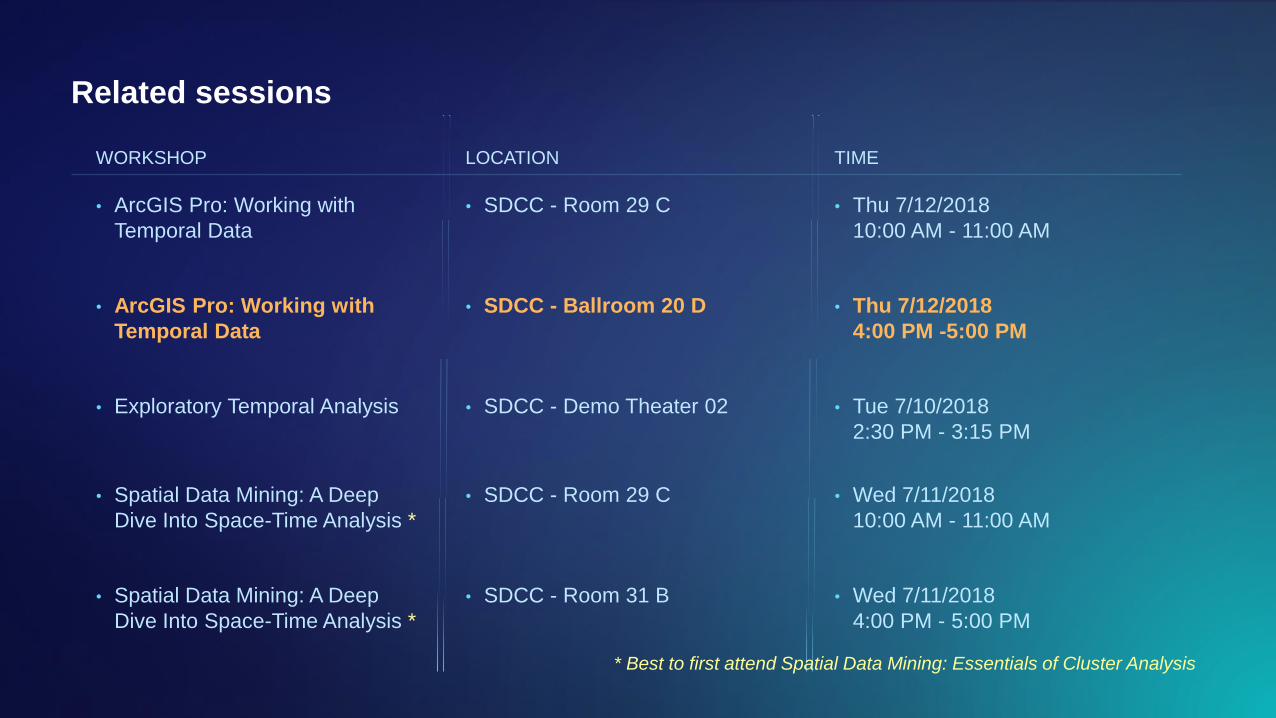
Related sessions
• ArcGIS Pro: Working with
Temporal Data
• ArcGIS Pro: Working with
Temporal Data
• Exploratory Temporal Analysis
• Spatial Data Mining: A Deep
Dive Into Space-Time Analysis *
• Spatial Data Mining: A Deep
Dive Into Space-Time Analysis *
WORKSHOP LOCATION
• SDCC - Room 29 C
• SDCC - Ballroom 20 D
• SDCC - Demo Theater 02
• SDCC - Room 29 C
• SDCC - Room 31 B
TIME
• Thu 7/12/2018
10:00 AM - 11:00 AM
• Thu 7/12/2018
4:00 PM -5:00 PM
• Tue 7/10/2018
2:30 PM - 3:15 PM
• Wed 7/11/2018
10:00 AM - 11:00 AM
• Wed 7/11/2018
4:00 PM - 5:00 PM
* Best to first attend Spatial Data Mining: Essentials of Cluster Analysis

Please Take Our Survey on the App
Download the Esri Events
app and find your event
Select the session
you attended
Scroll down to find the
feedback section
Complete answers
and select “Submit”

Slides are on Slideshare.net
Search for my name
Aileen Buckley