Working with Different Types of Imagery - Virginia Geospatial
10
Working with Imagery |Page 1 Working with Different Types of Imagery For the purpose of this exercise, we will consider the term “imagery” to refer to two of the most common forms of remotely sensed raster data: Satellite imagery and Aerial photography. The intent of this short exercise is to familiarize you with provide experience in the basic manipulation of these different forms of imagery within the ArcGIS Desktop. Satellite Imagery Landsat ETM+: The Landsat Program is a series of Earth-observing satellite missions managed by NASA and the U.S. Geological Survey. Landsat sensors have a moderate spatial-resolution. You cannot see individual houses on a Landsat image, but you can see large man-made objects such as highways. This is an important spatial resolution because it is coarse enough for global coverage, yet detailed enough to characterize human-scale processes such as urban growth. 1. In ArcGIS, add the data element “etm_p14r34_29jul02.img”. This is a Landsat ETM+ tile of the eastern portion of Virginia (and Maryland). The Landsat naming convention allows us to quickly see that this is an ETM (enhanced thematic mapper) image recorded on 29 July, 2002, of path 14, row 34 of the satellite’s orbital pattern. See Appendix 1 of this exercise for a map of Virginia’s Landsat Coverage. 2. What initial/instinctual observations can you make about the imagery from this zoomed view (i.e. what’s wrong with this picture)? ________________________________________________________________________ 3. Right click on the image title in the table of contents and select “Properties”. Using the ‘Source’ tab, define the following parameters for this image: Spatial Resolution: _______________ Radiometric Resolution: ___________ Spectral Resolution (bands): ________ 4. Now click on the ‘Symbology’ tab. This reveals what might be “wrong” with our display of the image. In most cases, color guns 1, 2, and 3, are reserved for blue, green, and red respectively. In ArcGIS, satellite
Transcript of Working with Different Types of Imagery - Virginia Geospatial
Working with Imagery |Page 1
Working with Different Types of Imagery For the purpose of this exercise, we will consider the term “imagery” to refer to two of the most common forms of remotely sensed raster data: Satellite imagery and Aerial photography. The intent of this short exercise is to familiarize you with provide experience in the basic manipulation of these different forms of imagery within the ArcGIS Desktop. Satellite Imagery Landsat ETM+: The Landsat Program is a series of Earth-observing satellite missions managed by NASA and the U.S. Geological Survey. Landsat sensors have a moderate spatial-resolution. You cannot see individual houses on a Landsat image, but you can see large man-made objects such as highways. This is an important spatial resolution because it is coarse enough for global coverage, yet detailed enough to characterize human-scale processes such as urban growth.
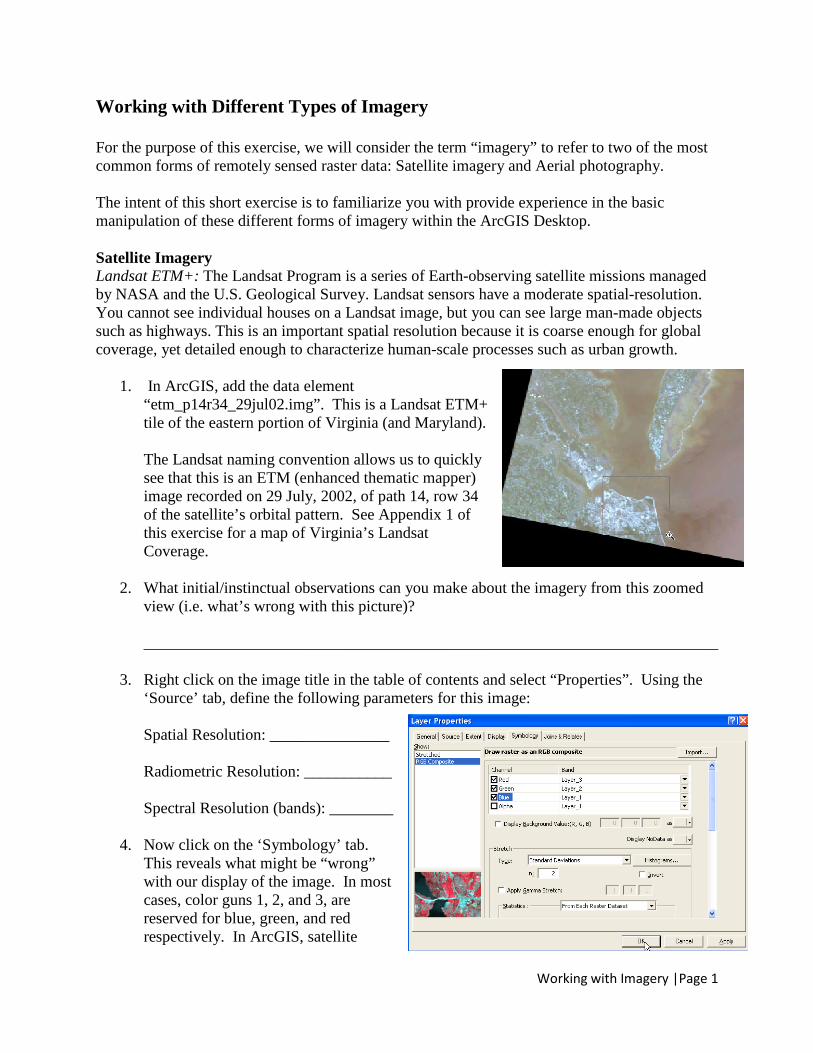
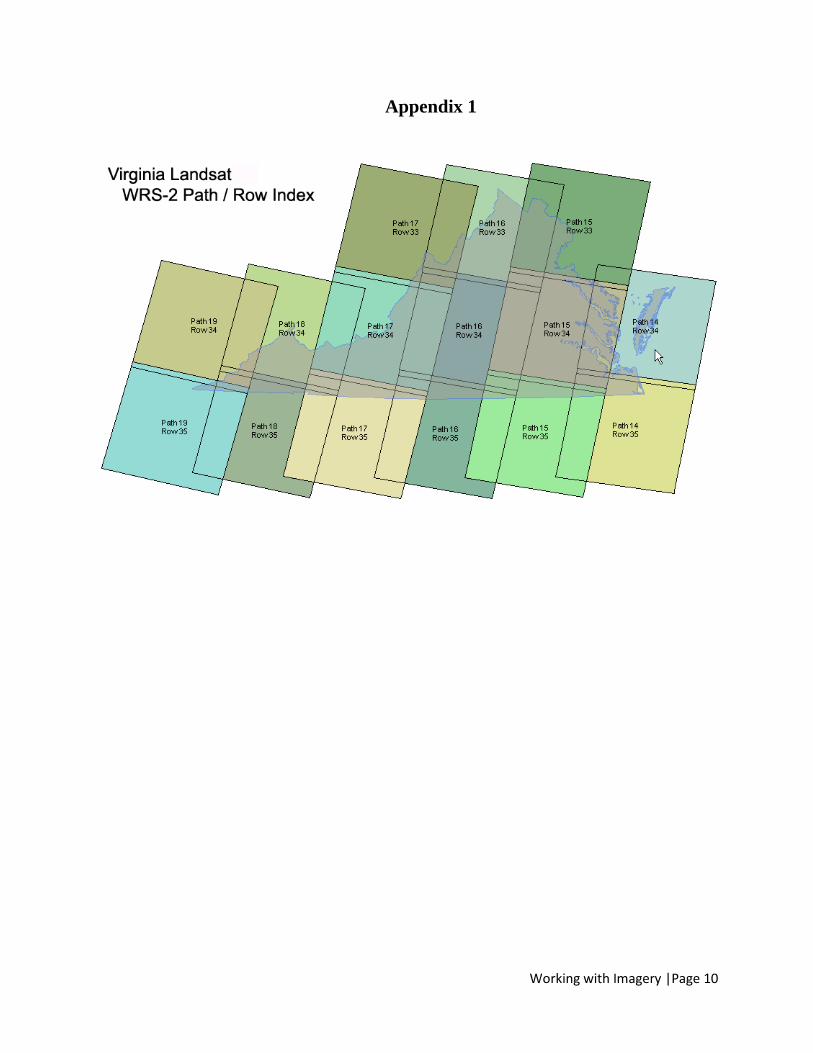
1. In ArcGIS, add the data element “etm_p14r34_29jul02.img”. This is a Landsat ETM+ tile of the eastern portion of Virginia (and Maryland). The Landsat naming convention allows us to quickly see that this is an ETM (enhanced thematic mapper) image recorded on 29 July, 2002, of path 14, row 34 of the satellite’s orbital pattern. See Appendix 1 of this exercise for a map of Virginia’s Landsat Coverage.
2. What initial/instinctual observations can you make about the imagery from this zoomed view (i.e. what’s wrong with this picture)? ________________________________________________________________________
3. Right click on the image title in the table of contents and select “Properties”. Using the ‘Source’ tab, define the following parameters for this image: Spatial Resolution: _______________ Radiometric Resolution: ___________ Spectral Resolution (bands): ________
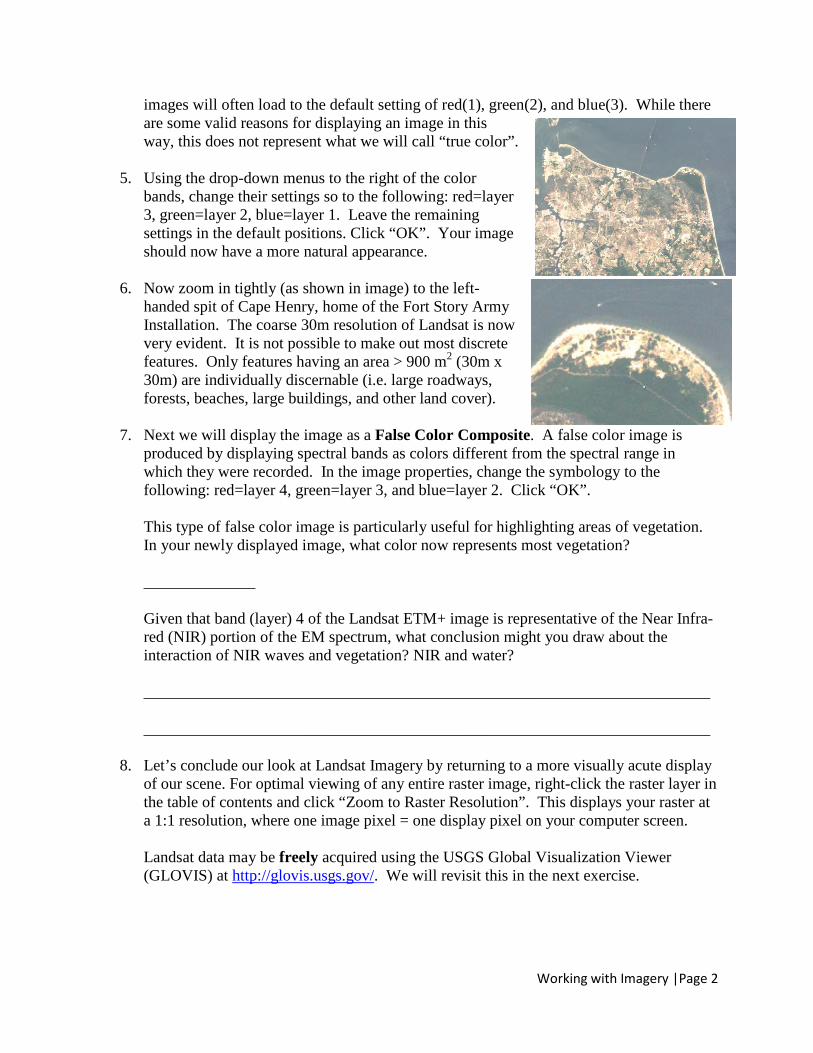
4. Now click on the ‘Symbology’ tab. This reveals what might be “wrong” with our display of the image. In most cases, color guns 1, 2, and 3, are reserved for blue, green, and red respectively. In ArcGIS, satellite
Working with Imagery |Page 2
images will often load to the default setting of red(1), green(2), and blue(3). While there are some valid reasons for displaying an image in this way, this does not represent what we will call “true color”.
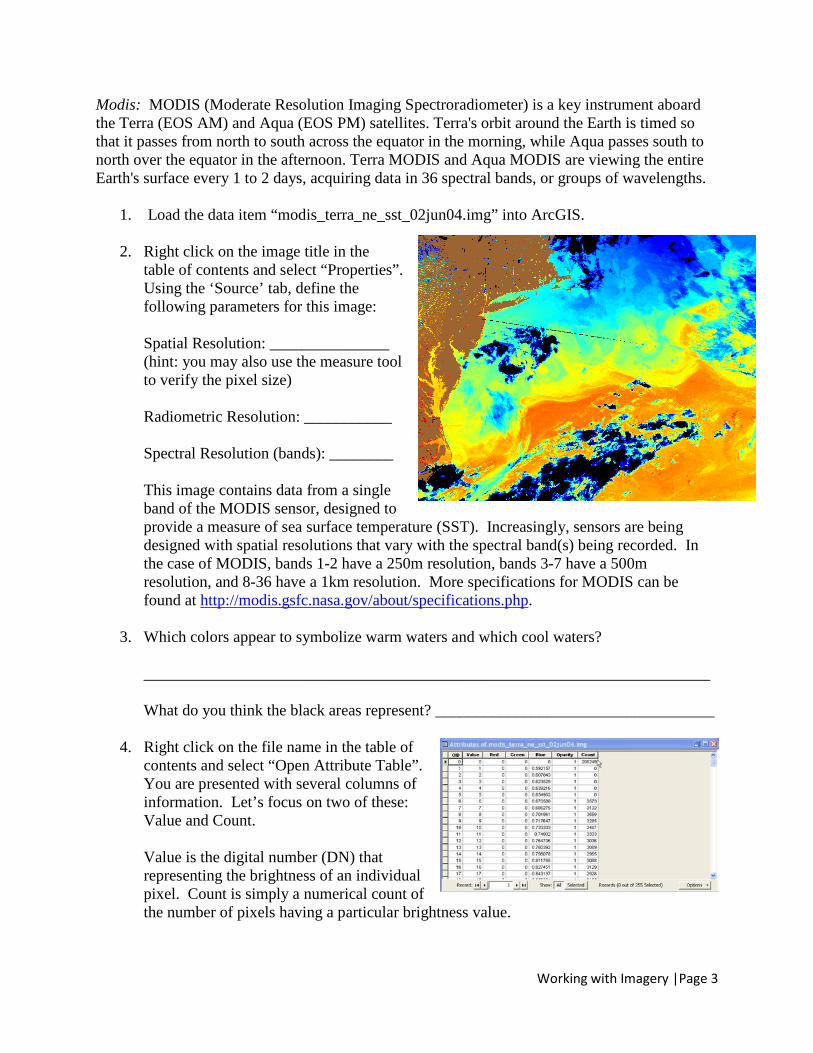
5. Using the drop-down menus to the right of the color bands, change their settings so to the following: red=layer 3, green=layer 2, blue=layer 1. Leave the remaining settings in the default positions. Click “OK”. Your image should now have a more natural appearance.
6. Now zoom in tightly (as shown in image) to the left-handed spit of Cape Henry, home of the Fort Story Army Installation. The coarse 30m resolution of Landsat is now very evident. It is not possible to make out most discrete features. Only features having an area > 900 m2 (30m x 30m) are individually discernable (i.e. large roadways, forests, beaches, large buildings, and other land cover).
7. Next we will display the image as a False Color Composite. A false color image is produced by displaying spectral bands as colors different from the spectral range in which they were recorded. In the image properties, change the symbology to the following: red=layer 4, green=layer 3, and blue=layer 2. Click “OK”. This type of false color image is particularly useful for highlighting areas of vegetation. In your newly displayed image, what color now represents most vegetation? ______________ Given that band (layer) 4 of the Landsat ETM+ image is representative of the Near Infra-red (NIR) portion of the EM spectrum, what conclusion might you draw about the interaction of NIR waves and vegetation? NIR and water? _______________________________________________________________________ _______________________________________________________________________
8. Let’s conclude our look at Landsat Imagery by returning to a more visually acute display of our scene. For optimal viewing of any entire raster image, right-click the raster layer in the table of contents and click “Zoom to Raster Resolution”. This displays your raster at a 1:1 resolution, where one image pixel = one display pixel on your computer screen. Landsat data may be freely acquired using the USGS Global Visualization Viewer (GLOVIS) at http://glovis.usgs.gov/. We will revisit this in the next exercise.
Working with Imagery |Page 3
Modis: MODIS (Moderate Resolution Imaging Spectroradiometer) is a key instrument aboard the Terra (EOS AM) and Aqua (EOS PM) satellites. Terra's orbit around the Earth is timed so that it passes from north to south across the equator in the morning, while Aqua passes south to north over the equator in the afternoon. Terra MODIS and Aqua MODIS are viewing the entire Earth's surface every 1 to 2 days, acquiring data in 36 spectral bands, or groups of wavelengths.
1. Load the data item “modis_terra_ne_sst_02jun04.img” into ArcGIS.
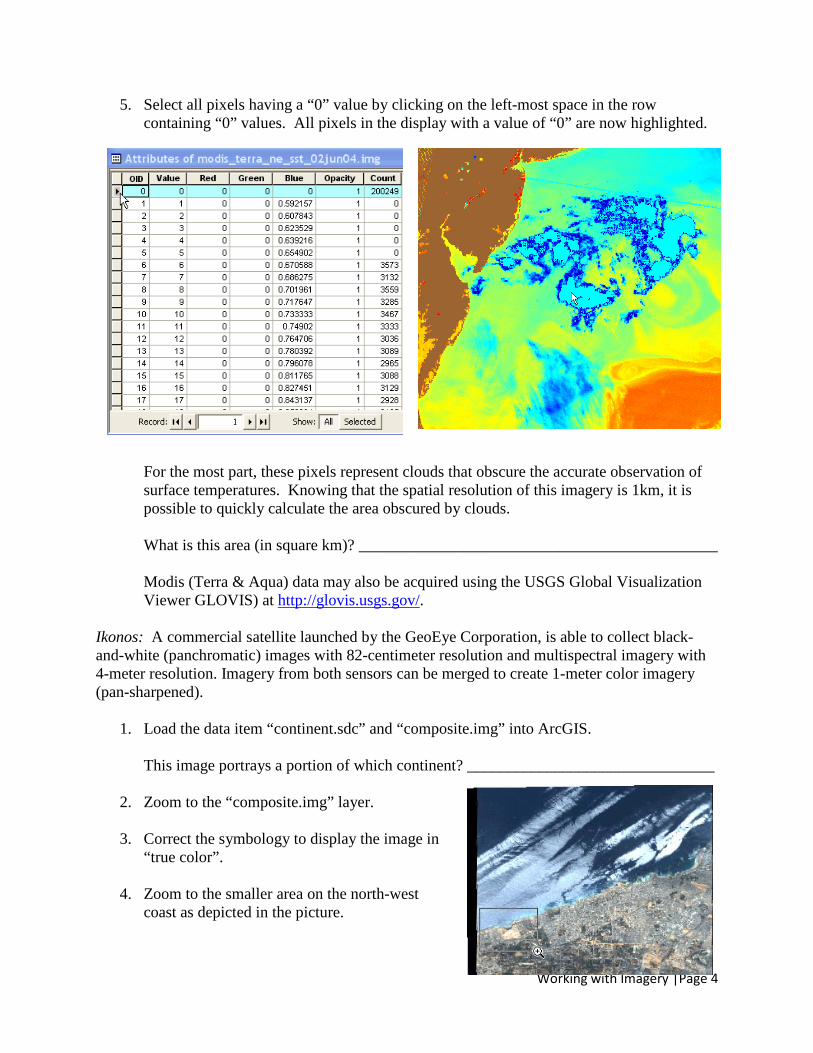
2. Right click on the image title in the table of contents and select “Properties”. Using the ‘Source’ tab, define the following parameters for this image: Spatial Resolution: _______________ (hint: you may also use the measure tool to verify the pixel size) Radiometric Resolution: ___________ Spectral Resolution (bands): ________ This image contains data from a single band of the MODIS sensor, designed to provide a measure of sea surface temperature (SST). Increasingly, sensors are being designed with spatial resolutions that vary with the spectral band(s) being recorded. In the case of MODIS, bands 1-2 have a 250m resolution, bands 3-7 have a 500m resolution, and 8-36 have a 1km resolution. More specifications for MODIS can be found at http://modis.gsfc.nasa.gov/about/specifications.php.
3. Which colors appear to symbolize warm waters and which cool waters? _______________________________________________________________________ What do you think the black areas represent? ___________________________________
4. Right click on the file name in the table of contents and select “Open Attribute Table”. You are presented with several columns of information. Let’s focus on two of these: Value and Count. Value is the digital number (DN) that representing the brightness of an individual pixel. Count is simply a numerical count of the number of pixels having a particular brightness value.
Working with Imagery |Page 4
5. Select all pixels having a “0” value by clicking on the left-most space in the row containing “0” values. All pixels in the display with a value of “0” are now highlighted.
For the most part, these pixels represent clouds that obscure the accurate observation of surface temperatures. Knowing that the spatial resolution of this imagery is 1km, it is possible to quickly calculate the area obscured by clouds. What is this area (in square km)? _____________________________________________ Modis (Terra & Aqua) data may also be acquired using the USGS Global Visualization Viewer GLOVIS) at http://glovis.usgs.gov/.
Ikonos: A commercial satellite launched by the GeoEye Corporation, is able to collect black-and-white (panchromatic) images with 82-centimeter resolution and multispectral imagery with 4-meter resolution. Imagery from both sensors can be merged to create 1-meter color imagery (pan-sharpened).
1. Load the data item “continent.sdc” and “composite.img” into ArcGIS. This image portrays a portion of which continent? _______________________________
2. Zoom to the “composite.img” layer.
3. Correct the symbology to display the image in “true color”.
4. Zoom to the smaller area on the north-west coast as depicted in the picture.
Working with Imagery |Page 5
5. Describe the following resolutions of the “composite” image: Spatial _____________ Spectral _______________ Radiometric __________________
6. “Composite.img” is, as the name implies, a composite “layer stack” of the red, green, and blue bands of Ikonos imagery. Normally, these data are rendered by GeoEye in unstacked format, requiring additional processing by the end user (more on this later). Now, let’s add the panchromatic band.
7. Load the data item “po_2620720_pan_0000000.tif” into ArcGIS.
8. Describe the following resolutions of the “po_2620720_pan_0000000.tif” image: Spatial _____________ Spectral _______________ Radiometric __________________
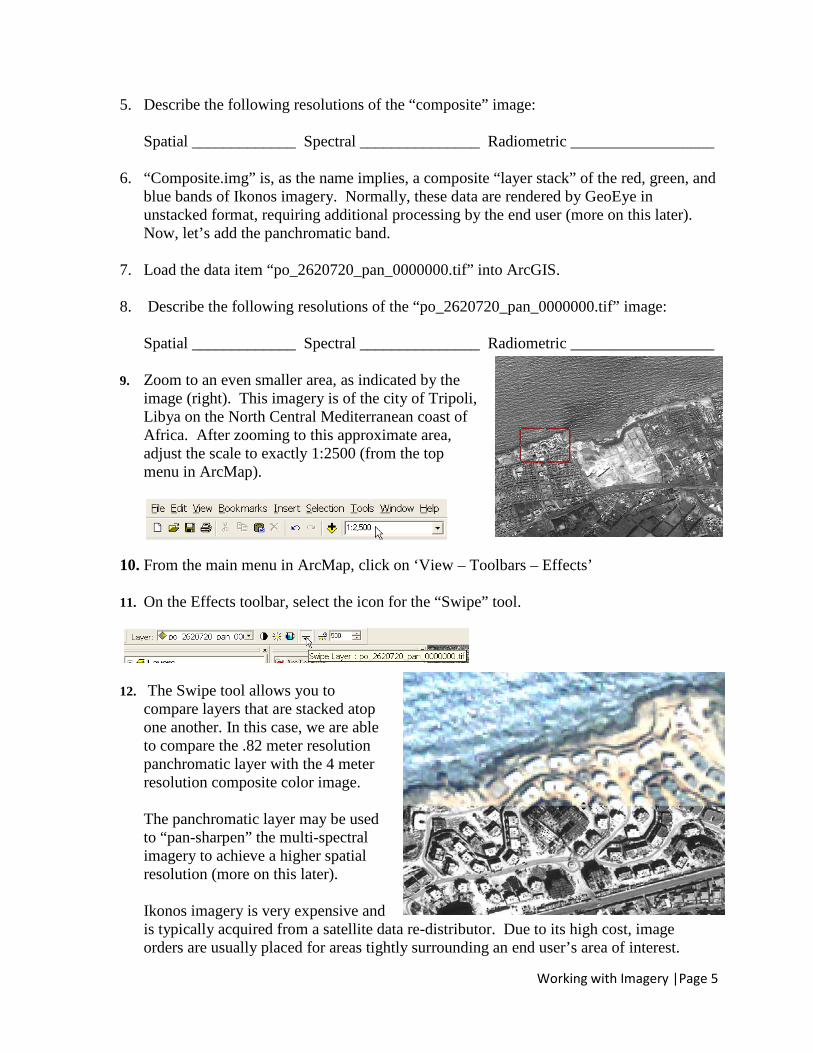
9. Zoom to an even smaller area, as indicated by the image (right). This imagery is of the city of Tripoli, Libya on the North Central Mediterranean coast of Africa. After zooming to this approximate area, adjust the scale to exactly 1:2500 (from the top menu in ArcMap).
10. From the main menu in ArcMap, click on ‘View – Toolbars – Effects’
11. On the Effects toolbar, select the icon for the “Swipe” tool.
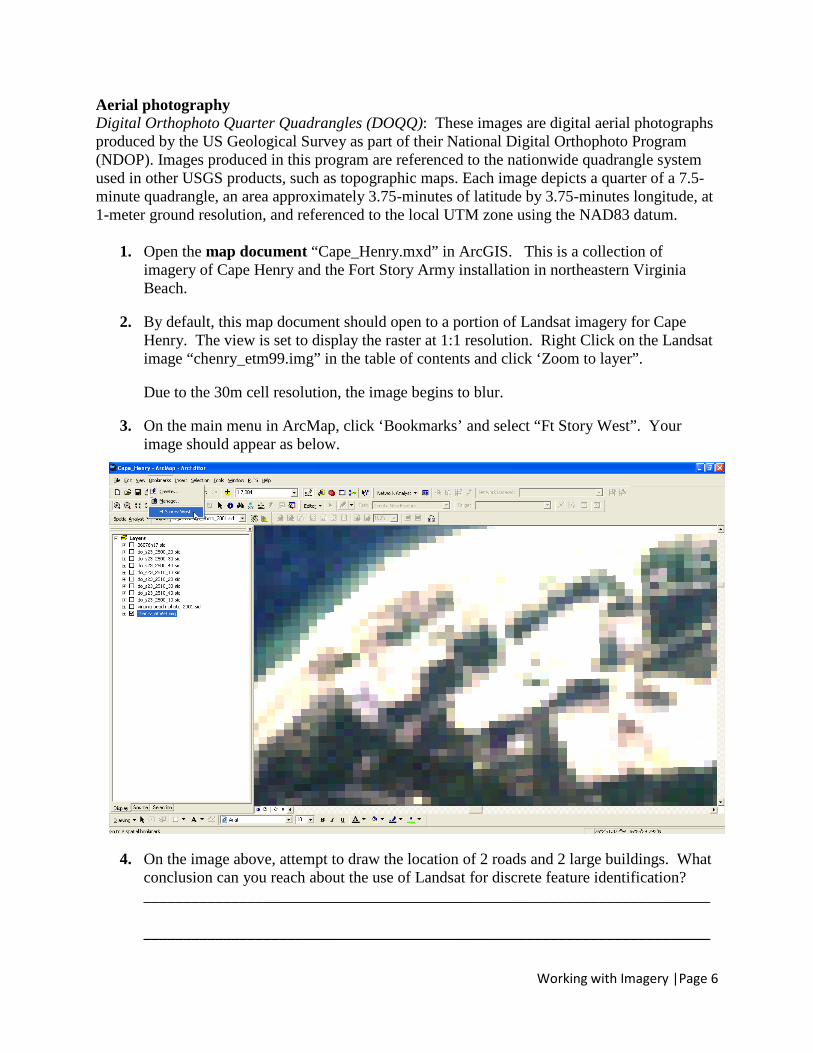
12. The Swipe tool allows you to compare layers that are stacked atop one another. In this case, we are able to compare the .82 meter resolution panchromatic layer with the 4 meter resolution composite color image. The panchromatic layer may be used to “pan-sharpen” the multi-spectral imagery to achieve a higher spatial resolution (more on this later). Ikonos imagery is very expensive and is typically acquired from a satellite data re-distributor. Due to its high cost, image orders are usually placed for areas tightly surrounding an end user’s area of interest.
Working with Imagery |Page 6
Aerial photography Digital Orthophoto Quarter Quadrangles (DOQQ): These images are digital aerial photographs produced by the US Geological Survey as part of their National Digital Orthophoto Program (NDOP). Images produced in this program are referenced to the nationwide quadrangle system used in other USGS products, such as topographic maps. Each image depicts a quarter of a 7.5-minute quadrangle, an area approximately 3.75-minutes of latitude by 3.75-minutes longitude, at 1-meter ground resolution, and referenced to the local UTM zone using the NAD83 datum.
1. Open the map document “Cape_Henry.mxd” in ArcGIS. This is a collection of imagery of Cape Henry and the Fort Story Army installation in northeastern Virginia Beach.
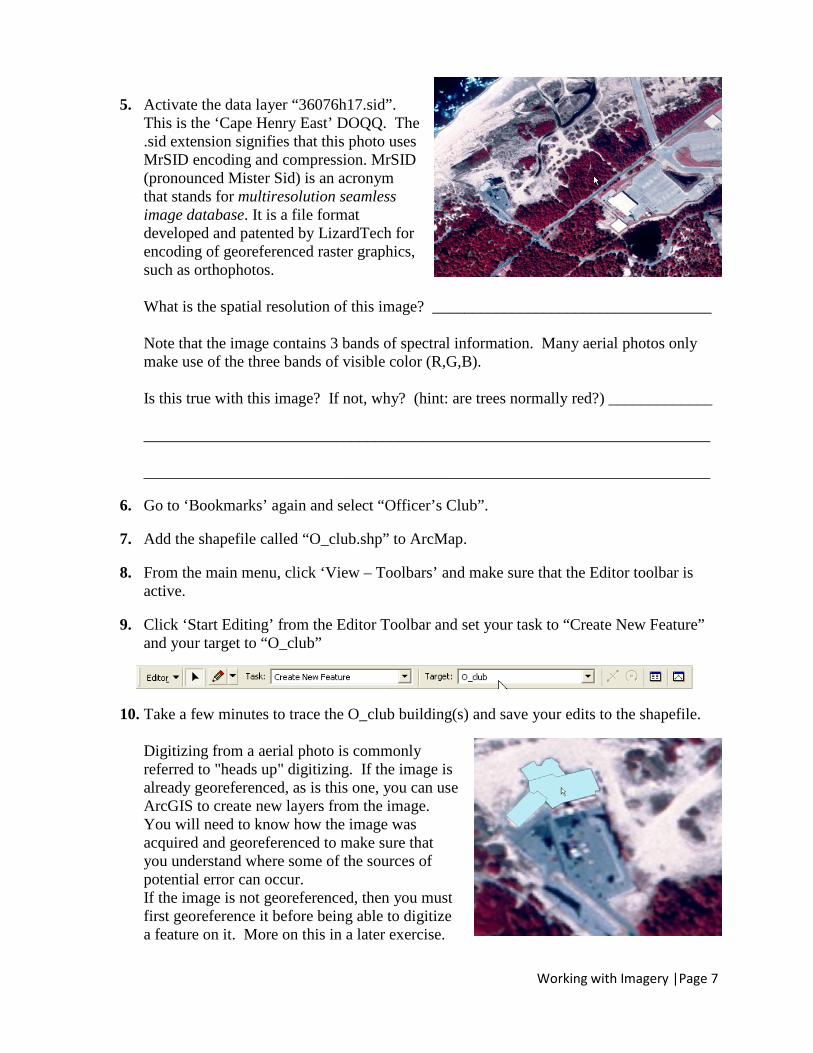
2. By default, this map document should open to a portion of Landsat imagery for Cape Henry. The view is set to display the raster at 1:1 resolution. Right Click on the Landsat image “chenry_etm99.img” in the table of contents and click ‘Zoom to layer”. Due to the 30m cell resolution, the image begins to blur.
3. On the main menu in ArcMap, click ‘Bookmarks’ and select “Ft Story West”. Your image should appear as below.
4. On the image above, attempt to draw the location of 2 roads and 2 large buildings. What
conclusion can you reach about the use of Landsat for discrete feature identification? _______________________________________________________________________ _______________________________________________________________________
Working with Imagery |Page 7
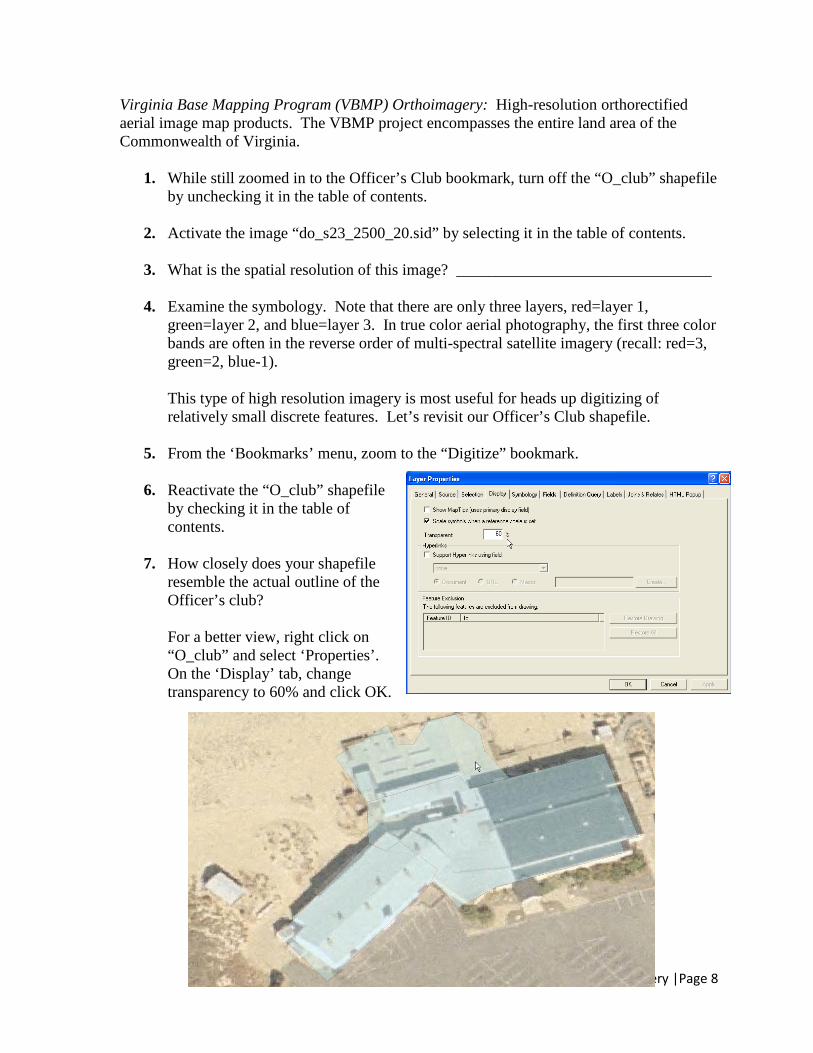
5. Activate the data layer “36076h17.sid”. This is the ‘Cape Henry East’ DOQQ. The .sid extension signifies that this photo uses MrSID encoding and compression. MrSID (pronounced Mister Sid) is an acronym that stands for multiresolution seamless image database. It is a file format developed and patented by LizardTech for encoding of georeferenced raster graphics, such as orthophotos. What is the spatial resolution of this image? ___________________________________ Note that the image contains 3 bands of spectral information. Many aerial photos only make use of the three bands of visible color (R,G,B). Is this true with this image? If not, why? (hint: are trees normally red?) _____________ _______________________________________________________________________ _______________________________________________________________________
6. Go to ‘Bookmarks’ again and select “Officer’s Club”.
7. Add the shapefile called “O_club.shp” to ArcMap.
8. From the main menu, click ‘View – Toolbars’ and make sure that the Editor toolbar is active.
9. Click ‘Start Editing’ from the Editor Toolbar and set your task to “Create New Feature” and your target to “O_club”
10. Take a few minutes to trace the O_club building(s) and save your edits to the shapefile.
Digitizing from a aerial photo is commonly referred to "heads up" digitizing. If the image is already georeferenced, as is this one, you can use ArcGIS to create new layers from the image. You will need to know how the image was acquired and georeferenced to make sure that you understand where some of the sources of potential error can occur. If the image is not georeferenced, then you must first georeference it before being able to digitize a feature on it. More on this in a later exercise.
Working with Imagery |Page 8
Virginia Base Mapping Program (VBMP) Orthoimagery: High-resolution orthorectified aerial image map products. The VBMP project encompasses the entire land area of the Commonwealth of Virginia.
1. While still zoomed in to the Officer’s Club bookmark, turn off the “O_club” shapefile by unchecking it in the table of contents.
2. Activate the image “do_s23_2500_20.sid” by selecting it in the table of contents.
3. What is the spatial resolution of this image? ________________________________
4. Examine the symbology. Note that there are only three layers, red=layer 1, green=layer 2, and blue=layer 3. In true color aerial photography, the first three color bands are often in the reverse order of multi-spectral satellite imagery (recall: red=3, green=2, blue-1). This type of high resolution imagery is most useful for heads up digitizing of relatively small discrete features. Let’s revisit our Officer’s Club shapefile.
5. From the ‘Bookmarks’ menu, zoom to the “Digitize” bookmark.
6. Reactivate the “O_club” shapefile by checking it in the table of contents.
7. How closely does your shapefile resemble the actual outline of the Officer’s club? For a better view, right click on “O_club” and select ‘Properties’. On the ‘Display’ tab, change transparency to 60% and click OK.

Working with Imagery |Page 9
8. Let’s make corrections to your “O_club” shapefile. Click ‘Start Editing’ from the Editor Toolbar and set your task to “Modify Feature” and your target to “O_club”, then click on the Edit tool.
9. Click somewhere on the boundary of your sketch. You can now drag vertices to new
positions to more closely conform to the actual shape of the building(s).
10. You may also right click anywhere on the boundary of your sketch and select ‘Insert
Vertex’. This will allow you to add vertices as needed to complete your shape. Finish editing by clicking anywhere outside of your sketch. Save your edits.
DOQQ imagery can be obtained from many different online locations. Data for Virginia can be found at The Virginia Gazetter offered online by the UVA Library at: http://www.lib.virginia.edu/scholarslab/resources/gis/vagaz/index.html A map showing all Virginia quadrangles by name can be found at: http://www.lib.virginia.edu/scholarslab/resources/gis/vagaz/24knames.pdf Information of how to obtain VBMP imagery can be found at the Virginia Information Technologies Agency (VITA) website: http://www.vita.virginia.gov/isp/default.aspx?id=8412
Working with Imagery |Page 10
Appendix 1