
Working Together to Improve Birth Outcomes in North …€¦ · · 2012-03-23Working Together to...
51
Belinda Pettiford, MPH NC Division of Public Health, Women’s Health Branch Sarah Verbiest, DrPH, MSW, MPH University of NC at Chapel Hill, Center for Maternal and Infant Health Working Together to Improve Birth Outcomes in North Carolina
Transcript of Working Together to Improve Birth Outcomes in North …€¦ · · 2012-03-23Working Together to...
B e l i n d a P e t t i f o r d , M P H
N C D i v i s i o n o f P u b l i c H e a l t h , W o m e n ’ s H e a l t h B r a n c h
S a r a h V e r b i e s t , D r P H , M S W , M P H
U n i v e r s i t y o f N C a t C h a p e l H i l l , C e n t e r f o r M a t e r n a l a n d I n f a n t H e a l t h
Working Together to Improve Birth Outcomes in North
Carolina
Acknowledgements
Carol Brady, NE Florida Healthy Start Association
Dr. Michael Lu, HRSA, MCH Bureau
Christine “Kiko” Malin, Alameda County Health Dept.
Many partners across North Carolina
Objectives
Describe the problem of infant mortality and its impact.
Discuss an emerging approach to thinking about the prevention of infant death and illness.
Share ideas about what we might do together to address this issue.
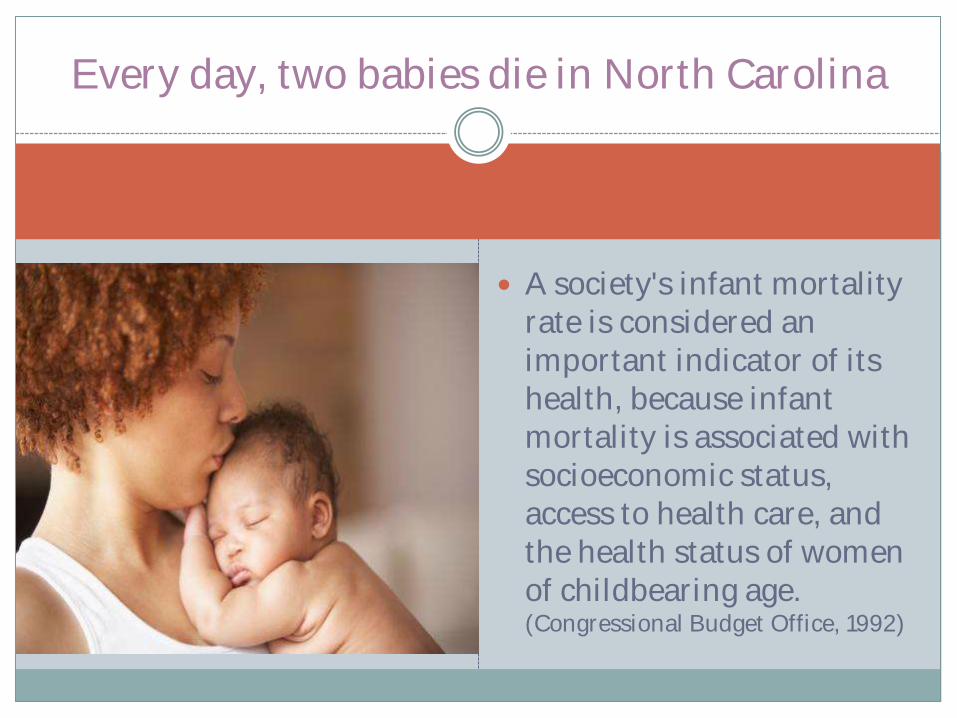
A society's infant mortality rate is considered an important indicator of its health, because infant mortality is associated with socioeconomic status, access to health care, and the health status of women of childbearing age. (Congressional Budget Office, 1992)
Every day, two babies die in North Carolina
41st in the world – really?!
Twenty years ago, the US was doing better than countries such as Cuba, Poland and Estonia in keeping newborn babies alive. As other nations improved this key indicator of women's and infants' health, the U.S. lagged, dropping to 41st worldwide.
The highest newborn death rate in the world is in Afghanistan, where one of every 19 babies dies. In the US, one of every 233 newborns dies. In Japan (1:909), France (1:455), Lithuania (1:385) or Cuba (1:345).
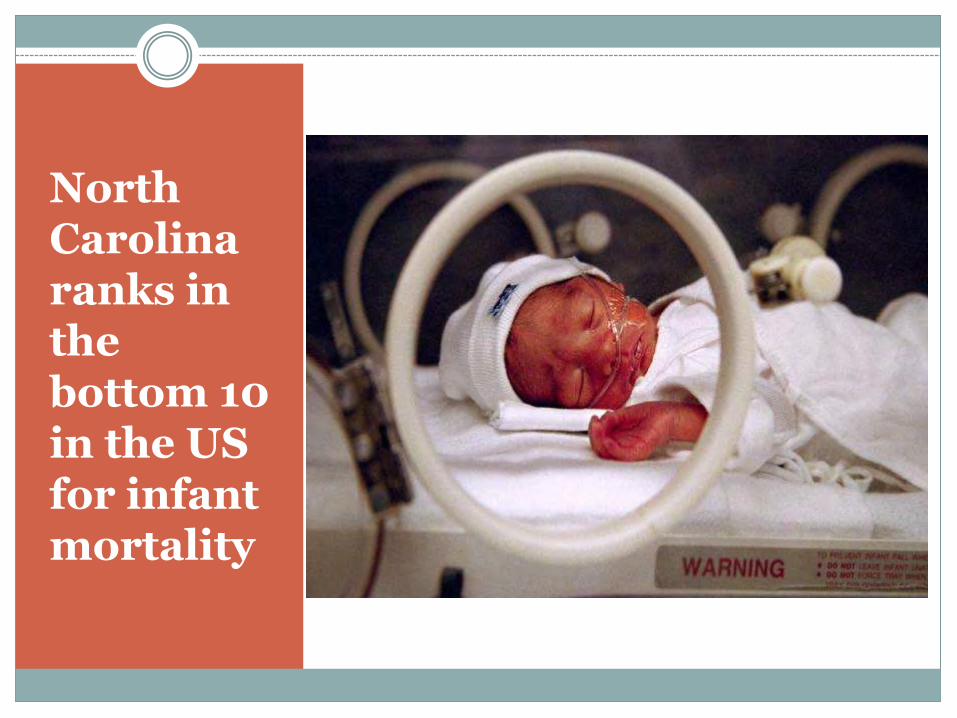
North Carolina ranks in the bottom 10 in the US for infant mortality
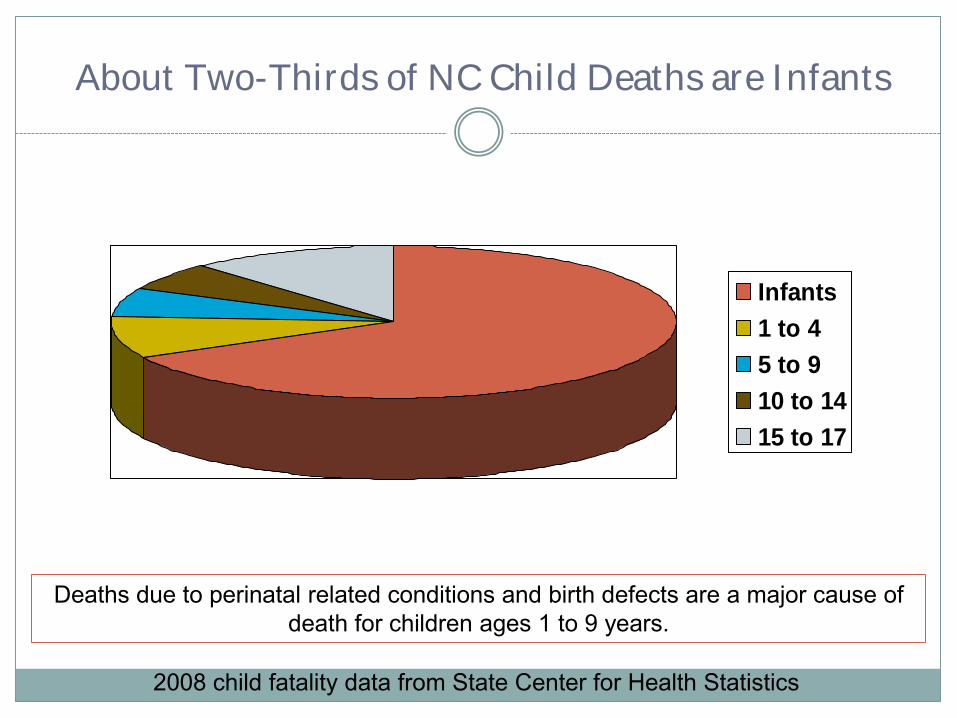
About Two-Thirds of NC Child Deaths are Infants
Infants
1 to 4
5 to 9
10 to 14
15 to 17
2008 child fatality data from State Center for Health Statistics
Deaths due to perinatal related conditions and birth defects are a major cause of death for children ages 1 to 9 years.
Data
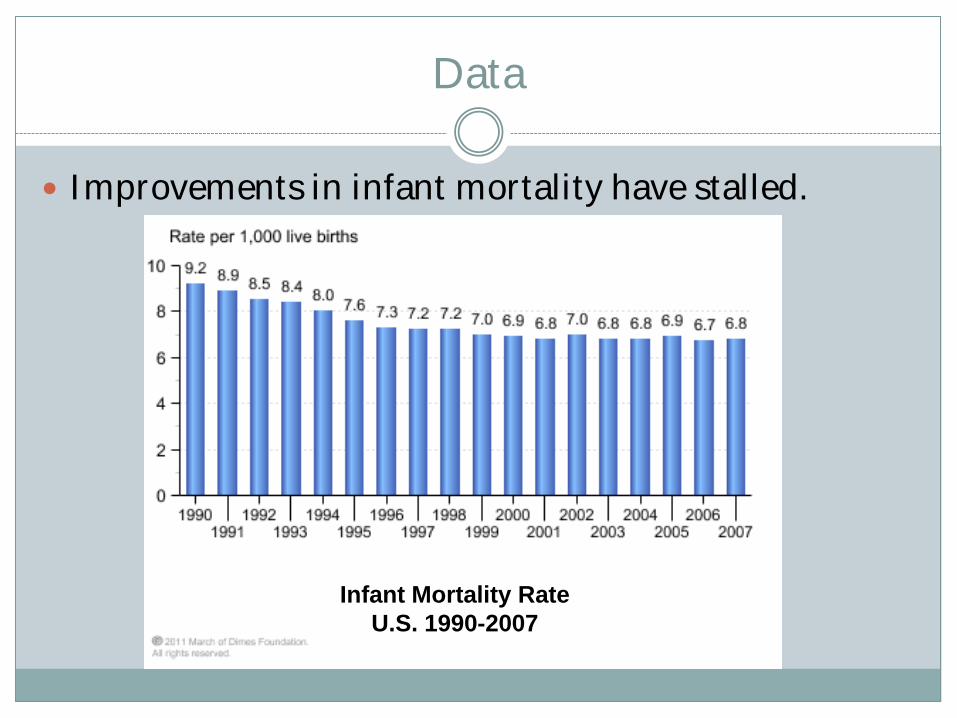
Improvements in infant mortality have stalled.
Infant Mortality, U.S.
1990-2007
Infant Mortality Rate
U.S. 1990-2007
Data
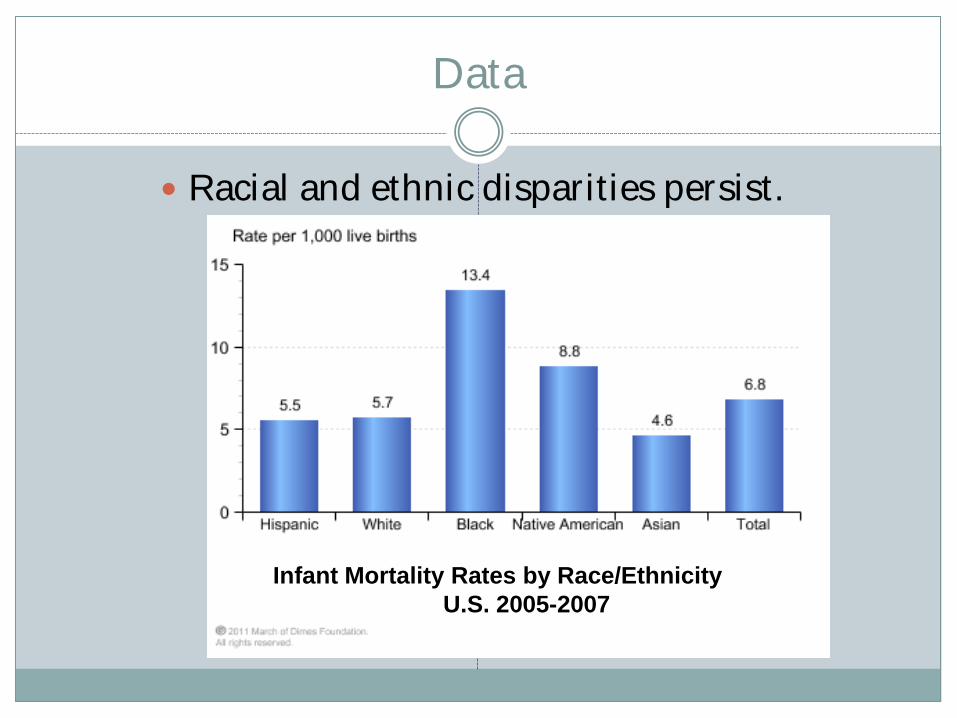
Racial and ethnic disparities persist.
Infant Mortality Rates by Race/Ethnicity
U.S. 2005-2007
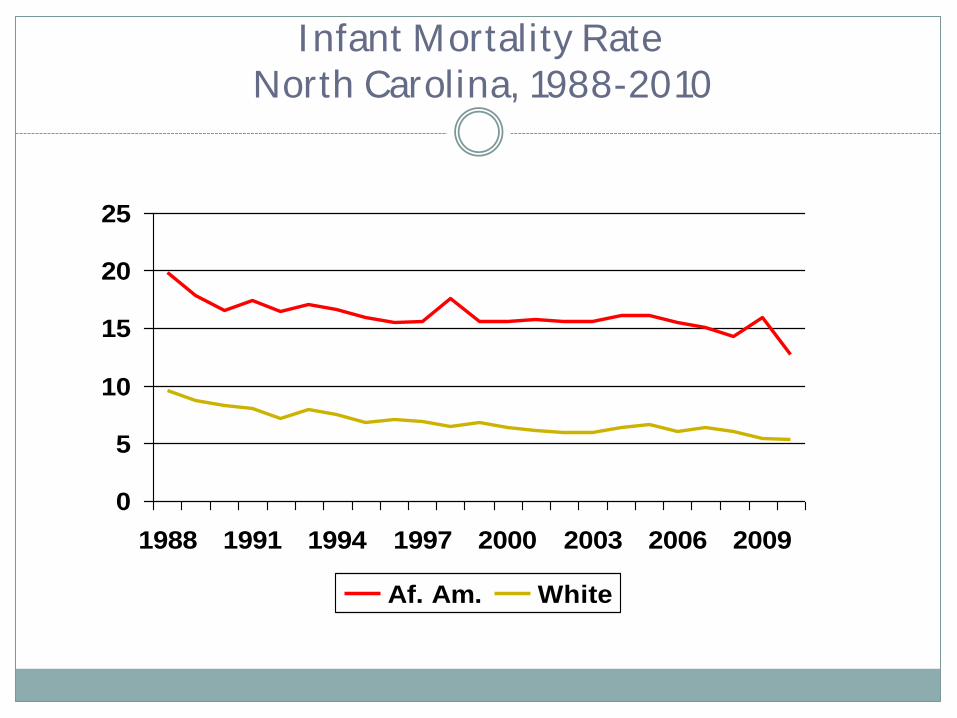
Infant Mortality Rate
North Carolina, 1988-2010
0
5
10
15
20
25
1988 1991 1994 1997 2000 2003 2006 2009
Af. Am. White
Data Review
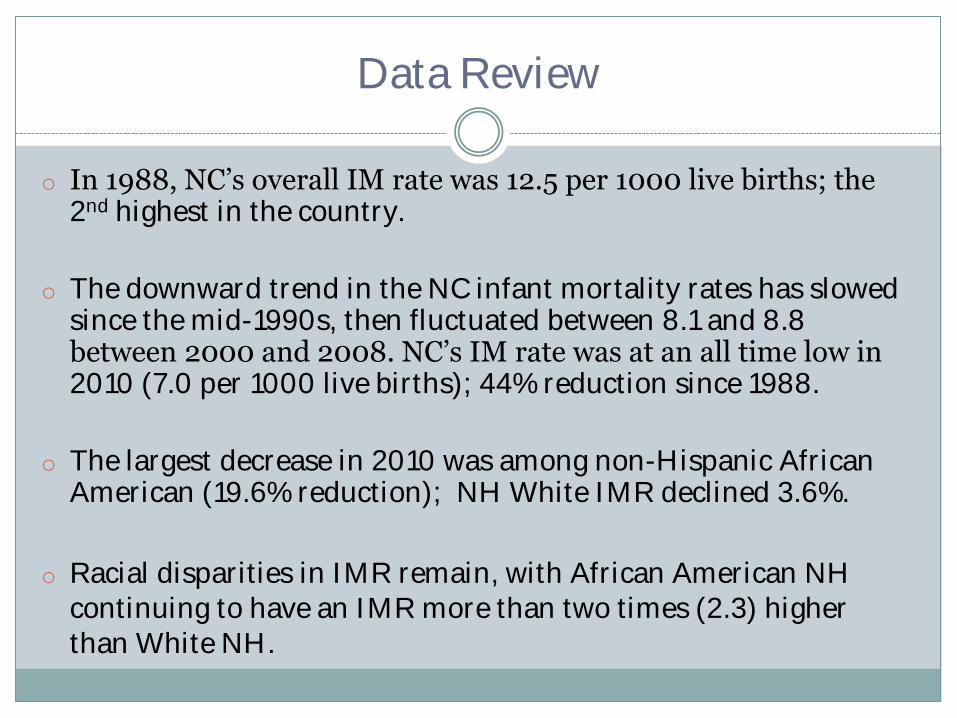
o In 1988, NC’s overall IM rate was 12.5 per 1000 live births; the 2nd highest in the country.
o The downward trend in the NC infant mortality rates has slowed since the mid-1990s, then fluctuated between 8.1 and 8.8 between 2000 and 2008. NC’s IM rate was at an all time low in 2010 (7.0 per 1000 live births); 44% reduction since 1988.
o The largest decrease in 2010 was among non-Hispanic African American (19.6% reduction); NH White IMR declined 3.6%.
o Racial disparities in IMR remain, with African American NH continuing to have an IMR more than two times (2.3) higher than White NH.
Data Review
The percentage of infants delivered very low birthweight (less than 1500 grams) remained about the same in 2010 (1.7% compared to 1.8% in 2009).
However, NH African American women experience markedly higher rates of low and very low birthweight births (14.1%) than did NH White (7.8%) and Hispanics (6.3%).
In 2010, more than one in ten (12.6%) of all resident births were premature (less than 37 weeks gestation). Almost 1:7 African American babies are born early.
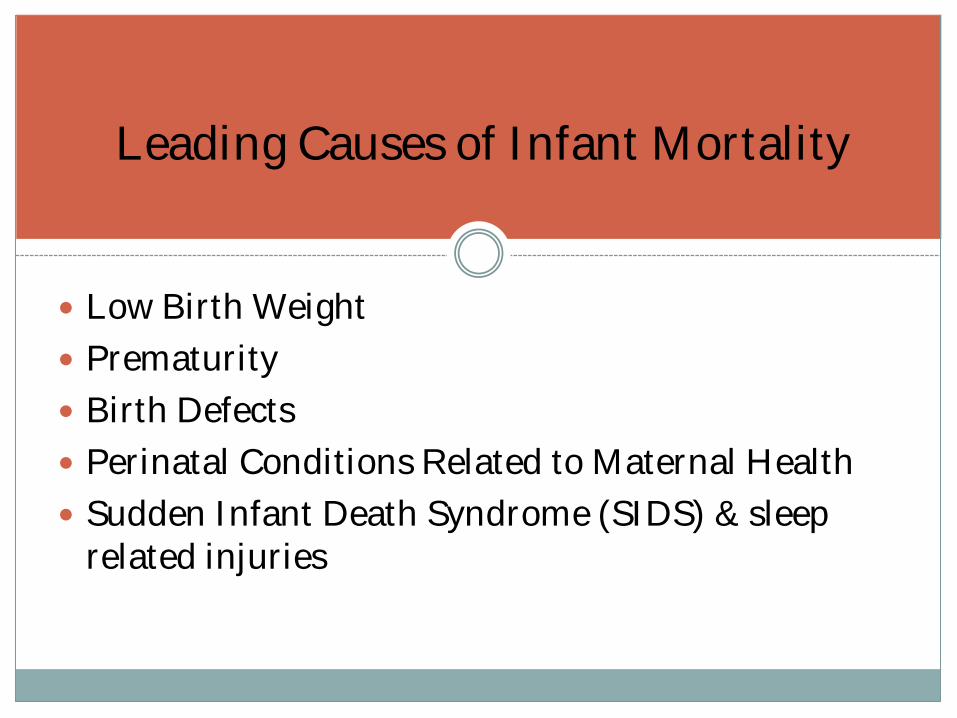
Leading Causes of Infant Mortality
Low Birth Weight
Prematurity
Birth Defects
Perinatal Conditions Related to Maternal Health
Sudden Infant Death Syndrome (SIDS) & sleep related injuries
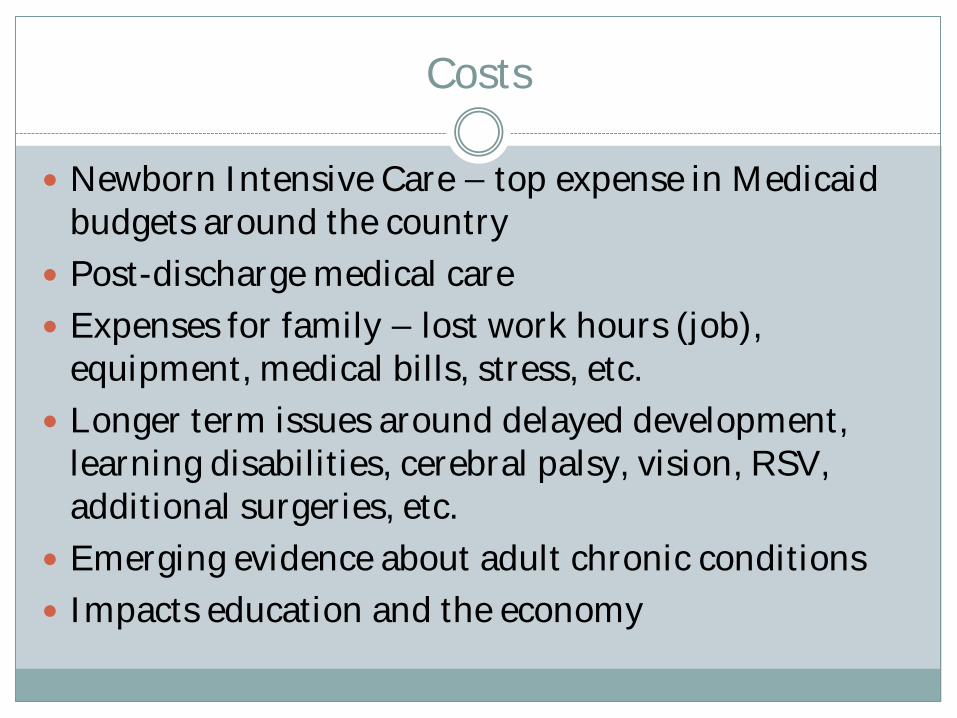
Costs
Newborn Intensive Care – top expense in Medicaid budgets around the country
Post-discharge medical care
Expenses for family – lost work hours (job), equipment, medical bills, stress, etc.
Longer term issues around delayed development, learning disabilities, cerebral palsy, vision, RSV, additional surgeries, etc.
Emerging evidence about adult chronic conditions
Impacts education and the economy
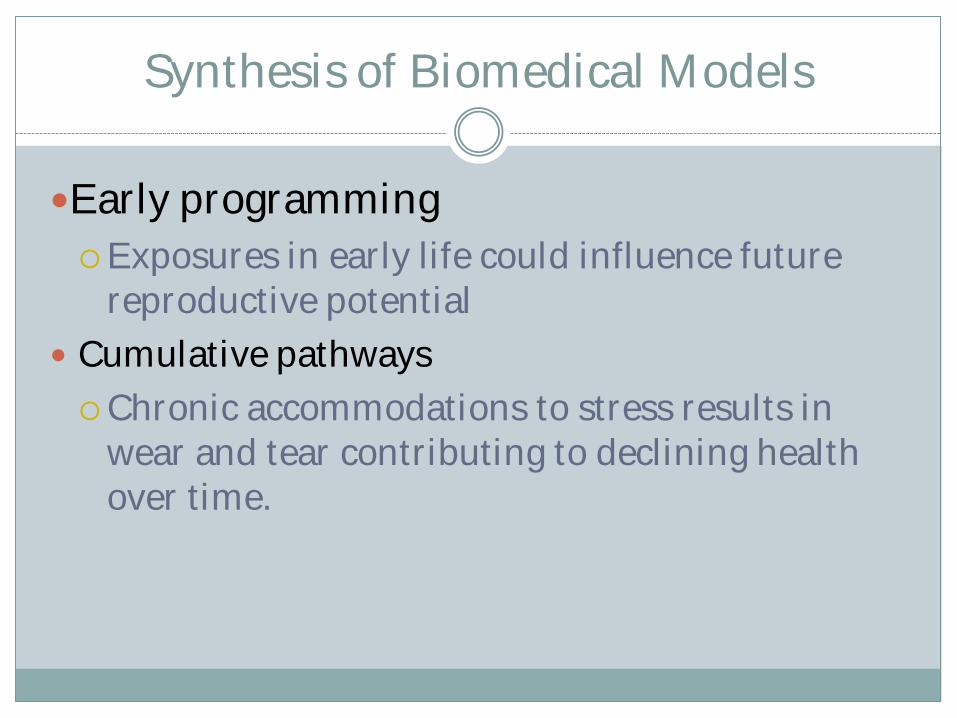
Synthesis of Biomedical Models
Early programming
Exposures in early life could influence future reproductive potential
Cumulative pathways
Chronic accommodations to stress results in wear and tear contributing to declining health over time.
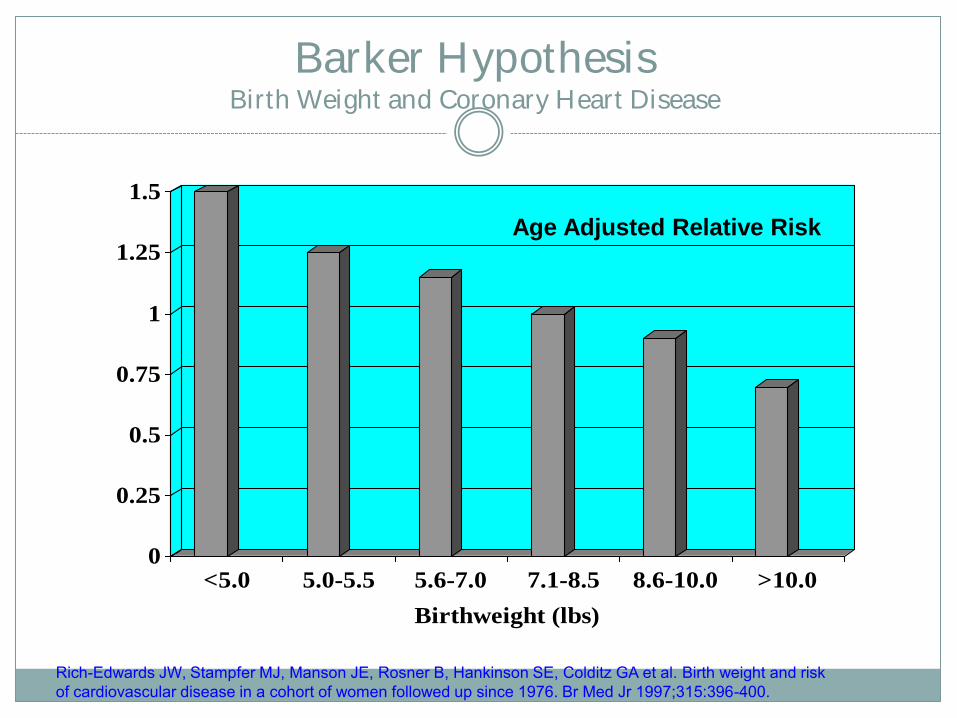
Barker Hypothesis Birth Weight and Coronary Heart Disease
0
0.25
0.5
0.75
1
1.25
1.5
<5.0 5.0-5.5 5.6-7.0 7.1-8.5 8.6-10.0 >10.0
Birthweight (lbs)
Age Adjusted Relative Risk
Rich-Edwards JW, Stampfer MJ, Manson JE, Rosner B, Hankinson SE, Colditz GA et al. Birth weight and risk of cardiovascular disease in a cohort of women followed up since 1976. Br Med Jr 1997;315:396-400.
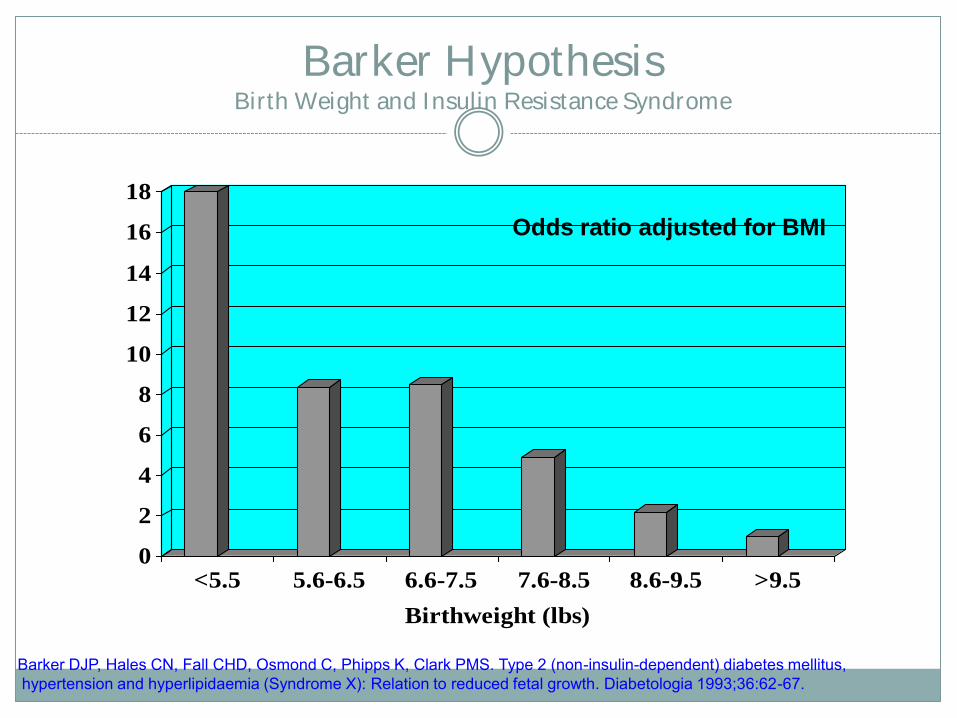
Barker Hypothesis Birth Weight and Insulin Resistance Syndrome
0
2
4
6
8
10
12
14
16
18
<5.5 5.6-6.5 6.6-7.5 7.6-8.5 8.6-9.5 >9.5
Birthweight (lbs)
Odds ratio adjusted for BMI
Barker DJP, Hales CN, Fall CHD, Osmond C, Phipps K, Clark PMS. Type 2 (non-insulin-dependent) diabetes mellitus, hypertension and hyperlipidaemia (Syndrome X): Relation to reduced fetal growth. Diabetologia 1993;36:62-67.
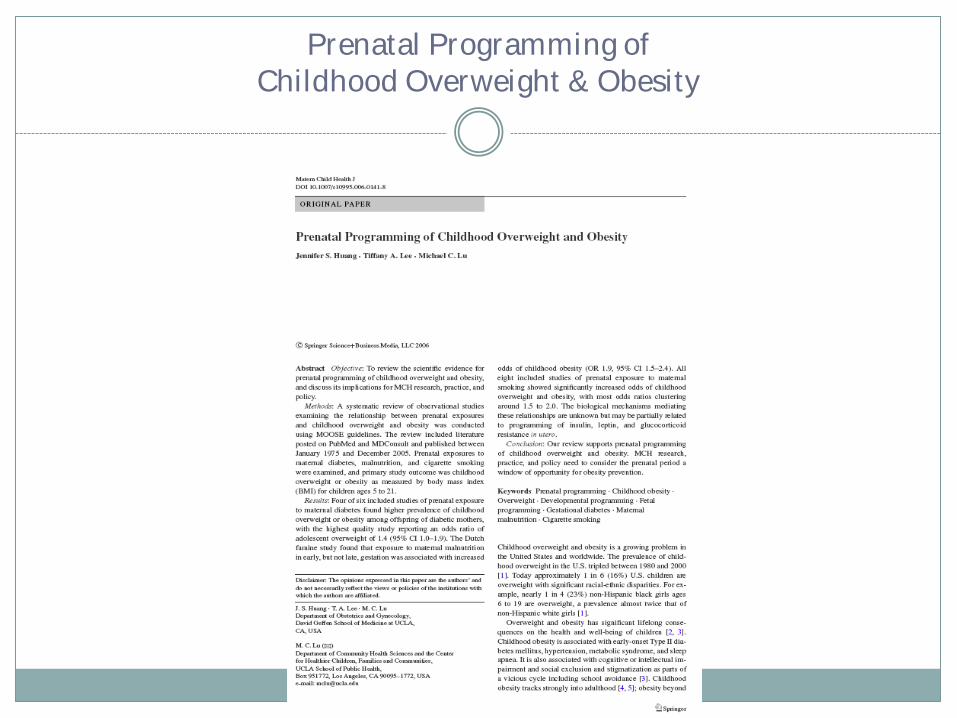
Prenatal Programming of Childhood Overweight & Obesity
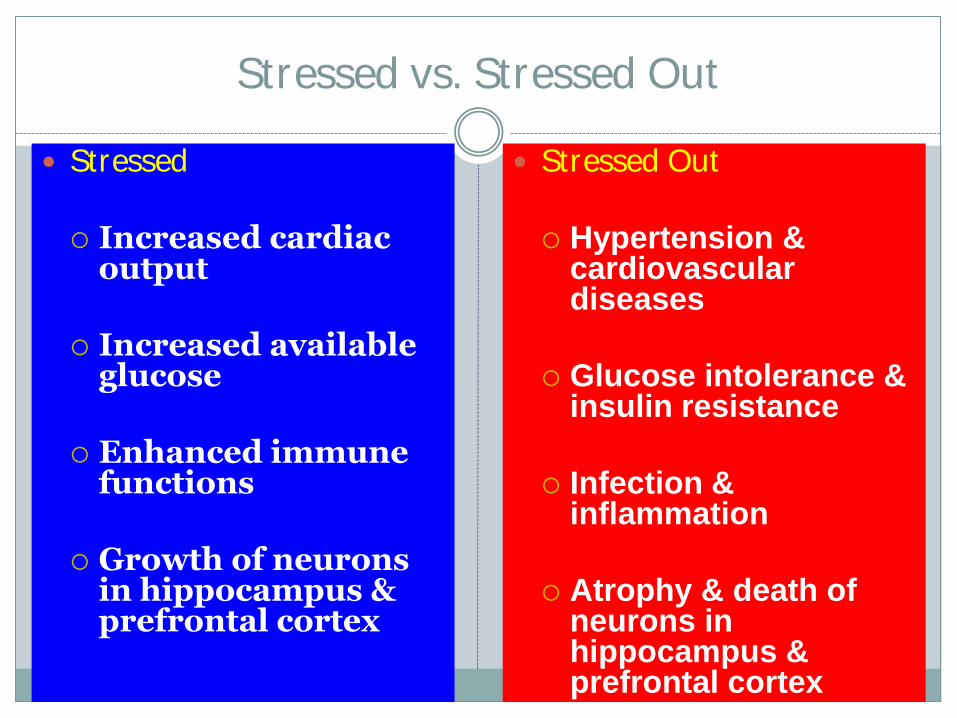
Stressed vs. Stressed Out
Stressed Increased cardiac
output Increased available
glucose Enhanced immune
functions Growth of neurons
in hippocampus & prefrontal cortex
Stressed Out Hypertension &
cardiovascular diseases
Glucose intolerance & insulin resistance
Infection & inflammation
Atrophy & death of neurons in hippocampus & prefrontal cortex
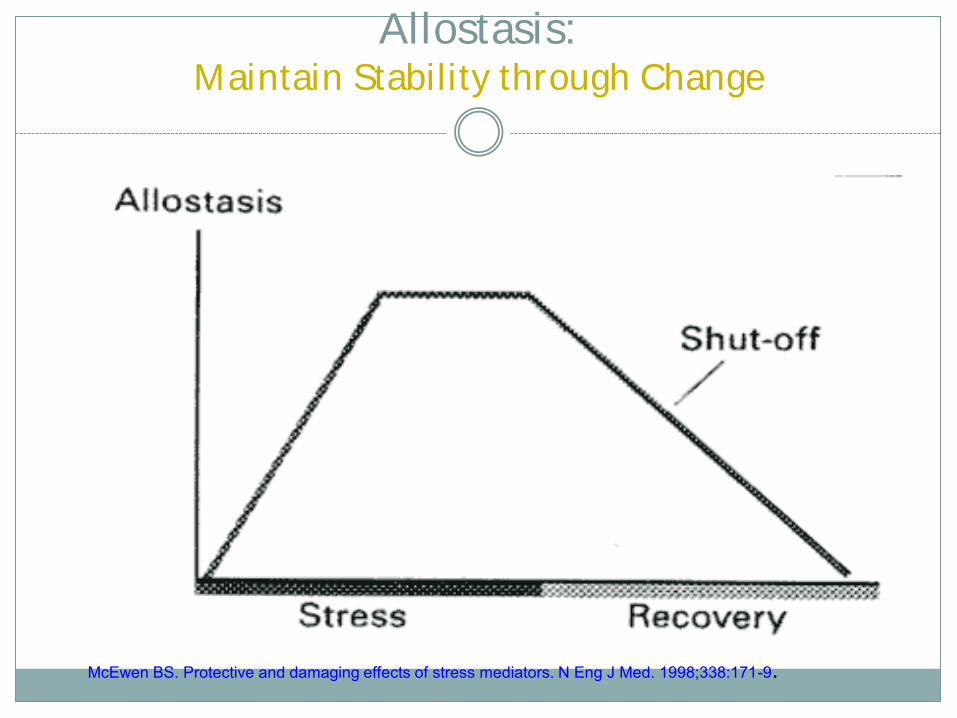
Allostasis: Maintain Stability through Change
McEwen BS. Protective and damaging effects of stress mediators. N Eng J Med. 1998;338:171-9.
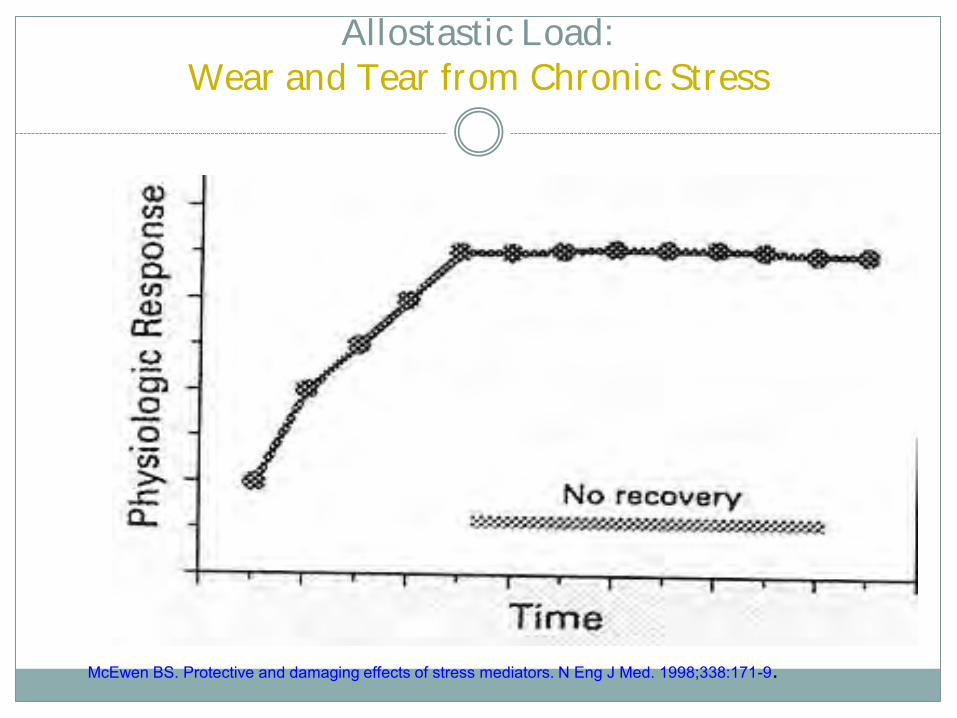
Allostastic Load: Wear and Tear from Chronic Stress
McEwen BS. Protective and damaging effects of stress mediators. N Eng J Med. 1998;338:171-9.
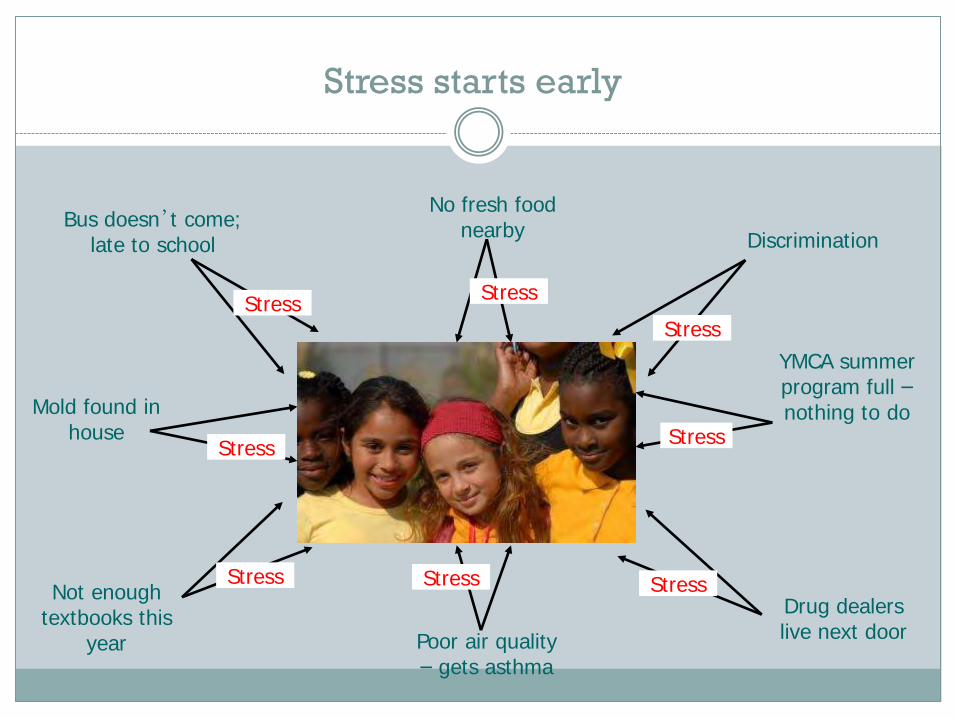
Bus doesn’t come; late to school
Mold found in house
Discrimination
YMCA summer program full – nothing to do
Drug dealers live next door Poor air quality
– gets asthma
Not enough textbooks this
year
Stress starts early
No fresh food nearby
Stress Stress Stress
Stress
Stress
Stress Stress
Stress
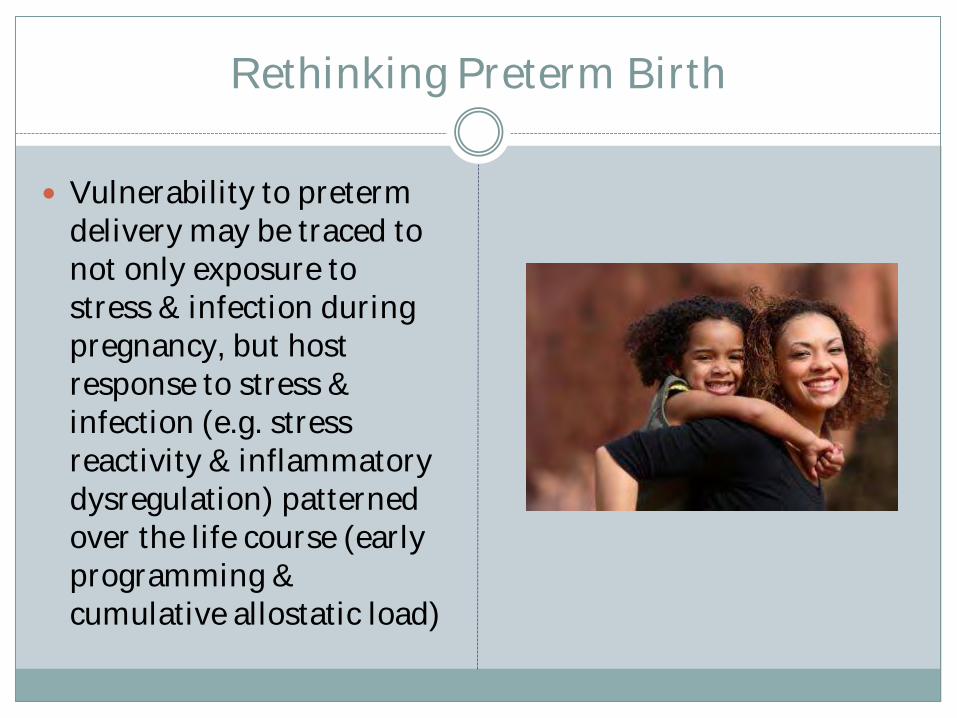
Rethinking Preterm Birth
Vulnerability to preterm delivery may be traced to not only exposure to stress & infection during pregnancy, but host response to stress & infection (e.g. stress reactivity & inflammatory dysregulation) patterned over the life course (early programming & cumulative allostatic load)
The Life Course Approach
Life Course Perspective
Approach suggests a complex interplay of biological, behavioral, psychological and social protective factors contributes to health outcomes across the span of a person’s life.
Factors impact racial, ethnic groups differently and may explain disparities despite equal access to care during pregnancy.
Life course models BROADENS the focus of MCH to include both health & social equity
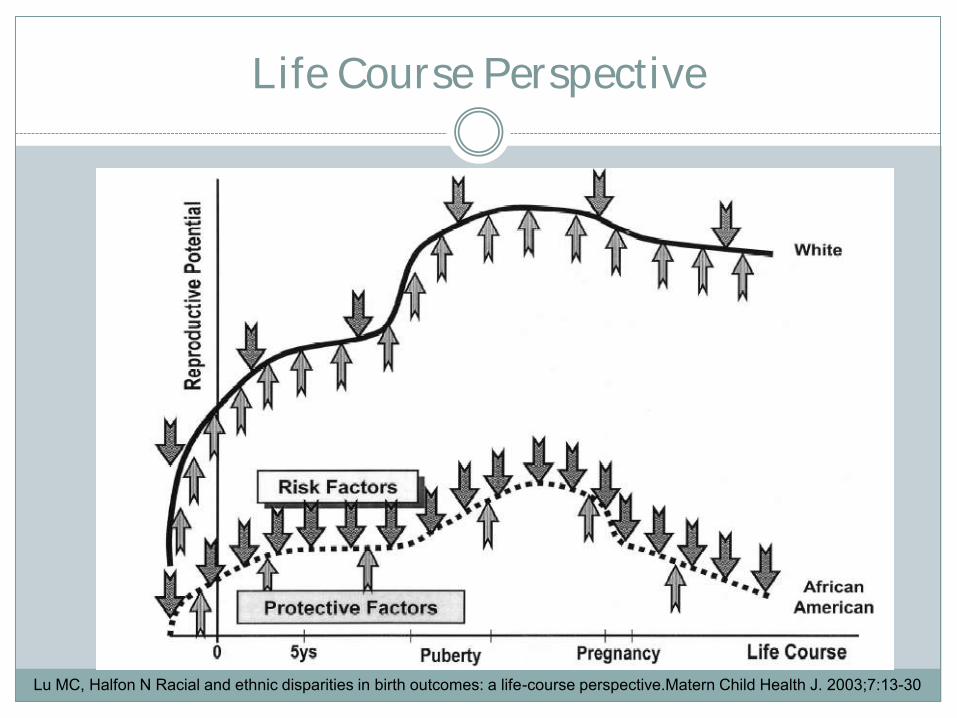
Life Course Perspective
Lu MC, Halfon N Racial and ethnic disparities in birth outcomes: a life-course perspective.Matern Child Health J. 2003;7:13-30
Life Course Perspective
Rather than focusing on risks, behaviors & services during pregnancy, CUMULATIVE effects of health, life events are examined.
Health & socioeconomic status of one generation directly affects the health status --- and REPRODUCTIVE HEALTH CAPITAL – of the next one.
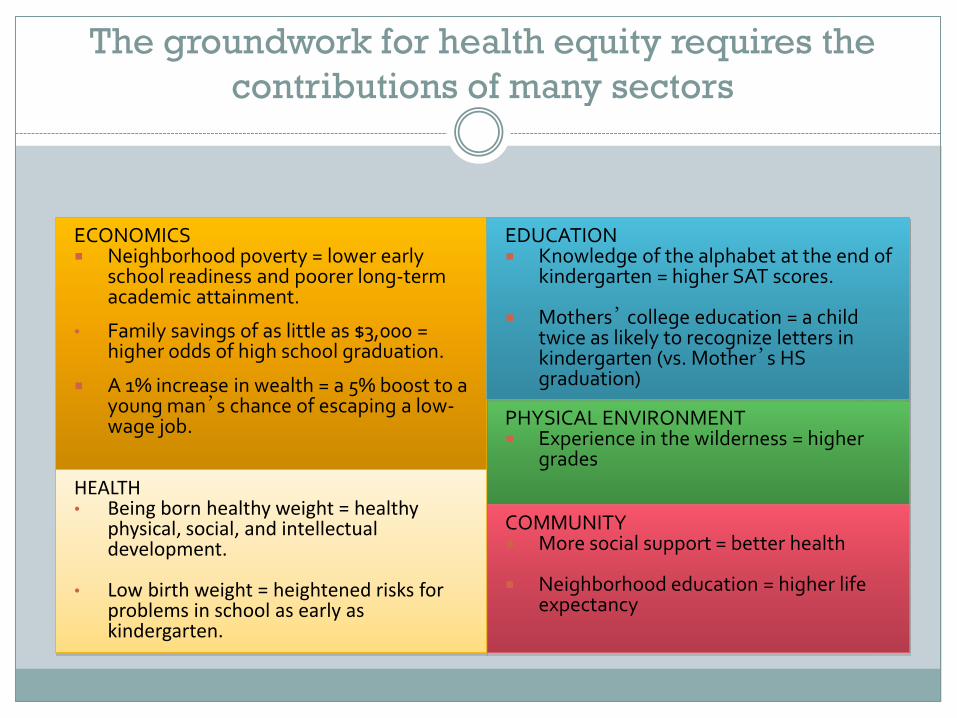
The groundwork for health equity requires the
contributions of many sectors
PHYSICAL ENVIRONMENT Experience in the wilderness = higher
grades
ECONOMICS Neighborhood poverty = lower early
school readiness and poorer long-term academic attainment.
• Family savings of as little as $3,000 = higher odds of high school graduation.
A 1% increase in wealth = a 5% boost to a young man’s chance of escaping a low-wage job.
EDUCATION Knowledge of the alphabet at the end of
kindergarten = higher SAT scores.
Mothers’ college education = a child
twice as likely to recognize letters in kindergarten (vs. Mother’s HS graduation)
COMMUNITY More social support = better health
Neighborhood education = higher life
expectancy
HEALTH • Being born healthy weight = healthy
physical, social, and intellectual development.
• Low birth weight = heightened risks for problems in school as early as kindergarten.
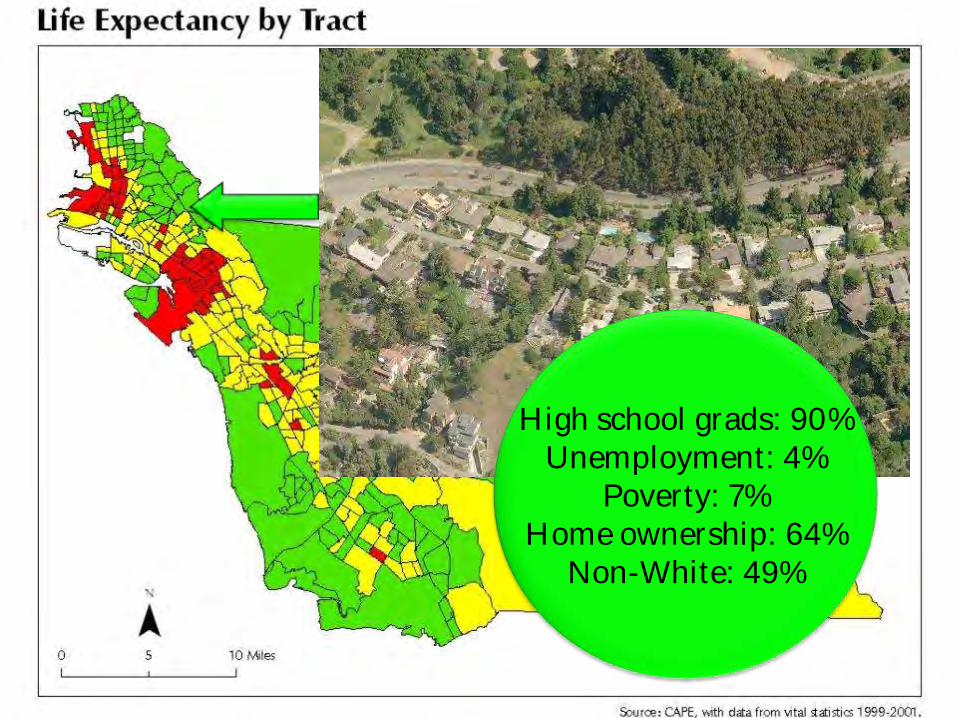
High school grads: 90% Unemployment: 4%
Poverty: 7% Home ownership: 64%
Non-White: 49%
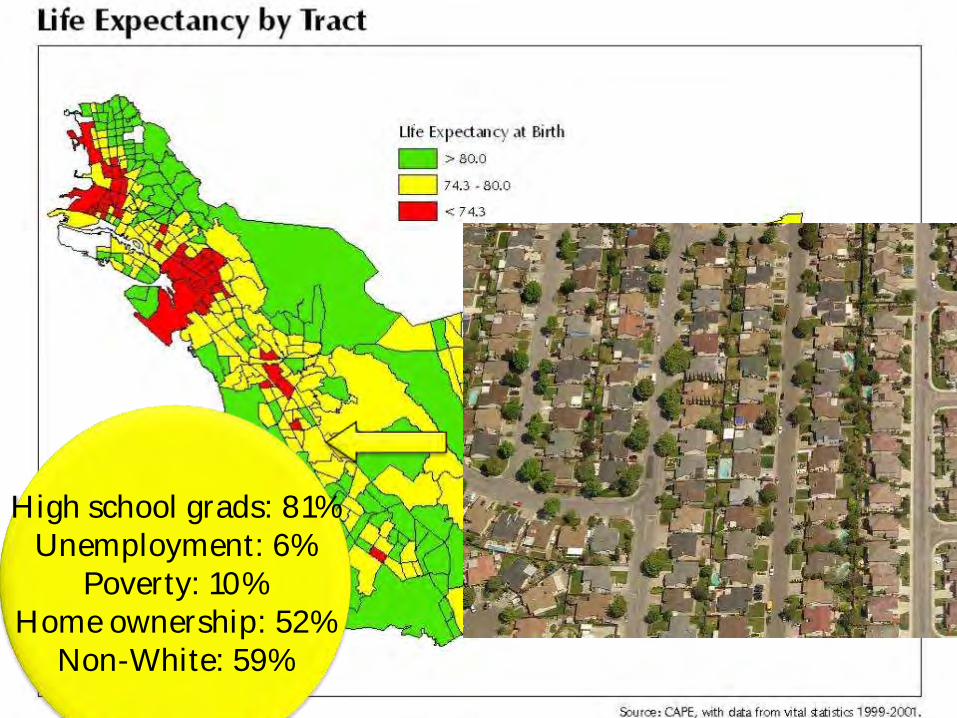
High school grads: 81% Unemployment: 6%
Poverty: 10% Home ownership: 52%
Non-White: 59%
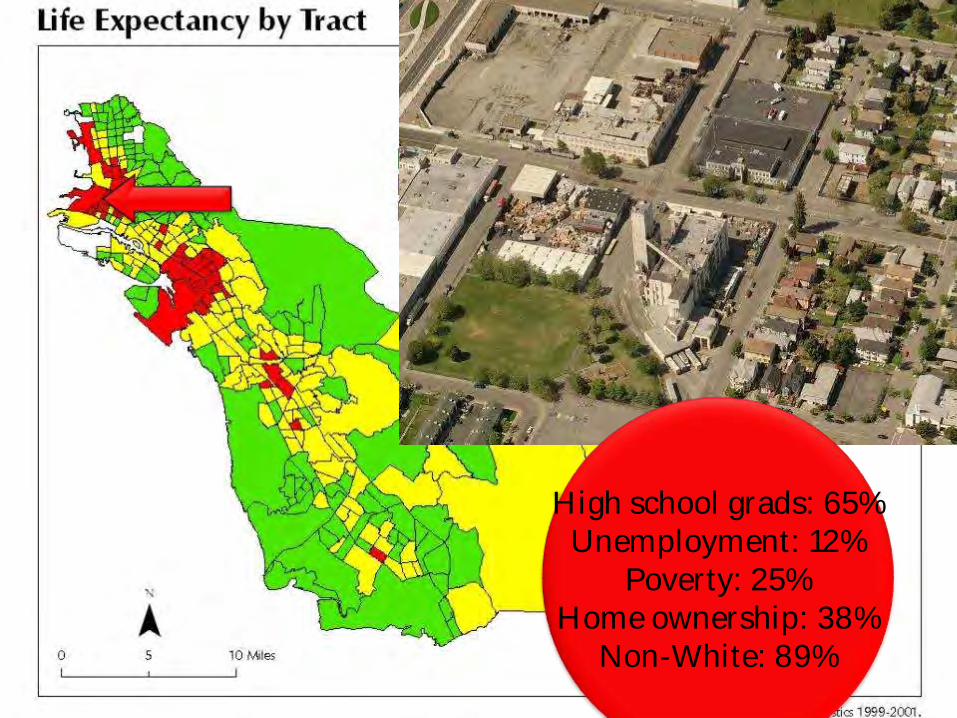
High school grads: 65% Unemployment: 12%
Poverty: 25% Home ownership: 38%
Non-White: 89%
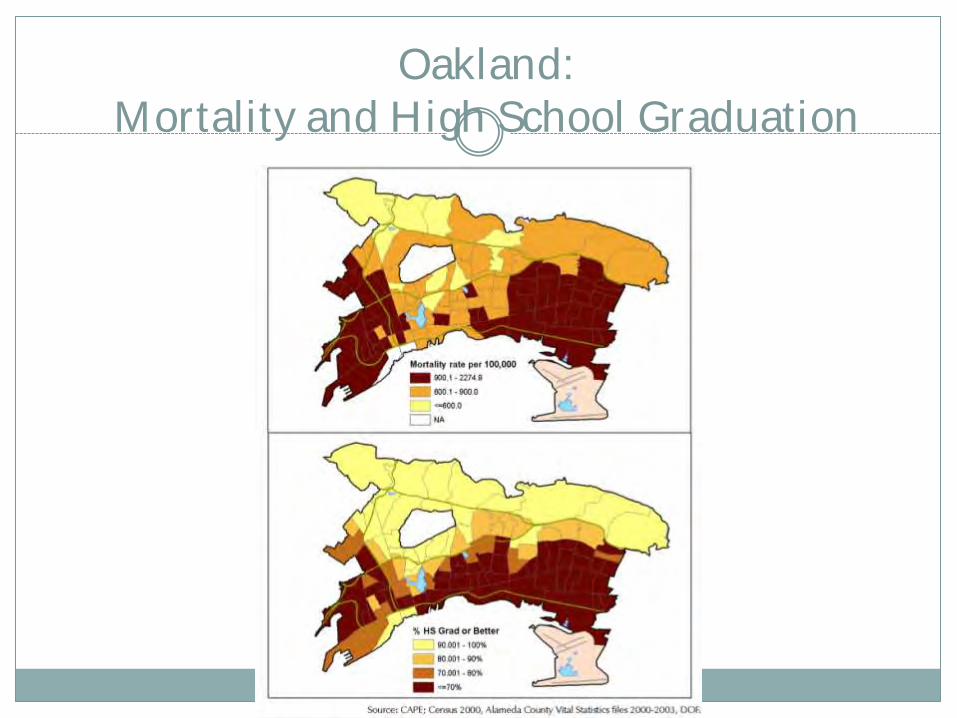
Oakland: Mortality and High School Graduation
What Can We Do?
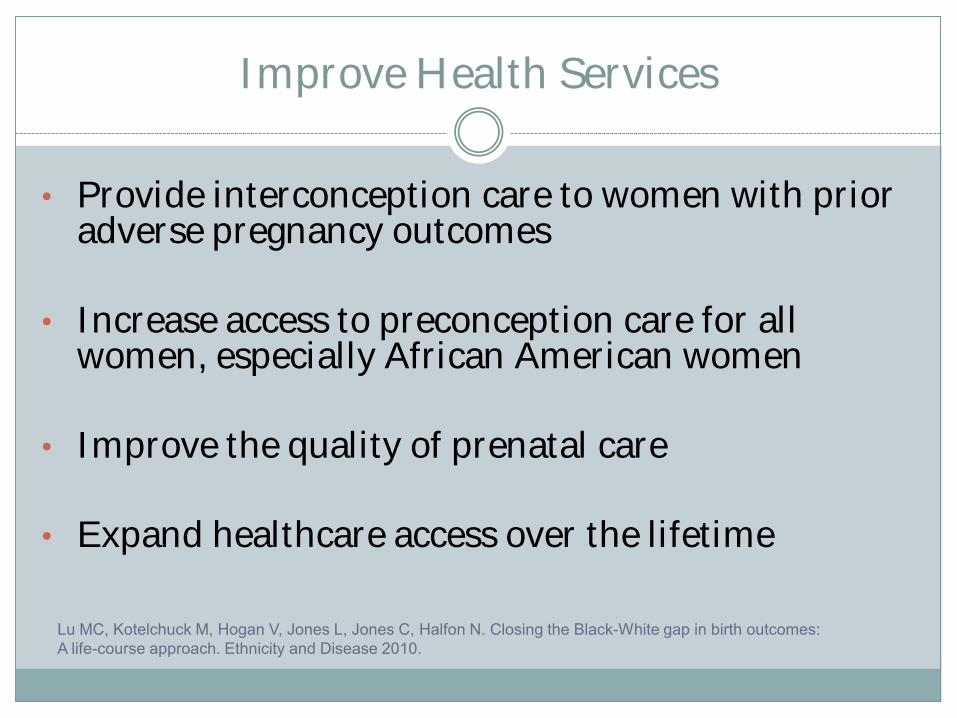
Improve Health Services
• Provide interconception care to women with prior adverse pregnancy outcomes
• Increase access to preconception care for all
women, especially African American women • Improve the quality of prenatal care • Expand healthcare access over the lifetime
Lu MC, Kotelchuck M, Hogan V, Jones L, Jones C, Halfon N. Closing the Black-White gap in birth outcomes: A life-course approach. Ethnicity and Disease 2010.
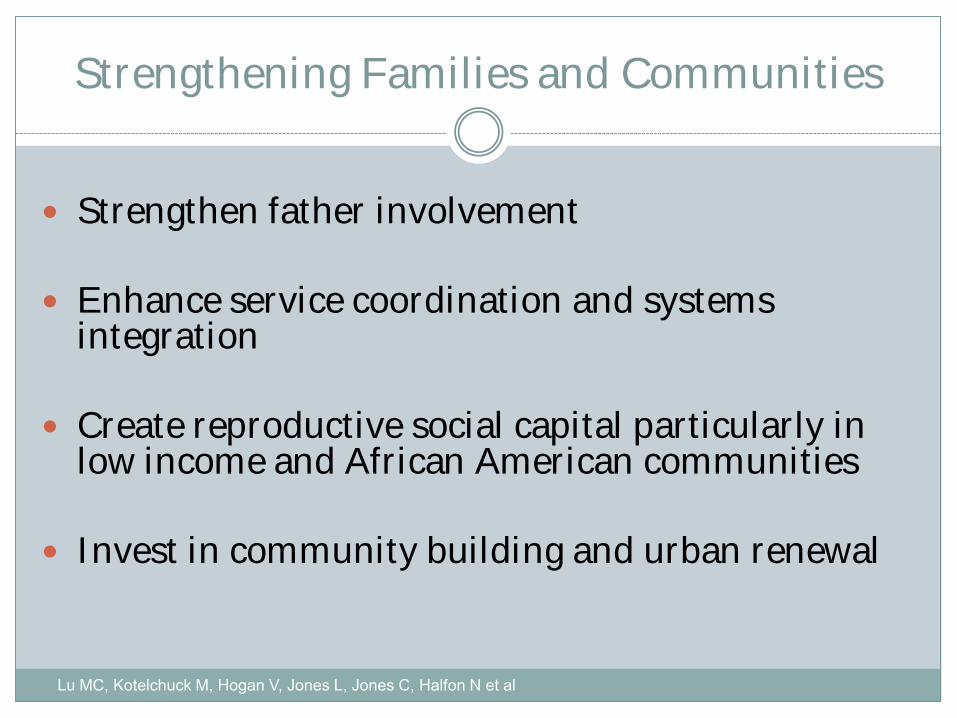
Strengthening Families and Communities
Strengthen father involvement Enhance service coordination and systems
integration Create reproductive social capital particularly in
low income and African American communities Invest in community building and urban renewal
Lu MC, Kotelchuck M, Hogan V, Jones L, Jones C, Halfon N et al
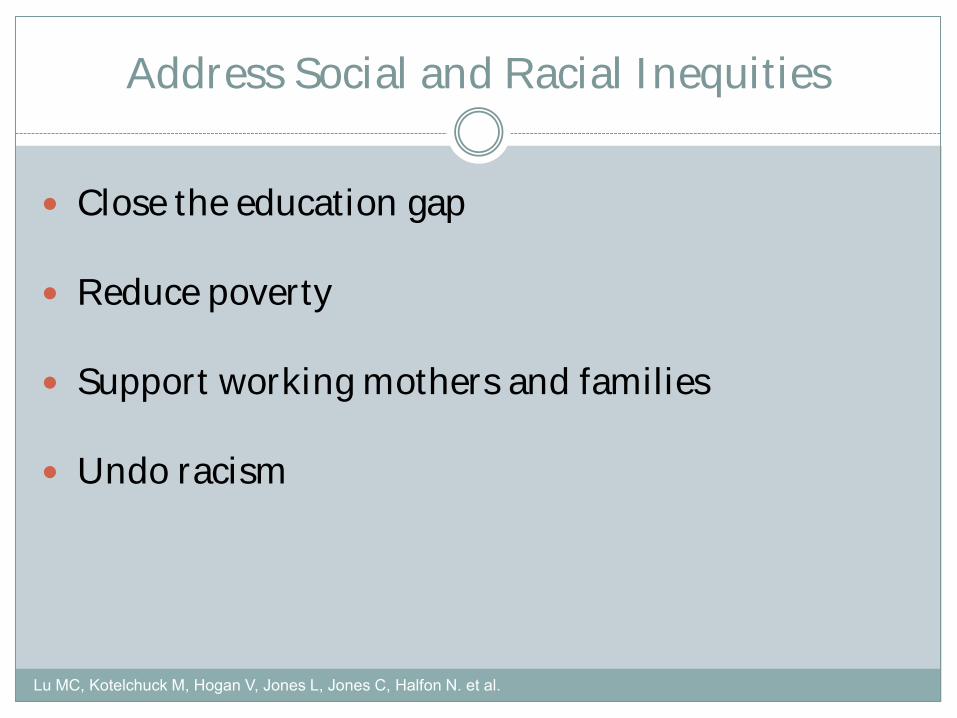
Address Social and Racial Inequities
Close the education gap Reduce poverty Support working mothers and families Undo racism
Lu MC, Kotelchuck M, Hogan V, Jones L, Jones C, Halfon N. et al.
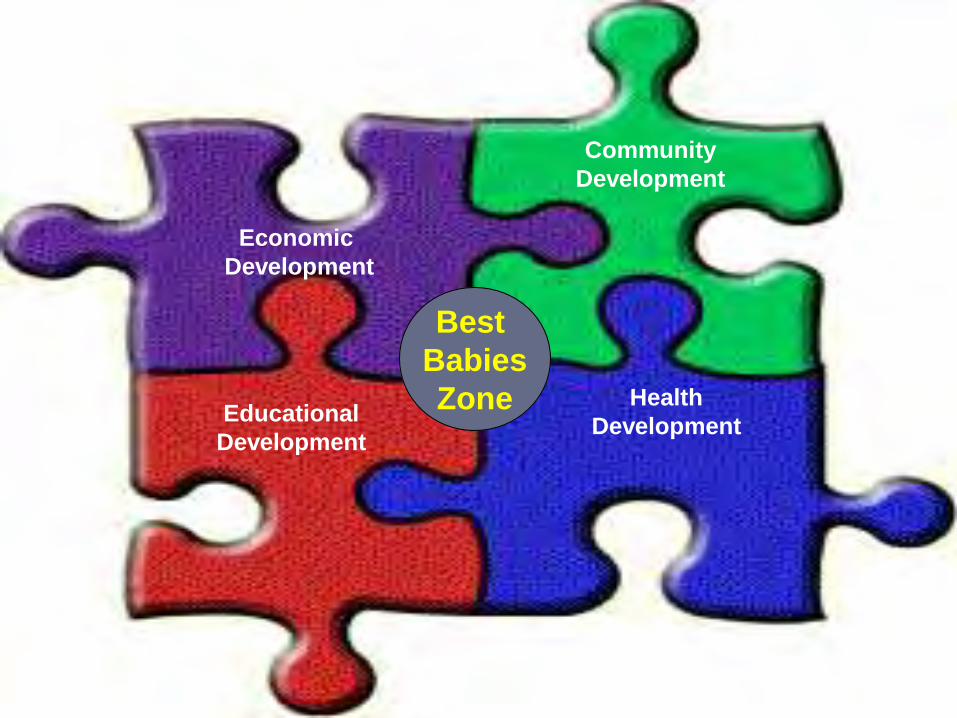
Health
Development Educational
Development
Community
Development
Economic
Development
Best
Babies
Zone
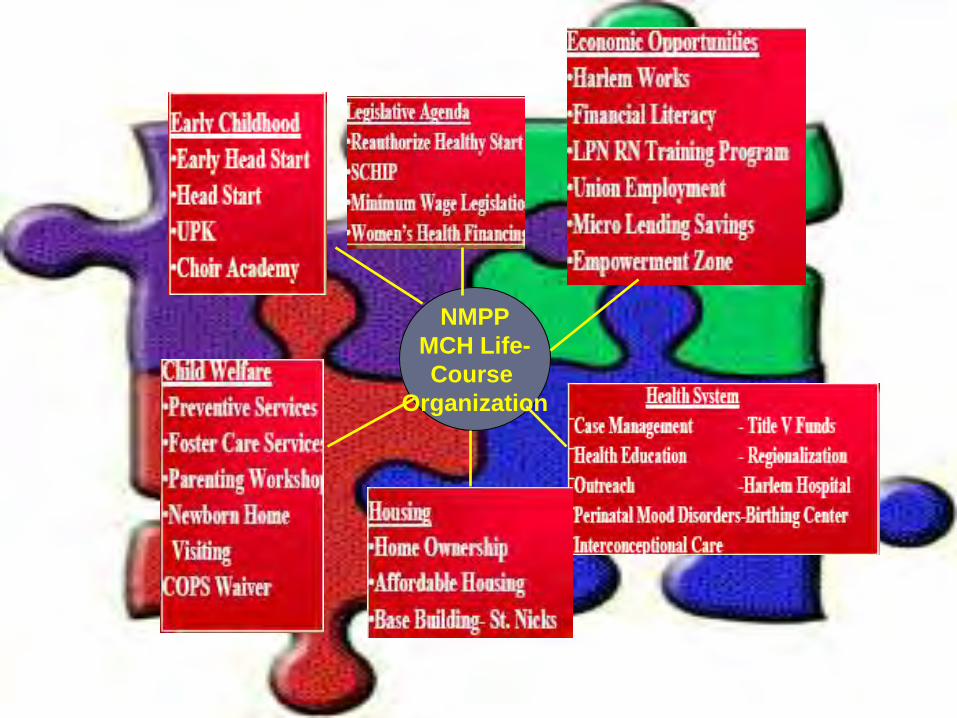
NMPP
MCH Life-
Course
Organization
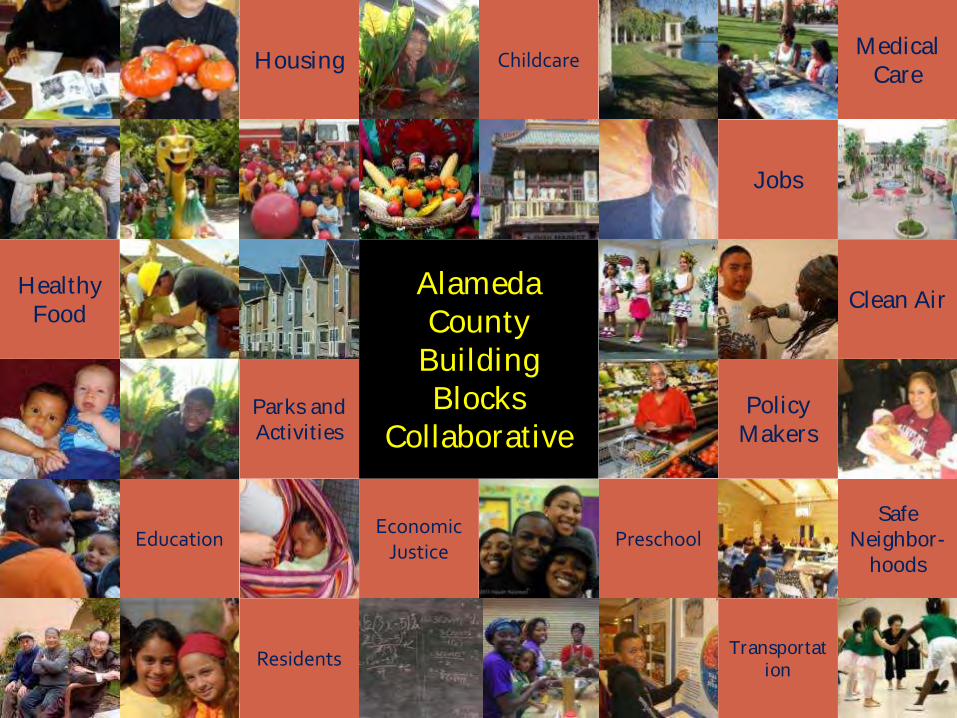
Healthy Food
Education
Residents
Parks and Activities
Housing
Economic Justice
Alameda County
Building Blocks
Collaborative
Childcare
Preschool
Transportation
Policy Makers
Jobs
Safe Neighbor-
hoods
Clean Air
Medical Care
YOU CAN AND DO IMPACT THE HEALTH OF GENERATIONS OF
NORTH CAROLINIANS
Next Steps
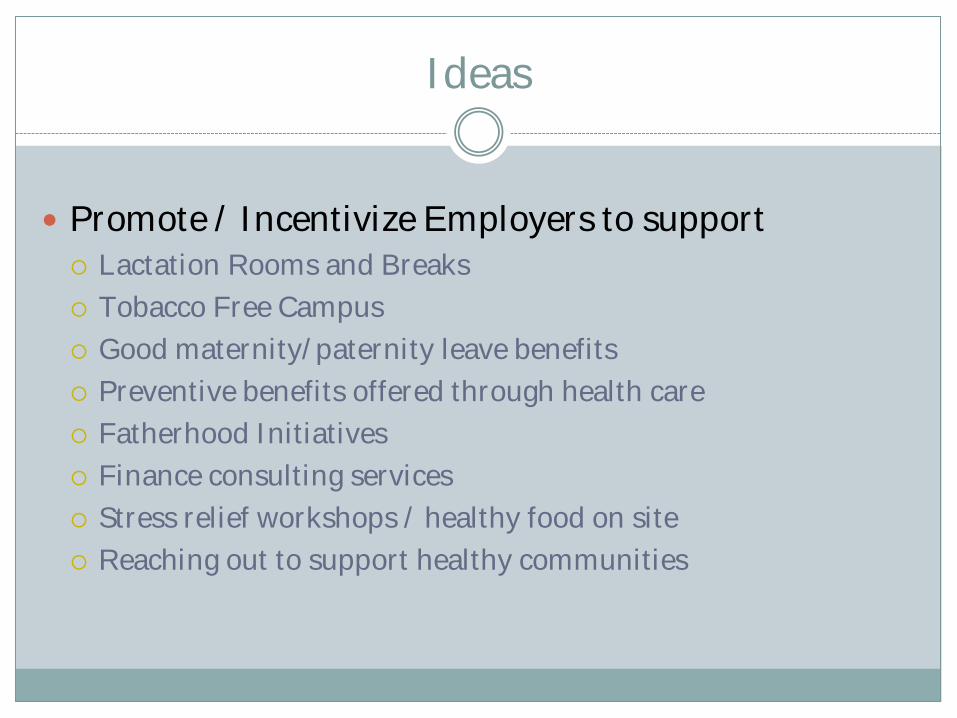
Ideas
Promote / Incentivize Employers to support
Lactation Rooms and Breaks
Tobacco Free Campus
Good maternity/paternity leave benefits
Preventive benefits offered through health care
Fatherhood Initiatives
Finance consulting services
Stress relief workshops / healthy food on site
Reaching out to support healthy communities
The Women’s Initiative
Partner with women to foster entrepreneurship and support new business.
Grameen Bank and Microlending are changing health status for women in other countries.
Since 1988, Women's Initiative has been assisting high-potential low-income women who dream of business ownership. Through an intensive 20 session program — in English or Spanish — women are enabled to start, or expand their business.
http://www.womensinitiative.org/index.htm
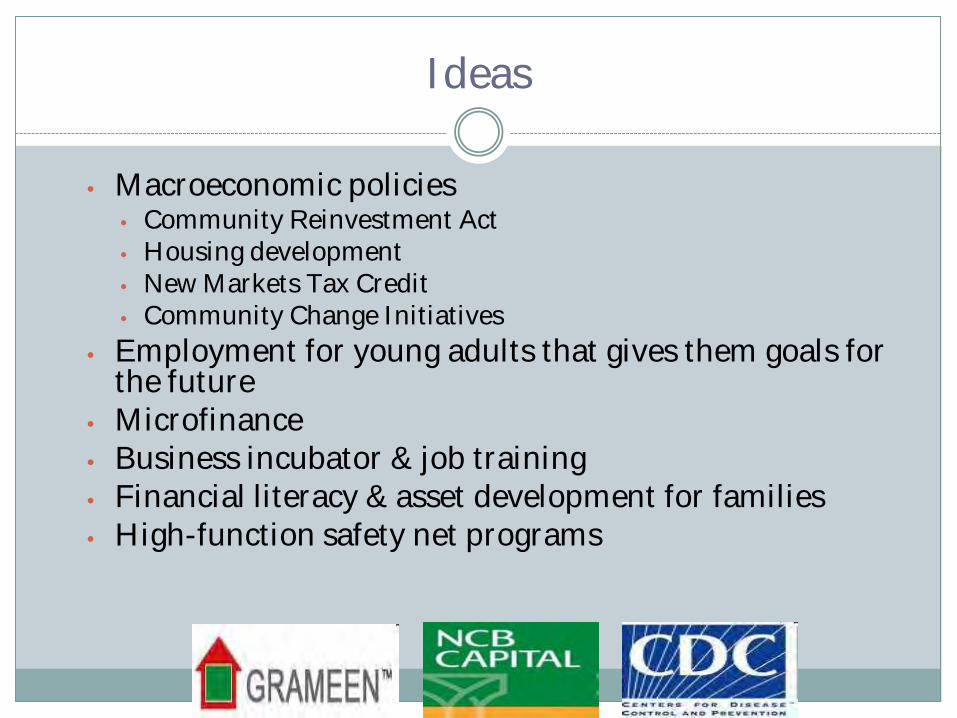
Ideas
• Macroeconomic policies • Community Reinvestment Act • Housing development • New Markets Tax Credit • Community Change Initiatives
• Employment for young adults that gives them goals for the future
• Microfinance • Business incubator & job training • Financial literacy & asset development for families • High-function safety net programs
What do you think??
Birth Equity Council
25+ member leadership team representing a variety of sectors including Commerce. 60+ member Council
Purpose: develop an actionable strategic plan to address disparities in birth outcomes…then fund and implement
Council in process of deciding on focus and framework for this work. Strong interest in addressing underlying social determinants of health
Will launch over 15 stakeholder forums across NC as part of this process
Timeline for completion and funding – Fall 2013
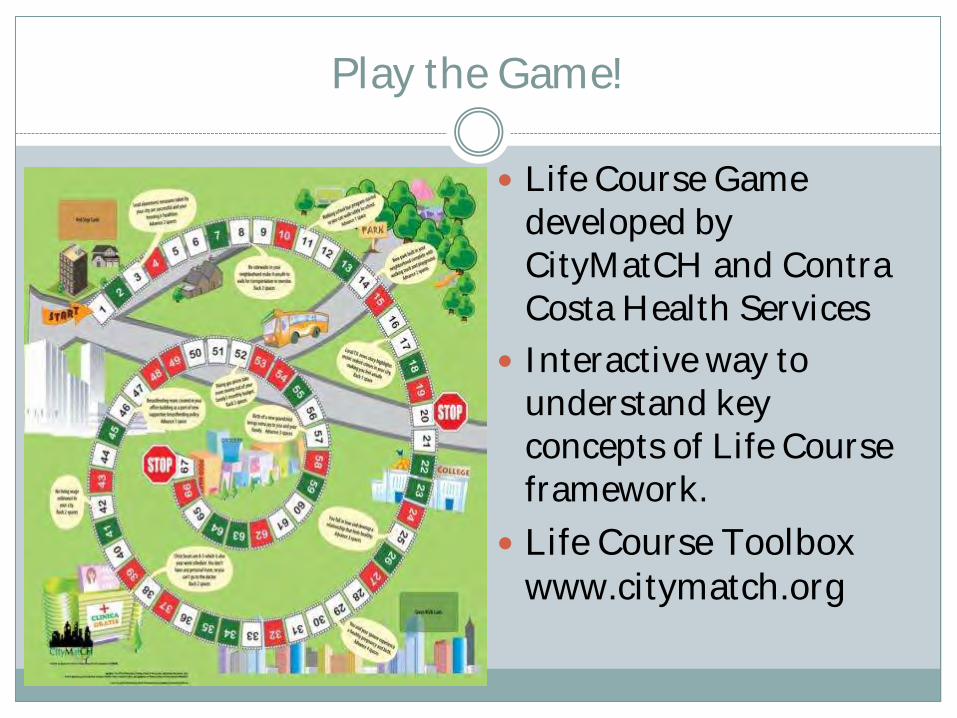
Play the Game!
Life Course Game developed by CityMatCH and Contra Costa Health Services
Interactive way to understand key concepts of Life Course framework.
Life Course Toolbox www.citymatch.org
www.EveryWomanSoutheast.org
John F Kennedy (1961)
All this will not be finished in the first 100 days. Nor will it be finished in the first 1,000 days, nor in the life of this Administration,
nor even perhaps in our lifetime on this planet. But let us begin.