Working Papers in Trade and Development · addition, Australia is currently negotiating bilateral...
35
Working Papers in Trade and Development Australia-Thailand Trade: Has the FTA Made a Difference? Prema-chandra Athukorala and Archanun Kohpaiboon August 2011 Working Paper No. 2011/12 Arndt-Corden Department of Economics Crawford School of Economics and Government ANU College of Asia and the Pacific
-
Upload
hoangquynh -
Category
Documents
-
view
216 -
download
1
Transcript of Working Papers in Trade and Development · addition, Australia is currently negotiating bilateral...

Working Papers in Trade and Development
Australia-Thailand Trade:
Has the FTA Made a Difference?
Prema-chandra Athukorala and
Archanun Kohpaiboon
August 2011 Working Paper No. 2011/12
Arndt-Corden Department of Economics Crawford School of Economics and Government
ANU College of Asia and the Pacific


Australia-Thailand Trade: Has the FTA Made a Difference?
Prema-chandra Athukorala The Arndt-Corden Department of Economics
Crawford School of Economics and Government ANU College of Asia and the Pacific The Australian National University
And
Archanun Kohpaiboon Faculty of Economics
Thammasat Univeersity, Thailand
Corresponding Address : Prema-chandra Athukorala
The Arndt-Corden Department of Economics Crawford School of Economics and Government
ANU College of Asia and the Pacific Coombs Building 9
The Australian National University Canberra ACT 0200
Email: [email protected]
August 2011
Working Paper No. 2011/12

This Working Paper series provides a vehicle for preliminary circulation of research results in the fields of economic development and international trade. The series is intended to stimulate discussion and critical comment. Staff and visitors in any part of the Australian National University are encouraged to contribute. To facilitate prompt distribution, papers are screened, but not formally refereed.
Copies may be obtained at WWW Site http://www.crawford.anu.edu.au/acde/publications/
Australia-Thailand Trade: Has the FTA Made a Difference?
Prema-chandra Athukorala
Arndt-Corden Department of Economics
Crawford School of Economics and Government
Australian National University
and
Archanun Kohpaiboon Faculty of Economics
Thammasat University, Thailand
Abstract: This paper examines the impact of the Australia-Thailand free trade agreement (TAFTA) on bilateral trade between the two countries, paying attention to the implications of rules of origins (RoO) and the utilization of tariff preferences. It is found that trade has expanded faster following TAFTA came into effect, but the impact has heavily concentrated in a few product lines in Australian imports from Thailand, reflecting the influence of commodity specific, supply-side factors which have a bearing on the rate of preference utilization. The findings, inter alia, suggest that the use of officially announced preference rates in trade flow modeling is likely to exaggerate trade flow effects of FTAs. Key words: free trade agreement, rules of origin, production fragmentation, Thailand,
Australia JEL Classifications: F13, F14, F15, F53
25 August 2011
Forthcoming in Australian Economic Review
1
Thai-Australian Trade: Has the FTA Made a Difference?
Prema-chandra Athukorala and Archanun Kohpaiboon
1. Introduction
In this paper, we examine emerging trends and patterns of Australia’s trade with Thailand, with a
focus on the impact of the free trade agreement (FTA) between the two countries. In addition to
broadening our understanding of the trade relations between the two countries, the paper aims to
contribute to the sparse literature on the trade flow effects of FTAs. Proliferation of FTAs over
the past two decades has sparked a policy debate both in Australian and in international policy
forums about their implications for the operation of the global trading system and finding ways
of mitigating their likely discriminatory effects on both partners and outside countries. In order
to inform this policy debate it is vital to explore the behavior of trade flows under FTAs which
have already been implemented, paying attention to the possible discriminatory effects of the
eligibility criteria (rules of origins, RoOs) which accompany tariff references (Lloyd and
Maclaren 2004).
The paper is structures as follows. Section 2 provides an overview of the Thailand-
Australia FTA (TAFTA) paying attention to the nature and extent of tariff concession offered
under TAFTA and the accompanying Rules of Origin (RoO). Section 3 probes the extent to
which trade preferences have so far been used by traders using a new data set compiled from the
administrative records of the relevant government bodies in Thailand. Section 4 examines the
impact of TAFTA on Australia-Thailand trade by linking preference utilization patterns observed
2
in Section 3 with a pre- and post-TAFTA comparison of trade flows. Some general conclusions
are drawn in the final section.
2. Australia-Thailand FTA
Over the past two decades FTAs have become an integral and enduring part of the global trading
system. The number of FTAs notified to the World Trade Organization (WTO) almost
quadrupled from around 110 in 1990 to 400 in 2010 and currently all member countries of WTO
other than Mongolia are members of at least one FTA. Australia and Thailand (and other Asian
countries) embraced the new-found FTA enthusiasm with a considerable time lag: until about
the beginning of the last decade they continued to maintain long-standing commitment to non-
discriminatory unilateral liberalization, reinforced by the WTO commitments. Since then both
countries have caught up rapidly with the global trends.
Australia is now party to seven FTAs: New Zealand (1983), Singapore (2003), the USA
(2005), Thailand (2005), Chile (2009) and ASEAN (together with New Zealand) (2010). In
addition, Australia is currently negotiating bilateral FTAs with China, Japan, Malaysia and the
Republic of Korea (DFAT 2010, PC 2010). A joint feasibility study of a possible FTA with
Indonesia has been finalized and a similar study is underway relating to a possible FTA with
India. Thailand has entered into 8 FTAs and another 13 agreements are under negotiation
(Kohpaiboon 2010, Saly 2006).
a. Tariff preferences

3
The Thailand-Australia Free Trade Agreement (TAFTA) came into effect on January 1, 2005. 1
By the time of signing the agreement Australia’s tariffs had come down to the average
level of the other developed countries, thanks to unilateral tariff reforms over the previous three
decades. Nearly half of the tariff lines at the 6-digit level of the Harmonized System (HS) of
product classification
The agreement is reasonably comprehensive in its coverage of trade in goods. However, unlike
in the other four FTAs signed by Australia in the last decade, TAFTA’s liberalisation
commitments relating to investment and services and other commercial practices impacting on
international trade (eg. intellectual property, government procurement and competition policy)
are rather thin. In this paper we, therefore, focus solely on goods trade.
2
1 The full text of the agreement is available at
were free of duty and the simple average most-favoured-nation (MFN)
tariff was 3.4 per cent. However, there were moderate tariff peaks relating to motor vehicles and
parts (6.8 per cent), textiles (9.7 per cent), wearing apparel (19.1 per cent) and leather products
(6.5 per cent) in which Thailand had considerable export potential (CIE 2004, Table A-1).
Under TAFTA, an additional 33.2 percent of tariff lines became duty free for Thailand with
immediate effect. All HS-6digit items belonging to the product category of completely-built up
(CBU) vehicles (Australia’s most important export to Australia) were in the additional duty free
list, giving Thailand a ‘preference margin’ (the difference between the MFN rate and the
preference rate) of about 10 percent for these items. The other products in this list list included
fresh fruit, vegetables, canned pineapple and pineapple juice, processed foods, small passenger
vehicles and pick-up trucks, gems and jewelry. The average preference rate offered by Australia
was 1.6 per cent compared to the average MFN rate in 2004 of 3.9 per cent. Give Australia’s
www.dfat.gov.au/trade/negotitions/aus-thai/ 2 The harmonized commodity and coding system (HS) is an internationally standardised system for classifying traded products developed by the World Customs Organization (WCO).
4
initial low tariffs, the preference margins for the bulk of product lines were below 5 percent
(Table 1). A further 13 per cent of tariff lines, comprising plastic products, rubber and rubber
products became duty free in 2010. The remaining items including textiles (HS52-60), garments
(HS61-62), household textiles (e.g. carpets, curtain) (HS63), footwear (HS64) and some
electrical appliances (HS85) will become duty free by 2015.
[Table 1 about here]
Thailand’s average tariff in 2004 was around 12 per cent and the tariff structure had 46
different slabs, with high tariff peaks ranging from 30 to 50 per cent for a number of dairy, meet
and other agricultural products imported from Australia (CIE 2004, Table A-1). Only about 4.2
per cent of total tariff lines were free of duty. Under the agreement the duty-free percentage for
Australia was increased to 49.2 per cent. The zero-duty list is dominated by raw materials such
as mineral ore, fuel, and chemicals, as well as raw and tanned hides. Duties on another 45 per
cent were removed in 2010 and the remaining 5 per cent of items comprising dairy and meat
products (beef, pork, milk and cheese, tea, and coffee) will be removed by 2015. The average
preferential tariff offered by Thailand to Australia was around 6 per cent, with an average
preference merging of about 10 per cent. For about a fifth of total tariff lines the preference
margin exceeded 20 per cent (Table 1).
A comparison of the structure of preferential tariffs with trade patterns in the lead up to
the signing of TAFTA3
3 The trade data are not reported here because of the space constraint. They are available from the authors on request.
suggests that products with large preference margins were mostly
manufactured goods which are hardly imported from Australia. Agricultural products with

5
considerable market potential in Thailand for Australian exporters, like fresh milk and milk
products4
and meat, are subject to tariff-quotas and the preferential quota levels and rates offered
to Australia are rather small. For instance, for fresh milk the MFN import quota was 2,400 tons,
with in- and out-quota tariff rates of 20 per cent and 41 per cent, respectively. Under TAFTA the
two rates for milk product within and outer quota rates applicable to imports from Australia are
set at 15 per cent and 20 per cent respectively, but the former rate is applicable for only 120 tons
(or just 5 per cent of the MFN quota). Bovine meat is subject to preferential tariff of 41 per cent
compared to a MFN rate of 50 per cent. This rate is applicable for the first 776 metric tons of
imports. Beyond this, the MFN tariff rate (50 per cent) is applicable. Tariff concessions for
agricultural products under TAFTA are also subject to safeguard provisions. That is, the member
countries can suspend the offered preferential tariffs and return to the MFN tariff if import
quantity reaches certain trigger levels.
b. Rules of Origin
In an FTA, the participant countries maintain their own external tariffs, which usually differ
between member countries, while offering concessional tariffs to the member courtiers. Thus, it
is necessary to combine tariff concessions offered to member countries with rules of origins
(RoO) to prevent ‘trade deflection’ –imports from non-member countries into the member with
the lowest most favoured tariffs for transshipment to other FTA members. If eligibility criteria
imposed for the identification of the true ‘originating status’ of products are stringent and the
related administrative mechanism is cumbersome, RoO can diminish, or even render worthless,
4 Between 2005 and 2010, Australia accounted for 57.6 per cent of total milk imports (HS 040110-040130) and 14 per cent for milk powder imports (HS 040221).

6
the preference margin offered to traders (Krishna 2006). Therefore, how the RoO are designed
and implemented matter a lot if we are to understand how much market access an FTA really
confers.
The RoO are set based on three main criteria: regional value content (RVC), change of
tariff classification (CTS), specificities about the production process (SPP). The RVS criterion
requires that the cost of material and processing cost within the FTA member countries
represents a set minimum proportion of the value of the final product. The CTS criterion requires
that the ‘non-originating material’ (that is, intermediate inputs imported from non-member
countries) used in the production process belongs to a different commodity code (category) of
the Harmonized System.. The SPP criterion requires non-originating material to undergo a
specified manufacturing or processing operation. Until recently, the CTS criterion was by far the
dominant norm in setting RoO in FTAs. Designing and application of RoOs have, however,
become increasingly complicated in recent years by the rapid growth of international
fragmentation of production: the geographic separation of activities involved in producing a
good (or service) across two or more countries within vertically integrated production systems. It
is difficult to apply the standard value added criteria in a context where trade in parts and
components, and final assembly occur in different countries, so that assembly in a given location
has a very thin value-added content (Lloyd 2001, Athukorala 2005). For this reason, most FTAs
now use a mixture of the three criteria, with CTC as the basic norm.
For a product to become eligible for tariff concessions, material (intermediate inputs)
used in producing it must have come from a different HS code. In applying the CTC criterion,
the shifting of HS classifications is usually expressed at the Chapter (2 digit), Heading (4 digit)
or Sub-heading (6 digit) level of the HS system of classification. The particular level of

7
classification chosen makes a significant difference in the case of manufactured goods as the
good is usually ‘made’ from the other items in the given chapter or the heading to which it
belongs. Specification of the ‘HS change level’ by chapter is more restrictive than a change at
the heading level, which in turn is more restrictive than a change at the subheading level
(Productivity Commission 2009, p. 135).
Like in the case of the other four recent Australian FTAs, CTC is the main (base) criteria
used in TAFTA (DFAT 2010, pp. 79-80). Approximately 80 per cent of HS products are subject
to CTC rules alone, 17 per cent to CTC and RVC, and 3 per cent to CT and SP. Of the products
for which CTC is the only criterion used, about 17 per cent are subject to HS shifting at the HS
2-digit level, 35 per cent at the HS 4-digit level and the balance of 28 per cent at the 6 digit level.
For processed agricultural goods, meat and fish products, RoO are generally a
combination of CTC and SPP. For example, RoO for processed fish (HS 0303) requires that
freezing, cleaning, gutting, removing of gills must be undertaken in addition to shifting from any
other HS heading. For motor vehicles RoO require HS shifting at the sub-heading level and a
minimum RVC of 40 per cent. For highly sensitive manufacturing products such as textiles,
wearing apparel and footwear, RoO are a combination of all three criteria. For example, a Thai
firm exporting men or boys’ overcoats, fur-coats, capes, cloaks etc. (HS 6101) is eligible for
tariff preference only if the product is a change to heading 6101 from any other Chapter and the
good is both cut (or knit to shape) and sewn or otherwise assembled in one or both countries and
has a regional value content of not less than 55 per cent. In some cases specific requirements are
added even at the sub-heading level. For example, in the case of TV sets (HS 852821) RoO
require a change to that subheading from any other subheading, except from subheadings 701120
(cathode-ray tubes), 854011 (cathode-ray picture tubes) and 854091 (parts of cathode-ray tubes).
8
This implies that an exporting firm would become eligible for tariff concessions only if these
three inputs are sourced locally. But this is not a viable option for the firm: it is not possible to be
internationally competitive unless these components are procured from advanced countries
(currently most of these components come from Japan).
3. Utilization of tariff preferences
As a prelude to analysing the impact of TAFTA on trade flows, in this section we examine the
actual utilization of trade preferences offered under the agreement.. For this purpose the
preference utilization rate is estimated as the percentage share of trade accounted for by RoO
certificates issued by the Thai Bureau of Preferential Trade and the actual trade of products
eligible for trade preferences computed using Customs records.
For total exports from Thailand (Australian imports), during the period from 2005 to
2010 the weighted average preference utilization rate ranged between 60 to 70 per cent (Table 2).
The utilization rates are highly concentrated: the top ten products of over 5000 products at the 6-
digit-HS level accounted for more than 60 per cent of total exports taking place under trade
preferences. The figure for the top-20 was 70 per cent. The average preference utilization rate of
Thai imports (Australian export to Thailand) was much lower: less than 15 per cent of eligible
imports actually took place under trade preferences. The degree of concentration of preference
utilization was higher for Thai imports than for exports in the early years but by 2010 the
concentration levels were similar.
[Tables 2 about here]
9
Assuming that producers and traders are fully aware of the tariff concessions offered
under an FTA, the utilization rates of tariff concessions depend largely on the margin between
the general and preferential tariff rates offered and cost involved in meeting RoO requirements
(which together determine the net preference margin) and the degree of restrictiveness of RoO
(Carrer and de Melo 2006). In addition to these main factors, some firms might be reluctant to
share details of their production process because of the fear of leakage of vital information on
production process to competitors or income/cost details to the tax authorities. Administrative
delays involved in obtaining RoO certification which could disrupt trade flows are another
possible reason to shun preferences. Disentangling these influences is not possible without
undertaking a systematic firm-level study. However, an inspection of the distribution of
preference margins and preference utilization patterns across products/product groups suggest
that both the cost of RoO compliance and, more importantly, restrictiveness of RoO do have a
significant impact on the actual trade effect of TAFTA.
According to the findings of Kohpaiboon (2010) the cost of RoO compliance under
TAFTA is not very high: it ranges from 5 to 8 per cent of the tax concession (preference margin).
However even this small cost can be a significant consideration for traders because, as we have
already noted, a significant percentage of tariff lines cluster at the lower end, particularly for
Thai exports to Australia.
The data reported in Tables 3 and 4 on FTA utilization information on the top ten exports
and imports help us gain some insights into the commodity specific nature of preference
utilization. On the import side, fully-built motor vehicles (HS 870421, HS870323, HS 870431,
10
and HS 870322) come first on the list of the top ten products. From the late 1980s, the export-
oriented motor vehicle industry has grown rapidly and a strong domestic parts and component
supply network has evolved side by side with final assembly (Athukorala & Kohpaiboon (2010).
Hence, the exporters can easily meet the RVC criteria. Interestingly, among electrical and
electronics goods which together ranked next to automobiles in Thailand’s export structure, only
air-conditioning systems(HS841510) appears among the top ten users of tariff preferences,
although all these products are eligible to similar preference margins (around 5 per cent). The
eligibility of this product for tariff preferences depends on a straight forward CTC criterion; non-
originating material used must have come from any other HS category than HS841510 By
contrast, as already noted, for many other HS-6 digit products belonging to this product group
there are more complex RoO criteria.
On the import side, the top-10 items on the import side include primary products like
wheat (HS100190), malt (HS 110710), zinc (HS 260800) and aluminum (HS 760110) (Table 7).
All these items are natural resource based products which naturally qualify as originating within
the FTA region without any need for satisfying any additional test. Interestingly, none of the 6-
digit HS products belonging to the commodity categories of milk and milk products, and meat
appear on this list, presumably reflecting the impact of more restrictive RoOs which combine
CTC and SPP criteria.
[Tables 3 and 4 about here]

11
4. Australia-Thailand trade
There has been a notable increase in Australia-Thailand bilateral trade following 2005 when the
TAFTA came into effect (Table 5). Between 2004 and 2010, total merchandise trade (exports +
import) between Australia and Thailand increased from US$ 5 billion to US$ 15.1 billion at an
annual rate of 20.2 per cent. In contrast, Australia’s total world merchandise trade increased
only by 12.0. Consequently, the share of bilateral trade in total trade increased from 2.6 per cent
to about 4.0 per cent between these two years. Trade with Australia as a share of total Thai
trade amounted to 3.5 per cent during 2005-10, up from 2.3 per cent during 2000-04.
[Table 5 about here]
The total trade figures, however, hide a notable asymmetry in growth of imports and
exports: trade expansion has occurred predominantly on the import side (Table 5). The share of
imports from Thailand increased from 2.8 per cent in 2004 to 5.2 per cent in 2010, where as the
share of exports to Thailand in total Australian exports varied mildly around an annual average
of 3.5 per cent during this period. During 2005-10, the annual average growth rate of exports to
Thailand (9.1 per cent was in fact slightly lower than the comparable figure for total exports
(14.2 per cent). Comparison of pre- and post-FTA trade performance is of course a weak basis
for drawing inferences because many factors other than FTA could have affected trade
performance over this period. Disentangling the effect of TAFTA from the other events is
difficult through a systematic econometric analysis is not possible given the short time period,
but the strong positive impact on the import side certainly is too strong to be discounted by any
other factors.
12
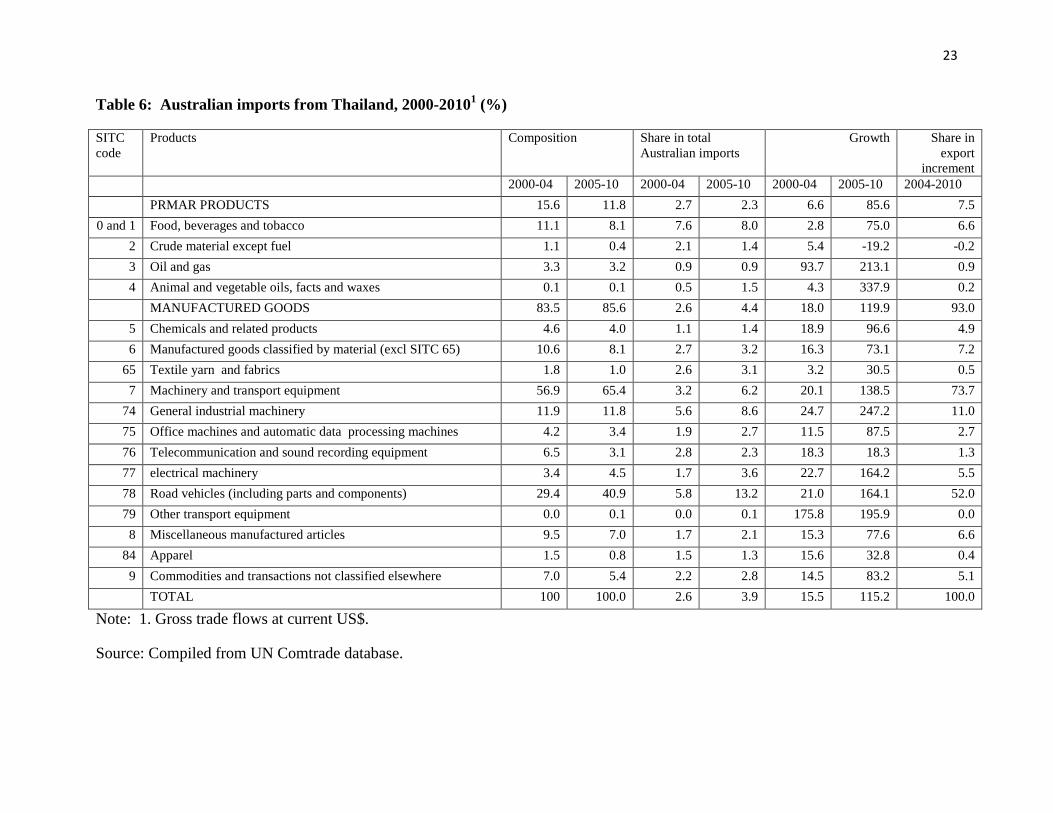
[Tables 6 and 7 about here]
On the Australian import side, the most striking development is a sharp increase in road
vehicle imports (Table 6). Australian imports of road vehicles (including parts and components)
increased at an annual rate of 164 per cent during 2005-10, up from 21 per cent during 2000-04.
Between these two periods motor vehicle share in total imports from Thailand and total
Australian vehicle imports increased from 29.4 per cent to 40.9 per cent, and 5.8 per cent to 13.2
per cent respectively. The market share of Australia in total motor vehicles exported from
Thailand increased from 13.8 per cent in 2000-04 to 17.4 per cent in 2010. As already noted the
emergence of Thailand as a global automobile assembly hub predates the signing of TAFTA. By
the time of TAFTA negotiation, there was already a 1.5 million unit motor vehicle industry
producing vehicles with a high local content which was well above the RVC limit (40%) set by
the FTA. By 2004 Australia was the major market for motor vehicle assembled in Thailand,
accounting for 25.8 per cent of total vehicles exports. TAFTA seems to have played a pivotal
role in strengthening this maker link and creating a more competitive and stable environment for
further expansion.
During 2000-04, Thailand (market share: 5.4 per cent) was the fourth largest source
country of automobile imports to Australia, after Japan (55.9 per cent), Germany (11.9 per cent),
Korea (6.1 per cent). In 2010 it was the second largest source country (17.2 per cent) after Japan
38.8 per cent.5
5 Market shares reported here were computed from the Comtrade data base (using export values), but use of quantity data does not change the patterns.
An inspection of time-series data on market share change suggests that
Thailand’s market share gains largely mirror market share losses of Japan. The upshot is that,

13
given the tariff preferences, Japanese car producers have opted to meet part of the demand in
Australia by expanding their assembly operations in Thailand instead of directly exporting from
Japan. Notwithstanding the same tariff preferences offered to the US under the Australia-USA
free trade agreement which came into effect in the same year as TAFTA, there has not been a
noticeable market share gain by US automakers in the Australian market. There is evidence that
the two major US automakers, GM and Ford, are expanding their production bases in Thailand to
serve the Australian and other regional markets.6
The bulk of other product categories listed in the table of Australian imports have also
recorded faster growth with notable increase in their share in total imports during the post-
TAFTA years. However, import growth rates of apparel and other miscellaneous products
(SITC 8), textiles (SITC 64) in which high-duty sensitive imports are concentrated have shown
much slower growth compared to the average performance. Thai data for exports to all countries
show that food and beverages (in particular fish and fish products, chicken meet, canned fruits),
and electrical goods and electronics have been the most dynamic export products after
automobiles over the past ten years. These products, however, still account for a much smaller
share in Australia imports from Thailand, although most of these products are at the upper end of
the distribution of FTA tariff preferences. At least part of the explanation seems to lie in the
relatively more restrictive RoO discussed in the previous section: we have also already observed
that the preference utilization rates in these products are low.
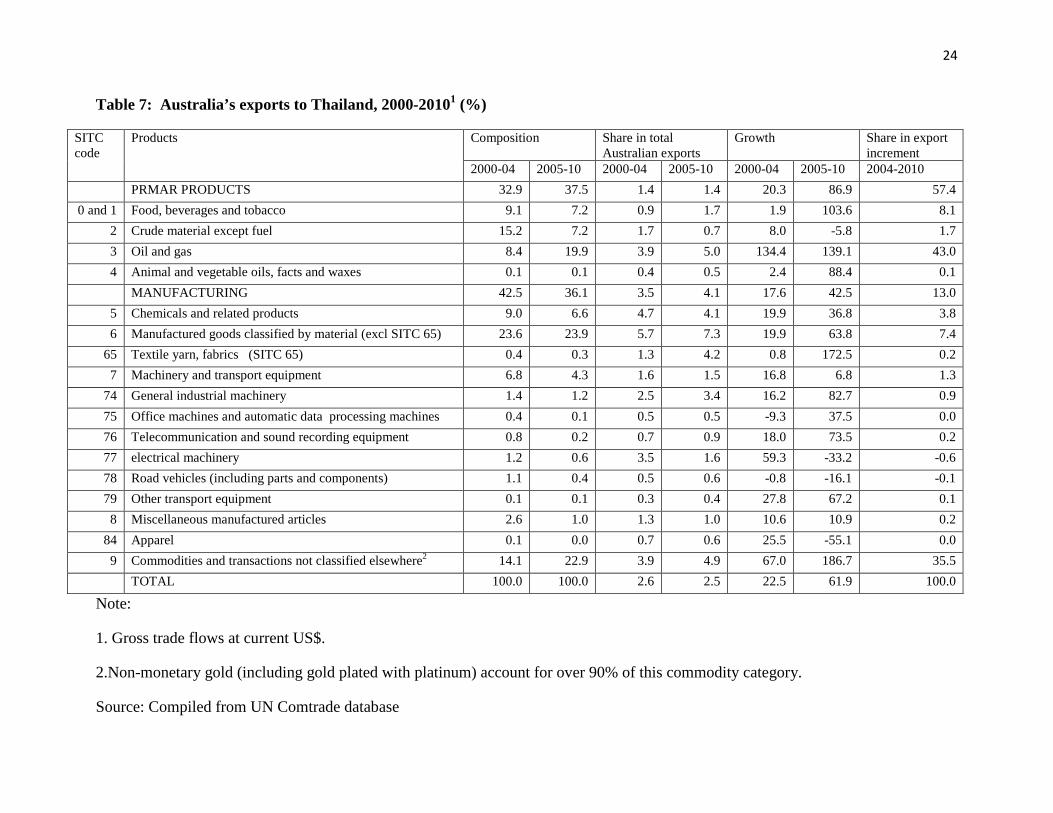
On the export side (Table 7), the share of manufacturing in total exports has declined
from 42.5% to 36.1 per cent between 2000-04 and 2005-10, even though most of the tariff
concessions offered by Thailand are concentration in this product category and these concessions 6 Some CGE-model based studies of the likely impact of AUSFTA predicted significant increase in the share of US automobile imports in Australia at the expense of imports from Japan! (See Stoler 2004 for a survey of these studies)

14
are much larger in magnitude compared to those on the import side. Interestingly, the share of
exports to Thailand in some manufacturing product categories has recorded a decline between
the two periods. The post-TAFTA average annual growth rates have been negative in some
product categories. One notable development on the export side has been a dramatic increase in
the share of unclassified exports (which mostly comprises non-monetary gold) in recent years,
but this has nothing to do with the trade concessions under the agreement. All in all, data on
exports from Australia to Thailand reported here (or the more disaggregated data not reported for
lack of space) do not permit any inference about the relative importance of the impact of
restrictive RoO. The only tentative inference we can make from these data (combined with those
relating to preference utilization patterns discussed in the previous section) is that the degree of
penetration of Australian products in the Thai market is fundamentally determined by supply-
side factors rather than tariff concessions offered under FTAs.
5. Concluding remarks
TAFTA has contributed to a notable expansion of trade between Thailand and Australia.
However, the expansion has occurred predominantly on the import side; there is no discernable
deviation from the pre-TAFTA trends and patterns on the export side. The expansion of imports
are predominantly accounted for by motor vehicles, with only few other products showing faster
growth. All in all, the evidence harnessed in the paper suggest that commodity specific supply-
side factors and RoO set at the individual commodity level in discriminatory fashion determine
the rate of rate of preference utilization and hence the actual trade flow effect of the TAFTA.
Further research is of course needed to delineate the effects of the cost and technical problems
involved in RoO compliance from other influences impacting on trade flows.
15
The findings of this paper caution against the use of officially announced preference tariff
rates for quantifying the trade flow effects of FTAs as is commonly done in computable general
equilibrium modeling exercises. The notable expansion of automotive imports to Australia from
Thailand at the expense of major traditional source countries points to the importance of taking
into account the growing role of international production fragmentation and the resultant shifts in
export locations in analyzing the trade flow effects of FTA.
16
References
Athukorala, P. 2010, ‘Production Networks and Trade Patterns in East Asia: Regionalization or
Globalization?’, Asian Economic Papers,10(1), 65-95.
Athukorala, P. and A. Kohpaiboon 2010, Thailand in Global Automobile Networks, Geneva:
World Trade Organization/International Trade Center.
DFAT (Department of Foreign Trade (2010), Review of Bilateral and Regional Trade
Agreements, Canberra: DFAT, viewed 16 August 2011,
www.dfat.gov.au/trade/agreements_review/
Correre, C. 2006, ‘Are different rules of origin costly? Evidence from NAFTA, in , Cadot, O.,
A. Estevadeordal, A. Suwa-Eisenmann and T. Verdier (eds.), The Origin of Goods:
Rules of Origin in Regional Trading Agreements, Oxford: Oxford University Press, pp.
191-212.
CIE (Center for International Economics) 2004, The Australia-Thailand Free Trade Agreement:
Economic Effects, Canberra: CIE, accessed on 12 August 2011,
(http://www.dfat.gov.au/trade/negotiations/aus-thai/)
Kohpaiboon, A. 2010, ‘Exporters’ response to FTA tariff preferences: Evidence from
Thailand’, RIETI Discussion Paper 10-E-039, Research Institute of Economy, Trade &
Industry, Tokyo.
Krishna, K. 2006, ‘Understanding rules origin’, in Cadot, O., A. Estevadeordal, A. Suwa-
Eisenmann and T. Verdier (eds.), The Origin of Goods: Rules of Origin in Regional
Trading Agreements, Oxford: Oxford University Press, pp. 19-34.

17
Lloyd, P. J. 2001, ‘Rules of Origin and Fragmentation of Trade’, in Global Production and
Trade in East Asia. Chen, L. K. and H. Kierzkowski , Amdterdam: Kluwer Academic
Publishers, pp. 273-287.
Lloyd, P. J. and D. Maclaren 2004, ‘Gains and losses from regional trading agreements: A
survey’, Economic Record, 80(251), 455-467.
PC (Productivity Commission) 2009, Trade & Assistance Review 2007-08, Annual Report
Series, Canberra.
PC (Productivity Commission) 2010, Bilateral and Regional Trade Agreement, Canberra:
Productivity Commission, assessed on 16 Aiugust 2010, <www.pc.gov.au>
Sally, R. 2007, Thai trade policy: From non-discriminatory liberalisation to FTAs’, World
Economy, 30(10): 1594-1620.
Stoler, A.L. (2004), ‘Australia-US free Trade: Benefits and cost of an agreement’, in Schott, J.J.
(ed.), Free-Trade Agreements: US Strategies and Priorities, Washington DC.: Institute
for International Economics, pp. 95-116.

18
Table 1: Australia-Thailand free-trade agreement: Average tariff and preference margins
Australia (2006) (%) Thailand (2009) (%) Average MFN rate1: 2004 3.9 15.0 Average TAFTA rate1: 2006 1.6 6.2
Distribution of preference margin (2006) Preference margin (Δt)2 Tariff lines3 (%) Tariff lines3 (%)
0t∆ = 49.8 4.3 0 5t< ∆ ≤ 50.1 56.5 5 10t< ∆ ≤ 0.1 15.2
10 20t< ∆ ≤ 0 6.2 20 30t< ∆ ≤ 0 12.1
30 t< ∆ 0 5.7 Number of Tariff lines 5,218 5,050 Note: (1). Simple (un-weighted) average.; 2. Difference between the TAFTA rate and the MFN
rate; (3) Percentage distribution of tariff lines at the 6 digit level of the Harmonized System (HS)
Source: Compiled from official tariff schedules.

19
Table 2: Utilization of trade preferences under TAFTA by Thai traders, 2005-2010 (%)
2005 2006 2007 2008 2009 2010 (a) Exports to Australia
Average utilization rate 67.1 62.8 70.8 62.5 50.3 60.2 The share of top 10 items in total preferential exports
75.7 65.0 69.1 62.3 63.7 62.4
The share of top 20 items in total preferential exports
80.9 72.5 75.9 72.0 71.5 71.6
(b) Imports from Australia Average utilization rate (%) 14.7 13.7 14.0 10.4 10.8 10.4 The share of top 10 items in total preferential imports
87.5 81.5 87.5 81.5 63.7 60.1
The share of top 20 items in total preferential imports
93.7 89.9 93.7 89.9 74.5 70.7
Source: Compiled from official FTA administration data provided by Bureau of Preferential Trade, Department of Foreign Trade, Ministry of Commerce., Thailand.

Table 3: Thailand: Top-10 ten products (at the 6-digit HS) exported to Australia under TAFTA preferences, 2005- 2010
HS Description RoO criteria1 Share in total exports to Australia (%)
Share in total preferential exports (%)
Preference utilization rate
(%) 2000-04 2004-2010 2005-2010 2005-2010
870421 Pick-up vehicles (Diesel Engine) with less than 5 tons
HS subheading level CTC + RVC 40%
9.8 11.9 24.3 100.0
870323 Passenger vehicles with engine less than 1,500 cc.
HS Subheading level CTC + RVC 40%
3.8 8.0 12.3 94.2
870431 Other pick-up vehicles HS Sub-heading level CTC + RVC 40%
11.5 3.7 11.6 100.0
870322 Passenger vehicles with engine from 1,500 cc. to 2,400 cc.
HS Subheading level CTC + RVC 40%
0.0 2.1 2.8 89.0
841510 Air-conditioning systems HS subheading level CTC 5.5 3.4 4.9 84.4 160414 Canned Tuna HS chapter level CTC 3.2 2.0 3.3 99.1 711319 Precious metal jewelry parts HS subheading level CTC 0.8 0.9 1.4 98.9 711311 Silver jewelry parts HS subheading level CTC 0.4 0.7 1.2 100.0 730690 Iron pipe HS heading level CTC 0.1 0.2 1.2 100.0 390760 Polyethylene in primary forms HS heading level CTC +
RVC 40% 0.1 0.6 0.8 96.7
Note: (1) CTC: change of tariff classification; RVC: Regional value content.
Source: Compiled from official FTA administration data provided by Bureau of Preferential Trade, Department of Foreign Trade, Ministry of Commerce, Thailand.
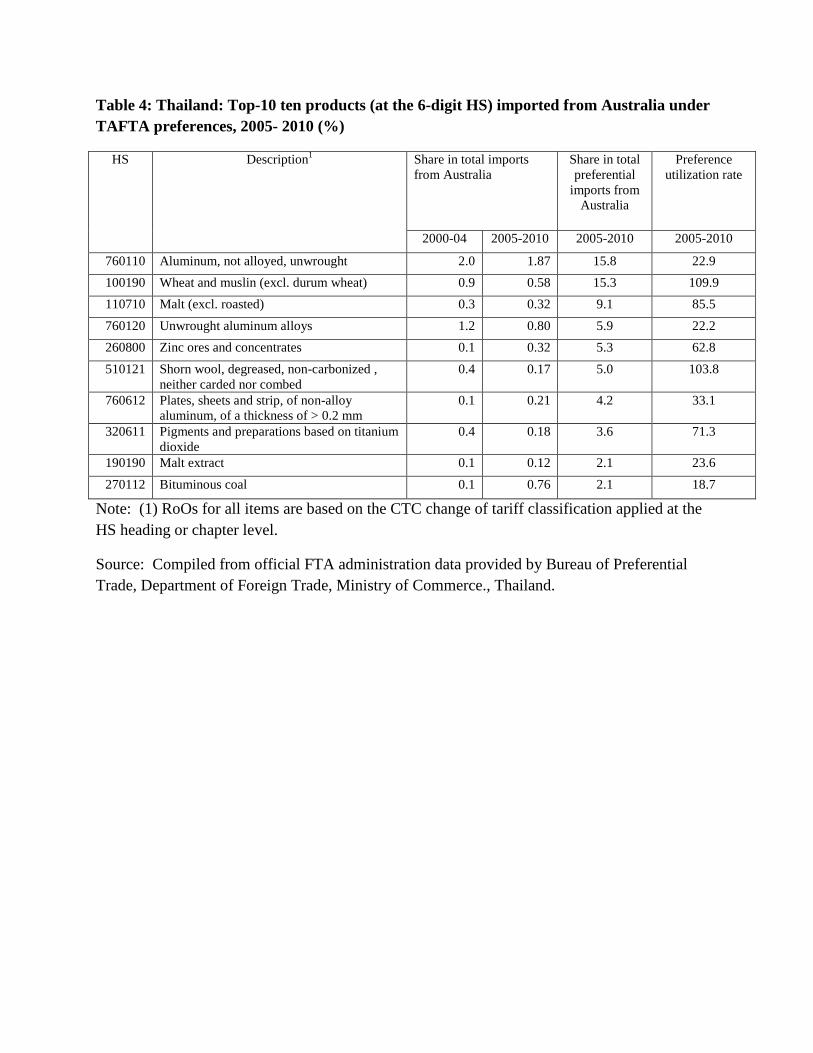
Table 4: Thailand: Top-10 ten products (at the 6-digit HS) imported from Australia under TAFTA preferences, 2005- 2010 (%)
HS Description1 Share in total imports from Australia
Share in total preferential
imports from Australia
Preference utilization rate
2000-04 2005-2010 2005-2010 2005-2010
760110 Aluminum, not alloyed, unwrought 2.0 1.87 15.8 22.9 100190 Wheat and muslin (excl. durum wheat) 0.9 0.58 15.3 109.9 110710 Malt (excl. roasted) 0.3 0.32 9.1 85.5 760120 Unwrought aluminum alloys 1.2 0.80 5.9 22.2 260800 Zinc ores and concentrates 0.1 0.32 5.3 62.8 510121 Shorn wool, degreased, non-carbonized ,
neither carded nor combed 0.4 0.17 5.0 103.8
760612 Plates, sheets and strip, of non-alloy aluminum, of a thickness of > 0.2 mm
0.1 0.21 4.2 33.1
320611 Pigments and preparations based on titanium dioxide
0.4 0.18 3.6 71.3
190190 Malt extract 0.1 0.12 2.1 23.6 270112 Bituminous coal 0.1 0.76 2.1 18.7
Note: (1) RoOs for all items are based on the CTC change of tariff classification applied at the HS heading or chapter level.
Source: Compiled from official FTA administration data provided by Bureau of Preferential Trade, Department of Foreign Trade, Ministry of Commerce., Thailand.

22
Table 5: Australia’s merchandise trade with Thailand, 2000-2010
2000 2004 2005 2006 2007 2008 2009 2010 2000-042 2005-20102
Thailand (exports + imports) US$b 2.8 5.0 6.8 7.9 10.2 13.1 12.5 15.1 3.5 (17.1) 11.0 (20.2)
Exports (US$b) 1.1 2.3 3.1 3.2 3.7 4.5 3.3 5.2 1.5 (20.2) 3.8 (9.1)
Imports (US$b) 1.6 2.8 3.7 4.7 6.5 8.6 9.2 9.9 2.0 (16.0) 7.1 (27.7)
Thailand’s share of Australia’s trade(%) 2.1 2.6 3.0 3.1 3.5 3.5 4.0 3.8 2.3 3.5
Exports 1.8 2.6 3.0 2.6 2.6 2.4 2.2 2.5 2.1 2.6
Imports 2.4 2.7 3.1 3.6 4.2 4.5 5.8 5.2 2.5 4.4
Trade balance1 (%) -44.0 -23.2 -16.9 -46.5 -78.6 -91.7 -177.3 -88.3 -34.0 -83.2
Australia’s share in Thailand’s trade (%) 2.1 2.4 2.8 3.0 3.3 3.7 4.3 4.0 2.3 3.5
Export 2.4 2.6 2.9 3.3 3.7 4.5 5.6 4.8 2.4 4.1
Imports 1.9 2.3 2.7 2.7 2.7 2.9 2.8 3.2 2.2 2.9
Note: (1) Trade balance as a percentage of exports (2) Annual average growth rates are given in blrackets.
Source: Compiled from UN Comtrade database.
23
Table 6: Australian imports from Thailand, 2000-20101 (%)
SITC code
Products Composition Share in total Australian imports
Growth Share in export
increment 2000-04 2005-10 2000-04 2005-10 2000-04 2005-10 2004-2010
PRMAR PRODUCTS 15.6 11.8 2.7 2.3 6.6 85.6 7.5 0 and 1 Food, beverages and tobacco 11.1 8.1 7.6 8.0 2.8 75.0 6.6
2 Crude material except fuel 1.1 0.4 2.1 1.4 5.4 -19.2 -0.2 3 Oil and gas 3.3 3.2 0.9 0.9 93.7 213.1 0.9 4 Animal and vegetable oils, facts and waxes 0.1 0.1 0.5 1.5 4.3 337.9 0.2
MANUFACTURED GOODS 83.5 85.6 2.6 4.4 18.0 119.9 93.0 5 Chemicals and related products 4.6 4.0 1.1 1.4 18.9 96.6 4.9 6 Manufactured goods classified by material (excl SITC 65) 10.6 8.1 2.7 3.2 16.3 73.1 7.2
65 Textile yarn and fabrics 1.8 1.0 2.6 3.1 3.2 30.5 0.5 7 Machinery and transport equipment 56.9 65.4 3.2 6.2 20.1 138.5 73.7
74 General industrial machinery 11.9 11.8 5.6 8.6 24.7 247.2 11.0 75 Office machines and automatic data processing machines 4.2 3.4 1.9 2.7 11.5 87.5 2.7 76 Telecommunication and sound recording equipment 6.5 3.1 2.8 2.3 18.3 18.3 1.3 77 electrical machinery 3.4 4.5 1.7 3.6 22.7 164.2 5.5 78 Road vehicles (including parts and components) 29.4 40.9 5.8 13.2 21.0 164.1 52.0 79 Other transport equipment 0.0 0.1 0.0 0.1 175.8 195.9 0.0 8 Miscellaneous manufactured articles 9.5 7.0 1.7 2.1 15.3 77.6 6.6
84 Apparel 1.5 0.8 1.5 1.3 15.6 32.8 0.4 9 Commodities and transactions not classified elsewhere 7.0 5.4 2.2 2.8 14.5 83.2 5.1
TOTAL 100 100.0 2.6 3.9 15.5 115.2 100.0
Note: 1. Gross trade flows at current US$.
Source: Compiled from UN Comtrade database.
24
Table 7: Australia’s exports to Thailand, 2000-20101 (%)
SITC code
Products Composition Share in total Australian exports
Growth Share in export increment
2000-04 2005-10 2000-04 2005-10 2000-04 2005-10 2004-2010 PRMAR PRODUCTS 32.9 37.5 1.4 1.4 20.3 86.9 57.4 0 and 1 Food, beverages and tobacco 9.1 7.2 0.9 1.7 1.9 103.6 8.1
2 Crude material except fuel 15.2 7.2 1.7 0.7 8.0 -5.8 1.7 3 Oil and gas 8.4 19.9 3.9 5.0 134.4 139.1 43.0 4 Animal and vegetable oils, facts and waxes 0.1 0.1 0.4 0.5 2.4 88.4 0.1
MANUFACTURING 42.5 36.1 3.5 4.1 17.6 42.5 13.0 5 Chemicals and related products 9.0 6.6 4.7 4.1 19.9 36.8 3.8 6 Manufactured goods classified by material (excl SITC 65) 23.6 23.9 5.7 7.3 19.9 63.8 7.4
65 Textile yarn, fabrics (SITC 65) 0.4 0.3 1.3 4.2 0.8 172.5 0.2 7 Machinery and transport equipment 6.8 4.3 1.6 1.5 16.8 6.8 1.3
74 General industrial machinery 1.4 1.2 2.5 3.4 16.2 82.7 0.9 75 Office machines and automatic data processing machines 0.4 0.1 0.5 0.5 -9.3 37.5 0.0 76 Telecommunication and sound recording equipment 0.8 0.2 0.7 0.9 18.0 73.5 0.2 77 electrical machinery 1.2 0.6 3.5 1.6 59.3 -33.2 -0.6 78 Road vehicles (including parts and components) 1.1 0.4 0.5 0.6 -0.8 -16.1 -0.1 79 Other transport equipment 0.1 0.1 0.3 0.4 27.8 67.2 0.1 8 Miscellaneous manufactured articles 2.6 1.0 1.3 1.0 10.6 10.9 0.2
84 Apparel 0.1 0.0 0.7 0.6 25.5 -55.1 0.0 9 Commodities and transactions not classified elsewhere2 14.1 22.9 3.9 4.9 67.0 186.7 35.5
TOTAL 100.0 100.0 2.6 2.5 22.5 61.9 100.0
Note:
1. Gross trade flows at current US$.
2.Non-monetary gold (including gold plated with platinum) account for over 90% of this commodity category.
Source: Compiled from UN Comtrade database


Working Papers in Trade and Development List of Papers (including publication details as at 2011)
07/01 KELLY BIRD, SANDY CUTHBERTSON and HAL HILL, ‘Making Trade Policy in a New
Democracy after a Deep Crisis: Indonesia 07/02 RAGHBENDRA JHA and T PALANIVEL, ‘Resource Augmentation for Meeting the
Millennium Development Goals in the Asia Pacific Region’ 07/03 SATOSHI YAMAZAKI and BUDY P RESOSUDARMO, ‘Does Sending Farmers Back to
School have an Impact? A Spatial Econometric Approach’ 07/04 PIERRE VAN DER ENG, ‘De-industrialisation’ and Colonial Rule: The Cotton Textile
Industry in Indonesia, 1820-1941’ 07/05 DJONI HARTONO and BUDY P RESOSUDARMO, ‘The Economy-wide Impact of
Controlling Energy Consumption in Indonesia: An Analysis Using a Social Accounting Matrix Framework’
07/06 W MAX CORDEN, ‘The Asian Crisis: A Perspective after Ten Years’ 07/07 PREMA-CHANDRA ATHUKORALA, ‘The Malaysian Capital Controls: A Success
Story? 07/08 PREMA-CHANDRA ATHUKORALA and SATISH CHAND, ‘Tariff-Growth Nexus in
the Australian Economy, 1870-2002: Is there a Paradox?, 07/09 ROD TYERS and IAN BAIN, ‘Appreciating the Renbimbi’ 07/10 PREMA-CHANDRA ATHUKORALA, ‘The Rise of China and East Asian Export
Performance: Is the Crowding-out Fear Warranted? 08/01 RAGHBENDRA JHA, RAGHAV GAIHA AND SHYLASHRI SHANKAR, ‘National
Rural Employment Guarantee Programme in India — A Review’ 08/02 HAL HILL, BUDY RESOSUDARMO and YOGI VIDYATTAMA, ‘Indonesia’s Changing
Economic Geography’ 08/03 ROSS H McLEOD, ‘The Soeharto Era: From Beginning to End’ 08/04 PREMA-CHANDRA ATHUKORALA, ‘China’s Integration into Global Production
Networks and its Implications for Export-led Growth Strategy in Other Countries in the Region’
08/05 RAGHBENDRA JHA, RAGHAV GAIHA and SHYLASHRI SHANKAR, ‘National Rural
Employment Guarantee Programme in Andhra Pradesh: Some Recent Evidence’ 08/06 NOBUAKI YAMASHITA, ‘The Impact of Production Fragmentation on Skill Upgrading:
New Evidence from Japanese Manufacturing’ 08/07 RAGHBENDRA JHA, TU DANG and KRISHNA LAL SHARMA, ‘Vulnerability to
Poverty in Fiji’

08/08 RAGHBENDRA JHA, TU DANG, ‘ Vulnerability to Poverty in Papua New Guinea’ 08/09 RAGHBENDRA JHA, TU DANG and YUSUF TASHRIFOV, ‘Economic Vulnerability
and Poverty in Tajikistan’ 08/10 RAGHBENDRA JHA and TU DANG, ‘Vulnerability to Poverty in Select Central Asian
Countries’ 08/11 RAGHBENDRA JHA and TU DANG, ‘Vulnerability and Poverty in Timor- Leste′ 08/12 SAMBIT BHATTACHARYYA, STEVE DOWRICK and JANE GOLLEY, ‘Institutions and
Trade: Competitors or Complements in Economic Development? 08/13 SAMBIT BHATTACHARYYA, ‘Trade Liberalizaton and Institutional Development’ 08/14 SAMBIT BHATTACHARYYA, ‘Unbundled Institutions, Human Capital and Growth’ 08/15 SAMBIT BHATTACHARYYA, ‘Institutions, Diseases and Economic Progress: A Unified
Framework’ 08/16 SAMBIT BHATTACHARYYA, ‘Root causes of African Underdevelopment’ 08/17 KELLY BIRD and HAL HILL, ‘Philippine Economic Development: A Turning Point?’ 08/18 HARYO ASWICAHYONO, DIONISIUS NARJOKO and HAL HILL, ‘Industrialization
after a Deep Economic Crisis: Indonesia’ 08/19 PETER WARR, ‘Poverty Reduction through Long-term Growth: The Thai Experience’ 08/20 PIERRE VAN DER ENG, ‘Labour-Intensive Industrialisation in Indonesia, 1930-1975:
Output Trends and Government policies’ 08/21 BUDY P RESOSUDARMO, CATUR SUGIYANTO and ARI KUNCORO, ‘Livelihood
Recovery after Natural Disasters and the Role of Aid: The Case of the 2006 Yogyakarta Earthquake’
08/22 PREMA-CHANDRA ATHUKORALA and NOBUAKI YAMASHITA, ‘Global Production
Sharing and US-China Trade Relations’ 09/01 PIERRE VAN DER ENG, ‘ Total Factor Productivity and the Economic Growth in
Indonesia’ 09/02 SAMBIT BHATTACHARYYA and JEFFREY G WILLIAMSON, ‘Commodity Price Shocks
and the Australian Economy since Federation’ 09/03 RUSSELL THOMSON, ‘Tax Policy and the Globalisation of R & D’ 09/04 PREMA-CHANDRA ATHUKORALA, ‘China’s Impact on Foreign Trade and Investment
in other Asian Countries’ 09/05 PREMA-CHANDRA ATHUKORALA, ‘Transition to a Market Economy and Export
Performance in Vietnam’

09/06 DAVID STERN, ‘Interfuel Substitution: A Meta-Analysis’ 09/07 PREMA-CHANDRA ATHUKORALA and ARCHANUN KOHPAIBOON, ‘Globalization
of R&D US-based Multinational Enterprises’ 09/08 PREMA-CHANDRA ATHUKORALA, ‘Trends and Patterns of Foreign Investments in
Asia: A Comparative Perspective’ 09/09 PREMA-CHANDRA ATHUKORALA and ARCHANUN KOHPAIBOON,’ Intra-
Regional Trade in East Asia: The Decoupling Fallacy, Crisis, and Policy Challenges’ 09/10 PETER WARR, ‘Aggregate and Sectoral Productivity Growth in Thailand and Indonesia’ 09/11 WALEERAT SUPHANNACHART and PETER WARR, ‘Research and Productivity in
Thai Agriculture’ 09/12 PREMA-CHANDRA ATHUKORALA and HAL HILL, ‘Asian Trade: Long-Term
Patterns and Key Policy Issues’ 09/13 PREMA-CHANDRA ATHUKORALA and ARCHANUN KOHPAIBOON, ‘East Asian
Exports in the Global Economic Crisis: The Decoupling Fallacy and Post-crisis Policy Challenges’.
09/14 PREMA-CHANDRA ATHUKORALA, ‘Outward Direct Investment from India’ 09/15 PREMA-CHANDRA ATHUKORALA, ‘Production Networks and Trade Patterns: East
Asia in a Global Context’ 09/16 SANTANU GUPTA and RAGHBENDRA JHA, ‘Limits to Citizens’ Demand in a
Democracy’ 09/17 CHRIS MANNING, ‘Globalisation and Labour Markets in Boom and Crisis: the Case of
Vietnam’ 09/18 W. MAX CORDEN, ‘Ambulance Economics: The Pros and Cons of Fiscal Stimuli’ 09/19 PETER WARR and ARIEF ANSHORY YUSUF, ‘ International Food Prices and Poverty in
Indonesia’ 09/20 PREMA-CHANDRA ATHUKORALA and TRAN QUANG TIEN, ‘Foreign Direct
Investment in Industrial Transition: The Experience of Vietnam’ 09/21 BUDY P RESOSUDARMO, ARIEF A YUSUF, DJONI HARTONO and DITYA AGUNG
NURDIANTO, ‘Implementation of the IRCGE Model for Planning: IRSA-INDONESIA15 (Inter-Regional System of Analysis for Indonesia in 5 Regions)
10/01 PREMA-CHANDRA ATHUKORALA, ‘Trade Liberalisation and The Poverty of Nations:
A Review Article’ 10/02 ROSS H McLEOD, ‘Institutionalized Public Sector Corruption: A Legacy of the Soeharto
Franchise’

10/03 KELLY BIRD and HAL HILL, ‘Tiny, Poor, Landlocked, Indebted, but Growing: Lessons for late Reforming Transition Economies from Laos’
10/04 RAGHBENDRA JHA and TU DANG, ‘Education and the Vulnerability to Food
Inadequacy in Timor-Leste’ 10/05 PREMA-CHANDRA ATHUKORALA and ARCHANUN KOHPAIBOON, ‘East Asia in
World Trade: The Decoupling Fallacy, Crisis and Policy Challenges’ 10/06 PREMA-CHANDRA ATHUKORALA and JAYANT MENON, ‘Global Production
Sharing, Trade Patterns and Determinants of Trade Flows’ 10/07 PREMA-CHANDRA ATHUKORALA, ‘Production Networks and Trade Patterns in East
Asia: Regionalization or Globalization? 10/08 BUDY P RESOSUDARMO, ARIANA ALISJAHBANA and DITYA AGUNG
NURDIANTO, ‘Energy Security in Indonesia’ 10/09 BUDY P RESOSUDARMO, ‘Understanding the Success of an Environmental Policy: The
case of the 1989-1999 Integrated Pest Management Program in Indonesia’ 10/10 M CHATIB BASRI and HAL HILL, ‘Indonesian Growth Dynamics’ 10/11 HAL HILL and JAYANT MENON, ‘ASEAN Economic Integration: Driven by Markets,
Bureaucrats or Both? 10/12 PREMA-CHANDRA ATHUKORALA, ‘ Malaysian Economy in Three Crises’ 10/13 HAL HILL, ‘Malaysian Economic Development: Looking Backwards and Forward’ 10/14 FADLIYA and ROSS H McLEOD, ‘Fiscal Transfers to Regional Governments in
Indonesia’ 11/01 BUDY P RESOSUDARMO and SATOSHI YAMAZAKI, ‘Training and Visit (T&V)
Extension vs. Farmer Field School: The Indonesian’ 11/02 BUDY P RESOSUDARMO and DANIEL SURYADARMA, ‘The Effect of Childhood
Migration on Human Capital Accumulation: Evidence from Rural-Urban Migrants in Indonesia’
11/03 PREMA-CHANDRA ATHUKORALA and EVELYN S DEVADASON, ‘The Impact of
Foreign Labour on Host Country Wages: The Experience of a Southern Host, Malaysia’ 11/04 PETER WARR, ‘Food Security vs. Food Self-Sufficiency: The Indonesian Case’ 11/05 PREMA-CHANDRA ATHUKORALA, ‘Asian Trade Flows: Trends, Patterns and
Projections’ 11/06 PAUL J BURKE, ‘Economic Growth and Political Survival’ 11/07 HAL HILL and JUTHATHIP JONGWANICH, ‘Asia Rising: Emerging East Asian
Economies as Foreign Investors’

11/08 HAL HILL and JAYANT MENON, ‘Reducing Vulnerability in Transition Economies: Crises and Adjustment in Cambodia’
11/09 PREMA-CHANDRA ATHUKORALA, ‘South-South Trade: An Asian Perspective’ 11/10 ARMAND A SIM, DANIEL SURYADARMA and ASEP SURYAHADI, ‘The
Consequences of Child Market Work on the Growth of Human Capital’ 11/11 HARYO ASWICAHYONO and CHRIS MANNING, ‘Exports and Job Creation in
Indonesia Before and After the Asian Financial Crisis’ 11/12 PREMA-CHANDRA ATHUKORALA and ARCHANUN KOHPAIBOON, ‘Australia-
Thailand Trade: Has the FTA Made a Difference?