Working Paper Template - Tax and Transfer Policy Institute
29
THE AUSTRALIAN NATIONAL UNIVERSITY Crawford School of Public Policy TTPI Tax and Transfer Policy Institute The ATO longitudinal information files (ALife): A new resource for retirement policy research* TTPI - Working Paper 2/2020 April 2020 Cain Polidano †ꭓ University of Melbourne Andrew Carter ‡ Australian Taxation Office Marc Chan ꞙꭓ University of Melbourne Abraham Chigavazira † University of Melbourne Hang To ‡ Australian Taxation Office Justin Holland ‡ Australian Taxation Office Son Nguyen ‡ Australian Taxation Office Ha Vu ₼ꭓ Deakin University Roger Wilkins †ꭓ University of Melbourne
Transcript of Working Paper Template - Tax and Transfer Policy Institute

T H E A U S T R A L I A N N A T I O N A L U N I V E R S I T Y
Crawford School of Public Policy
TTPI Tax and Transfer Policy Institute
The ATO longitudinal information files (ALife): A new resource for retirement policy research*
TTPI - Working Paper 2/2020 April 2020
Cain Polidano†ꭓ University of Melbourne
Andrew Carter‡ Australian Taxation Office
Marc Chanꞙꭓ University of Melbourne
Abraham Chigavazira† University of Melbourne
Hang To‡ Australian Taxation Office
Justin Holland‡ Australian Taxation Office
Son Nguyen‡ Australian Taxation Office
Ha Vu₼ꭓ Deakin University
Roger Wilkins†ꭓ University of Melbourne
T H E A U S T R A L I A N N A T I O N A L U N I V E R S I T Y
Abstract
Tax and Transfer Policy Institute
Crawford School of Public Policy
College of Asia and the Pacific
+61 2 6125 9318
The Australian National University
Canberra ACT 0200 Australia
www.anu.edu.au
The Tax and Transfer Policy Institute in the Crawford School of Public Policy has been established to
carry out research on tax and transfer policy, law and implementation for public benefit in Australia.
The research of TTPI focuses on key themes of economic prosperity, social equity and system
resilience. Responding to the need to adapt Australia’s tax and transfer system to meet contemporary
challenges, TTPI delivers policy-relevant research and seeks to inform public knowledge and debate
on tax and transfers in Australia, the region and the world. TTPI is committed to working with
governments, other academic scholars and institutions, business and the community.
The Crawford School of Public Policy is the Australian National University’s public policy school,
serving and influencing Australia, Asia and the Pacific through advanced policy research, graduate and
executive education, and policy impact.
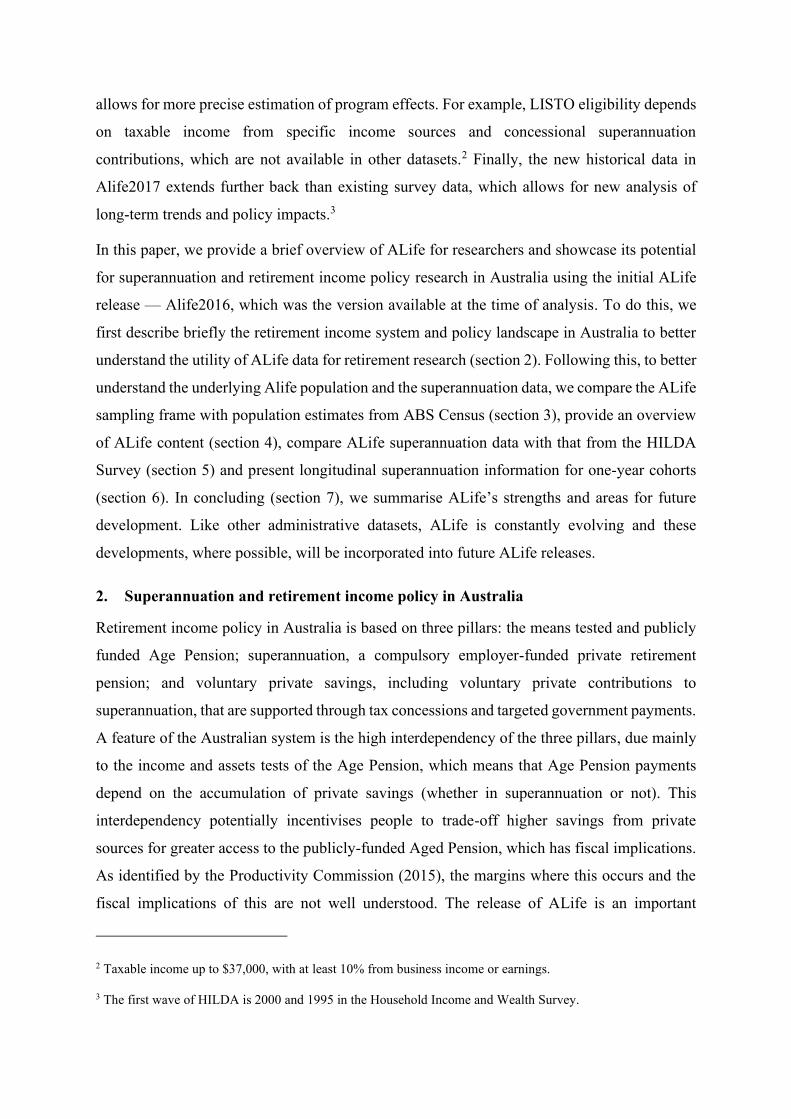
The Australian Taxation Office release of annual longitudinally linked individual tax and superannuation records, known as the ATO Longitudinal Information Files (ALife), opens-up opportunities for new research. In this study, we provide an overview of ALife, focusing on its use for retirement income research. To this end, we provide the first longitudinal estimates of superannuation outcomes for one-year birth cohorts. Results show marked increase in disparity of super balances in the lead-up to retirement as those in the top quartile ramp-up their contributions, possibly to take advantage of the favourable tax treatment of superannuation income in retirement years.
JEL Codes: H24, H55, J26 Keywords: Retirement income; taxation; private pension
*Corresponding author, [email protected], +61 03 8344 2102. †Melbourne Institute of Applied Economic and Social Research, University of Melbourne. ꭓTax and Transfer Policy Institute, Crawford School of Public Policy, Australian National University. ‡Australian Taxation Office. ꞙDepartment of Economics, University of Melbourne. ₼Department of Economics, Deakin University. This research is supported by an Australian Research Council Linkage Project grant (LP170101045). Analysis is based on annual curated tax and superannuation records, known as the ATO Longitudinal Information Files (ALife), which is produced by the Australian Taxation Office. All findings, opinions and conclusions are those of the authors and do not represent the views of the Australian government or any of its agencies. We would like to thank Kristen Sobeck from the Tax and Transfer Policy Institute and Viet Nguyen from the Melbourne Institute of Applied Economics and Social Research for their helpful comments.

1. Introduction
Governments around the world are seeking to improve the efficiency of programs and service
delivery through the curation and release of large administrative datasets for research. In
Australia, following the Australian government’s 2015 Public Data Policy Statement1 that
committed the government to release non-sensitive public data, there has been a wave of
activity to release administrative data for research. Consistent with this push, in 2019 the
Australian Taxation Office has compiled and released a 10 percent sample of annual
longitudinally linked individual tax and superannuation records (panel data), known as the
ATO Longitudinal Information Files (ALife). ALife data are released annually around January
each year, but due to late lodgements in tax returns, there is a two-year delay in data release.
The current release, ALife2017, tracks individuals from 1990-91 in tax records and 1996-97 in
superannuation records up to 2016-17.
The release of ALife opens-up opportunities for new research across many policy domains,
including income distribution and dynamics and the labour market. Perhaps less obvious is that
the data creates important new opportunities for research on retirement. Prior to ALife,
retirement income analysis relied on the use of nationally representative annual survey data,
especially individual panel data from the Household, Income and Labour Dynamics in
Australia (HILDA) Survey and repeated cross-sectional data from the Australian Bureau of
Statistics’ Household Income and Wealth Survey. There are several advantages of ALife over
these surveys. First, the large number of observations in ALife provide new opportunities to
conduct statistically robust analysis on sub-groups of interest that may be targeted by policy.
For example, ALife allows for analysis of responses to the Low Income Superannuation Tax
Offset (LISTO), introduced in 2012, that targets low-income earners. The longitudinal
dimension of ALife means that it can be used to also examine differences in sub-group
responses over time, which because of differences in their life circumstances and experiences,
are often varied. Second, there is a well-established literature on survey non-response and
response error and bias in relation to questions that have clear socially (un)desirable answers
such as income (see Moore and Welniak (2000) for a review), that give analysis with
administrative data an advantage. Third, ALife includes criteria for program eligibility which
1 https://www.pmc.gov.au/sites/default/files/publications/aust_govt_public_data_policy_statement_1.pdf
allows for more precise estimation of program effects. For example, LISTO eligibility depends
on taxable income from specific income sources and concessional superannuation
contributions, which are not available in other datasets.2 Finally, the new historical data in
Alife2017 extends further back than existing survey data, which allows for new analysis of
long-term trends and policy impacts.3
In this paper, we provide a brief overview of ALife for researchers and showcase its potential
for superannuation and retirement income policy research in Australia using the initial ALife
release — Alife2016, which was the version available at the time of analysis. To do this, we
first describe briefly the retirement income system and policy landscape in Australia to better
understand the utility of ALife data for retirement research (section 2). Following this, to better
understand the underlying Alife population and the superannuation data, we compare the ALife
sampling frame with population estimates from ABS Census (section 3), provide an overview
of ALife content (section 4), compare ALife superannuation data with that from the HILDA
Survey (section 5) and present longitudinal superannuation information for one-year cohorts
(section 6). In concluding (section 7), we summarise ALife’s strengths and areas for future
development. Like other administrative datasets, ALife is constantly evolving and these
developments, where possible, will be incorporated into future ALife releases.
2. Superannuation and retirement income policy in Australia
Retirement income policy in Australia is based on three pillars: the means tested and publicly
funded Age Pension; superannuation, a compulsory employer-funded private retirement
pension; and voluntary private savings, including voluntary private contributions to
superannuation, that are supported through tax concessions and targeted government payments.
A feature of the Australian system is the high interdependency of the three pillars, due mainly
to the income and assets tests of the Age Pension, which means that Age Pension payments
depend on the accumulation of private savings (whether in superannuation or not). This
interdependency potentially incentivises people to trade-off higher savings from private
sources for greater access to the publicly-funded Aged Pension, which has fiscal implications.
As identified by the Productivity Commission (2015), the margins where this occurs and the
fiscal implications of this are not well understood. The release of ALife is an important
2 Taxable income up to $37,000, with at least 10% from business income or earnings.
3 The first wave of HILDA is 2000 and 1995 in the Household Income and Wealth Survey.

development in efforts to understand superannuation accumulation and deaccumulation
behaviour in response to tax, superannuation and pension reforms. Research by the authors is
currently underway to examine some of these interrelationships and their fiscal implications.4
Below we provide a brief introduction to superannuation in Australia. For more detailed
information about the superannuation system, including recent changes, see the Australian
Taxation Office website (https://www.ato.gov.au/Individuals/Super/).
2.1. The superannuation system
Superannuation was first introduced in the 19th century for select white collar workers,
including public servants, but was made compulsory for most employees from April 1992 (see
Nielson and Harris (2010) for a chronology of superannuation in Australia). From 1992,
employers were required to make minimum contributions to their employees’ retirement,
except for employees paid less than $450 in a calendar month; those aged under 18 who worked
no more than 30 hours a week, and certain contractors.5 The compulsory retirement payments,
known as the Superannuation Guarantee (SG), started at 3 percent of employee pay and has
been gradually increased over time to its current rate of 9.5%.6 SG employer contributions are
generally tax deductible to the employer and are excluded from taxable income for the
employee, but are taxed at a rate of 15% on deposit into the superannuation fund (concessional
contribution).
On top of SG contributions, concessional contributions can also be made by employees
requesting that their employer salary sacrifice all or part of their pay. However, from July 2012
individuals whose aggregate income and concessional contributions are above a threshold
4 These issues are being addressed under ARC Linkage Grant LP170101045 between the University of Melbourne
and the ATO.
5 Such as freelancers or as self-employed. Other exemptions include domestic or private work not more than 30
hours per week; non-residents in Australia being paid by an employer from outside Australia and some foreign
executives who hold certain visas or entry permits under migration regulations.
6 The SG was supposed to increase to 10% on 1 July 2018; and then increase by 0.5% each year until it reached
12% on 1 July 2022. However, the 2014 federal budget deferred the proposed 2018 SG rate increases by 3
years, with the 9.5% rate remaining until 30 June 2021, and then the rate increasing by 0.5% each following
year until the SG rate reaches 12%, on 1 July 2025.
became liable to pay an extra 15% on concessional contributions (known as Division 293 tax).7
Concessional contributions are subject to an annual cap, which has been tightened over time.8
Contributions made above the cap are taxed at a higher rate — at the highest marginal tax rate
plus the medicare levy up to 2012-13, and at the individual’s actual marginal tax rate plus the
medicare levy thereafter. Employees can also make voluntary after-tax contributions, known
as personal contributions, which can be claimed until the age of 75. Personal contributions are
either deductible or non-deductible. Those that are deductible count towards the concessional
cap and are taxed in the superannuation fund. Non-deductible personal contributions are not
taxed in the superannuation fund and count towards a non-concessional (and not concessional)
contribution cap. For low income earners, if they make personal contribution to a super fund,
the government will also make a co-contribution, the amount depending on their income and
the size of the non-deductible personal contribution.
Typically, the minimum age at which one can draw down super (the preservation age) was 55
until July 2016, since then it has been increasing by one year every two years; it is scheduled
to keep increasing up until July 2024, when it will reach 60. Generally, individuals can access
their superannuation after they have reached their preservation age and are retired. Once a
person reaches the Age Pension age, which has been slowly increasing from 65 years in
financial year 2016-17 to 67 years by July 2023, there is no requirement to be retired to access
superannuation. Access to superannuation prior to preservation age is possible, but only under
certain conditions — extreme financial hardship, terminal illness, temporary residency, a
superannuation balance less than $200 or on compassionate grounds. For those beyond their
preservation age, but less than 60, superannuation income received is taxed at the marginal tax
rate, but there is a 15% tax offset,9 whereas super paid from age 60 is generally tax free. The
latter was introduced in July 2007 as part of the Government’s Simplified Superannuation
reforms. Prior to these reforms, superannuation income at the age of 60 and above was taxed
at the same rate as at the age below 60 (marginal tax rate less a 15% tax offset). Benefits can
be paid as either a lump-sum or as an income stream, but if the latter is taken, there are
requirements for minimum payments to be made.
7 The threshold was $300,000 from 1 July 2012-30 June 2017, then it was reduced to $250,000.
8 From July 2018, people with super balances of less than $500,000 can carry forward unused concessional caps.
9 Tax offsets are available for superannuation income paid prior to age 60 depending on individual circumstances.

3. Sample design
The initial ALife2016 sample is a 10 percent random sample of the ATO’s 2016 client register
of tax filers regularly updated since 1980, including temporary visa holders and people who
died prior to 2016.10 The 10% random sample is called ALife’s ‘broad sample’. To draw the
random sample from the client register, each client is given a unique permanent random number
between 0 and 1 and clients with a number less than 0.1 are included in the sample. In effect
this means that the selection of each client is an independent Bernoulli trial with a 10% chance
of selection. Historical information is added retrospectively by tracking individuals of the broad
sample back through time via their tax file number. In each release of ALife following initial
sample, the broad sample is updated by a 10% random sample of people added to the client
register since the previous annual release.
From the broad sample, ALife comprises individuals with at least one tax or superannuation
record from 1990-91 with no blank rows in the dataset. This means that individuals from the
broad sample may appear in one, both or none of the superannuation and tax records in ALife.
A small number of individuals who face relatively high risk of re-identification (such as those
aged 95 or more) are excluded from Alife.
10 The ATO client register contains individuals (including sole traders) who are not tax lodgers, e.g. people who
have a tax file number who have not lodged a tax return.

Figure 1: Comparison of the of the distribution of people by age in the ATO client
register against the ABS’s Estimated Resident population, 30 June 2014
To help users understand the client register, the ALife sample and their relationship to
population measures, we compare the client register to the ABS Estimated Resident Population
(ERP) in 2014 (Figure 1). ERP is the official measure of Australia’s population, based on the
concept of ‘usual residence’.11 For this exercise, we exclude around 1.8 million (out of 31.7
million) people from the client register who do not have date of birth. In Figure 1, the ERP
estimates are shown by the dotted line and the client register is the solid black line at the top of
the distribution. From Figure 1, the client register contains far more individuals overall — 31.7
11 Usual residence are people, regardless of citizenship, who usually live in Australia, except for diplomats and
their families and includes usual residents who are overseas for less than 12 months. It excludes overseas visitors
who are in Australia for less than 12 months. The ERP is based on the results of the Census of Population and
Housing, adjusted for net undercount and Australian usual residents temporarily overseas on census night. The
ERP is compiled as at 30 June of each census year and updated quarterly between censuses for Australia, states
and territories and annually for smaller areas. Population measures based on place of usual residence are also
referred to as the de jure population. More details about the concept of ERP, as adopted by the ABS for official
population estimates, are contained in Information Paper: Population Concepts, 2008 (cat. no. 3107.0.55.006) and
Population Estimates: Concepts, Sources and Methods (cat. no. 3228.0.55.001).

million compared to 23.5 million for the ABS estimated resident population — with the
difference most pronounced during working age. To reconcile the ERP and the client register,
we link information from other administrative datasets including: personal income tax returns;
superannuation contribution statements; social security payments summaries; pay as you go
(PAYG) payment summaries; distributions from partnerships and trusts; divided distributions
from companies; education data and temporary work visa departure dates.
The main observation to be made from Figure 1 is that tax lodgers and visible non-lodgers
(social security recipients and others observed in the administrative data, such as those in
PAYG payment summaries and students), or the blue and green sections, are a reasonable
approximation of the ABS ERP in 2014. The Australian Taxation Office is currently
conducting work to develop population measures that will more closely reflect ERP.
The difference between the client register and ERP estimates, the area between the hard-black
line and the dotted black line can be mostly explained by three groups at 30 June 2014 —people
in the client register who are deceased (red section) ; foreigners who have left/yet to arrive in
Australia (orange section) and citizens who do not appear in any dataset since 2000 and who
are likely to be overseas (yellow section).12 The blank section reflects those who are not seen
in any dataset in 2014 and cannot be reconciled.
4. ALife content
The unit of analysis in ALife is the individual tax filer who is tracked over time using their
unique client identification. Individual information available in Tax Return forms, Super
Member Contribution Statements (MCS) forms and the Self Managed Superannuation Fund
(SMSF) annual returns are included in ALife, including age, gender, residential address (ABS
SA4 level category) and occupation. In the current standard release of ALife, there is no partner
identifier. Generating a household identifier is in an experimental phase of development and
will be made available in future ALife releases.
Below we provide an overview of the superannuation and tax information in ALife. For more
detailed information, including how to access the data, refer to material on the ALife website
(https://alife-research.app/).
12 These are people who are observed in the data in the future or have been observed in the past.
4.1. Superannuation information
Superannuation data in ALife is annual financial-year curated superannuation balance and
contribution information from all MCS and SMSF annual returns forms reported to the ATO.
All providers are required to report details of each member’s superannuation account in MCS
or SMSF annual returns forms regardless of whether they are regulated by the Australian
Prudential Regulation Authority (APRA). Details of what are collected in the MCS and SMSF
annual returns forms are available on the ATO website.13 Identifying information of the
member in the MCS forms (e.g. name, date of birth, address) and provider (e.g. name, address,
contact details) are excluded in the standard ALife release. While provider identifying
information is omitted, ALife does distinguish balances and contributions by provider type —
APRA regulated, self-managed and exempt public sector super schemes (not APRA regulated).
While all filed tax records are available in each year of ALife, the coverage of superannuation
in ALife varies over time in accordance to legislative requirements for fund managers to report
MCS forms to the ATO. Prior to 2013 (financial year 2012-13), fund managers were only
required to lodge MCS forms to the ATO for accounts that received contributions during the
financial year. This means that inactive accounts will be missing from ALife prior to 2013,
which particularly affects data on retirees.14 In 2013, it became a requirement for super funds
to report all of their members’ accounts (both active and inactive) to the ATO , which means
that ALife only has full superannuation accounts coverage from here on.15 For self-managed
superannuation funds, which are not required to produce MCS, the ATO extracts all relevant
information from their annual returns, which all fund managers are legally obliged to report.
A feature of the ALife superannuation data is the inclusion of rich information that is derived
by the ATO for administering tax and superannuation regulations that are vital for policy
evaluation. In summary, these include:
• each member’s concessional and non-concessional cap and contributions;
13 https://www.ato.gov.au/Forms/Super-member-contribution-statement-for-2012-13-and-later-financial-years/
14 Some superannuation fund managers voluntarily provided MCS for inactive accounts, possibly because it was
administratively easier.
15 Since 1 July 2012, obligations under Division 390 have been extended as a result of the Stronger Super reforms,
which required MCS statement to be extended to all members, including those for whom no contributions were
made. The main motivation for this was to reunite people with lost superannuation accounts.

• tax liability for excess contributions;
• super co-contributions; and
• member’s Division 293 tax liability.
While there is comprehensive information in ALife about superannuation contributions and
annual balance information from 2012-13, there is currently incomplete information available
on draw-down and returns to superannuation. Superannuation payments, made to account
holders, in MCS and SMSF forms are only available for lump-sum withdrawals. The ATO does
hold superannuation payment summaries (for 2008-2018) that include taxable superannuation
income streams, but not untaxed streams (for members aged 60 and over) and these are yet to
be included in ALife. Members with zero balances are retained in ALife, which allows for the
identification of complete draw-down.
4.2. Tax record information
Tax data in ALife consists of annual financial-year’s incomes, deductions, tax rebates and
offsets, medicare levy and surcharge and other tax information from the individual tax returns,
including those of sole traders. In years where a tax return was not lodged, the individual’s
information for that year is missing in ALife. For information on the items collected in
individual tax returns, visit the ATO website.16 For reasons of confidentiality, tax payers
identifying information is removed or generalized, for example, date of birth is generalized to
age at 30 June (to integer level), and occupation is generalized to the 2-digit level of the
Australian and New Zealand Standard Classification of Occupation codes. In addition to
individual information from tax return forms, ALife includes the outcomes of tax assessment.
For more information on the components of individual income, deductions and other items
from individual income tax returns, see Bond and Wright (2018).
5. Sample characteristics
In this section, we compare the superannuation balances and characteristics of superannuation
members between ALife and HILDA. To showcase some of the advantages of ALife over past
surveys, we also present superannuation statistics over time and across occupation categories.
16 https://www.ato.gov.au/Forms/Prior-years-individuals-tax-return-forms---schedules/.

The total value of superannuation balances in the ALife sample in 2016-17 is $208 billion
(2017 values), which is somewhat lower than 10% of the total value of $2.5 trillion reported
by the Australian Prudential Regulation Authority (APRA) (APRA 2017). The difference may
be due to the exclusion of people from ALife who have a high risk of re-identification and the
exclusion of unmatched superannuation accounts belonging to people who cannot be specified
in the ATO database (due to missing identification information).
In Table 1 we compare the average superannuation membership rates and average balances for
the ALife sample against those from HILDA, separately for males and females across birth
cohorts in 2014. We choose 2014 as a comparison year because it is the latest year
superannuation data is available in HILDA as part of its wealth module. The statistics in
HILDA, but not ALife, are population weighted and both are deflated using the December 2014
CPI, with a base year of December 2017.
An interesting observation is differences in the superannuation gender gap estimated under the
two datasets. Across all those born before 1998 (aged 17 and older) the average female
superannuation balance in 2014 in HILDA is 41% lower than for men — $67,774 compared to
$115,525 for men. In contrast, the comparable gender gap in 2014 in ALife is 26% — $63,751
compared to $93,687. As a point of comparison, the gap estimated for the Survey of Income
and Wealth is 44% (Clare 2015).17 The smaller gender gap in ALife can be explained by two
factors. First, in Alife there is a greater proportion of women in Alife with non-zero
superannuation balances than in HILDA. Second, among people with non-zero superannuation
balances, the average difference between male and female balances is smaller in Alife.
A possible explanation is that in men in surveys may be more likely to over-inflate their wealth,
and/or be too embarrassed to answer questions on wealth, because it is more socially desirable
for them to be wealthy.18 An alternative explanation is that there are differences in the base
17 Average estimates from the Australian Bureau of Statistics’ Survey of Income and Wealth, published by the
Australian Superannuation Funds of Australia for all male members aged 15 and over (at June 2014) are $98,535
and $135,000 respectively. For females the relevant statistics are $54,916 and $83,000.
18 Non-response is similar by gender, 17% for females and 15% for males in 2014. However, non-response appears
more selective for males, with imputed values 25% lower than reported values. In contrast, imputed values for
females are 2% higher than reported values on average.

population that skew the data, for example, ALife may capture working-age short-term
residents who are more likely to be male (Australian Bureau of Statistics 2016).
In terms of characteristics of superannuation members with a non-zero balances that are
common to ALife and HILDA (Table 2), we observe only minor differences in average
statistics. As discussed above, the current version of ALife doesn’t include a household
identifier and around a quarter of all coupled superannuation members (16.7% out of 65.8%)
have a missing partner identifier.

Table 1: Average superannuation balances for ALife2016 10% sample in 2014a
Birth cohort Average balance, all
Average balance, non-zero
balances
Proportion with non-zero
balances (%)c
HILDAb ALife HILDAb ALife HILDAb ALife
$A2017 $A2017 $A2017 $A2017 % %
Females
All 67,774 63,751 97,723 95,786 69 67
1930-1933 13,441 16,736 131,038 247,516 10 7
1934-1937 27,303 45,012 205,259 298,311 13 15
1938-1941 89,957 77,814 290,910 315,964 31 25
1942-1945 126,067 125,246 318,063 309,211 40 41
1946-1949 130,269 160,523 284,188 298,325 46 54
1950-1953 172,952 162,133 268,160 234,413 65 69
1954-1957 142,637 135,019 189,555 173,135 75 78
1958-1961 112,369 109,510 133,335 129,120 84 85
1962-1965 94,923 85,188 114,282 97,861 83 87
1966-1969 87,690 70,253 102,705 80,489 85 87
1970-1973 56,924 57,335 64,005 65,839 89 87
1974-1977 47,103 45,301 52,675 52,596 89 86
1978-1981 40,167 36,249 44,010 42,060 91 86
1982-1985 24,877 25,013 29,940 29,558 83 85
1986-1989 13,521 14,701 16,655 18,197 81 81
1990-1993 5,747 6,229 6,769 8,290 85 75
1994-1997 1,138 955 2,039 1,949 56 49
Males
All 115,525 93,687 151,942 130,042 76 72
1930-1933 29,416 40,351 138,845 262,030 21 15
1934-1937 98,049 82,766 315,307 322,735 31 26
1938-1941 185,279 131,844 441,747 370,707 42 36
1942-1945 154,127 182,571 351,682 365,634 44 50
1946-1949 281,953 213,130 438,639 345,992 64 62
1950-1953 296,200 224,303 378,274 291,493 78 77
1954-1957 231,816 207,950 289,474 249,042 80 84
1958-1961 201,067 168,685 221,595 192,203 91 88
1962-1965 168,388 131,443 183,073 146,841 92 90
1966-1969 138,943 103,769 154,468 115,666 90 90
1970-1973 106,002 82,680 115,274 92,023 92 90
1974-1977 83,248 62,876 88,677 70,314 94 89
1978-1981 50,805 45,967 54,334 51,496 94 89
1982-1985 34,488 31,549 37,202 35,945 93 88
1986-1989 18,397 18,269 20,403 21,739 90 84
1990-1993 8,201 7,666 9,545 10,008 86 77
1994-1997 1,453 1,351 2,496 2,807 58 48 aWe do not report values for people born before 1930 because of small cell sizes. bPopulation weights are used to generate
HILDA estimates.
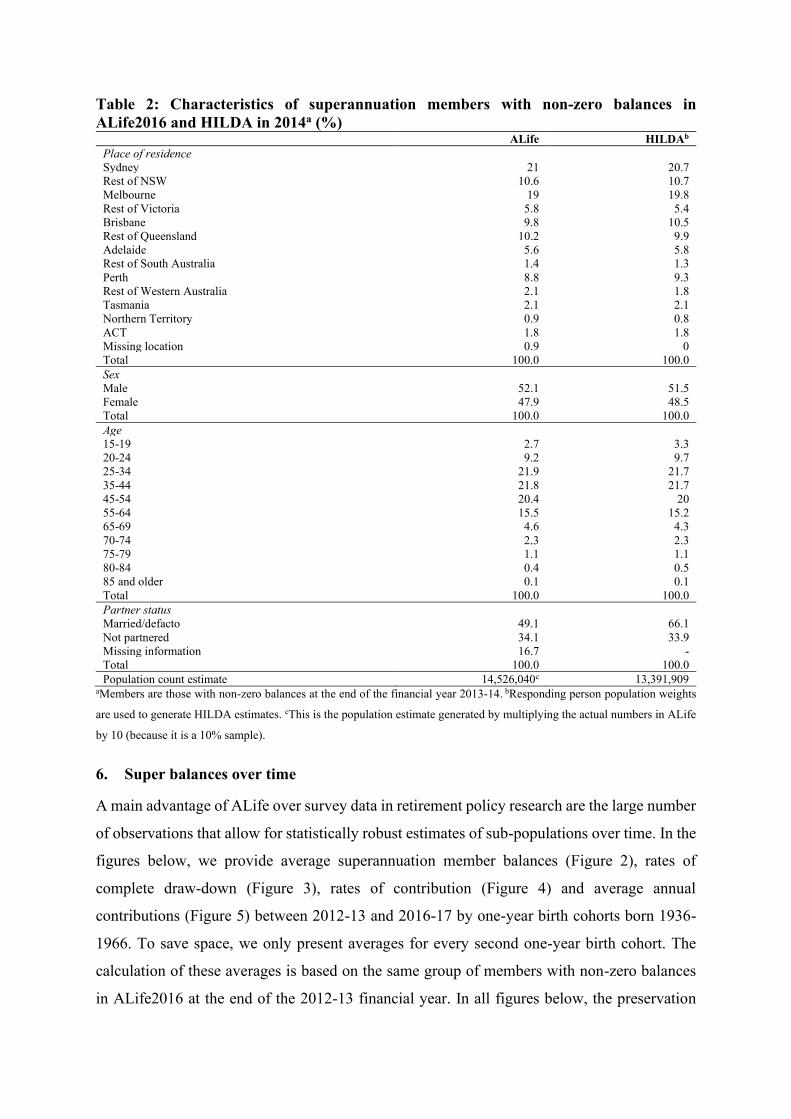
Table 2: Characteristics of superannuation members with non-zero balances in
ALife2016 and HILDA in 2014a (%)
ALife HILDAb
Place of residence Sydney 21 20.7
Rest of NSW 10.6 10.7
Melbourne 19 19.8
Rest of Victoria 5.8 5.4
Brisbane 9.8 10.5
Rest of Queensland 10.2 9.9
Adelaide 5.6 5.8
Rest of South Australia 1.4 1.3
Perth 8.8 9.3
Rest of Western Australia 2.1 1.8
Tasmania 2.1 2.1
Northern Territory 0.9 0.8
ACT 1.8 1.8
Missing location 0.9 0
Total 100.0 100.0
Sex
Male 52.1 51.5
Female 47.9 48.5
Total 100.0 100.0
Age 15-19 2.7 3.3
20-24 9.2 9.7
25-34 21.9 21.7
35-44 21.8 21.7
45-54 20.4 20
55-64 15.5 15.2
65-69 4.6 4.3
70-74 2.3 2.3
75-79 1.1 1.1
80-84 0.4 0.5
85 and older 0.1 0.1
Total 100.0 100.0
Partner status Married/defacto 49.1 66.1
Not partnered 34.1 33.9
Missing information 16.7 -
Total 100.0 100.0
Population count estimate 14,526,040c 13,391,909 aMembers are those with non-zero balances at the end of the financial year 2013-14. bResponding person population weights
are used to generate HILDA estimates. cThis is the population estimate generated by multiplying the actual numbers in ALife
by 10 (because it is a 10% sample).
6. Super balances over time
A main advantage of ALife over survey data in retirement policy research are the large number
of observations that allow for statistically robust estimates of sub-populations over time. In the
figures below, we provide average superannuation member balances (Figure 2), rates of
complete draw-down (Figure 3), rates of contribution (Figure 4) and average annual
contributions (Figure 5) between 2012-13 and 2016-17 by one-year birth cohorts born 1936-
1966. To save space, we only present averages for every second one-year birth cohort. The
calculation of these averages is based on the same group of members with non-zero balances
in ALife2016 at the end of the 2012-13 financial year. In all figures below, the preservation

age is marked by a vertical bar spanning the ages 55 and 56, which reflects the changes in the
preservation age that occurred over this period (from 1 July 2015). The Age Pension age
remained constant for both men and women, which is reflected by the vertical line at 65.
Figure 2: Average superannuation balances 2013-2017 among members with non-zero
balances on 30 June 2013 ($A’000s 2017), every second one-year birth cohort born
1936-66
For the cohort of members born in 1948, who have just reached pension eligibility age in 2012-
13, their average balance is $282,540 (Figure 2). Balances for 2012-13 members over time by
quartile are also provided in Figure A.1 in appendix A.19 What is apparent from Figure A.1 is
the large discrepancy in average balances between those in the top quartile (or top 25%) and
the rest. For example, for the 1948 cohort who just reached pension age in 2012-13, the average
balance in each quartile is: $6,235 for the bottom quartile (bottom 25%); $63,912 for the 2nd
quartile (2nd bottom 25%); $201,924 for the 3rd quartile (2nd top 25%) and $858,576 for the 4th
quartile (top 25%). Comparing balances across quartiles, what is also apparent is that most of
19 Members balances in 2012-13 are ranked from lowest to highest and are divided into four equal groups or
quantiles.

the disparity between the top quartile and the others is among cohorts approaching or in
retirement years, which is likely to reflect differences in the use of superannuation in
retirement.20 For members with balances in the top half, these results suggest that
superannuation is a liquid and tax-favourable place to park wealth in their retirement years,
while for those in the bottom half, superannuation is more of a reservoir of wealth from which
they can draw-on in retirement, for example, to pay-off debt, to re-invest and to fund retirement.
6.1. Superannuation draw-down over time
Over time we find little evidence that people, on average, run-down superannuation balances
after reaching the preservation age (Figure 2), which is consistent with the findings of Reeson
et al. (2016), who found similar results using a sample of 150,000 members of a large fund.
Instead, across the cohorts born prior to 1960 who pass (or have passed) preservation age over
the period, we find that superannuation balances have grown, which is due to superannuation
returns and contributions outstripping the rate of superannuation draw-down, except for the
oldest cohort in our analysis born in 1936 whose average balance falls. Growth in
superannuation balances is also found across all member balance quartiles, although the
greatest growth is for the top quartile (Figure A.1).
20 The discrepancy in cohort mean balances between those in the top quartile and the rest is not driven by
exceptionally high balances at the top, the discrepancy in cohort median balances between the top and the rest
is of a similar magnitude. Figures for median balances are available upon request from the corresponding author.

Figure 3: Proportion of members with non-zero balances on 30 June 2013 who
completely draw-down 2013-2017, every second one-year birth cohort born 1936-66
The rate of complete draw-down over time (Figure 3), reflected by the proportion of members
in 2012-13 who completely withdraw their superannuation by 2016-17, doubles from around
3% for those who are just short of their preservation age (cohort born 1962) to around 6-7%
for cohorts who pass their preservation age over the period (cohort born 1960).21 The largest
jump in complete drawn-down occurs for cohorts either side of the Age Pension eligibility age
– 10% for those born 1954 who are just short of the pension age by 2016-17 to 22% for those
born in 1950. For older cohorts who are well beyond pension age, the rate of draw-down over
time is similar.
However, what is clear from Figure A.2 in appendix A, is that the rate of complete drawn-down
depends heavily on the size of the initial balance. For members with balances in the bottom
50%, the rate of complete draw-down is much higher than for those with balances in the top
half and the jump in draw-down around pension age much more pronounced. For example, for
the cohort born in 1948 who have just reached pension age in 2012-13, 45% of those in the
bottom quartile withdraw their super balance completely by 2016-17; 20% of those in the
21 Gradual draw-down after age 60, for example annuities, cannot be observed in ALife.

second bottom quartile; 10% of those in the second top quartile and around 8% of those in the
top quartile. The higher rates of complete draw-down among those with smaller initial
balances, especially from pension age eligibility, does raise the likelihood that these people
will be more reliant on the Age Pension to fund retirement. However, whether the complete
draw-down of this group is a strategic decision to maximise pension income is unclear.
6.2. Superannuation contributions over time
The proportion of members in 2012-13 who make superannuation contributions declines over
time, but as for the rate of complete draw-down, there is a more marked decline in the rate of
contributions around pension age. For example, for cohort 1948 that has just reached retirement
age in financial year 2012-13, the proportion of members who contribute declines by 40% over
the time, whereas for cohort 1954 who are just short of the pension age (age 63 by 2016-17),
the decline is 9%. As for drawn-down, there are marked differences in the proportion of
members who are contributing over time by initial balance level, including prior to reaching
preservation age. For members whose balances are in the bottom quartile (25%), only around
a half are still contributing at age 50, compared to 81%, 91% and 93% in the second, third and
top quartiles. The low contribution rate of members with balances in the bottom quartile is
likely due to low rates of labour market participation among this group. Over time, cohorts
across all quartiles reduce their rates of contribution, especially after the pension age, although
this is less pronounced for members whose balances are in the bottom 25%. The contribution
rate of this group may not be affected to the same extent by reaching retirement age because
they may not have enough wealth to fund their retirement. Further, their future pension income
(which is means tested) may be relatively unaffected from the accumulation of more
superannuation past their pension age. It is those in the middle two groups whose contribution
rate is most affected by reaching the pension age.
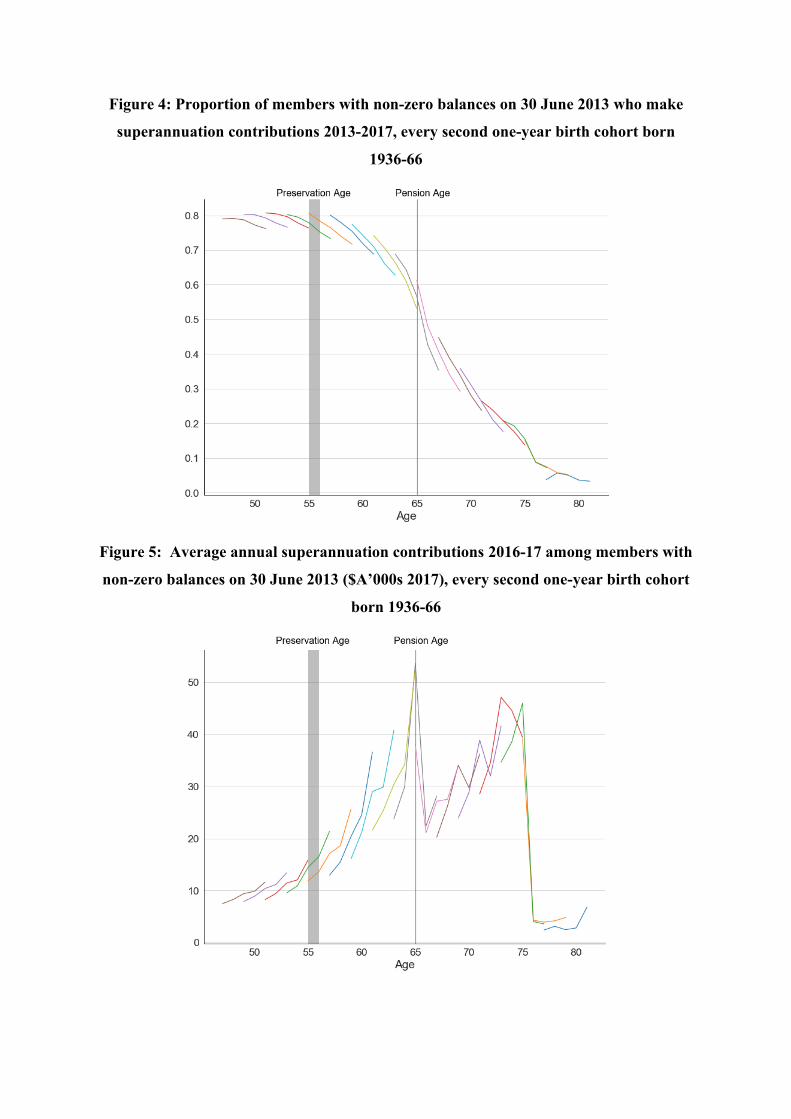
Figure 4: Proportion of members with non-zero balances on 30 June 2013 who make
superannuation contributions 2013-2017, every second one-year birth cohort born
1936-66
Figure 5: Average annual superannuation contributions 2016-17 among members with
non-zero balances on 30 June 2013 ($A’000s 2017), every second one-year birth cohort
born 1936-66

The amount that members contribute is estimated to ramp-up dramatically among cohorts that
are close to the pension age. For example, among those born in 1952 who just meet the pension
age by 30 June 2017, we estimate that their average contribution increases from around $21,626
per year to around $52,589 per year, which is around a 43% increase between 2012-13 to 2016-
17. This is a dramatic increase that does not necessarily represent an increase in the savings
rate, but possibly the diversion of wealth from other sources into superannuation to take
advantage of concessional tax treatment of superannuation income in the draw-down phase.
One way that wealth could be diverted is by liquidating assets to fund consumption, allowing
a greater share of labour earnings to be diverted to superannuation. The ramp-up in
contributions in the lead-up to retirement is apparent regardless of starting balances (Figure
A.4), but is more pronounced for members whose balances are in the top 25%. For this group,
although they may not be eligible for the pension, the pension age can still act as a
psychological marker for a socially appropriate time to retire. The greater ramp-up in
contributions among those in the top quartile suggests that those with greater superannuation
balances to start with are more able to ramp-up contributions in the lead-up to retirement to
take advantage of concessional tax treatment during the draw-down phase. Following the ramp-
up in average contributions in the lead-up to pension age, there is an equally dramatic decline
in average contributions after pension age, which coincides with increased rates of retirement.
Interesting, among those who remain attached to work after the retirement age, members again
continue to increase their contributions over time in the lead-up to age 75, the maximum age
at which people can legally contribute towards superannuation. Also of interest is the apparent
kink in the increases in contributions over time, which coincides with the 2015-16 drop in
superannuation returns. This kink is most noticeable amongst people who remain attached to
work after the pension age, which again points to contributions at this time being driven more
by expected returns from superannuation relative to other investments rather than members
building their nest egg.
7. Super balances across occupations
As discussed above, a feature of ALife is being able to generate statistically robust estimates
of population sub-groups. In Table 4, we present information on labour earnings (wages and
salaries plus reportable employer superannuation contributions), contributions and
superannuation balances by occupation subgroups for those who lodge a tax return in 2013-
14.22 Despite the overall high coverage of superannuation among tax filers, an interesting result
from Table 4 is that variation across occupations is highly related to skill level (and earnings).
At one end of the spectrum, less than 5% of highly educated workers who are employed in
professional jobs (excluding the occupational code “other professions”) miss out on
superannuation contributions. In contrast, around 15% of low skilled workers, such as labourers
and food preparation assistants, miss out on superannuation contributions. The lower coverage
among low-skilled workers is mostly likely because they are low paid and, when combined
with casual intermittent employment, are more likely to earn less than $450 per month to
qualify for the Superannuation Guarantee. Contributions as a share of earnings (excluding those
with zero contributions) are relatively uniform across occupations at around the minimum,
except for Protective Service Workers.
A point of note is that median contributions, as a share of labour earnings across most
occupations, is close to the minimum Superannuation Guarantee (SG) in 2013-14 of 9.25%.
However, it is important to stress that SG payment made by employers is calculated as a percent
of Ordinary Time Earnings (OTE), not labour earnings. OTE is what employees are paid for
their ordinary hours of work and excludes payments for overtime, which are part of labour
earnings.23 This is a likely reason why estimates of superannuation contributions as a share of
labour earnings are less than employer responsibilities under the SG for some occupations.
The final column in Table 4 is the average balances of members who have non-zero balances
by occupation. Given the relative consistency of the superannuation contribution rates as a
share of labour earnings, the distributions across occupation groups appears closely linked to
average labour earnings. However, it is worth keeping in mind that these are averages across
all people with non-zero balances who filed a tax return in 2013-14. As shown in Figure A.1,
discrepancies in super balances become much more pronounced as people approach retirement
and these balances may not reflect differences in the size of the superannuation nest egg by
occupation in retirement.
22 Information about occupation in ALife is captured via individual tax returns.
23 Where there are no agreed hours of work and no pattern of customary, regular, normal or usual hours, all hours
worked are treated as ordinary time hours.

Table 4: Average earnings, contributions and superannuation balances in ALife2016 by
occupation for those who lodged a tax return in 2013-14a
ANZSCO classifications and codes
Average labour
earningsa
Proportion with
no contributionb
Median total
contribution as
a share of
labour earningsc
Average balance of
members with non-
zero contributions
Female Male Female Male Female Male Female Male
$A2017 $A2017 % % % % $A2017 $A2017
Farm managers (12) 28,589 42,604 14.6 8.7 10.3 9.3 143,000 110,000
Hospitality managers (14) 44,468 62,092 4.1 5.0 9.4 9.3 64,764 108,000
Other managers (10,11,13) 70,190 101,000 4.9 6.3 10.0 9.9 153,000 240,000
Education professionals (24) 62,491 90,620 3.1 3.4 9.6 9.4 97,370 164,000
Health professionals (25) 59,084 94,150 2.8 2.2 9.4 9.5 83,433 176,000
ICT professionals (26) 53,965 65,275 1.6 1.6 9.8 10.3 124,000 182,000
Business professionals (22) 56,046 103,000 1.2 1.9 10.6 10.3 112,000 251,000
Legal professionals (27) 70,326 86,518 2.1 2.3 9.6 9.3 111,000 122,000
Design and engineering professionals (23) 57,407 72,860 2.5 4.9 10.4 10.9 102,000 168,000
Other professionals (20,21) 44,448 53,838 6.7 7.1 9.4 9.3 75,452 111,000
Auto & engineering trades (32) 46,806 75,861 1.8 2.3 9.8 9.3 70,333 130,000
Construction trades (33) 42,625 66,055 4.5 3.7 9.1 8.7 40,090 75,553
Electrotechnology trades (34) 30,442 47,782 10.3 9.7 9.2 8.9 30,303 48,727
Food trades (35) 57,250 72,500 2.6 3.5 9.5 9.0 79,689 96,888
Skilled animal and hort. Workers (36) 31,304 39,863 7.1 7.7 9.2 9.0 30,528 37,610
Engineering and ICT technicians (31) 29,132 38,917 5.8 5.3 9.3 9.2 36,511 61,066
Other trades and technicians (39) 30,854 57,176 7.4 5.0 9.3 9.1 36,590 92,285
Health and welfare support workers (41) 38,219 50,606 2.6 2.5 10.3 10.3 53,727 96,087
Carers and aides (42) 28,436 33,407 2.6 2.7 9.9 10.0 40,057 54,504
Hospitality workers (43) 20,922 25,267 10.3 8.7 9.1 9.1 16,073 21,844
Protective service workers (44) 61,163 65,643 2.8 3.3 12.9 12.3 96,803 131,000
Sports and personal service workers (45) 29,670 42,351 7.7 8.0 9.2 9.2 44,704 66,558
Clerks and administrative workers (50-59) 40,454 60,385 4.4 4.4 9.9 9.7 87,716 132,000
Sales and support workers (60-63) 25,833 39,938 7.7 7.5 9.4 9.2 33,148 54,520
Machine operators (70-72) 48,523 74,470 4.3 2.6 9.3 8.9 51,217 90,337
Road and rail drivers (73) 45,230 55,162 5.3 5.5 9.2 8.4 44,664 75,838
Storeperson (74) 33,289 41,243 3.8 2.8 9.2 9.1 35,291 55,209
Labourer (80) 25,365 25,762 16.3 8.6 8.8 8.4 14,129 27,203
Cleaners and laundary workers (81) 24,914 29,473 6.8 8.8 9.7 9.2 31,489 40,207
Construction and mining labourer (82) 50,247 59,577 8.3 6.3 9.1 8.4 43,917 56,021
Factory process worker (83) 31,647 42,918 5.3 4.3 9.1 8.8 36,917 54,274
Farm, Forestry and and garden worker (84) 23,018 31,387 12.2 9.9 9.2 9.2 29,845 46,162
Food preparation assistant (85) 20,625 17,062 13.2 19.1 9.4 8.8 20,959 9,124
Other labourer (89) 27,507 42,180 6.1 6.5 9.3 9.0 34,888 57,180
All 42,392 65,402 4.6 5.1 9.7 9.3 76,965e 114,731d aWages and salaries and employer reportable superannuation contributions. bProportion of members with positive reported
wages and salaries, but with no contributions in 2013-14. cIncludes concessional and post-tax contributions, excluding
members who made non-zero contributions. dThese are different to figures reported in Table 1because balances in this table
are for those who report a tax return in 2013-14.

8. Conclusions
The generation, curation and release of ALife data to trusted users (consistent with the UK’s
‘Five Safes Framework’ adopted by the ABS), provides researchers with new opportunities in
several domains of research.24 The key advantages of ALife over survey data are the large
number of observations that allow for robust sub-group analysis; avoidance of bias in responses
related to social desirability of income and wealth reporting and the inclusion of administrative
information that allows for the identification of groups affected by policy changes.
This study has showcased some of these advantages. Specifically, we bring to light potential
bias associated with the over-reporting of superannuation balances by males in survey data,
possibly due to the social desirability of wealth. By tracking cohorts over time according to
their initial superannuation balances, we show remarkable differences in accumulation and
deaccumulation behaviours by initial balance levels. Most importantly, we show stark
differences in average balances and draw-down behaviour between members whose balances
are in the bottom quartile compared to those whose balances are in the top. Importantly, these
differences are more exaggerated for cohorts at pension eligibility age. This appears to be more
because those with high initial balances are more able to park their wealth in superannuation
to take advantage of the concessional tax treatment of superannuation income, rather than
increased savings for retirement. This is reflected by large increases in contributions in the
lead-up to the pension age and low rates of complete withdraw around pension age.
Based on comparison of the ALife sampling frame with the ABS’s Estimated Resident
Population data, our conclusion is that the sampling frame is highly representative of the
Australian Census population. Similarly, characteristics of superannuation members with non-
zero balances from the 10% sample are also highly consistent with the nationally representative
HILDA survey that is commonly used to report national statistics (see for example Wilkins et
al. 2019).
ALife, like all early-life datasets, is in the process of development. Two of the key areas that
will be made available in future releases are the inclusion of family identifiers and a module of
PAYG non-lodgers. These will further expand the use of ALife as a tool for household and
labour market analysis.
24 The ‘Five Safes Framework’ was devised by the UK’s Office of National Statistics.

References
Australian Bureau of Statistics (2016). Overseas Arrivals and Departures, Australia, Jun 2016,
cat. no. 3401.0.
Australian Prudential Regulation Authority (APRA) (2018). Annual Superannuation Bulletin
at June 2017, https://www.apra.gov.au/sites/default/files/2018-ASB-201706.pdf, APRA,
Sydney.
Bond, D. and Wright, A. (2018). A Snapshot of the Australian Taxpayer, Australian
Accounting Review 87(28):598-615.
Clare, R. (2015) Superannuation account balances by age and gender, Australian
Superannuation Funds of Australia (ASFA), Sydney.
Moore, J.C. and Welniak, E.J., (2000). Income Measurement Error in Surveys: A
review. Journal of Official Statistics, 16(4):331-61.
Nielson, L. and Harris, B. 2010. Chronology of superannuation and retirement income in
Australia, Parliament of Australia,
https://www.aph.gov.au/About_Parliament/Parliamentary_Departments/
Parliamentary_Library/pubs/BN/0910/ChronSuperannuation, (accessed 9 September 2019).
Productivity Commission (2015). Superannuation Policy for Post-Retirement, Commission
Research Paper, Canberra.
Reeson, A., Sneddon, T., Zhu, Z., Stephenson, A., Hobman, E.V., Toscas, P. (2016).
Superannuation drawdown behaviour: An analysis of longitudinal data. CSIRO-Monash
Superannuation Research Cluster working paper.
Wilkins, R., Laß, I., Butterworth, P and Vera-Toscano, E. (2019). The Household, Income and
Labour Dynamics in Australia Survey: Selected Findings from Waves 1 to 17 Melbourne
Institute: Applied Economic & Social Research, The University of Melbourne.

Appendix A: Superannuation balances and flows over time by 30 June 2013 balance
quartile
Figure A.1: Average superannuation balances 2013-2017 among members with non-
zero balances on 30 June 2013 ($A’000s 2017), every second one-year birth cohort born
1936-66 by 30 June 2013 balance quartile

Figure A.2: Proportion of members with non-zero balances on 30 June 2013 who
completely draw-down 2013-2017, every second one-year birth cohort born 1936-66 by
30 June2013 balance quartile

Figure A.3: Proportion of members with non-zero balances on 30 June 2013 who make
superannuation contributions 2013-2017, every second one-year birth cohort born 1936-
66 by 30 June 2013 balance quartile

Figure A.4: Average annual superannuation contributions 2016-17 among members
with non-zero balances on 30 June 2013 ($A’000s 2017), every second one-year birth
cohort born 1936-66 by 30 June 2013 balance quartile