WORKING PAPER SERIES - Scuola Superiore … · LEM WORKING PAPER SERIES A Walk on the Wild Side:...
48
LEM LEM WORKING PAPER SERIES A Walk on the Wild Side: ‘Predatory’ Journals and Information Asymmetries in Scientific Evaluations Manuel Bagues ° Mauro Sylos-Labini § Natalia Zinovyeva ¶ ° Aalto University, Helsinki, Finland, and IZA § University of Pisa, Italy ¶ Aalto University, Helsinki, Finland 2017/01 October 2017 ISSN(ONLINE) 2284-0400
Transcript of WORKING PAPER SERIES - Scuola Superiore … · LEM WORKING PAPER SERIES A Walk on the Wild Side:...

LEMLEMWORKING PAPER SERIES
A Walk on the Wild Side: ‘Predatory’ Journals and
Information Asymmetries in Scientific Evaluations
Manuel Bagues ° Mauro Sylos-Labini §
Natalia Zinovyeva ¶
° Aalto University, Helsinki, Finland, and IZA§ University of Pisa, Italy
¶ Aalto University, Helsinki, Finland
2017/01 October 2017ISSN(ONLINE) 2284-0400
A Walk on the Wild Side: ‘Predatory’ Journals and
Information Asymmetries in Scientific Evaluations
Manuel Bagues ∗ Mauro Sylos-Labini † Natalia Zinovyeva ‡
September 14, 2017
Abstract
In recent years the academic world has experienced a mushrooming of jour-nals that falsely pretend to be legitimate academic outlets. We study this phe-nomenon using information from 46,000 researchers seeking promotion in Italianacademia. About 5% of them have published in journals included in the blacklistof ‘potential, possible, or probable predatory journals’ elaborated by the schol-arly librarian Jeffrey Beall. Data from a survey that we conducted among theseresearchers confirms that at least one third of these journals do not provide peerreview or they engage in some other type of irregular editorial practice. We iden-tify two factors that may have spurred publications in dubious journals. First,some of these journals have managed to be included in citation indexes such asScopus that many institutions consider as a guarantee of quality. Second, weshow that authors who publish in these journals are more likely to receive apositive evaluation when (randomly selected) scientific evaluators lack researchexpertise. Overall, our analysis suggests that the proliferation of ‘predatory’journals may reflect the existence of severe information asymmetries in scientificevaluations.
Keywords: Scientific misconduct, academic evaluations.
JEL Classification: I23.
∗Aalto University and IZA, Helsinki, Finland; email: [email protected]†University of Pisa, Italy; email: [email protected]‡Aalto University, Helsinki, Finland; email: [email protected]
1

1 Introduction
The academic community has suffered in recent years the emergence of a new industry
of journals which engage in deceptive and dishonest practices, falsely claim to offer peer
review and publish any article in exchange for a fee (Butler 2013, Clark and Smith 2015,
Kolata 2013). This phenomenon has been studied by the scholarly librarian Jeffrey
Beall, who maintained between 2010 and 2017 a list of ‘potential, possible, or probable
predatory’ journals and publishers who allegedly engaged in fraudulent practices. In
January 2017 Beall’s list included 1294 standalone journals and 1155 publishers.1
The rise of ‘predatory’ publishers has been linked to the emergence of the open-
access model (Beall 2012). This system, favored by the newly available ICT technolo-
gies, led to the appearance of thousands of new academic journals that are funded
through publication fees and are free of all restrictions on access.2 Some of these jour-
nals have rapidly managed to gain scientific recognition for publishing high-quality
articles (e.g. PlosOne), but others have been accused of dubious behavior. The lack of
standards of some of these journals was documented by a sting operation conducted by
journalist John Bohannon. He submitted a fake medical paper with easily detectable
flaws to 304 open-access journals, including a hundred which were included in Beall’s
list. Around half of these journals accepted the paper without questioning its content
or providing meaningful feedbacks (Bohannon 2013). Among Beall’s list journals the
acceptance rate was above 80%.
The revenues of traditional journals typically rely on the willingness of ‘readers’
- mainly academic libraries - to pay for a subscription. Instead, most open-access
journals depend on authors’ publication fees. The shift of the burden of payment from
readers to authors may have produced an important change in the incentive system.
Readers tend to be willing to pay only for journals that they consider worth reading.
1Beall unexpectedly took down his list in January 2017. A cached copy is available at https:
//archive.fo/6EByy).2See, for example, the Berlin Declaration on Open Access to Knowledge in the Sciences and Human-
ities (https://openaccess.mpg.de/Berlin-Declaration) and the Bethesda Statement on Open AccessPublishing (http://legacy.earlham.edu/ peters/fos/bethesda.htm). For a discussion on the discontentwith traditional publishers see Harvie et al. (2013).
2

Instead, some authors may have an incentive to pay for publishing in dubious journals
in the hope that their ‘principals’ (e.g. members of evaluation committees) will not
be able to distinguish legitimate journals from predatory ones. Furthermore, some
inexperienced or naive researchers may be unaware of the fraudulent nature of some
journals and they may fall prey of deceptive publishers.
In this paper we study the extent of predatory publications using data from Italy
and we analyze two ways in which authors may benefit from these publications. First,
many institutions and evaluation agencies use ‘whitelists’, such as Scopus, to identify
legitimate journals. We use survey information to investigate whether these whitelists
include any predatory journals. Second, we hypothesize that ‘principals’ with a weak
research background may lack the ability to assess accurately the quality of journals
where authors have published and, as a result, they may give credit to dubious journals.
We use data from a large-scale evaluation to test this hypothesis.
Our main database includes information on the CVs and the evaluations received
by more than 46,000 researchers who participated in the 2012 edition of the Italian
National Scientific Qualification (NSQ). This qualification is required for promotion to
associate or full professorship in Italy. The sample accounts for around 61% of assistant
professors and 60% of associate professors in the country. Applications were evaluated
by 184 evaluation committees, one per scientific field, and, as we explain in more detail
below, the members of these committees were selected by random draw out of a pool of
eligible evaluators. Each panel assessed more than 300 CVs, which included an average
of 46 publications each.
To detect publications in dubious journals we use Beall’s list. According to our
findings, about 5% of applicants have published in journals that Beall has classified
as ‘potential, possible, or probable predatory’. Publications in these journals are more
common in Southern Italy and, across the different fields, they are highest in Business
and Economics. Researchers who publish in dubious journals are usually younger, they
are more prolific but have fewer high-impact publications, and they tend to be based
in departments with lower research quality.
3

The inclusion of these journals in Beall’s list does not necessarily imply that they
are bogus. Instead, it is possible that Beall’s list is inaccurate and it includes some
legitimate journals. We investigate whether these journals are truly academic using
two sources of information. First, we collect information on the number of citations
received by these journals from Google Scholar. Their academic impact tends to be low,
only 38% of these journals have published in the previous 5 years at least 5 articles that
have received at least 5 citations (including self-citations). Moreover, to learn more
about their editorial practices, we surveyed a random sample of around 1,000 Italian
researchers who published in these journals, with a response rate of 54%. According
to our respondents, at least one-third of these journals did not provide referee reports
during the revision process or had an editorial behavior that casts doubts on their
integrity. Given the possibility of misreporting, we interpret this figure as a lower
bound of the extent of fraud within this set of journals.
A number of respondents argue that their main motivation to publish in these
journals was their inclusion in whitelists that are relevant in the Italian context, such
as Scopus or the whitelist elaborated by the Italian academic authorities in Social
Sciences and Humanities (ANVUR list), and the possibility that these journals may
receive a positive evaluation in promotion processes. We investigate in a systematic
way the validity of these two claims.
Out of the 599 Beall’s list journals where Italian researchers have published their
work, we find that 131 of them are included in Scopus and 213 in the ANVUR list.
These journals account for over 73% of the articles in our sample that were published
in Beall’s list journals. The survey information confirms that at least 40% of Scopus
journals and 49% of ANVUR journals in Beall’s list are likely to be fraudulent.
We also investigate the returns to predatory publications in the National Scientific
Qualification.3 We find that, on average, the success rate of candidates with predatory
3Evaluation committees were provided information on the number of articles that applicants hadpublished in journals from the whitelists but committees had full autonomy to choose their criteria.The Italian national evaluation agency (ANVUR) collected and distributed bibliometric informationon applicants. In Science, Technology, Engineering, and Mathematics, this information included thenumber of articles published in journals covered by Scopus, the number of citations received, and theirh-index. In Social Sciences and Humanities the agency used their own list, which includes around
4

publications is 3.5 percentage points (about 9%) lower relative to other candidates with
otherwise similar CVs. This gap may reflect both the negative impact of predatory
publications on the assessment of the average evaluator or the effect of other individual
characteristics that are observable to evaluators but are not captured in our analysis of
CVs (e.g. the content of candidates’ articles). We study how the magnitude of the gap
varies with the research profile of evaluators. To identify the causal effects, we exploit
the existence of a mechanism of random assignment of evaluators to committees.4 Our
analysis shows that evaluators with fewer publications in high-impact journals are sig-
nificantly more likely to promote authors with dubious publications. The magnitude of
the effect is substantial: one standard deviation increase in evaluators’ research quality
decreases the returns to dubious articles by about 7 percentage points (20%). In sum,
while the average committee seems to penalize applicants with publications in ‘preda-
tory’ journals, these publications may have a positive return when committee members
have a weak research profile. This effect is strongest in Business and Economics which,
as mentioned earlier, is also the field where predatory publications are most common.
Our work contributes to the literature in several ways. We provide the first quan-
tification of the extent of predatory publications at the country level. We consider one
of the world’s biggest producer of academic research.5 While previous studies have
shown that authors publishing in predatory journals tend to be predominantly based
in countries with weak research backgrounds (Xia et al. 2015, Shen and Bjork 2015),
our results suggest that predatory publications are also a relevant problem in Italy. We
also provide novel evidence on the causes of this phenomenon. Our findings suggest
that the proliferation of predatory publications may reflect the existence of severe in-
formation asymmetries in the evaluation of science. Evaluators with a weak research
profile may lack the ability to assess the quality of scientific outputs. The existence
20,000, and a subset of these journals were considered A-journals. The purpose of this informationwas to facilitate committees’ evaluation tasks and foster the objectivity of their assessments.
4A similar empirical strategy has been used to study the impact of evaluators’ gender (Bagues etal. 2017) and the existence of connections between evaluators and candidates (Zinovyeva and Bagues2015, Bagues et al. 2016).
5According to the Scimago Country Ranking, Italy is the country with the 7th largest h-index (seehttp://www.scimagojr.com/countryrank.php?order=h&ord=desc. Similarly, King (2004) argues thatItaly belongs to the scientific ‘premier league’.
5

of such information asymmetries in scientific evaluations might explain why some au-
thors are willing to pay to publish in predatory journals even if they are aware of their
fraudulent nature.
Finally, we show that some dubious journals have managed to be included in in-
dexes, such as Scopus, which are used by many institutions as de facto whitelists. Our
results cast doubts on the mechanical use of white- and black- lists in research eval-
uations, suggesting the need to complement journal lists with assessments conducted
by knowledgeable evaluators. Academic evaluations that automatically give credit to
publications in journals included in these lists may distort publication incentives, and
they may give unfair advantages to unethical authors.
2 Background information
2.1 The National Scientific Qualification
Since 2010, promotions in Italian universities are decided within a two-stage evaluation
system.6,7 In the first stage, candidates to associate and full professorships are required
to qualify in a national-level evaluation known as the National Scientific Qualification
(NSQ) (Abilitazione Scientifica Nazionale). Assessments are conducted separately by
184 committees, one for each scientific field defined by the Ministry of Education.
Qualified candidates can participate in the second stage, which is managed locally by
each university.
The first edition of the NSQ took place between 2012 and 2014. For candidates,
the submission package required the CV and a selection of publications. Researchers
were able to apply to multiple fields and positions. Once the list of eligible evaluators
was settled and the application deadline for candidates was closed, committee members
6Law number 240/2010, also known as “Gelmini reform” after the name of the minister of Edu-cation. A detailed description of the system can be also found in Bagues, Sylos-Labini, Zinovyeva(2017)
7Another recent change in the evaluation of research production in Italy concerns university fund-ing. Since 2011, universities are periodically evaluated on the quality of their research output, andthe outcome of this assessment has an impact on their funding. This evaluation combines peer-reviewof journal articles with the use of bibliometric indicators (Rebora and Turri, 2015).
6

were selected by random draw. These lotteries took place between late November 2012
and February 2013.
2.1.1 Selection of committees
The pool of eligible evaluators includes full professors in the corresponding field who
have volunteered for the task and satisfy some minimum quality requirements. In
Sciences, Technical and Engineering fields, Mathematics and Medicine (STEM&Med),
the requirement is to be above the median of full professors in the field in at least
two of the following three dimensions: (i) the number of articles published in scientific
journals covered by the Web of Science, (ii) the number of citations, (iii) and the H-
index. In the Social Sciences and the Humanities (SSH), eligible evaluators are required
to have a research production above the median in at least one of the following three
dimensions: (i) the number of articles published in high-quality scientific journals (in
what follows, A-journals),8 (ii) the overall number of articles published in any scientific
journals and book chapters, and (iii) the number of published books.
Eligible evaluators may be based in Italy (hereafter ‘Italian’) and may also be
affiliated with a university from an OECD country (‘international’). International and
Italian eligible evaluators have to satisfy the same research requirements. Evaluation
committees include five members. Four members are randomly drawn from the pool
of eligible Italian evaluators, under the constraint that no university can have more
than one evaluator within the committee. The fifth member is selected from the pool
of eligible international evaluators.
Randomization is conducted in a way that leaves little room for manipulation.
Eligible evaluators in each field are ordered alphabetically and are assigned a number
according to their position. A sequence of numbers is then randomly selected. The
same sequence is applied to select committee members in different fields. If an evaluator
resigns, a substitute reviewer is selected randomly from the corresponding group of
eligible evaluators. Approximately 8% of evaluators resigned after being selected in
8An evaluation agency and several scientific committees determined the set of high-quality journalsin each field.
7

the initial random draw.
2.1.2 The evaluation
The evaluations are based on candidates’ CVs and publications. Committee members
meet several times to discuss their assessments and cast their votes. A positive as-
sessment requires a qualified majority of four favorable votes (out of five committee
members).
Committees have full autonomy on the exact criteria to be used in the evaluation.
Nonetheless, at the beginning of the process an independent agency appointed by the
Ministry (ANVUR) collected information on the scientific production of all candidates
and provided it to the evaluation committees. In the STEM&Med fields, this informa-
tion is based on the number of articles published in journals indexed by Scopus or the
Web of Science. In SSHs, it relies, among other sources, on a list of journals compiled
by local experts. Committees were suggested to take this information into account.
2.2 Beall’s list
The academic librarian Jeffrey Beall launched in 2012 a blacklist of publishers and
standalone journals who, according to his judgement, did not comply with some basic
criteria (Butler 2013). For instance, many of these journals did not conduct peer-
review, they publicized fake impact factors and editorial boards, or they falsely claimed
a non-existent association with an academic institution or geographic location. The
2012 edition of the list included 143 standalone journals and about 269 publishers; two
years later, it included 468 standalone journals and 667 publishers, and by January
2017 there were 1294 standalone journals and 1155 publishers.
Several papers have studied the characteristics of authors who publish in Beall’s
list journals. Xia et al. (2015) analyze the profiles of around 1000 researchers who
published in 7 selected journals of Beall’s list in Pharmaceutical sciences. Most of these
authors are based in developing countries (69% from India and 8% from Nigeria). In a
more comprehensive study, Shen and Bjork (2015) consider 47 predatory journals and
8

262 authors. Similarly to Xia et al. (2015), they find that their regional distribution
is highly skewed to Asia and Africa (35% from India and 8% from Nigeria), even if a
notable 6% are based in the US. Shen and Bjork (2015) also estimate that the number
of articles published in doubtful journals has grown exponentially in recent years, from
around 53,000 articles in 2010 to 420,000 in 2014.
Shen and Bjork (2015) speculate that most authors are not unknowing victims, but
are probably “well aware of the circumstances and take a calculated risk that experts
who evaluate their publication lists will not bother to check the journal credentials in
detail.” Several other studies also suggest a link between the proliferation of predatory
publications and the lack of quality of scientific evaluations. Omobowale et al. (2014)
interviewed 30 academics from two Nigerian universities who argue that demand for
predatory journals is often triggered by promotion committees that require ‘interna-
tional’ publications but lack scholarly credibility. Seethapathy et al. (2016) run a
survey among 2000 researchers based in India that published in predatory journals,
with a response rate of 24%. The respondents tend to argue that the major factors
behind the popularity of predatory journals are publication pressure and the lack of
proper evaluations. Finally, Djuric (2015) reports that hundreds of Serbian researchers
published on a single predatory title that was listed in the Web of Science’s Journal
Citation Reports after their institution introduced publications in indexed journals as
a requirement for obtaining PhDs, professorships and tenures.
Beall’s list has been subject to some controversy. While in the experiment con-
ducted by Bohannon (2013) a fake article was accepted by approximately 82% of the
journals in Beall’s list that were targeted, the remaining 18% did reject it, suggesting
that maybe some of these journals do not qualify as predatory.9 As Beall himself ac-
knowledges, in some instances, publishers and journals may change their policies and,
as a result, the status of each outlet may not always be up to date.10 Sometimes it might
9More recently, Sorokowski et al. (2017) submitted a fake application for an editor position to360 journals drawn from the Web of Science’s Journal Citation Reports, a list of open-access journals(DOAJ) and Beall’s list. None of the titles indexed on Journal Citation Reports accepted the suspiciouscandidate, while 7% of titles in DOAJ and 33% in Beall’s list did.
10For instance, publishers such as MDPI and Hindawi were removed from the list after a successfulappeal.
9

also be difficult to distinguish between a poorly managed journal and an illegitimate
one.
In January 2017 Beall decided to stop updating his list and removed it from his
blog. He has publicly declared that this unexpected action was due to intense pressure
from his employer, the University of Colorado Denver (Beall 2017). Five months after
Beall’s list was shut down, a private firm named Cabell’s International launched a new
watchlist of untrustworthy journals(Silver 2017).
2.3 Citation indexes
Citation indexes provide a number of bibliometric indicators that many institutions
use to rank journals and evaluate research production. The most popular ones are
probably those provided by Scopus and the Web of Science. These lists include jour-
nals that allegedly satisfy some minimum requirements. For instance, Scopus, the
most comprehensive of the two, claims to include only journals that (i) provide-peer
review, (ii) publish issues on a regular basis, (iii) satisfy a minimum level of relevance
and readability for an international audience, and (iv) have an ethics and malpractice
statement (Rew 2015).11 Some universities and evaluation systems also consider the
inclusion in Scopus and the Web of Science as a mark of quality and use the set of
indexed journals as a de facto whitelist.12
One potential advantage of using citation indexes is that they may be less prone
to conflict of interests and they are less expensive than expert evaluations (Regibeau
and Rockett, 2006; Bertocchi et al., 2015). On the flip side, they may provide an
inaccurate measure of quality and they may encourage agents to game the incentive
11Scopus has a broader coverage of the scientific literature than the Web of Sci-ence. The selection criteria of the Web of Science and Scopus are explained inmore detail respectively at http://wokinfo.com/essays/journal-selection-process/ andhttps://www.elsevier.com/solutions/scopus/content/content-policy-and-selection
12For instance, Aalto University Guide for Researchers states that ‘(a)s some journals have ques-tionable motives for their publishing activity, you should be very careful when choosing a journal.[...] Journals listed in Publication Forum [JUFO], Thomson Reuter’s Web of Knowledge or Elsevier’sScopus are guaranteed to be established academic journals’ (the bold is ours). Similarly, evaluationagencies in Italy (National Quality Assessment and National Scientific Qualification), the Russian Fed-eration (The National Excellence Initiatives and the Russian Science Foundation) and Spain (AgenciaNacional de la Evaluacion de Calidad y la Acreditacion) rely on these indexes.
10

system (Hicks, 2012).13 If authors anticipate the metrics that will be used to evaluate
them, a problem of goal displacement may arise whereas scoring high on performance
measures becomes a goal in itself, rather than a means of measuring whether a desired
performance level has been attained (Wouters et al., 2015). For example, Butler (2003)
finds that, in Australia, a greater reliance on journals indexed in ISI Web of Knowledge
(today known as the Web of Science) was followed by an increase of the quantity but
not the quality of research. Similarly, Moosa (2016) shows that the adoption of a
bucket classification system encourages researchers to submit their research to the
lowest-quality journal within each bucket. Moreover, some of the journals included in
these indexes, particularly in Scopus, may have limited scientific value and, allegedly,
they may not even be legitimate academic outlets (Sterligov and Savina, 2016).
More recently, some agencies are also using the information provided by Google
Scholar (Bertocchi et al., 2015). In this database, citations are computed and updated
automatically and reflect all documents accessible to Google search robots that are
formatted in ways that make it possible for their indexing algorithms to identify their
bibliographic data or references. Hence, compared to other citations databases, it is
the most comprehensive (and the less selective) one.
3 Empirical analysis
The structure of our analysis is as follows. First, we describe the CVs of a large
sample of Italian researchers. Second, using this information we examine the number
of publications that they have published in Beall’s list journals and the characteristics
of these authors. Third, we analyze the quality of Beall’s list journals using bibliometric
and survey information. Finally, we study the motivations of authors. In particular, we
investigate whether publications in predatory journals may receive credit in scientific
evaluations, either through their inclusion in whitelists or in expert evaluations.
13Moed (2005) and Vinkler (2010) offer systematic reviews of bibliometric indicators for researchevaluation. More generally, Gibbons (1998) provides an overview of the economic literature on objec-tive performance measures.
11

3.1 Publication record of Italian researchers
Our sample includes all participants in the first wave of the NSQ that took place in
2012-2014.14 The dataset includes information on 46,244 researchers. This accounts
for around 61% of assistant professors and 60% of associate professors in Italy.15
Applicants’ CVs provide a rich amount of demographic and academic information.
As shown in Table 1, 40% of researchers are women and, on average, researchers have 16
years of experience measured as time elapsed since their first publication. Most candi-
dates hold a permanent position in an Italian university, either as assistant professors
(ricercatori) (64%) or as associate professors (professori associati) (36%). About a
third of candidates have a fixed-term labor contract, or they are not affiliated with an
Italian university. Approximately half of the researchers working in Italy are based in
the North, one-quarter is based in the central Italy, and another quarter is based in
the South.16
The CVs also provide information on researchers’ publications between 2002 and
2012 (see Table 1, middle panel). During this 10-year period, the average applicant has
published 45 items. Out of these 45 items, 24 (53%) are journal articles, 8 (18%) are
conference proceedings, 8 (18%) are books and books chapters, and 5 (11%) correspond
to other types of publications such as an abstract in a conference, a database, a trans-
lation or a comment on a court sentence. The type of publications varies significantly
across different disciplines. In Sciences and Medical disciplines, journal articles are the
main type of academic communication. In Engineering, conference proceedings are the
most popular output. In Social Sciences, Humanities, Business and Economics books
or chapters of books are as common as journal articles.
Within the set of articles published in journals, the vast majority (75%) were pub-
lished in outlets indexed by Scopus or the Web of Science. The proportion is sig-
14We downloaded in January 2014 the CVs of all applicants from the official page of the NationalScientific Qualification (http://abilitazione.miur.it/public/index.php?lang=eng.
15Source: Our own calculations using information from the Italian Ministry of Education on theidentity of all assistant (ricercatori) and associate professors (associati) in Italy on December 31 2012.
16Southern regions refer to Abruzzo, Molise, Campania, Apulia, Basilicata, Calabria, Sicily andSardinia; central regions include Lazio, Marche, Toscana and Umbria; and northern regions are EmiliaRomagna, Piemonte, Lombardia, Valle d’Aosta, Veneto, Trentino-Alto Adige, Friuli-Venezia Giuliaand Liguria
12

nificantly lower in Social Sciences and Humanities, probably reflecting that in these
areas only 10% of articles are written in English, compared to 60% in Business and
Economics and around 90% in Science, Technology, Engineering, Math, and Medicine
(STEM&Med).17
To proxy for the quality of articles, we consider two different measures. In the
STEM&Med fields, we ranked journals in each field by their Article Influence Score
(AIS).18 About 45% of articles by Italian researchers in these areas were published in
top quartile journals. In Business and Economics as well as in Social Sciences and
Humanities, we measure the quality of journals using the list of high-impact journals
prepared by the Italian evaluation agency ANVUR (in what follows, ‘A-journals’).
About 20% of all articles in Economics and 30% of articles in Social Sciences and
Humanities were published in A-journals.
3.2 Publications in Beall’s list journals
According to our calculations, out of the 1.8M articles published by researchers in our
sample, 5,798 were published in journals from Beall’s list.19 There are 2,225 researchers
(about 5% of the entire population) in the sample with at least one article published in
a journal of the Beall’s list. 70% of these authors have published only once in a Beall’s
list journal.
For the average researcher, it represents 0.5% of the articles listed in her CV (see
Table 1, lower panel). Since Beall monitored primarily English-language journals, we
also calculate the proportion of English-language articles by Italian authors (79% of
the total) that have been published in Beall’s list journals. In this case, the share of
predatory articles is slightly larger, around 0.9% of all articles published in English.
The propensity to publish in predatory journals differs substantially across fields.
17We identified the language of each article based on the language used in the title.18Article Influence Score is similar to the journal 5-year Impact Factor, but (i) it weights citations
by the quality of the citing journal and by the inverse of the number of references in citing journaland (ii) it excludes self-citations. It is available only for journals indexed in the Web of Science.
19We collected information on Beall’s list journals in January 2015. In order to identify how manyarticles researchers have published in journals included in Beall’s list of ‘potential, possible, or probablepredatory journals’, we match the information provided by researchers on the name and the ISSN codeof journals where they have published with the ISSN code of journals included in Beall’s list.
13

In Sciences and in Medicine, only 0.4% of articles in English were published in a
predatory journal. The figure is larger in Social Sciences and Humanities (0.7%) and
in Engineering (1.6%), and it is the highest in Business and Economics, where 4.1% of
all articles in English were published in a journal classified by Beall as predatory.
Figure 1 also shows how the proportion of publications in predatory journals has
evolved over time. Starting in 2010 we observe a sharp increase in the proportion of
articles published in Beall’s list journals, particularly in Business and Economics. In
the last year of our sample, 2012, over 5% of all articles written in English in Business
and Economics was published in journals included in Beall’s list.
3.3 Characteristics of authors who publish in Beall’s list jour-
nals
To describe the profile of a typical candidate who publishes in Beall’s list journals, we
estimate the following equation:
Bi,e = β0 +Xi,eβ1 + µe + ǫi,e, (1)
where Bi,e is an indicator for candidates who have published in Beall’s list journals, Xi,e
is a set of individual characteristics, and µe are evaluation fixed effects (i.e. discipline
times promotion category dummies).
Authors with predatory publications tend to be more prolific, but they publish in
journals with a lower rank (Table 2). They also tend to be less experienced, and they
tend to be based in departments with relatively poorer research quality, as measured by
the results of a national evaluation conducted by ANVUR.20 There are also important
geographical differences. Conditional on the research quality of the department, the
20We measure the research quality of Italian departments using the score obtained by each depart-ment in a national assessment of research quality that was conducted in 2011, based on publicationsby faculty members between 2004 and 2010. The assessment was organized by ANVUR and it wascarried out by independent experts who reviewed a selected number of research products. The re-sulting score varies between zero (low quality) and one (high quality). According to this metrics, theaverage researcher is based in a department with score 0.6 (standard deviation is 0.2). More detailedinformation is available at http://www.anvur.org/rapporto/.
14

probability of publishing in a predatory journal is 2.9 p.p. (around 60%) higher in de-
partments located in the South of Italy. Predatory publications are less common among
candidates who are based in foreign universities or candidates with non-academic jobs.
3.4 Quality of journals on Beall’s list
More than 2,000 researchers in our sample have published at least one article in a
journal included in Beall’s list. Overall, they have published in 599 different journals,
which represents slightly below 10% of the total number of journals included in Beall’s
list that have an ISSN code (see Table B1, columns 1 and 2).
The presence of these journals in Beall’s list does not necessarily imply that they
are not legitimate journals. For instance, as mentioned earlier, around 18% of journals
from Beall’s list that participated in Bohannon’s (2013) experiment did not accept the
fake paper sent by the researcher. The proportion of journals that, despite being part
of Beall’s list, actually follow a legitimate editorial process might be even larger within
the sample of journals in our study.
We investigate the quality of these journals using two sources of information. First,
we use bibliometric information. We examine how cited are these journals according
to Google Scholar. Second, we asked the authors about the editorial practices of these
journals directly. We conducted an online survey among a random sample of 1,000
authors in our sample that had a publication in a Beall’s list.
3.4.1 Bibliometric information
We use Google Scholar to gather information on the bibliometric impact of journals
included in Beall’s list where Italian researchers have published. We collected this
information in Fall 2016. Google scholar provides information on journals’ h5 index,
which indicates the largest number h such that h articles published in the previous five
years have at least h citations each. According to Google Scholar, only 38% of journals
in the sample satisfy the criterion for being indexed in Google Scholar: to have an
h5-index of five or more and to comply with simple formatting rules. Among these
15

journals, the median h5 index is equal to 10.
We also use Google Scholar to collect information about the number of citations
received by each article. As shown in Figure 2, most of these articles have not attracted
much attention. The median article has received only three citations.21 23% of articles
have not been ever cited and, if we exclude self-citations, the figure rises to one-third.
At the same time, we also observe that there is a group of articles which have received
a non-trivial number of citations. The 10% most cited articles in our sample have
received at least 20 citations, including one article with 399 citations.
3.4.2 Survey information
The journals in our sample tend to have a low scientific impact. However, this does not
necessarily imply that their editorial practices are fraudulent. To learn more about it,
we conducted a survey among a random sample of researchers in our database who have
published in these journals. The sample was selected using a randomized design with
stratification by university and field. The overall population includes 2,225 authors,
who were based in 1558 different departments. We randomly assigned half of these
departments to participate in the survey. The sample includes 1,088 researchers who
were based in 779 different departments. As expected, the characteristics of the survey
sample are statistically similar to the characteristics of the targeted population (see
Table B2, columns 1, 2 and 4).
We contacted authors by email between February 2016 and May 2016 and we asked
them to complete online a survey. The translated versions of our contact email and
the questionnaire are reproduced in Appendix A. In our contact email, we point out
that one of the articles of the recipient has been published in a journal included in
Beall’s list, and we brief the recipient about the nature of this list.22 We also explain
that Beall’s list may have some shortcomings and, in order to shed some light on its
21The titles of some of these articles provide some additional hints about their quality. In somecases, the grammar is not correct (e.g.“Income Don’t Influence Health”), or the paper deals withquestions of presumably limited academic interest (e.g.“Influence of Parmigiano Reggiano Diet onMale Sexual Behavior in Rats: Behavioral and Neurochemical Study”).
22In the case of authors who had more than one publication in a predatory journal, we selectedrandomly one single publication for the purpose of our survey.
16

reliability, we are collecting information from authors about the editorial functioning
of these journals. To minimize the possibility that our message might be perceived as
offensive, we also make it clear that it is not our intention to question the integrity or
the scientific quality of the recipient. If a given author did not answer, we sent up to
three reminders.
Out of the 1,088 authors contacted, 584 completed the survey (response rate 54%).
Due to co-authorships, some respondents provided information about the same article.
Overall, respondents provide information on 549 different articles (around 59% of the
initial set of articles) and 268 different journals (around 70% of the set of journals
initially identified). The set of authors who participated in the survey is (somehow
surprisingly) similar to the target population (see Table B2, columns 2, 3, and 5).
The sample of respondents only differs significantly from the target sample in terms
of their probability of holding a permanent position in an Italian university (73% in
the target sample vs. 77% in the sample of respondents). A possible explanation for
this divergence may be related to the validity of the email addresses that we used to
contact authors.23 Nonetheless, we can not exclude the potential existence of some
kind of non-response bias, which might affect the interpretation results in a non-trivial
way. On the one hand, researchers who are aware of the fraudulent nature of the
journal may feel too embarrassed or guilty about their past behavior to participate in
the survey. In this case, the sample that participated in the survey would be relatively
better in terms of the quality of the journals relative to non-participants. On the other
hand, researchers who have a higher opportunity cost of their time may be less likely
to reply. If these researchers are less likely to publish in truly predatory journals, this
might lead to a problem of ‘negative’ selection.
Respondents provided detailed information on the editorial practices of the journal
where their article was published.24 About 8% of respondents who recall the details of
the process admit that they did not receive any referee reports and the share more than
23We searched contact details based on the information provided in researchers’ applications in 2012for the NSQ evaluation. It is possible that researchers with a permanent position were more likely touse the same email address in 2016 than researchers with fixed-term positions.
24A more detailed summary can be found in Table B3.
17

doubles (22%) when we also consider those who reveal having received only comments
related to the editing (see Table 3, column 1). The figure rises to 26% when we
also include respondents who point out that, during the revision process, they noticed
something that made them distrust the integrity of the journal.
There are several potential concerns with these estimates. There might be a recall
bias. We ask researchers information about events that happened several years earlier.
Some of them may fail to remember their experience accurately. There might also be
a problem of cognitive dissonance: subjects may report opinions that legitimize their
past behaviors and past opinions. In general, we expect these biases to lead to the
underreporting of malpractices and, in this respect, our results should probably be
interpreted as a lower bound of the actual degree of fraud.
Given that some respondents may underreport fraudulent practices but it is unlikely
that someone mistakenly remembers an episode of academic fraud, we also construct
a variable defined at the journal level that takes value one if at least one author has
reported a case of malpractice. According to this metrics, at least 36% of journals
behaved in a fraudulent way (Table 3, column 2).25
In the survey, we also asked authors how they chose the journal where the article
was published. One-third of respondents replied that they learned about the journal
from one of their colleagues, 27% reacted to an e-mail sent by the journal, and in 12%
of the cases the submission was linked to the participation in a conference. Only 16%
of respondents chose the journal because they had previously read some of the articles
published there. We also asked researchers if they were familiar with Beall’s list. Most
of them were unaware of the existence of this ‘black’ list: only 10% had ever heard
about it.
The survey also provides interesting qualitative evidence. Authors could include
open comments and 40% of authors used this possibility to send us feedback about
their experience. Some authors voice negative opinions about the journal where they
published their work. Two authors put it quite bluntly:
25Table B4 in the Appendix provides the list of journals for which at least one author has reporteda case of malpractice.
18

I think that the journal should be shut down.
The editor in chief is a crook.
Some of the comments describe in detail the editorial practices of the suspicious
journals. Sometimes the acceptance decision was done at an unusually fast pace: either
automatic or in less than 48 hours from the submission. Of course, in none of these
cases the authors received referee reports. In some cases, there were referee reports,
but they were irrelevant. As one respondent points out:
I was invited to join the editorial board of the journal, and this is why I did
not pay to get published. Subsequently, I was asked to serve as a referee,
but I realized that my comments did not have any impact: the papers were
published without any improvement. This journal, like many others, does
not have a real editor, but a graphical technician who deals with both referees
and authors. I then wrote to the editor to resign but nobody even bothered
to reply.
Another irregularity was related to pricing policies. Some authors were asked to pay
additional fees to ensure publication after the official publication fee was paid. Others
were requested ex-post to attend a conference and pay an extra cost. In some cases,
journals published articles without the explicit consent of authors, for instance, fol-
lowing their participation in a conference. Some respondents also complain about the
practice of coercive citations, when the editor requires the authors to include among
the references some articles published in the same journal, irrespectively of their actual
content.26
Not all comments were negative. Around 10% (22 respondents) provided us with
positive feedbacks either praising the quality of the revision process or highlighting the
academic stand of the editor in charge.27 This is consistent with the fact that some of
26This practice has also been widely documented among more ‘standard’ academic journals (Wilhiteand Fong, 2012).
27For instance, one of the respondents declares: “My experience with [journal title] was very positive.I had the impression of a very careful and rigorous revision process, comparable to other journals of the
19

these articles received a significant number of citations. For example, among the top
cited articles of our sample, there is research cited in articles published in top-journals
like Science, PNAS, Nature review cancer, and The Lancet. But even among less cited
articles, according to the feedback of our respondents, some were peer reviewed for the
Italian Research Quality Assessment (VQR) and received the highest mark (excellent).
3.5 Returns to publications in Beall’s list journals
Some Italian researchers admit that they have published their work in journals that do
not qualify as legitimate academic outlets. Some of them argue that they were misled
by the information provided by the journal.28 Other authors admit that, while they
were aware of the fraudulent nature of the journal, they expected to these publications
to be useful in the national evaluations.29 For instance, one author says that:
It is not a publication I am proud of. Indeed, I am a bit ashamed. Let
me add that all the journals published by (...) are just trash. I cannot
understand how they can be indexed by Scopus and, thus, count for the
Research Quality Assessment.
Similarly, another author explains that:
In 2011 I participated in a conference they organized. They run several
journals and they offered me to publish on a fast track in one of them.
(...) I needed a publication for the National Scientific Qualification and I
accepted to publish in this journal. Today, I regret that decision.
same scientific field. I remember we had two very competent reviewers who addressed pertinent issuesin the paper and helped us to improve our article. To me, this is a ‘trustable’ Journal.” Similarly,another author argues: “The referees did an excellent job. The paper has improved substantially aftertheir comments and suggestions.” Two authors even sent us the copies of the referee reports theyreceived as a way to demonstrate the quality of the editorial process.
28For instance, one respondent argues: “On their website, they reported the impact factor of thejournal. Unfortunately, I trusted them and did not check it out. Only after they charged me thepublication fees, I realized that the journal was not indexed neither in ISI nor in Scopus.”
29Around 10% of feedbacks are related to the fact that the journal under scrutiny is indexed in Sco-pus or the Web of Science. Additionally, 13 feedbacks mention at least one of the two Italian nationalevaluations (VQR or NSQ). Interestingly, in 5 cases respondents acknowledge that the publicationwas useful for the evaluation.
20

Below we study systematically these claims. First, we study whether journals from
Beall’s list are included in any of the whitelists that were considered for the National
Scientific Qualification. Second, we investigate whether authors received credit for
predatory publications in these evaluations and we analyze the potential role played
by information asymmetries associated with the lack of expertise of some evaluators.
3.5.1 Whitelists
Many institutions and authors use whitelists to identify journals that satisfy some min-
imum quality requirements. In the case of the Italian National Science Qualification,
the evaluation agency considered several lists. In scientific disciplines, it relied on the
citations indexes Scopus and the Web of Science. In Social Sciences and Humanities,
the Italian academic authorities prepared their own whitelist of journals. We inves-
tigate whether these whitelists include journals that have been classified by Beall as
predatory.
Our analysis shows that, out of the approximately 7,000 journals included in Beall’s
list, 284 of them are also indexed by Scopus and 14 by the Web of Science (see Ta-
ble B1).30 Furthermore, within the sample of 599 Beall’s list journals where Italian
researchers have published, we find 131 journals that are also included in Scopus and
10 in the Web of Science. In general, these journals have a low impact. Only three of
them are in the top quartile of most cited journals according to Scopus, and none of
them is in the top quartile within the Web of Science.31
In Social Sciences and Humanities, we examine the overlap between Beall’s list and
the list of journals elaborated by the Italian academic authorities (ANVUR). Overall,
the ANVUR whitelist includes 273 journals from Beall’s list. Italian researchers have
published in 213 of these journals. ANVUR also elaborated a more selected list of
A-journals. Only two of these journals are also included in Beall’s list.
We use the survey information to investigate the quality of Beall’s list journals that
30We consider the composition of these indexes in 2012 when the NSQ took place.31In the case of the Web of Science we consider the ranking according to the Article Influence Score;
for Scopus, we consider the Scimago Journal Rank (SJR).
21

are also included in a whitelist (Scopus or ANVUR). The survey provides information
on 74 Scopus journals and 97 ANVUR journals. The information provided by respon-
dents suggests that many of these journals are not legitimate. As shown in Table 3,
at least 40% of Scopus journals and 49% of ANVUR journals exhibit some editorial
irregularity. This figure is, if anything, larger than among other journals from Beall’s
list.
3.5.2 Expert evaluations
Evaluation committees in the National Scientific Qualification had access to CVs, and
they were also provided information on the number of articles that applicants had
published in journals from the corresponding whitelist. Nonetheless, they had full
autonomy to choose their evaluation criteria. We study how publications in predatory
journals affect evaluation outcomes and whether the expertise of evaluators plays any
role.
First, we investigate the average performance of authors with predatory publica-
tions. We estimate the following equation:
Successi,e = β0 + β1Bi +Xi,eβ2 + µe + ǫi,e. (2)
where Successi,e is an indicator variable that takes value one if application i in evalu-
ation panel e was successful and takes value zero otherwise; Bi is an indicator variable
that takes value one if the candidate has published in a journal from Beall’s list, and
Xi,e is a vector that includes various measures of candidates’ research productivity, as
well as other individual characteristics that might be correlated with candidate quality,
such as experience, the field of research, the type of position or the research quality of
the applicant’s department. Evaluation fixed effects (µe) capture any variation in the
success rate of applicants who are evaluated by different evaluation panels.
On average, in each discipline and rank there are about 188 candidates aspiring
promotion and about 37% of them obtain a positive assessment. As expected, individ-
ual productivity is strongly correlated with success (column 1, Table 4). The number
22

of high-impact publications is the strongest factor: applicants with one standard de-
viation more high-impact publications are 12.5 percentage points (or 34%) more likely
to qualify. A similar increase in the number of other publications in Scopus or the Web
of Science is associated with a 2.9 percentage points (p.p.) increase in the probability
of success. The number of chapters in collective volumes, conference proceedings and
books are also positively associated with success but the magnitude of the coefficient
is smaller. Publications in other outlets are, if anything, negatively correlated with
success. Applicants also tend to be more successful if they are more experienced, they
have a tenured position, they are specialized in the same field as the committee, or
they are based in a research-intensive department. In columns 2-6, we perform a similar
analysis separately for different disciplinary groups. Interestingly, high-impact publi-
cations are the strongest predictor of success across all disciplinary groups, including
the ones where the dominant form of science communication is not academic journals,
but rather conference proceedings (i.e. Engineering) or books (i.e. Social Sciences and
Humanities).
Candidates with publications in predatory journals are less likely to obtain a positive
evaluation. Conditional on all the information available in the CV, their success rate
is 3.5 p.p. lower. The penalty associated with predatory publications is largest in
Engineering and Sciences, and it is not significantly different from zero in Medical
Sciences, Business and Economics, and Social Sciences and Humanities.
We examine whether the evaluations received by authors with predatory publica-
tions vary depending on the research quality of committee members. This analysis
faces at least two challenges. First, it requires the measurement of evaluators’ research
quality. Second, given that evaluators’ characteristics may be potentially related to
applicants’ characteristics, it calls for an empirical strategy that identifies exogenous
variations in the composition of committees.
We measure evaluators’ research quality by the number of high-impact publications.
In the STEM&Med fields we consider publications in top quartile journals according to
Web of Science and in other areas we use the list of A-journals elaborated by ANVUR.
23
The results reported in Table 4 suggest that this variable is the best predictor of
research quality in all disciplinary groups. To account for the varying propensity to
publish in different fields, we normalize this measure among eligible evaluators in the
same discipline.
To identify exogenous variations in evaluators’ research expertise, we exploit the ex-
istence of a random draw that selects panelists from the pool of eligible evaluators. We
compare the success rate of candidates who, due to the randomness of the draw, were
eventually assessed by panels of different research quality. We estimate the following
equation:
Successi,e = β0 + β1Bi +Xi,eβ2 + β3[Bi ∗Re] + β4[Bi ∗ E(Re)] + µe + ǫi,e, (3)
where Re is the average research quality of committee members and E(Re) is the
expected research quality of the committee. The latter variable reflects the composition
of the pool of eligible evaluators and it is computed using one million simulated draws
taking into account the rules of the selection process. Coefficient β1 measures the
relative success rate of authors with a Beall’s list publication and β3 captures the
causal effect of committee members’ research profile on their success rate.
As shown in Table 5, column 1, committees with a lower research quality tend to be
more benevolent with authors with publications in Beall’s list journals. A one standard
deviation decrease in the research quality of committee members increases the success
rate of these authors by 6.2 p.p. (17%), relative to other candidates.
As pointed out in section 2.1, 8% of evaluators resigned after being assigned to
committees and they were replaced by other randomly selected evaluators. To deal
with the lack of full compliance, we use an instrumental variables strategy. We use
the research quality of initially drawn committee members as an instrumental variable
for the research quality of actual committee members. The estimated effect is slightly
higher: authors with publications in Beall’s list journals have 6.7 percentage points
(or about 18%) higher success rate when evaluators’ research quality is one standard
deviation lower (Table Table 5, column 2).
24

In columns 3-7 we report the analysis separately for different disciplinary areas. The
impact of evaluators’ research quality on the success of candidates with publications
in Beall’s list journals is highest in Business and Economics (29 p.p.).
4 Conclusion
We investigate the extent of publications in ‘predatory’ journals and the motivations
of authors who publish in these journals. We use information from a large sample of
researchers who applied for promotion in Italy in 2012 and were evaluated by scientific
committees at the national level. To identify dubious journals, we use Beall’s list of
‘potential, possible, or probable predatory’ journals. The number of publications in
journals from this list is relatively small, but not negligible. In a sample of around
1.8 million publications, we identify approximately 6,000 publications in journals that
have been included by Beall in his blacklist. The number of these publications has
been growing in recent years and, among all fields, it is particularly relevant in Busi-
ness and Economics. In the last year of our sample, 2012, approximately 5% of all
articles by Italian economists and management scholars in English-language journals
were published in one of these journals.
To assess whether these journals are truly fraudulent, we collected bibliometric in-
formation and we conducted a survey among a sample of around 1,100 authors, with
a response rate of 54%. Most of these journals have a poor scientific impact. Only
38% have a Google Scholar h-index of five or more based on the articles published in
the previous five years. Moreover, according to survey respondents, at least a third of
journals in the sample incurred in some fraudulent editorial practice. The survey also
provides interesting qualitative information about the motivation of authors who pub-
lish in these journals. Some researchers argue that they were fooled by the misleading
information provided by these journals. Other authors confess that they were aware of
the dubious nature of these journals but, despite their lack of rigor, they expected to
receive academic credit for these publications.
We study the validity of the latter claim empirically. Our analysis uncovers two
25

ways in which authors benefit from publications in ‘predatory’ journals. First, we find
that many of these journals are included in lists of journals, such as Scopus, that many
institutions use as whitelists. Second, we show that authors with publications in Beall’s
list tend to receive relatively better evaluations when evaluators’ research background
is poor.
Overall, our study casts doubts on the mechanical use of whitelists and blacklists
in evaluation processes. In general, a more nuanced approach to evaluations may
be needed, whereas lists are combined with evaluations by experts.32 Moreover, the
research quality of these experts is relevant. Evaluators with a poor research record may
reward publications in dubious journals. In sum, the proliferation of predatory journals
may be a worrying symptom of the lack of accuracy of many scientific evaluations. In
this respect, predatory publications may be the ‘tip of the iceberg’ of a much deeper
problem.
References
Bagues, M., Sylos-Labini, M., Zinovyeva, N., 2017. Does the gender composition of
scientific committees matter? American Economic Review, 107(4), 1207-1238.
Bagues, M., Sylos-Labini, M., Zinovyeva, N., 2016. Connections in scientific com-
mittees and applicants’ self-selection: Evidence from a natural randomized ex-
periment. IZA Discussion Paper No. 9594.
Beall, J., 2012. Predatory publishers are corrupting open access. Nature, 489(7415),
179-179.
Beall, J., 2017. What I learned from predatory publishers. Biochemia Medica, 27(2),
273-278.
Bertocchi, G., Gambardella, A., Jappelli, T., Nappi, C.A., Peracchi, F., 2015.
Bibliometric evaluation vs. informed peer review: Evidence from Italy. Research
32There may also be a trade-off between using very comprehensive lists, such as a Scopus, whichmay include predatory journals, or more selective ones, such as the Web of Science, which excludesmany (less prestigious) legitimate journals.
26

Policy, 44(2), 451-466.
Bohannon, J., 2013. Who’s afraid of peer review? Science, 342, 60-65.
Butler, D., 2013. The dark side of publishing. Nature, 495, 433-435.
Butler, L., 2003. Explaining Australia’s increased share of ISI publications: the
effects of a funding formula based on publication counts. Research Policy, 32(1),
143-155.
Clark, J., Smith, R., 2015. Firm action needed on predatory journals. BMJ, 350.
Djuric, D. 2015. Penetrating the omerta of predatory publishing: The Romanian
Connection. Science and Engineering Ethics 21, 83-202.
Garfield, E., 1972. Citation analysis as a tool in journal evaluation Science, 178,
471-479.
Gibbons, R., 1998. Incentives in organization. Journal of Economic Perspectives,
12(4), 115-132.
Harvie, D., G. Lightfoot, S. Lilley and K. Weir. 2014. Publisher, be damned! From
price gouging to the open road. Prometheus: Critical Studies in Innovation,
31(3), 229-239.
Hicks, D., 2012. Performance based university research funding systems. Research
Policy, 41(2), 251-261.
King, D.A., 2004. The scientific impact of nations. Nature, 430, 311-316.
Kolata, G. 2013. Scientific articles accepted (personal checks, too). The New York
Times, April 7.
Moed, H.F., 2005. Citation Analysis in Research Evaluation. Springer.
Moosa, I.A., 2016. A critique of the bucket classification of journals: The ABDC
list as an example. Economic Record, 92(298), 448-463.
Rebora, G., Turri, R., 2013. The UK and Italian research assessment exercises face
to face. Research Policy, 42(9), 1657-1666.
27

Regibeau, K., Rocke, E., 2016. Research assessment and recognized excellence:
simple bibliometrics for more efficient academic research evaluations. Economic
Policy, 31(88), 607-609.
Rew, D., 2015. An Introduction to the Scopus
Content Selection and Advisory Board (CSAB).
https://www.elsevier.com/ data/assets/pdf file/0004/95116/general introduction csab.pdf
Seethapathy, G.S., J.U. Santhosh Kumar, A.S. Hareesha, 2016. India’s scientific
publication in predatory journals: need for regulating quality of Indian science
and education. Current Science, 111(11), 1759-1764.
Shen, C., B. Bjork, 2015. ‘Predatory’ open access: a longitudinal study of article
volumes and market characteristics. BMC Medicine, 13(230).
Silver, A. 2017. Pay-to-view blacklist of predatory journals set to launch. Nature
News, 31 May.
Sorokowski, P., E. Kulczycki, A. Sorokowska, K. Pisanski, 2017. Predatory journals
recruit fake editor. Nature, 543, 481-483.
Sterligov, I., Savina, T., 2016. Riding with the Metric Tide: ‘Predatory’ Journals
in Scopus. Higher Education in Russia and Beyond, 1(7), 9-12.
Vinkler, P., 2010. The Evaluation of Research by Scientometric Indicators. Oxford,
Chandos Publishing.
Wilhite, A., Fong, E.A., 2012. Coercive Citation in Academic Publishing. Science,
335(6068), 542-543.
Wouters, P., Thelwall, M., Kousha, K., Waltman, L., de Rijcke, S., Rushforth, A.,
Franssen, T., 2015. The Metric Tide: Literature Review. Supplementary Report
I to the Independent Review of the Role of Metrics in Research Assessment and
Management. HEFCE.
Xia J., Harmon, J.L., Connolly K.G., Donnelly, R.M., Anderson, M.R., Howard
H.A., 2015. Who publishes in ‘predatory’ journals? Journal of the Association
for Information Science and Technology, 66(7), 1406-1417.
28

Zinovyeva, N., Bagues, M., 2015. The Role of Connections in Academic Promotions.
American Economic Journals: Applied Economics, 7(2), 264-292.
29

Table 1: Descriptive statistics – Candidates in NSQ
All Sciences Medical Sciences Engineering Econ. & Business Soc.Sc. & Hum.
Mean Std. Dev. Mean Std. Dev. Mean Std. Dev. Mean Std. Dev. Mean Std. Dev. Mean Std. Dev.
Individual characteristics:Female 0.4 0.49 0.4 0.49 0.37 0.48 0.22 0.42 0.41 0.49 0.46 0.5Experience 16 8 16 7 18 8 13 6 12 6 15 8Permanent position in an Italian university: 0.6 0.49 0.57 0.5 0.59 0.49 0.7 0.46 0.75 0.43 0.57 0.5- Assistant professor 0.64 0.48 0.66 0.48 0.64 0.48 0.62 0.49 0.61 0.49 0.64 0.48- Associate professor 0.36 0.48 0.34 0.48 0.36 0.48 0.38 0.49 0.39 0.49 0.36 0.48University location:- North 0.45 0.5 0.45 0.5 0.46 0.5 0.46 0.5 0.48 0.5 0.42 0.49- Center 0.26 0.44 0.27 0.44 0.28 0.45 0.23 0.42 0.24 0.43 0.27 0.44- South 0.29 0.45 0.28 0.45 0.27 0.44 0.31 0.46 0.28 0.45 0.31 0.46Department research score 0.59 0.21 0.7 0.18 0.55 0.23 0.71 0.18 0.35 0.21 0.56 0.16
Publications 45 41 50 44 60 52 58 39 26 21 31 26Journal articles 24 30 35 38 38 34 21 17 10 11 10 13- Articles in English 19 29 33 35 33 33 19 17 6 8 1 3- ISI/Scopus articles 18 29 32 36 33 33 19 17 6 8 1 3- ANVUR list articles (SS&H) - - - - 9 9 8 10- Q1-journal articles (STEM&Med) - 17 23 15 19 7 9 - -- A-journal articles (SS&H) - - - - 2 3 3 5Conference proceedings 8 15 7 14 7 15 30 25 4 7 3 5Chapters 6 9 2 4 4 6 4 6 7 8 11 12Books 2 3 0.5 1.6 0.8 2.1 0.9 2.1 2 3 4 4Other publications 5 15 5 12 10 25 3 8 2 6 3 8
Publications in Beall’s listNumber of Beall’s list articles 0.08 0.52 0.07 0.39 0.09 0.48 0.22 1.03 0.21 0.94 0.01 0.015At least one Beall’s list article 0.05 0.21 0.05 0.22 0.06 0.24 0.11 0.31 0.11 0.32 0.01 0.08% of Beall’s list articles in journal articles 0.5 3.5 0.3 1.7 0.3 1.9 1.4 6.4 2.2 8.5 0.1 1.6% of Beall’s list articles in journal articlesin English 0.9 6.0 0.3 2.3 0.5 3.3 1.6 7.0 4.1 14.2 0.7 6.9
Observations 46,244 11,953 10,712 4,607 3,256 15,716
Notes: University location is identified for all applicants with a permanent or temporal position in an Italian university. Department research score is from the 2011 departmentassessment by ANVUR (Valutazione della Qualita della Ricerca). Q1-journals are journals in the first quartile in the corresponding field in Web of Science in terms of the ArticleInfluence Score. A-journals are high-impact journals in the fields of Economics, Business, Social Sciences and Humanities as defined by ANVUR expert committee. Experience isdefined as the number of years since the first publication. Publication data refer to publications between 2002 and 2012 listed in applicants’ CVs.
30

Table 2: Who publishes in Beall’s list?
1 2 3
All Disciplinary group:
STEM&Med Econ&SSH
Female −0.001 −0.003 0.001(0.002) (0.003) (0.002)
Experience −0.004∗∗∗ −0.004∗∗∗ −0.004∗∗∗(0.001) (0.002) (0.001)
Position (benchmark - non-tenured university position):- Assistant Professor, tenured 0.003 0.002 0.002
(0.003) (0.005) (0.003)- Associate Professor, tenured 0.004 0.002 0.004
(0.005) (0.008) (0.006)- Abroad or non-university position −0.021∗∗∗ −0.027∗∗∗ −0.020∗∗∗
(0.006) (0.009) (0.006)University location:- Central Italy 0.006∗∗ 0.007 0.004
(0.003) (0.004) (0.003)- Southern Italy 0.029∗∗∗ 0.039∗∗∗ 0.014∗∗∗
(0.003) (0.004) (0.003)University ranking −0.036∗∗∗ −0.040∗∗∗ −0.042∗∗∗
(0.007) (0.010) (0.008)Total number of publications 0.018∗∗∗ 0.022∗∗∗ 0.011∗∗∗
(0.001) (0.001) (0.001)Proportion of Q1/A-journal articles −0.011∗∗∗ −0.014∗∗∗ −0.005∗∗∗
(0.001) (0.002) (0.001)
Mean dependent variable 0.048 0.065 0.024
Evaluation panel FE Yes Yes YesAdjusted R-Squared 0.062 0.044 0.099Observations 46, 244 27, 272 18, 972
Note: OLS estimates. The dependent variable is an indicator for authors who have publications in Beall’s listjournals. All productivity indicators in the prediction model exclude publications in Beall’s list. Productivityindicators and experience are normalized to have zero mean and unit standard deviation for all applicants in agiven field and category.* p < 0.10, ** p < 0.05, *** p < 0.01.
Table 3: Survey responses on Beall’s list journals
1 2 3 4 5 6
All journals Indexed in Scopus Listed by ANVUR
% of % with at % of % with at % of % with atanswers least one answers least one answers least one
answer answer answer
No referee report 8 12 9 19 11 22No or superficial referee report 22 30 21 33 27 43No or superficial referee report,or something odd
26 36 27 40 31 49
Notes: The table includes information on 242 journals for which at least one respondent could recall whetherthe publication involved a referee report.
31

Table 4: Determinants of success
1 2 3 4 5 6
All Disciplinary area:
Sciences Engineering Medical Sc. Econ&Bus Soc.Sc.&Hum
Author with Beall’s list articles −0.035∗∗ −0.059∗∗∗ −0.054∗∗ −0.024 0.012 −0.011(0.014) (0.021) (0.024) (0.021) (0.048) (0.041)
Productivity measures:Q1 or A-journal articles 0.125∗∗∗ 0.134∗∗∗ 0.081∗∗∗ 0.152∗∗∗ 0.161∗∗∗ 0.081∗∗∗
(0.007) (0.018) (0.013) (0.011) (0.022) (0.006)Other articles in Web of Science or Scopus 0.029∗∗∗ 0.036∗∗∗ 0.060∗∗∗ 0.044∗∗∗ 0.009 0.005
(0.004) (0.009) (0.009) (0.014) (0.013) (0.004)Other journal articles −0.006∗∗ −0.001 −0.009 0.005 −0.013 −0.011∗∗
(0.003) (0.006) (0.006) (0.005) (0.008) (0.004)Proceedings 0.012∗∗∗ −0.005 0.077∗∗∗ 0.000 0.013 0.019∗∗∗
(0.004) (0.010) (0.009) (0.005) (0.012) (0.005)Books 0.009∗∗∗ −0.004 0.007 −0.008∗ 0.001 0.034∗∗∗
(0.003) (0.006) (0.006) (0.004) (0.011) (0.004)Chapters 0.038∗∗∗ 0.030∗∗∗ 0.014∗∗ 0.028∗∗∗ 0.042∗∗∗ 0.056∗∗∗
(0.003) (0.005) (0.006) (0.005) (0.014) (0.004)Other publications −0.009∗∗∗ −0.014∗∗ −0.007 −0.002 −0.017∗∗ −0.006∗
(0.002) (0.005) (0.008) (0.006) (0.006) (0.003)
Other individual characteristics:Experience 0.008∗∗ 0.006 −0.004 0.002 −0.015 0.022∗∗∗
(0.004) (0.009) (0.008) (0.005) (0.009) (0.005)Non-tenured university position −0.096∗∗∗ −0.112∗∗∗ −0.126∗∗∗ −0.164∗∗∗ −0.014 −0.050∗∗∗
(0.018) (0.032) (0.042) (0.032) (0.038) (0.017)Fixed university position in the same field 0.255∗∗∗ 0.221∗∗∗ 0.318∗∗∗ 0.197∗∗∗ 0.303∗∗∗ 0.280∗∗∗
(0.011) (0.024) (0.018) (0.023) (0.033) (0.014)Fixed university position in other field 0.017 0.042∗∗ −0.075∗∗ −0.020 0.091∗∗ 0.025
(0.012) (0.018) (0.032) (0.029) (0.036) (0.017)University score 0.160∗∗∗ 0.126∗∗∗ 0.207∗∗∗ 0.261∗∗∗ 0.027 0.153∗∗∗
(0.026) (0.038) (0.056) (0.045) (0.071) (0.029)University location:- Central Italy −0.023∗∗∗ −0.022∗∗ −0.019 −0.015 −0.037∗ −0.012
(0.007) (0.010) (0.016) (0.023) (0.018) (0.011)- Southern Italy −0.039∗∗∗ −0.063∗∗∗ −0.043∗∗ −0.020 −0.064∗∗∗ −0.018∗
(0.008) (0.014) (0.019) (0.020) (0.019) (0.011)Exam FE Yes Yes Yes Yes Yes YesAdj. R-Squared 0.239 0.233 0.294 0.265 0.227 0.260Observations 69020 19164 6813 15418 6005 21620
Note: OLS estimates. Standard errors are clustered at the field level. Dependent variable takes value one if the applicantis granted a qualification. Research productivity indicators and experience are normalized for researchers applying to thesame position and field.* p < 0.10, ** p < 0.05, *** p < 0.01.
32

Table 5: Effect of committee research quality on the success of candidateswith Beall’s list publications
1 2 3 4 5 6 7
Disciplinary area:
Sciences Engineering Medical Sc. Econ&Bus Soc.Sc.&Hum
Author with Beall’s list articles −0.032∗∗ −0.032∗∗ −0.062∗∗∗ −0.062∗∗ −0.029 0.044 0.005(0.014) (0.014) (0.020) (0.024) (0.021) (0.038) (0.050)
Author with Beall’s list articles* Evaluators’ research quality −0.062∗∗ −0.067∗∗ −0.110∗∗∗ −0.037 0.031 −0.292∗∗∗ −0.026
(0.031) (0.033) (0.031) (0.049) (0.049) (0.093) (0.124)Exam FE Yes Yes Yes Yes Yes YesAdj. R-Squared 0.240 0.240 0.233 0.295 0.265 0.232 0.260Observations 69020 69020 19164 6813 15418 6005 21620
Note: Dependent variable takes value one if the applicant is granted a qualification. Evaluators’ research quality is measuredas the number of Q1 articles in STEM&Med fields and as the number of A-journal articles in Business and Economics, SocialSciences and Humanities, and it is normalized for all eligible evaluators in a given field. Column 1 reports the estimatefrom an OLS regression. In columns 2-7, the research quality of actual evaluators is instrumented by the research qualityof evaluators initially selected by the random draw. Standard errors are clustered at the field level. All regressions alsoinclude an interaction between the proportion of articles in Beall’s list and the expected evaluators’ research quality, whichis obtained based on one million simulated draws taking into account the composition of the pool of eligible evaluators andthe selection rules.* p < 0.10, ** p < 0.05, *** p < 0.01.
33

Figure 1: Beall’s list articles (%)
01
23
45
BL a
rtic
les a
mo
ng
En
glis
h-la
ng
ua
ge
art
icle
s, %
2002 2004 2006 2008 2010 2012Year
Sciences Economics and Management
Medicine Social Sciences and Humanities
Engineering
Figure 2: Citations of articles in Beall’s list journals
0.1
.2.3
Fra
ctio
n
0 20 40 60 80 100Number of Google Scholar citations
Excluding self-citations All citations
Note: The figure does not include 3 observations with more than 100 citations.
34
Appendix A. Data.
The data on the participants in Italian evaluations were available on the website of
the Italian Ministry of Higher Education and Research during the evaluation process.
We extracted all the individual characteristics that we use in the analysis from these
CVs. Information on tenured researchers’ affiliation was obtained from the Consortium
of Italian universities (CINECA). Affiliation of nontenured researchers is from the most
recent publication of the CV. Experience is the number of years elapsed from the
candidate’s first publication.
Candidates were required to report the ISSN code of their journal publications in
their submitted CVs. This facilitates the process of merging information in candidates’
CVs with various journal lists. To identify publications in Beall’s list journals, we first
collected titles and the ISSN codes of the whole set of journals of each publisher that
appeared in Beall’s list in January 2015. We also collected the ISSN codes of journals
included in the list of standalone predatory journals. We then matched the whole set
of articles with candidates’ CVs lists using the ISSN code of the journals. To avoid
mistakes, we ignored Beall’s list journals with no ISSN codes (about 40%). We also
exclude from the list the journals run by MDPI, a publisher that in 2015 was removed
from the Beall’s list after its successful appeal.
We also collected information on bibliometric information from Scopus and Web of
Science. First, we check whether journals in candidates’ CVs were indexed in Scopus
and Web of Science at the moment when candidates submitted their applications in
2012. Second, we consider journals citations ranks based on Scimago Journal Rank
(2011) and Article Influence Score (2012). For a subsample of journals, we consider
whether they are indexed in Google Scholar as in 2016 and their Google Scholar h-
index.
An average candidate submitted 1.5 applications. About 14% of initially submitted
applications were withdrawn during two weeks following the selection of committee
when withdrawals were still allowed. To avoid the problem of potentially endogenous
self-selection of candidates into evaluation process, when analyzing the determinants
35

of candidates’ success, we use information on all initial applications.
The Ministry also provided online CVs of all eligible, initially selected and actual
evaluators. Unfortunately, CVs of evaluators based in non-Italian universities are very
heterogeneous in their content and often incomplete, so in our analysis we focus only
on the impact of the research quality of evaluators based in Italy.
Appendix B. Survey email and questionnaire
In this section, we report the translated version of the email and questionnaire used
in our survey. The original version is available in the online appendix.
TRANSLATED VERSION
Email Subject : One of your published articles
Dear [NAME SURNAME],We contact you regarding your article “[ARTICLE TITLE]” published in [JOUR-
NAL TITLE].The aforementioned article (or its publisher) had been included by prof. Jeffrey
Beall (University of Colorado) in a list of “potentially, possibly, or probably” do notrespect international scientific standards. To give you an example, according to prof.Beall, some of the included journals accept articles without a proper refereeing system,or include in their web pages inaccurate information concerning their impact factor,the composition of their editorial board, or their precise location. You can find moreinformation on the list and Beall criteria at this link:[HYPERLINK TO BEALL’S LIST]
“Beall’s list” created a few controversies and some publishers initially included havebeen removed after a successful appeal. In an ongoing research project, our main goalis to shed some light on the reliability of the list and possibly to improve it. Yourexperience with the aforementioned journal is very important for our research.
Hence, we shall be pleased if you could devote just 2 minutes of your time to answer7 short questions concerned with your experience with [JOURNAL TITLE]:[HYPERLINK TO QUESTIONNAIRE]
We wish to make clear that our goal is not to question the seriousness of yourscientific work or of other articles published in the same aforementioned journal. Ouronly goal is to understand its editorial functioning.
Your answers will be anonymized and employed only for research purposes. Afterthe end of our project, also to thank you for your collaboration, we shall send you areport on the main results.
Yours sincerely,
36

Manuel Bagues, Aalto University, Helsinki (email: [email protected])Mauro Sylos Labini, University of Pisa (email: [email protected])Natalia Zinovyeva, Aalto University, Helsinki (email: [email protected])
Questionnaire
1. How did you first hear about the aforementioned journal?
• I received suggestion from a colleague
• An email/invitation to submit a paper
• Reading its published articles
• Attending a conference
• Other/I do not remember
2. After submitting your article, did you receive referee reports?
• No, I did not
• Yes, I did receive trivial referee report only addressing the editing
• Yes, I did and they also addressed the paper’s contents
• I do not remember
3. Did you pay any fee to publish your article?
• No, I did not
• Yes, I did and it was clear from the journal guidelines
• Yes, I did and I found out after the article was accepted for publication
• I do not remember
If you did, could you please indicate how much you paid? (in US dollar)
4. During the process of revision/acceptance of your paper, did you notice anythingthat made you distrust the integrity/professionalism of the journal?
• No, I did not
• Yes, I did
• I do not remember
In case you did, could you briefly tell us what?
5. According to your past experience, what is the academic value of articles pub-lished on this journal?
• High
• Average
• Low
37

• None
• Negative
6. According to your opinion, what should be the academic value of articles pub-lished on this journal?
• High
• Average
• Low
• None
• Negative
7. Have you ever heard about ”Beall list” before getting the invitation to participateto this survey?
• Yes
• No
In case you would like to add any comment or suggestion you can use the boxbelow
38

Table B1: Sample selection: Beall’s list journals
1 2 3 4
All journals Journals where Journals in the Journals with(non-missing ISSN) Italians published targeted sample survey info
Number of journals 7210 599 379 268Indexed in:Scopus 284 131 88 74- Q1 SJR 6 3 3 3Web of Science 14 10 6 5- Q1 AIS 0 0 0 0ANVUR list 273 213 128 102- A-journal 2 2 2 2Google Scholar n.a. n.a. 143 112- GS h-index (mean) n.a. n.a. 12 12
Notes: Column 1 includes information on all journals from Beall’s list with non-missing ISSN codes. Q1 SJRstands for the top-quartile journals in Scopus according to Scimago Journal Rank. Q1 AIS indicates top-quartile journals is Web of Science according to the Article Influence Score. n.a. - information is not available(not collected).
39

Table B2: Sample selection: researchers
1 2 3 4 5
Authors with t-test for equality of MeansBeall’s list Targeted Replied (p-values)articles targeted vs. not replied vs. not
Female 0.36 0.37 0.35 0.487 0.213Experience 15 16 16 0.163 0.238Disciplinary group:- Sciences 0.27 0.27 0.29 0.780 0.152- Engineering 0.22 0.22 0.21 0.606 0.788- Medicine 0.31 0.31 0.28 0.737 0.026- Business and Economics 0.16 0.16 0.17 0.658 0.235- Social Sciences and Humanities 0.04 0.04 0.05 0.622 0.749Permanent position in an Italianuniversity: 0.74 0.73 0.77 0.865 0.003- Assistant professor 0.62 0.59 0.57 0.019 0.226- Associate professor 0.38 0.41 0.43 0.019 0.226University location:- North 0.37 0.35 0.36 0.152 0.615- Center 0.23 0.24 0.25 0.544 0.150- South 0.41 0.41 0.39 0.376 0.084All publications 62 63 62 0.775 0.857Journal articles 32 33 32 0.920 0.324Q1 or A-journal articles 9.6 9.4 9.2 0.376 0.714Bealls list articles 1.6 1.6 1.6 0.214 0.579
Characteristics of the Beall’slist article inquired about inthe survey:Year of publication - 2010 2010 - 0.783Citations in Google Scholar - 8.9 9.3 - 0.469Journal is indexed in GoogleScholar - 0.52 0.54 - 0.109Journal Google Scholar H-index - 17 16 - 0.721Journal is indexed in Scopus - 0.43 0.45 - 0.201Journal Scopus SJR score - 0.55 0.55 - 0.698Journal is indexed in WoS - 0.13 0.14 - 0.628Journal WoS AIS score - 0.87 0.85 - 0.316
Observations 2225 1088 584
Notes: Column (1) includes information on 2225 authors who have published at least one article in a Beall’slist journal. Columns (2) and (3) provide information on authors who were targeted in the survey and authorswho replied to the survey respectively.
40

Table B3: Survey responses
1 2 3
All In Scopus/WoS:No Yes
How did you first hear about this journal?A suggestion from a colleague 33 28 39An email/invitation to submit a paper 27 30 23Reading its published articles 16 15 17Attending a conference 12 13 11Other / Do not remember 13 15 10
After submitting your article, did you receive referee reports?Yes, I did and they also addressed paper’s contents 64 65 62Yes, I did and they only addressed the editing 12 13 10No, I did not 7 7 8I do not remember 18 15 20
Did you pay any fee?No, I did not 44 45 42Yes, I did and it was clear from the journal guidelines 30 31 28Yes, I did and I found out after the article was acceptedfor publication 8 10 6I do not remember 18 14 24
Did you find anything odd in the process of revision/acceptance of the paper?No, I did not 78 77 80Yes, I did 10 10 11I do not remember 12 14 9
According to your experience, what’s the academic value of publicationsin this journal (in formal national research evaluations)?High 4 4 3Average 20 15 26Low 39 38 41None 24 30 16Negative 1 0.3 1.9I do not know 13 14 12
In your opinion, what should be the academic value of publications inthis journal (in formal national research evaluations)?High 5 5 5Average 35 33 37Low 35 36 34None 10 11 9Negative 1.2 0.3 2.3I do not know 14 15 13
Have you ever heard about Beall’s list before?No 90 88 93Yes 10 12 7
Notes: The table reports percentages of non-missing answers to each question.
41

Table B4: Journals with at least one reported bad practice
Journal title Replies Any bad Scopus WoS NSQ Google
practice, % 2012 2012 2012 Scholar
APPLIED MATHEMATICS 3 100 0 0 1 0
CHINA-USA BUSINESS REVIEW 2 100 0 0 1 1
ENVIRONMENTAL ECONOMICS 2 100 0 0 1 0
INTERNATIONAL JOURNAL OF CONTEMPORARY
MATHEMATICAL SCIENCES 2 100 0 0 1 0
THE OPEN FUELS & ENERGY SCIENCE JOURNAL 2 100 1 0 0 0
THE OPEN PROTEOMICS JOURNAL 2 100 1 0 0 0
ACTA INFORMATICA MEDICA 1 100 1 0 0 1
AFRICAN JOURNAL OF AGRICULTURAL RESEARCH 1 100 1 0 1 1
AMERICAN JOURNAL OF FOOD TECHNOLOGY 1 100 1 0 1 0
ATMOSPHERIC AND CLIMATE SCIENCE 1 100 0 0 0 1
CREATIVE EDUCATION 1 100 0 0 0 1
ENERGY AND ENVIRONMENT RESEARCH 1 100 0 0 0 1
EUROPEAN JOURNAL OF MANAGEMENT (EJM) 1 100 0 0 1 0
EUROPEAN JOURNAL OF SCIENTIFIC RESEARCH 1 100 0 0 1 0
GLOBAL ECONOMY AND FINANCE JOURNAL 1 100 0 0 1 0
INTERNATIONAL JOURNAL OF APPLIED PSYCHOL-
OGY 1 100 0 0 0 0
INTERNATIONAL JOURNAL OF COMPUTER SCIENCE
ISSUES 1 100 0 0 0 1
INTERNATIONAL JOURNAL OF HUMANITIES AND SO-
CIAL SCIENCE 1 100 0 0 1 1
INTERNATIONAL JOURNAL OF MATERIAL SCIENCE 1 100 0 0 0 0
INTERNATIONAL JOURNAL OF MATHEMATICAL
ANALYSIS 1 100 1 0 1 0
INTERNATIONAL JOURNAL ON ADVANCES IN SOFT-
WARE 1 100 0 0 0 0
JOURNAL OF ANTIVIRALS AND ANTIRETROVIRALS 1 100 1 0 0 0
JOURNAL OF AQUACULTURE RESEARCH & DEVEL-
OPMENT 1 100 0 0 0 1
JOURNAL OF CLINICAL MEDICINE RESEARCH 1 100 0 0 0 1
JOURNAL OF FOOD RESEARCH 1 100 0 0 0 1
JOURNAL OF INTERNATIONAL ENVIRONMENTAL AP-
PLICATION & SCIENCE 1 100 0 0 0 1
JOURNAL OF MATHEMATICAL SCIENCES: ADVANCES
AND APPLICATIONS 1 100 0 0 1 0
JOURNAL OF NANOMEDICINE & BIOTHERAPEUTIC
DISCOVERY 1 100 0 0 0 0
JOURNAL OF PHARMACY AND NUTRITION SCIENCES 1 100 0 0 0 1
JOURNAL OF TRAUMA & TREATMENT 1 100 0 0 0 0
Continued on next page
42

Table B4 – Journals with at least one reported bad practice (continued)
Journal title Replies Any bad Scopus WoS NSQ Google
practice, % 2012 2012 2012 Scholar
NATURAL SCIENCE 1 100 0 0 0 1
OPEN CONFERENCE PROCEEDINGS JOURNAL 1 100 0 0 0 0
RESEARCH IN APPLIED ECONOMICS 1 100 0 0 1 1
SURGICAL SCIENCE 1 100 0 0 0 1
THE OPEN CRYSTALLOGRAPHY JOURNAL 1 100 0 0 0 0
THE OPEN ECONOMICS JOURNAL 1 100 0 0 1 0
THE OPEN FOOD SCIENCE JOURNAL 1 100 0 0 0 0
THE OPEN MEDICAL IMAGING JOURNAL 1 100 0 0 0 0
THE OPEN PSYCHOLOGY JOURNAL 1 100 0 0 0 0
UNIVERSAL JOURNAL OF MANAGEMENT AND SO-
CIAL SCIENCES 1 100 0 0 1 0
WORLD APPLIED SCIENCES JOURNAL 1 100 1 0 0 1
WSEAS TRANSACTIONS ON BIOLOGY AND
BIOMEDICINE 1 100 1 0 0 0
WSEAS TRANSACTIONS ON CIRCUITS AND SYSTEMS 1 100 1 0 0 1
WSEAS TRANSACTIONS ON COMMUNICATIONS 1 100 1 0 0 1
WSEAS TRANSACTIONS ON MATHEMATICS 1 100 1 0 1 1
WSEAS TRANSACTIONS ON SIGNAL PROCESSING 1 100 0 0 1 0
JOURNAL OF ANIMAL AND VETERINARY ADVANCES 8 75 1 1 0 1
INTERNATIONAL MATHEMATICAL FORUM 7 71 0 0 1 0
JOURNAL OF LIFE SCIENCES 3 67 0 0 1 1
THE EUROPEAN JOURNAL OF ECONOMICS, FINANCE
AND ADMINISTRATIVE SCIENCES 3 67 1 0 1 0
THE OPEN MECHANICAL ENGINEERING JOURNAL 3 67 1 0 0 1
WSEAS TRANSACTIONS ON COMPUTERS 6 50 1 0 1 1
WSEAS TRANSACTIONS ON INFORMATION SCIENCE
AND APPLICATIONS 6 50 1 0 1 1
JOURNAL OF US-CHINA PUBLIC ADMINISTRATION 4 50 0 0 1 1
BRITISH JOURNAL OF MEDICINE AND MEDICAL RE-
SEARCH 2 50 0 0 0 1
INTERNATIONAL JOURNAL OF ACADEMIC RE-
SEARCH IN ACCOUNTING, FINANCE AND MANAGE-
MENT SCIENCES 2 50 0 0 1 1
INTERNATIONAL JOURNAL OF COMPUTER SCIENCE
AND NETWORK SECURITY (IJCSNS) 2 50 0 0 1 1
JOURNAL OF KNOWLEDGE MANAGEMENT, ECO-
NOMICS AND INFORMATION TECHNOLOGY 2 50 0 0 1 1
JOURNAL OF MODERN ACCOUNTING AND AUDITING 2 50 0 0 1 1
JOURNAL OF PURE AND APPLIED MATHEMATICS:
ADVANCES AND APPLICATIONS 2 50 0 0 1 0
PSYCHOLOGY 2 50 0 0 1 0
Continued on next page
43

Table B4 – Journals with at least one reported bad practice (continued)
Journal title Replies Any bad Scopus WoS NSQ Google
practice, % 2012 2012 2012 Scholar
SOCIOLOGY MIND 2 50 0 0 1 1
THE OPEN ZOOLOGY JOURNAL 2 50 0 0 0 0
THEORETICAL ECONOMICS LETTERS 2 50 0 0 1 0
US-CHINA FOREIGN LANGUAGE 2 50 0 0 1 1
APPLIED MATHEMATICAL SCIENCES 9 44 1 0 1 0
INTERNATIONAL JOURNAL OF ENGINEERING BUSI-
NESS MANAGEMENT 5 40 1 0 1 1
WSEAS TRANSACTIONS ON SYSTEMS 8 38 1 0 1 0
INTERNATIONAL JOURNAL OF PURE AND APPLIED
MATHEMATICS 12 33 1 0 1 1
HEAD AND NECK ONCOLOGY 3 33 1 0 0 0
INTERNATIONAL JOURNAL OF BUSINESS AND MAN-
AGEMENT 3 33 0 0 1 1
JOURNAL OF BUSINESS AND POLICY RESEARCH 3 33 0 0 1 0
JOURNAL OF COMMUNICATIONS (JCM) 3 33 0 0 0 1
JOURNAL OF EARTH SCIENCE AND ENGINEERING 3 33 0 0 0 1
JOURNAL OF ENVIRONMENTAL SCIENCE AND ENGI-
NEERING 3 33 0 0 1 1
JOURNAL OF INTELLIGENT LEARNING SYSTEMS
AND APPLICATIONS 3 33 0 0 1 1
MEDITERRANEAN JOURNAL OF SOCIAL SCIENCES 3 33 0 0 1 1
NANOMATERIALS AND NANOTECHNOLOGY 3 33 0 0 0 0
CHINESE BUSINESS REVIEW 4 25 0 0 1 1
INVESTMENT MANAGEMENT & FINANCIAL INNOVA-
TIONS 4 25 1 0 1 0
JOURNAL OF APPLIED SCIENCES 4 25 1 0 1 1
JOURNAL OF AGRICULTURAL SCIENCE AND TECH-
NOLOGY 5 20 0 0 1 1
JOURNAL OF ENVIRONMENTAL PROTECTION 5 20 0 0 1 1
FRONTIERS IN BIOSCIENCE 45 16 1 1 0 1
INTERNATIONAL JOURNAL OF ADVANCED ROBOTIC
SYSTEMS 7 14 1 1 1 1
PHARMACOLOGYONLINE (PHOL) 8 13 1 0 1 0
Notes: The number of replies stands for the number of replies by respondents that could recall the experience with the
journal. ‘Bad practice’ indicates cases when the author did not receive a referee report, received only a superficial referee
report, or noticed something that made him/her distrust the integrity/professionalism of the journal.
44
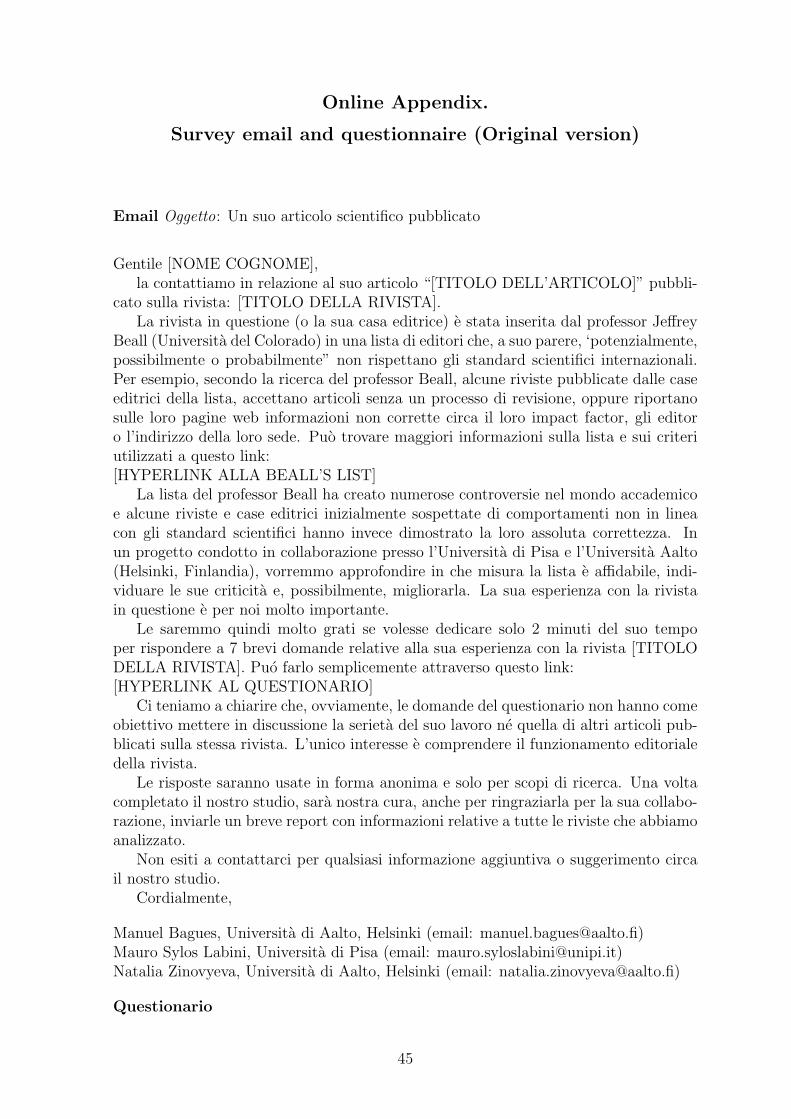
Online Appendix.
Survey email and questionnaire (Original version)
Email Oggetto: Un suo articolo scientifico pubblicato
Gentile [NOME COGNOME],la contattiamo in relazione al suo articolo “[TITOLO DELL’ARTICOLO]” pubbli-
cato sulla rivista: [TITOLO DELLA RIVISTA].La rivista in questione (o la sua casa editrice) e stata inserita dal professor Jeffrey
Beall (Universita del Colorado) in una lista di editori che, a suo parere, ‘potenzialmente,possibilmente o probabilmente” non rispettano gli standard scientifici internazionali.Per esempio, secondo la ricerca del professor Beall, alcune riviste pubblicate dalle caseeditrici della lista, accettano articoli senza un processo di revisione, oppure riportanosulle loro pagine web informazioni non corrette circa il loro impact factor, gli editoro l’indirizzo della loro sede. Puo trovare maggiori informazioni sulla lista e sui criteriutilizzati a questo link:[HYPERLINK ALLA BEALL’S LIST]
La lista del professor Beall ha creato numerose controversie nel mondo accademicoe alcune riviste e case editrici inizialmente sospettate di comportamenti non in lineacon gli standard scientifici hanno invece dimostrato la loro assoluta correttezza. Inun progetto condotto in collaborazione presso l’Universita di Pisa e l’Universita Aalto(Helsinki, Finlandia), vorremmo approfondire in che misura la lista e affidabile, indi-viduare le sue criticita e, possibilmente, migliorarla. La sua esperienza con la rivistain questione e per noi molto importante.
Le saremmo quindi molto grati se volesse dedicare solo 2 minuti del suo tempoper rispondere a 7 brevi domande relative alla sua esperienza con la rivista [TITOLODELLA RIVISTA]. Puo farlo semplicemente attraverso questo link:[HYPERLINK AL QUESTIONARIO]
Ci teniamo a chiarire che, ovviamente, le domande del questionario non hanno comeobiettivo mettere in discussione la serieta del suo lavoro ne quella di altri articoli pub-blicati sulla stessa rivista. L’unico interesse e comprendere il funzionamento editorialedella rivista.
Le risposte saranno usate in forma anonima e solo per scopi di ricerca. Una voltacompletato il nostro studio, sara nostra cura, anche per ringraziarla per la sua collabo-razione, inviarle un breve report con informazioni relative a tutte le riviste che abbiamoanalizzato.
Non esiti a contattarci per qualsiasi informazione aggiuntiva o suggerimento circail nostro studio.
Cordialmente,
Manuel Bagues, Universita di Aalto, Helsinki (email: [email protected])Mauro Sylos Labini, Universita di Pisa (email: [email protected])Natalia Zinovyeva, Universita di Aalto, Helsinki (email: [email protected])
Questionario
45

1. Come ha conosciuto l’esistenza della rivista in questione?
• Attraverso la segnalazione di un collega
• Con un email/invito della rivista
• Partecipando ad una conferenza
• Leggendo articoli pubblicati dalla rivista
• Altro/Non ricordo
2. Dopo aver inviato il suo articolo, ha ricevuto referee report?
• No
• Sı, ho ricevuto referee report superficiali solo relativi alla forma
• Sı, ho ricevuto referee report anche relativi ai contenuti
• Non ricordo
3. La pubblicazione del suo articolo e stata a pagamento?
• Sı, era evidente nelle regole della rivista
• Sı, l’ho scoperto dopo che l’articolo e stato accettato
• No, non c’e stato alcun costo
• Non ricordo
Se ha pagato per la pubblicazione, puo indicarci qual era il prezzo (in $ USA)?
4. Nel processo di revisione e accettazione dell?articolo, c’e stato qualcosa che le hafatto dubitare dell’integrita/professionalita della rivista?
• No
• Sı
• Non ricordo
Se ha risposto sı alla domanda precedente, puo descrivere brevemente cosa?
5. In base alla sua esperienza professionale, che valore hanno accademicamente lepubblicazioni su questa rivista (per esempio per la Valutazione della Qualita dellaRicerca (VQR), l’Abilitazione Scientifica Nazionale (ASN), i fondi di ricerca)?
• Alto
• Medio
• Basso
• Nullo
• Negativo
46
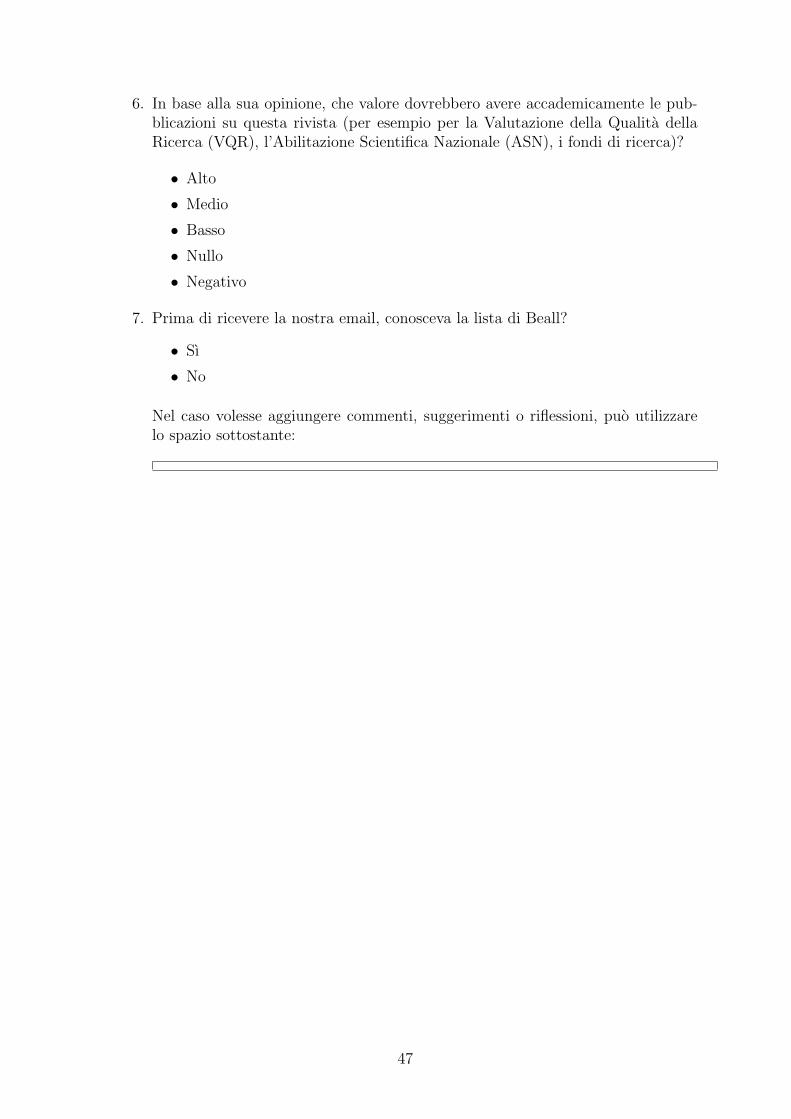
6. In base alla sua opinione, che valore dovrebbero avere accademicamente le pub-blicazioni su questa rivista (per esempio per la Valutazione della Qualita dellaRicerca (VQR), l’Abilitazione Scientifica Nazionale (ASN), i fondi di ricerca)?
• Alto
• Medio
• Basso
• Nullo
• Negativo
7. Prima di ricevere la nostra email, conosceva la lista di Beall?
• Sı
• No
Nel caso volesse aggiungere commenti, suggerimenti o riflessioni, puo utilizzarelo spazio sottostante:
47