Finding Dominators in Flowgraphs Loukas Georgiadis COS 423 - 03/29/2004

Working Paper Series Determinants of global spillovers from US monetary policy
Georgios Georgiadis
No 1854 / September 2015
Note: This Working Paper should not be reported as representing the views of the European Central Bank (ECB). The views expressed are those of the authors and do not necessarily reflect those of the ECB

Abstract
This paper assesses the global spillovers from identified US monetary policy shocks in aglobal VAR model. US monetary policy generates sizable output spillovers to the restof the world, which are larger than the domestic effects in the US for many economies.The magnitude of spillovers depends on the receiving country’s trade and financialintegration, de jure financial openness, exchange rate regime, financial market devel-opment, labor market rigidities, industry structure, and participation in global valuechains. The role of these country characteristics for the spillovers often differs acrossadvanced and non-advanced economies and also involves non-linearities. Furthermore,economies which experience larger spillovers from conventional US monetary policyalso displayed larger downward revisions of their growth forecasts in spring 2013 whenthe Federal Reserve upset markets by discussing tapering off quantitative easing. Theresults of this paper suggest that policymakers could mitigate their economies’ vul-nerability to US monetary policy by fostering trade integration as well as domesticfinancial market development, increasing the flexibility of exchange rates, and reduc-ing frictions in labor markets. Other policies—such as inhibiting financial integration,industrialisation and participation in global value chains—might mitigate spilloversfrom US monetary policy, but are likely to reduce long-run growth.
Keywords: Mixed cross-section global VAR, spillovers, US monetary policy.
JEL-Classification: F4, E5, C3.
ECB Working Paper 1854, September 2015 1

Non-technical summary
The global economy has witnessed a substantive deepening of trade and financial integration and
associated increase in the relevance of spillovers to the domestic economy from shocks in other
economies. For example, in May 2013 discussions of tapering of the unconventional monetary
policies of the Federal reserve led to global spillovers, in particular exemplified by sell-offs of
emerging market securities by international investors. Also, it has been argued that financial
conditions and growth worldwide are driven by a global financial cycle, which appears to be
determined to a large extent by monetary policy in the center country: the US (Rey, 2013; Bekaert et
al., 2014; Bruno and Shin, 2014). This paper advances our understanding of cross-country spillovers
by estimating the global effects on real activity of conventional US monetary policy and by shedding
light on the determinants of their magnitude across economies. In particular, I employ a global VAR
model estimated for 61 countries over the time period from 1999 to 2009 and I identify a US
monetary policy shock by imposing sign restrictions on the responses of output growth and inflation. I
find that the global spillovers from US monetary policy shocks are substantial, being larger than the
domestic effects in the US in many economies. Moreover, I find that the magnitude of spillovers from
US monetary policy economies experience depends on a number of country characteristics. For
example, economies which are more integrated in global capital markets and less in trade, which
feature more rigid labor and less developed domestic financial markets, and which have a high share
of output accounted for by manufacturing industries experience larger spillovers. Moreover, there
appear to be some differences in the determinants of the magnitude of spillovers across advanced
and non-advanced economies. In particular, advanced economies that limit the flexibility of their
exchange rate experience larger spillovers; more de jure financially open non-advanced economies
experience larger spillovers. The magnitude of spillovers from US monetary policy is also determined
by the joint constellation of country characteristics. For example, some results suggest that in non-
advanced economies trade integration amplifies spillovers if their industry structure is tilted towards
the production of manufactured goods, if they participate in global value chains and allow only
limited flexibility of their exchange rate. Also, exchange rate liberalisation tends to magnify spillovers
if non-advanced economies do not trade much. And financial integration is associated with larger
spillovers if non-advanced economies have an inflexible exchange rate. Finally, even though in this
paper I study the spillovers from conventional US monetary policy, I obtain evidence suggesting that
the transmission channels of global spillovers from exit from quantitative easing may be similar: there
is a statistically significant positive correlation between the spillovers from conventional US monetary
ECB Working Paper 1854, September 2015 2

policy and the revisions in growth forecasts in spring 2013 when Federal Reserve chairman Bernanke
upset financial markets by discussing tapering off quantitative easing. The results of this paper offer
some recommendations regarding the policies that could help to mitigate spillovers from
(un)conventional monetary policy in the US – and possibly external shocks more generally. In
particular, economies could reduce their vulnerability to US monetary policy by fostering domestic
financial market development, trade integration, the liberalisation of exchange rates, reducing
frictions in labor markets and ensuring fiscal space. Other policies that may mitigate the spillovers
from US monetary policy are likely to conflict with the pursuit of other important objectives of
policymakers. For example, participation in global value chains through trade in intermediates has
helped economies to raise their potential growth similarly, capital market integration and financial
openness allows economies to reap collateral benefits from financial globalisation Clearly, a
completely closed economy will not experience any spillovers whatsoever, but is likely to grow more
slowly in the long run. In these cases, the trade-offs should be carefully considered before any
measures are taken.
ECB Working Paper 1854, September 2015 3

1 Introduction
Over the last decades the global economy has witnessed a substantive deepening of trade and
financial integration. The associated growing importance of spillovers from shocks in other
economies has given impetus to academics and practitioners alike to devote more efforts
to understand the relevant transmission channels (see, for example, IMF, 2013a). It has
even been argued that financial conditions and growth worldwide are driven by a global
financial cycle, which, in turn, appears to be determined to a large extent by monetary
policy in the US (Rey, 2013; Bekaert et al., 2013). This paper advances our understanding
of cross-country spillovers by quantifying the global effects on real activity of conventional
US monetary policy and by shedding light on the channels through which these materialise.
I find that the spillovers from US monetary policy are substantial; in fact, for many economies
the spillovers are larger than the domestic effects in the US. Furthermore, I find that in line
with existing literature the magnitude of spillovers depends on a number of country charac-
teristics including financial integration, trade openness, the exchange rate regime, industry
structure, financial market development and labour market rigidities (Rey and Martin, 2006;
Cavallo and Frankel, 2008; Calvo et al., 2008; Edwards, 2004, 2007b,a; Milesi-Ferretti and
Tille, 2011; Broda, 2001; Edwards and Levy Yeyati, 2005). For example, economies which
are more integrated in global capital markets and less in trade, which feature more rigid labor
and less developed domestic financial markets, and which have a high share of output ac-
counted for by manufacturing industries experience larger spillovers. Moreover, there appear
to be some differences in the determinants of the magnitude of spillovers across advanced
and non-advanced economies. In particular, advanced economies that limit the flexibility of
their exchange rate experience larger spillovers; more de jure financially open non-advanced
ECB Working Paper 1854, September 2015 4

economies experience larger spillovers. The magnitude of spillovers from US monetary policy
is also determined by the joint constellation of country characteristics. For example, some
results suggest that in non-advanced economies trade integration amplifies spillovers if their
industry structure is tilted towards the production of manufactured goods, if they partici-
pate in global value chains and allow only limited flexibility of their exchange rate. Also,
exchange rate liberalisation tends to magnify spillovers if non-advanced economies do not
trade much. And financial integration is associated with larger spillovers if non-advanced
economies have an inflexible exchange rate. Finally, even though in this paper I focus on the
spillovers from conventional US monetary policy, I obtain some tentative evidence suggesting
that the transmission channels of global spillovers from exit from quantitative easing may be
similar: there is a statistically significant positive correlation between the global spillovers
from conventional US monetary policy and the revisions in countries’ growth forecasts in
spring 2013 when Federal Reserve chairman Bernanke upset financial markets by discussing
tapering off quantitative easing.
The results of this paper suggest that economies could reduce their vulnerability to US
monetary policy by fostering domestic financial market development, trade integration, the
liberalisation of exchange rates, and reducing frictions in labor markets. Other policies that
may mitigate the spillovers from US monetary policy are likely to conflict with the pursuit of
other important objectives of policymakers. For example, participation in global value chains
through trade in intermediates has helped economies to raise their potential growth (see IMF,
2013c); similarly, capital market integration and financial openness allow economies to reap
collateral benefits from financial globalisation (see Kose et al., 2009; Binder et al., 2013).
Clearly, a completely closed economy will not experience any spillovers whatsoever, but is
likely to grow more slowly in the long run. In these cases, the trade-offs should be carefully
ECB Working Paper 1854, September 2015 5

considered before any measures are taken (see, for example, the IMF’s institutional view on
capital flow management, IMF, 2012).
The paper is related to and contributes to four strands of the literature. First, several
papers investigate the global output spillovers from conventional US monetary policy (see,
for example, Kim and Roubini, 2000; Kim, 2001; Faust and Rogers, 2003; Faust et al., 2003;
Canova, 2005; Nobili and Neri, 2006; Mackowiak, 2007; Bluedorn and Bowdler, 2011). The
empirical approach in these papers is based on two-country VAR models which involve the
US and domestic macroeconomic variables of one additional economy (or vice versa) and
which are estimated for a few countries only. The results of this literature suggest that US
monetary policy has substantial global spillovers across both advanced and emerging market
economies, and that these arise mainly through spillovers in interest rates.1 However, these
papers do not shed light on why some countries experience larger spillovers than others. As a
result, this literature offers few insights to policymakers that could help them to render their
economies more resilient to changes in US monetary policy. In addition, these papers may
also suffer from methodological constraints. Specifically, as they build on two-country VAR
models they do not account for the multilateral nature of global interlinkages; spillovers from
US monetary policy may affect all economies, and thereby give rise to third-country effects
and spillbacks that a bilateral model fails to capture. Exceptions to the use of bilateral
models in this literature are Dees et al. (2010) and Chen et al. (2012). The former examine
the global effects of US monetary policy based on a multi-country New Keynesian dynamic
stochastic general equilibrium model that they solve using the GVAR approach. The latter
1Frankel and Roubini (2001) and Reinhart and Reinhart (2002) take a more general approach and examinethe effects of changes in world rather than US interest rates on domestic growth and obtain similar results.di Giovanni and Shambaugh (2008) focus on changes in base-country rather than US interest rates and findthat the spillovers to domestic output are statistically significant only for economies which do not let theirexchange rate float. Finally, Canova and Ciccarelli (2009) as well as Dees and Saint-Guilhem (2011) examinespillovers from shocks to US GDP growth rather than US monetary policy.
ECB Working Paper 1854, September 2015 6

use a GVAR model to analyse the global spillovers from unconventional monetary policy
in the US. However, while both do account for the multilateral nature of cross-country
interlinkages, they do not study the sources of the heterogeneities in the spillovers they
find. In contrast, in this paper I set up a multilateral GVAR model for a large number of
economies in order to identify the country characteristics that give rise to variations in the
magnitude of the spillovers from US monetary policy.
Second, this paper is also related to the literature on the spillovers from US monetary policy
to global financial markets (see Craine and Martin, 2008; Ehrmann and Fratzscher, 2009;
Wongswan, 2009; Neely, 2010; Hausman and Wongswan, 2011; Gurkaynak and Wright, 2011;
Fratzscher et al., 2013; Moore et al., 2013; Rogers et al., 2014). These papers study the effects
of US monetary policy shocks on other countries’ equity and bond markets, capital flows and
exchange rates, typically at high frequency. This literature finds that financial spillovers are
large, and it establishes that country characteristics referring to financial market structure
and integration explain a substantial fraction of the cross-country heterogeneities. The
papers in this literature investigate different dimensions of US monetary policy, such as
conventional and unconventional policies, surprises to the federal funds rate target and to
its future path as well as announcements and asset purchases. However, in contrast to this
paper this literature does not examine the global output spillovers from US monetary policy
and their determinants. Moreover, these papers do not account for the multilateral nature
of spillovers.
Third, this paper is related to the literature analysing the role of specific country characteristics—
such as the exchange rate regime or the extent of capital controls—for spillovers (see Philip-
pon et al., 2001; Frankel et al., 2004; Shambaugh, 2004; Miniane and Rogers, 2007). In
contrast to this paper, this literature typically does not focus on the spillovers from US
ECB Working Paper 1854, September 2015 7

monetary policy, but more generally on interest rate changes in the country which repre-
sents the base country for the domestic economy’s exchange rate. Moreover, as they build
on bilateral regression models these papers do not account for the multilateral nature of
global spillovers. Most importantly, however, in contrast to this paper they examine the
spillovers from foreign to domestic interest rates rather than to real activity. Even though
interest rates play an important role in the transmission of shocks and in macroeconomic
management, ultimately the variables of interest to policymakers are real activity and infla-
tion. And, the empirical literature on domestic monetary transmission suggests that a given
change in interest rates does not map uniquely into changes in output growth and inflation
(see Carlino and DeFina, 1998; Cecchetti, 1999; Ehrmann, 2000; Georgiadis, 2014); rather,
the strength of the transmission depends on a host of country characteristics. As a result,
these papers offer only limited guidance to policymakers as to how they could render their
economies more resilient to changes in US monetary policy. In contrast, the results of this
paper identify policies which could mitigate economies’ vulnerability to US monetary policy.
Finally, this paper adds to the quickly expanding literature on spillovers estimated by GVAR
models. By now, GVAR models have been applied to the analysis of numerous empirical
questions (see Chudik and Pesaran, 2014, for a survey). However, in this literature the infor-
mation contained in the cross-country heterogeneities of the spillover estimates is typically
not exploited in order to improve our understanding of the transmission channels.2 In con-
trast, this paper advances our understanding of the transmission channels by moving beyond
the estimation of the responses of domestic variables to foreign shocks and by analysing the
role of country characteristics for the magnitude of the spillovers.
The remainder of the paper is organised as follows. The next section introduces the GVAR
2An exception is Chudik and Fratzscher (2012).
ECB Working Paper 1854, September 2015 8
model on which the analysis of spillovers from US monetary policy in this paper builds.
Section 3 presents the results for the spillover estimates as well as the role of country char-
acteristics for heterogeneities in the global transmission of US monetary policy. Section 4
describes the results from a number of robustness checks regarding the GVAR model speci-
fication and the identification of US monetary policy shocks. Finally, Section 5 concludes.
2 The Empirical Model
By combining country-specific VAR models into a global model, the GVAR approach intro-
duced by Pesaran et al. (2004) allows one to model the dynamics of several economies jointly.
Unfortunately, the institutional framework of currency unions such as the euro area—a num-
ber of currency union members which are subject to a common monetary policy shaped by
union-wide variables—complicates the inclusion of individual member economies in a stan-
dard GVAR model: the equation reflecting monetary policy cannot be included in any of
the country-specific VAR models, as the central bank responds to union-wide rather than
an individual member’s endogenous variables. Recognising this complication, in the GVAR
literature the euro area economy is typically included ”as a whole [in order to avoid] being
subject to possible inconsistencies that could arise if the different economies in the euro area
were modelled separately” (see Dees et al., 2007, p. 2), see also Eickmeier and Ng (2011);
Cashin et al. (2012); Rebucci et al. (2012); Chudik and Smith (2013). While being consis-
tent with the institutional framework of the euro area, by aggregating individual economies
into a euro area economy this approach implies renouncing to entering a relatively large
number of advanced economies individually; and this reduces the amount for cross-sectional
ECB Working Paper 1854, September 2015 9

information for the analysis of the determinants of spillovers from US monetary policy.
In order to maximise the number of advanced economies that I can draw on in the analysis
below, I build on the mixed cross-section GVAR model set up in Georgiadis (forthcoming).
The model in Georgiadis (forthcoming) allows—in contrast to the standard approach in
the GVAR literature—to include euro area economies individually and at the same time
to model euro area monetary policy in a manner consistent with EMU, namely as being
shaped by euro area aggregate output growth and inflation dynamics. Specifically, in the
model of Georgiadis (forthcoming) the ECB is introduced as a separate cross-sectional unit
in which euro area short-term interest rates are determined as a function of GDP-weighted
euro area output growth and inflation. In turn, each euro area country-specific VAR model
describes the evolution of output growth and inflation given euro area short-term interest
rates which are determined in the ECB’s model. Of course, both the ECB’s model and those
of the individual euro area economies are also affected by non-euro area real and financial
developments. The non-euro area part of the GVAR model is treated in the standard way
(except for oil prices, see below).
Denote the country-specific VARX models on which the GVAR model builds by
xit = ai +
pi∑j=1
Φij · xi,t−j +
p∗i∑j=0
Γij · x∗i,t−j + uit, i = 1, 2, . . . , N, (1)
where xit is a ki-dimensional vector of domestic macroeconomic variables, and x∗it is a k∗
i -
dimensional vector of foreign macroeconomic variables. For the euro area economies the
vector of endogenous variables xit includes output and prices;3 the vector of foreign vari-
3The economies which are modelled as being subject to euro area monetary policy are Austria, Belgium,Finland, France, Germany, Greece, Ireland, Italy, Luxembourg, the Netherlands, Portugal and Spain. Slove-nia, Slovakia and Estonia are not treated as euro area economies for the estimation of the model as theyadopted the euro only recently.
ECB Working Paper 1854, September 2015 10

ables x∗it includes trade-weighted foreign output and prices, euro area short-term interest
rates, and trade-weighted foreign interest rates determined in the remaining economies. For
all non-euro area economies, the vector of endogenous variables includes output and prices
as well, but in addition also short-term interest rates; the corresponding vector of foreign
variables comprises trade-weighted foreign output, prices and interest rates. Short-term in-
terest rates in the euro area are not determined in any of the individual euro area economies’
VARX models. Rather, as in Georgiadis (forthcoming) a separate model is introduced for the
ECB which features the short-term interest rate as the only endogenous variable; the corre-
sponding vector of ”foreign” variables in the ECB model comprises GDP-weighted averages
of output and prices of euro area economies as well as GDP-weighted interest rates of non-
euro area economies. As in Pesaran et al. (2004), bilateral exchange rates are not entered in
each country VARX model symmetrically. In particular, as all euro area economies feature
the same nominal bilateral exchange rate, the euro is chosen as the numeraire currency: In
each euro area economy VARX model the trade-weighted nominal bilateral euro exchange
rate of the euro enters the vector of foreign variables; in contrast, in the non-euro area
economies’ VARX models, the nominal bilateral exchange rate vis-a-vis the euro is entered
as an endogenous variable.4 I also introduce an oil block in order to model commodity prices
endogenously. Specifically, the VARX model for the oil block features oil prices as the only
endogenous variable. The corresponding vector of foreign variables includes GDP-weighted
averages of global output, prices and short-term interest rates. In turn, oil prices enter the
VARX models of all economies and the ECB as an additional foreign variable.
I enter output, prices, the nominal bilateral exchange rate and oil prices in first differences
of their logarithms.5 The sample I investigate runs from 1999Q1 to 2009Q4 and includes 61
4The euro area trade-weighted nominal exchange rate enters the ECB model as foreign variable.5See Georgiadis (forthcoming) for a discussion about the specification of GVAR models in first differences.
ECB Working Paper 1854, September 2015 11
economies. The sample begins in 1999 when the ECB assumed responsibility for monetary
policy in the euro area. I drop the most recent years in the sample in order to reduce the
likelihood that the data include structural breaks and non-linearities associated with the
euro area sovereign debt crisis.6 Table 1 provides information on the full set of economies
that are included. I summarise the economies of Estonia, Latvia and Lithuania into a
Baltic (BAL) region, and the economies of Venezuela, Ecuador and Saudi Arabia into an
Oil Exporting Countries (OPC) block, which is different from the oil block described above.
Due to the small time-series dimension, for estimation I set the lag order to one for the
endogenous variables and restrict the foreign variables in each VARX model to enter only
contemporaneously. Finally, in order to account for the extraordinary role of the US in
the global economy, I treat the US as a dominant unit in the sense of Pesaran and Chudik
(2010).7
2.1 Identification of US Monetary Policy Shocks
In the baseline specification I consider the effects of US monetary policy shocks identified
by sign restrictions following the approach of Eickmeier and Ng (2011). Consider the global
representation of the MCSGVAR model
G0 · xt = a+
q∑j=1
Gj · xt−j + ut, (2)
where the global matrices Gj collect the relevantΓij and Φij from the unit-specific VARX
models in Equation (1). Let vit denote the structural (orthogonal) VARX model innovations
6I use the data from Georgiadis (forthcoming). For some countries real GDP had to be interpolated fromannual to quarterly frequency due to missing data.
7The estimated model is stable and the fraction of instances in which residual serial correlation is detectedis small (see Georgiadis, forthcoming).
ECB Working Paper 1854, September 2015 12
which are related to reduced-form residuals uit of the unit-specific VARX models in Equation
(1) according to
vit = P−1i uit, (3)
where P i is a ki×ki matrix of parameters to be identified and that satisfies Σui= Cov(uit) =
P iP′i. The sign restrictions approach to structural shock identification essentially consists
of constructing impulse response functions for a large number of candidate shocks v(r)it , r =
1, 2, . . . , R which are all orthogonal (and thus labeled structural), and which are associated
with impulse response functions that satisfy the required sign restrictions; finally, one reports
some statistic of this set of impulse response functions (such as the median).
To implement the sign restrictions approach in the GVAR context of this paper, I first
determine the Cholesky decomposition of the covariance matrix Σuiof the vector of reduced-
form residuals uit for each unit i to obtain a lower-triangular matrix P i. I then set up the
global matrix P which has the P i’s on its diagonal blocks and zeros elsewhere. The impulse
responses to the structural shocks vt = (v1t,v2t, . . . ,vNt)′ at horizon h are then given by
ΨhG−10 P , where Ψh is the relevant moving-average coefficient matrix of the global solution
of the GVAR model. The responses to alternative structural shocks can now be obtained by
multiplying the Choleski factors P i by some orthonormal matrix Q(r)i . The set of impulse
responses to alternative structural shocks v(r)t is then given by ΨhG
−10 PQ(r), where Q(r) is
a block-diagonal matrix with blocks Q(r)i .8 I impose sign restrictions on the responses of the
US short-term interest rate and US inflation. In particular, I require that the US short-term
interest rate increases on impact and that US inflation turns negative after four quarters,
reflecting the stickiness of aggregate prices. The responses of US inflation at shorter horizons
8I construct the impulse responses to alternative structural shocks using the QR-decomposition and collect500 impulse responses which satisfy these sign restrictions.
ECB Working Paper 1854, September 2015 13

and all other economies’ variables are left unrestricted.
3 Results
3.1 Spillover Estimates
Figure 1 presents the trough responses to a 100 basis points contractionary US monetary
policy shock on the level of real GDP. The cross-border spillovers to real activity are sub-
stantial: with the exception of most Australasian economies and a few emerging market
economies in Africa and Latin America the spillovers are at least as large as the domestic
impact in the US. The spillovers to Russia, the Baltics, Greece, Ireland, and Luxembourg
are particularly large. In contrast, South East Asian countries and, in particular, China
exhibit rather weak spillovers. Spillovers to non-advanced economies are in general smaller
than those to advanced economies. Even though at the upper end, overall, the magnitudes
of the estimates for the spillovers from US monetary policy are in line with the findings in
the existing literature, see Table 2.9
3.2 The Determinants of Spillovers
In order to shed light on the determinants of the output spillovers from US monetary policy,
I consider cross-sectional regressions of the spillovers depicted in Figure 1 and denoted by si
9di Giovanni and Shambaugh (2008) focus on changes in interest rates in countries’ base country, whichinclude countries which are much smaller than the US, such as Belgium or Portugal; this may lead to outputspillover estimates that are much smaller than those found in this paper. Kim (2001) and, to a lesser extent,Faust and Rogers (2003) as well as Faust et al. (2003) investigate earlier sample periods in which spilloversmight have been smaller due to lower levels of international trade and, in particular, financial integration.
ECB Working Paper 1854, September 2015 14

on time-averages of a set of country characteristics collected in the vector xi:
si = α + xi · β + wi. (4)
Table 3 presents the country characteristics I consider, grouped in the categories of open-
ness/integration, economic structure and vulnerabilities.10,11 I now discuss in more detail
the motivation for considering the country characteristics in xi.
Integration and openness Both financial and trade integration may affect the magnitude
of spillovers from US monetary policy through various channels. On the one hand, an
economy more integrated in global trade may experience larger spillovers to domestic output
as foreign demand—which is dampened in line with US and global demand in response to the
contraction in US monetary policy—accounts for a larger share of aggregate demand of the
domestic economy; in fact, there exists considerable evidence showing that trade integration
is a crucial determinant of business cycle synchronisation and spillovers (see Clark and van
Wincoop, 2001; Baxter and Kouparitsas, 2005). On the other hand, trade integration could
dampen the impact of external shocks, for example by rendering sudden stops and current
account reversals in response to a tightening in US monetary policy less likely (see Rey and
Martin, 2006; Cavallo and Frankel, 2008; Calvo et al., 2008), or by mitigating the effects on
10When data for one of these country characteristics are missing I resort to imputation in order to precludea contraction of the sample. Specifically, for a given country characteristic I impute the missing observationsbased on the fit of a regression of the data for that country characteristics for all countries for which thereare data on the spillover estimates; if the relationship is statistically significant, for the countries with themissing observations I calculate the implied fitted value given their spillover estimates and add error termsdrawn from a normal distribution with mean zero and standard deviation of the regression residuals. If therelationship is not statistically significant, I draw random numbers from a normal distribution with meanand standard deviation taken from the sample of the countries for which data are available. Missing dataare imputed only in few instances: for labor market rigidities for Paraguay, Costa Rica and Albania; andfinancial liberalisation for Croatia, Slovenia and the Slovak Republic.
11In addition to these variables, due to their particularly large spillover estimates I include a dummyfor the Central and Eastern European countries of Russia, Croatia, the Slovak Republic and Slovenia inEquation (4).
ECB Working Paper 1854, September 2015 15
growth once a current account reversal has occurred (see Edwards, 2004, 2007b). Moreover,
to the extent that the expenditure-switching effect associated with a rise in exports to the US
in response to an appreciation of the US dollar outweighs the expenditure-reducing effect
associated with the rise in global interest rates, economies which are more integrated in
global trade should display smaller spillovers. Ultimately, it is an empirical question which
of these effects dominates.
Financial integration and de jure financial openness may give rise to larger swings in capital
flows and spillovers in interest rates. For example, evidence suggests that in particular non-
advanced economies which are more financially integrated and/or which are more financially
open de jure are more likely to experience sudden stops and current account reversals (see
Rey and Martin, 2006; Edwards, 2007a; Calvo et al., 2008; Milesi-Ferretti and Tille, 2011);
also, the adverse consequences once the latter occur are more severe in financially integrated
and open economies (see Edwards, 2004, 2007b).12 Moreover, spillovers in interest rates may
be more pronounced the more strongly an economy is integrated in global financial markets.
Finally, financial integration may be associated with stronger contagion effects (see Edwards,
2007a).
Economic structure To the extent that domestic interest rates rise in line with those
in the US, economies which feature a large share of aggregate output accounted for by in-
dustries which service more interest-rate sensitive demand should display stronger responses
of domestic real activity to US monetary policy (see Georgiadis, 2014). Moreover, to the
12In contrast, Miniane and Rogers (2007) find that the extent of capital controls does not have a significantimpact on the response of domestic interest rates to changes in US interest rates. Similarly, Forbes andWarnock (2012) find that capital controls do not have an impact on the likelihood of capital flow surges, stops,flights and retrenchments. The breadth and the strictness of enforcement of capital controls is notoriouslydifficult to quantify and has given rise to numerous measures, and may to some extent explain the differencesin the results in the literature.
ECB Working Paper 1854, September 2015 16

extent that exports drop in response to a tightening in US monetary policy, economies which
rely more on manufactured goods production should also display larger spillovers as a sig-
nificant share of trade is accounted for by manufactured intermediate goods, in line with
the progressive fragmentation of supply chains across countries (see IMF, 2013c). Finan-
cial development may also affect the magnitude of spillovers from US monetary policy. On
the one hand, economies with deeper financial markets tend to be more leveraged, giving
rise to more pronounced credit channel effects in response to exogenous changes in interest
rates. On the other hand, financial systems in which competitive pressures are stronger
and which are less repressed may be more efficient in reducing informational asymmetries,
thereby mitigating financial accelerator effects. Deeper financial markets may also be better
able to withstand capital outflows in response to a tightening in US monetary policy, and
thereby to preserve domestic lending. Again, it is an empirical question which of these effects
dominates. Finally, the literature on domestic monetary transmission has shown that the
effects of interest rate changes on real activity are amplified by real wage and mitigated by
unemployment rigidities, as they shift the burden of adjustment from prices to quantities
(see Abbritti and Weber, 2010).
Vulnerabilities Flexible exchange rates could help economies to mitigate external shocks
(see Broda, 2001; Edwards and Levy Yeyati, 2005), for example by reducing the likelihood of
current account reversals in response to a tightening of US monetary policy and by mitigating
their impact once they occur (see Edwards, 2004, 2007a). Moreover, a flexible exchange rate
that depreciates in response to a tightening in US monetary policy may also help to mitigate
spillovers by expenditure-switching, in particular by depreciating relative to the US dollar
and currencies which are pegged to the US dollar. Also, if its public debt ratio is low an
ECB Working Paper 1854, September 2015 17

economy may have sufficient fiscal policy space to counter adverse spillovers arising from a
tightening in US monetary policy. Finally, more developed market economies characterised
by fewer rigidities, market imperfections and informational asymmetries as summarised by
measures of institutional quality should be able to adjust more efficiently to shocks, giving
rise to larger spillovers from US monetary policy.
3.2.1 Baseline Results
I adopt a general-to-specific approach to identify the determinants of global spillovers from
US monetary policy. In particular, I allow the effects to differ across advanced and non-
advanced economies.13 The results are reported in Table 4. Specifically, I start with a
relatively large set of country characteristics in each group discussed in the previous subsec-
tion (column (1)). Only few coefficient estimates are statistically significant at conventional
significance levels. Therefore, I narrow down the set of country characteristics by drop-
ping those for which neither the coefficient estimate for advanced nor that for non-advanced
economies has a t-value above unity (so that the adjusted R-squared would increase): fi-
nancial liberalisation. In the resulting model with a reduced set of country characteristics
(column (2)), in order to improve efficiency I test for the equality of coefficients for those
country characteristics whose estimates for advanced and non-advanced economies have the
same sign: trade integration, financial integration, the manufacturing share, financial sys-
tem competition, financial depth, labor market rigidities, and institutional quality. The test
results (not reported) suggest that the hypotheses of equal coefficients across advanced and
13The set of advanced economies includes Australia, Austria, Belgium, Canada, Switzerland, Germany,Denmark, Spain, Finland, France, the UK, Greece, Hong Kong, Ireland, Israel, Italy, Japan, South Korea,the Netherlands, Norway, New Zealand, Portugal, Singapore, the Slovak Republic, Slovenia and Sweden. Idrop Luxembourg from the analysis of the determinants of spillovers due to its extraordinarily large spilloversthat are very likely to be due to special features related to its role as a small international financial center.
ECB Working Paper 1854, September 2015 18

non-advanced economies cannot be rejected. Based on these test results, I replace the dis-
tinct coefficients for advanced and non-advanced economies by pooled coefficients (column
(3)). Finally, I drop those country characteristics whose coefficient estimates have t-values
below unity (column (4)).
The final model features pooled and statistically significant coefficient estimates for trade
and financial integration, the manufacturing share, institutional quality, financial system
competition and depth, and labor market rigidities; statistically significant coefficient esti-
mates for de jure financial openness, the exchange rate regime and public debt relative to
GDP for advanced economies; and for non-advanced economies a statistically significant co-
efficient estimates for de jure financial openness. Thus, economies which are more integrated
in global financial markets and which trade less, which feature more rigid labor markets,
less efficient and shallower financial systems as well as a higher share of aggregate output
accounted for by manufacturing display larger spillovers. Also, economies with stronger in-
stitutions experience larger spillovers; this last result is similar to the findings of Giannone
et al. (2011), who find that countries with better regulatory quality in credit markets expe-
rienced stronger spillovers from the global financial crisis in 2008/09. Moreover, advanced
economies which feature inflexible exchange rates, higher public debt ratios and which are
less financially open de jure display larger spillovers; this latter result may stem from the
likelihood of sudden stops and reversals in advanced economies not being affected by the
extent of capital controls, and from less financially open advanced economies experiencing
fewer safe-haven capital inflows in response to a tightening in US monetary policy. Finally,
non-advanced economies which are more open de jure experience larger spillovers, suggesting
that imposing capital controls could reduce their vulnerability to US monetary policy. The
R-squared of the final model suggests that a large share of the variation in the spillovers
ECB Working Paper 1854, September 2015 19

from US monetary policy can be accounted for by the country characteristics considered.
The next subsection explores to what extent specific country characteristics are relevant in
conjunction with other country characteristics.
3.3 Non-Linearities
I introduce interaction terms in order to investigate the role of non-linearities:
si = δ + x\k,ji · β\k,j + βj · xij + βk · xik + xik · xij · γ + ui, (5)
where x\k,ji is the original set of country characteristics without xik and xij which are involved
in the non-linear hypothesis in question. The hypotheses and the corresponding results are
reported in Table 5.
The results suggest that there are non-linearities in the effects of industry mix, exchange rate
liberalisation, global value chain participation as well as trade and financial integration on
the spillovers from US monetary policy. Specifically, trade integration amplifies spillovers in
non-advanced economies if a large share of their aggregate output is accounted for by man-
ufactured goods and if they participate strongly in global value chains, even though these
results are not estimated very precisely.14 Similarly, in non-advanced economies an industry
mix tilted towards the production of manufactured goods is associated with larger spillovers
the more integrated these economies are in global trade; in contrast, in advanced economies
an industry structure tilted more towards manufacturing does not amplify spillovers if they
14Strong participation in global value chains reflects that a large share of a country’s domestic valueadded component of its exports is used in exports of other countries and suggests that its trade is focused onintermediate goods. The index for participation in global value chains I use is constructed as in Koopmanet al. (2010), using the newly released World Input-Output Database. Missing data for GVC participationhave been imputed based on its bivariate correlation of around 0.8 with trade openness as measured by totaltrade relative to GDP.
ECB Working Paper 1854, September 2015 20

are more integrated in global trade. These results are consistent with the hypothesis that
industry mix affects the magnitude of spillovers from US monetary policy in advanced
economies mostly through spillovers to interest rates and subsequently domestic demand
for domestically-produced interest-rate sensitive goods, while in non-advanced economies
industry mix affects the magnitude of spillovers through the importance of manufactured
goods in their trade.
The results in Table 5 also suggest that the exchange rate regime plays a non-linear role for
the spillovers from US monetary policy. In particular, non-advanced economies experience
larger spillovers the more strongly they are integrated in global trade if they also feature an
inflexible exchange rate regime. An explanation for this finding could be that an inflexible
exchange rate appreciates in line with the US dollar in response to a tightening in US mone-
tary policy—at least to the extent that the US dollar is the base rate—and thereby worsens
the trade balance. This explanation is corroborated by the result that liberalising the ex-
change rate is associated with larger spillovers from US monetary policy when non-advanced
economies do not trade much: In this case, a depreciation in response to a tightening in
US monetary policy does not provide a relief because the contribution of net exports to
aggregate demand is small. Moreover, the results in Table 5 suggest that in non-advanced
economies financial integration is associated with larger spillovers if the exchange rate is
inflexible. This result is consistent with the hypothesis that capital outflows in response to a
tightening of US monetary policy are mitigated by a depreciation of the domestic currency.
Similar to the case with trade integration, liberalising the exchange rate mitigates spillovers
if non-advanced economies are financially integrated and thereby benefit from a depreciation
in response to a US monetary policy shock as capital outflows are dampened.
ECB Working Paper 1854, September 2015 21

3.4 Relationship to Spillovers from Unconventional US Monetary
Policy
A natural question is to what extent the estimates of the spillovers from conventional US
monetary policy from this paper allow us to draw inferences about spillovers from exit from
unconventional monetary policy. Unfortunately, the effects of exit may be hard to capture in
a linear, quarterly GVAR model that employs the short-term interest rate as a measure for
the monetary policy stance. Therefore, I confine the analysis to a cmparison of the spillovers
from conventional and unconventional US monetary policy. Specifically, I resort to a stylised
event-study approach by comparing countries’ growth forecast revisions in spring 2013 when
Federal Reserve chairman Bernanke upset markets by discussing the start of tapering off
quantitative easing with the global spillovers from conventional monetary policy estimated
in this paper. To the extent that market participants correctly anticipated how exit from
unconventional monetary policies would transmit to global growth, forecast revisions may be
a good proxy for the actual spillovers. The top panel in Figure 2 plots the real GDP spillovers
from conventional contractionary US monetary policy as estimated by the GVAR against the
revisions in real GDP growth forecasts for 2014 between April and May 2013 obtained from
Consensus Economics. The results suggest that economies which display larger spillover
estimates from conventional US monetary policy also displayed larger downward revisions
of their GDP growth projections. This result does not seem to be a statistical artifact: The
bottom panel in Figure 2 shows that such a positive and statistically significant correlation
between the growth forecast revisions and the spillovers from US monetary policy exists
only for the revisions around the time of the first tapering discussions. These results suggest
that the transmission channels of global spillovers from conventional and unconventional US
ECB Working Paper 1854, September 2015 22

monetary policy might be similar. Of course, this evidence can only be suggestive and needs
to be bolstered by more research (see, for example, Chen et al., 2012).
4 Robustness
4.1 Alternative Model Specification
In order to preclude that the result of large global spillovers from US monetary policy
shocks are an artifact stemming from the treatment of the US as a dominant unit, I consider
a specification of the GVAR model in which the US is entered symmetrically to all other
economies. Second, in order to preclude that the finding of large spillovers from US mon-
etary policy stems from the sample including the financial crisis and the Federal Reserve
hitting the zero lower bound, I include dummy variables for 2008Q3, 2008Q4 and 2009Q1
for all economies/units as well as—in addition—for 2009Q2, 2009Q3 and 2009Q4 for the US.
Moreover, I use the shadow federal funds rates of Wu and Xia (2014) as well as Lombardi and
Zhu (2014) which are not constrained by the zero lower bound as an alternative measure of
US monetary policy. Third, I determine whether the results are robust to the sovereign debt
crisis by extending the sample period to 2012Q1; this robustness check also addresses the
possibility that the estimation is compromised by the short sample period in the baseline.
Fourth, I include the VIX in order to ensure that the spillovers are driven by a monetary
policy rather than a shock to risk aversion and uncertainty. The results displayed in the
top panel of Figure 3 suggest that the spillover estimates obtained from these alternative
specifications are very similar to those from the baseline specification.
ECB Working Paper 1854, September 2015 23

While the correlation between the spillover estimates from the baseline and these alternative
specifications are high they are not perfect, begging the question which of these specifications
to consider as the reference point. In order to ensure that the results for the determinants
of the spillovers from US monetary policy obtained from Equation (5) in the baseline chosen
in this paper are not unique to this specification, I run the following robustness check.
Denote by s∗ the true spillovers. Moreover, denote by s(j) the spillover estimates from
alternative specification j, with j ∈ {w/o dominant unit,FC dummies, ...,VIX} described
above. Assume that each specification j of the total S different alternative specifications
involves an error h(j) due to mis-specification so that s(j) = s∗ + h(j). Then,
s∗ = xβ + u, (6)
s(j) = xβ + u+ h(j), (7)
where u captures the effects of omitted country characteristics on the spillovers which are
uncorrelated with those in x. Next, denote by s the vector which stacks all s(j)
s = (ι′ ⊗ x)β + ν, ν = (ι′ ⊗ u) + h, (8)
where ι is a 1 × S vector of ones. Equation (8) can then be estimated by GLS to account
for correlation of ν within alternative specifications and countries. Equation (8) can be
interpreted as a regression of repeated measurements of the spillovers from US monetary
policy on countries’ characteristics that has improved efficiency relative to Equation (5).
The results for the alternative specifications discussed above are reported in the second
column of Table 6 and suggest that the results from the baseline specification are mostly
ECB Working Paper 1854, September 2015 24

robust. An exception is the result for financial depth.
4.2 Alternative Identification of US Monetary Policy Shock
In order to ensure that the drop in inflation and the increase in short-term interest rates is
driven by a monetary policy rather than a money demand shock, I impose an additional sign
restriction on the response of money by requiring that M1 drops in response to a tightening
in monetary policy. Moreover, to the strong cross-country correlation of interest rates,
imposing the restriction that domestic interest rates rise and inflation drops might fail to
identify a monetary policy shock specific to the US; rather, the identified shock may reflect
a convolution of foreign monetary policy shocks. Therefore, in a second robustness check in
addition to the restriction on the response of US short-term interest rates and inflation I also
restrict the US nominal effective exchange rate to appreciate in response to a US monetary
policy shock (see Eichenbaum and Evans, 1995; Kim and Roubini, 2000; Kim, 2001; Nobili
and Neri, 2006; Miniane and Rogers, 2007; Binder et al., 2010).
In addition, I consider monetary policy shocks that have been identified outside the model.
First, I use the monetary policy shocks from the structural VAR model of Sims and Zha
(2006) for the US economy based on non-recursive contemporaneous restrictions implied by a
theoretical model. While the contemporaneous restrictions imposed by Sims and Zha (2006)
are underpinned by a theoretical model, their VAR only incorporates a limited number of
variables which do not perfectly match the variables from the theoretical model. Therefore, as
a second alternative, I consider the monetary policy shocks constructed by Romer and Romer
(2004). Under their approach, they first determine the intended change of the federal funds
rate target on the occasion of FOMC meetings. From these intended changes in the federal
ECB Working Paper 1854, September 2015 25

funds rate target they then remove those parts that are a systematic response to current and
expected economic developments captured in internal Fed briefings, other Fed publications
and readings of minutes. While the monetary policy shocks of Romer and Romer (2004) are
constructed outside of a VAR and thus do not require that the included endogenous variables
are sufficient to describe the economy’s dynamics, their approach involves some subjective
judgement and might fail to consider all information concerning current and future economic
developments that was available to FOMC members. Therefore, as a third alternative I use
the monetary policy shocks constructed by Bernanke and Kuttner (2005) which are based on
the difference between last periods federal funds futures rate and the current period’s average
federal funds rate target, purged from the effects of economic news. Bernanke and Kuttner
(2005) focus only on the one-month future, which might be subject to more volatile risk
premia and be less liquid than longer maturities. Therefore, as a fourth alternative I resort
to the monetary policy shocks constructed by Barakchian and Crowe (2010); in contrast
to Bernanke and Kuttner (2005), Barakchian and Crowe (2010) use federal funds futures
of various maturities and extract the information about the monetary policy shocks from
these maturities using a factor model. The advantage of the approaches to the identification
of monetary policy shocks based on federal funds futures is that they do not require to
model the Fed’s reaction function and to make an assumption about the information set
of policymakers on the time of a rate decision. However, a disadvantage is that when the
approaches to the identification of monetary policy shocks by Bernanke and Kuttner (2005)
and Barakchian and Crowe (2010) are used at lower than daily frequencies they cannot
perfectly differentiate between random movements in monetary policy and economic news
that trigger endogenous policy responses. I enter each series of alternative monetary policy
shocks as an exogenous variable to the GVAR model one at a time and determine dynamic
ECB Working Paper 1854, September 2015 26

multipliers.
The middle panel in Figure Figure 3 suggest that the spillovers arising in response to these
alternative monetary policy shocks are closely related to those obtained from the baseline
specification. Similarly, the regression results for the determinants of the spillovers reported
in column (3) of Table 6 suggest that the results from the baseline are largely robust to
alternative identifications of US monetary policy shocks. Exceptions are de jure financial
openness and public debt in advanced economies.
4.3 Levels GVAR
To the extent that the GVAR model in levels involves non-stationary and co-integrated
variables, the model in first differences might be mis-specified and give rise to inconsistent
estimates. In order to determine whether such mis-specification might have an effect on
the results of this paper, I estimate the model in levels. More specifically, I determine the
responses of real GDP to a US monetary policy shock as represented by the time series
constructed by Romer and Romer (2004) in order to avoid imposing sign restrictions on a
non-stationary model.15 The bottom panel in Figure 3 suggests that the spillover estimates
obtained from the GVAR in levels based on the Romer and Romer (2004) monetary policy
shocks are similar to those from the baseline GVAR in first differences based on sign restric-
tions; also, the spillover estimates obtained from the GVAR in levels based on the Romer
and Romer (2004) monetary policy shocks are similar to those from the baseline GVAR in
first differences based on the Romer and Romer (2004) monetary policy shocks. Moreover,
15The largest eigenvalue of the companion matrix of the global solution of the levels GVAR model isslightly above unity. As is common in the GVAR setting, this gives rise to impulse responses which explodefaster than in single-country VAR models. Relying on sign restrictions in this setting is likely to give riseto implausible spillovers estimates. Because the dynamics of the spillovers are somewhat different, for thisrobustness check I consider the trough values of the spillovers rather than the spillover after seven quarters.
ECB Working Paper 1854, September 2015 27

columns (2) and (3) in Table 7 suggest that the results for the determinants of the spillovers
are similar when they are estimated in a levels GVAR.
4.4 Alternative Timing for Data in Link Matrices
The bottom panel in Figure 3 and columns (4) and (5) of Table 7 show that the spillover
estimates are hardly changed when bilateral trade and GDP data for 1999 and 2009 rather
than averages over the time period from 1999 to 2009 are used to set up the link matrices
that include the weights used to construct the foreign variables in the GVAR model.
4.5 Additional Explanatory Variables
Columns (6) to (8) of Table 7 report the results for the determinants of the spillovers from
regressions in which the bilateral distance to the US, bilateral trade with the US and bilat-
eral financial integration with the US are included as additional explanatory variables.16 In
all cases do the baseline results remain unchanged. Interestingly, the coefficient estimates
for bilateral financial and trade integration with the US are not statistically significant.
For bilateral trade integration, this suggests that the spillovers arising through expenditure-
switching and expenditure-reducing effects stemming directly from the US offset each other.
For bilateral financial integration, the lack of statistical significance suggests that the bi-
lateral spillovers which operate through financial channels are considerably less important
than a country’s integration with global markets. Finally, Table 7 also reports the results
16In each case, the null that the coefficient is the same for advanced and non-advanced economies cannotbe rejected. Distance to the US is taken from the CEPII database, bilateral trade integration is proxied bythe sum of exports to and imports from the US relative to GDP taken from the IMF Direction of TradeStatistics, and financial integration by the sum of the stocks of portfolio assets in the US and domesticportfolio liabilities held by US residents relative to GDP.
ECB Working Paper 1854, September 2015 28

from regressions in which the spillovers after seven quarters as the dependent variable are
replaced by the trough spillovers. Again, the results are mostly unchanged.
5 Conclusion
The finding that US monetary policy has sizable spillovers to the rest of the world begs
the question whether global welfare could be improved if these spillovers were internalised
by US policymakers, in particular given the US dollar’s role as the global reserve currency.
At least to the extent that the benefits depend on the magnitude of spillovers, the results
of this paper raise the question whether it might be worthwhile to strengthen international
coordination of monetary policies and global safety nets (see Ostry and Ghosh, 2013; Rajan,
2013; Jeanne, 2014). Future research should examine possible asymmetries in the spillovers
across conventional and unconventional as well as across expansionary and contractionary
monetary policy. Finally, the finding that the global spillovers from US monetary policy are
very large is in line with the hypothesis of a global financial cycle driven by financial condi-
tions in the center economy, and therefore begs the question of whether domestic monetary
policy in non-US economies has been undermined by financial globalisation (Shin, 2012; Rey,
2013; Georgiadis and Mehl, 2014).
ECB Working Paper 1854, September 2015 29

References
Abbritti, M., Weber, S., 2010. Labor Market Institutions and the Business Cycle: Unem-ployment Rigidities Vs. Real Wage Rigidities. ECB Working Paper 1183.
Abiad, A., Detragiache, E., Tressel, T., 2010. l. IMF Staff Papers 57 (2), 281–302.
Barakchian, M., Crowe, C., 2010. Monetary Policy Matters: New Evidence Based on a NewShock Measure. IMF Working Papers 10/230.
Baxter, M., Kouparitsas, M., 2005. Determinants of Business Cycle Comovement: A RobustAnalysis. Journal of Monetary Economics 52 (1), 113–157.
Bekaert, G., Hoerova, M., Lo Duca, M., 2013. Risk, Uncertainty and Monetary Policy.Journal of Monetary Economics 60 (7), 771–788.
Bernanke, B., Kuttner, K., 2005. What Explains the Stock Market’s Reaction to FederalReserve Policy? Journal of Finance 60 (3), 1221–1257.
Binder, M., Chen, Q., Zhang, X., 2010. On the Effects of Monetary Policy Shocks on Ex-change Rates. Cesifo working paper.
Binder, M., Georgiadis, G., Sharma, S., 2013. Growth Effects of International FinancialIntegration. mimeo, Goethe University Frankfurt.
Bluedorn, J., Bowdler, C., 2011. The Open Economy Consequences of U.S. Monetary Policy.Journal of International Money and Finance 30 (2), 309–336.
Botero, J., Djankov, S., Porta, R., Lopez-De-Silanes, F. C., 2004. The Regulation of Labor.The Quarterly Journal of Economics 119 (4), 1339–1382.
Broda, C., 2001. Coping with Terms-of-Trade Shocks: Pegs versus Floats. American Eco-nomic Review 91 (2), 376–380.
Calvo, G., Izquierdo, A., Mejıa, L.-F., 2008. Systemic Sudden Stops: The Relevance OfBalance-Sheet Effects And Financial Integration. NBER Working Paper (14026).
Canova, F., 2005. The Transmission of US Shocks to Latin America. Journal of AppliedEconometrics 20 (2), 229–251.
Canova, F., Ciccarelli, M., 2009. Estimating Multicountry VAR Models. International Eco-nomic Review 50 (3), 929–959.
Carlino, G., DeFina, R., 1998. The Differential Regional Effects of Monetary Policy. Reviewof Economics and Statistics 80 (4), 527–587.
Cashin, P., Mohaddes, K., Raissi, M., Raissi, M., 2012. The Differential Effects of Oil De-mand and Supply Shocks on the Global Economy. IMF Working Paper 03/34.
ECB Working Paper 1854, September 2015 30

Cavallo, E., Frankel, J., 2008. Does Openness to Trade Make Countries More Vulnerable toSudden Stops, or Less? Using Gravity to Establish Causality. Journal of InternationalMoney and Finance 27 (8), 1430–1452.
Cecchetti, S., 1999. Legal Structure, Financial Structure, and the Monetary Policy Trans-mission Mechanism. Economic Policy Review (July), 9–28.
Chen, Q., Filardo, A., He, D., Zhu, F., 2012. International Spillovers of Central Bank Bal-ance Sheet Policies. In: for International Settlements, B. (Ed.), Are Central Bank BalanceSheets in Asia Too Large? Vol. 66 of BIS Papers Chapters. Bank for International Settle-ments, pp. 220–264.
Chinn, M., Ito, H., 2003. A New Measure of Capital Account Openness. Journal of Compar-ative Policy Analysis 10 (3), 309–322.
Chudik, A., Fratzscher, M., 2012. Liquidity, Risk and the Global Transmission of the 2007-08Financial Crisis and the 2010-2011 Sovereign Debt Crisis. ECB Working Paper 1416.
Chudik, A., Pesaran, M., 2014. Theory and Practice of GVAR Modeling. Globalization andMonetary Policy Institute Working Paper 180, Federal Reserve Bank of Dallas.
Chudik, A., Smith, V., 2013. The GVAR Approach and the Dominance of the U.S. Economy.Globalization and Monetary Policy Institute Working Paper 136, Federal Reserve Bankof Dallas.
Cihak, M., Demirguc-Kunt, A., Feyen, E., Levine, R., 2013. Financial Development in 205Economies, 1960 to 2010. Journal of Financial Perspectives 1 (2), 17–36.
Clark, T., van Wincoop, E., 2001. Borders and Business Cycles. Journal of InternationalEconomics 55 (1), 59–85.
Craine, R., Martin, V., 2008. International Monetary Policy Surprise Spillovers. Journal ofInternational Economics 75 (1), 180–196.
Dees, S., di Mauro, F., Pesaran, M., Smith, L., 2007. Exploring the International Linkagesof the Euro Area: A Global VAR Analysis. Journal of Applied Econometrics 22 (7), 1–38.
Dees, S., Pesaran, M., Smith, V., Smith, R. P., Sep. 2010. Supply, Demand and MonetaryPolicy Shocks in a Multi-Country New Keynesian Model. Working Paper Series 1239,European Central Bank.
Dees, S., Saint-Guilhem, A., 2011. The Role of the United States in the Global Economyand its Evolution Over Time. Empirical Economics 41 (3), 573–591.
di Giovanni, J., Shambaugh, J., 2008. The Impact of Foreign Interest Rates on the Economy:The Role of the Exchange Rate Regime. Journal of International Economics 74 (2), 341–361.
Edwards, S., 2004. Financial Openness, Sudden Stops, and Current-Account Reversals.American Economic Review 94 (2), 59–64.
Edwards, S., 2007a. Capital Controls, Capital Flow Contractions, and Macroeconomic Vul-nerability. Journal of International Money and Finance 26 (5), 814–840.
Edwards, S., 2007b. Capital Controls, Sudden Stops, and Current Account Reversals. In:Capital Controls and Capital Flows in Emerging Economies: Policies, Practices and Con-sequences. NBER Chapters. National Bureau of Economic Research, pp. 73–120.
ECB Working Paper 1854, September 2015 31

Edwards, S., Levy Yeyati, E., 2005. Flexible Exchange Rates as Shock Absorbers. EuropeanEconomic Review 49 (8), 2079–2105.
Ehrmann, M., 2000. Comparing Monetary Policy Transmission across European Countries.Review of World Economics 136 (1), 58–83.
Ehrmann, M., Fratzscher, M., 2009. Global Financial Transmission of Monetary PolicyShocks. Oxford Bulletin of Economics and Statistics 71 (6), 739–759.
Eichenbaum, M., Evans, C., 1995. Some Empirical Evidence on the Effects of Shocks toMonetary Policy on Exchange Rates. The Quarterly Journal of Economics 110 (4), 975–1009.
Eickmeier, S., Ng, T., 2011. How Do Credit Supply Shocks Propagate Internationally? AGVAR Approach. CEPR Discussion Paper 8720.
Faust, J., Rogers, J., 2003. Monetary Policy’s Role in Exchange Eate Behavior. Journal ofMonetary Economics 50 (7), 1403–1424.
Faust, J., Rogers, J., Swanson, E., Wright, J., 2003. Identifying the Effects of MonetaryPolicy Shocks on Exchange Rates Using High Frequency Data. Journal of the EuropeanEconomic Association 1 (5), 1031–1057.
Forbes, K., Warnock, F., 2012. Capital Flow Waves: Surges, Stops, Flight, and Retrench-ment. Journal of International Economics 88 (2), 235–251.
Frankel, J., Roubini, N., Dec. 2001. The Role of Industrial Country Policies in EmergingMarket Crises. NBER Working Papers 8634, National Bureau of Economic Research.
Frankel, J., Schmukler, S., Serven, L., 2004. Global Transmission of Interest Rates: MonetaryIndependence and Currency Regime. Journal of International Money and Finance 23 (5),701–733.
Fratzscher, M., Lo Duca, M., Straub, R., 2013. On the International Spillovers of US Quan-titative Easing. ECB Working Paper 1557.
Fukuda, Y., Kimura, Y., Sudo, N., Ugai, H., 2013. Cross-Country Transmission Effect of theU.S. Monetary Shock under Global Integration. Bank of Japan Working Paper.
Georgiadis, G., 2014. Towards an Explanation of Cross-Country Asymmetries in MonetaryTransmission. Journal of Macroeconomics 39, 66–84.
Georgiadis, G., forthcoming. Examining Asymmetries in the Transmission of Monetary Pol-icy in the Euro Area: Evidence from a Mixed Cross-Section Global VAR Model. EuropeanEconomic Review.
Georgiadis, G., Mehl, A., 2014. Trilemma, not Dilemma: Financial Globalisation and Mon-etary Policy Effectiveness. mimeo.
Giannone, D., Lenza, M., Reichlin, L., 2011. Market Freedom and the Global Recession.IMF Economic Review 59 (1), 111–135.
Gurkaynak, R., Wright, J., 2011. Market Perceptions of International Monetary Policy De-pendence. mimeo.
Hausman, J., Wongswan, J., 2011. Global Asset Prices and FOMC Announcements. Journalof International Money and Finance 30 (3), 547–571.
ECB Working Paper 1854, September 2015 32

Ilzetzki, E., Jin, K., 2013. The Puzzling Change in the International Transmisison of U.S.Macroeconomic Policy Shocks. mimeo, LSE.
Ilzetzki, E., Reinhart, C., Rogoff, K., 2010. Exchange Rate Arrangements Entering the 21stCentury: Which Anchor Will Hold? mimeo, LSE.
IMF, 2012. The Liberalization and Management of Capital Flows: An Institutional View.IMF.
IMF, 2013a. 2013 Spillover Report.
IMF, 2013b. Dancing Together? Spillovers, Common Shocks, and the Role of Financial andTrade Linkages. In: World Economic Outlook, Chpt. 3.
IMF, 2013c. Trade Interconnectedness: The World with Global Value Chains. IMF.
Jeanne, O., 2014. Macroprudential Policies in a Global Perspective. IMES Discussion PaperSeries 14-E-01, Institute for Monetary and Economic Studies, Bank of Japan.
Kim, S., 2001. International Transmission of U.S. Monetary Policy Shocks: Evidence fromVAR’s. Journal of Monetary Economics 48 (2), 339–372.
Kim, S., Roubini, N., 2000. Exchange Rate Anomalies in the Industrial Countries: A Solutionwith a Structural VAR Approach. Journal of Monetary Economics 45 (3), 561–586.
Koopman, R., Powers, W., Wang, Z., Wei, S.-J., 2010. Give Credit Where Credit Is Due:Tracing Value Added in Global Production Chains. NBER Working Paper 16426.
Kose, A., Prasad, E., Rogoff, K., Wei, S.-J., 2009. Financial Globalization: A Reappraisal.IMF Staff Papers 56 (1), 8–62.
Lane, P. R., Milesi-Ferretti, G. M., 2007. The External Wealth of Nations Mark II: Re-vised and Extended Estimates of Foreign Assets and Liabilities, 1970-2004. Journal ofInternational Economics 73 (2), 223–250.
Lombardi, M., Zhu, F., 2014. A Shadow Policy Rate to Calibrate US Monetary Policy atthe Zero Lower Bound. BIS Working Papers 452, Bank for International Settlements.
Mackowiak, B., 2007. External Shocks, US Monetary Policy and Macroeconomic Fluctua-tions in Emerging Markets. Journal of Monetary Economics 54 (8), 2512–2520.
Milesi-Ferretti, G.-M., Tille, C., 2011. The Great Retrenchment: International Capital FlowsDuring the Global Financial Crisis. Economic Policy 26 (66), 285–342.
Miniane, J., Rogers, J., 2007. Capital Controls and the International Transmission of U.S.Money Shocks. Journal of Money, Credit and Banking 39 (5), 1003–1035.
Moore, J., Nam, S., Suh, M., Tepper, A., 2013. Estimating the Impacts of U.S. LSAPs onEmerging Market Economies’ Local Currency Bond Markets. Staff Reports 595, FederalReserve Bank of New York.
Neely, C., 2010. The Large Scale Asset Purchases Had Large International Effects. WorkingPapers 2010-018, Federal Reserve Bank of St. Louis.
Nobili, A., Neri, S., 2006. The Transmission of Monetary Policy Shocks from the US to theEuro Area. Temi di discussione, Bank of Italy.
ECB Working Paper 1854, September 2015 33

Ostry, J., Ghosh, A., 2013. Obstacles to International Policy Coordination, and How toOvercome Them. IMF Staff Discussion Note 11.
Pesaran, M., Chudik, A., 2010. Econometric Analysis of High-Dimensional VARs Featuringa Dominant Unit. ECB Working Paper 1194.
Pesaran, M., Schuermann, T., Weiner, S. M., 2004. Modeling Regional InterdependenciesUsing a Global Error-Correcting Macroeconometric Model. Journal of Business and Eco-nomic Statistics 22 (2), 129–162.
Philippon, T., Zettelmeyer, J., Borensztein, E., 2001. Monetary Independence in EmergingMarkets: Does the Exchange Rate Regime Make a Difference? IMF Working Papers 01/1.
Rajan, R., 2013. A Step in the Dark: Unconventional Monetary Policy After the Crisis.Speech at The Andrew Crockett Memorial Lecture, BIS Basel.
Rebucci, A., Cesa-Bianchi, A., Pesaran, M., Xu, T., 2012. China’s Emergence in the WorldEconomy and Business Cycles in Latin America. Journal of LACEA Economia.
Reinhart, C., Reinhart, V., 2002. What Hurts Emerging Markets Most? G3 Exchange Rateor Interest Rate Volatility? In: Preventing Currency Crises in Emerging Markets. NBERChapters. National Bureau of Economic Research, Inc, pp. 133–170.
Rey, H., 2013. Dilemma not Trilemma: The Global Cycle and Monetary Policy Indepen-dence. Proceedings - Economic Policy Symposium - Jackson Hole, 1–2.
Rey, H., Martin, P., 2006. Globalization and Emerging Markets: With or Without Crash?American Economic Review 96 (5), 1631–1651.
Rogers, J., Scotti, C., Wright, J., 2014. Evaluating Asset-Market Effects of UnconventionalMonetary Policy: A Cross-Country Comparison. International Finance Discussion Papers1101, Board of Governors of the Federal Reserve System.
Romer, C., Romer, D., 2004. A New Measure of Monetary Shocks: Derivation and Implica-tions. American Economic Review 94 (4), 1055–1084.
Shambaugh, J., 2004. The Effect of Fixed Exchange Rates on Monetary Policy. The Quar-terly Journal of Economics 119 (1), 300–351.
Shin, H. S., 2012. Global Banking Glut and Loan Risk Premium. IMF Economic Review60 (2), 155–192.
Sims, C., Zha, T., 2006. Does Monetary Policy Generate Recessions? Macroeconomic Dy-namics 10 (02), 231–272.
Wongswan, J., 2009. The Response of Global Equity Indexes to U.S. Monetary Policy An-nouncements. Journal of International Money and Finance 28 (2), 344–365.
Wu, J., Xia, F., 2014. Measuring the Macroeconomic Impact of Monetary Policy at the ZeroLower Bound. mimeo.
ECB Working Paper 1854, September 2015 34

A Tables
Table 1: Country Groups
Region Countries
Indiv. coun-tries/units
ALB, AUS, AUT, BAL, BEL, BGR, BOL, BRA, CAN,CHE, CHL, CHN, COL, CRI, CZE, DEU, DNK, ECB,EGY, ESP, FIN, FRA, GBR, GRC, HKG, HRV, HUN, IDN,IND, IRL, ISR, ITA, JOR, JPN, KOR, LUX, MAR, MEX,MYS, NLD, NOR, NZL, OIL, OPC, PER, PHL, POL, PRT,PRY, ROU, RUS, SGP, SVK, SVN, SWE, THA, TUR, USA,ZAF
Baltics (BAL) EST, LVA, LTU
Oil exporting coun-tries (OPC)
VEN, ECU, SAU
Note: The table reports the countries included and details the composition of the country groups.
Table 2: Overview of the Existing Evidence on the Magnitude of Spillovers from USMonetaryPolicy Shocks
Paper For. rel. to US response Countries Remark
Kim (2001) 0.25 to 0.5 G6 ”The increase in output in the non-US G6 countries is about one fourthto one half of the increase in US output” (p. 353)
Faust and Rogers (2003) 0.5 to 1 DEU and GBR Figure 2
Faust et al. (2003) 0.5 to 0.75 DEU and GBR Figures 1, 2, 3 and 4
Nobili and Neri (2006) 0.75 Euro Area
Mackowiak (2007) >1 KOR, MYS, PHL,THA, HKG, SGP,CHL, MEX
”The price level and real output in a typical emerging market respondto US monetary policy shocks by more than the price level and realoutput in the US itself” (p. 2512)
di Giovanni and Sham-baugh (2008)
0.1 to 0.2 160 countries Results refer to responses of output in countries with pegged exchangerates to changes in base country interest rates (p. 347). Base countriesinclude AUS, BEL, FRA, DEU, IND, MYS, PRT, USA, GBR, ZAF
Dees et al. (2010) ≈1 25 AEs and non-AEs ”The effects on output in other countries are [on average] similar tothose in the US. (...) The US variables tend to return to their steadystate values relatively quickly compared to other countries” (p.29 andFigure 1c)
Bluedorn and Bowdler(2011)
0.5 to 1 DEU, CAN, GBR,JPN, ITA, FRA
Figures 5 and 6
Ilzetzki and Jin (2013) ≈1 not specified Foreign impulse response ”is similar to (but slightly smaller than)”(p.11) in the US. Spillover estimates refer to sample for 1973 to 1990
IMF (2013b) 0.25 to 0.5 Asia, Europe andLatin America
Figure 3.12
Note: Other papers on spillovers from US monetary policy are not included in the table as they do not report the domestic impact in the US and/ordo not allow to compare the spillovers to the domestic impact in the US, see Kim and Roubini (2000), Canova (2005), and Fukuda et al. (2013).
ECB Working Paper 1854, September 2015 35
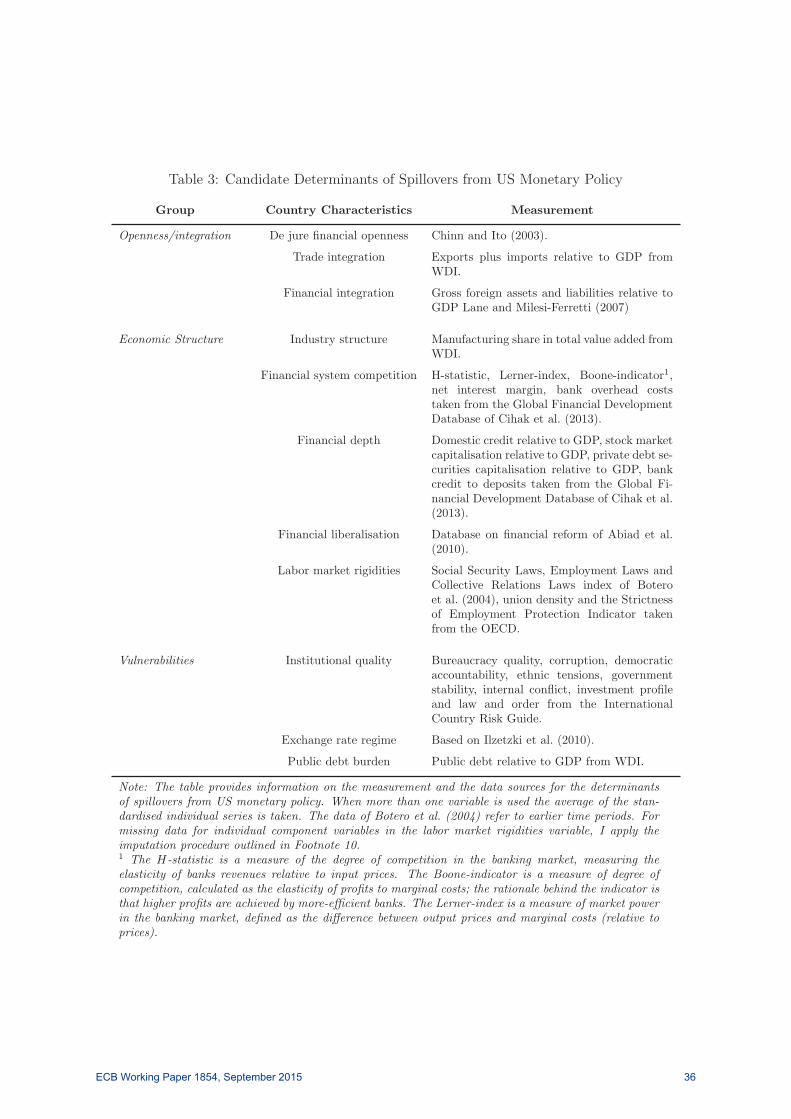
Table 3: Candidate Determinants of Spillovers from US Monetary Policy
Group Country Characteristics Measurement
Openness/integration De jure financial openness Chinn and Ito (2003).
Trade integration Exports plus imports relative to GDP fromWDI.
Financial integration Gross foreign assets and liabilities relative toGDP Lane and Milesi-Ferretti (2007)
Economic Structure Industry structure Manufacturing share in total value added fromWDI.
Financial system competition H-statistic, Lerner-index, Boone-indicator1,net interest margin, bank overhead coststaken from the Global Financial DevelopmentDatabase of Cihak et al. (2013).
Financial depth Domestic credit relative to GDP, stock marketcapitalisation relative to GDP, private debt se-curities capitalisation relative to GDP, bankcredit to deposits taken from the Global Fi-nancial Development Database of Cihak et al.(2013).
Financial liberalisation Database on financial reform of Abiad et al.(2010).
Labor market rigidities Social Security Laws, Employment Laws andCollective Relations Laws index of Boteroet al. (2004), union density and the Strictnessof Employment Protection Indicator takenfrom the OECD.
Vulnerabilities Institutional quality Bureaucracy quality, corruption, democraticaccountability, ethnic tensions, governmentstability, internal conflict, investment profileand law and order from the InternationalCountry Risk Guide.
Exchange rate regime Based on Ilzetzki et al. (2010).
Public debt burden Public debt relative to GDP from WDI.
Note: The table provides information on the measurement and the data sources for the determinantsof spillovers from US monetary policy. When more than one variable is used the average of the stan-dardised individual series is taken. The data of Botero et al. (2004) refer to earlier time periods. Formissing data for individual component variables in the labor market rigidities variable, I apply theimputation procedure outlined in Footnote 10.1 The H-statistic is a measure of the degree of competition in the banking market, measuring theelasticity of banks revenues relative to input prices. The Boone-indicator is a measure of degree ofcompetition, calculated as the elasticity of profits to marginal costs; the rationale behind the indicator isthat higher profits are achieved by more-efficient banks. The Lerner-index is a measure of market powerin the banking market, defined as the difference between output prices and marginal costs (relative toprices).
ECB Working Paper 1854, September 2015 36

Table 4: Determinants of Spillovers from US Monetary Policy - Baseline Results
(1) (2) (3) (4)
AE fin. openness 0.16∗∗ 0.17∗∗ 0.13∗ 0.13∗
Non-AE fin. openness -0.02 -0.03 -0.06∗ -0.06∗∗
AE trade integration (trade to GDP) 0.29∗∗∗ 0.28∗∗∗
Non-AE trade integration (trade to GDP) 0.08 0.06
AE financial integration (GFA to GDP) -0.18∗∗∗ -0.18∗∗∗
Non-AE financial integration (GFA to GDP) -0.19+ -0.20+
AE FX regime 0.04∗∗∗ 0.04∗∗∗ 0.03∗∗∗ 0.03∗∗∗
Non-AE FX regime -0.00 -0.01 -0.01
AE manufacturing share -0.78∗ -0.78∗
Non-AE manufacturing share -0.79+ -0.62
AE financial system competition 0.21∗∗ 0.21∗∗
Non-AE financial system competition 0.06 0.08
AE financial system depth 0.03 0.03
Non-AE financial system depth 0.15+ 0.15+
AE financial liberalisation 0.21
Non-AE financial liberalisation -0.23
AE labor market rigidities -0.11∗∗ -0.11∗∗
Non-AE labor market rigidities -0.10+ -0.10+
AE institutional quality -0.02∗∗∗ -0.02∗∗∗
Non-AE institutional quality -0.01+ -0.01∗
AE debt to GDP -0.12+ -0.14∗ -0.14∗ -0.13∗
Non-AE debt to GDP 0.38+ 0.37+ 0.38+ 0.40+
AE dummy -0.11 0.21 -0.16 -0.09
BAL, HRV, RUS, SVK, SVN dummy -0.69∗∗∗ -0.71∗∗∗ -0.70∗∗∗ -0.69∗∗∗
Trade integration 0.18∗∗∗ 0.19∗∗
Financial integration (GFA to GDP) -0.15∗∗∗ -0.15∗∗∗
Manufacturing share -0.91∗∗ -0.94∗∗
Financial system competition 0.13∗ 0.12∗
Financial depth 0.06+ 0.08∗
Labor market rigidities -0.09∗ -0.09∗
Institutional quality -0.02∗∗∗ -0.02∗∗∗
Constant 0.64+ 0.54+ 0.82∗∗∗ 0.75∗∗∗
Observations 55 55 55 55Adjusted R2 0.70 0.71 0.72 0.72
Robust standard errors.+ p < 0.325, ∗ p < 0.1, ∗∗ p < 0.05, ∗∗∗ p < 0.01
ECB Working Paper 1854, September 2015 37
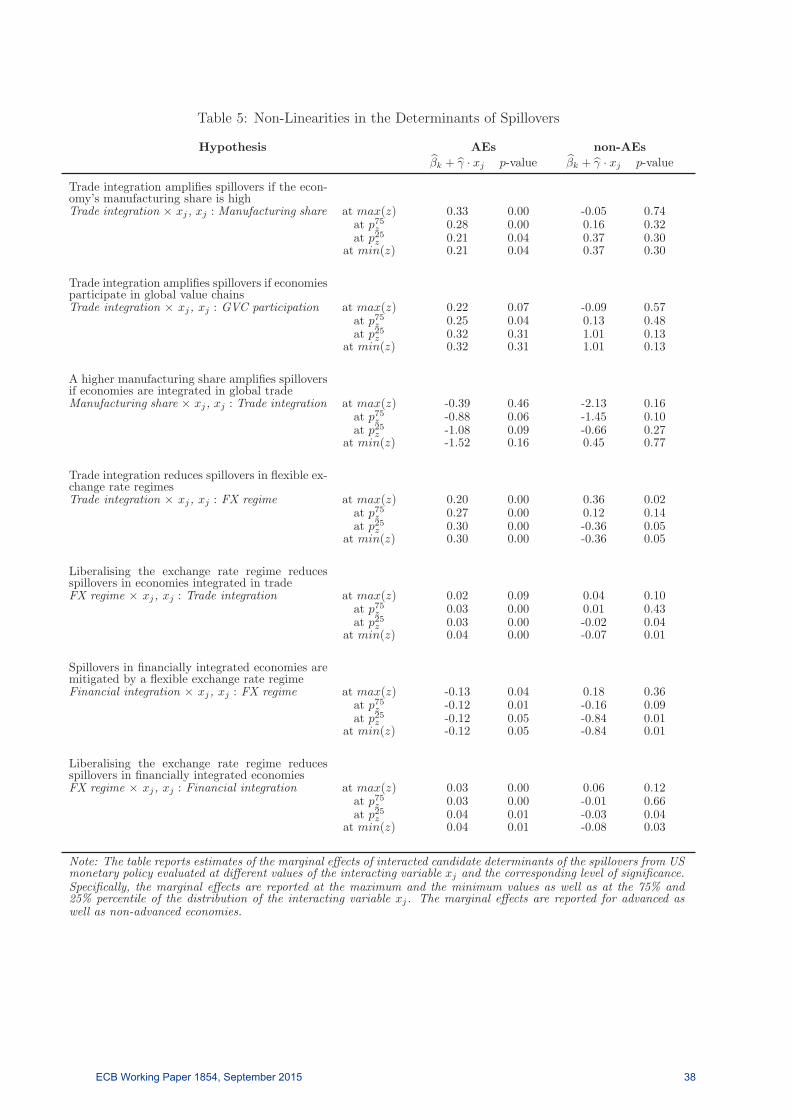
Table 5: Non-Linearities in the Determinants of Spillovers
Hypothesis AEs non-AEs
βk + γ · xj p-value βk + γ · xj p-value
Trade integration amplifies spillovers if the econ-omy’s manufacturing share is highTrade integration × xj, xj : Manufacturing share at max(z) 0.33 0.00 -0.05 0.74
at p75z 0.28 0.00 0.16 0.32at p25z 0.21 0.04 0.37 0.30
at min(z) 0.21 0.04 0.37 0.30
Trade integration amplifies spillovers if economiesparticipate in global value chainsTrade integration × xj, xj : GVC participation at max(z) 0.22 0.07 -0.09 0.57
at p75z 0.25 0.04 0.13 0.48at p25z 0.32 0.31 1.01 0.13
at min(z) 0.32 0.31 1.01 0.13
A higher manufacturing share amplifies spilloversif economies are integrated in global tradeManufacturing share × xj, xj : Trade integration at max(z) -0.39 0.46 -2.13 0.16
at p75z -0.88 0.06 -1.45 0.10at p25z -1.08 0.09 -0.66 0.27
at min(z) -1.52 0.16 0.45 0.77
Trade integration reduces spillovers in flexible ex-change rate regimesTrade integration × xj, xj : FX regime at max(z) 0.20 0.00 0.36 0.02
at p75z 0.27 0.00 0.12 0.14at p25z 0.30 0.00 -0.36 0.05
at min(z) 0.30 0.00 -0.36 0.05
Liberalising the exchange rate regime reducesspillovers in economies integrated in tradeFX regime × xj, xj : Trade integration at max(z) 0.02 0.09 0.04 0.10
at p75z 0.03 0.00 0.01 0.43at p25z 0.03 0.00 -0.02 0.04
at min(z) 0.04 0.00 -0.07 0.01
Spillovers in financially integrated economies aremitigated by a flexible exchange rate regimeFinancial integration × xj, xj : FX regime at max(z) -0.13 0.04 0.18 0.36
at p75z -0.12 0.01 -0.16 0.09at p25z -0.12 0.05 -0.84 0.01
at min(z) -0.12 0.05 -0.84 0.01
Liberalising the exchange rate regime reducesspillovers in financially integrated economiesFX regime × xj, xj : Financial integration at max(z) 0.03 0.00 0.06 0.12
at p75z 0.03 0.00 -0.01 0.66at p25z 0.04 0.01 -0.03 0.04
at min(z) 0.04 0.01 -0.08 0.03
Note: The table reports estimates of the marginal effects of interacted candidate determinants of the spillovers from USmonetary policy evaluated at different values of the interacting variable xj and the corresponding level of significance.Specifically, the marginal effects are reported at the maximum and the minimum values as well as at the 75% and25% percentile of the distribution of the interacting variable xj. The marginal effects are reported for advanced aswell as non-advanced economies.
ECB Working Paper 1854, September 2015 38

Table 6: Robustness: Stacked Regressions for Additional Explanatory Variables and Alter-native Monetary Policy Shocks
Baseline Alternative Alternativespecifications identification
AE fin. openness 0.13∗ 0.09− 0.06
Non-AE fin. openness -0.06∗∗ -0.04− -0.07∗∗∗
AE FX regime 0.03∗∗∗ 0.02∗∗∗ 0.03∗∗∗
AE debt to GDP -0.13∗ -0.15− -0.07
Non-AE debt to GDP 0.40− 0.46∗∗∗ 0.49∗∗∗
Trade integration 0.19∗∗ 0.10∗ 0.15∗∗∗
Financial integration (GFA to GDP) -0.15∗∗∗ -0.16∗∗∗ -0.13∗∗
Manufacturing share -0.94∗∗ -0.89∗∗ -0.82∗∗
Financial system competition 0.12∗ 0.09− 0.11∗∗
Financial depth 0.08∗ 0.05 0.07−
Labor market rigidities -0.09∗ -0.08∗∗ -0.11∗∗∗
Institutional quality -0.02∗∗∗ -0.01∗∗ -0.01∗∗∗
AE dummy -0.09 0.03 0.09
BAL, HRV, RUS, SVK, SVN dummy -0.69∗∗∗ -0.63∗∗∗ -0.73∗∗∗
Constant 0.75∗∗∗ 0.18 0.44∗∗
Observations 55 385 385Adjusted R2 0.72
Robust standard errors in baseline and clustered at country level in stacked regressions.− p < 0.2, ∗ p < 0.1, ∗∗ p < 0.05, ∗∗∗ p < 0.01
ECB Working Paper 1854, September 2015 39

Tab
le7:
Rob
ustness:
Additional
ExplanatoryVariables
Baseline
LevelsGVAR
w/oTUR
1999weights
2009weights
Distance
US
Fin.integr.
US
TradeUS
Troughspillover
AE
fin.openness
0.13∗
0.08
0.10∗
0.09
0.08−
0.14∗
0.13∗
0.14∗
0.12−
Non-A
Efin.openness
-0.06∗∗
0.04
-0.01
-0.07∗∗
-0.03−
-0.05∗
-0.06∗
∗-0.06∗∗
-0.02
AE
FX
regim
e0.03∗∗
∗0.01
0.01
0.03∗
∗∗0.02∗∗
∗0.03∗∗
∗0.03∗∗
∗0.03∗∗
∗0.03∗∗
∗
AE
deb
tto
GDP
-0.13∗
0.28∗
0.19∗
-0.18∗
-0.09
-0.14∗
-0.14∗
-0.13−
-0.13−
Non-A
Edebtto
GDP
0.40−
0.31−
0.35−
0.45∗
0.37∗
0.39−
0.40−
0.41−
0.31−
Tradeintegration
0.19∗
∗0.14−
0.10
0.15∗
0.09−
0.18∗∗
0.18∗∗
0.22∗∗
0.13∗
Financialintegration
-0.15∗∗
∗-0.16∗
∗-0.14∗
∗-0.19∗
∗∗-0.11∗
∗-0.155∗∗
∗-0.14∗
-0.16∗∗
∗-0.14∗∗
∗
Manufacturingshare
-0.94∗
∗-1.48∗∗
-1.26∗
∗-0.98∗
∗-0.80∗
∗-0.95∗
∗-0.93∗∗
-0.97∗∗
∗-1.03∗∗
Financialsystem
comp.
0.12∗
0.26∗
0.16∗∗
0.11−
0.11∗∗
0.10−
0.12−
0.12−
0.17∗∗
∗
Financialdep
th0.08∗
0.14∗
0.09∗
0.04
0.06∗
0.07−
0.08∗
0.08∗
0.06−
Labormarket
rigidities
-0.09∗
-0.10−
-0.10∗
-0.09−
-0.08∗
∗-0.08−
-0.09∗
-0.08∗
-0.08−
Institutionalquality
-0.02∗∗
∗-0.01−
-0.01−
-0.01∗
∗-0.01∗
∗∗-0.01∗
∗∗-0.02∗
∗∗-0.02∗
∗∗-0.01∗
∗∗
AE
dummy
-0.09
-0.11
-0.06
0.13
-0.01
-0.09
-0.09
-0.10
-0.09
BAL,H
RV,RUS,SVK,SVN
-0.69∗∗
∗-0.39∗
∗∗-0.45∗
∗∗-0.75∗
∗∗-0.50∗∗
∗-0.69∗
∗∗-0.69∗
∗∗-0.71∗
∗∗-0.62∗
∗∗
Distance
toUS
0.04
Bil.fin.integration
-0.02
Bil.tradeintegration
-0.25
Constant
0.75∗
∗∗0.10
0.04
0.48−
0.38∗∗
0.35
0.74∗
∗∗0.83∗∗
∗0.58∗∗
Observations
5555
5455
5555
5555
55Adjusted
R2
0.72
0.31
0.52
0.67
0.71
0.72
0.71
0.72
0.66
Robust
standard
errors.
−p<
0.2,
∗p<
0.1,
∗∗p<
0.05
,∗∗
∗p<
0.01
ECB Working Paper 1854, September 2015 40

B Figures
Figure 1: Real GDP Spillovers from US Monetary Policy Shock
< 0.75 < 0.50 < 0.25 < 0.00 > 0.00
Note: The top panel displays the trough spillovers to real GDP to a 100 basis points monetary policy shockin the US identified by sign restrictions, see Section 3 for details. The magnitude of these trough spillovers isindicated by the color bar. The bottom panel compares the domestic trough impact in the US to GDP-weightedaverage trough spillovers to different regions in the sample.
Figure 2: Comparison of Real GDP Spillovers Estimated by the GVAR and Revisions ofGrowth Forecasts for 2014
1.5 1 0.5 0 0.50.5
0.4
0.3
0.2
0.1
0
0.1
0.2
Spillover from US monetary policy
Gro
wth
fore
cast
revi
sion
2014 growth forecast revision betw. April/May(p value=0.00,0.01)
ALB
AUSAUT
BAL
BEL
BGR
BOL
BRA
CAN
CHECHL
CHNCOLCRI
CZEDEUDNK EGYESP
FIN
FRAGBRGRC
HKGHRV
HUNIDN
INDIRL
ISR
ITA
JPN
KOR
MEX
MYSNLDNOR
NZLOPC
PER
PHL
POL
PRT
ROURUS
SGPSVK
SVN
SWETHA
TURZAF
Full sampleW/o CAN, HRV, SVN, JPN
Feb/Mar Mar/Apr Apr/May May/Jun Jun/Jul0.4
0.3
0.2
0.1
0
0.1
0.2
0.3
Revision date
Slo
pe c
oeffi
cien
t
Evolution of correlation between spillovers and 2014 forecast revisions
Note: The left-hand side panel displays the correlation between the trough responses of real GDP obtainedfrom the GVAR model and the revisions between April and May 2013 of Consensus Economics real GDPgrowth forecasts for 2014. The black solid line represents the fitted values of a regression of the growth forecastrevisions on the spillovers. The red-dashed line represents the fitted values for the case in which Canada,Croatia, Slovenia and Japan are dropped. The p-values are provided in the chart titles. The right-hand sidepanel displays the evolution of the slope estimate from this regression for the revisions at different dates. Theshaded areas indicate the 99%, 95% and 90% confidence bands. The results are unchanged when the outliersare dropped at each revision date.
ECB Working Paper 1854, September 2015 41

Figure 3: Correlation of Trough Responses from Robustness Checks with Baseline
Alternative specifications
0
0.25
0.5
0.75
1
US notdom. unit
Fin. crisisdummies
Lombardi/Zhushadow FFR
Wu/Xiashadow FFR
Sample to2012Q1
VIXincluded
All countries W/o outlier
Alternative monetary policy shocks
0
0.25
0.5
0.75
1
M1 signrestr.
FX signrestr.
Sims andZha
Romer andRomer
Bernkankeand Kuttner
Barakchianand Crowe
All countries W/o outlier
Levels GVAR and alternative weights
0
0.25
0.5
0.75
1
Levels withRR MP shock
FD with RRLevels w. RR
Weights1999
Weights2009
All countries W/o outlier
Note: The figure shows the correlation between the responses of the level of real GDP to a US monetarypolicy shock after seven quarters from the baseline specification and those from alternative specifications.The green bars display the correlation if all countries are considered and the yellow bars if a single outlier isremoved. For the alternative specification with dummies during the financial crisis the outlier is Singapore,for the levels GVAR with the monetary policy shocks of Romer and Romer (2004) the outlier is Turkey, andin all other cases it is the Baltics.
ECB Working Paper 1854, September 2015 42

Acknowledgements I would like to thank Stijn Claessens, Michele Lenza, Livio Stracca and an anonymous referee, conference and seminar participants at the 13th DIW Macroeconometric Workshop, the ECB, Goethe University Frankfurt, the National Bank of Poland Workshop on Monetary Transmission in Diverse Economies, the 20th International Conference on Computing in Economics and Finance, the 20th International Panel Data Conference, and the ECBIMF conference on International Dimensions of Conventional and Unconventional Monetary Policy for helpful comments and suggestions. I also wish to thank Marco Lo Duca and Feng Zhu for sharing their data on federal funds futures and shadow federal funds rates. Roberto Gonzalez Quintanilla and Fabian Trottner provided excellent research assistance. The views expressed in the paper are those of the author and do not necessarily reflect those of the ECB or of the ESCB.
Georgios Georgiadis European Central Bank, Frankfurt am Main, Germany; e-mail: [email protected]
© European Central Bank, 2015
Postal address 60640 Frankfurt am Main, Germany Telephone +49 69 1344 0 Website www.ecb.europa.eu
All rights reserved. Any reproduction, publication and reprint in the form of a different publication, whether printed or produced electronically, in whole or in part, is permitted only with the explicit written authorisation of the ECB or the authors.
This paper can be downloaded without charge from www.ecb.europa.eu, from the Social Science Research Network electronic library at http://ssrn.com or from RePEc: Research Papers in Economics at https://ideas.repec.org/s/ecb/ecbwps.html.
Information on all of the papers published in the ECB Working Paper Series can be found on the ECB’s website, http://www.ecb.europa.eu/pub/scientific/wps/date/html/index.en.html.
ISSN 1725-2806 (online) ISBN 978-92-899-1667-7 DOI 10.2866/987302 EU catalogue No QB-AR-15-094-EN-N


![Problems of the Flamant Boussinesq and Kelvin Type in Dipolar Gradient Elasticitymechan.ntua.gr/PERSONEL-DEP/SELIDES DEP/GEORGIADIS... · 2017-10-11 · Georgiadis et al. [3], Georgiadis](https://static.fdocuments.us/doc/165x107/5e681297edd8d925626ef172/problems-of-the-flamant-boussinesq-and-kelvin-type-in-dipolar-gradient-depgeorgiadis.jpg)