Working paper research - nbb.be1 Golin (2001) insists that credit rating agencies conducting...
46
Working paper research n° 79 February 2006 Is there a difference between solicited and unsolicited bank ratings and if so, why ? Patrick Van Roy
Transcript of Working paper research - nbb.be1 Golin (2001) insists that credit rating agencies conducting...
Working paper research n° 79 February 2006
Is there a difference between solicited and unsolicited bank ratings and if so, why ? Patrick Van Roy

NBB WORKING PAPER No. 79 FEBRUARY 2006
Editorial Director
Jan Smets, Member of the Board of Directors of the National Bank of Belgium
Statement of purpose:
The purpose of these working papers is to promote the circulation of research results (Research Series) and analyticalstudies (Documents Series) made within the National Bank of Belgium or presented by external economists in seminars,conferences and conventions organised by the Bank. The aim is therefore to provide a platform for discussion. The opinionsexpressed are strictly those of the authors and do not necessarily reflect the views of the National Bank of Belgium.
The Working Papers are available on the website of the Bank:http://www.nbb.be
Individual copies are also available on request to:NATIONAL BANK OF BELGIUMDocumentation Serviceboulevard de Berlaimont 14BE 1000 Brussels
Imprint: Responsibility according to the Belgian law: Jean Hilgers, Member of the Board of Directors, National Bank of Belgium.Copyright © fotostockdirect goodshoot
gettyimages digitalvisiongettyimages photodiscNational Bank of Belgium
Reproduction for educational and noncommercial purposes is permitted provided that the source is acknowledged.ISSN: 1375680X

NBB WORKING PAPER No. 79 FEBRUARY 2006
Abstract
This paper analyses the effect of soliciting a rating on the rating outcome of banks. Using a sample
of Asian banks rated by Fitch Ratings ("Fitch"), I find evidence that unsolicited ratings tend to be
lower than solicited ones, after accounting for differences in observed bank characteristics. This
downward bias does not seem to be explained by the fact that betterquality banks selfselect into
the solicited group. Rather, unsolicited ratings appear to be lower because they are based on public
information. As a result, they tend to be more conservative than solicited ratings, which incorporate
both public and nonpublic information.
JELcode : G15, G18, G21
Keywords: Credit rating agencies, Unsolicited ratings, Selfselection, Public disclosure,
Accounting transparency

NBB WORKING PAPER No. 79 - FEBRUARY 2006
TABLE OF CONTENTS
1. Introduction ................................................................................................................................ 1
2. Background on unsolicited ratings ............................................................................................. 7
3. Data ............................................................................................................................................ 9
4. Methodology ............................................................................................................................. 12
4.1. Ordinary least squares ...................................................................................................... 12
4.2. Endogenous switching regression model ......................................................................... 13
5. Results ...................................................................................................................................... 16
5.1. Ordinary least squares ...................................................................................................... 16
5.2. Endogenous switching regression model ......................................................................... 18
5.3. Test of the public disclosure hypothesis ........................................................................... 20
6. Conclusion ................................................................................................................................ 24
References ...................................................................................................................................... 27
Tables .............................................................................................................................................. 32
National Bank of Belgium - Working paper series ........................................................................... 41

1
1. Introduction
Several facts have recently drawn public attention to the work and functioning of credit
rating agencies. First and foremost was their failure to predict severe financial crises and a wave
of corporate scandals (Enron, WorldCom, or Parmalat), and most recently defaults of subprime
mortgage-related securities. Second was the potential procyclicality of their assessments and
their increasing role in the regulatory mechanism of financial markets. Third have been a number
of issues related to the transparency and integrity of the rating process. Among these issues, the
practice of unsolicited ratings has prompted controversy among issuers, credit rating agencies,
and regulators alike. Unsolicited ratings are formally defined as "ratings that credit rating
agencies conduct without being formally engaged to do so by the issuer" (International
Organization of Securities Commissions, 2003). As such, and contrary to solicited ratings,
unsolicited ratings do not imply the payment of a rating fee and do not automatically involve any
formal meetings between the credit rating agency and the entity being rated.1 Such meetings,
which are part of the solicited ratings process, typically provide an opportunity for credit rating
agencies to get an overview of a company’s activities and to obtain more information than what
is disclosed in its published annual reports.2
The main concern surrounding unsolicited ratings is the fact that, all else being equal, they
"do not appear to be empirically as favorable as solicited ratings" (Securities and Exchange
Commission, 2005). Even though this could be interpreted as evidence that unsolicited ratings
are assigned to "blackmail" issuers into paying for a solicited rating, it could also simply indicate
that better-quality issuers request a rating or that credit rating agencies issue more conservative
ratings in the absence of non-public information.
1 Golin (2001) insists that credit rating agencies conducting unsolicited ratings attempt to invite the participation ofthe rated entity, either through submission of questionnaires, informal visits, or informal reviews of the draft report.Fitch (2005 and 2006) claims that some issuers choose to participate to the rating process following this initialcontact.2 Fight (2001) reports excerpts of a survey which indicate that more than 90% of companies release either selectedor substantial non-public information to their rating agency during these meetings.
2
This paper contributes to the literature on unsolicited ratings by investigating whether there is
a difference between solicited and unsolicited bank ratings and, if so, why. The analysis makes
use of a sample of bank ratings assigned by Fitch Ratings ("Fitch") in Asia because several
sources allow identification of the solicited status of ratings assigned by Fitch in that region (see
Section 3). After confirming a systematic difference between solicited and unsolicited ratings for
similar banks, the paper tests two hypotheses. The first is the "self-selection hypothesis", which
states that solicited ratings tend to be higher than unsolicited ones because they are the result of
self-selection, i.e., better-quality issuers self-select into the solicited group by choosing to obtain
rating services. This hypothesis is tested using an endogenous switching regression model, which
extends the standard model of sample selection due to Heckman (1979).
A rejection of the self-selection hypothesis is consistent with at least two different
interpretations: unsolicited ratings are lower to punish issuers who otherwise would not purchase
ratings coverage; alternatively, unsolicited ratings are lower because they are based only on
public information and, as a result, tend to be more conservative than solicited ratings. The latter
gives rise to the second hypothesis tested by the paper: the "public disclosure hypothesis", which
states that (i) disclosure of public information has only an impact on the rating of issuers who
choose not to be rated; (ii) issuers who do not request a rating but who disclose a high enough
amount of public information do not receive a lower rating than do similar issuers who have
solicited a rating. In this paper, information disclosure is measured by an index capturing the
level of accounting information publicly released by issuers (see Baumann and Nier, 2004).
Interestingly, the importance of information disclosure for nonfinancial firms has recently
become the focus of several empirical papers. Mitton (2002) and Baek et al. (2004) find that East
Asian firms that had higher disclosure quality experienced better stock price performance during
the financial crisis of 1997-98. Jorion et al. (2005) find for the U.S. that the stock price effect of
rating changes has been larger since the implementation of Regulation Fair Disclosure, which
prohibits public companies from disclosing non-public information to favored investment

3
professionals, except to credit rating agencies. Finally, Yu (2005) shows that U.S. firms improve
their credit rating by 0.5 notches on a 1 to 20 rating scale by elevating their disclosure quality
above the median disclosure index.
Given the importance of information disclosure for nonfinancial firms, one should expect
disclosure to play at least as important a role for banks. Indeed, several studies suggest that banks
are inherently more opaque than nonfinancial firms. For instance, Morgan (2002) reports that
Moody’s Investors Service Inc. (Moody’s) and Standard and Poor’s (S&P) disagree more often
over U.S. banks’ and insurance companies’ ratings than over other types of firms’ ratings and
that Moody’s is systematically more conservative than S&P in its ratings, and relatively more so
for banks. The latter result can be explained by the fact that the opacity of banks’ assets makes
conservative rating agencies err even more on the side of caution. Iannotta (2006) looks at bond
ratings of European firms and also finds that credit rating agencies disagree the most on bank
ratings. Akhigbe and Martin (2006) provide additional evidence on the importance of
information disclosure for financial services firms by showing that firms with greater financial
statement disclosures experienced more favorable wealth effects following the passage of the
Sarbanes-Oxley act.
In addition to the recent interest in firms’ information disclosure, several papers have been
devoted to the question of differences in solicited versus unsolicited ratings. The existing
literature on this topic can be divided into three groups of papers.
The first group of papers (Poon, 2003a and 2003b; Poon and Firth, 2005; Poon et al., 2007 )
focuses on credit ratings assigned by S&P and Fitch to companies located in different countries
and finds that unsolicited ratings are lower than solicited ones.3 While these studies attempt to
control for sample selection, their somewhat conflicting results make it difficult to infer whether
3 Poon et al. (2007) show that the difference between solicited and unsolicited ratings can be explained bydifferences in their solicitation status and financial profile. However, the authors do not control for the level ofinformation disclosed by issuers hence their results may suffer from an omitted variable bias. Shimoda and Yuko(2007) look at S&P’s ratings of nonfinancial companies in Japan and confirm the existence of a downward bias inunsolicited ratings.
4
sample selection in credit ratings does exist and, if so, whether it is responsible for the lower
unsolicited ratings.
The second group of papers (Butler and Rodgers, 2003; Gan, 2004) looks at solicited and
unsolicited ratings assigned by Moody’s and S&P to U.S. companies. Butler and Rodgers (2003)
find that solicited ratings are not higher than unsolicited ones, while Gan (2004) finds a
statistically significant difference between the two types of ratings but no statistically significant
difference between the issuers’ performance after a rating has been assigned. These results lead
Gan (2004) to reject the idea that issuers with unsolicited ratings are discriminated against.
Finally, the last group of papers (Behr and Güttler, 2008; Bannier et al., 2007) focuses on the
informational content of unsolicited ratings. Behr and Güttler (2008) look at whether the stock
market reacts to the assignment of and changes in unsolicited ratings by S&P. The authors find
that investors react negatively in both cases, implying that unsolicited ratings convey new
information to the stock market. Bannier et al. (2007) find no systemic bias in unsolicited ratings
of U.S. firms, which leads them to reject the hypothesis that unsolicited ratings are assigned to
blackmail issuers and conclude that lower unsolicited ratings are probably due to the opaqueness
of firms which seek a rating (the authors do not, however, test this claim).
In light of the above, the main contributions of this paper are the following. First, this study
makes use of a sample where the solicited status of credit ratings is clearly identified through
various sources. While some of the existing studies use larger samples, they do not always
distinguish completely between solicited and unsolicited ratings.4 Second, this paper addresses
the issue of self-selection through the use of an endogenous switching regression model (self-
selection hypothesis). Third, this paper tests whether disclosure of public information only
matters for banks with unsolicited ratings (first part of the disclosure hypothesis) and whether the
4 For instance, Poon and Firth (2005) identify Fitch’s solicited ratings as corresponding to its “non-shadow” ratings.However, Fitch claims that some of its non-shadow ratings are also unsolicited (see Section 3). Butler and Rodgers(2003) and Gan (2004) rely on estimated rating fees to distinguish between solicited and unsolicited ratings, whichmay lead to some misidentifications given the difficulty of identifying a fee threshold below which ratings should beconsidered as unsolicited.
5
difference between solicited and unsolicited ratings disappears when banks with unsolicited
ratings release a high enough amount of public information (second part of the public disclosure
hypothesis). As far as I am aware, the public disclosure hypothesis has not yet been tested in the
literature.
Several results emerge from the analysis. First, I find no evidence that, in determining
ratings, Fitch assigns different weights to observable bank characteristics in the solicited and
unsolicited groups (except the degree of public disclosure). However, I do find that unsolicited
bank ratings are lower than solicited ones after controlling for observable bank characteristics.
The estimated difference between the two types of ratings is also economically significant, as it
averages 1.2 notches on a 1 to 9 rating scale.
On the one hand, these findings appear to give some credence to Fitch’s claim that it
maintains the same standards of analysis for its solicited and unsolicited ratings (see Fitch,
2005). On the other hand, they seemingly contradict the figures in Fitch (2006), which tend to
show that there is no difference in Fitch’s credit judgment of firms with unsolicited ratings.5
A second result is that there is no evidence of a sample selection problem in bank ratings.
Hence the self-selection hypothesis is rejected.
Third, the results provide support for the public disclosure hypothesis. Disclosure of public
information has a positive impact on the rating of banks which choose not to be rated, but no
impact on the rating of banks which ask to be rated. In addition, high disclosure banks with an
unsolicited rating and low disclosure banks with a solicited rating do not receive ratings which
are significantly different from the rating of high disclosure banks with a solicited rating.
However, low disclosure banks with an unsolicited rating do receive lower ratings than the latter
group of banks.
5 Note however that the solicited status of the Moody’s and S&P’s ratings used as control groups in Fitch (2006) isunknown.

6
The latter finding is important in light of the fact that the theoretical impact of public
disclosure on the relation between soliciting a rating and the actual rating outcome is ambiguous.
On the one hand, the impact of public disclosure might be positive if issuers who do not request
a rating and who disclose a high enough amount of public information receive the benefit of the
doubt. On the other hand, the impact of public disclosure might be negative if it adds to negative
perceptions or intuitions about issuers who choose not to be rated. This study suggests that the
first effect dominates the second.
The results of the test of the public disclosure hypothesis are also of interest in the particular
case of Fitch. A former official of Fitch's BankWatch has acknowledged that "It is true that
unsolicited ratings are often more conservative than solicited ratings. The reason is not that
agencies are attempting to punish companies that decline to pay for a rating, but that where there
is doubt, the agencies will tend to err on the side of caution. Correspondingly, the more
information provided to the agencies, the more transparent the disclosure process, the more
comfort agency analysts will feel in giving the company the benefit of the doubt (...) As a matter
of practice, less disclosure tends to be associated with higher risk. In the context of risk
assessment, disclosure is not only the means by which the assessment is performed, it is also
arguably a positive credit consideration in itself" (Golin, 2001, pp. 534-535).6
The remainder of the paper is organized as follows. Section 2 reviews the background on
unsolicited ratings. Section 3 presents the data used in the analysis. The research methodology is
described in Section 4 and the results are presented in Section 5. Section 6 concludes and offers
some policy implications.
6 One may also argue that credit rating agencies assign lower unsolicited ratings not because they are conservativebut because they are rational. Indeed, as mentioned earlier, credit rating agencies often stress that issuers are giventhe opportunity to participate in the unsolicited ratings process. Therefore, issuers who refuse to participate in suchprocess must have something to "hide" and a lower rating may be warranted. However, there have been cases inwhich issuers with no negative inside information have refused to participate in the unsolicited ratings process (see,e.g., the case of Hannover Re, which is discussed at the beginning of Section 2) hence this argument may not beentirely convincing.
7
2. Background on unsolicited ratings
Even though the vast majority of credit ratings are assigned on a solicited basis, unsolicited
ratings currently account for a sizeable portion of the total number of credit ratings. According to
the Cantwell survey (Fight, 2001), unsolicited ratings represented between 6% (S&P) and 26.6%
(Fitch) of the total number of credit ratings assigned in industrial countries in 2000.
Recently, there have been many instances in which credit rating agencies have been accused
of assigning lower unsolicited ratings in order to "blackmail" issuers into paying for and
participating in a rating process (see, e.g., Hill, 2004, for a review). An example cited as an
alleged abuse of power is the series of successive downgrades of Hannover Re, one of the
world’s largest reinsurance companies, by Moody’s. Hannover Re was initially approached by
Moody’s in 1998 to subscribe to its rating services but declined the offer. Despite being turned
down, Moody’s decided to go ahead and rate Hannover Re at no charge. Over the next five
years, Moody’s rating actions (3 downgrades, from Aa2 to Baa1) surprised many analysts given
that other credit rating agencies continued to give the insurance company credit ratings several
notches higher than Moody’s. Hannover Re’s comments were that Moody’s decisions were "pure
blackmail" and that company’s officials had been told on many occasions that if they paid for a
rating, it "could have a positive impact" on the grade (Wall Street Journal, 2004).
In spite of the controversy surrounding unsolicited ratings, credit rating agencies insist on
defending this practice. Their main argument is that they do not issue higher solicited ratings to
keep existing customers or lower unsolicited ratings to attract new customers, as this would
imply that they are willing to jeopardize their reputation in order to benefit from a temporary
increase in revenues (Golin, 2001).
Interestingly, rating agencies provide different degrees of transparency with respect to the
solicited status of their credit ratings. S&P designates unsolicited ratings as such or as "public
information ratings" in its publications. The other two major rating agencies (Moody’s and Fitch)

8
identify in their initial credit rating announcements the ratings for which the issuer has declined
to participate in the assignment process (Fitch issues such ratings under the name "agency-
initiated ratings"). However, both rating agencies do not normally disclose the solicitation status
of ratings afterwards (Fitch, 2005; Moody’s, 2006).
Over the last years, unsolicited ratings have come under the attention of several committees
and regulatory bodies as part of wider investigations into the role and function of credit rating
agencies. Some of the most recent developments are detailed below.
In 2004, the International Organization of Securities Commissions (IOSCO) published a code
of conduct for credit rating agencies, which asks credit rating agencies to "disclose whether the
issuer participated in the rating process" and to identify each rating not initiated at the request of
an issuer as such (IOSCO, 2004a).7 However, as of 2008, the three major credit rating agencies
are still not compliant with this requirement (see CESR, 2008). As a result, it is often difficult for
market participants to obtain information on whether a credit rating is solicited or not.
In the U.S., the Senate Banking Committee enacted in 2006 the Credit Agency Reform Act,
which aims at fostering accountability, transparency and competition in the credit rating industry.
More specifically, the Act foresaw that the Securities and Exchange Commission (SEC) would
issue final rules to prohibit any act or practice related to "modifying or threatening to modify a
credit rating (...) based on whether the obligor (...) purchases or will purchase the credit rating or
any other service or product of the nationally recognized statistical rating organization" (U.S.
Congress, 2006). However, one year later, the SEC decided not to prohibit these acts and
practices for the moment because it wanted "to gain a better understanding (...) of how credit
rating agencies define unsolicited credit ratings and the practice they employ with respect to
these ratings" (SEC, 2007).
7 Interestingly, Fitch’s response to the IOSCO code was that it did “not believe that it is necessary or appropriate torequire the disclosure of whether a rating is initiated or whether the issuer has cooperated in the rating process” andthat such requirements “interfere in the editorial process of the rating agencies” (IOSCO, 2004b).

9
3. Data
This study is based on a sample of solicited and unsolicited bank ratings assigned by Fitch in
Asia. The unsolicited bank ratings included in the sample were called "shadow ratings" and were
appended with an "s" in Fitch’s publications until June 2005. These ratings were introduced by
Fitch in 2000 to bring into its coverage the large number of credit evaluations previously
conducted by Thomson BankWatch, a credit rating agency it acquired that year (Fitch, 2001).
Private correspondence with a Fitch Ratings analyst confirmed that all shadow ratings are
Fitch-initiated (i.e., unsolicited) but revealed that some non-shadow ratings may also be
unsolicited. A suggestion, which was followed in this paper, was to reclassify non-shadow
ratings of banks with a short-form credit report (10 ratings from the initial sample) as
unsolicited.8 This is because banks without a shadow rating but covered in short-form are
generally rated on a Fitch-initiated basis (see also Golin, 2001, p. 580).
The solicited and unsolicited bank ratings used in this study are individual ratings. Contrary
to debt ratings, these ratings focus on the ability of issuers to satisfy their obligations in general
and are primarily used by interbank lenders to assess the overall creditworthiness of their
counterparty. As a result, banks' decision to request an individual rating is not necessarily
determined by their need to raise debt on the public market.
The individual ratings and the corresponding financial information were obtained from
Bankscope and Fitch Research. Specifically, in the remainder of the paper, I use cross-sectional
regressions where the dependent variable is the bank individual rating on 31 January 2004. Since
shadow ratings were introduced in 2000 and some of them were modified between 2000 and
2004, the unsolicited ratings used in this paper include both first-time and re-ratings of banks.
The same is true of the solicited ratings.
8 Fitch produces two types of bank credit reports: short-form reports called “credit updates” and long-form reportscalled “full rating reports”.
10
As Fitch asks for a minimum of three years’ annual data and a maximum of five years’ when
assigning a bank rating (see Fitch, 2004), I use the five-year average (1999 to 2003) of bank
variables if available and their three-year average (2001 to 2003) if not.
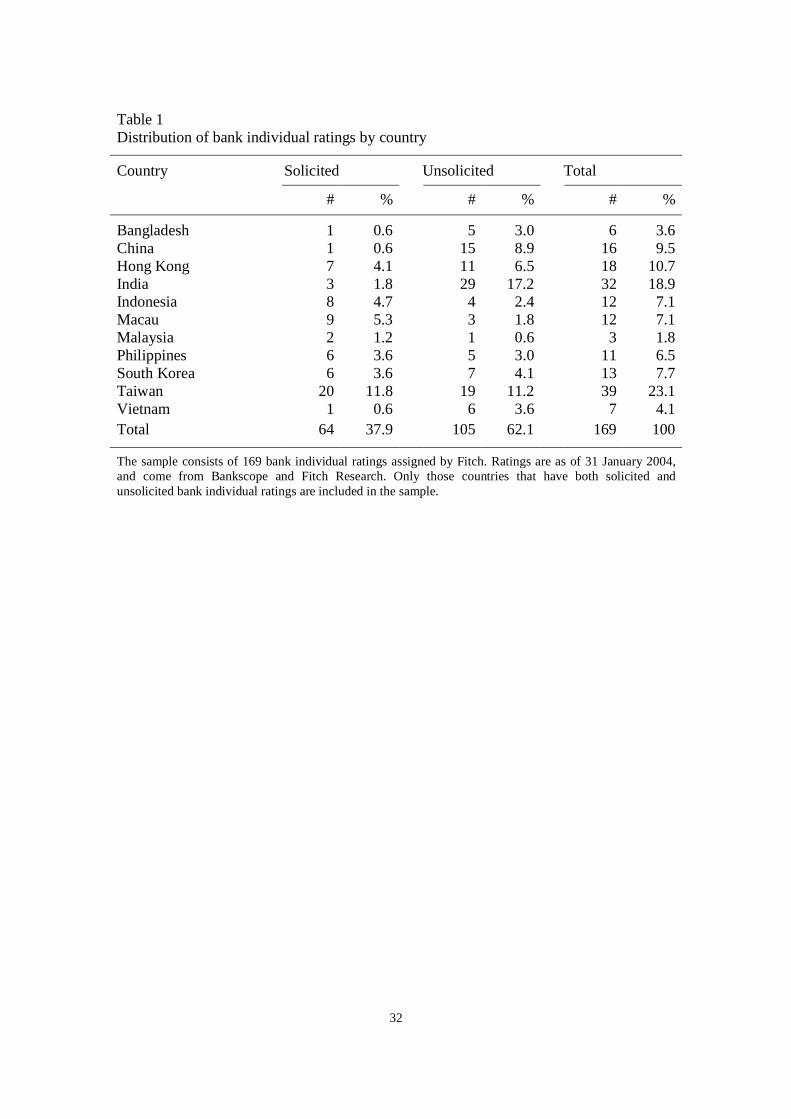
Table 1 illustrates the distribution of the sample bank ratings by country. Note that only those
countries that have both solicited and unsolicited bank ratings are included in the analysis.
Unsolicited ratings constitute the majority of ratings in the sample with 105 banks, while
solicited ratings account for the remainder of the sample with 64 banks.
[Insert Tables 1 and 2 about here]
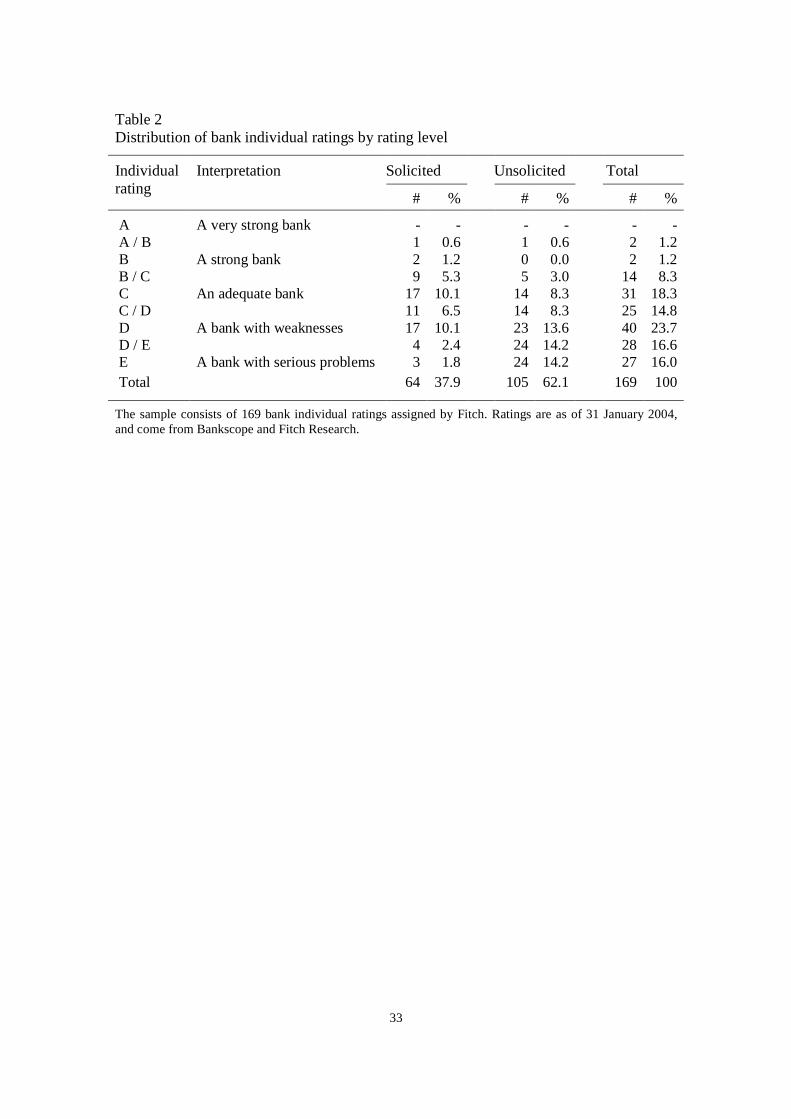
Table 2 shows the sample distribution of solicited and unsolicited ratings by rating level.
Observe that, contrary to Fitch’s debt ratings, which use the standard AAA to D rating scale,
Fitch’s individual ratings are based on an A to E classification. Slightly less than a third of the
sample banks obtain C ratings or above, meaning that their overall creditworthiness is adequate
to very strong. The remaining sample banks are classified below C, meaning that their overall
creditworthiness is somewhat weak to very weak.
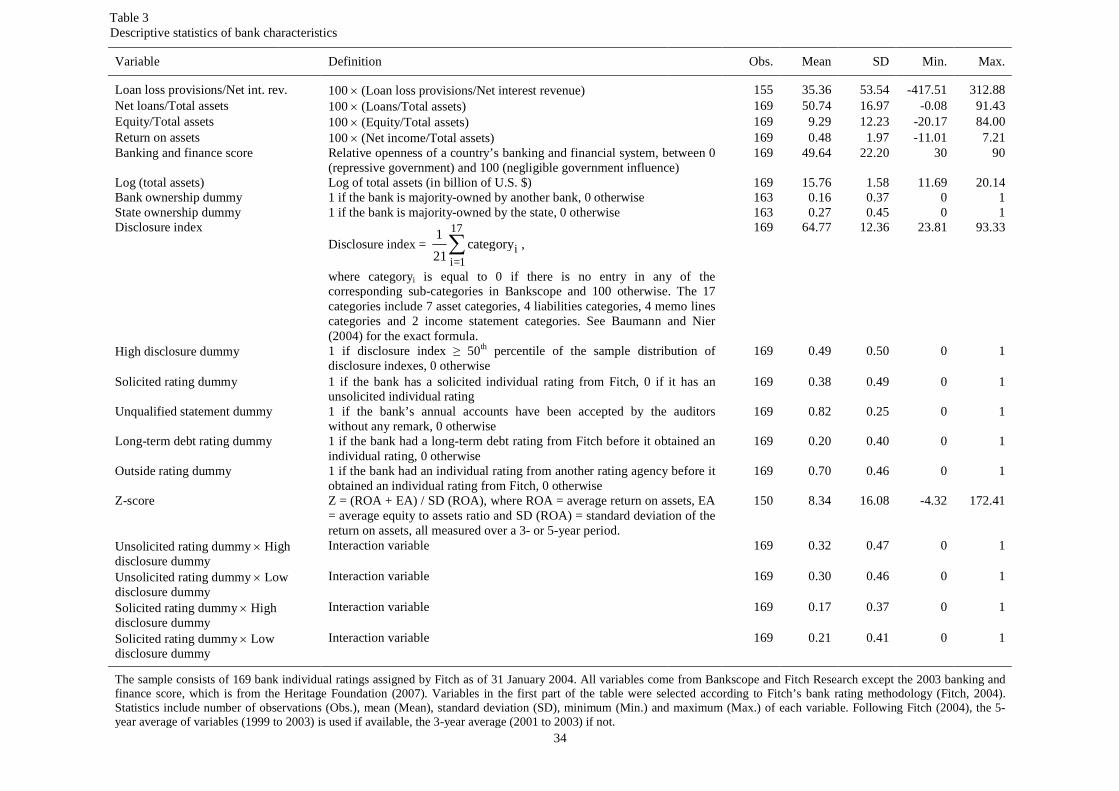
In Table 3, I present summary statistics for the entire sample of bank ratings. Fitch (2004)
indicates that its bank ratings are determined by a number of quantitative and qualitative
variables that can be classified into several categories which include, among others, risk
management, funding and liquidity, capitalization, earnings and performance, market
environment, diversification and corporate governance. Based on this classification, the variables
which show the strongest correlation with Fitch’s bank individual ratings are included in the first
part of Table 3.9
[Insert Table 3 about here]
9 The banking and finance score estimated by the Heritage Foundation is used to capture aspects related to themarket environment of banks. This index, which measures the relative openness of a country’s banking and financialsystem on a 0-100 scale, has been shown to be strongly correlated with a sample of bank individual ratings assignedby Fitch in Asia (Pasourias et al., 2007). The banking and finance score was preferred to Fitch's sovereign creditratings because the latter exhibit a low correlation with the bank individual ratings and are available for fewercountries.
11
Fitch (2004) also emphasizes the need for a detailed breakdown of banks’ balance sheet and
income statement when assigning a rating. This requirement is captured by a disclosure index
which ranges between 0 and 100 and which measures the level of detail that banks provide on 17
key dimensions of accounting information in their published accounts (see Baumann and Nier,
2004).
In the empirical analysis, the disclosure index is transformed into a dummy variable: 1 if the
bank is a "high" disclosure bank and 0 otherwise. High disclosure banks are defined as those
having a disclosure index equal to or higher than the 50th percentile of the sample distribution of
disclosure indexes, which is equal to 67.7 (see Table 3).10 This transformation is made because
testing the public disclosure hypothesis requires splitting the sample into high and low disclosure
banks (see Subsection 5.3). As a robustness check, I also used the 40th and 75th percentiles of the
sample distribution of disclosure indexes to define the high disclosure dummy variable (these
percentiles are respectively equal to 65.7 and 71.4). The main results of this paper are robust to
these alternative definitions of the high disclosure dummy.
Finally, the last part of Table 3 shows summary statistics for variables used later in the
analysis (i.e., unqualified statement dummy, long-term debt rating dummy, outside rating
dummy, Z-score, and four interaction variables).
Interestingly, t-tests comparing the mean value of the variables included in Table 3 reveal
some significant differences between the solicited and unsolicited groups (for the sake of brevity,
the results of these tests are not reported in a table).11 For instance, banks with unsolicited ratings
are less capitalized (i.e., have a lower equity to total assets) than banks with solicited ratings.
Also, there are more banks which are majority-owned by the state in the unsolicited than in the
10 Since Fitch (2004) asserts that its rating determinants take into account national and regional bank characteristics,I use the 50th percentile of the sample distribution of disclosure indexes (67.7) rather than the 50th percentile of theworld distribution of disclosure indexes (56.0) to define the high disclosure dummy.11 Throughout the paper, significance refers to a level of confidence of 95% and marginal significance to a level ofconfidence of 90%.

12
solicited group (40.0% vs. 7.9%) and the level of the banking and finance score is higher in the
solicited than in the unsolicited group (55.6 vs. 43.0).
There does not seem to be any significant difference between the level of disclosure of banks
with solicited ratings and unsolicited ratings. However, banks which request a rating are more
likely to have a financial statement which has been approved by the auditors without
qualification (88.3% of banks in the solicited group vs. 78.3% in the unsolicited group). Finally,
banks which choose to ask for an individual rating are more likely to have already a long-term
rating from Fitch (40.6% of banks in the solicited group vs. 6.7% in the unsolicited group).12
Overall, Table 2 suggests that unsolicited ratings tend to be more frequently assigned at the
lower end of the rating scale than solicited ones while results of t-tests show some differences in
the characteristics of the solicited and unsolicited groups. In order to answer the question of
whether there is a difference between solicited and unsolicited bank ratings and, if so, to explain
why, I now turn to the econometric analysis.
4. Methodology
This section outlines the methodology used to test whether banks with solicited ratings and
those with unsolicited ratings obtain the same rating ceteris paribus.
4.1. Ordinary least squares
I first use a simple ordinary least squares regression of the form:
,i i i iRating = X Solicited + (1)
where Ratingi corresponds to the individual rating of bank i coded on a 9 (A) to 1 (E) scale, Xi is
a matrix of financial and nonfinancial characteristics that explain the individual rating of bank i
and Solicitedi is a dummy variable that equals one if bank i has requested an individual rating
12 A vast majority of these long-term ratings is solicited (private correspondence with a Fitch Ratings analyst).
13
and zero otherwise. Although Ratingi takes nine different discrete values, it is treated as a
continuous variable in the analysis for two reasons. First, researchers often treat discrete
variables as continuous when the range of values that they take is large enough. Second, the
existing studies on the determinants of credit ratings show that this type of analysis is not very
sensitive to the choice between ordinary least squares and ordered probit, a statistical model for
discrete random variables (see, e.g., Cantor and Packer, 1997).
Looking at equation (1), the coefficient of Solicitedi, , measures the so-called treatment
effect. In this context, the treatment is whether or not banks have requested an individual rating
from Fitch. The null hypothesis to be tested is whether = 0, i.e., whether soliciting a rating has
no effect on the rating itself once controlling for relevant bank characteristics. One issue that
arises in this setup is the potential endogeneity of the variable Solicitedi, i.e., the possibility that
corr (Solicitedi, i) 0, yielding biased and inconsistent least squares estimates. For instance, if
the typical bank which chooses to request a rating would have a relatively high rating whether or
not it asked to be rated, there will be a positive correlation between Solicitedi and i. In this case,
the least squares estimates of will actually overestimate the treatment effect. Therefore, I use an
extension of the standard model of sample selection due to Heckman (1979) to test the self-
selection hypothesis.13
4.2. Endogenous switching regression model
The endogenous switching regression model is based on the following selection equation:
*i i iSolicited =W + u , (2)
1 if > 0 0 otherwise*i iSolicited = Solicited , , (3)
where W collects all variables in X plus any other variables that affect the decision to request an
individual rating but not the rating itself. The model further assumes that W is exogenous.
13 Poon (2003a) and Poon (2003b) use Heckman’s standard model of sample selection and are therefore unable toestimate the impact of soliciting a rating while simultaneously controlling for the selection bias. Poon and Firth(2005) use a treatment effect model. Butler and Rodgers (2003) and Gan (2004) do not control for sample selection.

14
Contrary to the ordinary least squares model, the endogenous switching regression model
also assumes that soliciting a rating may have a slope effect, i.e., the coefficients of the Xs in
equation (1) may differ according to the solicited status. The outcome equation is thus given by:
1 1 1i i iRating = X if Solicitedi = 0, (4)
2 2 2i i iRating = X if Solicitedi = 1, (5)
where it is assumed that X is exogenous and that 1, 2 and u follow a trivariate normal
distribution with mean vector zero and symmetric covariance matrix equal to:
21 1
22 2
2=
u
u
u
. ,
. . (6)
where 21 and 2
2 are the variances of the error terms in the outcome equations, 2u is the
variance of the error term in the selection equation and 1u and 2u are the covariances between
1 and u and 2 and u, respectively (the covariance between the error terms in the outcome
equations is not defined since Rating1i and Rating2i are never observed simultaneously). Since
can be estimated only up to a scale factor, it is further assumed that 2 =1u hence 1 1 1u u and
2 2 2u u where 1u and 2u are the coefficients of correlation between 1 and u and 2 and u,
respectively.
Using equations (2) to (6), one can show that the expected rating conditional on having
requested one is given by:
2 2 2 2( )E( 1 ) =( )
,ii i i ii u
i
WRating Solicited = , X ,W XW
(7)
where denotes the normal density function and the normal cumulative function.
For banks with unsolicited ratings, the counterpart to (7) is:
1 1 1 1- ( )E( 0 ) +
1 - ( )i
i i i ii ui
Rating Solicited = , X ,W = X . (8)

15
The difference in expected rating between banks which request a rating and those which do
not is given by the difference between equations (7) and (8):
2 1
2 1 2 2 1 1
E( = 1 ) - E( = 0 ) =
( ) - ( )( - ) + -( ) 1 - ( )
i i i i i ii i
i ii u u
i i
Rating Solicited , X ,W Rating Solicited , X ,W
,(9)
where the first term on the right-hand side, Xi( 2 – 1), is the average treatment effect (ATE),
which measures the average gain or loss from soliciting a rating for a randomly chosen bank (this
quantity was denoted by in Subsection 4.1). The second and third terms on the right-hand side
are the sample selection correction terms. Under fairly weak assumptions, a consistent estimator
of the average treatment effect is given by:
2 1( )ATE = X ,ˆ ˆˆ (10)
where is used to denote average and ˆ parameter estimates obtained by estimating the system
formed by equations (2)-(3) and (4)-(5).
In this setup, a test for 2 2 1 1 = 0u u is a test of selection based on unobservable rating
determinants. If the test fails to reject that both parameters are jointly equal to zero, we cannot
reject the null hypothesis of no selectivity bias in the solicited and unsolicited groups and we
have no argument against using ordinary least squares. A Chow test can also be used to test
whether the s are identical in the solicited and unsolicited groups. If they are, a simple treatment
effect model is more efficient than the endogenous switching regression model.14
The endogenous switching regression model is estimated by maximum likelihood using the
procedure outlined in Greene (1995).
14 The treatment effect model (see, e.g., Greene, 1995) is based on the same sample selection equation as theendogenous switching regression model but assumes that the treatment has the same effect across individuals.
16
5. Results
In this section, I discuss the results of the estimation procedures described above. Next, I turn
to the test of the public disclosure hypothesis.
5.1. Ordinary least squares
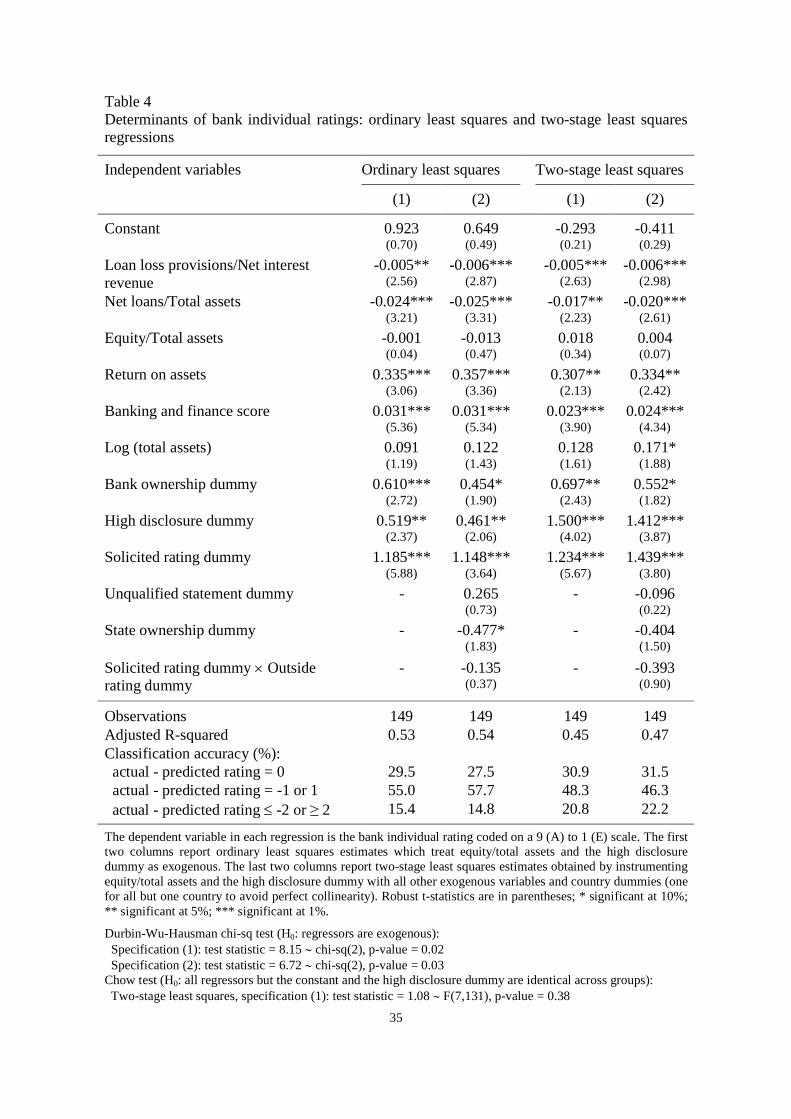
Two basic specifications of equation (1) are reported in Table 4. To avoid multicollinearity
problems, the first specification only includes five financial variables and three nonfinancial
variables in addition to a solicited rating dummy. These variables cover the different areas of
Fitch’s bank rating methodology: risk management (loan loss provisions/net interest revenue),
liquidity (net loans/total assets), capitalisation (equity/total assets), earnings and performance
(return on assets), market environment (banking and finance score), diversification/franchise (log
of total assets), corporate governance (bank ownership dummy – one if the bank is majority-
owned by another bank and zero otherwise), and public disclosure (high disclosure dummy).15
The second specification adds two variables that control for additional aspects of market
environment (unqualified statement dummy) and corporate governance (state ownership dummy
– one if the bank is majority-owned by the State and zero otherwise). In addition, the second
specification also interacts the solicited rating dummy with the outside rating dummy, which is
equal to one if the bank had an individual rating from a competitor agency before it obtained an
individual rating from Fitch and zero otherwise. The resulting variable captures whether there is
a rating difference between banks which request an individual rating without being rated by a
competitor of Fitch and banks which request an individual rating while already being rated by a
competitor agency.
15 The results of this paper are robust to the choice of alternative variables for each category, e.g. cost to incomeratio instead of return on assets (for earnings and performance) or log of total deposits instead of log of total assets(for diversification). The results of Tables 4 and 5 also hold if Baumann and Nier’s original disclosure index issubstituted for the high disclosure dummy.
17
[Insert Table 4 about here]
The two specifications are estimated by ordinary least squares (OLS) and by two-stage least
squares (2SLS) to account for the potential endogeneity of equity/total assets and the high
disclosure dummy, i.e., the two explanatory variables that are most likely to suffer from an
endogeneity bias (see, e.g., Baumann and Nier, 2004). The set of instruments for both variables
consists of all the other exogenous explanatory variables in the regression and country dummies
(one for all but one country to avoid perfect collinearity). I also carried out a Durbin-Wu-
Hausman test, the null hypothesis for which states that OLS delivers consistent estimates, i.e.,
that instrumental variables techniques are not required. The values of the Durbin-Wu-Hausman
statistic in specifications (1) and (2) are 8.15 and 6.72, with an associated probability of 0.02 and
0.03 respectively, meaning that the null hypothesis that OLS delivers consistent estimates is
rejected in both specifications. The discussion of Table 4 is therefore based on the 2SLS results.
The coefficient of the solicited rating dummy in specifications (1) and (2) is equal to 1.234
and 1.439 respectively and is highly significant. This means that there is an important premium
for banks which request an individual rating once controlling for other rating determinants. For
the control variables, the results appear to be standard. For example, loan loss provisions/net
interest revenue and net loans/total assets negatively impact individual ratings, while higher
values of the return on assets, the banking and finance score, the high disclosure dummy, and the
bank ownership dummy are associated with higher individual ratings (but only in the first
specification for the latter variable). Other variables common to both specifications as well as the
variables added in the second specification are not significant at the 95% confidence level. The
statistics at the bottom of the table also indicate that the two specifications have similar
prediction rates and classify about one-third of banks in the correct rating category and about
one-half in the rating category immediately above or below the actual rating. Since the variables

18
added in specification (2) are not significant, I work only with the variables included in
specification (1) from now on.16
5.2. Endogenous switching regression model
The coefficient of the solicited rating dummy in Table 4 suggests that there is an important
difference between the rating of banks which ask for a rating and those which do not. This result
confirms the findings of some of the studies reviewed in the introduction. However, as noted
earlier, ordinary least squares may overestimate the impact of the treatment if banks which
request a rating are positively self-selected. Moreover, the parameters of the outcome equation
may differ according to whether or not banks have solicited a rating. For these reasons, I proceed
to use the endogenous switching regression model described in Subsection 4.2. Given the low
number of observations in the solicited group (54) with respect to the number of explanatory
variables (9), the system formed by equations (2)-(3) and (4)-(5) is estimated without equity/total
assets and the bank ownership dummy on the right-hand side of each equation.17
For identification purposes, the selection equation must include at least one variable that
affects the decision to ask for an individual rating but not the rating itself (see, e.g., Sartori,
2003). The variable which enters the selection equation but not the outcome equations is the
long-term debt rating dummy, which is equal to one if the bank had a long-term debt rating from
Fitch before it obtained an individual rating and zero otherwise. The long-term debt rating
dummy is used as an exclusion restriction because banks which first obtained a long-term rating
should be more likely to have subsequently asked and paid for an individual rating if they were
satisfied with Fitch’s rating services (note that this is true irrespective of whether the long-term
16 Note that a Chow test does not reject the null hypothesis that the coefficients of the explanatory variables (exceptthe constant and the high disclosure dummy) are the same in the solicited and unsolicited groups (test statistic =1.08, p-value = 0.38). The test of the first part of the public disclosure hypothesis is based on a regression whichassumes different intercepts and coefficients of the high disclosure dummy in both groups (see Subsection 5.3).17 Both variables were removed because neither of them is significant at the 95% confidence level in Table 4. Noneof the main results of Table 5 are affected if I use the full list of variables instead.
19
rating was solicited or not). At the same time, it is unlikely that having a long-term debt rating
would influence the level of the individual rating.
[Insert Table 5 about here]
Table 5 reports the results of the endogenous switching regression model. The first column
shows the results of the selection equation, while the last two columns show the results of the
outcome equations. For consistency with the 2SLS results in Table 4, I report results where the
high disclosure dummy has been instrumented before performing the maximum-likelihood
estimation suggested in Greene (1995). As in Table 4, the instruments for the high disclosure
dummy consist of the other exogenous variables and country dummies (one for all but one
country to avoid perfect collinearity). Bootstrapped t-statistics are in parentheses.
Looking at the selection equation, the results indicate that banks located in countries with
open banking and financial systems are more likely to request an individual rating ceteris
paribus. Consistent with the intuition developed above, the long-term debt rating dummy is also
significant, though only marginally (t-test = 1.94, with associated probability = 0.05).
The results of the outcome equations are as follows. First, two explanatory variables are
significant in the solicited and unsolicited ratings groups but only one (the banking and finance
score) is common to both groups. These variables have the expected sign, i.e., higher values of
return on assets, the banking and finance score and the high disclosure dummy increase the
individual rating of banks.
Second, the average treatment effect (ATE), which measures the average gain from soliciting
a rating for a randomly chosen bank, was obtained by estimating equation (10). This effect is
equal to 2.014 and is significantly different from zero at the 95% level (the bootstrap percentile
confidence interval is [0.253; 3.305]).
Third, an F-test of the null hypothesis that the sample selection terms 1 1 2 2andu u are
jointly insignificant was performed. The value of the test statistic is 0.66 with an associated
probability of 0.42, meaning that one cannot reject the null hypothesis that both terms are equal
20
to zero and that there is no selection bias in bank individual ratings. Thus, the results in Table 5
do not support the self-selection hypothesis.
Finally, a Chow test of the null hypothesis that the coefficients of individual rating
determinants (except the constant and the high disclosure dummy) are the same in the solicited
and unsolicited groups was carried out. The value of the test statistic is 0.78 with an associated
probability of 0.58, meaning that one cannot reject the null hypothesis that the coefficients of the
six rating determinants considered are identical in both groups and that the endogenous
switching regression model is less efficient than a treatment effect model. Therefore, I estimated
a treatment effect model, the results of which confirm the existence of a significant difference
between solicited and unsolicited ratings (+ 2.261) and the absence of any sample selection bias
in bank individual ratings.
To sum up, the ordinary least squares regression and the endogenous switching regression
model both find a positive and significant difference between solicited and unsolicited ratings.
However, the endogenous switching regression model fails to provide evidence for a sample
selection problem in bank individual ratings. There is thus no evidence that that this model is
more appropriate than equation (1) to study the determinants of bank ratings. For this reason, I
rely on the latter specification to test the public disclosure hypothesis.
5.3. Test of the public disclosure hypothesis
The public disclosure hypothesis consists of two predictions: (i) disclosure of public
information has only an impact on the rating of banks which choose not to be rated; (ii) a high
enough amount of public information eliminates the difference between solicited and unsolicited
ratings. Together with (i), (ii) implies that high disclosure banks which have not solicited a rating
and low disclosure banks which have solicited a rating do not receive a lower rating than high

21
disclosure banks with a solicited rating. However, low disclosure banks which do not solicit a
rating do receive a lower rating than the latter group of banks.
There are reasons to believe that these predictions might well hold. First, the results of the
endogenous switching regression clearly show that the high disclosure dummy is significant in
the unsolicited group and insignificant in the solicited group. Second, Table 6 shows the results
of an experiment which divides the sample into two groups of banks, those with a Z-score below
or equal to the sample median (5.5) and those with a Z-score above.18 The aim of this experiment
is to look at the effect of solicitation status and disclosure on bank ratings while simultaneously
controlling for credit risk, i.e. the main determinant of credit ratings. The Z-score, which can be
seen as an accounting-based measure of distance-to-default, is a well-used measure of credit risk
in the banking literature.
[Insert Table 6 about here]
The results for banks with a Z-score below or equal to the median (i.e., those with relatively
high credit risk) are clearly supportive of the disclosure hypothesis. First, disclosure appears to
play only a role in the unsolicited group. Second, low disclosure banks with an unsolicited rating
receive significantly lower ratings than the other three groups of banks. The results for banks
with a Z-score above the median are more mixed. On the one hand, low disclosure banks with a
solicited rating and high disclosure banks with an unsolicited rating receive comparable ratings.
On the other hand, high disclosure banks with a solicited rating receive ratings above these two
groups of banks. Also, disclosure appears to matter both in the solicited and unsolicited groups.
Two characteristics of the high disclosure banks with a solicited rating and a Z-score above
the median may explain the latter results, which contradict the disclosure hypothesis. First, banks
in this group are mostly located in countries with higher banking and finance scores than the
18 Following Mercieca et al. (2007) and others, the Z-score of banks is calculated as Z = (ROA + EA) / SD (ROA),where ROA is the average return on assets, EA is the average equity to assets ratio and SD (ROA) is the standarddeviation of the return on assets. All three variables are based on the same number of years (either 5 years, from1999 to 2003, or 3 years, from 2001 to 2003). The Z-score thus measures the number of standard deviations belowthe mean by which bank profits would have to fall just to deplete equity capital.

22
other three groups of banks. Second, these banks tend to exhibit much lower loan loss provisions
as a percentage of net interest revenue than the rest of the sample. Given that the banking and
finance score and loan loss provisions/net interest revenue have a significant impact on credit
ratings (see Tables 4 and 5) but that these variables are not included in the Z-score, Table 6
should thus only be seen as a preliminary attempt to isolate the impact of solicitation status and
disclosure from the other determinants of bank individual ratings. A more systematic
econometric analysis is needed to assess the independent effect of each variable on credit ratings
and is therefore undertaken in the remainder of this section.
The two predictions made by the public disclosure hypothesis are formally tested using
equations (11) and (12), which control for a wider range of bank characteristics than those
included in the Z-score:
1 2 3( )i i i i i i
i
Rating = X Unsolicited + High disclosure + Unsolicited × High disclosure(11)
54
6
( ) ( )( )
i i i i i i
i i i
Rating = X Unsolicited × High disclosure + Unsolicited × Low disclosureSolicited × Low disclosure + (12)
where Unsolicitedi is a dummy variable equal to (1 - Solicitedi) and Low disclosurei is a dummy
variable equal to (1 - High disclosurei).
If the first prediction holds, we should observe that 2 = 0 and 2 + 3 > 0 in equation (11). If
the second prediction is true, we should have that 5 < 0 and 4 = 6 = 0 in equation (12).
Both equations are estimated by ordinary least squares and by two-stage least squares to
account for the potential endogeneity of equity/total assets and any interaction variable involving
the high (or low) disclosure dummy.19 As in Tables 4 and 5, the instruments consist of all other
exogenous variables in each equation and country dummies (one for all but one country to avoid
perfect collinearity). Since a Durbin-Wu-Hausman test rejects the null hypothesis that OLS
19 Specifically, the following variables are instrumented (in addition to equity/total assets): High disclosure dummyand (Unsolicited rating dummy High disclosure dummy) in equation (11); (Unsolicited rating dummy Highdisclosure dummy), (Unsolicited rating dummy Low disclosure dummy) and (Solicited rating dummy Lowdisclosure dummy) in equation (12).

23
delivers consistent parameter estimates in equations (11) and (12) - the values of the test statistic
are 15.28 and 27.62, both with an associated probability of 0.00 -, the discussion of Table 7 is
based on the 2SLS results.
[Insert Table 7 about here]
Looking at Table 7, the estimated coefficients of the first seven explanatory variables (from
loan loss provisions/net interest revenue to the bank ownership dummy) are close to those shown
in Table 4, though slightly less significant. This result is not surprising given that equations (11)
and (12) are relatively similar to equation (1). I now turn to the test of the two predictions made
by the public disclosure hypothesis.
In equation (11) estimated by 2SLS, one cannot reject the null hypothesis that disclosure
does not have any impact on the rating of banks in the solicited group ( 2 = 0). However, one is
able to reject the null that disclosure has no impact on the rating of banks in the unsolicited group
( 2 + 3 = 0). Indeed, in the latter case, the sum of both coefficients (2.47) is positive and
significantly different from zero (F-test = 16.35, with associated probability = 0.00). This result,
which is consistent with the results of the endogenous switching regression model, is in line with
the first prediction made by the public disclosure hypothesis.
In equation (12) estimated by 2SLS, one is able to reject the null hypothesis that the rating of
low disclosure banks which do not request a rating is identical to the rating of high disclosure
banks with a solicited rating ( 5 = 0). However, one is unable to reject the null that the rating of
high disclosure banks with an unsolicited rating and the rating of low disclosure banks with a
solicited rating is identical to the rating of high disclosure banks with a solicited rating ( 4 = 6 =
0).20 This finding is consistent with the second prediction made by the public disclosure
hypothesis.
Finally, a question is whether the above results are transferable to banks located outside Asia.
The appendix shows the results of equations (11) and (12) estimated on a sample of bank long-
20 As shown at the bottom of Table 7, the F-test of joint significance has a value of 1.85 (p-value = 0.16).

24
term debt ratings assigned across Asia, Europe, Africa and Latin America by S&P as of 31
January 2004 (the sample, which includes banks from 18 countries, is similar to that used in
Poon, 2003b).21 Results of preliminary regressions (not reported here) confirm the existence of a
significant difference between S&P’s solicited and unsolicited bank ratings: all else being equal,
the former tend to be higher than the latter by 1.5 notches on average on a 1 to 20 rating scale.
The results shown in the appendix (2SLS regressions) indicate that the public disclosure
hypothesis might well account for this difference. First, the high disclosure dummy is only
significant in the unsolicited group. Second, low disclosure banks with unsolicited ratings
receive ratings which are significantly lower than those of the three other groups of banks. Both
results, however, are only significant at the 90% confidence level.
6. Conclusion
This paper investigates whether there is a difference between solicited and unsolicited bank
ratings and, if so, why. It is based on a somewhat smaller sample of credit ratings (assigned by
Fitch to Asian banks) than some of the existing studies. However, and contrary to most of them,
it distinguishes clearly between solicited and unsolicited ratings in the analysis. The results show
that unsolicited bank ratings tend to be lower than solicited ones after controlling for observable
bank characteristics. The difference between both types of ratings is economically significant as
it averages 1.2 notches on a 1 to 9 rating scale.
The existence of a difference between solicited and unsolicited ratings has already been
documented for other credit rating agencies. While some issuers believe that such a difference is
due to the fact that credit rating agencies attempt to force them to pay for a solicited rating,
several alternative explanations are consistent with it. For instance, better-quality issuers may
21 This sample is smaller than the one based on Fitch's ratings. It is not possible to estimate a regression on acombined sample of S&P and Fitch ratings because explanatory variables may vary from one rating agency to theother.

25
request a rating or, alternatively, unsolicited ratings may be more conservative than solicited
ones since they do not involve the disclosure of non-public information.
In contrast to some previous contributions on the differences between solicited and
unsolicited ratings, this paper explicitly controls for potential sample selection by using an
endogenous switching regression model to test whether better-quality banks self-select into the
solicited group (self-selection hypothesis). Although the analysis does find a significant
difference between solicited and unsolicited ratings, no evidence is found in favour of the sample
selection hypothesis.
The paper also tests whether Fitch assigns different weights across solicited and unsolicited
groups to observable bank characteristics and in particular to the amount of public information
released by banks. After showing that information disclosure has only an impact on the rating of
banks which do not request one (first part of the disclosure hypothesis), the paper tests whether
the difference between solicited and unsolicited ratings disappears for banks with unsolicited
ratings but which disclose a high enough amount of public information (second part of the public
disclosure hypothesis). Support is found for this: high disclosure banks which have not asked to
be rated receive ratings that are not significantly different from the ratings of banks which have
asked to be rated.
The above-mentioned findings are interesting for three reasons at least. First, as mentioned in
Section 2, possible measures concerning the use of unsolicited ratings are being considered at the
European and U.S. levels. The results of this study support additional measures designed to
clarify the differences between solicited and unsolicited ratings. For instance, it should be
required that credit rating agencies clearly label unsolicited ratings as such in their regular
publications and that they make the characteristics and limitations of this type of ratings
transparent to the public.
Second, national supervisory authorities dealing with the implementation of the Basel II
framework have recently decided on the eligibility of unsolicited ratings for risk-weighting

26
purposes by banks. While some countries have decided to allow the conditional use of
unsolicited ratings in their jurisdiction, others have decided to forbid them. The results of this
paper, which show that credit rating agencies are simply more conservative in the absence of
non-public information, may help supervisors to reassess their decision in the future.
Third, one of the main objectives of Basel II is to increase public disclosure by banks. It is
therefore necessary that financial institutions understand the need for more disclosure and move
in this direction on their own. This paper provides an incentive for bank managers to disclose
information as it documents the impact of public disclosure on credit ratings and on the relation
between soliciting a rating and the actual rating outcome. Public disclosure not only appears to
have a positive effect on the credit rating of banks which choose not to be rated, but it also seems
to eliminate the downward bias of unsolicited ratings.
Finally, it is worth stressing once again that the credit ratings used in this study are assigned
to banks located in Asia. Although this caveat implies that the policy recommendations should
be interpreted with care, the fact that the public disclosure hypothesis seems to hold for a more
international sample suggests that the results could well carry over.
27
References
Akhigbe, A., Martin, A.D. (2006). Valuation impact of Sarbanes-Oxley: evidence from
disclosure and governance within the financial services industry. Journal of Banking and
Finance 30: 989-1006.
Baek, J.-S., Kang, J.-K., Park, K.S. (2004). Corporate governance and firm value: evidence from
the Korean financial crisis. Journal of Financial Economics 71: 265-313.
Bannier, C.E., Behr, P., Güttler, A. (2007). Why are unsolicited ratings lower than solicited
ratings? A theoretical and empirical assessment. Unpublished working paper, Goethe
University.
Baumann, U., Nier, E. (2004). Disclosure, volatility, and transparency: an empirical investigation
into the value of bank disclosure. Economic Policy Review 10, 31-45. Federal Reserve Bank
of New York, New York, NY.
Behr, P., Güttler, A. (2008). The informational content of unsolicited ratings. Journal of Banking
and Finance 32: 587-599.
Butler, A.W., Rodgers, K.J. (2003). Relationship rating: how do bond rating agencies process
information? Unpublished working paper, Pennsylvania State University.
Cantor, R., Packer, F. (1997). Differences of opinion and selection bias in the credit rating
industry. Journal of Banking and Finance 21: 1395-1417.

28
Committee of European Securities Regulators (2008). CESR’s second report to the European
Commission on the compliance of credit rating agencies with the IOSCO code and the role
of credit rating agencies in structured finance. CESR, Paris.
Fight, A. (2001). The ratings game, John Wiley & Sons, England.
Fitch Ratings (2001). Fitch introduces shadow individual ratings. Financial institutions special
report. Fitch, London.
Fitch Ratings (2004). Bank rating methodology. Criteria report. Fitch, London.
Fitch Ratings (2005). Rating initiation and participation disclosure. Credit policy special report.
Fitch, London.
Fitch Ratings (2006). Unsolicited ratings and Basel II. Fitch, London.
Gan, Y. (2004). Why do firms pay for bond ratings when they can get them for free?
Unpublished working paper, The Wharton School, University of Pennsylvania.
Golin, J. (2001). The bank credit analysis handbook: a guide for analysts, bankers and investors.
John Wiley & Sons (Asia) Pte Ltd.
Greene, W. (1995). Limdep user’s manual (version 7.0). Econometric Software Inc, New York,
NY.
Heckman, J. (1979). Sample selection as a specification error. Econometrica 47: 153-162.
Heritage Foundation (2007). Index of economic freedom. Washington, DC.

29
Hill, C.A. (2004). Regulating the rating agencies. American Law & Economics Association
Annual Meetings.
Iannotta, G. (2006). Testing for opaqueness in the European banking industry: evidence from
bond credit ratings. Journal of Financial Services Research 30: 287-309.
International Organization of Securities Commissions (2003). Report on the activities of credit
rating agencies. IOSCO, Madrid.
International Organization of Securities Commissions (2004a). Code of conduct fundamentals
for credit rating agencies. IOSCO, Madrid.
International Organization of Securities Commissions (2004b). Fitch’s comments on the draft
code of conduct fundamentals for credit rating agencies. IOSCO, Madrid.
Jorion, P., Liu, Z., Shi, C. (2005). Informational effects of regulation FD: evidence from rating
agencies. Journal of Financial Economics 76: 309-330.
Mercieca, S., Schaeck, K., Wolfe, S. (2007). Small European banks: Benefits from
diversification? Journal of Banking and Finance 31: 1975-1998.
Mitton, T. (2002). A cross-firm analysis of the impact of corporate governance on the East Asian
financial crisis. Journal of Financial Economics 64: 215-241.
Moody’s Investors Service (2006). Report on the code of professional conduct. Moody’s, New
York, NY.
30
Morgan, D. (2002). Rating banks: risk and uncertainty in an opaque industry. American
Economic Review 92: 874-888.
Pasiourias, F., Gaganis, C., Doumpos, M. (2007). A multicriteria discrimination approach for the
credit rating of Asian banks. Annals of Finance 3: 351-367.
Poon, W. (2003a). Are unsolicited credit ratings biased downward? Journal of Banking and
Finance 27: 593-614.
Poon, W. (2003b). Are unsolicited bank ratings lower after controlling for financial and
sovereign risk? Unpublished working paper, Lingnan University, Hong Kong.
Poon, W., Firth, M. (2005). Are unsolicited credit ratings lower? International evidence from
bank ratings. Journal of Business Finance & Accounting 32: 1741-1761.
Poon, W., Lee, J., Gup, B. (2007). Do solicitations matter in bank credit ratings? Results from a
study of 72 countries. Unpublished working paper.
Sartori, A. (2003). An estimator for some binary-outcome selection models without exclusion
restrictions. Political Analysis 11: 111-138.
Securities and Exchange Commission (2005). Regulatory issues and economic principles. SEC,
Washington, DC.
Securities and Exchange Commission (2007). Oversight of credit rating agencies registered as
nationally recognized statistical rating organizations; final rule. SEC, Washington, DC.
31
Shimoda, N., Yuko, K. (2007). Credit rating gaps in Japan: differences between solicited and
unsolicited ratings, and "rating splits". Working paper # 7-E-11, Bank of Japan, Tokyo.
U.S. Congress (2006). Credit Rating Agency Reform Act of 2006. U.S. Government Printing
Office, Washington, DC.
Wall Street Journal (2004). Credit raters’ tactics in pursuing new work frustrate companies, 25
November.
Yu, F. (2005). Accounting transparency and the term structure of credit spreads. Journal of
Financial Economics 75: 53-84.
32
Table 1Distribution of bank individual ratings by country
Country Solicited Unsolicited Total
# % # % # %
Bangladesh 1 0.6 5 3.0 6 3.6China 1 0.6 15 8.9 16 9.5Hong Kong 7 4.1 11 6.5 18 10.7India 3 1.8 29 17.2 32 18.9Indonesia 8 4.7 4 2.4 12 7.1Macau 9 5.3 3 1.8 12 7.1Malaysia 2 1.2 1 0.6 3 1.8Philippines 6 3.6 5 3.0 11 6.5South Korea 6 3.6 7 4.1 13 7.7Taiwan 20 11.8 19 11.2 39 23.1Vietnam 1 0.6 6 3.6 7 4.1Total 64 37.9 105 62.1 169 100
The sample consists of 169 bank individual ratings assigned by Fitch. Ratings are as of 31 January 2004,and come from Bankscope and Fitch Research. Only those countries that have both solicited andunsolicited bank individual ratings are included in the sample.
33
Table 2Distribution of bank individual ratings by rating level
Interpretation Solicited Unsolicited TotalIndividualrating # % # % # %
A A very strong bank - - - - - - A / B 1 0.6 1 0.6 2 1.2 B A strong bank 2 1.2 0 0.0 2 1.2 B / C 9 5.3 5 3.0 14 8.3 C An adequate bank 17 10.1 14 8.3 31 18.3 C / D 11 6.5 14 8.3 25 14.8 D A bank with weaknesses 17 10.1 23 13.6 40 23.7 D / E 4 2.4 24 14.2 28 16.6 E A bank with serious problems 3 1.8 24 14.2 27 16.0 Total 64 37.9 105 62.1 169 100
The sample consists of 169 bank individual ratings assigned by Fitch. Ratings are as of 31 January 2004,and come from Bankscope and Fitch Research.
34
Table 3 Descriptive statistics of bank characteristics
Variable Definition Obs. Mean SD Min. Max.
Loan loss provisions/Net int. rev. 100 (Loan loss provisions/Net interest revenue) 155 35.36 53.54 -417.51 312.88Net loans/Total assets 100 (Loans/Total assets) 169 50.74 16.97 -0.08 91.43Equity/Total assets 100 (Equity/Total assets) 169 9.29 12.23 -20.17 84.00Return on assets 100 (Net income/Total assets) 169 0.48 1.97 -11.01 7.21Banking and finance score Relative openness of a country’s banking and financial system, between 0
(repressive government) and 100 (negligible government influence)169 49.64 22.20 30 90
Log (total assets) Log of total assets (in billion of U.S. $) 169 15.76 1.58 11.69 20.14Bank ownership dummy 1 if the bank is majority-owned by another bank, 0 otherwise 163 0.16 0.37 0 1State ownership dummy 1 if the bank is majority-owned by the state, 0 otherwise 163 0.27 0.45 0 1Disclosure index
Disclosure index =17
ii=1
1category
21,
where categoryi is equal to 0 if there is no entry in any of thecorresponding sub-categories in Bankscope and 100 otherwise. The 17categories include 7 asset categories, 4 liabilities categories, 4 memo linescategories and 2 income statement categories. See Baumann and Nier(2004) for the exact formula.
169 64.77 12.36 23.81 93.33
High disclosure dummy 169 0.49 0.50 0 11 if disclosure index 50th percentile of the sample distribution ofdisclosure indexes, 0 otherwise
Solicited rating dummy 1 if the bank has a solicited individual rating from Fitch, 0 if it has anunsolicited individual rating
169 0.38 0.49 0 1
Unqualified statement dummy 1 if the bank’s annual accounts have been accepted by the auditorswithout any remark, 0 otherwise
169 0.82 0.25 0 1
Long-term debt rating dummy 1 if the bank had a long-term debt rating from Fitch before it obtained anindividual rating, 0 otherwise
169 0.20 0.40 0 1
Outside rating dummy 1 if the bank had an individual rating from another rating agency before itobtained an individual rating from Fitch, 0 otherwise
169 0.70 0.46 0 1
Z-score Z = (ROA + EA) / SD (ROA), where ROA = average return on assets, EA= average equity to assets ratio and SD (ROA) = standard deviation of thereturn on assets, all measured over a 3- or 5-year period.
150 8.34 16.08 -4.32 172.41
169 0.32 0.47 0 1Unsolicited rating dummy Highdisclosure dummy
Interaction variable
169 0.30 0.46 0 1Unsolicited rating dummy Lowdisclosure dummy
Interaction variable
169 0.17 0.37 0 1Solicited rating dummy Highdisclosure dummy
Interaction variable
169 0.21 0.41 0 1Solicited rating dummy Lowdisclosure dummy
Interaction variable
The sample consists of 169 bank individual ratings assigned by Fitch as of 31 January 2004. All variables come from Bankscope and Fitch Research except the 2003 banking andfinance score, which is from the Heritage Foundation (2007). Variables in the first part of the table were selected according to Fitch’s bank rating methodology (Fitch, 2004).Statistics include number of observations (Obs.), mean (Mean), standard deviation (SD), minimum (Min.) and maximum (Max.) of each variable. Following Fitch (2004), the 5-year average of variables (1999 to 2003) is used if available, the 3-year average (2001 to 2003) if not.
35
Table 4Determinants of bank individual ratings: ordinary least squares and two-stage least squaresregressions
Independent variables Ordinary least squares Two-stage least squares
(1) (2) (1) (2)
Constant 0.923 0.649 -0.293 -0.411(0.70) (0.49) (0.21) (0.29)
Loan loss provisions/Net interest -0.005** -0.006*** -0.005*** -0.006***revenue (2.56) (2.87) (2.63) (2.98)Net loans/Total assets -0.024*** -0.025*** -0.017** -0.020***
(3.21) (3.31) (2.23) (2.61)Equity/Total assets -0.001 -0.013 0.018 0.004
(0.04) (0.47) (0.34) (0.07)
Return on assets 0.335*** 0.357*** 0.307** 0.334**(3.06) (3.36) (2.13) (2.42)
Banking and finance score 0.031*** 0.031*** 0.023*** 0.024***(5.36) (5.34) (3.90) (4.34)
Log (total assets) 0.091 0.122 0.128 0.171*(1.19) (1.43) (1.61) (1.88)
Bank ownership dummy 0.610*** 0.454* 0.697** 0.552*(2.72) (1.90) (2.43) (1.82)
High disclosure dummy 0.519** 0.461** 1.500*** 1.412***(2.37) (2.06) (4.02) (3.87)
Solicited rating dummy 1.185*** 1.148*** 1.234*** 1.439***(5.88) (3.64) (5.67) (3.80)
Unqualified statement dummy - 0.265 - -0.096(0.73) (0.22)
State ownership dummy - -0.477* - -0.404(1.83) (1.50)
Solicited rating dummy Outside - -0.135 - -0.393rating dummy (0.37) (0.90)
Observations 149 149 149 149Adjusted R-squared 0.53 0.54 0.45 0.47Classification accuracy (%): actual - predicted rating = 0 29.5 27.5 30.9 31.5 actual - predicted rating = -1 or 1 55.0 57.7 48.3 46.3 actual - predicted rating -2 or 2 15.4 14.8 20.8 22.2
The dependent variable in each regression is the bank individual rating coded on a 9 (A) to 1 (E) scale. The firsttwo columns report ordinary least squares estimates which treat equity/total assets and the high disclosuredummy as exogenous. The last two columns report two-stage least squares estimates obtained by instrumentingequity/total assets and the high disclosure dummy with all other exogenous variables and country dummies (onefor all but one country to avoid perfect collinearity). Robust t-statistics are in parentheses; * significant at 10%;** significant at 5%; *** significant at 1%.
Durbin-Wu-Hausman chi-sq test (H0: regressors are exogenous): Specification (1): test statistic = 8.15 chi-sq(2), p-value = 0.02 Specification (2): test statistic = 6.72 chi-sq(2), p-value = 0.03Chow test (H0: all regressors but the constant and the high disclosure dummy are identical across groups): Two-stage least squares, specification (1): test statistic = 1.08 F(7,131), p-value = 0.38

36
Table 5Determinants of bank individual ratings: endogenous switching regression model
Independent variables Selection equation Outcome equations
Unsolicited Solicited
Constant -0.679 2.075** 3.750***(0.82) (2.45) (3.91)
Loan loss provisions/Net interest 0.006 -0.005 -0.008revenue (1.57) (0.79) (1.21)
Net loans/Total assets -0.010 -0.023 -0.003(1.27) (1.63) (0.15)
Return on assets -0.074 0.281 0.425***(0.84) (1.04) (3.35)
Banking and finance score 0.013*** 0.022*** 0.022*(2.11) (2.73) (1.89)
Bank ownership dummy -0.047 0.550* 0.861**(0.01) (1.71) (2.01)
High disclosure dummy -0.298 1.955*** 0.630(0.61) (3.26) (0.87)
Long-term debt rating dummy 1.212* - -(1.94)
Standard deviation ( 1) = 1 - 1.065*** -(7.85)
Correlation ( 1, u) = 1u - 0.056 -(0.12)
Standard deviation ( 2) = 2 - - 1.285***(7.15)
Correlation ( 2, u) = 2u - - -0.689(1.58)
Observations 149 95 54Pseudo (sel.) / Adjusted (out.) R-squared 0.13 0.43 0.40Classification accuracy (%) - Selection:correctly classified 71.8 - -Classification accuracy (%) - Outcome:actual - predicted rating = 0 - 36.8 25.9actual - predicted rating = -1 or 1 - 44.2 57.4actual - predicted rating -2 or 2 -
----18.9 16.7
The table reports the results of the endogenous switching regression model. The first column shows the results of theselection equation where the dependent variable is the solicited individual rating dummy (1 if solicited, 0 otherwise).The last two columns show the results of the outcome equations where the dependent variable is the bank individualrating code on a 9 (A) to 1 (E) scale. Results were obtained by instrumenting the high disclosure dummy beforeperforming the maximum-likelihood estimation suggested in Greene (1995). The instruments for the high disclosuredummy consist of all other exogenous variables and country dummies (one for all but one country to avoid perfectcollinearity). Bootstrapped t-statistics are in parentheses; * significant at 10%; ** significant at 5%; *** significant at1%.
F-test (H0: 1u 1 = 2u 2 = 0): Outcome equations: test statistic = 0.66 F(1,133), p-value = 0.42Chow test (H0: all regressors but the constant and the high disclosure dummy are identical across groups): Outcome equations: test statistic = 0.78 F(6,133), p-value = 0.58

37
Table 6Average bank individual rating across groups of banks (number of observations inparenthesis)
Type of bank Z-score median Z-score > median Outcome equationsSolicited rating, high disclosure (SH) 3.5 (14) 5.7 (14)Solicited rating, low disclosure (SL) 3.5 (13) 4.2 (14)Unsolicited rating, high disclosure (UH) 3.0 (29) 4.0 (14)Unsolicited rating, low disclosure (UL) 2.1 (19) 2.8 (23)
The table shows the average individual rating of four groups of banks (SH, SL, UH and UL) split up into twocategories: those with a Z-score below or equal to the median (5.5) and those with a Z-score above. The Z-scoremeasures the number of standard deviations below the mean by which bank profits would have to fall just todeplete equity capital.
Wilcoxon rank-sum test:
Z-score median H0: SH = SL, test-statistic = -0.05 N(0,1), p-value = 0.96 H0: SH = UH, test-statistic = -1.25 N(0,1), p-value = 0.21 H0: UH = UL, test-statistic = -2.32 N(0,1), p-value = 0.02
Z-score > median H0: SH = SL, test-statistic = -3.19 N(0,1), p-value = 0.00 H0: SH = UH, test-statistic = -3.04 N(0,1), p-value = 0.00 H0: UH = UL, test-statistic = -2.36 N(0,1), p-value = 0.02
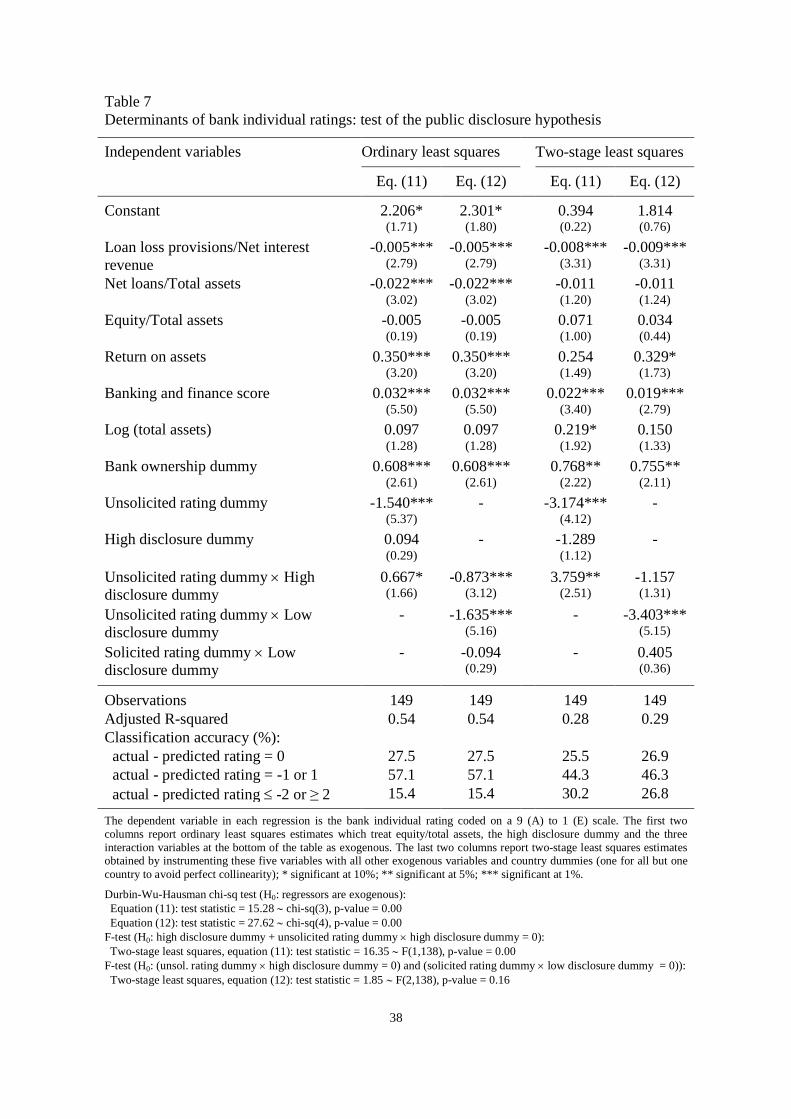
38
Table 7Determinants of bank individual ratings: test of the public disclosure hypothesis
Independent variables Ordinary least squares Two-stage least squares
Eq. (11) Eq. (12) Eq. (11) Eq. (12)
Constant 2.206* 2.301* 0.394 1.814(1.71) (1.80) (0.22) (0.76)
Loan loss provisions/Net interest -0.005*** -0.005*** -0.008*** -0.009***revenue (2.79) (2.79) (3.31) (3.31)Net loans/Total assets -0.022*** -0.022*** -0.011 -0.011
(3.02) (3.02) (1.20) (1.24)Equity/Total assets -0.005 -0.005 0.071 0.034
(0.19) (0.19) (1.00) (0.44)
Return on assets 0.350*** 0.350*** 0.254 0.329*(3.20) (3.20) (1.49) (1.73)
Banking and finance score 0.032*** 0.032*** 0.022*** 0.019***(5.50) (5.50) (3.40) (2.79)
Log (total assets) 0.097 0.097 0.219* 0.150(1.28) (1.28) (1.92) (1.33)
Bank ownership dummy 0.608*** 0.608*** 0.768** 0.755**(2.61) (2.61) (2.22) (2.11)
Unsolicited rating dummy -1.540*** - -3.174*** -(5.37) (4.12)
High disclosure dummy 0.094 - -1.289 -(0.29) (1.12)
Unsolicited rating dummy High 0.667* -0.873*** 3.759** -1.157disclosure dummy (1.66) (3.12) (2.51) (1.31)
Unsolicited rating dummy Low - -1.635*** - -3.403***disclosure dummy (5.16) (5.15)
Solicited rating dummy Low - -0.094 - 0.405disclosure dummy (0.29) (0.36)
Observations 149 149 149 149Adjusted R-squared 0.54 0.54 0.28 0.29Classification accuracy (%): actual - predicted rating = 0 27.5 27.5 25.5 26.9 actual - predicted rating = -1 or 1 57.1 57.1 44.3 46.3 actual - predicted rating -2 or 2 15.4 15.4 30.2 26.8
The dependent variable in each regression is the bank individual rating coded on a 9 (A) to 1 (E) scale. The first twocolumns report ordinary least squares estimates which treat equity/total assets, the high disclosure dummy and the threeinteraction variables at the bottom of the table as exogenous. The last two columns report two-stage least squares estimatesobtained by instrumenting these five variables with all other exogenous variables and country dummies (one for all but onecountry to avoid perfect collinearity); * significant at 10%; ** significant at 5%; *** significant at 1%.
Durbin-Wu-Hausman chi-sq test (H0: regressors are exogenous): Equation (11): test statistic = 15.28 chi-sq(3), p-value = 0.00 Equation (12): test statistic = 27.62 chi-sq(4), p-value = 0.00F-test (H0: high disclosure dummy + unsolicited rating dummy high disclosure dummy = 0): Two-stage least squares, equation (11): test statistic = 16.35 F(1,138), p-value = 0.00F-test (H0: (unsol. rating dummy high disclosure dummy = 0) and (solicited rating dummy low disclosure dummy = 0)): Two-stage least squares, equation (12): test statistic = 1.85 F(2,138), p-value = 0.16
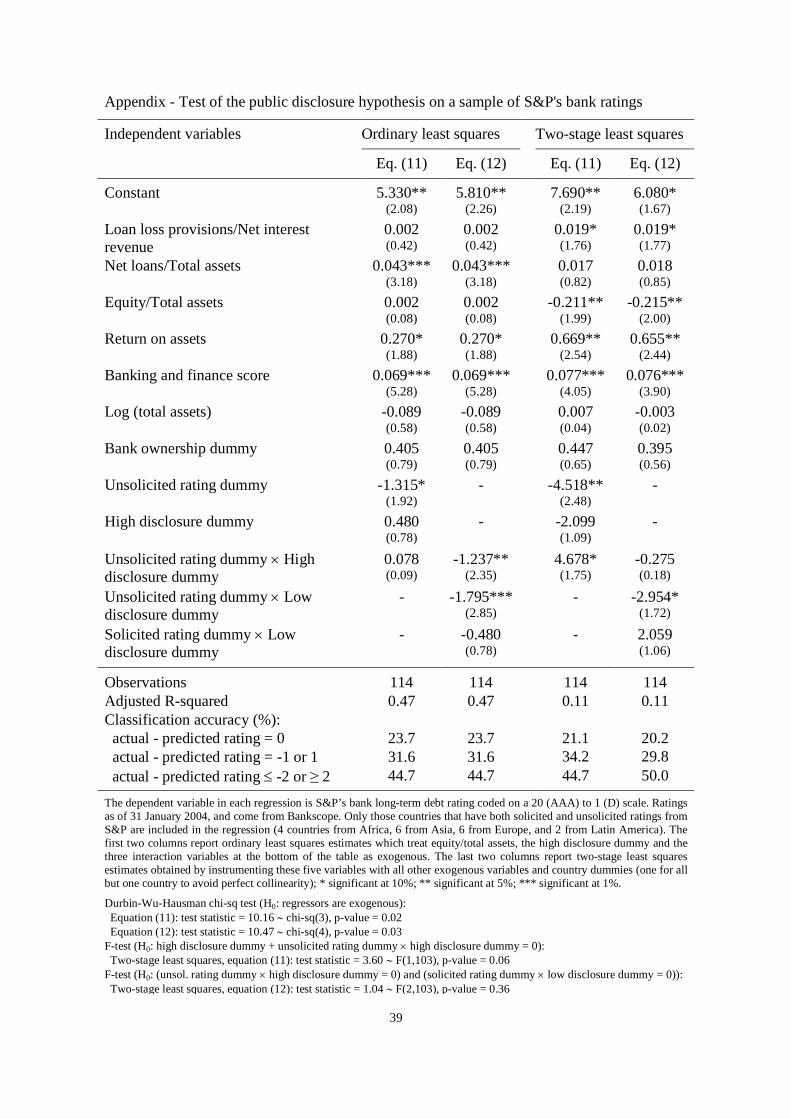
39
Appendix - Test of the public disclosure hypothesis on a sample of S&P's bank ratings
Independent variables Ordinary least squares Two-stage least squares
Eq. (11) Eq. (12) Eq. (11) Eq. (12)
Constant 5.330** 5.810** 7.690** 6.080*(2.08) (2.26) (2.19) (1.67)
Loan loss provisions/Net interest 0.002 0.002 0.019* 0.019*revenue (0.42) (0.42) (1.76) (1.77)Net loans/Total assets 0.043*** 0.043*** 0.017 0.018
(3.18) (3.18) (0.82) (0.85)Equity/Total assets 0.002 0.002 -0.211** -0.215**
(0.08) (0.08) (1.99) (2.00)Return on assets 0.270* 0.270* 0.669** 0.655**
(1.88) (1.88) (2.54) (2.44)
Banking and finance score 0.069*** 0.069*** 0.077*** 0.076***(5.28) (5.28) (4.05) (3.90)
Log (total assets) -0.089 -0.089 0.007 -0.003(0.58) (0.58) (0.04) (0.02)
Bank ownership dummy 0.405 0.405 0.447 0.395(0.79) (0.79) (0.65) (0.56)
Unsolicited rating dummy -1.315* - -4.518** -(1.92) (2.48)
High disclosure dummy 0.480 - -2.099 -(0.78) (1.09)
Unsolicited rating dummy High 0.078 -1.237** 4.678* -0.275disclosure dummy (0.09) (2.35) (1.75) (0.18)
Unsolicited rating dummy Low - -1.795*** - -2.954*disclosure dummy (2.85) (1.72)
Solicited rating dummy Low - -0.480 - 2.059disclosure dummy (0.78) (1.06)
Observations 114 114 114 114Adjusted R-squared 0.47 0.47 0.11 0.11Classification accuracy (%): actual - predicted rating = 0 23.7 23.7 21.1 20.2 actual - predicted rating = -1 or 1 31.6 31.6 34.2 29.8 actual - predicted rating -2 or 2 44.7 44.7 44.7 50.0
The dependent variable in each regression is S&P’s bank long-term debt rating coded on a 20 (AAA) to 1 (D) scale. Ratingsas of 31 January 2004, and come from Bankscope. Only those countries that have both solicited and unsolicited ratings fromS&P are included in the regression (4 countries from Africa, 6 from Asia, 6 from Europe, and 2 from Latin America). Thefirst two columns report ordinary least squares estimates which treat equity/total assets, the high disclosure dummy and thethree interaction variables at the bottom of the table as exogenous. The last two columns report two-stage least squaresestimates obtained by instrumenting these five variables with all other exogenous variables and country dummies (one for allbut one country to avoid perfect collinearity); * significant at 10%; ** significant at 5%; *** significant at 1%.
Durbin-Wu-Hausman chi-sq test (H0: regressors are exogenous): Equation (11): test statistic = 10.16 chi-sq(3), p-value = 0.02 Equation (12): test statistic = 10.47 chi-sq(4), p-value = 0.03F-test (H0: high disclosure dummy + unsolicited rating dummy high disclosure dummy = 0): Two-stage least squares, equation (11): test statistic = 3.60 F(1,103), p-value = 0.06F-test (H0: (unsol. rating dummy high disclosure dummy = 0) and (solicited rating dummy low disclosure dummy = 0)):Two-stage least squares, equation (12): test statistic = 1.04 F(2,103), p-value = 0.36

NBB WORKING PAPER No. 79 - FEBRUARY 2006 41
NATIONAL BANK OF BELGIUM - WORKING PAPERS SERIES
1. "Model-based inflation forecasts and monetary policy rules" by M. Dombrecht and R. Wouters, Research Series, February 2000.
2. "The use of robust estimators as measures of core inflation" by L. Aucremanne, Research Series, February 2000.
3. "Performances économiques des Etats-Unis dans les années nonante" by A. Nyssens, P. Butzen, P. Bisciari, Document Series, March 2000.
4. "A model with explicit expectations for Belgium" by P. Jeanfils, Research Series, March 2000. 5. "Growth in an open economy: some recent developments" by S. Turnovsky, Research Series, May 2000. 6. "Knowledge, technology and economic growth: an OECD perspective" by I. Visco, A. Bassanini,
S. Scarpetta, Research Series, May 2000. 7. "Fiscal policy and growth in the context of European integration" by P. Masson, Research Series, May
2000. 8. "Economic growth and the labour market: Europe's challenge" by C. Wyplosz, Research Series, May
2000. 9. "The role of the exchange rate in economic growth: a euro-zone perspective" by R. MacDonald,
Research Series, May 2000. 10. "Monetary union and economic growth" by J. Vickers, Research Series, May 2000. 11. "Politique monétaire et prix des actifs: le cas des Etats-Unis" by Q. Wibaut, Document Series, August
2000. 12. "The Belgian industrial confidence indicator: leading indicator of economic activity in the euro area?" by
J.J. Vanhaelen, L. Dresse, J. De Mulder, Document Series, November 2000. 13. "Le financement des entreprises par capital-risque" by C. Rigo, Document Series, February 2001. 14. "La nouvelle économie" by P. Bisciari, Document Series, March 2001. 15. "De kostprijs van bankkredieten" by A. Bruggeman and R. Wouters, Document Series, April 2001. 16. "A guided tour of the world of rational expectations models and optimal policies" by Ph. Jeanfils,
Research Series, May 2001. 17. "Attractive Prices and Euro - Rounding effects on inflation" by L. Aucremanne and D. Cornille,
Documents Series, November 2001. 18. "The interest rate and credit channels in Belgium: an investigation with micro-level firm data" by
P. Butzen, C. Fuss and Ph. Vermeulen, Research series, December 2001. 19 "Openness, imperfect exchange rate pass-through and monetary policy" by F. Smets and R. Wouters,
Research series, March 2002. 20. "Inflation, relative prices and nominal rigidities" by L. Aucremanne, G. Brys, M. Hubert, P. J. Rousseeuw
and A. Struyf, Research series, April 2002. 21. "Lifting the burden: fundamental tax reform and economic growth" by D. Jorgenson, Research series,
May 2002. 22. "What do we know about investment under uncertainty?" by L. Trigeorgis, Research series, May 2002. 23. "Investment, uncertainty and irreversibility: evidence from Belgian accounting data" by D. Cassimon,
P.-J. Engelen, H. Meersman, M. Van Wouwe, Research series, May 2002. 24. "The impact of uncertainty on investment plans" by P. Butzen, C. Fuss, Ph. Vermeulen, Research series,
May 2002. 25. "Investment, protection, ownership, and the cost of capital" by Ch. P. Himmelberg, R. G. Hubbard,
I. Love, Research series, May 2002. 26. "Finance, uncertainty and investment: assessing the gains and losses of a generalised non-linear
structural approach using Belgian panel data", by M. Gérard, F. Verschueren, Research series, May 2002.
27. "Capital structure, firm liquidity and growth" by R. Anderson, Research series, May 2002. 28. "Structural modelling of investment and financial constraints: where do we stand?" by J.- B. Chatelain,
Research series, May 2002. 29. "Financing and investment interdependencies in unquoted Belgian companies: the role of venture
capital" by S. Manigart, K. Baeyens, I. Verschueren, Research series, May 2002. 30. "Development path and capital structure of Belgian biotechnology firms" by V. Bastin, A. Corhay,
G. Hübner, P.-A. Michel, Research series, May 2002.
42 NBB WORKING PAPER No. 79 - FEBRUARY 2006
31. "Governance as a source of managerial discipline" by J. Franks, Research series, May 2002. 32. "Financing constraints, fixed capital and R&D investment decisions of Belgian firms" by M. Cincera,
Research series, May 2002. 33. "Investment, R&D and liquidity constraints: a corporate governance approach to the Belgian evidence"
by P. Van Cayseele, Research series, May 2002. 34. "On the Origins of the Franco-German EMU Controversies" by I. Maes, Research series, July 2002. 35. "An estimated dynamic stochastic general equilibrium model of the Euro Area", by F. Smets and
R. Wouters, Research series, October 2002. 36. "The labour market and fiscal impact of labour tax reductions: The case of reduction of employers' social
security contributions under a wage norm regime with automatic price indexing of wages", by K. Burggraeve and Ph. Du Caju, Research series, March 2003.
37. "Scope of asymmetries in the Euro Area", by S. Ide and Ph. Moës, Document series, March 2003. 38. "De autonijverheid in België: Het belang van het toeleveringsnetwerk rond de assemblage van
personenauto's", by F. Coppens and G. van Gastel, Document series, June 2003. 39. "La consommation privée en Belgique", by B. Eugène, Ph. Jeanfils and B. Robert, Document series,
June 2003. 40. "The process of European monetary integration: a comparison of the Belgian and Italian approaches", by
I. Maes and L. Quaglia, Research series, August 2003. 41. "Stock market valuation in the United States", by P. Bisciari, A. Durré and A. Nyssens, Document series,
November 2003. 42. "Modeling the Term Structure of Interest Rates: Where Do We Stand?, by K. Maes, Research series,
February 2004. 43. Interbank Exposures: An Empirical Examination of System Risk in the Belgian Banking System, by
H. Degryse and G. Nguyen, Research series, March 2004. 44. "How Frequently do Prices change? Evidence Based on the Micro Data Underlying the Belgian CPI", by
L. Aucremanne and E. Dhyne, Research series, April 2004. 45. "Firms' investment decisions in response to demand and price uncertainty", by C. Fuss and
Ph. Vermeulen, Research series, April 2004. 46. "SMEs and Bank Lending Relationships: the Impact of Mergers", by H. Degryse, N. Masschelein and
J. Mitchell, Research series, May 2004. 47. "The Determinants of Pass-Through of Market Conditions to Bank Retail Interest Rates in Belgium", by
F. De Graeve, O. De Jonghe and R. Vander Vennet, Research series, May 2004. 48. "Sectoral vs. country diversification benefits and downside risk", by M. Emiris, Research series,
May 2004. 49. "How does liquidity react to stress periods in a limit order market?", by H. Beltran, A. Durré and P. Giot,
Research series, May 2004. 50. "Financial consolidation and liquidity: prudential regulation and/or competition policy?", by
P. Van Cayseele, Research series, May 2004. 51. "Basel II and Operational Risk: Implications for risk measurement and management in the financial
sector", by A. Chapelle, Y. Crama, G. Hübner and J.-P. Peters, Research series, May 2004. 52. "The Efficiency and Stability of Banks and Markets", by F. Allen, Research series, May 2004. 53. "Does Financial Liberalization Spur Growth?" by G. Bekaert, C.R. Harvey and C. Lundblad, Research
series, May 2004. 54. "Regulating Financial Conglomerates", by X. Freixas, G. Lóránth, A.D. Morrison and H.S. Shin, Research
series, May 2004. 55. "Liquidity and Financial Market Stability", by M. O'Hara, Research series, May 2004. 56. "Economisch belang van de Vlaamse zeehavens: verslag 2002", by F. Lagneaux, Document series,
June 2004. 57. "Determinants of Euro Term Structure of Credit Spreads", by A. Van Landschoot, Research series,
July 2004. 58. "Macroeconomic and Monetary Policy-Making at the European Commission, from the Rome Treaties to
the Hague Summit", by I. Maes, Research series, July 2004. 59. "Liberalisation of Network Industries: Is Electricity an Exception to the Rule?", by F. Coppens and
D. Vivet, Document series, September 2004. 60. "Forecasting with a Bayesian DSGE model: an application to the euro area", by F. Smets and
R. Wouters, Research series, September 2004.

NBB WORKING PAPER No. 79 - FEBRUARY 2006 43
61. "Comparing shocks and frictions in US and Euro Area Business Cycle: a Bayesian DSGE approach", by F. Smets and R. Wouters, Research series, October 2004.
62. "Voting on Pensions: A Survey", by G. de Walque, Research series, October 2004. 63. "Asymmetric Growth and Inflation Developments in the Acceding Countries: A New Assessment", by
S. Ide and P. Moës, Research series, October 2004. 64. "Importance économique du Port Autonome de Liège: rapport 2002", by F. Langeaux, Document series,
November 2004. 65. "Price-setting behaviour in Belgium: what can be learned from an ad hoc survey", by L. Aucremanne and
M. Druant, Research series, March 2005. 66. "Time-dependent versus State-dependent Pricing: A Panel Data Approach to the Determinants of
Belgian Consumer Price Changes", by L. Aucremanne and E. Dhyne, Research series, April 2005. 67. "Indirect effects – A formal definition and degrees of dependency as an alternative to technical
coefficients", by F. Coppens, Research series, May 2005. 68. "Noname – A new quarterly model for Belgium", by Ph. Jeanfils and K. Burggraeve, Research series,
May 2005. 69. "Economic importance of the Flemish martime ports: report 2003", F. Lagneaux, Document series, May
2005. 70. "Measuring inflation persistence: a structural time series approach", M. Dossche and G. Everaert,
Research series, June 2005. 71. "Financial intermediation theory and implications for the sources of value in structured finance markets",
J. Mitchell, Document series, July 2005. 72. "Liquidity risk in securities settlement", J. Devriese and J. Mitchell, Research series, July 2005. 73. "An international analysis of earnings, stock prices and bond yields", A. Durré and P. Giot, Research
series, September 2005. 74. "Price setting in the euro area: Some stylized facts from Individual Consumer Price Data", E. Dhyne,
L. J. Álvarez, H. Le Bihan, G. Veronese, D. Dias, J. Hoffmann, N. Jonker, P. Lünnemann, F. Rumler and J. Vilmunen, Research series, September 2005.
75. "Importance économique du Port Autonome de Liège: rapport 2003", by F. Lagneaux, Document series, October 2005.
76. "The pricing behaviour of firms in the euro area: new survey evidence, by S. Fabiani, M. Druant, I. Hernando, C. Kwapil, B. Landau, C. Loupias, F. Martins, T. Mathä, R. Sabbatini, H. Stahl and A. Stokman, Research series, November 2005.
77. "Income uncertainty and aggregate consumption, by L. Pozzi, Research series, November 2005. 78. "Crédits aux particuliers - Analyse des données de la Centrale des Crédits aux Particuliers", by
H. De Doncker, Document series, January 2006. 79. "Is there a difference between solicited and unsolicited bank ratings and, if so, why?" by P. Van Roy,
Research series, February 2006.