WORKING PAPER reddot/ssh-ilsm... · · 2016-04-11Louvain School of Management Working Paper...
12
Clémentine Van Parijs, Virginie Vandenbulcke, François Fouss Louvain School of Management WORKING PAPER 2013/34 Improving accuracy by reducing the importance of hubs in nearest-neighbor recommendations LOUVAIN SCHOOL OF MANAGEMENT RESEARCH INSTITUTE
Transcript of WORKING PAPER reddot/ssh-ilsm... · · 2016-04-11Louvain School of Management Working Paper...

Clémentine Van Parijs, Virginie Vandenbulcke, François Fouss Louvain School of Management
WORKING PAPER 2013/34
Improving accuracy by reducing the importance of hubs in nearest-neighbor recommendations
LOUVAIN SCHOOL OF MANAGEMENT RESEARCH INSTITUTE

Improving accuracy by reducing the importance of hubs in nearest-neighbor recommendations Clémentine Van Parijs, Virginie Vandenbulcke, François Fouss Louvain School of Management
Summary
A traditional approach for recommending items to persons consists of including a step of forming neighborhoods of users/items. This work focuses on such nearest-neighbor approaches and, more specifically, on a particular type of neighbors, the ones frequently appearing in the neighborhoods of users/items (i.e., very similar to many other users/items in the data set), referred to as hubs in the literature. The aim of this paper is to explore through experiments how the presence of hubs affects the accuracy of nearest-neighbor recommendations. Keywords: Recommendation, nearest-neighbor, hubs JEL Classification: C02, C65.
Louvain School of Management Working Paper Series Editor : Prof. J. Vanderdonckt
Corresponding author: Virginie Vandenbulcke Center of Excellence in Management Information Systems (CEMIS) Louvain School of Management Université catholique de Louvain Chaussée de Binche, 151 B-7000 MONS, BELGIUM E-mail : [email protected]
The papers in the WP series have undergone only limited review and may be updated, corrected or withdrawn without changing numbering. Please contact the corresponding author directly for any comments or questions regarding the paper. ILSM, UC Louvain, 1 place des doyens, B-1348 Louvain-la-Neuve, BELGIUM www.uclouvain.be/ilsm and www.uclouvain.be/lsm_WP

Improving accuracy by reducing the importance
of hubs in nearest-neighbor recommendations
Clémentine Van Parijs, Virginie Vandenbulcke & François Fouss
Université catholique de Louvain (UCL)Chaussée de Binche 151, 7000 Mons - Belgium
Abstract. A traditional approach for recommending items to personsconsists of including a step of forming neighborhoods of users/items. Thiswork focuses on such nearest-neighbor approaches and, more speci�cally,on a particular type of neighbors, the ones frequently appearing in theneighborhoods of users/items (i.e., very similar to many other users/itemsin the data set), referred to as hubs in the literature. The aim of thispaper is to explore through experiments how the presence of hubs a�ectsthe accuracy of nearest-neighbor recommendations.
1 Introduction
Recommender systems (see, e.g., [1�3]) try to provide people with recommen-dations of items they will appreciate, based on their past preferences, historyof purchase, and demographic information. Recommender systems have theirorigin (see the survey of the state-of-the-art of Adomavicius and Tuzhilin [4] formore details) in the work done in, mainly, information retrieval [5], cognitivescience [6], forecasting theories [7], marketing [8], management [9], and emergedas an independent research area in the mid-1990s, with the �rst papers on col-laborative �ltering appearing in [10�12]. Three steps usually are common tothe functioning of recommender systems: (1) gather valuable information on theusers and on the items, (2) determine patterns from the historical data, and (3)suggest items to people.
This paper relates to this second step of determining patterns from historicaldata. Various approaches (content-based, collaborative, or hybrid approaches� combining the �rst two ones) were developed through years to produce thebest recommender systems. While content-based approaches recommend itemssimilar to the ones a user preferred in the past depending on the features ofthe items, collaborative approaches recommend to a user items that people withsimilar tastes and preferences have liked (user-based recommandation) or itemssimilar to the ones the considered user has preferred (item-based recommanda-tion), depending, this time, on the links between items and users, and not onthe features of items. These sets of similar users (items) are usually called thenearest neighbors of the user (of the items bought by the user). Our work fo-cuses on a particular type of neighbors, the ones frequently appearing in theneighborhoods of users/items (i.e., very similar to many other people/items inthe data set). As shown in other areas (see Section 2), such neighbors (referredto as hubs in the literature and therefore in this paper) play a very importantrole in nearest-neighbor processes.
This paper shows that applying nearest-neighbor methods in recommendersystems also leads to the emergence of hubs and explore how the presence ofhubs can a�ect the accuracy of nearest-neighbor recommendations. Section 2shows some work related to the presence of hubs. Section 3 describes three intu-itive approaches aiming at reducing the importance of hubs in nearest-neighborrecommendations. In Section 4, these three approaches are applied on two well-known data sets in the �eld of recommender systems, and results are shown andanalyzed. Concluding remarks are discussed in Section 5.
2 Related work
This section provides a short survey of the related work dealing with the so-calledhubness phenomenon inherent to nearest-neighbor methods.
The hubness phenomenon was �rst described, with no insight into its origins,in speech recognition in 1998 [13], �ngerprint identi�cation in 2005 [14], and mu-sic retrieval in 2007 [15, 16], where hub songs were de�ned as songs similar tomany other songs (therefore keep appearing unwontedly often in recommenda-tion lists preventing other songs from being recommended at all [17]).
Probably discovered by Berenzweig in [18], the link between the hub prob-lem and the high dimensionality of the feature space was further explored byRadovanovi¢ et al. in [19�21]. Indeed, the authors were the �rst to propose atheoretical analysis and an empirical investigation on the hubness phenomenon(see [20, 21]), explaining the origins of the phenomenon and the mechanismthrough which hubs emerge. More precisely, the authors observed that hubsemerge as dimension increases, for a number of common similarity or distancemeasures. They also pointed out that the emergence of hubs has a negativee�ect on the accuracy of nearest-neighbor methods in the task of classi�cation.Notice that Low et al. recently challenged, in [22], the hypothesis that the hub-ness phenomenon is an e�ect of the dimensionality of the data set. In [22], theauthors claim that it is rather a boundary e�ect or, more generally, an e�ect ofa density gradient.
In [23], the authors investigate the e�ectiveness of Laplacian-based kernels inhub reduction. More precisely, they show that, in some cases (as the results seema�ected by the size of the data), kernels based on the graph Laplacian are morerobust to the hubness phenomenon, in information retrieval and classi�cation.
Also in the �eld of classi�cation, Schnitzer et al. developed in [24] two classesof methods that try to symmetrize nearest-neighbor relations and investigated towhat extent they can mitigate the negative e�ects of hubs. The authors showedthrough experiments on machine learning data sets and synthetic data that bothmethods lead to a strong decrease of hubness in high dimensional data sets whileat the same time improving classi�cation accuracy.
Toma�sev et al. also worked on exploiting the hubness phenomenon in knearest-neighbor methods. In [25], the authors examine the hubness of variousimage data sets, under several di�erent feature representations, and show thatit is possible to exploit the observed hubness and improve the recognition accu-

racy. In [26], the authors analyzed the hubness phenomenon in the context ofclassi�cation. They proposed a new algorithm, Hubness Information k-NearestNeighbor introducing the k-occurrence informativeness into the hubness-awarek nearest-neighbor voting framework. In [27], the authors showed that hubnesscan be successfully exploited in clustering. More precisely, they showed thathubness is a good measure of point centrality within a high-dimensional datacluster, and proposed several hubness-based clustering algorithms, showing thatmajor hubs can be used e�ectively as cluster prototypes or as guides during thesearch for centroid-based cluster con�gurations.
The hubness phenomenon was also studied in the �eld of collaborative �lter-ing. In [28], Nanopoulos et al. analyzed the hubness phenomenon as well as thesimilarity concentration phenomenon showing, through theoretical analysis andexperimental evaluation, that they are inherent properties of high-dimensionalspace, unrelated to other data properties like sparsity, and that they can impactcollaborative �ltering algorithms by questioning the meaning and the represen-tativeness of discovered nearest neighbors.
3 Reducing the importance of hubs
As shown in the previous section, neighbors frequently appearing in the neigh-borhoods of users/items play an important role in nearest-neighbor processes invarious areas. Our preliminary experiments on real data sets (see Section 4 fordetails about the data sets) con�rmed that some users/items are included in animportant number of neighborhoods (while some others are almost not presentin any neighborhood). Following the intuition that neighbors common to lots ofneighborhoods may bring less pertinent information for recommendations, sincefrequent, we formulate our research question as: �Could the accuracy of recom-mendations be in�uenced by neighbors belonging to many neighborhoods�?
Remember that this work relates to the second step common to all recom-mender systems, which aims at determining patterns from historical data. Inrecommendation algorithms based on neighborhoods, this second step is fur-ther divided into two substeps, the �rst one consists of computing similaritiesbetween users/items and the second one of forming neighborhoods. To answerour research question, three approaches (all lying between these two substepssince manipulating the similarities used for forming the neighborhoods) weredeveloped aiming at mitigating the impact of the neighbors present in manyneighborhoods.
The �rst approach (RMV) simply consists of removing from neighborhoodsthe most frequent neighbors. More precisely, k nearest neighbors of users/itemsare �rst identi�ed (applying any method) and then the �nal neighborhoods arerecomputed by removing the neighbors originally present in many neighbor-hoods. Notice that this technique therefore needs the tuning of a parameter, p,controlling the percentage of the initial neighbors deleted from neighborhoods.
Systematically ignore information that can be provided by some neighbors(such as in the �rst approach) can be considered as too radical. The idea of the

second approach (NRM) is to �rst normalize the similarities (i.e., consideringa user/item, each of its similarities - with other users/items - is �rst divided bythe sum of its similarities with all the other users/items) in order to a�ect thesimilarity values associated to the neighbors and therefore the composition ofthe neighborhoods. Intuitively, the more a user/item is similar to many otherusers/items, the more its initial impact in neighborhoods will be reduced.
The third approach (RNK) relies on ranks to select the k nearest neigh-bors of a user/item. For a considered user/item, each similarity - i.e., withanother user/item - is simply replaced by its rank among the similarities be-tween the considered user/item and all the other users/items (i.e., a 1 replacesthe highest similarity of the considered user, a 2 the second highest, etc.). Theneighborhoods are now formed using these ranks rather than initial similari-ties. Applying this procedure limits the number of times a neighbor (originallypresent in many neighborhoods) appears in the new ones while every user/itemis somehow forced to be present in at least some neighborhoods. The intuitionis that every user/item should be the neighbor of at least some others, which isquite natural except for, rare, very atypical, users/items.
Notice that the second and third approaches are free of parameters.
4 Experiments
This section reports on experimental work aiming at assessing if nearest-neighborrecommendations can be more accurate when applying the three suggested ap-proaches.
4.1 Data sets
Two di�erent data sets, well-known in recommender systems, were used for ex-periments in this work. The MovieLens (ML) data set contains 100.000 ratingsof 943 persons about 1.682movies. Users watched 20 or more movies, and movieswere watched at least one. The BookCrossing (BC) data set contains 109.374ratings of 1.028 persons about 2.222 books. Users bought 40 or more books, andmovies were bought by 20 or more persons.
For all the experiments on both data sets, the numerical value of the ratingsprovided by the users are not taken into account, but only the fact that a userwatched a movie / bought a book.
4.2 Methodology
Assessing recommender systems can be performed on various axis such as com-plexity, coverage, robustness, novelty (see, e.g., see [29,30]), or, most of the time,accuracy. To compare the di�erent approaches, this work focuses on accuracyeven if the best con�gurations will be further compared in terms of novelty (notethat the approaches are equivalent in terms of coverage and complexity whilethe robustness criteria is not relevant in this work).

The criteria used for assessing the accuracy of the approaches is the recallscore, averaged on all the users, quantifying for each user the proportion of thetop N recommended items that should be recommended to the user, accordingto historical data. The recall scores should be as high as possible (i.e., closeto 100%) for good performance and are computed through a classical doublecross-validation prodecure: An internal cross-validation is used for tuning theparameters (i.e., the number of neighbors k (= 10, 20, ..., 100) and the percentageof removed users in the �rst approach p = (5%, 10%, ..., 40%)), and an externalcross-validation for assessing the approach when the values of the parameters are�xed to the ones providing the best accuracy results in internal cross-validation.Details of the computation of the recommendations and recall scores (recall 10and recall 20 are reported in this paper) as well as details on the applied doublecross-validation procedure can be found in [31].
Reference situation. To evaluate if the three approaches improve the accuracyof recommendations, a reference situation has to be taken. The so-called Bin
method was chosen as a reference for its simplicity and for providing very com-petitive results when applied on the MovieLens and BookCrossing data sets(see [31,32]).
Applied in the user-based method (the item-based method is similar anddoes not require further explanations), each user i is characterized by a binaryvector (whose dimension is the total number of items) encoding the items hebought. Similarities between pairs of vectors (and therefore pairs of users) arethen computed. In [32], systematic comparisons between eight such measures(listed in [33], p. 674) were performed. The best recall scores were obtained withthe measure �ratio of 1-1 matches to mismatches with 0-0 matches excluded�.
4.3 Results
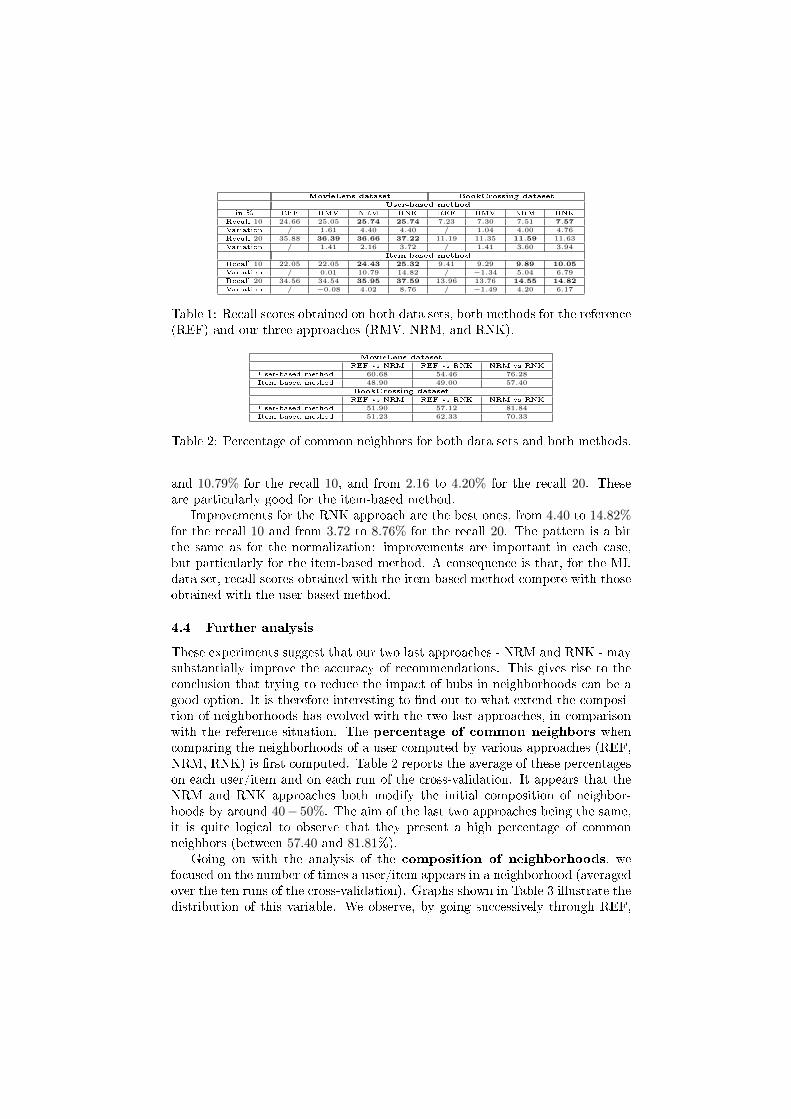
Table 1 shows the recall scores obtained on both data sets and both methods(user-based, item-based). For each case, the recall obtained in the reference situ-ation (REF) and the ones obtained by applying the three approaches modifyingthe composition of the neighborhoods (i.e., the removal of hubs (RMV), the nor-malization technique (NRM), and the ranks technique (RNK)) are shown. Weused a paired t-test to determine whether there is a signi�cant di�erence (with ap-value smaller than 0.01) between the recalls; the results that are signi�cantlybetter than REF are in bold. The improvements of the recalls (in percentage)are also shown, in the �Variation� rows.
The variation of the recalls when removing some neighbors present in manyneighborhoods are rather low (close to 1%), and are positive in the user-basedmethod and negative in the item-based method. Nevertheless, it shows thatdisputing the presence of some neighbors may be bene�cial. Particularly, in thecase of the ML data set, it appeared that we could remove up to 35% of hubsand still have improvements with respect to the initial situation.
The NRM approach leads to better accuracy results for both data sets andboth methods. Improvements, generally signi�cant, are important: between 4.00
MovieLens dataset BookCrossing dataset
User-based method
in % REF RMV NRM RNK REF RMV NRM RNK
Recall 10 24.66 25.05 25.74 25.74 7.23 7.30 7.51 7.57
Variation / 1.61 4.40 4.40 / 1.04 4.00 4.76
Recall 20 35.88 36.39 36.66 37.22 11.19 11.35 11.59 11.63
Variation / 1.41 2.16 3.72 / 1.41 3.60 3.94
Item-based method
Recall 10 22.05 22.05 24.43 25.32 9.41 9.29 9.89 10.05
Variation / 0.01 10.79 14.82 / −1.34 5.04 6.79
Recall 20 34.56 34.54 35.95 37.59 13.96 13.76 14.55 14.82
Variation / −0.08 4.02 8.76 / −1.49 4.20 6.17
Table 1: Recall scores obtained on both data sets, both methods for the reference(REF) and our three approaches (RMV, NRM, and RNK).
MovieLens dataset
REF vs NRM REF vs RNK NRM vs RNK
User-based method 60.68 54.46 76.28
Item-based method 48.90 49.00 57.40
BookCrossing dataset
REF vs NRM REF vs RNK NRM vs RNK
User-based method 51.90 57.12 81.84
Item-based method 51.23 62.33 70.33
Table 2: Percentage of common neighbors for both data sets and both methods.
and 10.79% for the recall 10, and from 2.16 to 4.20% for the recall 20. Theseare particularly good for the item-based method.
Improvements for the RNK approach are the best ones, from 4.40 to 14.82%for the recall 10 and from 3.72 to 8.76% for the recall 20. The pattern is a bitthe same as for the normalization: improvements are important in each case,but particularly for the item-based method. A consequence is that, for the MLdata set, recall scores obtained with the item-based method compete with thoseobtained with the user-based method.
4.4 Further analysis
These experiments suggest that our two last approaches - NRM and RNK - maysubstantially improve the accuracy of recommendations. This gives rise to theconclusion that trying to reduce the impact of hubs in neighborhoods can be agood option. It is therefore interesting to �nd out to what extend the composi-tion of neighborhoods has evolved with the two last approaches, in comparisonwith the reference situation. The percentage of common neighbors whencomparing the neighborhoods of a user computed by various approaches (REF,NRM, RNK) is �rst computed. Table 2 reports the average of these percentageson each user/item and on each run of the cross-validation. It appears that theNRM and RNK approaches both modify the initial composition of neighbor-hoods by around 40− 50%. The aim of the last two approaches being the same,it is quite logical to observe that they present a high percentage of commonneighbors (between 57.40 and 81.81%).
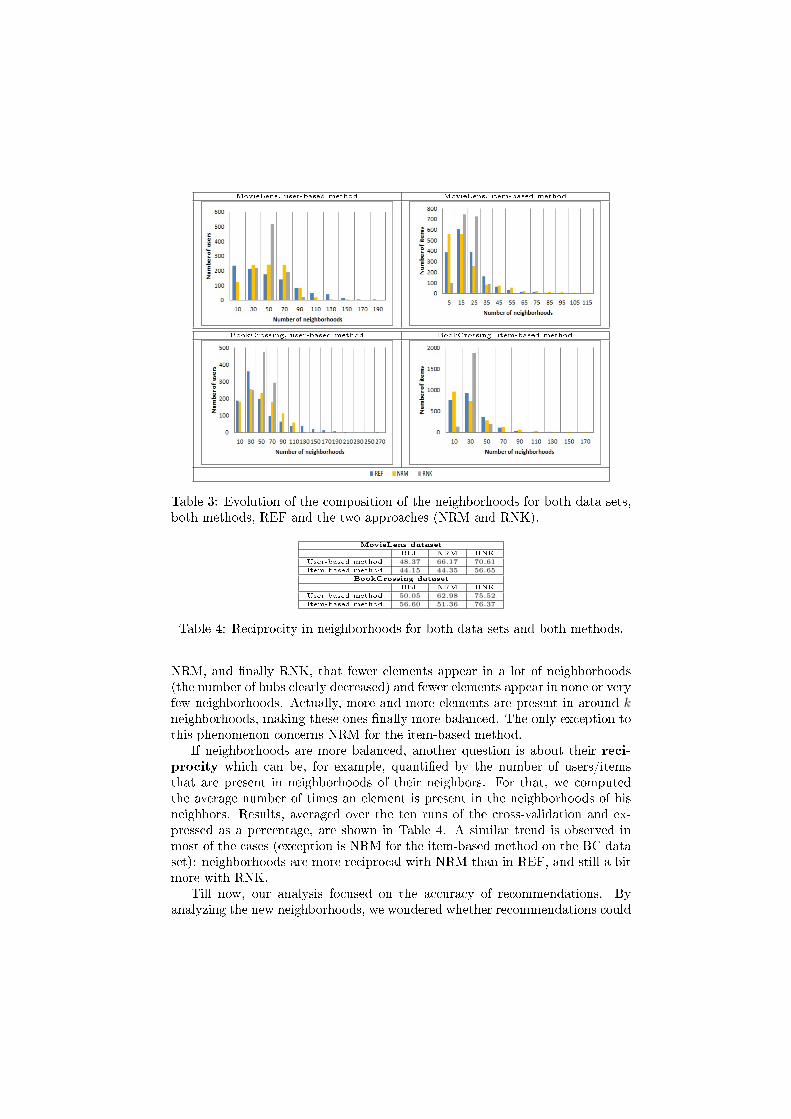
Going on with the analysis of the composition of neighborhoods, wefocused on the number of times a user/item appears in a neighborhood (averagedover the ten runs of the cross-validation). Graphs shown in Table 3 illustrate thedistribution of this variable. We observe, by going successively through REF,
MovieLens, user-based method MovieLens, item-based method
BookCrossing, user-based method BookCrossing, item-based method
Table 3: Evolution of the composition of the neighborhoods for both data sets,both methods, REF and the two approaches (NRM and RNK).
MovieLens dataset
REF NRM RNK
User-based method 48.37 66.17 70.61
Item-based method 44.15 44.35 56.65
BookCrossing dataset
REF NRM RNK
User-based method 50.05 62.98 75.52
Item-based method 56.60 51.36 76.37
Table 4: Reciprocity in neighborhoods for both data sets and both methods.
NRM, and �nally RNK, that fewer elements appear in a lot of neighborhoods(the number of hubs clearly decreased) and fewer elements appear in none or veryfew neighborhoods. Actually, more and more elements are present in around kneighborhoods, making these ones �nally more balanced. The only exception tothis phenomenon concerns NRM for the item-based method.
If neighborhoods are more balanced, another question is about their reci-procity which can be, for example, quanti�ed by the number of users/itemsthat are present in neighborhoods of their neighbors. For that, we computedthe average number of times an element is present in the neighborhoods of hisneighbors. Results, averaged over the ten runs of the cross-validation and ex-pressed as a percentage, are shown in Table 4. A similar trend is observed inmost of the cases (exception is NRM for the item-based method on the BC dataset): neighborhoods are more reciprocal with NRM than in REF, and still a bitmore with RNK.
Till now, our analysis focused on the accuracy of recommendations. Byanalyzing the new neighborhoods, we wondered whether recommendations could

MovieLens dataset
User-based method Item-based method
REF NRM RNK REF NRM RNK
Recall 10 288.86 258.52 277.51 202.62 253.54 235.01
Recall 20 245.69 217.50 234.91 190.11 233.83 207.73
BookCrossing dataset
User-based method Item-based method
REF NRM RNK REF NRM RNK
Recall 10 174.66 129.95 151.46 102.37 121.23 105.59
Recall 20 161.28 122.48 139.98 99.25 114.26 96.99
Table 5: Novelty (average frequency of recommended items).
be more surprising with NRM or RNK. Indeed, reducing the impact of hubs couldintuitively lead to reduce the recommendation of items with a high frequency. Tothis end, the average of the median frequency of 10 or 20 recommended itemswas computed and the results are shown in Table 5 (this measure should beas low as possible for a good performance in terms of novelty). In REF, theitem-based method always provides better results than the user-based method.When looking at NRM and RNK, results are essentially better for the user-basedmethod.
To summarize, using NRM or RNK in the user-based method improves therecall scores and provides more surprising recommendations while importantaccuracy improvements were obtained with the item-based method, but withoutleading to more surprising recommendations.
5 Conclusion
The hubness phenomenon inherent to nearest-neighbor methods has been high-lighted in many di�erent areas such as, e.g., speech recognition, clustering, classi-�cation, or even collaborative �ltering where [28] questioned the meaning and therepresentativeness of discovered nearest neighbors. This work goes one step fur-ther by experimentally showing that the presence of hubs can a�ect the accuracyof nearest-neighbor recommendations and suggesting three intuitive approachesaiming at mitigating the impact of the neighbors present in many neighborhoods.Results showed that two approaches (i.e., NRM and RNK) signi�cantly improvethe accuracy of the recommendations, lead to more symmetric neighborhoodsand also, in di�erent cases, to more surprising recommendations.
References
[1] D. Jannach, M. Zanker, A. Felfernig, and G. Friedrich. Recommender Systems: Anintroduction. Cambridge University Press, 2011.
[2] L. Lü, M. Medo, C. H. Yeung, Y.-C. Zhang, Z.-K. Zhang, and T. Zhou. Recommendersystems. Physics Reports, 519:1�49, 2012.
[3] F. Ricci, L. Rokach, B. Shapira, and P.B. Kantor. Recommender Systems Handbook.Springer, 2011.
[4] G. Adomavicius and A. Tuzhilin. Toward the next generation of recommender systems: Asurvey of the state-of-the-art and possible extensions. IEEE Transactions on Knowledgeand Data Engineering, pages 734�749, 2005.
[5] G. Salton. Automatic Text Processing. Addison-Wesley, 1989.
[6] E. Rich. User modeling via stereotypes. Cognitive Science, 3(4):329�354, 1979.
[7] J. Armstrong. Principles of Forecasting, A Handbook for Researchers and Practitioners.Kluwer Academic, 2001.
[8] G. Lilien, B. Smith, and K. Moorthy. Marketing Models. Prentice Hall, 1992.
[9] B. Murthi and S. Sarkar. The role of the management sciences in research on personal-ization. Management Science, 49(10):1344�1362, 2003.
[10] W. Hill, L. Stead, M. Rosenstein, and G. Furnas. Recommending and evaluating choices ina virtual community of use. Proceedings of ACM CHI'95 Conference on Human Factorsin Computing Systems, pages 194�201, 1995.
[11] P. Resnick, I. Neophytos, S. Mitesh, P. Bergstrom, and J. Riedl. GroupLens: An openarchitecture for collaborative �ltering of netnews. Proceedings of the Conference on Com-puter Supported Cooperative Work, pages 175�186, 1994.
[12] U. Shardanand and P. Maes. Social information �ltering: Algorithms for automating'word of mouth'. Proceedings of the Conference on Human Factors in Computing Systems,pages 210�217, 1995.
[13] G. Doddington, W. Ligget, A. Martin, M. Przybocki, and D. Reynolds. Sheep, goats,lambs and wolves: A statistical analysis of speaker performance in the NIST 1998 speakerrecognition evaluation. Proceedings of the 5th International Conference on Spoken Lan-guage Processing, 1998.
[14] A. Hicklin, C. Watson, and B. Ulery. The myth of goats: How many people have �nger-prints that are hard to match? Internal Report 7271, National Institute of Standardsand Technology, 2005.
[15] J.-J. Aucouturier and F. Pachet. Improving timbre similarity: How high is the sky?Journal of Negative Results in Speech and Audio Sciences, 1(1), 2004.
[16] J.-J. Aucouturier and F. Pachet. A scale-free distribution of false positives for a largeclass of audio similarity measures. Pattern Recognition, 41(1):272�284, 2007.
[17] A. Flexer, D. Schnitzer, and J. Schluter. A mirex meta-analysis of hubness in audio musicsimilarity. Proc. of the 13th Int. Society for Music Information Retrieval Conference,pages 175�180, 2012.
[18] A. Berenzweig. Anchors and hubs in audio-based music similarity. PhD thesis, ColumbiaUniversity, 2007.
[19] M. Radovanovi¢, A. Nanopoulos, and M. Ivanovi¢. Nearest-neighbors in high-dimensionality data: the emergence and in�uence of hubs. Proceedings of the Inter-national Conference on Machine Learning (ICML), pages 865�872, 2009.
[20] M. Radovanovi¢, A. Nanopoulos, and M. Ivanovi¢. Hubs in space: popular nearest neigh-bors in high-dimensional data. Journal of Machine Learning Research, 11:2487�2531,2010.
[21] M. Radovanovi¢, A. Nanopoulos, and M. Ivanovi¢. On the existence of obstinate resultsin vector space models. In Proceedings of the 33rd Annual International Conference onResearch and Development in Information Retrieval, pages 186�193, 2010.
[22] T. Low, C. Borgelt, S. Stober, and A. Nurnberger. Towards advanced data analysisby combining soft computing and statistics: The hubness phenomenon, fact or artifact.Springer-Verlag Berlin Heidelberg, 2013.
[23] I. Suzuki, K. Hara, M. Shimbo, Y. Matsumoto, and M. Saerens. Investigating the ef-fectiveness of Laplacian-based kernels in hub reduction. Proceedings of the 26th AAAIConference on Arti�cial Intelligence, pages 1112�1118, 2012.
[24] D. Schnitzer, A. Flexer, M. Schedl, and G. Widmer. Local and global scaling reduce hubsin space. Journal of Machine Learning Research, 13:2871�2902, 2012.

[25] N. Toma�sev, R. Brehar, D. Mladeni�c, and S. Nedevschi. The in�uence of hubness onnearest-neighbor methods in object recognition. Proceedings of the IEEE InternationalConference on Intelligent Computer Communication and Processing, pages 367�374,2011.
[26] N. Toma�sev and D. Mladeni�c. Nearest neighbor voting in high dimensional data: learningfrom past occurences. Computer Science and Information Systems, 9(2):691�712, 2012.
[27] N. Toma�sev, M. Radovanovi�c, D. Mladeni�c, and M. Ivanovi�c. The role of hubness in clus-tering high-dimensional data. IEEE Transactions on Knowledge and Data Engineering,99, 2013.
[28] A. Nanopoulos, M. Radovanovi�c, and M. Ivanovi�c. How does high dimensionality af-fect collaborative �ltering? Proceedings of the 3rd ACM Conference on RecommenderSystems, pages 293�296, 2009.
[29] Pedro G. Campos Soto. Temporal models in recommender systems: An exploratory studyon di�erent evaluation dimensions. Autonomous University of Madrid, 2011.
[30] F. Fouss and M. Saerens. Evaluating performance of recommender systems: An experi-mental comparison. Proceedings of the 2008 IEEE/WIC/ACM International Conferenceon Web Intelligence and Intelligent Agent Technology, pages 735�738, 2008.
[31] F. Fouss, K. Francoisse, L. Yen, A. Pirotte, and M. Saerens. An experimental investigationof kernels on graphs for collaborative recommendation and semisupervised classi�cation.Neural Networks, 31:53�72, 2012.
[32] F. Fouss, A. Pirotte, J.-M. Renders, and M. Saerens. Random-walk computation ofsimilarities between nodes of a graph, with application to collaborative recommendation.IEEE Transactions on Knowledge and Data Engineering, 19(3):355�369, 2007.
[33] R. Johnson and D. Wichern. Applied multivariate statistical analysis, 5th Ed. PrenticeHall, 2002.