Working Paper no. 122 Is labor flexibility a substitute to...
27
Working Paper no. 122 Is labor flexibility a substitute to offshoring? Evidence from Italian manafacturing Andrea F. Presbitero Università Politecnica delle Marche; MoFiR and CeMaFiR Matteo G. Richiardi University of Turin, Collegio Carlo Alberto and LABORatorio R. Revelli Alessia Amighini Università del Piemonte Orientale September, 2012 Laboratorio R. Revelli, Collegio Carlo Alberto Tel. +39 011 670.50.60 - Fax +39 011 670.50.61 Via Real Collegio, 30 - 10024 Moncalieri (TO) www.laboratoriorevelli.it - [email protected]
Transcript of Working Paper no. 122 Is labor flexibility a substitute to...
Working Paper no. 122
Is labor flexibility a substitute to offshoring?
Evidence from Italian manafacturing
Andrea F. Presbitero Università Politecnica delle Marche; MoFiR and CeMaFiR
Matteo G. Richiardi
University of Turin, Collegio Carlo Alberto and LABORatorio R. Revelli
Alessia Amighini Università del Piemonte Orientale
September, 2012
Laboratorio R. Revelli, Collegio Carlo Alberto Tel. +39 011 670.50.60 - Fax +39 011 670.50.61 Via Real Collegio, 30 - 10024 Moncalieri (TO) www.laboratoriorevelli.it - [email protected]
1
Is labor flexibility a substitute to offshoring?
Evidence from Italian manafacturing
Andrea F. Presbitero, Matteo G. Richiardi and Alessia Amighini
This draft: July 31, 2012
Abstract
We test whether labor flexibility acts as a substitute to delocalization. Using Italian survey data, we
show that a higher share of temporary workers appears to reduce the likelihood of future offshoring.
However, once reverse causality and spurious correlation are controlled for with IV techniques, the
relationship vanishes. This finding suggests that the threat of delocalization to win support for
further labor market reforms is probably misplaced.
KEYWORDS: offshoring, labor flexibility, temporary work, delocalization, labor market reforms,
cost saving
JEL Codes: J21, F16, F23
Acknowledgments
The authors thanks Luigi Benfratello, Stefano Staffolani, Alberto Zazzaro and participants to the
workshop “I cambiamenti della manifattura italiana visti attraverso l‟indagine Unicredit” (Centro Studi Luca
d‟Agliano, 2010) and to the 51st annual meeting of the Italian Economic Association (Catania, 2010) for
helpful comments on an earlier version of this paper.
Affiliations:
Andrea F. Presbitero: Università Politecnica delle Marche, Department of Economics and Social
Sciences; MoFiR and CeMaFiR.
Matteo G. Richiardi: Università di Torino, Department of Economics, Collegio Carlo Alberto and
LABORatorio Revelli Centre for Employment Studies
Alessia Amighini: Università del Piemonte Orientale
2
1. Introduction
"Once again, the key to turning the single market and globalization into opportunities is the capacity
to reform labour market and social policies in the right direction. Failing to do so would only
exacerbate the fear towards „Polish plumbers‟ and delocalization" (Sapir, 2006).
The link between globalization and labor market regulations goes widely undisputed in the
literature and in the public debate. As the story goes, in a globalized world domestic labor
protective legislation becomes too costly, causing firms either to succumb to their international
competitors, or to move their production abroad. The threat of delocalization, by reinforcing the
trade-off between job and employment security, is indeed a major driver in the political strive for
labor market reforms (Stone 2012, Esping-Andersen and Regini 2000). The same arguments
explain the stress international institutions like the OECD and the International Monetary Fund put
on labor market reforms in the present financial crisis.1
While the literature has identified high domestic unit labor costs as one of the factors
motivating firms‟ choice to delocalize, little effort has been devoted to test at a micro level whether
more job stability fosters offshoring, as commonly assumed. In particular, no connections have so
far been established between the diffusion of flexible work arrangements by means of non-standard
contracts and the likelihood of offshoring. This is all the more interesting as labor market reforms in
OECD countries in the past two decades have mainly occurred by introducing the possibility to hire
under less protected, temporary contracts.
From a theoretical perspective, the impact of workforce composition on offshoring decisions
is indeterminate. If firms consider production offshoring and workforce flexibility as two different
cost-cutting strategies, then a higher share of temporary workers over total workforce should be
associated with less delocalization. Indeed, non-standard contracts, and in particular fixed-term
work arrangements, do entail lower dismissal costs, as no firing costs have to be paid upon
expiration of the contract and in many countries no end-of-services allowances are due. Conversely,
higher workforce flexibility (in terms of a higher share of temporary workers) could facilitate
offshoring, as domestic production can be displaced abroad without bearing the high costs of
permanent workers dismissal. Such costs entail not only monetary payments to workers, but also
increased opposition by labor unions and more attention from the general public and the media,
which might delay offshoring or deter it completely.
Therefore, the question whether labor market flexibility induces more or less offshoring has
ultimately to be addressed at an empirical level. To the best of our knowledge, this paper is the first
1See for instance IMF (2012), Barkbu et al. (2012), OECD (2012).
3
to postulate a relationship between offshoring decision and workforce composition in terms of
temporary vs. open-ended workers, and to test this claim with firm-level data. Partially related to
this research questions, Machikita and Sato (2011) find that FDI and/or outsourcing tend to
encourage the replacement of permanent workers with temporary workers in home production by
Japanese firms. This result may be consistent with the manufacturers‟ goal to save expected labor
adjustment costs. Once the firm has already incurred the setup cost for the foreign plant, a more
favorable foreign business opportunities can be dealt with dismissing temporary rather than
permanent workers. Moreover, tougher competition may make the employment relationship fragile,
reducing the workers‟ incentive to accumulate firm-specific skills. Hence, the efficiency advantage
of permanent workers over temporary workers reduces and firms prefer substituting permanent with
temporary workers. With respect to Machikita and Sato (2011), we test the existence of a causal
nexus working in the opposite direction, from labor force composition to offshoring.
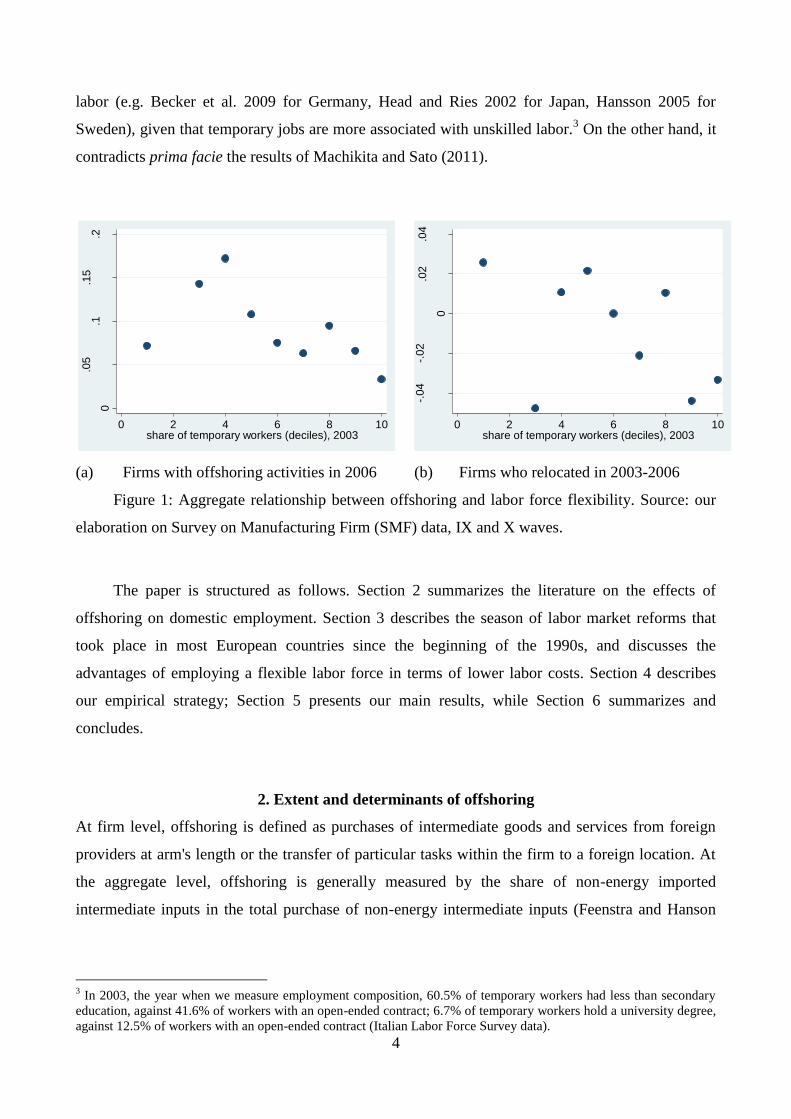
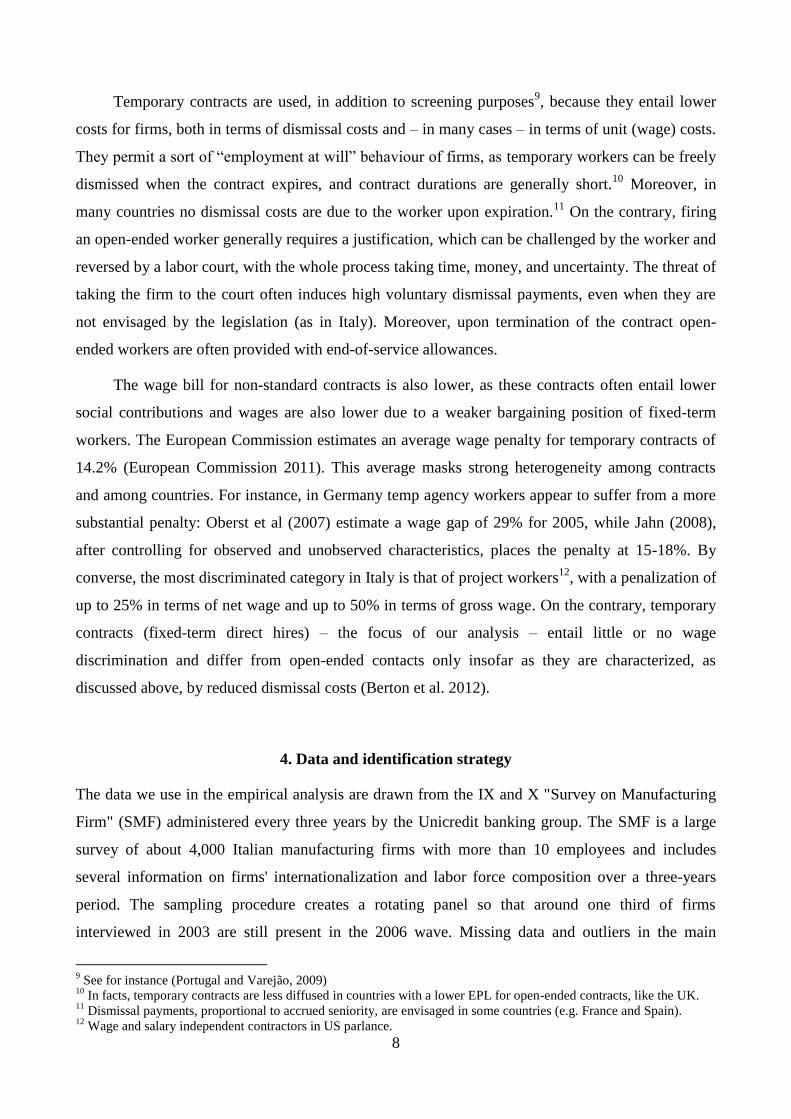
Our data refer to Italy, an interesting case study because it was the OECD country that
liberalized the use of temporary contracts to the highest degree, in the period 1998-2008 (see
Section 3, below). A first look at the data reinforces the opinion that domestic labor force flexibility
and offshoring are substitutes, rather than complements (Figure 1). The variable on the vertical axes
is the share of firms who had relocated part of their production abroad by 2006 in the left panel, and
the share of firms who choose to relocate part of their production abroad in the period 2003-2006 in
the right panel2. The variable on the horizontal axes is the share of temporary workers in 2003 (by
deciles).
This aggregate pattern shows up even after controlling for a number of firm characteristics, as
we show in our analysis. However, as common in the offshoring literature, an issue can be raised
concerning reverse causality (from a propensity to future offshoring to a preference over actual
workforce composition) and spurious correlation (some firm characteristics affecting both the
propensity to future offshoring and the actual workforce composition). Indeed, we show by using
appropriate instruments that once this endogeneity problem is controlled for, the relationship
between actual workforce composition and future offshoring vanishes (whether the theoretical
mechanisms at work discussed above are too weak or compensate each other, we can‟t tell). The
negative correlation between offshoring and temporary employment that we find when reverse
causation is not controlled for is coherent with the firm-level literature on the effects of offshoring
pointing to an increase in the demand for skilled labor and a decrease in the demand for unskilled
2 To be more precise, the outcome variable in the right panel can take a value of +1 if the firm had offshore activities in
2006 but not in 2003, a value of 0 if the firm either had offshore activities both in 2006 and in 2003, or neither in 2006
nor in 2003, and a value of -1 if the firm had offshore activities in 2003 but not in 2006.
4
labor (e.g. Becker et al. 2009 for Germany, Head and Ries 2002 for Japan, Hansson 2005 for
Sweden), given that temporary jobs are more associated with unskilled labor.3 On the other hand, it
contradicts prima facie the results of Machikita and Sato (2011).
(a) Firms with offshoring activities in 2006 (b) Firms who relocated in 2003-2006
Figure 1: Aggregate relationship between offshoring and labor force flexibility. Source: our
elaboration on Survey on Manufacturing Firm (SMF) data, IX and X waves.
The paper is structured as follows. Section 2 summarizes the literature on the effects of
offshoring on domestic employment. Section 3 describes the season of labor market reforms that
took place in most European countries since the beginning of the 1990s, and discusses the
advantages of employing a flexible labor force in terms of lower labor costs. Section 4 describes
our empirical strategy; Section 5 presents our main results, while Section 6 summarizes and
concludes.
2. Extent and determinants of offshoring
At firm level, offshoring is defined as purchases of intermediate goods and services from foreign
providers at arm's length or the transfer of particular tasks within the firm to a foreign location. At
the aggregate level, offshoring is generally measured by the share of non-energy imported
intermediate inputs in the total purchase of non-energy intermediate inputs (Feenstra and Hanson
3 In 2003, the year when we measure employment composition, 60.5% of temporary workers had less than secondary
education, against 41.6% of workers with an open-ended contract; 6.7% of temporary workers hold a university degree,
against 12.5% of workers with an open-ended contract (Italian Labor Force Survey data).
0
.05
.1.1
5.2
share
of offshori
ng fir
ms, 2006
0 2 4 6 8 10share of temporary workers (deciles), 2003
-.04
-.02
0
.02
.04
share
of offshori
ng fir
ms, 2003-2
006
0 2 4 6 8 10share of temporary workers (deciles), 2003
5
1996; 1999).4 Since the nineties, the fragmentation of production has increased in several advanced
economies. On average, the index of offshoring in OECD countries was 18 percent in 2005, 4
percentage higher than in 1995. In Italy, by contrast, the intensity of offshoring remained quite
stable, at about 11 percent of total inputs in the manufacturing and 7 percent in the service sectors.
In comparative terms, the intensity of offshoring in Italy is lower than in Germany (22%), but
similar to the values reported in France and Germany (18%) and much higher than in the US and in
Japan (OECD 2010).
The effects of offshoring on labor market outcomes have been extensively studied (see Crinò
(2009) for a review). In a nutshell, offshoring may induce cost savings and improve productivity,
resulting in a higher output. Thanks to the productivity-enhancing effect of offshoring, even factors
of production whose tasks are offshored can benefits from the international delocalization of
production (Grossman and Rossi-Hansberg 2008).5
Given the emphasis on the effects of outsourcing at firm, industry and economy-wide levels,
it is quite surprising the limited attention devoted by the empirical literature on the determinants of
offshoring.6 Working on Japanese firms, Tomiura (2005) shows that offshorers are larger, more
productive, produce more labor-intensive goods and have a larger dotation of information and
communication technologies (ICT) than domestic firms. Moreover, firms with previous experience
in foreign activities are more likely to start offshoring, since they face a lower fixed cost of
delocalization. Diaz-Mora (2008) and Pelegrìn and Bolancé (2011) provide similar findings for
Spain using, respectively, industry-level and firm-level data. Hyun (2010) shows that, for Korean
manufacturers, productivity does not explain the decision to offshoring. The latter is more frequent
among firms that are larger, with a higher usage of R&D and ICT, and with a higher labor intensity.
More generally, the choice of offshoring is mainly driven by two goals: 1) the reduction of
costs of production, especially the search for lower labor costs, and 2) a greater proximity to new
markets, driven by the aim of increasing sales (OECD 2007). The firms‟ decision to locate abroad
4 According to the OECD (2010) definition, the index of offshoring at the industry level is constructed as:
where i is the industry Mj are the imports of goods or services j and Dj is the domestic demand for goods or services j.
National indicators are constructed aggregating industry-based measures. 5 The empirical evidence broadly supports this view (Gorg et al. 2008; Daveri and Jona Lasinio 2008; Hijzen et al.
2010; Jabbour 2010). However, higher productivity comes at the cost of higher demand elasticities for production
workers (Senses 2010), increasing job instability (Geishecker 2008; Lo Turco et al. 2012), broadening wage inequality
due to the increase in the relative demand for skilled workers (Feenstra and Hanson 1996; 1999; Broccolini et al. 2011),
and higher unemployment in presence of imperfect intersectoral labor mobility (Mitra and Ranjan 2010). 6 A related strand of literature discusses the determinants of outsourcing and production subcontracting (see, for
instance, Girma and Gorg 2004; Holl 2008).
6
to reduce unit labor cost is the key issue explaining the great attention paid on offshoring by policy-
makers and by the economic research. The existing evidence suggests that international outsourcing
is primarily a cost-cutting strategy. Diaz-Mora (2008) finds that the offshoring intensity is higher in
sectors with higher unit labor costs. Using firm-level data, Pelegrìn and Bolancé (2011) confirm the
presence of cost-cutting strategies by offshoring firms, since firms with worse operating
performance and labor-intensive activities are more likely to relocate part of their production
abroad. The descriptive analysis of the X Survey on Manufacturing Firms, used in the empirical
exercise, also indicates that firms‟ choices to delocalize primarily follow a cost-cutting strategy.
Lower labor costs and input costs are indicated by, respectively, the 49% and the 21% of Italian
offshoring firms as the main driver of delocalization decisions.
3. Labor market reforms
In the past twenty years most industrialized countries have undergone a process of labor market
reforms aimed at introducing more degrees of flexibility in labor relationships. Given strong
political opposition (in particular from labor unions) to lowering guarantees for the stock of open-
ended workers, the trend undertook the path of least resistance and flexibility was introduced
mainly “at the margin”, by increasing the availability of more flexible, non-standard contracts for
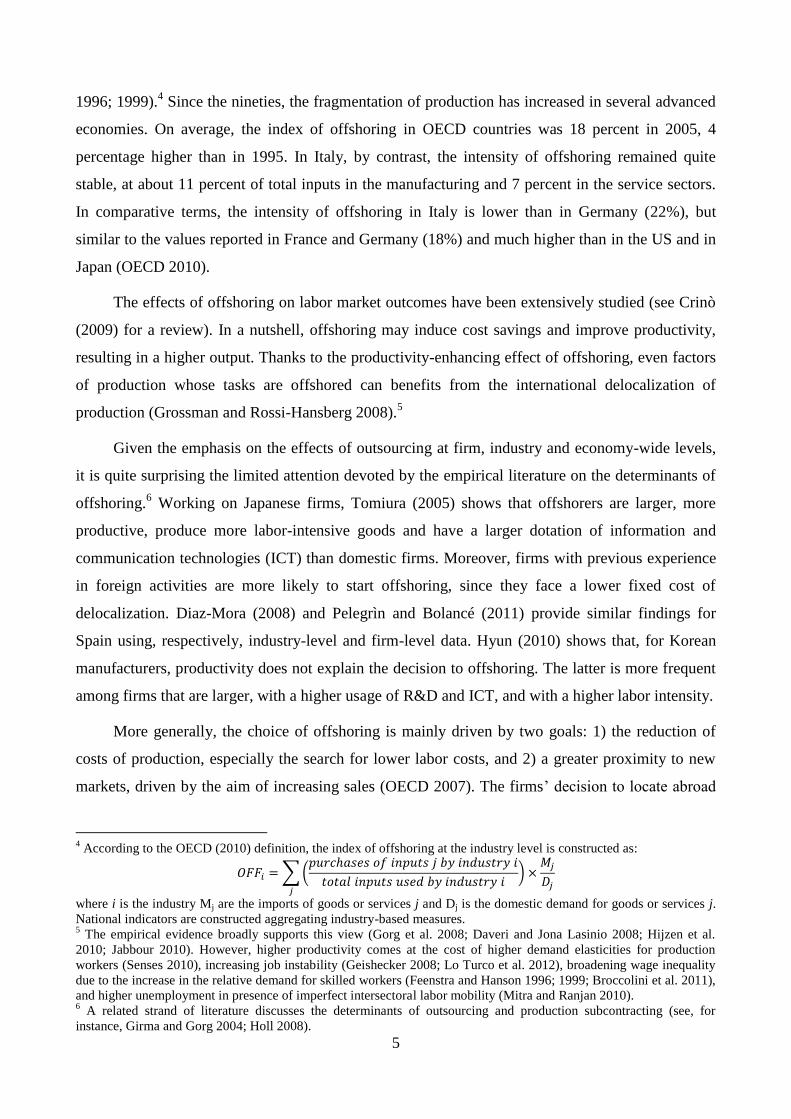
the flow of new hires. This is confirmed by Figure 2, which shows the evolution of the EPL
(Employment Protection Legislation) index between 1990 and 2008 for open-ended (left panel) and
temporary (right panel) contracts. Very little changed for open-ended contracts, with most countries
lying exactly on the 45 degrees line. On the other hand, restrictions to the use of temporary
contracts were lifted and the menu of non-standard contracts enlarged: most countries lie well
below the diagonal, indicating lower restrictions. Italy is an interesting case in this respect, as it is
the country where the EPL index for fixed-term contracts underwent the strongest reduction: from
about 5.5 in 1990 – Italy was the country with the strongest restrictions in the sample – to about 2 in
2008, lower than France and Spain, and not far away from Germany, Denmark and the
Netherlands.7
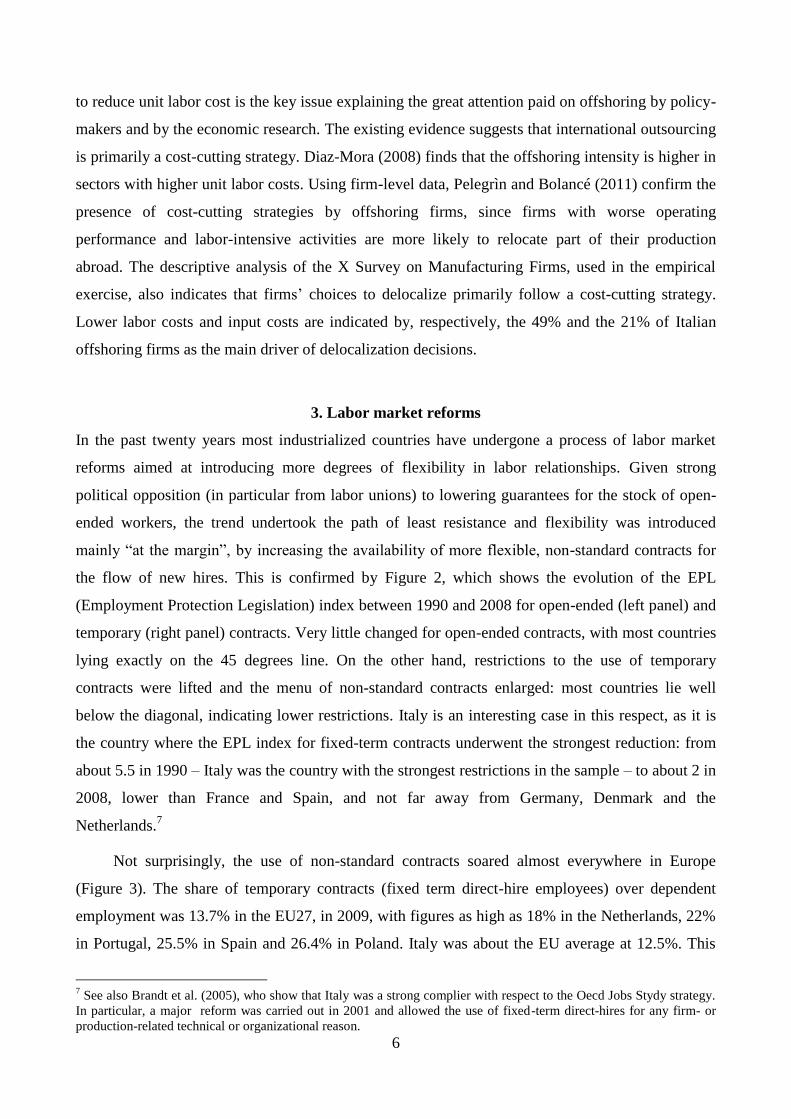
Not surprisingly, the use of non-standard contracts soared almost everywhere in Europe
(Figure 3). The share of temporary contracts (fixed term direct-hire employees) over dependent
employment was 13.7% in the EU27, in 2009, with figures as high as 18% in the Netherlands, 22%
in Portugal, 25.5% in Spain and 26.4% in Poland. Italy was about the EU average at 12.5%. This
7 See also Brandt et al. (2005), who show that Italy was a strong complier with respect to the Oecd Jobs Stydy strategy.
In particular, a major reform was carried out in 2001 and allowed the use of fixed-term direct-hires for any firm- or
production-related technical or organizational reason.
7
share skyrocketed to above 40% in the EU27 for younger workers in the 15-24 age bracket (France,
Germany, Spain, Portugal and Sweden were at about 55%; Poland was at 62%; Italy at 44%).8
Given the shorter duration of temporary contracts with respect to open-ended ones, the incidence of
temporary contracts in hiring is even greater, with Spain reaching 80%.
(a) EPL index for open-ended workers (0 = minimum
protection, 6= maximal protection)
(b) EPL index for temproary workers (0 = least constraints
to hiring, 6= maximal constraints to hiring)
Figure 2: Evolution of EPL index, 1990-2008. Source: Berton et al. (2012)
Figure 3: Temporary work in selected EU countries (% of total number of employees).
Source: European Commission 2011
8 The crisis induced a decrease in the share of fixed-term contracts, as those were the first to be dismissed. The
maximum was achieved, in most countries, in 2007.
8
Temporary contracts are used, in addition to screening purposes9, because they entail lower
costs for firms, both in terms of dismissal costs and – in many cases – in terms of unit (wage) costs.
They permit a sort of “employment at will” behaviour of firms, as temporary workers can be freely
dismissed when the contract expires, and contract durations are generally short.10
Moreover, in
many countries no dismissal costs are due to the worker upon expiration.11
On the contrary, firing
an open-ended worker generally requires a justification, which can be challenged by the worker and
reversed by a labor court, with the whole process taking time, money, and uncertainty. The threat of
taking the firm to the court often induces high voluntary dismissal payments, even when they are
not envisaged by the legislation (as in Italy). Moreover, upon termination of the contract open-
ended workers are often provided with end-of-service allowances.
The wage bill for non-standard contracts is also lower, as these contracts often entail lower
social contributions and wages are also lower due to a weaker bargaining position of fixed-term
workers. The European Commission estimates an average wage penalty for temporary contracts of
14.2% (European Commission 2011). This average masks strong heterogeneity among contracts
and among countries. For instance, in Germany temp agency workers appear to suffer from a more
substantial penalty: Oberst et al (2007) estimate a wage gap of 29% for 2005, while Jahn (2008),
after controlling for observed and unobserved characteristics, places the penalty at 15-18%. By
converse, the most discriminated category in Italy is that of project workers12
, with a penalization of
up to 25% in terms of net wage and up to 50% in terms of gross wage. On the contrary, temporary
contracts (fixed-term direct hires) – the focus of our analysis – entail little or no wage
discrimination and differ from open-ended contacts only insofar as they are characterized, as
discussed above, by reduced dismissal costs (Berton et al. 2012).
4. Data and identification strategy
The data we use in the empirical analysis are drawn from the IX and X "Survey on Manufacturing
Firm" (SMF) administered every three years by the Unicredit banking group. The SMF is a large
survey of about 4,000 Italian manufacturing firms with more than 10 employees and includes
several information on firms' internationalization and labor force composition over a three-years
period. The sampling procedure creates a rotating panel so that around one third of firms
interviewed in 2003 are still present in the 2006 wave. Missing data and outliers in the main
9 See for instance (Portugal and Varejão, 2009)
10 In facts, temporary contracts are less diffused in countries with a lower EPL for open-ended contracts, like the UK.
11 Dismissal payments, proportional to accrued seniority, are envisaged in some countries (e.g. France and Spain).
12 Wage and salary independent contractors in US parlance.
9
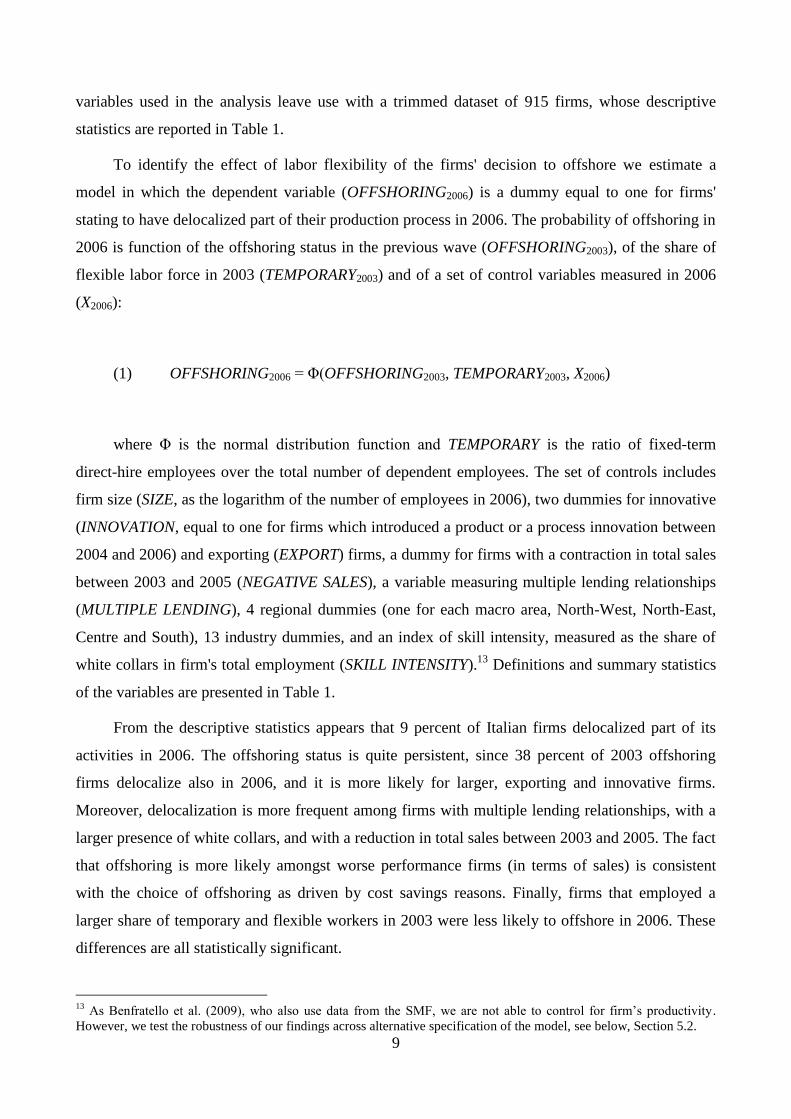
variables used in the analysis leave use with a trimmed dataset of 915 firms, whose descriptive
statistics are reported in Table 1.
To identify the effect of labor flexibility of the firms' decision to offshore we estimate a
model in which the dependent variable (OFFSHORING2006) is a dummy equal to one for firms'
stating to have delocalized part of their production process in 2006. The probability of offshoring in
2006 is function of the offshoring status in the previous wave (OFFSHORING2003), of the share of
flexible labor force in 2003 (TEMPORARY2003) and of a set of control variables measured in 2006
(X2006):
(1) OFFSHORING2006 = Φ(OFFSHORING2003, TEMPORARY2003, X2006)
where Φ is the normal distribution function and TEMPORARY is the ratio of fixed-term
direct-hire employees over the total number of dependent employees. The set of controls includes
firm size (SIZE, as the logarithm of the number of employees in 2006), two dummies for innovative
(INNOVATION, equal to one for firms which introduced a product or a process innovation between
2004 and 2006) and exporting (EXPORT) firms, a dummy for firms with a contraction in total sales
between 2003 and 2005 (NEGATIVE SALES), a variable measuring multiple lending relationships
(MULTIPLE LENDING), 4 regional dummies (one for each macro area, North-West, North-East,
Centre and South), 13 industry dummies, and an index of skill intensity, measured as the share of
white collars in firm's total employment (SKILL INTENSITY).13
Definitions and summary statistics
of the variables are presented in Table 1.
From the descriptive statistics appears that 9 percent of Italian firms delocalized part of its
activities in 2006. The offshoring status is quite persistent, since 38 percent of 2003 offshoring
firms delocalize also in 2006, and it is more likely for larger, exporting and innovative firms.
Moreover, delocalization is more frequent among firms with multiple lending relationships, with a
larger presence of white collars, and with a reduction in total sales between 2003 and 2005. The fact
that offshoring is more likely amongst worse performance firms (in terms of sales) is consistent
with the choice of offshoring as driven by cost savings reasons. Finally, firms that employed a
larger share of temporary and flexible workers in 2003 were less likely to offshore in 2006. These
differences are all statistically significant.
13
As Benfratello et al. (2009), who also use data from the SMF, we are not able to control for firm‟s productivity.
However, we test the robustness of our findings across alternative specification of the model, see below, Section 5.2.
10
Table 1: Variables‟ definitions and descriptive statistics
Notes: our elaboration on Survey on Manufacturing Firm (SMF) data, IX and X waves. Data on instrumental variables
originally refer to the 103 Italian administrative provinces, as were in 2002, but actual figures are based on 94
provinces, since provinces are aggregated to the old classification of 95 provinces and one province is not represented
in the final SMF data set used in the analysis. * Significant at 10%; ** significant at 5%; *** significant at 1%.
Equation (1) is firstly estimated by a standard probit and a linear probability model. However,
the model could suffer from simultaneity and omitted variable biases. Even if the labor market
flexibility variable is predetermined, it could still be endogenous to the firms' offshoring propensity.
In fact, the decision to delocalize part of the production process abroad in the near future could
affect the current composition of the labor force. This may result in an increase of the share of
flexible contracts, to facilitate the future offshoring process, or to a reduction of temporary workers,
if firms see the expected delocalization as a cost-cutting strategy alternative to flexibilization
Variables Description Mean # obs.
Dependent variable
OFFSHORING2006 (0,1)
Dummy equal to 1 if the firm has declared to
perform abroad part of his activities in 2006, 0
otherwise.
0.090 915
Explanatory variables
OFFSHORING2006 T-test
Yes No (one tail)
OFFSHORING2003 (0,1)
Dummy equal to 1 if the firm has declared to
perform abroad part of his activities in 2003, 0
otherwise.
0.378 0.070 *** 915
TEMPORARY2003 Share of fixed-term direct-hire employees over
total dependent employees, in 2003. 0.015 0.042 ** 915
EXPORT2006 (0,1) Dummy equal to 1 if the firm exported abroad
part of his production in 2006, 0 otherwise. 0.951 0.753 *** 915
INNOVATION2006 (0,1)
Dummy equal to 1 if the firm has introduced a
product and/or process innovation in the period
2004-2006, 0 otherwise.
0.707 0.557 *** 915
SIZE2006 Logarithm of the number of employees,
excluding term contract workers, in 2006. 4.781 4.316 *** 915
SKILL INTENSITY2006 Share of white collars employees over the total
number of employees, in 2006. 0.427 0.358 *** 915
MULTIPLE LENDING2006 The number of banks with which the firm does
business, in 2006. 7.963 6.191 *** 915
NEGATIVE SALES (0,1) Dummy equal to one if the firm has a negative
variation in sales between 2005 and 2003 0.447 0.338 ** 915
Instrumental variables
TEMPORARY_PROV
Share of temporary workers (fixed-term
dependent employees and project workers) over
the total dependent employees, at the provincial
level, in 2002. Source: Italian Social
Security Administration (INPS)
0.157 94
MIGRANTS_PROV
Share of foreign resident population over total
resident population at the provincial level in
2002. Source: Italian Statistical Office (ISTAT).
0.013 94
11
(Pelegrìn and Bolancé 2011). This case is consistent with the firms‟ own statements about the
reasons why they offshore, with the descriptive analysis of the data (Table 1), and with the lower
relative demand by offshoring firms for unskilled labor (Head and Ries 2002; Hijzen et al. 2005;
Becker et al. 2009), where temporary workers are relatively more present. Under this scenario, the
OLS estimates would be negatively biased. Second, it is possible that both offshoring and labor
force flexibility are jointly driven by other unobserved factors, such as the degree of market
competition.
To address these problems we rely on IV techniques. In absence of firm-level variables which
could affect the composition of the labor force, but not the decision to delocalize part of the
production, we instrument TEMPORARY with: 1) the share of temporary over total dependent
employees at the provincial level in 2002 (TEMPORARY_PROV)14
, and 2) the share of foreign
resident population over total resident population at the provincial level in 2002
(MIGRANTS_PROV). The former variable, being a measure of labor force flexibility calculated at
the provincial level, should not affect the individual decision to offshore (the instrument is
exogenous) but it should be correlated with TEMPORARY (the instrument is relevant), since the
contract types workers are offered are highly persistent (Berton et al. 2011) and the aggregate
number of employees with temporary contracts represents a pool from which firms can fish. Similar
considerations can be made for the provincial share of migrants. Its correlation with the share of
offshoring firms at provincial level is extremely low (0.04) and not statistically significant, making
it an exogenous instrument. On the other hand, immigrants are more likely to hold an open-ended
job with respect to natives: 72.0% vs. 64.8% among dependent employment, according to a study
by Fondazione Moressa (Fondazione Moressa 2011).15
In addition to the economic justification for the choice of the instruments provided above, in
our empirical analysis we test the statistical validity of the instruments.16
In the robustness analysis
we will further deepen the discussion of our IV strategy, see below, Section 5.2.
Our preferred specification is a linear probability model estimated by two-stage least squares
(2SLS), which has the advantage of providing diagnostic tests for over-identifying restrictions,
14
Italian Social Security Administration (INPS) data. We thank Fabio Berton for providing the computation. 15
This is also due to a higher incidence of irregular work among immigrants, which partly substitutes temporary
employment. 16
We tried several different variables –at firm, industry, and provincial level– which may be candidate for being good
instruments. In particular, we used firms‟ age, a dummy for firms which fired at least one employee in 2003, the share
of temporary workers at regional and industry (2-digit) level, the provincial youth unemployment rate, a provincial
measure of human capital stock, the ratio of labor force aged 15-34 over labor force aged 35-64 at province level, the
provincial participation rates in the labor market of individuals aged 15-24, 15-34 and 25-34. All these variables proved
to be bad instruments, either because they do not satisfy the relevance or the exogeneity condition.
12
under-identification, and weak identification.17
Additionally, we report the results of the estimation
of a probit model with endogenous regressors by maximum likelihood.
5. Results
5.1 Baseline model
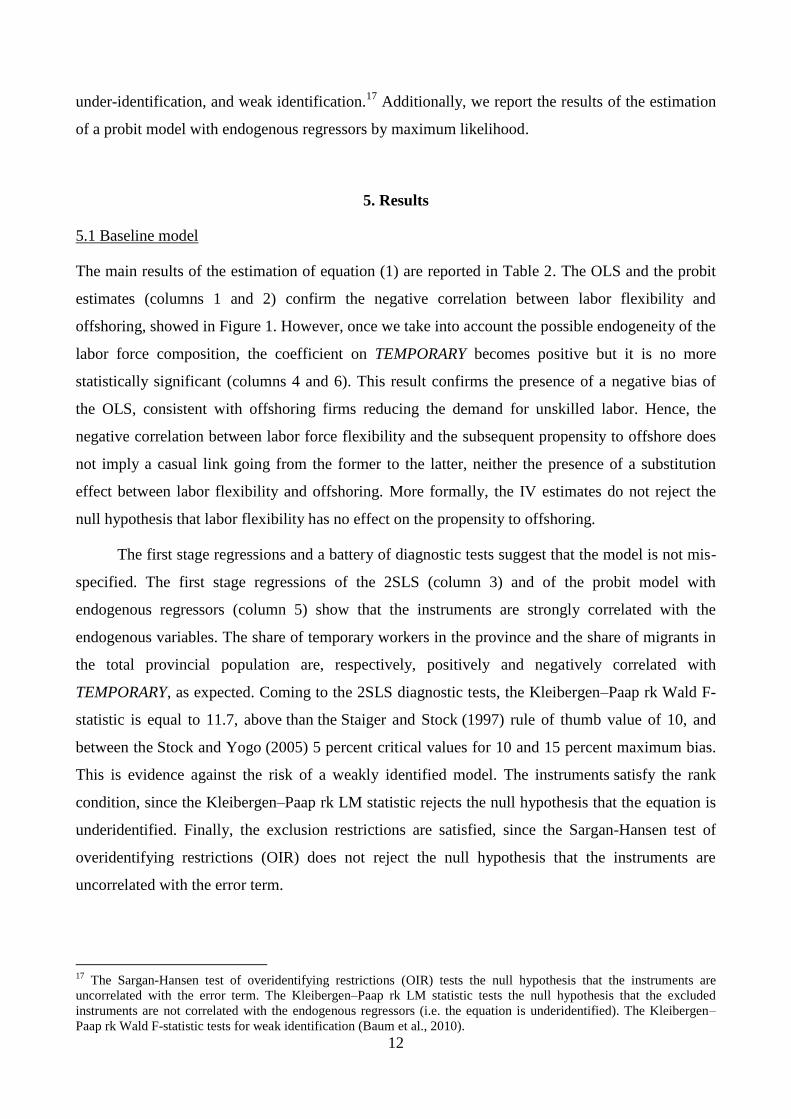
The main results of the estimation of equation (1) are reported in Table 2. The OLS and the probit
estimates (columns 1 and 2) confirm the negative correlation between labor flexibility and
offshoring, showed in Figure 1. However, once we take into account the possible endogeneity of the
labor force composition, the coefficient on TEMPORARY becomes positive but it is no more
statistically significant (columns 4 and 6). This result confirms the presence of a negative bias of
the OLS, consistent with offshoring firms reducing the demand for unskilled labor. Hence, the
negative correlation between labor force flexibility and the subsequent propensity to offshore does
not imply a casual link going from the former to the latter, neither the presence of a substitution
effect between labor flexibility and offshoring. More formally, the IV estimates do not reject the
null hypothesis that labor flexibility has no effect on the propensity to offshoring.
The first stage regressions and a battery of diagnostic tests suggest that the model is not mis-
specified. The first stage regressions of the 2SLS (column 3) and of the probit model with
endogenous regressors (column 5) show that the instruments are strongly correlated with the
endogenous variables. The share of temporary workers in the province and the share of migrants in
the total provincial population are, respectively, positively and negatively correlated with
TEMPORARY, as expected. Coming to the 2SLS diagnostic tests, the Kleibergen–Paap rk Wald F-
statistic is equal to 11.7, above than the Staiger and Stock (1997) rule of thumb value of 10, and
between the Stock and Yogo (2005) 5 percent critical values for 10 and 15 percent maximum bias.
This is evidence against the risk of a weakly identified model. The instruments satisfy the rank
condition, since the Kleibergen–Paap rk LM statistic rejects the null hypothesis that the equation is
underidentified. Finally, the exclusion restrictions are satisfied, since the Sargan-Hansen test of
overidentifying restrictions (OIR) does not reject the null hypothesis that the instruments are
uncorrelated with the error term.
17
The Sargan-Hansen test of overidentifying restrictions (OIR) tests the null hypothesis that the instruments are
uncorrelated with the error term. The Kleibergen–Paap rk LM statistic tests the null hypothesis that the excluded
instruments are not correlated with the endogenous regressors (i.e. the equation is underidentified). The Kleibergen–
Paap rk Wald F-statistic tests for weak identification (Baum et al., 2010).
13
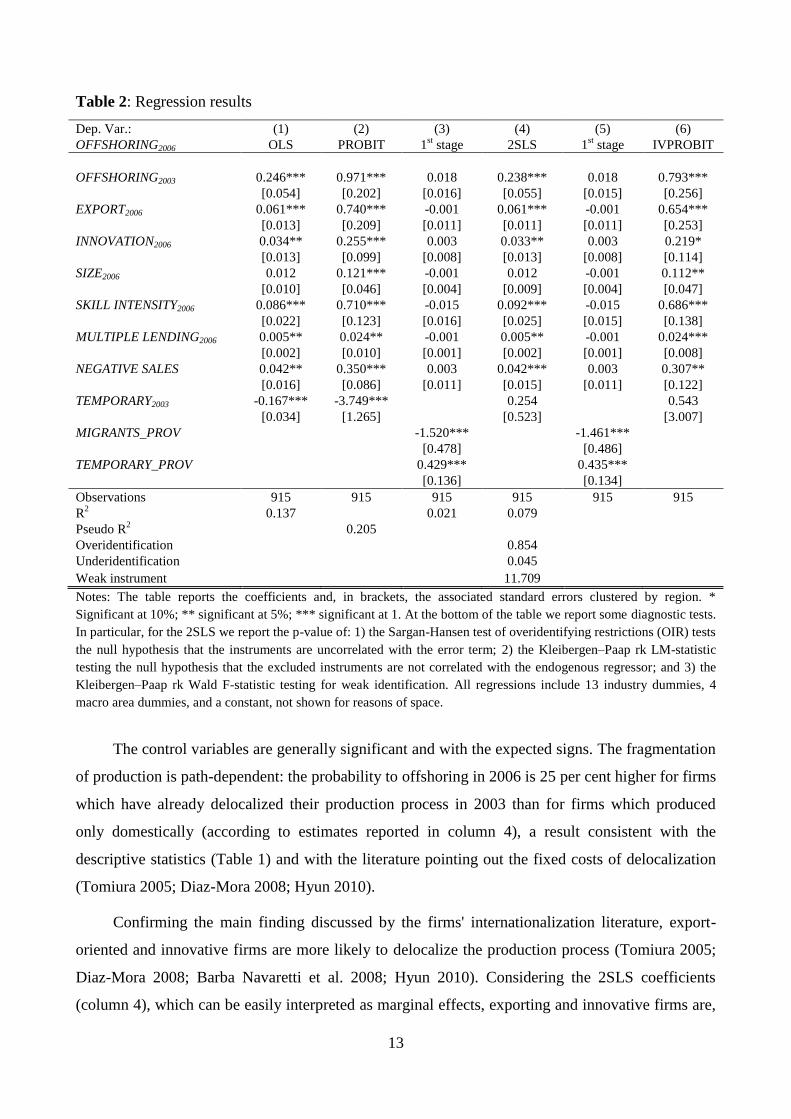
Table 2: Regression results
Dep. Var.: (1) (2) (3) (4) (5) (6)
OFFSHORING2006 OLS PROBIT 1st stage 2SLS 1
st stage IVPROBIT
OFFSHORING2003 0.246*** 0.971*** 0.018 0.238*** 0.018 0.793***
[0.054] [0.202] [0.016] [0.055] [0.015] [0.256]
EXPORT2006 0.061*** 0.740*** -0.001 0.061*** -0.001 0.654***
[0.013] [0.209] [0.011] [0.011] [0.011] [0.253]
INNOVATION2006 0.034** 0.255*** 0.003 0.033** 0.003 0.219*
[0.013] [0.099] [0.008] [0.013] [0.008] [0.114]
SIZE2006 0.012 0.121*** -0.001 0.012 -0.001 0.112**
[0.010] [0.046] [0.004] [0.009] [0.004] [0.047]
SKILL INTENSITY2006 0.086*** 0.710*** -0.015 0.092*** -0.015 0.686***
[0.022] [0.123] [0.016] [0.025] [0.015] [0.138]
MULTIPLE LENDING2006 0.005** 0.024** -0.001 0.005** -0.001 0.024***
[0.002] [0.010] [0.001] [0.002] [0.001] [0.008]
NEGATIVE SALES 0.042** 0.350*** 0.003 0.042*** 0.003 0.307**
[0.016] [0.086] [0.011] [0.015] [0.011] [0.122]
TEMPORARY2003 -0.167*** -3.749***
0.254
0.543
[0.034] [1.265]
[0.523]
[3.007]
MIGRANTS_PROV
-1.520***
-1.461***
[0.478]
[0.486]
TEMPORARY_PROV
0.429***
0.435***
[0.136]
[0.134]
Observations 915 915 915 915 915 915
R2 0.137
0.021 0.079
Pseudo R2
0.205
Overidentification
0.854
Underidentification
0.045
Weak instrument 11.709
Notes: The table reports the coefficients and, in brackets, the associated standard errors clustered by region. *
Significant at 10%; ** significant at 5%; *** significant at 1. At the bottom of the table we report some diagnostic tests.
In particular, for the 2SLS we report the p-value of: 1) the Sargan-Hansen test of overidentifying restrictions (OIR) tests
the null hypothesis that the instruments are uncorrelated with the error term; 2) the Kleibergen–Paap rk LM-statistic
testing the null hypothesis that the excluded instruments are not correlated with the endogenous regressor; and 3) the
Kleibergen–Paap rk Wald F-statistic testing for weak identification. All regressions include 13 industry dummies, 4
macro area dummies, and a constant, not shown for reasons of space.
The control variables are generally significant and with the expected signs. The fragmentation
of production is path-dependent: the probability to offshoring in 2006 is 25 per cent higher for firms
which have already delocalized their production process in 2003 than for firms which produced
only domestically (according to estimates reported in column 4), a result consistent with the
descriptive statistics (Table 1) and with the literature pointing out the fixed costs of delocalization
(Tomiura 2005; Diaz-Mora 2008; Hyun 2010).
Confirming the main finding discussed by the firms' internationalization literature, export-
oriented and innovative firms are more likely to delocalize the production process (Tomiura 2005;
Diaz-Mora 2008; Barba Navaretti et al. 2008; Hyun 2010). Considering the 2SLS coefficients
(column 4), which can be easily interpreted as marginal effects, exporting and innovative firms are,
14
respectively, 6.0 and 3.3 per cent more likely to offshore than firms which sell all their production
in Italy and do not introduce product or process innovations.
While firm size is usually a good predictor of firm‟s internationalization, the coefficient on
SIZE is significant only in the probit models, while not in the OLS and 2SLS estimates. This may
be due to the presence of the lagged OFFSHORING variable, since in a static model the coefficient
on SIZE is highly significant in all specifications (see Section 5.2 below).
Offshoring is more likely to occur for firms with a larger share of white collars, consistently
with a larger presence of offshoring firms in skill-intensive sectors (Diaz-Mora 2008; Pelegrìn and
Bolancé 2011). In addition, the choice to delocalize is more frequent among firms who were
experiencing a negative performance in terms of sales, suggesting that offshoring may be driven by
the need to reduce production costs to gain competitiveness. As regards the financial variable,
results show that firms borrowing from more banks are more likely to offshore. This could be
consistent with the fact that multiple lending is a more frequent phenomenon for large firms, but
also with an easier access to bank credit, since multiple lending is associated with less binding
financing constraints for Italian SMEs (Alessandrini et al. 2009). Finally, the macro area dummies
are generally not significant, suggesting that geographical location is not correlated with firms‟
propensity to offshoring.
5.2 Robustness exercises
We run a battery of additional exercises to test the validity of our main findings. In particular,
results are robust to: 1) the estimation of a static version of equation (1) excluding
OFFSHORING2003, which should be less subject to autocorrelation problems in the error term; 2) an
alternative definition of TEMPORARY, including also project workers; 3) the inclusion of a series
of additional control variables, potentially correlated with the offshoring decisions (i.e. firm‟s age, a
dummy for credit rationed firms, a dummy for investment in R&D as alternative measure of
innovation, a dummy for firms belonging to groups, a dummy for family firms); 4) the distinction
between low-and high-tech industries; and 5) an IV estimation with exact identification, even if we
slightly relax the exclusion restriction. While full results are reported in the Annex Tables, here we
discuss the most relevant findings.
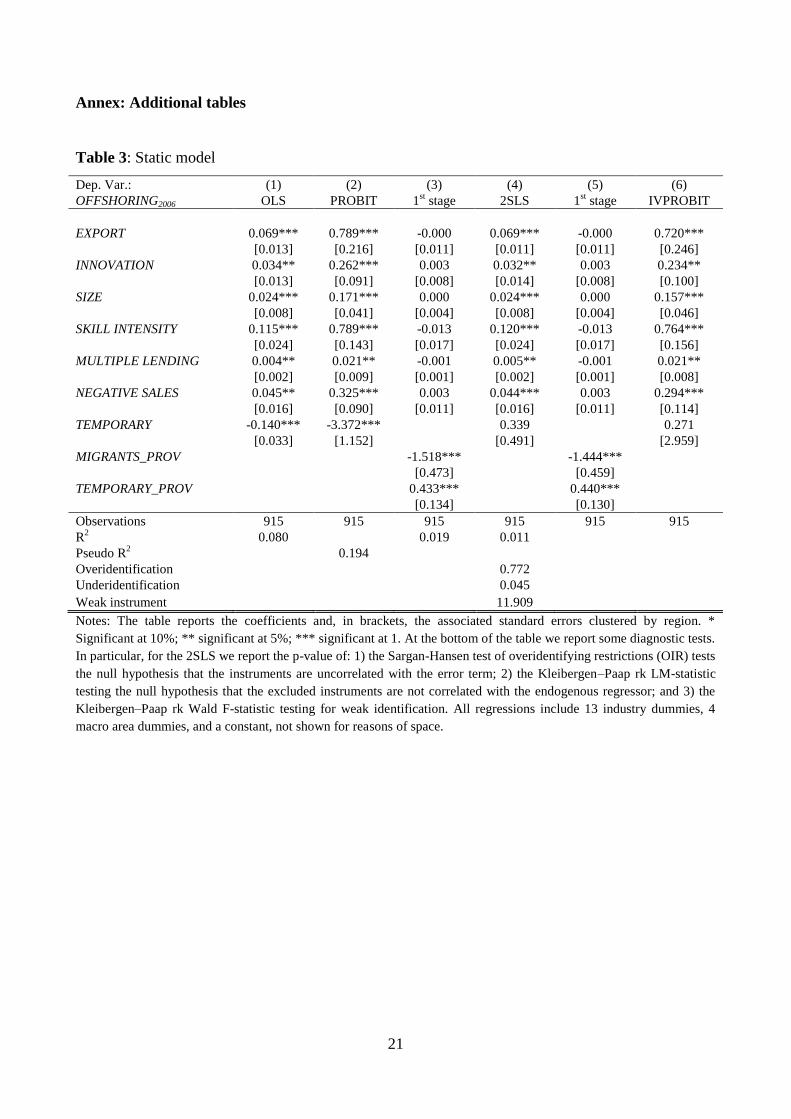
The estimation of a static model (Table 3) confirms our main results, showing also a positive
and significant coefficient on SIZE, consistent with the empirical findings of the literature about the
positive correlation between size and internationalization.
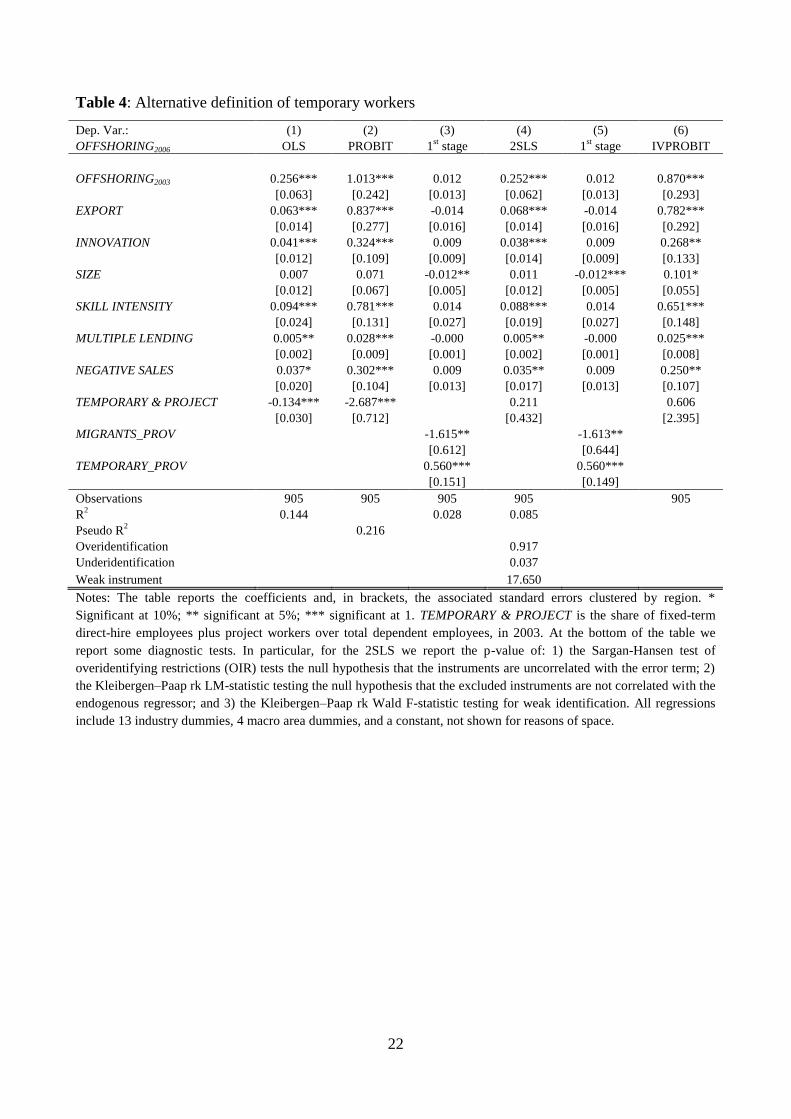
The negative correlation between flexible labor force and offshoring is confirmed even using
15
a broader definition of TEMPORARY including also project workers (Table 4). This correlation
vanishes in the IV estimates and the first stage regression in the 2SLS is even better than in the
baseline, since the F-statistic is now greater than 17, above the Stock and Yogo (2005) five percent
critical values for ten percent maximum bias.
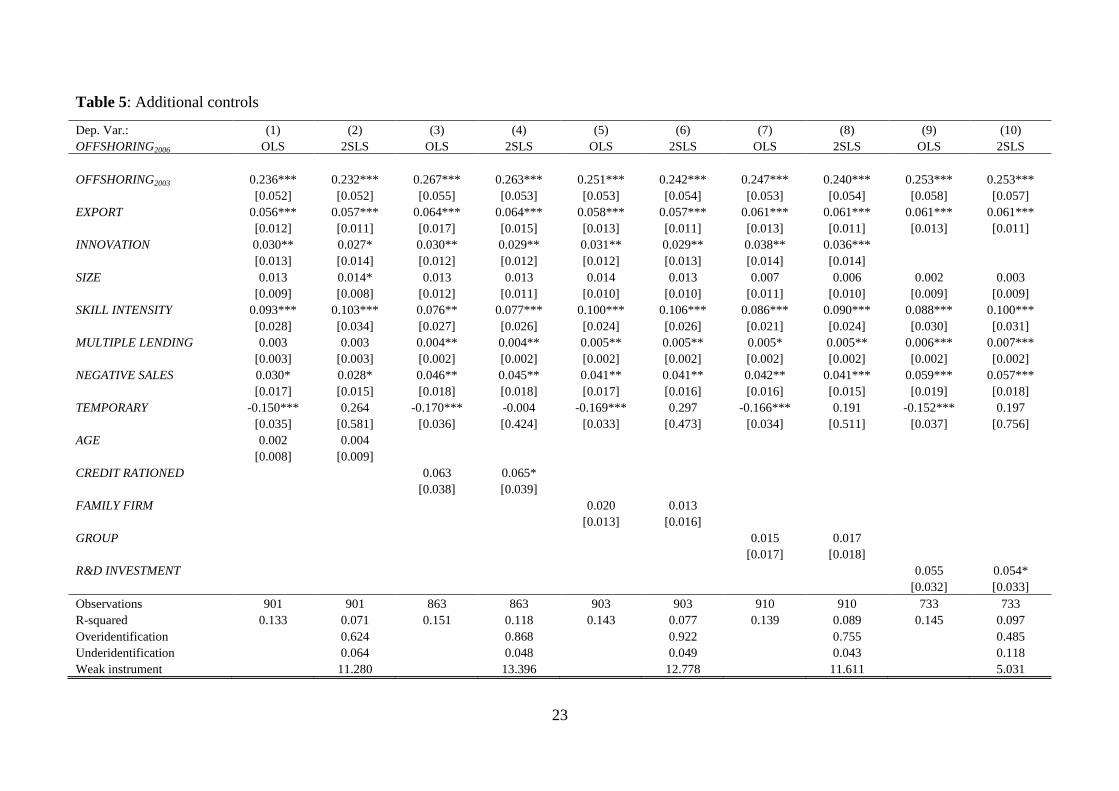
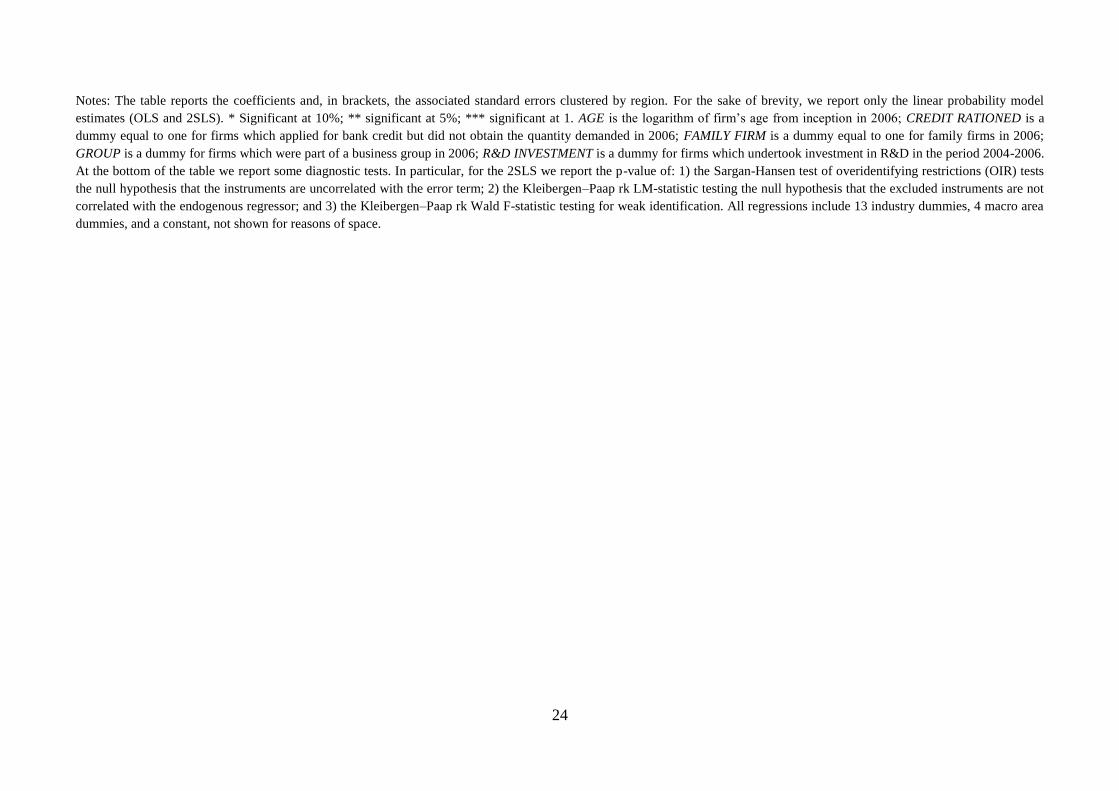
Adding several different control variables that may be correlated with the propensity to
offshore does not alter the main regression results, neither provides valuable insights (Table 5). In
additional regressions, we also included regional dummies instead of the four macro-area dummies
and results are almost identical.
The lack of a causal effect going from labor flexibility to offshoring may be the outcome of
some neglected heterogeneity. One possible source of heterogeneity is related to the intensity of
R&D and ICT, which is generally associated with a higher propensity to offshoring (Tomiura 2005;
Hyun 2010). Firms operating in high-technology sectors may be less exposed to international
competition and they can choose to delocalize in order to expand their markets. By contrast, firms
operating in low-tech, traditional sectors are more exposed to international competition and they
may decide to delocalize for cost savings reasons in order to re-gain competitiveness. Hence, for the
former offshoring is an active strategy whose relationship with labor flexibility is uncertain a priori,
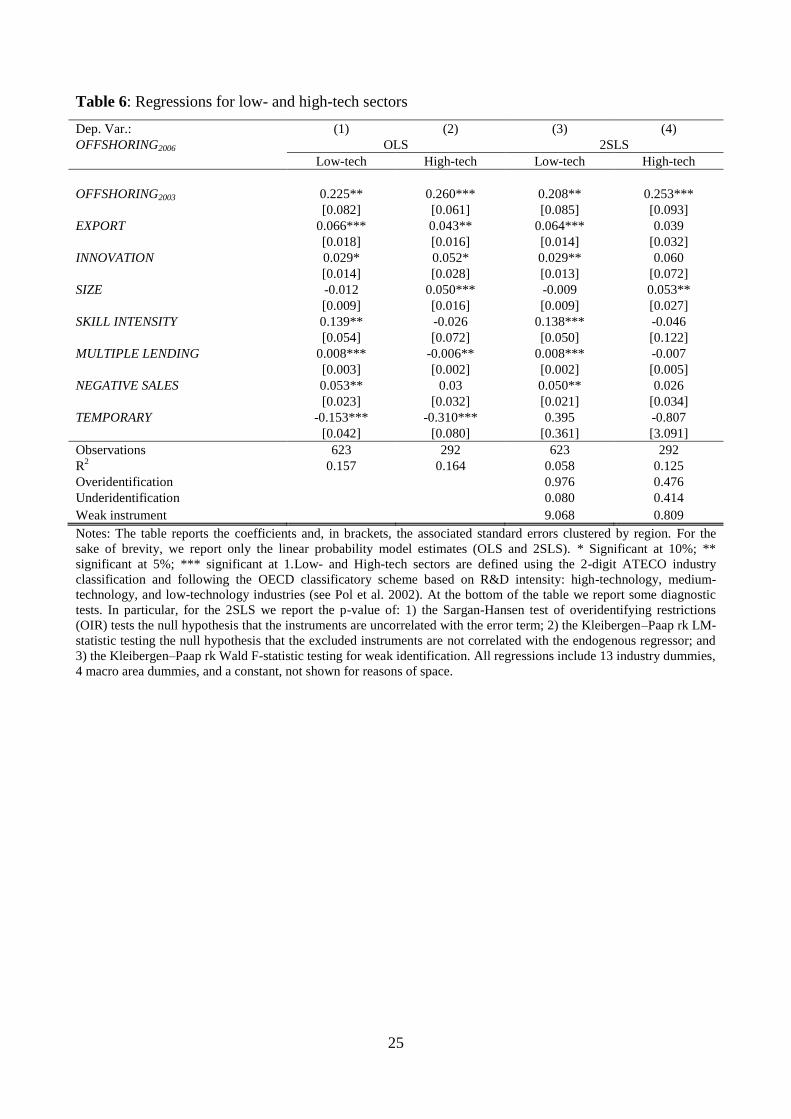
while for the latter offshoring may be a passive strategy, alternative to labor flexibility. Table 6
shows that the main result of the paper holds even if we split the sample between firms operating in
low-tech and high-tech sectors. In both sub-samples we observe a negative correlation between
TEMPORARY and OFFSHORING (column 1 and 2), but the 2SLS again show that this correlation
in no more statistically significant when reverse causality is taken into account. The diagnostic of
the IV estimates is still good in the low-tech sub-sample, while it worsens in the high-tech sub-
sample, but this is likely the result of a much smaller sample.
Finally, we recognize that the choice of the instruments may be challenged and not fully
convincing. We have already discussed the reason why we did not use alternative firm- industry-
and province-level variables as instruments (see footnote 15). Here, we aim at further discussing
our IV strategy to convince the reader of its validity.
First, we recognize that the choice of MIGRANTS_PROV as instrument for TEMPORARY
may be not be fully convincing, notwithstanding its low correlation with offshoring, at firm- and
province-level. Therefore, we run our baseline model with just one instrument
(TEMPORARY_PROV), finding very similar results to the one presented in Table 2. Nonetheless,
we choose to present the model with both instruments since we can test for the overidentifying
restrictions.
16
Second, we use the Kraay‟s (2012) Bayesian approach to build confidence intervals for
instrumental variable regressions with weak exclusion restrictions. The first stage regressions
reported in Table 2 (and in the other Annex Tables) should have convinced the reader that our
instruments are relevant, i.e they are correlated with TEMPORARY. What is probably more
challenging is the excluding restriction. We have discussed why the share of temporary workers and
of migrants in the province should not affect the firm‟s decision to offshoring. This assumption is
supported by some basic correlations at province level.18
Anyway, we can imagine that some
skeptical reader may not be fully convinced. Hence, we adopt a Bayesian approach recently
developed by Kraay (2012) for 2SLS exactly identified models to see what happens if we relax our
exclusion restriction. According to Kraay (2012, p. 112), the assumption that the instrument is not
correlated with the error term of the structural equation “is likely to be a poor approximation to the
actual prior belief of empirical researchers.” In a nutshell, the Kraay‟s Bayesian approach
quantifies the consequence of prior uncertainty on the validity of the exclusion restriction and maps
the degree of uncertainty on the precision of the estimate of the structural parameter.19
Simulations
show that even moderate prior uncertainty can have a large effect on the precision of the estimated
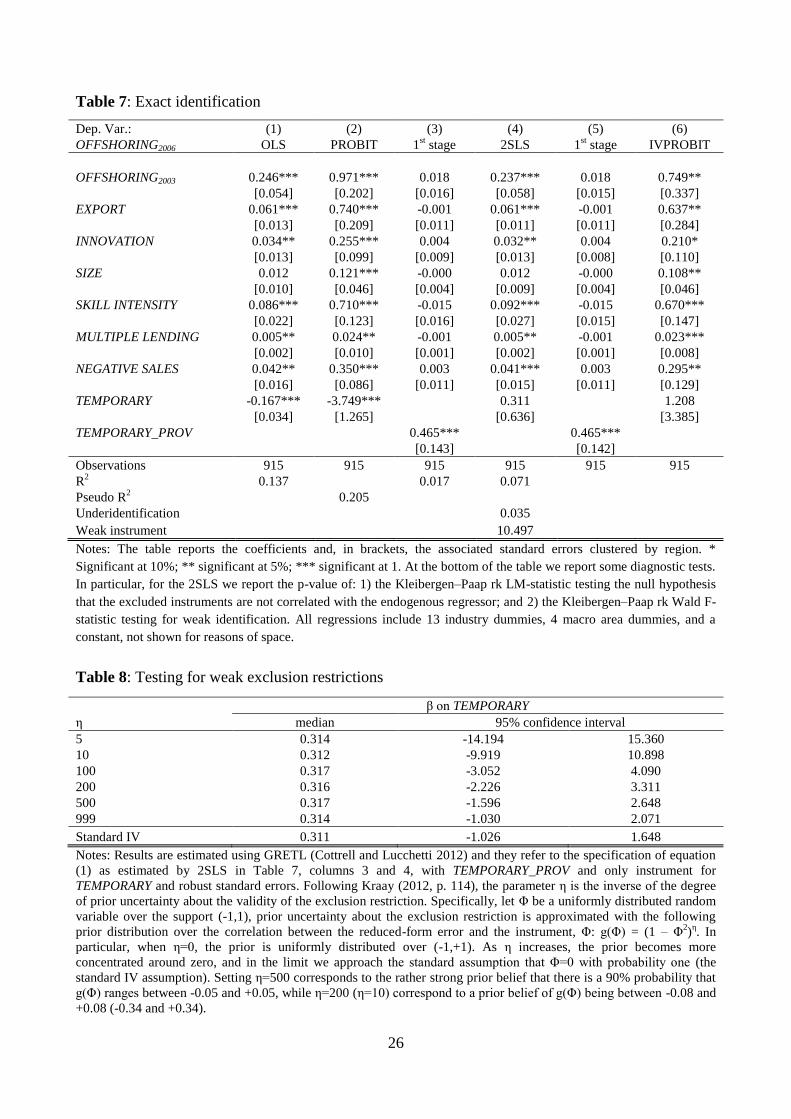
parameters. We use the Kraay‟s approach in a linear model identical to the one with
TEMPORARY_PROV as a unique instrument (as the one reported in Table 7, columns 4 and 5) to
examine the consequence of weakening our priors about the validity of the exclusion restriction.
We find that a strong violation of our exclusion restriction yields very large confidence interval
(Table 8). In particular, when η=10 (implying that uncertainty is high, since there is a 90 percent
probability that the correlation Φ between the error term and the instrument is between -0.34 and
+0.34), the confidence interval of the coefficient on TEMPORARY is more than seven times larger
than those of the IV regressions in which the correlation is assumed to be zero. However, when
uncertainty is lower (η=200) so that the 90% confidence interval of Φ is (-0.08, 0.08), the
confidence interval of the coefficient on TEMPORARY becomes only twice larger than that of the
IV estimates. With η=500 the confidence intervals are even closer, suggesting that a small
relaxation of the excluding restriction would not affect the validity of our main result.
6. Concluding remarks
The fragmentation of production processes and an increasing flexibility of the labor force are two
growing features of the global economy. In this paper, we take Italy as a representative case study
18
The correlation coefficients between the share of offshoring firms in 2006 and (i) the share of temporary workers; (ii)
the share of migrants are, respectively, 0.12 and 0.04 and they are not significant at the 10% level of confidence. 19
See the notes to Table 8 and Kraay (2012) for a more detailed and formal description of this Bayesian technique.
17
to assess whether the use of a more flexible labor force acts as a substitute to offshoring, or whether
it further enhances delocalization. Firms engaging in offshoring are generally moved by cost-
savings reasons and by the necessity to be closer to new potential markets. The replacement of
permanent with temporary workers, made possible by recent legislative reforms in the Italian labor
markets, could partially offset the potential advantages of offshoring, reducing in particular
dismissal costs and increasing numerical flexibility. Alternatively, a more flexible occupational mix
could make it easier to substitute domestic with foreign labor, making easier to firms to reap the
potential benefits of offshoring opportunities.
The estimation of a model aimed at explaining the firm‟s propensity to offshore, based on a
representative sample of Italian manufacturers, shows that there is a negative correlation between
labor flexibility and offshoring, suggesting that the two phenomena can be substitute rather than
complements. However, the OLS estimates are likely to be negatively biased. The cost-saving
strategies driving offshoring firms reduce the relative demand for unskilled tasks, where temporary
jobs are concentrated, and may introduce a negative correlation between the current labor force
composition and the future delocalization choice. Once we control for the endogeneity of the share
of temporary workers and for spurious correlation, we find that the share of temporary workers does
no more contribute to explain the firms‟ propensity to offshoring. This means that the negative
correlation between labor flexibility and subsequent delocalization observed in the data (Figure 1)
cannot be interpreted as causation. More precisely, we cannot reject the null hypothesis that labor
flexibility has no effect on the propensity to offshoring. While we recognize that our paper does not
provide a definitive result, we believe it significantly contributes to the literature and to the policy
discussion.
Our results suggest that, on the basis of the available evidence, we should not bother too
much about the interaction between labor force flexibility and offshoring decisions. In particular,
political support for labor market reforms aimed at further liberalizing the labor market should not
be sought after on the implicit threat that firms would otherwise relocate their production abroad.
According to our estimates, a solid argument that labor flexibility and offshoring are substitutes has
still to be made.
18
References
Alessandrini, P., Presbitero, A.F. and Zazzaro, A. (2009). Banks, Distances, and Firms‟ Financing
Constraints, Review of Finance, 13(2): 261-307.
Barba Navaretti, G., Bertola, G. and Sembenelli, A. (2008). Offshoring and immigrant employment:
Firm-level theory and evidence, CEPR Discussion Papers, No. 6743.
Barkbu, B., Rahman, J. and Valdés, R. (2012). Fostering Growth in Europe Now, IMF Staff
Discussion Note No. 12/17.
Baum, C. F., Schaffer, M. E., and Stillman, S. (2010). ivreg2: Stata Module for Extended
Instrumental Variables/2SLS, GMM and AC/HAC, LIML and k-class Regression. Technical
report. Available online at: http://ideas.repec.org/c/boc/bocode/s425401.html.
Becker, S.O., Ekholm, K.. and Muendler, M-A (2009). Offshoring and the Onshore Composition of
Tasks and Skills, CEPR Discussion Papers, No. 7391.
Benfratello, L., Razzolini, T. and Sembenelli, A. (2009). Does ICT Investment Spur or Hamper
Offshoring? Empirical Evidence from Microdata, unpublished, University of Turin.
Berton, F., Devicienti, F., Pacelli (2011). Are temporary jobs a port of entry into permanent
employment? Evidence from matched employer-employee data, International Journal of
Manpower, 32(8): 879-899.
Berton, F., Richiardi, M. and Sacchi, S. (2012). The political economy of work security and
flexibility: Italy in comparative perspective, Bristol: Policy Press
Broccolini C., Lo Turco A., Presbitero A.F. e Staffolani S. (2011). Individual Earnings,
International Outsourcing and Technological Change, International Economic Journal
25(1): 29-46.
Cottrell, A. and Lucchetti, R. (2012). Gretl User‟s Guide. Available for download at:
http://sourceforge.net/projects/gretl/files/manual/gretl-guide.pdf/download
Crinò, R. (2009). Offshoring, Multinationals and Labour Market: A Review of the Empirical
Literature, Journal of Economic Surveys 23(2): 197-249.
Daveri, F. and Jona-Lasinio, C. (2008). Off-shoring and Productivity Growth in the Italian
Manufacturing Industries, CESifo Economic Studies 54(3): 414-450.
Dìaz-Mora, C. (2008). What Factors Determine the Outsourcing Intensity? A Dynamic Panel Data
Approach for Manufacturing Industries, Applied Economics 40(19): 2509-2521.
Esping-Andersen, G. and Regini, M. eds. (2000). Why Deregulate Labour Markets? Oxford
University Press
European Commission (2011). Employment in Europe (2010 edn), Luxembourg: Publication Office
of the European Union.
Feenstra, R.C. and Hanson, G.H. (1996). Globalization, Outsourcing, and Wage Inequality,
American Economic Review, 86(2): 240-45.
Feenstra, R.C. and Hanson, G.H. (1999). The Impact Of Outsourcing And High-Technology
Capital On Wages: Estimates For The United States, 1979-1990, The Quarterly Journal of
Economics 114(3): 907-940.
Fondazione Moressa (2011). La condizione occupazionale dei giovani stranieri, Fondazione
Moressa, Mestre.
19
Geishecker I. (2008). The impact of international outsourcing on individual employment security: a
micro-level analysis, Labour Economics 15(3): 291-314.
Girma, S. and Gorg, H. (2004). Outsourcing, Foreign Ownership, and Productivity: Evidence from
UK Establishment-level Data, Review of International Economics 12(5): 817-832.
Gorg, H., Hanley, A. and Strobl, E. (2008). Productivity Effects of International Outsourcing:
Evidence from Plant-level Data, Canadian Journal of Economics 41(2): 670-688.
Grossman, G.M. and Rossi-Hansberg, E. (2008). Trading Tasks: A Simple Theory of Offshoring,
American Economic Review 98(5): 1978-97.
Hansson, P. (2005). Skill upgrading and production transfer within Swedish multinationals.
Scandinavian Journal of Economics 107(4): 673–692.
Head, K. and Ries, J. (2002). Offshore production and skill upgrading by Japanese manufacturing
firms. Journal of International Economics 58(1): 81–105.
Hijzen, A., Görg, H. and Hine, R.C. (2005). International Outsourcing and the Skill Structure of
Labour Demand in the United Kingdom, Economic Journal 115(506): 860-878
Hijzen, A., Inui, T. and Todo, Y. (2010). Does Offshoring Pay? Firm-level Evidence from Japan,
Economic Inquiry 48(4): 880-895.
Holl, A. (2008). Production Subcontracting and Location, Regional Science and Urban Economics,
38(3): 299-309.
Hyun, H-J. (2010). Firm Heterogeneity in the Choice of Offshoring: Evidence from Korean
Manufacturing Firms, Asian Economic Papers, 9(1): 157-178.
Jabbour, L. (2010). Offshoring and Firm Performance: Evidence from French Manufacturing
Industry, The World Economy 33(3): 507-524.
Jahn, E.J. (2008). Reassessing the wage penalty for temps in Germany, IZA Discussion Paper
Series, No. 3663.
Kraay, A. (2012). Instrumental Variables Regressions with Uncertain Exclusion Restrictions: A
Bayesian Approach, Journal of Applied Econometrics, 27(1): 108–128.
IMF (2012). Euro area policies: 2012 Article IV Consultation, IMF Country Report No. 12/181.
Lo Turco, A., Maggioni, D. and Picchio, M. (2012). Offshoring and Job Stability: Evidence from
Italian Manufacturing, IZA Discussion Paper Series, No. 6514.
Machikita, T. and Sato, H. (2011). Temporary jobs and globalization: Evidence form Japan, RIETI
Discussion Paper Series, No. 11-E-029.
Mitra, D. and Ranjan, P. (2010). Offshoring and Unemployment: The Role of Search Frictions
Labor Mobility, Journal of International Economics 81(2): 219-229.
Oberst, M., Schank, T. and Schnabel, C. (2007). Interne Arbeitsmärkte und Einsatz temporärer
Arbeitsverhältniss: Eine Fallstudie mit Daten eines deutschen Dienstleistungsunternehmens,
Zeitschrift für Betriebswirtschaft, 77(11): 1–19.
OECD (2010). Measuring Globalisation: OECD Economic Globalisation Indicators 2010, OECD
Publishing
OECD (2012). Economic Policy Reforms 2012: Going for Growth. OECD Publishing.
Pelegrìn, A. and Bolancé, C. (2011). Offshoring and company characteristics: some evidence from
the analysis of Spanish firm data, Institut d'Economia de Barcelona Working Papers No.
2011/16.
20
Pol, E., Carroll, P. and Robertson, P. (2002). A New Typology for Economic Sectors with a View
to Policy Implications, Economics of Innovation and New Technologies, 11(1): 61-76.
Portugal, P. and Varejão, J. (2009). Why Do Firms Use Fixed-Term Contracts? IZA Discussion
Paper Series No. 4380.
Sapir A. (2006). Globalisation and the Reform of European Social Models. Journal of Common
Market Studies, 44(2): 369-390.
Sensen, M.Z. (2010). The Effects of Offshoring on the Elasticity of Labor Demand, Journal of
International Economics 81(1): 89-98.
Staiger, D. and Stock, J.H. (1997). Instrumental variables regression with weak instruments,
Econometrica, 65(3): 557-586.
Stock, J.H. and Yogo, M. (2005). Testing for Weak Instruments in Linear IV Regression, in
Identification and Inference for Econometric Models: Essays in Honor of Thomas
Rothenberg, ed. D.W.K. Andrews and J.H. Stock, Cambridge University Press, chapter 5,
pp. 80–108.
Stone, K. (2012, forthcoming). Globalization and Flexibilization: The Remaking of Employment
Relations for the 21st Century. Yale University Press
Tomiura, E. (2005). Foreign Outsourcing and Firm-Level Characteristics: Evidence form Japanese
Manufacturers, Journal of the Japanese and International Economies, 19(2): 255-271.
UNCTAD (2012). Development and Globalization: Facts and Figure 2012, United Nations
21
Annex: Additional tables
Table 3: Static model
Dep. Var.: (1) (2) (3) (4) (5) (6)
OFFSHORING2006 OLS PROBIT 1st stage 2SLS 1
st stage IVPROBIT
EXPORT 0.069*** 0.789*** -0.000 0.069*** -0.000 0.720***
[0.013] [0.216] [0.011] [0.011] [0.011] [0.246]
INNOVATION 0.034** 0.262*** 0.003 0.032** 0.003 0.234**
[0.013] [0.091] [0.008] [0.014] [0.008] [0.100]
SIZE 0.024*** 0.171*** 0.000 0.024*** 0.000 0.157***
[0.008] [0.041] [0.004] [0.008] [0.004] [0.046]
SKILL INTENSITY 0.115*** 0.789*** -0.013 0.120*** -0.013 0.764***
[0.024] [0.143] [0.017] [0.024] [0.017] [0.156]
MULTIPLE LENDING 0.004** 0.021** -0.001 0.005** -0.001 0.021**
[0.002] [0.009] [0.001] [0.002] [0.001] [0.008]
NEGATIVE SALES 0.045** 0.325*** 0.003 0.044*** 0.003 0.294***
[0.016] [0.090] [0.011] [0.016] [0.011] [0.114]
TEMPORARY -0.140*** -3.372***
0.339
0.271
[0.033] [1.152]
[0.491]
[2.959]
MIGRANTS_PROV
-1.518***
-1.444***
[0.473]
[0.459]
TEMPORARY_PROV
0.433***
0.440***
[0.134]
[0.130]
Observations 915 915 915 915 915 915
R2 0.080
0.019 0.011
Pseudo R2
0.194
Overidentification
0.772
Underidentification
0.045
Weak instrument 11.909
Notes: The table reports the coefficients and, in brackets, the associated standard errors clustered by region. *
Significant at 10%; ** significant at 5%; *** significant at 1. At the bottom of the table we report some diagnostic tests.
In particular, for the 2SLS we report the p-value of: 1) the Sargan-Hansen test of overidentifying restrictions (OIR) tests
the null hypothesis that the instruments are uncorrelated with the error term; 2) the Kleibergen–Paap rk LM-statistic
testing the null hypothesis that the excluded instruments are not correlated with the endogenous regressor; and 3) the
Kleibergen–Paap rk Wald F-statistic testing for weak identification. All regressions include 13 industry dummies, 4
macro area dummies, and a constant, not shown for reasons of space.
22
Table 4: Alternative definition of temporary workers
Dep. Var.: (1) (2) (3) (4) (5) (6)
OFFSHORING2006 OLS PROBIT 1st stage 2SLS 1
st stage IVPROBIT
OFFSHORING2003 0.256*** 1.013*** 0.012 0.252*** 0.012 0.870***
[0.063] [0.242] [0.013] [0.062] [0.013] [0.293]
EXPORT 0.063*** 0.837*** -0.014 0.068*** -0.014 0.782***
[0.014] [0.277] [0.016] [0.014] [0.016] [0.292]
INNOVATION 0.041*** 0.324*** 0.009 0.038*** 0.009 0.268**
[0.012] [0.109] [0.009] [0.014] [0.009] [0.133]
SIZE 0.007 0.071 -0.012** 0.011 -0.012*** 0.101*
[0.012] [0.067] [0.005] [0.012] [0.005] [0.055]
SKILL INTENSITY 0.094*** 0.781*** 0.014 0.088*** 0.014 0.651***
[0.024] [0.131] [0.027] [0.019] [0.027] [0.148]
MULTIPLE LENDING 0.005** 0.028*** -0.000 0.005** -0.000 0.025***
[0.002] [0.009] [0.001] [0.002] [0.001] [0.008]
NEGATIVE SALES 0.037* 0.302*** 0.009 0.035** 0.009 0.250**
[0.020] [0.104] [0.013] [0.017] [0.013] [0.107]
TEMPORARY & PROJECT -0.134*** -2.687***
0.211
0.606
[0.030] [0.712]
[0.432]
[2.395]
MIGRANTS_PROV
-1.615**
-1.613**
[0.612]
[0.644]
TEMPORARY_PROV
0.560***
0.560***
[0.151]
[0.149]
Observations 905 905 905 905 905
R2 0.144
0.028 0.085
Pseudo R2
0.216
Overidentification
0.917
Underidentification
0.037
Weak instrument 17.650
Notes: The table reports the coefficients and, in brackets, the associated standard errors clustered by region. *
Significant at 10%; ** significant at 5%; *** significant at 1. TEMPORARY & PROJECT is the share of fixed-term
direct-hire employees plus project workers over total dependent employees, in 2003. At the bottom of the table we
report some diagnostic tests. In particular, for the 2SLS we report the p-value of: 1) the Sargan-Hansen test of
overidentifying restrictions (OIR) tests the null hypothesis that the instruments are uncorrelated with the error term; 2)
the Kleibergen–Paap rk LM-statistic testing the null hypothesis that the excluded instruments are not correlated with the
endogenous regressor; and 3) the Kleibergen–Paap rk Wald F-statistic testing for weak identification. All regressions
include 13 industry dummies, 4 macro area dummies, and a constant, not shown for reasons of space.
23
Table 5: Additional controls
Dep. Var.: (1) (2) (3) (4) (5) (6) (7) (8) (9) (10)
OFFSHORING2006 OLS 2SLS OLS 2SLS OLS 2SLS OLS 2SLS OLS 2SLS
OFFSHORING2003 0.236*** 0.232*** 0.267*** 0.263*** 0.251*** 0.242*** 0.247*** 0.240*** 0.253*** 0.253***
[0.052] [0.052] [0.055] [0.053] [0.053] [0.054] [0.053] [0.054] [0.058] [0.057]
EXPORT 0.056*** 0.057*** 0.064*** 0.064*** 0.058*** 0.057*** 0.061*** 0.061*** 0.061*** 0.061***
[0.012] [0.011] [0.017] [0.015] [0.013] [0.011] [0.013] [0.011] [0.013] [0.011]
INNOVATION 0.030** 0.027* 0.030** 0.029** 0.031** 0.029** 0.038** 0.036***
[0.013] [0.014] [0.012] [0.012] [0.012] [0.013] [0.014] [0.014]
SIZE 0.013 0.014* 0.013 0.013 0.014 0.013 0.007 0.006 0.002 0.003
[0.009] [0.008] [0.012] [0.011] [0.010] [0.010] [0.011] [0.010] [0.009] [0.009]
SKILL INTENSITY 0.093*** 0.103*** 0.076** 0.077*** 0.100*** 0.106*** 0.086*** 0.090*** 0.088*** 0.100***
[0.028] [0.034] [0.027] [0.026] [0.024] [0.026] [0.021] [0.024] [0.030] [0.031]
MULTIPLE LENDING 0.003 0.003 0.004** 0.004** 0.005** 0.005** 0.005* 0.005** 0.006*** 0.007***
[0.003] [0.003] [0.002] [0.002] [0.002] [0.002] [0.002] [0.002] [0.002] [0.002]
NEGATIVE SALES 0.030* 0.028* 0.046** 0.045** 0.041** 0.041** 0.042** 0.041*** 0.059*** 0.057***
[0.017] [0.015] [0.018] [0.018] [0.017] [0.016] [0.016] [0.015] [0.019] [0.018]
TEMPORARY -0.150*** 0.264 -0.170*** -0.004 -0.169*** 0.297 -0.166*** 0.191 -0.152*** 0.197
[0.035] [0.581] [0.036] [0.424] [0.033] [0.473] [0.034] [0.511] [0.037] [0.756]
AGE 0.002 0.004
[0.008] [0.009]
CREDIT RATIONED
0.063 0.065*
[0.038] [0.039]
FAMILY FIRM
0.020 0.013
[0.013] [0.016]
GROUP
0.015 0.017
[0.017] [0.018]
R&D INVESTMENT
0.055 0.054*
[0.032] [0.033]
Observations 901 901 863 863 903 903 910 910 733 733
R-squared 0.133 0.071 0.151 0.118 0.143 0.077 0.139 0.089 0.145 0.097
Overidentification
0.624
0.868
0.922
0.755
0.485
Underidentification
0.064
0.048
0.049
0.043
0.118
Weak instrument 11.280 13.396 12.778 11.611 5.031
24
Notes: The table reports the coefficients and, in brackets, the associated standard errors clustered by region. For the sake of brevity, we report only the linear probability model
estimates (OLS and 2SLS). * Significant at 10%; ** significant at 5%; *** significant at 1. AGE is the logarithm of firm‟s age from inception in 2006; CREDIT RATIONED is a
dummy equal to one for firms which applied for bank credit but did not obtain the quantity demanded in 2006; FAMILY FIRM is a dummy equal to one for family firms in 2006;
GROUP is a dummy for firms which were part of a business group in 2006; R&D INVESTMENT is a dummy for firms which undertook investment in R&D in the period 2004-2006.
At the bottom of the table we report some diagnostic tests. In particular, for the 2SLS we report the p-value of: 1) the Sargan-Hansen test of overidentifying restrictions (OIR) tests
the null hypothesis that the instruments are uncorrelated with the error term; 2) the Kleibergen–Paap rk LM-statistic testing the null hypothesis that the excluded instruments are not
correlated with the endogenous regressor; and 3) the Kleibergen–Paap rk Wald F-statistic testing for weak identification. All regressions include 13 industry dummies, 4 macro area
dummies, and a constant, not shown for reasons of space.
25
Table 6: Regressions for low- and high-tech sectors
Dep. Var.: (1) (2) (3) (4)
OFFSHORING2006 OLS 2SLS
Low-tech High-tech Low-tech High-tech
OFFSHORING2003 0.225** 0.260*** 0.208** 0.253***
[0.082] [0.061] [0.085] [0.093]
EXPORT 0.066*** 0.043** 0.064*** 0.039
[0.018] [0.016] [0.014] [0.032]
INNOVATION 0.029* 0.052* 0.029** 0.060
[0.014] [0.028] [0.013] [0.072]
SIZE -0.012 0.050*** -0.009 0.053**
[0.009] [0.016] [0.009] [0.027]
SKILL INTENSITY 0.139** -0.026 0.138*** -0.046
[0.054] [0.072] [0.050] [0.122]
MULTIPLE LENDING 0.008*** -0.006** 0.008*** -0.007
[0.003] [0.002] [0.002] [0.005]
NEGATIVE SALES 0.053** 0.03 0.050** 0.026
[0.023] [0.032] [0.021] [0.034]
TEMPORARY -0.153*** -0.310*** 0.395 -0.807
[0.042] [0.080] [0.361] [3.091]
Observations 623 292 623 292
R2 0.157 0.164 0.058 0.125
Overidentification
0.976 0.476
Underidentification
0.080 0.414
Weak instrument 9.068 0.809
Notes: The table reports the coefficients and, in brackets, the associated standard errors clustered by region. For the
sake of brevity, we report only the linear probability model estimates (OLS and 2SLS). * Significant at 10%; **
significant at 5%; *** significant at 1.Low- and High-tech sectors are defined using the 2-digit ATECO industry
classification and following the OECD classificatory scheme based on R&D intensity: high-technology, medium-
technology, and low-technology industries (see Pol et al. 2002). At the bottom of the table we report some diagnostic
tests. In particular, for the 2SLS we report the p-value of: 1) the Sargan-Hansen test of overidentifying restrictions
(OIR) tests the null hypothesis that the instruments are uncorrelated with the error term; 2) the Kleibergen–Paap rk LM-
statistic testing the null hypothesis that the excluded instruments are not correlated with the endogenous regressor; and
3) the Kleibergen–Paap rk Wald F-statistic testing for weak identification. All regressions include 13 industry dummies,
4 macro area dummies, and a constant, not shown for reasons of space.
26
Table 7: Exact identification
Dep. Var.: (1) (2) (3) (4) (5) (6)
OFFSHORING2006 OLS PROBIT 1st stage 2SLS 1
st stage IVPROBIT
OFFSHORING2003 0.246*** 0.971*** 0.018 0.237*** 0.018 0.749**
[0.054] [0.202] [0.016] [0.058] [0.015] [0.337]
EXPORT 0.061*** 0.740*** -0.001 0.061*** -0.001 0.637**
[0.013] [0.209] [0.011] [0.011] [0.011] [0.284]
INNOVATION 0.034** 0.255*** 0.004 0.032** 0.004 0.210*
[0.013] [0.099] [0.009] [0.013] [0.008] [0.110]
SIZE 0.012 0.121*** -0.000 0.012 -0.000 0.108**
[0.010] [0.046] [0.004] [0.009] [0.004] [0.046]
SKILL INTENSITY 0.086*** 0.710*** -0.015 0.092*** -0.015 0.670***
[0.022] [0.123] [0.016] [0.027] [0.015] [0.147]
MULTIPLE LENDING 0.005** 0.024** -0.001 0.005** -0.001 0.023***
[0.002] [0.010] [0.001] [0.002] [0.001] [0.008]
NEGATIVE SALES 0.042** 0.350*** 0.003 0.041*** 0.003 0.295**
[0.016] [0.086] [0.011] [0.015] [0.011] [0.129]
TEMPORARY -0.167*** -3.749***
0.311
1.208
[0.034] [1.265]
[0.636]
[3.385]
TEMPORARY_PROV
0.465***
0.465***
[0.143]
[0.142]
Observations 915 915 915 915 915 915
R2 0.137
0.017 0.071
Pseudo R2
0.205
Underidentification
0.035
Weak instrument 10.497
Notes: The table reports the coefficients and, in brackets, the associated standard errors clustered by region. *
Significant at 10%; ** significant at 5%; *** significant at 1. At the bottom of the table we report some diagnostic tests.
In particular, for the 2SLS we report the p-value of: 1) the Kleibergen–Paap rk LM-statistic testing the null hypothesis
that the excluded instruments are not correlated with the endogenous regressor; and 2) the Kleibergen–Paap rk Wald F-
statistic testing for weak identification. All regressions include 13 industry dummies, 4 macro area dummies, and a
constant, not shown for reasons of space.
Table 8: Testing for weak exclusion restrictions
β on TEMPORARY
η median 95% confidence interval
5 0.314 -14.194 15.360
10 0.312 -9.919 10.898
100 0.317 -3.052 4.090
200 0.316 -2.226 3.311
500 0.317 -1.596 2.648
999 0.314 -1.030 2.071
Standard IV 0.311 -1.026 1.648
Notes: Results are estimated using GRETL (Cottrell and Lucchetti 2012) and they refer to the specification of equation
(1) as estimated by 2SLS in Table 7, columns 3 and 4, with TEMPORARY_PROV and only instrument for
TEMPORARY and robust standard errors. Following Kraay (2012, p. 114), the parameter η is the inverse of the degree
of prior uncertainty about the validity of the exclusion restriction. Specifically, let Φ be a uniformly distributed random
variable over the support (-1,1), prior uncertainty about the exclusion restriction is approximated with the following
prior distribution over the correlation between the reduced-form error and the instrument, Φ: g(Φ) = (1 – Φ2)
η. In
particular, when η=0, the prior is uniformly distributed over (-1,+1). As η increases, the prior becomes more
concentrated around zero, and in the limit we approach the standard assumption that Φ=0 with probability one (the
standard IV assumption). Setting η=500 corresponds to the rather strong prior belief that there is a 90% probability that
g(Φ) ranges between -0.05 and +0.05, while η=200 (η=10) correspond to a prior belief of g(Φ) being between -0.08 and
+0.08 (-0.34 and +0.34).