Working Paper No. 051
56
Universität Zürich IBW – Institut für Betriebswirtschaftslehre Working Paper No. 051 Poaching and Firm-Sponsored Training Jens Mohrenweiser Thomas Zwick Uschi Backes-Gellner
Transcript of Working Paper No. 051

UniversitätZürichIBW–InstitutfürBetriebswirtschaftslehre
Working Paper No. 051 Poaching and Firm-Sponsored Training
Jens Mohrenweiser
Thomas Zwick
Uschi Backes-Gellner

Revised version, September 2017
This version replaces the previous versions of December 2010, August 2011, May 2013 and November 2016.
Die Discussion Papers dienen einer möglichst schnellen Verbreitung von neueren Forschungsarbeiten des Leading Houses und seiner Konferenzen und Workshops. Die Beiträge liegen in alleiniger Verantwortung der
Autoren und stellen nicht notwendigerweise die Meinung des Leading House dar.
Disussion Papers are intended to make results of the Leading House research or its conferences and workshops promptly available to other economists in order to encourage discussion and suggestions for revisions. The
authors are solely responsible for the contents which do not necessarily represent the opinion of the Leading House.
The Swiss Leading House on Economics of Education, Firm Behavior and Training Policies is a Research Program of the Swiss State Secretariat for Education, Research, and Innovation (SERI).
www.economics-of-education.ch
Working Paper No. 051 Poaching and Firm-Sponsored Training
Jens Mohrenweiser
Thomas Zwick
Uschi Backes-Gellner
Published as: “Poaching and Firm Sponsored Training.” British Journal of Industrial Relations 57(2018)1: 143-181. By Jens Mohrenweiser, Thomas Zwick and Uschi Backes-Gellner. DOI: https://doi.org/10.1111/bjir.12305

POACHING AND FIRM-SPONSORED TRAINING ∗
This version: September 2017
ABSTRACT:
A series of seminal theoretical papers argues that poaching of employees may hamper
company-sponsored general training like apprenticeship training in Germany. Empirically
however, the existence and extent of poaching still remains an open question. We provide a
novel empirical strategy to identify poaching and investigate its causes and consequences. We
find that only a few apprenticeship training firms in Germany are poaching victims or raiders.
Poaching victim firms are more likely to be in a temporary downturn and raiding firms are
more likely to increase their workforce. Poaching victims hardly change their training strategy
after poaching. Thus, poaching is a transitory event and not a general threat to apprenticeship
training. This is an important result for countries that intend to introduce apprenticeship type
of training and need to convince firms to participate in their endeavour.
JEL Codes: J24, M51, M53
Key words: poaching, company sponsored training, recruiting, apprenticeship
∗ We are grateful for the discussion and comments by Giorgio Brunello, Simon Janssen, Raymond Montizaan, Christian Pfeifer, Dario Pozzoli, Paul Ryan, Stefan Wolter, and Ludger Wössmann. The research was partly supported by the Swiss Federal Office for Professional Education and Technology through its Leading House on Economics of Education, Firm Behaviour and Training Policies. We thank the Research Data Centre (FDZ) of the Federal Employment Agency at the Institute for Employment Research for the data access and the support with analysis of the LIAB data. Data access was via guest research spells at FDZ and afterwards via controlled data remote access at the FDZ. The data basis of this paper is the LIAB longitudinal version 2. We also thank Gudrun Schönfeld and Harald Pfeifer for providing additional statistics form the latest BiBB cost/benefit survey.

1
Introduction
Employer investments in transferable skills such as apprenticeship training are widely
viewed by economists as a risky strategy because outside firms can poach trained employees
and the training firm loses its training investment.1 The raiding firm can meet its skill
demand without paying for training. Consequently, poaching and the threat of poaching can
lead to lower-than-efficient training investments by firms (Stevens 1996; Acemoglu and
Pischke 1999a, 1999b; Leuven 2005).
Despite the poaching risk, employers offer apprenticeship training in Germany. The German
labour market is considered a prime example of occupational type labour markets in which
apprenticeships underpin a high standardisation of transferable skills (Marsden and Ryan
1990; Marsden 1990; Gospel 1998; Lewis et al. 2008). Apprenticeship certificates issued by
credible external institutions reveal the value of transferable skills to outside employers and
facilitate firm switches (Soskice 1994; Busemeyer 2009). However, apprenticeships,
particularly in manufacturing, also entail net training investments by companies (Carlin and
Soskice 2009; Mohrenweiser and Zwick 2009; Schönfeld et al. 2010, Wenzelmann 2012).
The theoretical literature solves this economic puzzle by distinguishing two mechanisms that
might prevent poaching or reduce its threat. First, training investments are possible if the
post-training monopsony power of training firms generates wage compression (Soskice 1993;
Acemoglu and Pischke 1999, Booth and Zoega 2004; Leuven 2005; Wolter and Ryan 2011).
Second, employer coordination can solve the issue of commitment to training and reduce
free-riding through circulation of information, deliberation, monitoring, and sanctioning
(Soskice 1994; Culpepper 1999; Busemeyer 2009). Despite these institutional and labour
market particularities, the existence, extent, determinants and consequences of poaching
remain open empirical questions.

2
The main reason for lack of evidence about poaching is the difficulty to empirically identify
poached trainees. The identification requires that the training firm wants to retain the training
participant and that an outside firm is willing to pay a higher salary than the training
participant would get in the training firm.
We introduce a novel approach to solve these empirical challenges. We identify poached
training participants by exploiting earnings variance between apprenticeship completers2 in
the German apprenticeship training system. We argue that the training firm wants to retain an
apprenticeship completer if it pays more at the end of the apprenticeship for this person than
for his or her peers (“interest to keep”). The outside firm poaches if a leaving apprenticeship
completer earns more at the new firm than any of the retained apprenticeship completers of
the cohort in the training firm (“earnings mark-up”).
The first condition relies on the assumption that training firms screen apprentices during
training, and that they know the productivity of apprentices at the end of the training period
in contrast to outside firms. We assume that firms are more interested in keeping apprentices
the higher their productivity and that they pay these apprentices more than their peers in the
same occupation and cohort. The second condition assumes that the maximum earnings the
training firm is willing to pay for apprenticeship completers is the highest realised
willingness to pay for those who stay in the same occupation and cohort. Both conditions
imply that we analyse ex-post poaching which can reveal the existence of poaching and its
consequences.
Our empirical analysis identifies training firms that have been poaching victims and shows
that poaching is more likely to be a transitory rather than a systematic event. Poaching and
raiding firms are relatively large and pay high wages. Smaller firms that pay less are able to
retain the apprenticeship completers they would like to keep. Poaching victims are
nevertheless vulnerable because they experience a temporary employment decline. During a

3
downsizing period, training firms may not be able to make counter-offers for apprenticeship
completers they want to retain. Workforce reductions indicate for outside firms, that they can
hire high-quality employees relatively cheaply. Thus, raiding firms exploit temporary
weaknesses of training firms and are willing to pay for well-trained apprenticeship
completers they otherwise would not have been able to attract. Raiding firms, on the
contrary, typically experience a period of strong employment growth and also train their own
apprentices. The analysis of the consequences of poaching supports the argument that
poaching is transitory. Poaching victims neither adjust the proportion of training places nor
earnings for apprenticeship completers in their first jobs as skilled employees.
We conclude that the poaching risk is low and poaching is mainly a transitory event without
severe long-term consequences for apprenticeship training firms in our sample. Hence,
poaching has a minor influence on the expected returns to training and firms’ training
decisions. Our results support that poaching does not threaten an apprenticeship training
system and the basic assumption in theoretical models that poaching is an equilibrium
phenomenon.
The remainder of this paper is organised as follows: The next section reviews the literature.
The third and fourth section briefly describes the institutional setting of apprenticeship
training in Germany and the data. Afterwards, we present our identification strategy for
poached apprentices and describe firms that are poaching victims in comparison with raiding
firms and firms not affected by poaching. The seventh section analyses firms’ responses to
poaching. The last sections discuss consequences for apprenticeship training and conclude.
Background Discussions
Theoretical background
A long tradition of theoretical papers analyses firms’ incentives to invest in general skills of
employees. The main argument is that labour market imperfections create a wedge between

4
employees’ post-training productivity and wages, which allows firms to get a return on
training investments3. However, firms can lose a minority of trainees and outside firms can
earn a ‘rent’ on these trainees as long as staying trainees compensate for training investments
(Stevens, 1994; Acemoglu and Pischke, 1999a, 1999b; Booth and Zoega, 2004; Leuven,
2005). Transitory poaching and company investments in general skills can co-exist in
equilibrium: firms expect that they cannot keep all trainees they would like to keep and that
some training participants might be poached by outside firms. Training firms nevertheless
invest in training because they obtain rents from training as long as the retention probability is
high or the poaching probability remains small. Market imperfections prevent systematic
poaching. For example, Acemoglu and Pischke (1998) have shown that information
asymmetry on the ability of apprentices between potential raider and training firms and the
possibility of counter-offers4 by training firms leads to the risk of a “winners´ curse” for
successful poaching firms that keep firms from systematic poaching attempts.
The transferability of acquired skills between firms and the visibility of skills for outside
firms determines the probability of an outside offer and, hence, poaching (Lazear, 1986;
Stevens, 1996, 2001). Poaching can in principle be prevented if the future employment of the
trained employee is ex-ante contractible or if reimbursement of training costs is possible
(Benson et al., 2004; Manchester, 2012). In addition, high transferability and visibility of
skills is a typical characteristic of occupational labour markets that are characterised by
standardisation of skills governed by independent and credible institutions. Such labour
markets are only stable if strong intermediate institutions such as trade unions and employer
associations can regulate free market forces. In particular, strong employer coordination can
lead to a non-poaching agreement between competing firms (Marsden and Ryan 1990; Gospel
1998; Culpepper 1999; Busemeyer 2009).
Some theoretical models analyse further mechanisms that prevent systematic poaching:
Training firms can get a reputation for training quality and credibly offer long-term contracts

5
(Sadowski 1980; Moen and Rosen 2004). Firms may use training investments as a
commitment device to reduce turnover (Backes-Gellner and Tuor 2010). Both approaches
propose mechanisms that lead to a selected, more loyal workforce that might resist external
offers.
On the contrary, Cahuc et al. (1990) discuss conditions for systematic poaching. They split
firms with training investments into a group that poaches (dominating firms) and a group that
loses some of their trained employees although this incurs a loss (dominated firms). They
show that poaching does not necessarily replace a firm’s own training efforts and that
systematic poaching and training might co-exist.
Related empirical studies
Although theoretical models show the existence of an equilibrium between poaching and
training, empirical evidence is scarce. Mühlemann and Wolter (2011) discuss ex-ante
consequences of the poaching threat and show lower training intensity in dense regional
labour markets for apprenticeship training in Switzerland. Moreover, previous studies have
given indirect evidence that poaching after further training might exist. Booth and Bryan
(2005) show that employees’ earnings mark-ups at subsequent employers exceed earnings
increases at training firms if employees reported company-sponsored training in general skills
during the previous year. Similarly, Loewenstein and Spletzer (1999) and Booth and Katic
(2011) show that employers reward skills acquired during previous employment. Parrotta and
Pozzoli (2012) investigate whether poaching can be profitable for raiding firms. They show
that hiring highly educated employees from rival firms can increase the value added of hiring
firms. Finally, Kampkötter and Sliwka (2014) show that firms typically pay more when they
hire employees from direct competitors.

6
Institutional Setting
Apprenticeship training in Germany traditionally provides general and vocational education
and training for about two-thirds of the German workforce and is the backbone of medium-
skilled vocational training. Apprenticeships last between three and three and a half years.
School-leavers typically apply for apprenticeships in firms and firms are free to decide
whether and how many apprentices they take. Apprentices work and learn 3-4 days a week in
the training firm and 1-2 days in government funded and controlled vocational schools5.
Apprenticeships are subjected to the Vocational Training Act and occupational specific
training curricula. The Vocational Training Act describes the length of training, necessary
equipment and requirements for training firms. Training firms must fulfil these requirements
to get a permit for apprenticeship training granted by the Chambers of Industry and
Commerce or the Chambers of Craft. The training curricula describe minimum skills for
successful completion in each training occupation. The training curricula are defined and can
be amended by a committee consisting of state, employer and union representatives. At the
end of the training period, apprentices receive graded skill certificates issued by the chambers.
The chambers monitor training quality in each enterprise and administer the final exam on the
practical part of the skills examination. The theoretical part is administered and graded by
vocational schools. Therefore, independent public bodies administer the exams and monitor
the minimum skills acquired during apprenticeship training.
This institutional framework permits a co-ordinated sharing of training costs between the
state, the apprentice and the employer. The state provides vocational schools in which
apprentices learn general skills. Apprentices contribute to firms´ output and thus cover a share
of the training costs. They also accept comparably low pay by international standards,
approximately less than 50% of that of a skilled employee in the same occupation (Marsden
1990; Ryan et al. 2013). The employers accept the remaining training costs. Despite the low

7
pay, apprentices engage in apprenticeship training because they can gain a widely
acknowledged training certificate guaranteed by the Vocational Training Act, with
occupation-specific training curricula and state and union involvement in the process.
This institutional framework allows us to identify poaching. First, it offers a consistent and
unambiguous definition of training across firms. Apprenticeship completers in different firms
who learn the same occupation have comparable and guaranteed minimum skills that are
monitored and examined by institutions independent of the training firm.
Second, compliance with the training regulations means that training is visible to outside
firms. Visibility is guaranteed by the documented and transparent training curricula and
graded final exams documenting theoretical and practical skills. Therefore, an outside firm
knows the skill level of an apprenticeship completer in a given occupation and can assess the
quality of the applicant on the basis of the grades.
Third, skills are not only observable but also transferable. Detailed occupational-specific
training curricula limit firms’ ability to substitute general with firm-specific training6. Fourth,
reimbursement of training costs by apprenticeship completers who leave a firm is not
permitted by law and future employment of apprenticeship completers is non-contractible.
Moreover apprenticeship contracts are distinct from employee contracts and differentiate
apprentices from students. Apprenticeship training contracts legally terminate at the day after
the final exam and an employment contract has to be negotiated at the end of the
apprenticeship even for those who stay at the training firm.
Fifth, apprenticeships are a training investment for the majority of firms, although necessary
investments differ significantly between occupations. Apprenticeships in blue-collar
manufacturing occupations require substantial training investment by firms. Schönfeld et al.
(2010) calculate that investment costs for blue-collar apprentices are on average three times
higher than for white-collar apprentices. White-collar apprentices are more productive during

8
their apprenticeships and the productivity balances most of their training costs during
apprenticeship training (Mohrenweiser and Zwick 2009). Therefore, poaching is a stronger
threat to firms’ willingness to train in blue-collar than in white-collar occupations and we will
report all results for blue-collar manufacturing apprentices separately. The flexibility to allow
for the provision of cost-neutral apprenticeships for training in some occupations and the
incentive to provide costly advanced skills in others are generally considered distinctive
factors of the German apprenticeship training system (Carlin and Soskice 2009;
Mohrenweiser and Zwick 2009).
Sixth, apprenticeship completers who start their first job are a relatively homogeneous group
in terms of age, tenure, and prior education. Hence, initial labour market conditions, a
potentially unknown job history that differs between stayers and movers as well as differences
in selectivity at labour market entry (Kahn 2013), do not apply because apprentices usually
have no prior labour market experience and come directly from school. Apprentices start
training at the same point in time (therefore there are no differences in occupation selectivity
during the business cycle) and their contracts end at the same point in time (therefore there are
no differences in specific labour demand when they start their career as skilled employees).
Seventh, wage setting for apprentices follows specific rules. Apprentices’ wages are usually
set by collective bargaining at the sector level according to § 17 of the Vocational Training
Act (BBiG). In principle, apprentices in each of the 26 economic sectors defined by collective
bargaining should earn the same wage irrespective of their occupation7. According to § 17
BBiG, a firm also has to pay an appropriate wage when not covered by collective bargaining8.
The Chambers monitor whether wages in training contracts are within an accepted range.
However, there is some leeway for individual wage setting even for employers with collective
bargaining: A) enterprises are free to voluntarily pay a wage above the collective bargaining
level; B) collective bargaining agreements might include different earnings level options for

9
apprentices; C) wage supplements are possible for especially demanding or dangerous jobs or
extra hours.
On the contrary, statutory regulations and collective agreements do not contain specific
restrictions on wage bargaining at the first job after apprenticeship completion, allowing for
wage competition in principle. In an international comparison, wage variation in Germany is
low (Busemeyer and Iversen 2012). However, even in the unionised sector, half of the
employers pay more than the collective wage to selected employees. This increases the wages
for these employees by approximately 10 percent (Dustmann and Schönberg 2009).
Moreover, Grund (2005) compares the wage structure of German and US subsidiaries of a
multinational company and found wage variation at the employee entry-level and higher
levels with significantly lower variation in Germany than in the US. Pfeifer (2008) confirms
wage variation for entry-level jobs in another German unionised firm. Gerlach and Stephan
(2006) and Fitzenberger et al. (2013) use German representative establishment data and show
lower wage variation in establishments covered by collective bargaining than in uncovered
establishments and Addison et al. (2010) show lower wage variation in establishments with
works councils. Wage variation in Germany appears to have increased in recent years and for
all income levels (Dustmann et al. 2009; Card et al. 2013). These findings accentuate
Soskice’s (1993) argument that industry-determined entry wages with tacit agreements to
restrict wage competition might govern payments for apprenticeship completers to reduce the
poaching threat. Unions, employer associations and works councils might discourage
companies from using wage mark-ups to entice apprenticeship completers even if firms use
wage variation for entry-level jobs.
Eighth, several collective bargaining agreements include retention clauses
(“Übernahmeklauseln“) that require firms to retain their apprentices for some months after
they complete training. This may induce some training firms to retain more apprenticeship

10
completers than they otherwise would like to keep and dismiss them after the time period
specified in the collective bargaining agreements, usually half a year9. However, retention
goals do not protect training firms from poaching.
Finally, firms do not receive subsidies for retaining apprenticeship completers in Germany.
This implies that training firms are essentially free to choose whom and how many
apprenticeship completers they offer contracts.
Taken together, apprentices receive widely recognised and visible training certificates at the
end of their training period. Their skills are applicable to jobs in a number of outside firms,
and allow them to bargain freely their entry earnings as skilled workers.
Data and Sample Selection
Data
In addition to a suitable institutional framework, an analysis of poaching requires individual
data that follow apprentices who leave the training firm after training and establishment
information about training and raiding firms. This information can be obtained from the IAB
linked employer-employee data set longitudinal version 2 (LIAB). The LIAB combines
individual employment statistics from Social Security Records with plant-level survey data
from the IAB Establishment Panel. The LIAB longitudinal version 2 includes all
establishments with three consecutive entries in the IAB Establishment Panel between 1999
and 2002, and all employees who have been working at least one day in those establishments
between 1997 and 2003. For these employees, the data contains complete employment
histories between 1993 and 2006 (Jacobebbinghaus, 2008).
In our sample, most completers do not move between sampled firms but to firms outside the
sample. Thus, we merge the Establishment History Panel (EHP) using the unique
establishment identifier. The EHB entails basic aggregated establishment characteristics such

11
as employee and earnings structure, size, and sector also for all firms’ apprenticeship
completers move to. We use the LIAB to identify poached individuals and the EHP to
describe establishment characteristics of poaching victim firms and raiding firms.
The LIAB longitudinal data drawn from Social Security Records guarantee a high validity of
earnings and employment information because they are used for pension claims and
unemployment insurance. The data permit a day-based calculation of employment mobility
between firms, contractual change from apprentice to skilled worker and occupation change
for every individual employed in around 4.500 establishments over seven years. Social
Security Records that cover all apprentices and employees allow earnings based identification
of poached individuals.
Based on exam days and training duration, we distinguish between three and three-and-a-half
year apprenticeships. We use the two-digit occupation code to identify the training occupation
and to calculate the exact number of apprenticeship completers in each establishment,
occupation, and completion year (cohort) cell.
Sample Selection
We restrict the data to spells after 1998 because reporting the exact day of transition from
apprenticeship to work was not mandatory before 1999 (Jacobebbinghaus 2008). Indeed, the
Social Security Records entail only variables that indicate the exact duration of an
apprenticeship but not the successful completion. Hence, we impose two further restrictions to
remove drop-outs and examination repeaters: we use only apprenticeship completers with a
full-time employment spell in their first job after apprenticeship and those with a regular
training duration. A regular training duration begins at the start of a school year (around
September), terminates in the occupation-specific exam week between January and August of
a year, and lasts between 700 and 1500 days.

12
On the establishment-level, we apply the standard procedure to clean the data from breaks in
the establishment identifier by dropping extreme outliers, i.e. those establishments in the 1st
and 99th percentile in the establishment size growth distribution. We further drop agriculture,
public, and non-profit establishments as well as establishments with missing data. On the
individual-level, we drop apprentices who earn less than 50 per cent or more than 200 per cent
of the occupational mean because earnings misreports may happen in rare numbers or these
employees might be misclassified as apprentices (compare also appendix Table B1).
To calculate comparable earnings between homogeneous movers and stayers after
apprenticeship (detailed description in next section), we restrict the sample to those
apprenticeship completers who learn in establishment/ occupation/ cohort cells with at least
one second peer. We need this restriction for our poaching conditions. The restriction reduces
the number of individuals by around 20 per cent and the number of firms to one third resulting
in a doubled average establishment size (see Appendix Table B2). Furthermore, some cells
entail only moving apprenticeship completers. These cells are not used because we cannot
calculate counterfactual earnings of stayers10. The apprentices in our sample are more likely
to work in large and high-earnings establishments than those in the raw sample. We take this
sample selection into account when interpreting the data.
Finally, we apply two further conditions to make sure that we are more likely to identify
poaching. First, we double-check that poaching victims and raiding firms are not
establishments of the same company. Since the data entail no company identifier, we analyse
in- and outflows of employees between establishments and drop those establishments where
more than 10 per cent of all establishment flows occur between two establishment
identifiers11. Finally, we drop all establishment/ year observations in the control group if the
establishment was identified as poaching victim in any other year.

13
The sample selection yields 34,298 individuals in 7480 establishment/ occupation/ completion
year cells in 5042 establishment/ years from a raw sample of 86,618 individuals in 41,174
establishment/ occupation/ cohort cells in 30,671 establishment/ years (appendix Table B1).
The mobility pattern of apprenticeship completers in the final sample is documented in
appendix Table B3. Around 80 per cent or 27,386 out of 34,298 completers stay in the
training firm and around seven per cent or 2424 completers start working at an outside firm in
the training occupation within ten days.
Identification of Poaching
Definition of Poaching
To characterize poaching victim firms, we identify apprenticeship completers who are enticed
away even if the training firm wants to keep them. Previous studies have used the term
“poaching” with a variety of slightly different meanings. Our definition is that poaching exists
when the following two conditions hold: First, the training firm wants to retain the most
productive apprenticeship completer but is not successful (“interest to keep”). Instead, the
most productive apprenticeship completer leaves the training firm to work for a raiding firm.
Second, the raiding firm pays the apprenticeship completer higher earnings than he or she
would have received at the training firm (“earnings mark-up”)12.
Before describing both conditions in detail, we outline four consequences of the necessary
assumptions for the interpretation of our results. First, our poaching definition focuses on
apprenticeship completers changing employers against the will of training firms. This means
that we focus solely on the perspective of the training firm because the firm pays for training
investments and can only get a return on investment if apprentices stay. If the training firm
attempts to retain an apprentice but the apprentice nevertheless leaves, this is, in our
definition, an “involuntary quit” from the training firm’s perspective.

14
Second, our poaching conditions require comparable apprentices. Hence, we analyse
variations within cells, defined as apprentices within an establishment, training occupation,
and cohort. In each cell, we need at least one moving and one staying apprenticeship
completer. This restriction leads to a selection of rather large establishments (see sample
selection above) but it allows us to compare apprentices who learn the same tasks, within the
same training environment, with the same training instructors, with the same wage setting
rules, and the same selection process into apprenticeship.
Third, we identify poaching by `immediate’ movers who still work in their training
occupation after apprenticeship completion. Staying in the same occupation should reduce the
possibility of varying pay solely based on different tasks and jobs apprenticeship completers
do. Moreover, considering only `immediate’ apprenticeship completers those who worked for
a maximum of 10 days in the firm after apprenticeship completion before moving ensures that
training firms have not had a chance to obtain a return on their training investments. The ten-
day rule further ensures that the movers and stayers are as homogeneous as possible. If we
also include the movers who switch sometime after finishing apprenticeship training, this
could induce unobservable differences between early movers, stayers and late movers, for
example, with respect to unobservable training occurring after apprenticeship training (Kahn
2013). In addition, a short period between completing an apprenticeship and new employment
is usually interpreted as a sign of having quit rather than being fired (Haltiwanger et al. 2017),
which also underpins that the move is more likely to be involuntary from the training firm’s
perspective. These “immediate” movers make up 7.1 per cent of all apprenticeship completers
in our sample (see Appendix Table B3 for more details). Fourth, we identify poaching
completely on the basis of financial considerations. The decision to stay in the training firm
might, however, been influenced by unobservable (expected) utility considerations.
Individuals may choose to switch firms because of reasons that go beyond pay considerations
such as job satisfaction, career opportunities and life events.13 Poaching firms might offer a

15
more attractive location, work environments or career prospects in addition to financial
incentives. Moreover, we have no information about outside offers, counter-offers made by
firms and individual search behaviour.
First poaching condition: “interest to keep”
The first poaching condition (“interest to keep”) requires that we can identify apprentices the
training firm wants to keep. We identify the desirability of apprenticeship completers by the
relative earnings position within the training firm, occupation and cohort cell. We label
movers who earn more than the stayer with the highest earnings in a cell as movers against the
will of the training firm. We relax this strong requirement later in a robustness check. For the
interpretation, the timeline is important: The training firm first pays more to those apprentices
it wants to keep and after apprenticeship completion, the apprentice decides about staying or
leaving.
It is important for our argument that training firms differentiate payment at the end of the
apprenticeship period. We argue that firms pay a higher salary to apprentices they want to
keep and for whom a risk of leaving has been identified. The payment relative to the peers
within a cell reveals higher relative appreciation of a firm to keep an apprentice. We assume
that it is sufficient that a) more-appreciated apprentices earn more than less-appreciated
apprentices and b) training firms prefer to retain more-appreciated apprentices. Moreover, the
condition includes the possibility that employers plan from the start to retain only a certain
fraction of apprenticeship completers because they screen during apprenticeship (Acemoglu
and Pischke 1998).
Obviously, we can only identify firms’ interest to keep an apprentice if a firm differentiates
earnings within cells. We find striking earnings variation between homogeneous apprentices
in the same cell at the end of apprenticeship training. The standard deviation of apprentices’
earnings is zero for only 15.5 per cent of cells at the end of apprenticeship. Most training

16
establishments pay apprentices slightly different earnings (compare appendix Table B4), even
if apprentices have similar characteristics such as age, schooling qualification or gender. The
average standard deviation of earnings is 1.99 Euros a day within a cell. This difference
accounts for around seven per cent of the daily gross earnings (Table 1).
We interpret earnings differences between apprentices at the end of their apprenticeship
within a cell as relative appreciation or interest to keep an apprentice. This argument is
supported by the fact that earnings variations within cells are relatively small until the last
months of the apprenticeship but strongly increase when the final exam approaches
(Appendix: Figure A1)14. The stark increase in earnings variation within cells before
completion supports our interpretation that firms use small rewards to nudge apprentices they
want to keep. Firms deliberately vary payments. On the contrary, paying apprentices who are
supposed to leave after apprenticeship completion more than necessary is a waste of money.
We also find this stark wage variation within cells in unionised firms. Unionised firms are
free to voluntarily pay a wage above the collective bargaining level as merit pay and wage
supplements allow for pay variation. However, unions, some works councils and the
management of some training firms may regard explicit performance pay for apprentices as
divisive or as a source of dysfunctional incentives to produce rather than learn during training.
Therefore, we collected information about the external validity of earnings differences in
interviews with several HR managers in training firms. The HR managers confirmed that all
apprentices in the same training year receive the same base salary, usually according to
collective agreements. However, many firms pay bonuses for good performance by
apprentices. For example, many firms send their apprentices abroad for some weeks in the
final training year. Managers state that apprentices who are sent abroad are a positive
selection. Working abroad, therefore, is a reward for good performance that is accompanied
by additional payments according to collective agreements. Additional evidence is provided

17
by the latest Federal Institute of Vocational Education and Training costs/benefit study, a
survey of the costs and benefit structures of German apprenticeship training firms conducted
every six years (Jansen et al., 2015). This survey indicates that 45 percent of training firms
pay their apprentices a bonus (Appendix Table A4). These extra payments can include
accommodation and travel costs for apprentices working abroad. Moreover, 16 percent of
training firms provide explicit merit payments for apprentices. In addition, Ryan et al. (2013)
present evidence for individual and group-related performance pay for apprentices in 13 out
of the 18 engineering and retailing firms analysed in Germany. Backes-Gellner and Oswald
(2014) find that several firms pay earnings bonuses for good grades in vocational schools.
Thus, we can conclude that several mechanisms link the earnings of apprentices within an
employer and occupation cell to individual productivity relative to their peers in the same cell.
We find that 39 per cent of immediately moving apprenticeship completers earn more than the
best-paid stayer at the end of the apprenticeship (Table 2). In more detail, 46 per cent of all
immediate movers in blue-collar manufacturing occupations that require high investments by
training firms earn more at the end of the apprenticeship than those who stayed with the
training firm. This share is lower for white-collar occupations (29 per cent).
Second poaching condition “earnings mark-up”
The decision of an apprentice to leave the training firm might be a consequence of individual
preferences and not of a superior offer from an outside firm. Since we aim at identifying
poaching as a deliberate action by outside employers and not luck, we additionally impose the
second condition. Raiding firms are willing to offer an earnings mark-up for moving
apprenticeship completers compared to what he or she would have obtained in the training
firm. This condition implies that the training firm was unable or unwilling to counter the offer
by the raiding firm15.

18
To calculate earnings mark-ups, we need counterfactual earnings - earnings that a leaving
apprenticeship completer would have received if he or she stayed with the training firm. We
construct the counterfactual earnings as the highest earnings of stayers within the cell. These
earnings are the highest revealed willingness to pay by the training firm for a comparable
apprenticeship completer. We use the highest earnings of all staying apprenticeship
completers within a cell as an indicator of the willingness to pay for the mover. Choosing the
highest earnings of a stayer ensures a strict poaching condition.
Table 3 shows that 32 per cent of all immediate movers earn more than the best-paid staying
apprenticeship completer in his or her first regular job (our second poaching condition). This
proportion is again higher for immediately moving apprenticeship completers in blue-collar
manufacturing occupations (42 per cent) than those in white-collar occupations (25 per cent).
The second condition alone is also not sufficient to identify poaching. The “earnings mark-
up” condition can be met if the training firm wanted to hire only the most desirable apprentice
(“interest to keep” condition) and another lower-paid apprentice was lucky to receive an offer
from an outside firm that was higher in pay than that of the highest-paid stayer. Therefore, we
combine both conditions to identify poaching on the individual level. Table 4 shows that 15.5
per cent of all immediately moving apprenticeship completers fulfil both poaching
conditions16. Again, poaching is more frequent in more cost-intensive blue-collar
manufacturing occupations (21 per cent) than in white-collar occupations (11 per cent). This
implies that poaching can indeed be observed for apprentices in training occupations with
investments in general skills.

19
Characteristics of Poaching Victim Firms
Classification of firms and the extent of poaching
We turn to the establishment level now. Each establishment/ year observation can consist of
several cells because an establishment can train apprentices in more than one occupation. We
classify an establishment/ year observation as poaching victim if at least one apprenticeship
completer within one of the establishment/ year cells fulfils both poaching conditions.
Accordingly, we classify an establishment/ year observation as raider if it hires at least one
poached apprenticeship completer. We classify the remaining establishment/ year
observations as control group if they train at least two apprenticeship completers within a cell
and keep at least one of both, i.e. if they potentially could be classified as poaching victim.
In principle, one establishment can comprise several cells that have been classified
differently. However, we do not find any poaching victim that is also a raiding firm in any
other cell or year within the linked employer-employee dataset we use to identify poached
individuals17. Of course, we find control establishments that are poaching victims in another
year. That’s why we clean the control group by deleting all establishments that have been
classified as poaching victim in any other year. Hence, the control group contains only
establishment/ year cells from establishments never classified as poaching victims. Poaching
victims, raiding firms and control firms are mutually exclusive establishment groups during
our observation period.
According to our definition, around 4 per cent of training establishments are poaching
victims. This shows that poaching according to our strict definition does exist even in large
firms, but seems not to be widespread in our sample. We also find that more than three
quarters of poaching victims experience poaching only once during our observation period.

20
Characteristics of poaching firms: poaching victims vs. raiding firms
We proceed and compare poaching victims with raiding firms in order to analyse structural
differences between both groups. Afterwards, we investigate differences between poaching
victims and control firms.
Table 5 displays descriptive statistics and t-tests of poaching victims and raiding firms. We
find three main differences. First, raiding firms experience an employment growth of 5.5 per
cent within a year compared with an employment decline of 2 per cent of poaching victims.
Both groups employ a similar number of employees, however. Second, raiding firms train less
apprentices as a proportion of all employees (3.7 per cent) than poaching victims (9.8 per
cent). Nevertheless, 83 per cent of raiding firms train apprentices themselves. Third, both
firms have similar earnings level. This holds for the 25, 50, and 75 per cent earnings quartiles.
Multivariate Probit regressions displayed in Table 6 accordingly show that poaching victims
experience an employment decline, train more, and pay less than raiders.
We proceed by investigating the development of these firm characteristics over time. Figure 1
illustrates the development of the number of employees (percentage change). The horizontal
axis displays the timing, starting three years before poaching until three years after poaching
which occurs at time zero18. It shows that raiding firms strongly grow by more than 15 per
cent until poaching occurs. On the contrary, employment in poaching victim firms slightly
declines during the same period. These findings are confirmed in regressions shown in
Appendix Table B5. Table B5 displays coefficients of being a poaching victim on firm size
and employment growth in OLS regressions controlling for further firm characteristics.
Raiding firms are smaller than poaching victims during the seven-year period but employment
growth significantly differs between both groups in the years before poaching and when
poaching happens.

21
Figure 2 illustrates the development of the proportion of apprentices on all employees for the
same period three years before and after poaching. Poaching victims train 2.5 times more
apprentices than raiding firms. This proportion slightly decreases after poaching but remains
higher for poaching victims than for raiding firms. Appendix Table B5 accordingly shows
regression coefficients of the poaching victim dummy on the proportion of apprentices on all
employees controlling for additional establishment characteristics. These regressions confirm
significant differences in the number of apprentices between poaching victims and raiding
firms over the entire observation period. Moreover, poaching does not change training
participation for poaching victims – less than four per cent of poaching victim firms quit
apprenticeship training in the three years after poaching. We also find no substantial reduction
in training efforts of raiders before or after the poaching event19.
Characteristics of poaching firms: poaching victims vs. control group firms
We proceed with an analysis of the differences between poaching victims and control firms.
Table 5 shows descriptive statistics and t-tests. Poaching victims employ more people (1299
to 839), train a higher share of apprentices as a proportion of total employment (9.8 to 7.4 per
cent), and pay more (98 to 91 Euros a day at median) than control firms. Poaching victims
seem not to be weaker than control firms that are able to keep the apprentices they want.
Multivariate regressions that control for additional establishment characteristics confirm these
findings (Table 7). Marginal effects after Probit (Table 7, column 1) show that ten per cent
higher median earnings raise the poaching probability by around 0.5 percentage point.
Earnings growth of ten per cent decreases the poaching probability by 0.6 percentage points.
These numbers should be compared with the overall poaching probability of four per cent.
The ten percentage point increase in the average establishment earnings level accounts for
nearly 12 per cent of the total poaching probability. Furthermore, employing 1000 more
employees increase poaching probability by only 0.1 percentage points and an employment

22
reduction of ten per cent reduces poaching probability by 0.7 percentage points. Finally,
poaching victims employ significantly more apprentices, more females and fewer foreign
employees than control group firms.
We investigate more thoroughly, whether poaching victims are indeed not structurally weaker
than the control firms that are able to keep the apprentices they want. We use additional
survey information of the IAB Establishment panel, which we can merge for a sub-sample of
57 per cent of establishment/ year observations. Firms in the sub-sample are similar to those
in the entire sample (Table 7, column 2). Additional variables from the establishment survey
allow us to investigate further establishment characteristics such as investments, industrial
relations, and exports that are commonly related to training. We find that more competitive
firms with higher investments per capita, a higher export-share and with a collective
agreement are more likely to be poaching victims (Table 7, column 3). This result confirms
that poaching victims are generally not structurally weak firms. In addition, business
expectations are similar between poaching victims and control establishments - this suggests
that firms expect that the downturn is more likely to be of transitory nature. Our previous
findings regarding salaries, employment and training intensity do not change when we include
the additional covariates.
Finally, we consider endogeneity concerns and extend the model in column 1 of Table 7. We
account for time-invariant variables that could simultaneously affect poaching and
employment reduction, such as leadership culture, management quality, incentive and reward
systems or general human resource management practices by estimating a Linear Probability
First Difference Model, with first differences between the year of poaching and the previous
year for all firms (see the first two columns of Table 8)20. If we take firm fixed-effects into
account, an employment reduction of ten per cent significantly increases the probability of
being a poaching victim by 0.43 percentage points. This explains around eleven per cent of

23
the overall probability of being a poaching victim. Earnings differences are no longer
significant. Our main results are robust to the inclusion of firm fixed-effects.
Our findings also hold if we only analyse firms that train blue-collar manufacturing
apprentices21 (Table B6 for descriptive statistics and columns 3 and 4 in Table 8). In the sub-
sample of blue-collar apprentices, an employment decrease has an even stronger impact on
poaching. All other variables remain insignificant.
Firms’ response to poaching
In most theoretical models, poaching is not systematic and training firms do not change their
training behaviour. In principle, poaching victims have three possible responses to poaching:
reduce training expenses, improve retention of apprenticeship completers by increasing
skilled entry payments and/or reduce the number of training places22. As we have no
establishment-level data on training expenses, our empirical analysis concentrates on the
second and third point.
We analyse differences between poaching victims and control firms using the following
timing approach: firms suffer poaching or fulfil criteria as a control firm in period 0 and can
react in periods 1, 2 and 3. We apply fixed-effect models because we are interested in
reactions or changes in behaviour of poaching victims controlling for time-invariant factors
such as leadership culture and HR policies.
Table 9 presents a fixed-effects model explaining the share of newly hired apprentices
including the number of years passed since poaching. The first two columns show estimates
for all firms, and the third and fourth column show estimates for firms that train apprentices in
blue-collar manufacturing occupations. Columns 2 and 4 include additional establishment
characteristics usually associated with firms’ training decisions. Table 9 shows that poaching
victims do not adjust the numbers of training places in the year after poaching has taken place.

24
Since poaching occurs in spring or summer after the legally fixed termination of
apprenticeships and many firms decide about new intakes up to one year in advance, an
immediate reaction is unlikely. Poaching victims however do not reduce the share of training
places on all employees in the second and third year after poaching.
The employment reaction to poaching differs somewhat for firms that train apprentices in
blue-collar manufacturing occupations. The share of new apprentice intakes is unchanged in
the first year after poaching, it decreases by 0.3 percentage points in the second and by 0.7
percentage points in the third year. The number of training positions shrinks to a level similar
to control firms in the third year after the poaching incidence. The reduction therefore seems
to be a sign of a “normalisation” of poaching victims´ training behaviour rather than a change
in training strategy.
Poaching victims could also increase earnings for apprenticeship completers in their first
skilled job as a counter strategy against raid attempts by outside firms. Columns 1 and 2 of
Table 10 present fixed-effects earnings regressions up to three years after poaching compared
with control firms again for parsimonious and richer specifications. Columns 3 and 4 repeat
these regressions for firms with blue-collar manufacturing apprentices. Poaching victims do
not adjust entry earnings of apprenticeship completers in response to poaching. We also find
no differences between occupation groups. These results also suggest that poaching victims
perceive poaching as a transitory event.
Robustness checks
We choose rather strong poaching conditions in order to analyse if poaching happens but we
run some robustness checks with regard to these definitions. First, we relax the poaching
conditions. In particular, the first poaching condition identifies all movers who earn more than
the best-paid stayer in the cell. This condition may indeed be too restrictive if a training firm
may also like to keep the second- or third-highest paid apprentice. Hence, we relax the first
25
poaching condition and set the earnings threshold to more than the median in the cell. Around
50 per cent more apprenticeship completers who change the employer immediately after
training meet the weaker condition. The recalculation leads to 5.1 per cent of firms being
classified as poaching victims. Second, if we relax the second poaching condition and set the
entry wage threshold to more than the median in the cell of the staying apprenticeship
completers, we also obtain a share of 5.1 per cent poaching victims. Poaching victims, raiding
firms and control firms that meet the relaxed conditions still have comparable characteristics
to firms that meet the stronger conditions. Moreover, the results on determinants of, and
responses to, poaching remain robust. We also test a more restrictive second poaching
condition and require a five per cent pay mark-up in the outside firm in comparison to the
highest paid stayer. This robustness check reduces the share of poaching victims to 2.6 per
cent but the key results still hold. We also test propensity score matching instead of regression
based approaches and found qualitatively the same results. Finally, we test whether our results
hold for a more restrictive classification of occupations. We run an analysis with the more
precise 3-digit occupational classification. As a general rule, blue-collar manufacturing and
service occupations with the same 2-digit but different 3-digit occupation codes are usually
specialisations in a similar occupation23. Different occupational specialisations could be seen
as substitutes. A 3-digit code is, therefore, less appropriate for our kind of analysis24.
However, using a 3-digit code does not change our main results.
Consequences for the German apprenticeship training system
Our results show a modest incidence of poaching in a sample of relatively large
apprenticeship training firms. We argue that labour market frictions are the prime explanation
for poaching. Labour market frictions arise because apprenticeships usually last three or three
and a half years. Poaching victims and raiding firms might be unexpectedly hit by a transitory
labour demand shock long after the decision to train was made. Such a shock is less likely to

26
have serious consequences for long-term training programmes (Brunello 2009). This section
discusses our main arguments for the transitory nature of poaching and the consequences of
our results for our understanding of the German apprenticeship training system.
First, poaching victims are mainly firms in a temporary downturn. Poaching victims might
have been too optimistic about their skilled labour demand at the time apprentices were hired.
Therefore, poached apprenticeship completers would have been retained without the strong
employment reduction. This interpretation fits with our first poaching condition that poaching
victims keep apprenticeship completers of a training cohort but are not able to retain the
completers they paid the highest salary. This happens only during the downturn and not in
earlier or later years. Moreover, the business expectations of poaching victims and control
firms are similar and therefore the downturn seems to be transitory.
Second, raiding firms face a temporarily higher demand for skilled employees because they
experienced a strong employment growth before poaching. They might have been too
pessimistic about their skilled labour demand when apprentices were hired. Thus, they may be
forced to outbid wages for apprenticeship completers in order to fill the gap. This
interpretation of our results is supported by the fact that raiding firms usually rely on their
own apprentices because most raiders also regularly train apprentices. In addition, we cannot
detect raiding in more than two consecutive years. This means that we have no indications of
a systematic raiding strategy of firms.
Third, poaching victims are relatively large firms that train more apprentices and pay more
than comparable firms that manage to keep their best apprentices. Even if this result seems to
be counter-intuitive at first sight, it supports the hypothesis of the transitory nature of
poaching. As high-paying training firms usually attract school-leavers from the upper end of
the ability distribution, they are generally considered to be high-quality training firms in
“normal” times (Soskice 1994; Smits 2006)25. Their apprenticeship completers might be seen

27
as a worthwhile poaching prey. Outside firms may only dare to poach, or might only be
successful and able to poach, if a high-quality training firm shows temporary signs of
vulnerability such as downsizing which is visible for outside firms. Outside firms might
exploit the current weakness of poaching victims and be willing to pay well for highly
productive apprenticeship completers from these firms.
Fourth, we cannot detect any substantial long-term consequences of poaching. Poaching
victims neither reduce the proportion of apprentice intakes nor the salaries of apprenticeship
completers in the first job. They are also able to prevent poaching in subsequent years. Hence,
they do not perceive poaching as a systematic threat.
The interpretation of our results as a transitory rather than a permanent event is in line with
most theoretical models that allow a small but not systematic incidence of poaching (Stevens
1996, 2001; Acemoglu and Pischke 1998, 1999a, 1999b; Booth and Zoega 2004; Leuven
2005). However, our finding is against the argument that firms with better technology, higher
market power or management quality can systematically exploit their advantage and entice
high quality trainees from weaker firms (Lazear 1986; Cahuc et al. 1990)26. Our interpretation
extends the argument that strong employer coordination do not only reduce the poaching
threat (Soskice 1994; Culpepper 1999; Busemeyer 2009) but they also allow a reallocation of
apprenticeship completers for training firms with a temporarily higher or lower demand.
These insights are important because they solve a much-cited puzzle – how is it possible that
a high training equilibrium with investment in apprenticeship training is not put into question
by poaching? Our answer is that poaching occurs only sporadically and poaching victims are
not structurally weak firms but high-quality training firms in a temporary economic downturn.
Raiding firms instead usually also train but increase their workforce before the raiding event.
Therefore, the overall importance of poaching on expected returns to apprenticeship training
and firms’ training decisions seems to be negligible.

28
Conclusions
We present a novel approach to detect poaching and show the existence of poaching after
apprenticeship training. The extent of poaching is modest in our sample and poaching is more
likely to be a transitory event instead of a systematic threat. Poaching victims are not
structurally weak firms but relatively high-quality training firms in a temporary economic
downturn.
We leave a number of relevant questions for future research. A potential shortcoming is that
our poaching conditions restrict the analysis to rather large training firms, more specifically
firms that train at least two apprentices per occupation and cohort. Large firms are usually
considered to be less exposed to poaching than small firms. Strategies of small firms for
handling the poaching threat may differ. However, one key contribution of our paper is that
we can identify poaching even in large firms. We further find that poaching victims train three
times more apprentices than raiding firms. Unfortunately, we cannot explain the difference in
training efforts with the data at hand.
We also only account for short-term financial motives of apprentices and exclude for example
long-term career incentives in outside firms or dissatisfaction incurred during the
apprenticeship as additional poaching triggers. We finally want to note that our analysis
identifies the ex-post realisation of but cannot say anything about non-participation in training
because of ex-ante fears of poaching. We are therefore careful and interpret our results as
characteristics and consequences of ex-post experiences of poaching. However, we can
assume that training firms adapt their ex-ante expectations about poaching by observing
poaching ex-post. Analysing determinants and consequences of poaching ex-post gives an
insight on realised poaching and, therefore, an information basis for expectations.
Our results can be transferred to other situations or countries in which firms provide and cover
the costs of training in visible and transferable skills for their workforce. Training contents are

29
visible and transferable in countries with dual apprenticeship training in which nationally
recognised curricula guarantee the visibility of skills and skills are certified by independent
institutions. Contents are also visible and transferable in other types of training or lifelong
learning in which companies invest in skills development and in which an external institution
guarantees transferable content with a standardised curriculum and a recognised certificate. In
these cases, wage compression (Leuven 2005) and/ or employer coordination (Trampusch and
Eichenberger 2012) may support employer investments in further training activities.
Examples of these types of training are vocational or professional upgrading training,
recognised training courses at chartered institutes, recognised IT or language training
certificates, tuition reimbursement schemes for graduate courses or academic grades, or
training in leadership skills such as an MBA (Autor, 2001; Cappelli 2004; Benson et al. 2004;
Pattie et al. 2006; Manchester 2012; Benson 2013). Our results are relevant for these types of
training and our measurement strategy can be applied in analogy to the method chosen in this
paper.
References
Acemoglu, D. and Pischke J. (1998). ‘Why Do Firms Train? Theory and Evidence’. Quarterly Journal of Economics, 113(1): 79-119.
Acemoglu, D. and Pischke, J. (1999a). ‘The Structure of Wages and Investment in General Training’. Journal of Political Economy, 107(3): 539-572.
Acemoglu, D. and Pischke, J. (1999b). ‘Beyond Becker: training in imperfect labour markets’. Economic Journal, 109(453): 112-142.
Acemoglu, D. and Pischke, J. (2000). ‘Certification of Training and Training Outcomes’. European Economic Review, 44: 917-927.
Akerlof, G. (1984). ‘Gift Exchange and Efficiency-Wage Theory: Four Views’. American Economic Review, 74(2): 79-83.

30
Autor, D. (2001). ‘Why do Temporary Help Firms Provide Free General Skills Training?’. Quarterly Journal of Economics, 116(4):1409-1448.
Backes-Gellner, U. and Tuor, S. (2010). ‘Avoiding Labor Shortages by Employer Signaling - On the Importance of Good Work Climate and Labor Relations’. Industrial and Labor Relations Review, 63(2): 271-286.
Backes-Gellner, U. and Oswald, Y. (2014). ‘Learning for a bonus: How financial incentives interact with preferences’. Journal of Public Economics, 118: 52-61.
Barron, J., Berger, M. and Black, D. (2006). ‘Selective Counteroffers’. Journal of Labor Economics, 24(3): 385-409.
Becker, G. (1993). Human Capital – A Theoretical and Empirical Analysis, with Special Reference to Education, 3rd edition. Chicago: University of Chicago Press.
Benson, A. (2013). ‘Firm-sponsored general education and mobility frictions: Evidence from hospital sponsorship of nursing schools and faculty’. Journal of Health Economics, 32(1): 149-159.
Benson, G.S., Finegold, D. and Mohrmann, S.A. (2004). ‘You Paid for the Skills now Keep Them: Tuition Reimbursement and Voluntary Turnover’. Academy of Management Journal, 47(3): 315-331.
Bispinck, R., Dorsch-Schweizer, M. and Kirsch, J. (2002). ‘Tarifliche Ausbildungsförderung begrenzt erfolgreich – eine empirische Wirkungsanalyse’. WSI Mitteilungen 04/2002, pp. 213-219.
Booth, A.L. and Zoega, G. (2004). ‘Is Wage Compression a Necessary Condition for Firm-Financed General Training?’. Oxford Economic Papers, 56(1): 88-97.
Booth, A.L. and Bryan, M. (2005). ‘Testing Some Predictions of Human Capital Theory: New Training Evidence from Britain’. Review of Economics and Statistics, 87(2): 391-394.
Booth, A.L. and Katic, P. (2011). ‘Men at Work in a Land Down-Under: Testing Some Predictions of Human Capital Theory’. British Journal of Industrial Relations, 49(1): 1-24.
Brunello, G. (2009). ‘The effect of economic downturns on apprenticeships and initial workplace training: a review of the evidence’. Empirical Research in Vocational Education and Training, 1(2): 145-171.
Busemeyer, M. (2009). ‘Asset Specificity, Institutional Complementarities and the Variety of Skill Regimes in Coordinated Market Economies’. Socio-Economic Review, 7(3): 375-406.
Busemeyer, M. and Iversen, T. (2012). ‘Collective Skill Systems, Wage Bargaining, and Labor Market Stratification’. In M. Busemeyer and C. Trampusch (eds.), The Political Economy of Collective Skill Formation. Oxford: Oxford University Press, pp. 205-233.
Card, D., Heining, J. and Kline, P. (2013). ‘Workplace Heterogeneity and the Rise of West German Wage Inequality’. The Quarterly Journal of Economics, 128(3): 967-1015.

31
Carlin, W. and Soskice, D. (2009). ‘German Economic Performance: Disentangling the Role of Supply-Side Reforms, Macroeconomic Policy and Coordinated Economy Institutions’. Socio-Economic Review, 7(1): 67-99.
Cahuc, P., Sevestre, P. and Zajdela, H. (1990). ‘Négociations salariales et segmentation du marché du travail’. Economie et prevision, 92(1): 43-50.
Cappelli, P. (2004). ‘Why do employers pay for college?’. Journal of Econometrics, 121(1): 213-241.
Culpepper, P. (1999). ‘The Future of the High-Skill Equilibrium in Germany’. Oxford Review of Economic Policy, 15(1): 43-59.
Dustmann, C., Ludsteck, J. and Schönberg, U. (2009). ‘Revisiting the German Wage Structure’. The Quarterly Journal of Economics, 124(2): 843-881.
Dustmann, C. and Schönberg, U. (2009). ‘Training and Union Wages’. The Review of Economics and Statistics, 91(2): 363-376.
Dustmann, C. and Schönberg, U. (2012). ‘What makes Firm-based Vocational Training Schemes Successful? The Role of Commitment’. American Economic Journal: Applied Economics, 4(2): 36-61.
Farber, H. and Gibbons, R. (1986). ‘Learning and Wage Dynamics’. Quarterly Journal of Economics, 111(4): 1007-1047.
Fitzenberger, B., Kohn, K. and Lembcke, A. (2013). ‘Union Density and Varieties of Coverage: The Anatomy of Union Wage Effects in Germany’. Industrial and Labor Relations Review, 66(1): 169-197.
Fort, T., Haltiwanger, J., Jarmin, R.S. and Miranda, J. (2013). ‘How Firms Respond to Business Cycles: The Role of Firm Age and Firm Size’. IMF Economic Review, 61(3): 520-559.
Griffeth, R.W., Hom, P.W. and Gaertner, S. (2000). ‘A Meta-Analysis of Antecedents and Correlates of Employee Turnover: Update, Moderator Tests, and Research Implications for the Next Millennium’. Journal of Management, 26(3): 463-488.
Gerlach, K. and Stephan, G. (2006). ‘Pay Policies of Firms and Collective Wage Contracts: an Uneasy Partnership?’. Industrial Relations, 45(1): 47-68.
Grund, C. (2005). ‘The Wage Policy of Firms – Comparative Evidence for the U.S. and Germany from Personnel Records’. International Journal of Human Resource Management, 16 (1): 104-119.
Gospel, H. (1998). ‘The Revival of Apprenticeship Training in Britain?’. British Journal of Industrial Relations, 36(3): 435-457.
Göggel, K. and Zwick, T. (2012). ‘Heterogeneous Wage Effects of Apprenticeship Training’. Scandinavian Journal of Economics, 114 (3): 756 – 779.
Haltiwanger, J., Hyatt, H., Kahn, L. and McEntarfer, E. (2017). ‘Cyclical Job Ladders by Firm Size and Firm Wage’. NBER Working Paper 23485, Cambridge, MA.

32
Jansen, A., Pfeifer, H., Schönfeld, G. and Wenzelmann, F. (2015). ‘Apprenticeship training in Germany remains investment-focused – results of BIBB Cost-Benefit Survey 2012/13’. BiBB report 01/2015.
Jacobebbinghaus, P. (2008). LIAB-Datenhandbuch, Version 3.0. FDZ Datenreport 03/2008.
Kahn, L. (2013). ‘Asymmetric Information between Employers’. American Economic Journal: Applied Economics, 5(4): 165-205.
Kampkötter, P. and Sliwka, D. (2014). ‘Wage Premia for Newly Hired Employees’. Labour Economics, 31(1): 45-60.
Konings, J. and Vanormelingen, S. (2015). ‘The Impact of Training on Productivity and Wages: Firm-Level Evidence’. Review of Economics and Statistics, 97(2): 485-497.
Lakies, T. and Nehls, H. (2009). Berufsbildungsgesetz. Basiskommentar. Frankfurt am Main: Bund-Verlag.
Lazear, E. (1986). ‘Raids and Offer-Matching’. Research in Labor Economics, 8(A): 141-165.
Lee, T.W. and Mitchell, R.R. (1994). ‘An Alternative Approach: The Unfolding Model of Employee Turnover’. Academy of Management Review, 19(1): 51–89.
Leuven, E. (2005). ‘The Economics of Private Sector Training: A Survey of the Literature’. Journal of Economic Surveys, 19(1): 91-111.
Lewis, P., Ryan, P. and Gospel, H. (2008). ‘A hard sell? The Prospects for Apprenticeship in British Retailing’. Human Resource Management Journal, 18(1): 3-19.
Loewenstein, M. and Spletzer, J. (1999). ‘General and Specific Training: Evidence and Implications’. Journal of Human Resources, 34(4): 710-733.
Manchester, C.F. (2012). ‘General Human Capital and Employee Mobility; How Tuition Reimbursement Increases Retention Through Sorting and Participation’. Industrial and Labor Relation Review, 65(4): 951-974.
March, J.G. and Simon, H.A. (1958). Organizations. New York: Wiley.
Marsden, D. and Ryan, P. (1990). ‘Institutional aspects of youth employment and training policy in Britain’. British Journal of Industrial Relations, 28(3): 351-369.
Marsden, D. (1990). ‘Institutions and Labour Mobility: Occupational and Internal Labour Markets in Britain, France, Italy and West Germany’. In R. Brunetta and C. Dell´Arringa (eds.), Labour Relations and Economic Performance. Houndmills: Macmillan, pp. 414-438.
Marsden, D. (2016). Norms of exchange and the socio-economics of labour markets, in Kaufman B (ed) Labor Market Models. Chicago: Stanford University Press.
Mobley, W.H. (1977). ‘Intermediate Linkages in the Relationship between Job Satisfaction and Employee Turnover’. Journal of Applied Psychology, 62(2): 237-240.
33
Moen, E. and Rosen, A. (2004). ‘Does Poaching Distort Training?’. Review of Economic Studies, 71(4): 1143-1162.
Mohrenweiser, J. and Zwick, T. (2009). ‘Why Do Firms Train Apprentices? The Net Cost Puzzle Reconsidered’. Labour Economics, 16(6): 631-637.
Mohrenweiser, J. and Backes-Gellner, U. (2010). ‘Apprenticeship training: for investment or substitution?’. International Journal of Manpower, 31(5): 545-562.
Mohrenweiser, J. and Zwick, T. (2013). ‘Managing Retention after Training in Transferable Skills: The Effect of a Bonus during Training’. Paper presented at GEABA 2013.
Mohrenweiser, J., Wydra-Sommaggio, G. and Zwick, T. (2017). ‘Information Advantages of Training Employers Despite Credible Training Certificates’. Economics of Education working paper No. 121, Zurich.
Mühlemann, S. and Wolter, S. (2011). ‘Firm-sponsored training and poaching externalities in regional labor markets’. Regional Science and Urban Economics, 41(6): 560-570.
Parrotta, P. and Pozzoli, D. (2012). ‘Learning by Hiring and Productivity: The Case of Denmark’. RAND Journal of Economics, 43(1): 167-185.
Pattie, M., Benson, G.S. and Baruch, Y. (2006). ‘Tuition Reimbursement, Perceived Organisational Support and Turnover Intention among Graduate Business School Students’. Human Resource Development Quarterly, 17(4): 423-442.
Pfeifer, C. (2008). ‘An Empirical Note on Wages in an Internal Labour Market’. Economics Letters, 99 (3): 570-573.
Pfeifer, C. (2016). ‘Intra-firm Wage compression and Coverage of Training Costs’. Industrial and Labor Relation Review, 69(2): 405-434.
Postel-Vinay, F. and Robin, J.M. (2004). ‘To Match or not to Match? Optimal Wage Policy with endogenous worker search intensity’. Review of Economic Dynamics, 7(2): 297-330.
Ryan, P., Wagner, K., Teuber, S. and Backes-Gellner, U. (2013). ‘Apprentice Pay in Britain, Germany and Switzerland: Institutions, Market Forces and Market Power’. European Journal of Industrial Relations, 10(3): 201-220.
Ryan, P. (2011). ‘Apprenticeship: Between Theory and Practice, School and Workplace’. Economics of Education Working Paper No. 64, Zurich.
Sadowski, D. (1980). Berufliche Bildung und betriebliches Bildungsbudget zur ökonomischen Theorie der Personalbeschaffungs- und Bildungsplanung im Unternehmen. Stuttgart: Poeschel Verlag.
Schönfeld, G., Wenzelmann, F., Dionisus, R., Pfeifer, H. and Walden, G. (2010). Kosten und Nutzen der dualen Ausbildung aus Sicht der Betriebe. Bielefeld: Bertelsmann Verlag.
Smits, W. (2006). ‘The Quality of Apprenticeship Training’. Education Economics, 14(3): 329-344.

34
Song, J., Almeida, P. and Wu, G. (2003). ‘Learning-by-Hiring: When is Mobility More Likely to Facilitate Interfirm Knowledge Transfer?’. Management Science, 49(4): 351-365.
Soskice, D. (1993). ‘Social Skills from Mass Higher Education: Rethinking the Company-Based Initial Training Paradigm’. Oxford Review of Economic Policy, 9(3): 101-113.
Soskice, D. (1994). ‘Reconciling Markets and Institutions: The German Apprenticeship System’. In L.M. Lynch (Ed.), Training and the Private Sector: International Comparisons. Chicago: University of Chicago Press, pp. 26-60.
Stevens, M. (1994). ‘A theoretical model of on-the-job training with imperfect competition’. Oxford Economic Papers, 46(4): 537-562.
Stevens, M. (1996). ‘Transferable Training and Poaching Externalities’. In A. Booth and D. Snower (Eds.), Acquiring Skills - Market Failures, Their Symptoms and Policy Responses. Cambridge: Cambridge University Press.
Stevens, M. (2001). ‘Should Firms Be Required to Pay for Vocational Training?’. Economic Journal, 111(473): 485-505.
Trampusch, C. and Eichenberger, P. (2012). ‘Skills and Industrial Relations in Coordinated Market Economies—Continuing Vocational Training in Denmark, the Netherlands, Austria and Switzerland’. British Journal of Industrial Relations, 50(4): 644-666.
Wenzelmann, F. (2012). ‘Ausbildungsmotive und die Zeitaufteilung der Auszubildenden im Betrieb’. Journal for Labour Market Research, 45(2): 125-145.
Wolter, S. C. and Ryan, P. (2011). ‘Apprenticeship’. Handbook of the Economics of Education, 3: 521-576.
Wydra-Somaggio, G. and Seibert, H. (2010). ‘Signalwirkung von Lehrabschlüssen Einkommensunterschiede von Ausbildungsabsolventen beim Berufseinstieg’. Sozialer Fortschritt, 59(12): 296-305.
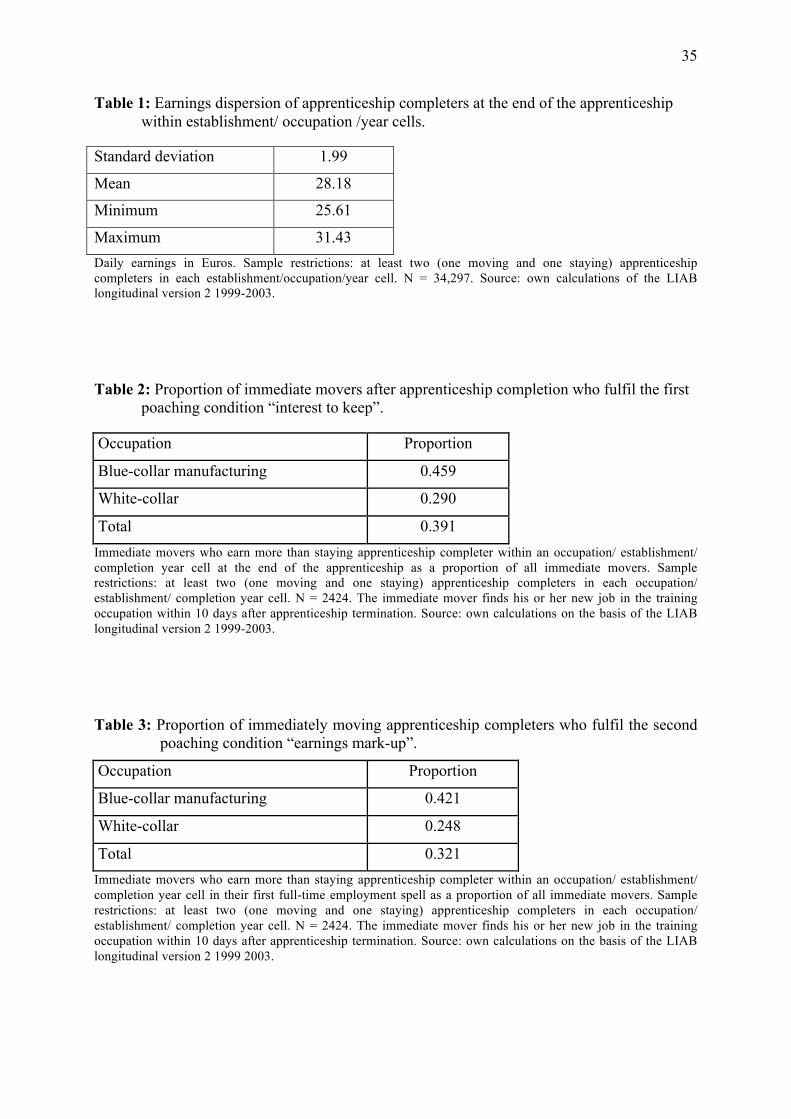
35
Table 1: Earnings dispersion of apprenticeship completers at the end of the apprenticeship within establishment/ occupation /year cells.
Standard deviation 1.99
Mean 28.18
Minimum 25.61
Maximum 31.43 Daily earnings in Euros. Sample restrictions: at least two (one moving and one staying) apprenticeship completers in each establishment/occupation/year cell. N = 34,297. Source: own calculations of the LIAB longitudinal version 2 1999-2003.
Table 2: Proportion of immediate movers after apprenticeship completion who fulfil the first poaching condition “interest to keep”.
Occupation Proportion
Blue-collar manufacturing 0.459
White-collar 0.290
Total 0.391 Immediate movers who earn more than staying apprenticeship completer within an occupation/ establishment/ completion year cell at the end of the apprenticeship as a proportion of all immediate movers. Sample restrictions: at least two (one moving and one staying) apprenticeship completers in each occupation/ establishment/ completion year cell. N = 2424. The immediate mover finds his or her new job in the training occupation within 10 days after apprenticeship termination. Source: own calculations on the basis of the LIAB longitudinal version 2 1999-2003.
Table 3: Proportion of immediately moving apprenticeship completers who fulfil the second poaching condition “earnings mark-up”.
Occupation Proportion
Blue-collar manufacturing 0.421
White-collar 0.248
Total 0.321 Immediate movers who earn more than staying apprenticeship completer within an occupation/ establishment/ completion year cell in their first full-time employment spell as a proportion of all immediate movers. Sample restrictions: at least two (one moving and one staying) apprenticeship completers in each occupation/ establishment/ completion year cell. N = 2424. The immediate mover finds his or her new job in the training occupation within 10 days after apprenticeship termination. Source: own calculations on the basis of the LIAB longitudinal version 2 1999 2003.

36
Table 4: Proportion of immediately moving apprenticeship completers who fulfil both poaching conditions.
Occupation group Proportion
Blue-collar manufacturing 0.214
White-collar 0.112
Total 0.155 Immediate movers who earn more than staying apprenticeship completers within an occupation/ establishment/ completion year cell at the end of the apprenticeship and in the first full-time employment as a proportion of all immediate movers. Sample restrictions: at least two (one moving and one staying) apprenticeship completers in each occupation/ establishment/ completion year cell. N = 2424. The immediate mover finds his or her new job in the training occupation within 10 days after apprenticeship termination. Source: own calculations on the basis of the LIAB longitudinal version 2 1999 2003.
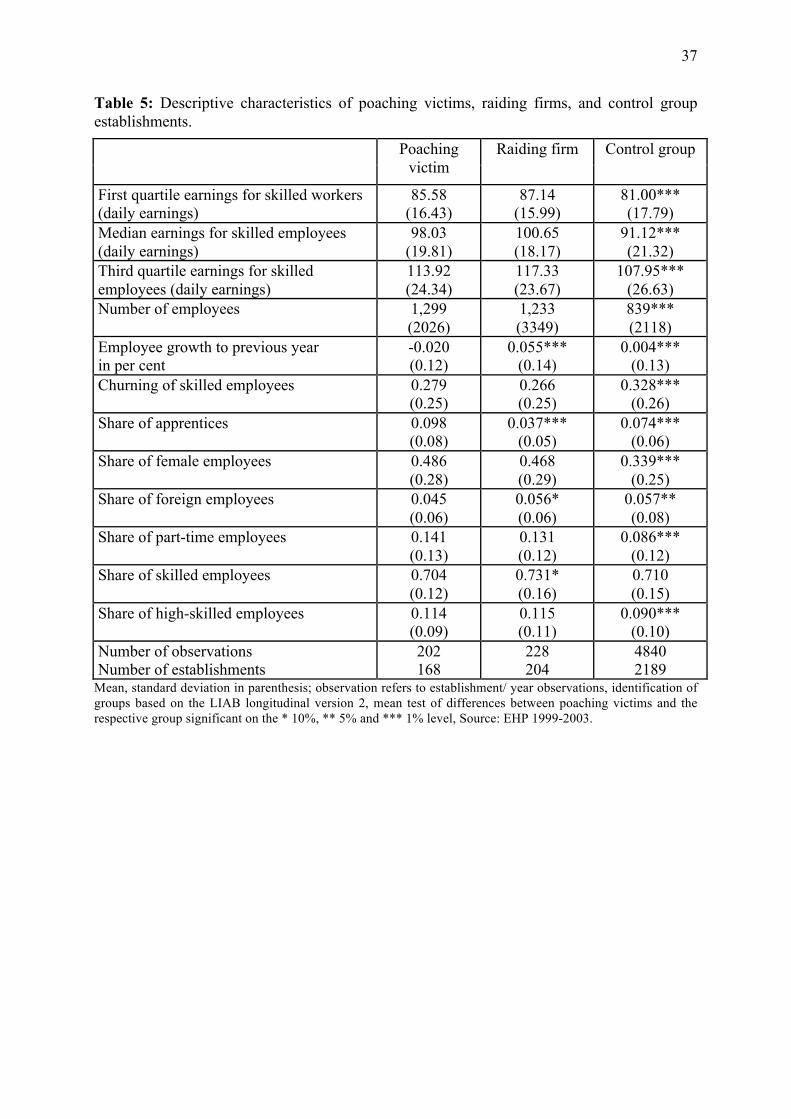
37
Table 5: Descriptive characteristics of poaching victims, raiding firms, and control group establishments.
Poaching victim
Raiding firm Control group
First quartile earnings for skilled workers (daily earnings)
85.58 (16.43)
87.14 (15.99)
81.00*** (17.79)
Median earnings for skilled employees (daily earnings)
98.03 (19.81)
100.65 (18.17)
91.12*** (21.32)
Third quartile earnings for skilled employees (daily earnings)
113.92 (24.34)
117.33 (23.67)
107.95*** (26.63)
Number of employees 1,299 (2026)
1,233 (3349)
839*** (2118)
Employee growth to previous year in per cent
-0.020 (0.12)
0.055*** (0.14)
0.004*** (0.13)
Churning of skilled employees 0.279 (0.25)
0.266 (0.25)
0.328*** (0.26)
Share of apprentices 0.098 (0.08)
0.037*** (0.05)
0.074*** (0.06)
Share of female employees 0.486 (0.28)
0.468 (0.29)
0.339*** (0.25)
Share of foreign employees 0.045 (0.06)
0.056* (0.06)
0.057** (0.08)
Share of part-time employees 0.141 (0.13)
0.131 (0.12)
0.086*** (0.12)
Share of skilled employees 0.704 (0.12)
0.731* (0.16)
0.710 (0.15)
Share of high-skilled employees 0.114 (0.09)
0.115 (0.11)
0.090*** (0.10)
Number of observations Number of establishments
202 168
228 204
4840 2189
Mean, standard deviation in parenthesis; observation refers to establishment/ year observations, identification of groups based on the LIAB longitudinal version 2, mean test of differences between poaching victims and the respective group significant on the * 10%, ** 5% and *** 1% level, Source: EHP 1999-2003.

38
Table 6: Characteristics of poaching victims in comparison to raiding firms.
(1) (2) (3) First quartile earnings for skilled employees
-0.013 [-0.005] (2.08)
Median earnings for skilled employees -0.011 [-0.004] (2.06)
Third quartile earnings for skilled employees
-0.007 [-0.003] (1.81)
Earnings growth to previous year 1.912 [0.762] (1.38)
1.875 [0.747] (1.28)
1.508 [0.601] (1.00)
Number of employees/1,000 0.044 [0.017] (1.58)
0.043 [0.017] (1.50)
0.038 [0.015] (1.37)
Employee growth to previous year -3.297 [-1.314] (4.90)
-3.292 [-1.312] (4.93)
-3.297 [-1.314] (4.92)
Churning of skilled employees -0.069 [-0.027] (0.21)
-0.054 [-0.022] (0.17)
-0.052 [-0.021] (0.16)
Share of apprentices 13.75 [5.481] (6.58)
13.58 [5.413] (6.48)
13.61 [5.423] (6.46)
Share of female employees -0.114 [-0.045] (0.22)
-0.001 [-0.001] (0.00)
0.096 [0.038] (0.19)
Share of foreign employees -2.326 [-0.926] (1.60)
-2.321 [-0.925] (1.59)
-2.295 [-0.914] (1.57)
Share of part-time employees 0.879 [0.358] (1.03)
0.827 [0.329] (0.97)
0.798 [0.318] (0.93)
Share of skilled employees -0.449 [-0.179] (0.68)
-0.493 [-0.196] (0.75)
-0.615 [0.245] (0.92)
Share of high-skilled employees 0.389 [0.155] (0.34)
0.320 [0.127] (0.28)
0.162 [0.065] (0.15)
Sector and year dummies Yes Yes Yes Number of observations* Number of establishments
430 372
430 372
430 372
Pseudo R square 0.28 0.28 0.28 Probit regression, coefficients and marginal effects calculated at the mean in brackets; Dependent variable: firm was poaching victim (1) and raiding firm (0); standard errors clustered on establishment, z-values in parenthesis. Identification of groups based on the LIAB longitudinal version 2, * includes 202 poaching victims and 228 raiding firms; source: EHP 1999-2003.

39
Table 7: Characteristics of poaching victims in comparison to control firms. (1) (2) (3) Median earnings for skilled employees
0.008 [0.0004] (3.11)
0.015 [0.0005] (4.78)
0.012 [0.0003] (3.82)
Earnings growth to previous year -0.950 [-0.058] (1.32)
-1.435 [-0.051] (1.38)
-1.576 [-0.045] (1.38)
Number of employees/1,000 0.003 [0.001] (1.89)
0.111 [0.004] (3.07)
0.072 [0.0002] (1.94)
Employee growth to previous year -1.211 [-0.074] (2.89)
-1.467 [-0.052] (2.09)
-1.512 [0.043] (1.96)
Churning of skilled employees -0.262 [-0.016] (1.62)
-0.394 [-0.014] (1.58)
-0.344 [-0.009] (1.33)
Share of apprentices 3.809 [0.234] (6.03)
5.594 [0.200] (5.24)
7.006 [0.202] (5.14)
Share of female employees 0.422 [0.026] (1.49)
1.190 [0.043] (2.82)
1.412 [0.041] (3.24)
Share of foreign employees -0.280 [-0.017] (0.44)
-1.663 [0.059] (1.54)
-2.166 [-0.062] (2.05)
Share of part-time employees 0.928 [0.057] (1.88)
-0.166 [0.006] (0.25)
0.260 [0.007] (0.38)
Share of skilled employees -0.037 [0.002] (0.12)
0.083 [0.003] (0.19)
-0.181 [-0.005] (0.39)
Share of high-skilled employees 0.682 [0.042] (1.63)
1.098 [0.039] (1.63)
0.311 [0.009] (0.43)
Positive business expectations 0.045 [0.001] (0.41)
Ln(investments) 0.105 [0.003] (2.23)
Export share on sales 0.005 [0.001] (1.79)
Works council 0.019 [0.001] (0.07)
Collective agreement 0.484 [0.010] (1.86)
Sector and year dummies Yes Yes Yes Number of observations* Number of establishments
5042 2357
2880 1263
2880 1263
Pseudo R2 0.12 0.19 0.23 Probit estimation, dependent variable: 1 if firm was poaching victim, 0 if control group. Marginal effects calculated at the mean in brackets; Standard errors clustered on establishment, z-values in parenthesis. Identification based on the LIAB longitudinal version 2, * includes 202 poaching victims and 4840 control firms; source: EHP and IAB Establishment Panel 1999-2003.

40
Table 8: Determinants of poaching: poaching victims in comparison to control group.
All firms Firms with blue-collar apprentices
Log(number of employees) -0.034 (2.33)
-0.043 (2.81) -0.076
(3.66) -0.077 (3.63)
Median earnings for skilled employees/1,000
-0.152 (0.29)
-0.232 (0.43) -0.087
(0.13) -0.207 (0.30)
Churning of skilled employees -0.024 (3.20) -0.009
(0.95)
Share of apprentices -0.066 (0.74) 0.122
(0.89)
Share of female employees 0.064 (0.72) 0.317
(2.28)
Share of foreign employees 0.160 (1.06) -0.063
(0.34)
Share of part-time employees -0.113 (1.50) 0.076
(0.56)
Share of skilled employees -0.064 (0.96) -0.114
(1.11)
Share of high-skilled employees -0.024 (0.16) 0.008
(0.04)
Year Dummies Yes Yes Yes Yes
Number of observations 7800 7800 3275 3275
Number of establishments 2357 2357 973 973
within R² 0.01 0.01 0.01 0.01 Prob (u_i ==0) 0.00 0.00 0.00 0.00
Linear probability first difference regressions, dependent variable: 1 poaching victim, 0 control group. Sample restriction: all firms of control group and poaching victims if they have not suffered poaching in the previous year, standard errors clustered on establishment, t-values in parenthesis. Source: LIAB longitudinal version 2 1999-2003.

41
Table 9: Victims’ responses to poaching: the share of newly hired apprentices.
All firms Firms with blue-collar apprentices
Poaching victim (t+1) 0.0004 (0.44)
0.0003 (0.38)
-0.002 (1.70)
-0.002 (1.56)
Poaching victim (t+2) -0.001 (1.07)
-0.001 (1.13)
-0.004 (1.95)
-0.003 (1.71)
Poaching victim (t+3) -0.001 (1.00)
-0.001 (1.04)
-0.007 (2.28)
-0.007 (2.04)
Ln(number of employees)
0.001 (2.36)
0.001 (2.51)
Churning of skilled employees
0.0001 (2.80)
-0.002 (3.43)
Share of female employees
0.002 (0.50)
0.019 (2.10)
Share of foreign employees
0.011 (0.89)
0.024 (2.05)
Share of part-time employees
0.001 (0.13)
-0.001 (0.06)
Share of skilled employees
0.012 (2.80)
0.021 (2.42)
Share of high-skilled employees
0.022 (2.56)
0.009 (0.61)
Year dummies Yes Yes Yes Yes Number of observation Number of establishments*
10,087 2334
10,087 2334
4089 948
4089 948
Within R² 0.003 0,01
0.01 0.01 Prob (u_i ==0) 0.00 0.00 0.00 0.00
Fixed effects regressions, dependent variable: share of newly recruited apprentices on all employees. Sample restriction: all firms of control group and poaching victims if no poaching occurs in the following years, standard errors clustered on establishment, t-values in parenthesis. * no data available for the 23 missing establishments, Source: LIAB longitudinal version 2 1999-2003.

42
Table 10: Victims’ responses to poaching: earnings of apprenticeship completers in their first job.
All firms Firms with blue-collar apprentices
Poaching victim (t+1) -0.388 (0.48)
-0.339 (0.42)
0.612 (0.51)
0.561 (0.45)
Poaching victim (t+2) 0.458 (0.45)
0.491 (0.48)
1.028 (0.80)
-0.856 (0.64)
Poaching victim (t+3) -0.952 (0.72)
-0.945 (0.71)
1.223 (0.63)
0.987 (0.50)
Ln(number of employees) 1.214 (1.54)
0.824 (1.05)
Churning of skilled employees
0.116 (0.26)
-0.357 (0.59)
Share of female employees -2.51 (0.45)
-5.360 (0.65)
Share of foreign employees -0.895 (0.11)
-8.445 (0.77)
Share of part-time employees
-7.733 (1.68)
-0.207 (0.03)
Share of skilled employees -1.259 (0.29)
2.067 (0.35)
Share of high-skilled employees
-2.319 (0.23)
-9.61 (0.63)
Year Dummies Yes Yes Number of observation Number of establishments*
7757 2334
7757 2334
3358 948
3358 948
Within R² 0.01 0.02 0.01 0.02 Prob (u_i =0) 0.00 0.00 0.00 0.00
Fixed effects regressions, dependent variable: log earnings deviation of newly recruited apprentices to occupation median. Sample restriction: all firms of control group and poaching victims if their observation in the following years was not poaching again, standard errors clustered on establishment, t-values in parenthesis. * no data available for the 23 missing establishments, Source: LIAB longitudinal version 2 1999-2003.

43
Figure 1: Percentage change in firm size before and after poaching incidence (period 0).
N = 92 poaching victims and N = 81 raiding firms, only one-time raiding firms and one-time poaching victims. Identification of poaching based on the longitudinal version 2 of the LIAB, source: EHP 1999-2003
Figure 2: Development of the proportion of apprentices on all employees before and after poaching incidence (period 0).
N = 92 poaching victims and N = 81 raiding firms, only firms that poach only once or were only one-time poaching victims. Identification of poaching based on the longitudinal version 2 of the LIAB, source: EHB 1999-2003.
0.90
0.95
1.00
1.05
1.10
1.15
1.20
-3 -2 -1 0 1 2 3
raidingfirm poachingvic7m
0.01
0.02
0.03
0.04
0.05
0.06
0.07
0.08
0.09
0.1
-3 -2 -1 0 1 2 3
raidingfirm poachingvic7m

44
Appendix A Validation for the interpretation of relative earnings differences as measure for “interest to keep” within an establishment/ occupation/ cohort cell First, we discuss why firms might differentiate earnings between apprentices, despite the fact
that earnings are determined by collective bargaining or other rules that prohibit undercutting
certain earnings levels. Our argument is that training firms use the private information on
relative productivity differences between their apprentices by voluntarily sharing a part of the
additional rent created by more able apprentices (Farber and Gibbons 1986). Firms nudge
apprentices with additional payments and apprentices reciprocate and feel more obliged to
stay. They are more loyal according to gift exchange considerations (Akerlof 1984). This
could give training enterprises a head start after the end of the apprenticeship period.
We present a couple of additional justifications for our assumption that the relative earnings
rank in an establishment/ occupation/ cohort cell is a predictor for relative “interest to keep”
an apprentice. The basic argument is revealed preferences – we interpret a high earnings
position in a cell as a voluntary payment that only has returns for the training firm if the
apprentice stays. Empirically, we can first confirm that the relative earnings in a cell are
positively correlated with the probability of staying with the training firm (see Table A1).
Second, the earnings rank predicts first full-time earnings of stayers (Table A2). Third, a
Spearman Rank Correlation Test shows that the earnings rank remains stable between the end
of the apprenticeship and the first full-time employment of stayers within a cell (Table A3).
When skilled entry earnings reflect the market value (productivity) of an employee, we can
conclude that our measure reflects productivity differences of apprentices at the end of the
apprenticeship period when training firms know the relative productivity of their apprentices.
Fourth, Mohrenweiser et al. (2017) show that the pay variation within a cell at the end of
apprenticeship is correlated with grades in the final apprenticeship examinations. Training
firms are able to keep those apprentices with relatively better grades and higher earnings
within a cell on average, a precondition for adverse selection on labour markets (Acemoglu
and Pischke 1998).
Finally, higher earnings during apprenticeship training might compensate exogenous (and
frequently unobservable) negative utility encountered by apprentices in training firms that
could induce them to quit (Acemoglu and Pischke 1998; Dustmann and Schönberg 2012;
Kahn, 2013). Supporting evidence for this hypothesis is that earnings differences strongly
increase absolutely and relatively just before apprenticeship termination (Figure A1 and
Mohrenweiser and Zwick 2013 for a more detailed discussion).

45
The relative earnings during apprenticeship are very unlikely to be influenced by counter
offers from external firms. Apprentices have labour contracts for a fixed period. The contracts
automatically end at the day after the final exam, a day set by independent institutions
(chambers). In addition, during the apprenticeship it is very costly for an apprentice to move
to another employer without losing valuable time to finish the apprenticeship. Hardly any
apprentice changes the employer closely before the end of the apprenticeship. Thus, it is
unlikely that earnings differences at the end of the apprenticeship may have been occurred
because of raiding attempts during apprenticeship.
We can interpret the earnings differences within a cell as relative individual productivity
differences because apprentices’ within a cell learn the same skills and the Vocational
Training Act determines tasks that apprentices should perform and learn during each stage of
apprenticeship. Therefore, two apprentices in the same occupation do not get different
earnings because they perform different tasks1. Moreover, apprenticeship completers in the
same training occupation in one firm are practically identical in terms of observable variables
such as age, education, start of apprenticeship and prior working experience. Furthermore,
relative earnings within cells filter out additional group payments frequently implemented on
the establishment level and instead capture only the individual differences between
apprentices in homogeneous cells. Group payments for all apprentices within a cell do not add
variation that is required to calculate the difference between the individual earnings within a
cell.
1 The earnings definition in the LIAB data entails full-time earnings for apprentices. A fraction of apprentices might receive additional earnings or work extra hours. Overtime, weekend or shift work payment might partly account for the wage differences between apprentices at the end of the apprenticeship. However, overtime payment is more likely paid for more productive apprentices. The imprecision in the earnings measure therefore does not invalidate our interpretation.
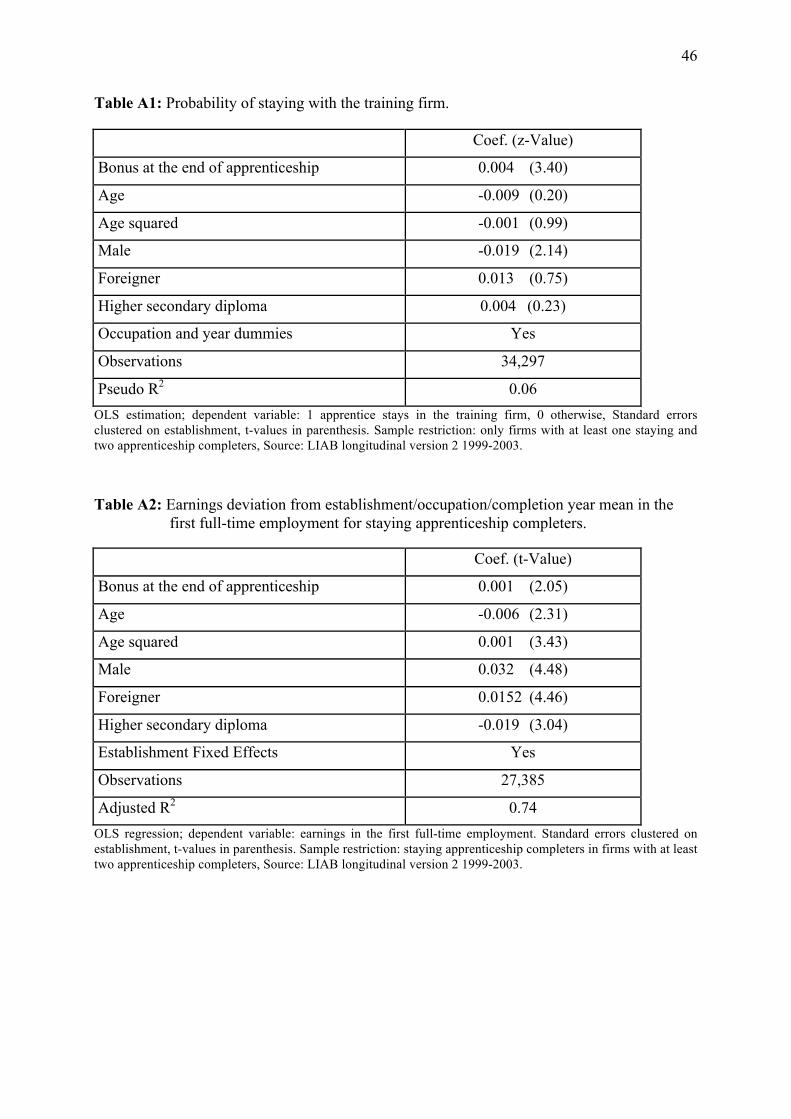
46
Table A1: Probability of staying with the training firm.
Coef. (z-Value)
Bonus at the end of apprenticeship 0.004 (3.40)
Age -0.009 (0.20)
Age squared -0.001 (0.99)
Male -0.019 (2.14)
Foreigner 0.013 (0.75)
Higher secondary diploma 0.004 (0.23)
Occupation and year dummies Yes
Observations 34,297
Pseudo R2 0.06 OLS estimation; dependent variable: 1 apprentice stays in the training firm, 0 otherwise, Standard errors clustered on establishment, t-values in parenthesis. Sample restriction: only firms with at least one staying and two apprenticeship completers, Source: LIAB longitudinal version 2 1999-2003.
Table A2: Earnings deviation from establishment/occupation/completion year mean in the first full-time employment for staying apprenticeship completers.
Coef. (t-Value)
Bonus at the end of apprenticeship 0.001 (2.05)
Age -0.006 (2.31)
Age squared 0.001 (3.43)
Male 0.032 (4.48)
Foreigner 0.0152 (4.46)
Higher secondary diploma -0.019 (3.04)
Establishment Fixed Effects Yes
Observations 27,385
Adjusted R2 0.74 OLS regression; dependent variable: earnings in the first full-time employment. Standard errors clustered on establishment, t-values in parenthesis. Sample restriction: staying apprenticeship completers in firms with at least two apprenticeship completers, Source: LIAB longitudinal version 2 1999-2003.

47
Table A3: The stability of stayer wages before and after the end of the apprenticeship period.
Spearman Rank Correlation Coefficients Test
Spearman’s Rho 0.3516
p-value 0.0000
Kendall’s Rank Correlation Coefficients Test
Kendall’s tau-a 0.2408
Kendall’s tau-b 0.2409
z-value 0.0000 Comparison between the earnings rank at the end of the apprenticeship and the first full-time employment after the apprenticeship of stayers in the same occupation. Number of observations: 27,386, all stayers in establishments with at least two apprenticeship completers. Source: LIAB longitudinal version 2, 1999-2003.
Table A4: Firms with additional payments for apprentices (BiBB survey 2012/13)
percentage of training firms
additional payments 45.7
additional bonus payments 15.7 N = 1090 apprenticeship training firms with at least two apprentices per cell. We are grateful to Gudrun Schoenfeld and Harald Pfeifer for providing us with this information, source: BiBB cost/benefit survey 2012/13.
Figure A1: Development of earnings variance of apprentices within an occupation/establishment/cohort cell.
Figure from Mohrenweiser and Zwick (2013), based on the same sample N = 6494 cells; each cell contains at least three apprentices learning in the same establishment, occupation and completion year. The data source contains annual earnings (y axis = average daily earnings). Therefore, x-axis year 1 means the time period from start of apprenticeship (usually in August or September) till the end of the calendar year, the following periods are the respective following calendar years, the last period is earnings between January and June or July (3-year apprenticeships). Source: LIAB longitudinal version 2, 1999-2006.
25
26
27
28
29
30
31
32
33
34
35
1 2 3 4

48
Appendix B: Supplementary material
Table B1: Sample restrictions
Step Individuals Cells Establishment/ year obs.
1 Apprentices with duration of apprenticeship between 700 and 1500 days End of apprenticeship in spring/ summer Start of apprenticeship around September No missing values in controls Stable establishment identifier (drop first/ last percentile in the distribution of firm size growth)
86,618 41,184 30,671
2 Earnings within social security contribution area For apprenticeship earnings: between 50 and 200 per cent of occupational mean per year
74,400 36,612 27,299
3 At least two apprenticeship completers per cell 48,067 10,279 6,696
4 Drop cells with movers only 42,529 8,555 5,522
5 Drop establishments that belong to the same company (more than 10 per cent of all out- or inflowing employees switch between a poaching victim and the respective raiding firm) Drop control cells in establishments that experience poaching
34,297 7,480 5,042
Note: 34,297 completers are the basis of our analysis; compare Table B2, with 2424 immediate moving apprentices (same occupation) who are the basis of the calculation of poaching in Tables 2-4. Basis of the estimation on the establishment-level (compare Table 5 and 7, victims and control establishments) are the 5,042 establishment/ year observations. Source: LIAB longitudinal version 2, 1999-2003.
Table B2: establishment-level statistics for each preparation step
Observations (firm/ year)
Number of employees
Share of skilled employees
1 Initial sample 30,671 405 (1,476) 0.67 (0.19)
2 Earnings purge 22,7299 435 (1,549) 0.68 (0.18)
3 At least two apprentices within cell
6,696 924 (2248) 0.71 (0.15)
4 Drop mover only cells 5,522 963 (2346) 0.71 (0.12)
5 Final sample 5,042
Note: mean displayed with standard deviation in parentheses; the descriptive statistics corresponds to the data preparation steps described in the previous table. Source: LIAB longitudinal version 2, 1999-2003.

49
Table B3: Descriptive comparisons between stayers and movers.
Total number Daily earnings at the end of the apprenticeship in Euro
Daily earnings at the first full-time employment in Euro
Stayer 27,386 28.47 70.90
Mover within 10 days, same occupation 2424 28.67 68.07
Mover within 10 days, occupational switcher 1182 26.43 54.14
Mover with unemployment spell of more than 10 days, same occupation 1267 26.84 67.46
Mover with unemployment spell of more than 10 days, occupational switcher 1716 25.38 48.03
Out of labour force during observation period 322 26.59 --- Sample restrictions: at least two apprenticeship completers with one staying apprenticeship completer in each establishment/occupation/year cell. N = 34.297, Source: LIAB longitudinal version 2, 1999-2003.
Table B4: Percentile distribution of the earnings standard deviation on the cell-level
p10 p25 p50 p75 p90
0 0.127 0.616 1.802 4.364 N = 7.480 cell/ year observations, Source: LIAB longitudinal version 2 1999-2003.

50
Table B5: Differences in employment growth, number of employees and share of new training positions between raiding firms and poaching victims before and after poaching incidence (period t).
Employment growth Number of employees Share of apprentice-
ship positions
Time Coef. T-value Coef. T-value Coef. t-Value
t-3 0.015 0.90 0.596 2.82 0.044 4.89
t-2 -0.031 1.61 0.502 2.50 0.045 5.02
t-1 -0.021 1.26 0.484 2.50 0.044 5.02
t -0.044 2.63 0.664 3.26 0.043 4.45
t+1 -0.023 1.61 0.488 2.51 0.044 4.51
t+2 0.010 0.74 0.457 2.41 0.043 4.47
t+3 -0.017 1.13 0.417 2.21 0.039 4.08 Dependent variable: firm was poaching victim (1) or raiding firm (0); OLS Regressions, N = 163 , further control variables: number of employees, employment growth, churning of skilled employees, proportion of female, foreign and part-time employees, proportion of skilled and high-skilled employees , t-values in parenthesis. Source: LIAB longitudinal version 2 1999-2003.

51
Table B6: Descriptive differences between poaching victims and control firms that train apprentices in blue-collar manufacturing occupations.
Poaching victims
Control group
Number of employees 2002 (2999)
861 (2170)
Employee growth to previous year in per cent
-0.052 (0.145)
0.006 (0.130)
First quartile earnings for skilled employees (daily earnings)
95.48 (12.84)
81.27 (17.70)
Median earnings for skilled employees (daily earnings)
108.91 (17.21)
92.52 (21.20)
Third quartile earnings for skilled employees (daily earnings)
127.48 (22.25)
108.35 (26.51)
Churning of skilled employees 0.355 (0.274)
0.323 (0.255)
Share of apprentices 0.102 (0.098)
0.071 (0.057)
Share of female employees 0.211 (0.123)
0.352 (0.259)
Share of foreign employees 0.069 (0.069)
0.056 (0.078)
Share of part-time employees 0.064 (0.086)
0.090 (0.117)
Share of skilled employees 0.633 (0.126)
0.711 (0.153)
Share of high-skilled employees 0.151 (0.097)
0.092 (0.104)
Number of observations 63 5207 Mean, standard deviations in parenthesis; identification based on the longitudinal version 2 of the LIAB, source: EHP 1999-2003.
1 Becker (1993) observed that training can be classified into general training that is transferable and productivity enhancing in other firms as well as specific training that only has a productivity effect in one firm. In a perfectly competitive labour market in which workers are paid according to their marginal productivity, firms have no incentive to invest in general training because workers can leave directly after the training period and reap all the benefits of their acquired general skills. 2 Recent empirical evidence has shown wage variation in entry positions in German unionised firms even if the wage variation is much smaller than in the US (Grund, 2005). Further evidence for wage variation for entry-level jobs provides Pfeifer (2008) and for wage variation for apprenticeship completers in unionised firms Gerlach and Stephan (2006), Dustmann and Schönberg (2009), and Fitzenberger et al. (2013). 3 These models require two conditions: firms earn profits on workers and these profits increase with the training level (Acemoglu and Pischke, 1999a; Leuven, 2005). Konings and Vanormelingen (2015) empirically show that both conditions hold for general training in Belgium and Pfeifer (2016) shows that a more compressed wage structure leads to more company-sponsored training. 4 A growing literature analyses the use of counter-offers. In Lazear (1986) for instance, the raiding firm is successful when the firm-specific component of productivity is negative. Postel-Vinay and Robin (2004) show a

52
“dual labour market” where some firms commit to an offer-matching policy and other firms commit to a policy of never making counter-offers. Barron et al. (2006) analyse conditions for firms to use selective counter-offers. 5 Firms provide a relevant part of training in practical skills evident by net training costs (Schoenfeld et al., 2010) while the vocational schools focus more on general skills such as theoretical knowledge, language and numeracy skills. 6 The general nature of training contents during apprenticeship training can also be derived from low or non-existent wage disadvantages of employer movers compared with stayers directly after apprenticeship training (Göggel and Zwick 2012; Dustmann and Schönberg 2012). 7 More than two-thirds of apprentices are trained by establishments with collective bargaining and, additionally, 22% of apprentices work at establishments with wages oriented at collective bargaining (Schönfeld et al. 2010). 8 A wage is appropriate if it is not more than 20 per cent below the collective bargaining rate for apprentices (Lakies and Nehls 2009). 9 Empirical studies have shown that these regulations do not really bite. In an overview on the effects of retention clauses on retention rates, Bispinck et al. (2002) shows that firms hardly changed their retention policy after retention clauses became more than pure appeals. Firms instead used numerous loopholes these clauses left – for example by offering skilled jobs in establishments far away, by offering unattractive jobs or by trusting that a lower than legal retention rate does not lead to legal action by apprenticeship completers and unions. 10 Establishments without any staying apprentice usually want to substitute apprentices and unskilled workers. This motive does not fall into the theoretical considerations (Mohrenweiser and Backes-Gellner, 2010). 11 This procedure leads to an exclusion of 10.5 per cent of potential poaching victims. 12 For the sake of clean identification of poaching, we concentrate on job entrants after apprenticeship training. We therefore exclude a vast area of poaching activities concentrating on experts whose transfer can serve as a mechanism for the acquisition of externally developed knowledge (Song et al. 2003). We assume that learning by hiring is only a minor reason for poaching skilled employees at the beginning of their careers. 13 Apprentices might voluntarily leave the training firm for a number of reasons. The poaching conditions exclusively focus on pay-related issues. The literature has analysed additional reasons for individuals to leave a firm, such as life events (Lee and Mitchell 1994) and several sources of job dissatisfaction (March and Simons 1958; Mobley 1977; Griffith et al. 2000). 14 The picture holds also for movers for whom the probability to misreport the day of transition between apprenticeship and first skilled job is smaller. 15 In some cases, future expectations such as implicit wage contracts on seniority wages can also induce apprenticeship graduates to switch to an outside firm although their entry wage is lower than the wage offered at the training firm (Postel-Vinay and Robin 2004). In a similar manner, we already argued that disutility during the training period can lead to switching despite a higher wage offer of the training firm (Acemoglu and Pischke 1998). These two effects are not included in our poaching definition, which is restricted to poaching via entry earnings. It requires an “earnings mark-up” by the outside firm which may then result in a counter offer. We therefore might only capture a lower bound of poaching when in some cases apprenticeship completers are attracted by non-monetary benefits or deferred earnings increases that might compensate the corresponding offers by the training firm. 16 We observe 375 immediate movers (0.155*2,424, compare Table 4) who earn the highest salary in the cell but have 7480 cells (see sample selection in Table B1). In other words, the best paid apprenticeship completer moves in only 5 per cent of all cells. Hence, we do not have an automatism here that movers have to earn a higher salary than stayers. 17 Even if we do not find any raiding firm with cells classified as poaching victim in any establishment/ year, we cannot rule out that such combinations exist. Our finding might be a consequence of the fact that we cannot analyse cells in raiding firms. 18 The figures display one-time victims only. As most two-time victims experience poaching in two consecutive years, including those firms does not qualitatively change the results. The restriction to one-time victims explains small differences in the number of observations between Figure 1 and Tables 5 and 6. 19 We can only observe the development of earnings measured at quartiles in the EHB. The quartiles show a slight decrease in earnings for raiding firms over the seven-year period and an increase for poaching victims. However, an analysis with the LIAB data for poaching victims shows that earnings increase because of employee turnover. New recruits (laid-off workers) are more likely to be at the bottom (top) of the earnings distribution and this appears to drive our findings on earnings quartiles. Following this argument, the earnings decrease of raiding firms could be caused by hiring. 20 We use the entire sample because the following regressions also require information from the year before poaching. This is too restrictive for the sub-sample with the merged IAB Establishment data. Moreover, we only have observations from the consecutive year of some control firms. Therefore the number of observations increases by less than two.

53
21 Regarding the earnings differences, we can only compare poaching victims and control firms with regard to differences between white- and blue-collar manufacturing apprentices as we do not have information on the occupation-level for raiding firms. 22 These personnel policies are possible responses to poaching within the rigid institutional setting of the German apprenticeship training system. Moreover, training firms can also adjust their selection criteria for apprentices. 23 This does not hold for crafts occupations. Our sample, however, consists of rather large firms that rarely train apprentices in crafts occupations. 24 Wydra-Somaggio and Seibert (2010) show that their earnings estimations are robust regardless of whether they use the 2-, 3- or 4-digit occupational code for apprentices. 25 School-leavers in poaching victim firms are more likely to be positively selected. Around 27.2 per cent of all apprentices in poaching victim firms have the highest school-leaving certificate compared with 21.1 per cent in control firms (t = 1.98). 26 Our results are also in line with observations in the US Job Openings and Labour Turnover Survey Studies showing that most job-to-job movers switch to young, highly productive and fast- growing firms, not necessarily large firms (Fort et al. 2013; Haltiwanger et al. 2017).