Working Paper NI WP 17-05
17
Estimating the Value of Public Water Data www.nicholasinstitute.duke.edu Working Paper NI WP 17-05 June 2017 Author Affiliation * Nicholas School of the Environment, Duke University ** Nicholas Institute for Environmental Policy Solutions, Duke University Citation Gardner, John, Martin Doyle, and Lauren Patterson. 2017. “Estimating the Value of Public Water Data.” NI WP 17-05. Durham, NC: Duke University. http://nicholasinstitute.duke.edu/ publications. Review This working paper has not undergone a formal review process. It is intended to stimulate discussion and inform debate on emerging issues. CONTENTS Investing in Public Water Data 1 Qualitative Review of Studies 1 Identified Costs and Benefits of Public Water Information 2 Quantified and Monetized Costs and Benefits of Public Water Information 4 Interpretation 7 Trends in Water Data and Information 8 Appendix A: Benefit-Cost Ratios 9 Appendix B: Quantitative Studies on the Costs and Benefits of Public Water Information 11 Appendix C: Qualitative Studies on the Costs and Benefits of Public Water Information 13 References 14 SUMMARY Public water data, such as river flow from stream gauges or precipitation from weather satellites, produce broad benefits at a cost to the general public. is paper presents a review of the academic literature on the costs and benefits of government investments in public water data. On the basis of 21 studies quantifying the costs and benefits of public water quantity data, it appears that the median benefit-cost ratio across different economic sectors and geographic regions is 4:1. But a great deal of uncertainty attends this number; very few studies empirically quantify or monetize the costs, the benefits, or both of water information with sound economic methods, and no studies have quantified the value of water quality information. is review is part of an ongoing effort by the Nicholas Institute of Environmental Policy Solutions at Duke University and the Aspen Institute to develop the foundations of an Internet of Water by quantifying the potential value of open and integrated public water data. John Gardner, * Martin Doyle, *,** and Lauren Patterson ** NICHOLAS INSTITUTE FOR ENVIRONMENTAL POLICY SOLUTIONS
Transcript of Working Paper NI WP 17-05
Estimating the Value of Public Water Data
www.nicholasinstitute.duke.edu
Working Paper NI WP 17-05
June 2017
Author Affiliation* Nicholas School of the Environment, Duke University** Nicholas Institute for Environmental Policy Solutions, Duke University
CitationGardner, John, Martin Doyle, and Lauren Patterson. 2017. “Estimating the Value of Public Water Data.” NI WP 17-05. Durham, NC: Duke University. http://nicholasinstitute.duke.edu/publications.
ReviewThis working paper has not undergone a formal review process. It is intended to stimulate discussion and inform debate on emerging issues.
CONTENTS
Investing in Public Water Data 1
Qualitative Review of Studies 1
Identified Costs and Benefits of Public Water Information 2
Quantified and Monetized Costs and Benefits of Public Water Information 4Interpretation 7Trends in Water Data and Information 8Appendix A: Benefit-Cost Ratios 9Appendix B: Quantitative Studies on the Costs and Benefits of Public Water Information 11Appendix C: Qualitative Studies on the Costs and Benefits of Public Water Information 13References 14
SUMMARY Public water data, such as river flow from stream gauges or precipitation from weather satellites, produce broad benefits at a cost to the general public.
This paper presents a review of the academic literature on the costs and benefits of government investments in public water data. On the basis of 21 studies quantifying the costs and benefits of public water quantity data, it appears that the median benefit-cost ratio across different economic sectors and geographic regions is 4:1. But a great deal of uncertainty attends this number; very few studies empirically quantify or monetize the costs, the benefits, or both of water information with sound economic methods, and no studies have quantified the value of water quality information.
This review is part of an ongoing effort by the Nicholas Institute of Environmental Policy Solutions at Duke University and the Aspen Institute to develop the foundations of an Internet of Water by quantifying the potential value of open and integrated public water data.
John Gardner,* Martin Doyle,*,** and Lauren Patterson**
NICHOLAS INSTITUTEFOR ENVIRONMENTAL POLICY SOLUTIONS

1
INVESTING IN PUBLIC WATER DATA
There is growing interest in water data, particularly in expanding the use of existing public water data
through increased data integration and sharing. A recent dialogue series held by the Aspen Institute found
that although many water managers agree there is value in an integrated water data system, they consider
the absence of quantified benefits to be a significant barrier to building political support for and
investment in making public water data open and shareable. Governments could make investments in
water data and information—as they have in other public goods—to reach the socially optimal outcome.
However, without evidence of the value of water information, decision makers will likely remain
skeptical about the return on that investment (Jeuland et al. forthcoming).
Valuation of public data, particularly with robust benefit quantification methods—is conceptually and
logistically difficult. The value of information should be measured against a counter-factual, that is,
relative to a baseline of outcomes absent the information.1 Rigorous, empirical studies of the benefits and
costs of public water data that do so are rare (Jeuland et al. forthcoming).
QUALITATIVE REVIEW OF STUDIES POINTS TO THE VALUE OF WATER DATA
Research databases were scanned for academic and peer-reviewed studies that quantified a benefit-cost
ratio for public water data. The resulting articles were screened for relevance and from them information
about the type of data (i.e., sector, region) was extracted and coded.2 This approach provides a snapshot of
the value of public water data—although a preliminary and empirically weak one.
The studies in this meta-analysis generally focused on specific types of information (e.g., hydrologic,
ecological) or sectors (e.g., agriculture, hydropower). The meta-analysis consisted of 29 estimates of
benefit-cost ratios from the 21 articles identified in the academic literature, government reports (e.g., U.S.
Geological Survey, Office of Management and Budget), inter-governmental agencies (e.g., the World
Bank), and NGOs. All but one of these studies accounted for both costs and benefits of water
information.1 Stallings and Fread (1997) provided costs as the annual budget of the U.S. National
Weather Service (NWS) during the year in which the benefits were estimated.
1 The three key steps of valuation are identifying, quantifying, and monetizing impacts (Boardman and Boardman 2008). Quantification is conceptually challenging because the impact of additional information stems from improvements in management decisions. Without investments in additional water information, managers would make decisions with available information. The value of collecting, analyzing, and disseminating additional information must be measured as the extent to which more-informed management decisions improve outcomes relative to a (unobserved) counterfactual, or baseline—what would have occurred without additional information. Researchers must estimate the counterfactual using models, expert opinions, and empirical economic methods (e.g., before-after studies, cross-section studies, differences-in-differences comparison, natural experiments, or randomized control trials). Impacts can be monetized using market or shadow prices. For example, researchers often estimate the value of hydro-met information on the basis of avoided damages, natural hazards, or increased revenues from improved efficiency (WMO 2015). Estimates often rely on expert opinions of preventable costs or predicted revenues. Alternatively, researchers can estimate the value of information using decision-making models that assume users optimize their behavior in response to new information and measure increased outcome (e.g., additional crop yield or lower risk of flood damages). 2 If a range of benefit-cost ratios was presented, the mean of those estimates was used.

2
IDENTIFIED COSTS AND BENEFITS OF PUBLIC WATER INFORMATION
The costs associated with public water information broadly include collection, analysis, dissemination,
and use. Collecting water data requires designing, installing, operating, and maintaining a network of
environmental sensors and research stations. These water quantity and quality data must be cleaned and
analyzed, which requires investments in information technology, data management, and training of
scientists and managers. Dissemination costs include publishing information online and in print and
holding meetings and workshops for users. Use costs largely stem from education and training expenses
(Jeuland et al. forthcoming).
Many studies have outlined the potential economic benefits of public water information (see Table 1 and
appendixes A and B for a list of benefits and studies, respectively). Water information enables
governmental agencies, non-governmental organizations, private companies, and individuals to make
evidence-based decisions about both short- and long-term management operations and planning. This
information is beneficial to many sectors, including agriculture, energy production, hydropower, forestry,
manufacturing, mining, tourism and recreation, and water service provision (Table 1).
The benefits of public water data can be very simply categorized on the basis of improved design of
infrastructure (roads, bridges, irrigation structures, dykes, reservoirs, mine-tailing ponds), flood and storm
avoidance, and sustainable resource management (Azar 2003). Flood and storm avoidance is a frequently
cited and quantified benefit of water quantity information across all sectors. For example, forecasting
flood magnitude and geographic extent helps private and public industries protect infrastructure and
assets. Sustainable resource management is most beneficial to the daily operations of hydropower,
agriculture, forestry, or any industry that directly depends on water to generate products and revenue.

3
Table 1. Sectoral benefits derived from public water information
Sector/type of information
Water quantity information (meteorological and hydrological data)
Water quality information (ecological and chemical data)
All sectors
Reduce costs from uncertainty by increasing managers’ ability to plan more efficiently and respond more quickly to water availability and use issues (Jeuland et al. forthcoming)
Reduce costs by decreasing the likelihood and scale of expensive threats (e.g., chemical spills/leaks, harmful algal blooms, decaying infrastructure) Reduce costs by identifying more efficient and precise ways to treat quality problems and comply with government regulations
Agriculture (irrigated and non-irrigated)
Increase revenue by improving planting and irrigation decisions to increase yields or product quality (Jeuland et al. forthcoming)
Reduce costs through more efficient (less) use of fertilizer
Energy production Reduce cost and increase revenue by improving planning and production decisions (e.g., by knowing the amount of energy needed to transport water to meet demand) (Copeland 2017)
Forestry Increase revenue by improving planning and operations decisions about planting and harvesting (e.g., information about groundwater/soil moisture helps managers project biomass growth and operate efficiently)
Water information facilitates a secondary market for water quality (e.g., foresters can earn revenue by selling water quality credits earned by planting of trees to decrease surface water temperature)
Hydropower production
Reduce costs by optimizing the design of hydropower facilities; stream gauging data in the Columbia River led to $153 million in hydropower revenue (NRC 2004) Reduce costs by improving reliability and avoiding operations shutdowns
Reduce costs of complying with environmental regulations by improving dam releases to maintain viable fish populations downstream
Manufacturing and industry
Reduce costs by improving operations to precisely address recycling, reuse, and release contaminants

4
Sector/type of information
Water quantity information (meteorological and hydrological data)
Water quality information (ecological and chemical data)
Mining
Reduce costs and increase production by optimizing planning and operations on the basis of water availability information and flood/weather forecasting
Transportation Reduce costs by optimizing planning for shipping/logistics industry; trucking alone loses $3 billion a year from inclement weather (Marquis 2012) Reduce costs by optimizing barge operation
Tourism and recreation
Increase revenue through using information (e.g., lake/stream levels, snowpack for skiing) to improve planning and attract tourists to recreation; the market value of water in the Delaware River Basin for recreation is ~$2.2 billion (Kauffman 2011) Reduce costs by using information to improve risk planning for floods and other disasters
Reduce costs of treatment through early identification of pollution to maintain fisheries and public safety
Water service provider
Reduce costs by optimizing operations and disaster planning with improved weather and flooding forecasts; streamflow gauging data has saved $50 million in avoided flood damages (NHWC 2006); the value of a UK water monitoring network for water planning and flood defense was estimated at ~$25 million (Walker 2000)
Reduce costs and increase revenue by monitoring water delivery and consumption to optimize supply/demand operations decisions, improve reliability, understand user behavior, plan water and wastewater treatment (improved projections reduce spending on excess capacity) (GWI 2016)
Reduce costs of treatment by using information to quickly identify and effectively respond to pollution and leakages Reduce costs of treatment by using information to improve source water protection, which is often less expensive than traditional treatment
QUANTIFIED AND MONETIZED COSTS AND BENEFITS OF PUBLIC WATER INFORMATION
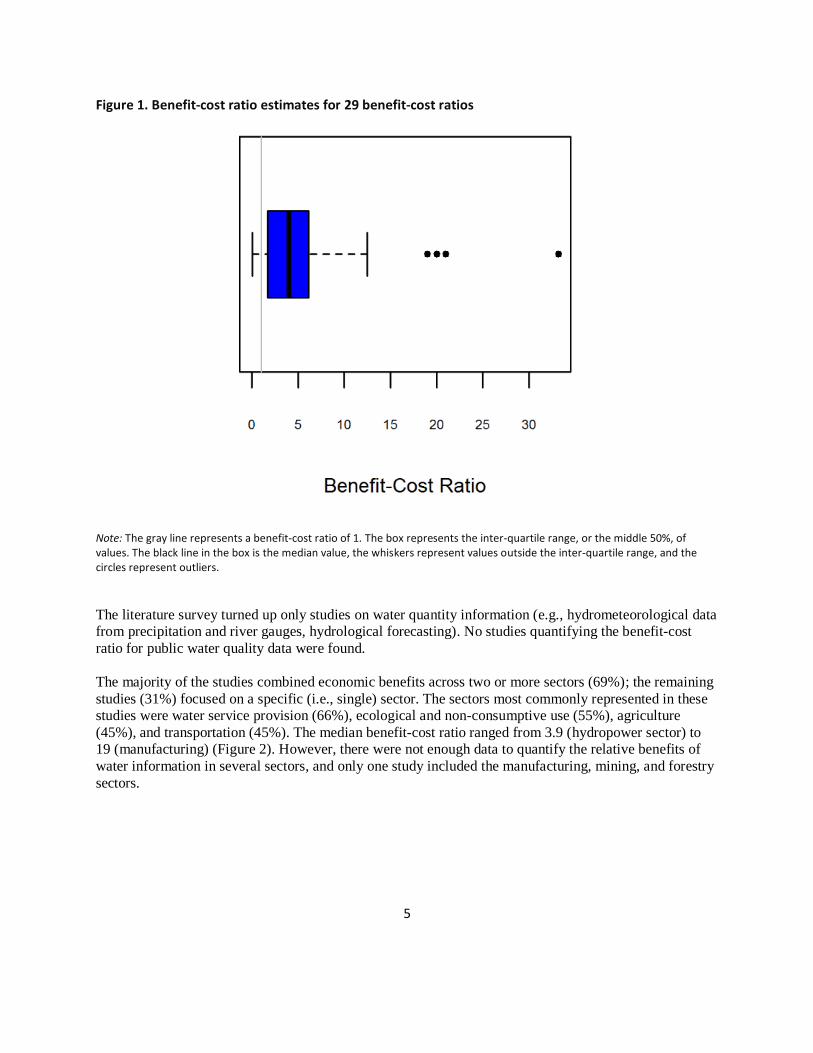
The median benefit-cost ratio of water information was 4 (n = 29), with a range of 0.04 to 33 (Figure 1).
Overall, 86% of analyses reported that the benefits of public water information exceeded the costs.
5
Figure 1. Benefit-cost ratio estimates for 29 benefit-cost ratios
Note: The gray line represents a benefit-cost ratio of 1. The box represents the inter-quartile range, or the middle 50%, of values. The black line in the box is the median value, the whiskers represent values outside the inter-quartile range, and the circles represent outliers.
The literature survey turned up only studies on water quantity information (e.g., hydrometeorological data
from precipitation and river gauges, hydrological forecasting). No studies quantifying the benefit-cost
ratio for public water quality data were found.
The majority of the studies combined economic benefits across two or more sectors (69%); the remaining
studies (31%) focused on a specific (i.e., single) sector. The sectors most commonly represented in these
studies were water service provision (66%), ecological and non-consumptive use (55%), agriculture
(45%), and transportation (45%). The median benefit-cost ratio ranged from 3.9 (hydropower sector) to
19 (manufacturing) (Figure 2). However, there were not enough data to quantify the relative benefits of
water information in several sectors, and only one study included the manufacturing, mining, and forestry
sectors.

6
Figure 2. Benefit-cost ratio across sectors
Note: The number of benefit-cost estimates within each sector (n) is shown in the legend on the right. Many values are counted multiple times because estimates for multiple sectors were aggregated in the same study.
The studies were largely clustered within three geographic regions: Europe and Central Asia (45%), East
Asia and the Pacific (28%), and North America (21%). Only one study from Africa and Latin American
(Figure 3) was found.

7
Figure 3. Number of studies represented across global regions
INTERPRETATION
Water information is a public—non-rival and non-excludable—good. As such, it is necessary and
important for public agencies to provide ongoing investment in it. The analysis presented here shows that
public investment in water information is a good investment: its economic benefits generally outweigh the
costs. But because the academic literature does not comprehensively or consistently quantify or monetize
these costs and benefits, significant uncertainty and speculation about them exist.
Many of the reviewed studies also suffer from methodological shortcomings:
● Very few studies include the full costs associated with generating and utilizing additional public
water information. User costs and transactions are not often reflected in benefit cost-ratios
(Jeuland et al. forthcoming). Those ratios are likely too high when full costs are not captured.
● The value of additional public water information appears not to have been estimated using a
rigorous experimental or quasi-experimental design. Very few studies measure the benefits vis-à-
vis a synthetic counterfactual (Jeuland et al. forthcoming). The World Meteorological
8
Organization’s (2015) assessment of the value of meteorological and hydrological services and
Cordery and Cloke (1992) work on the value of streamflow data are notable exceptions.
Counterfactuals are often estimated by extrapolating from historical outcomes, which may not be
pertinent (Jeuland and Whittington 2014).
● Benefits from additional public water information are often based on hypothetical physical and
hydrologic models that predict, rather than empirically measure, changes in outcomes. For a good
example, see the Adeloye (1996) model for estimating the value of streamflow data. Actually
utilizing additional information to make more informed management decisions may require
advanced analytical tools that many users lack, thus calling into question the predicted benefits
(Jeuland et al. forthcoming). In addition, benefits and costs are currently estimated from model
outputs rather than real-world outcomes—in many cases, use of water data is captured through
download numbers.
● Very few studies monetize the value of improvements in operations and planning from additional
public water information. It is unclear whether, or how, better information has quantitatively
improved or optimized infrastructure performance or potentially reduced the costs of design and
construction.
Beyond these limitations, there is no information on the value of water quality information, specifically
the benefit-cost ratio. Yet, there is high potential for growth in water quality monitoring due to the rapid
development of sensor technology, along with growing interest and deployment of markets for water
quality trading (e.g., nitrogen trading among water treatment plants). Just as water quantity data increases
the odds that floods and other water-related disasters can be avoided, water quality monitoring could
prevent costly spills and water quality hazards. However, the value of water quality information depends,
to some degree, on regulation (e.g., the Clean Water Act, the Safe Drinking Water Act) that sets numeric
standards for water quality or for the ability of water users (e.g., water treatment plants) to make use of
new streams of data to improve operational efficiency.
TRENDS IN WATER DATA AND INFORMATION
Several broad trends in water data may affect the value of public water information. First, water data are
increasingly collected by private entities (and typically not publicly shared) because of the decreased
costs associated with data collection and increased recognition of the value of water data. This effort has
been enabled by the rapid improvement in technology and sensor development. There are likely strategic
incentives to not share water data as well as incentives to avoid potential regulatory implications.
Second, and in contrast, scientific, NGO, and government institutions are attempting to make water data
more open and easily accessible (GWI 2016). For example, the U.S. federal government established the
Open Water Data Initiative, which seeks to integrate fragmented data from across the nation into one
open water web to facilitate “innovation, modeling, data sharing, and solution development.” Similarly,
the non-profit Consortium of Universities for the Advancement of Hydrologic Science is developing
hydroinformatic tools for sharing and synthesizing data. With the rise of big data, empirical information
will increasingly play a role in decision making for individuals, companies, and governments.

9
APPENDIX A: BENEFIT-COST RATIOS
A
gric
ult
ure
Ene
rgy
Fore
stry
Hyd
rop
ow
er
Man
ufa
ctu
rin
g
Min
ing
Tran
spo
rt
Tou
rism
No
n-C
on
sum
pti
ve
Use
Wat
er S
ervi
ce
Pro
visi
on
Region
Benefit-Cost Ratio
Adams et al. 2003 X Latin America and
Caribbean 2.90
Adeloye 1996 X
Europe and Central Asia 0.04
Anaman and Lellyett 1996
X East Asia and Pacific 4.17
Azar et al. 2003 X X X X X X X X X North America 19.00
Black et al. 1999 X X X X X X Europe and Central Asia 33.22
Herschy et al. 1991 X X X X Europe and Central Asia 2.30
Considine et al. 2004
X North America 2.39
Cordery and Cloke 1990
X X X East Asia and Pacific 5.00
Cordery and Cloke 1990
X X X East Asia and Pacific 20.00
Cordery and Cloke 1992
X X X East Asia and Pacific 0.10
Cordery and Cloke 1992
X X X East Asia and Pacific 0.80
Cordery and Cloke 1992
X X X East Asia and Pacific 1.70
Cordery and Cloke 1992
X X X East Asia and Pacific 2.00
Cordery and Cloke 1992
X X X East Asia and Pacific 4.00
Frei et al. 2010 X X Europe and Central Asia 5.00
EU Met Statistics 2014
X X X X Europe and Central Asia 21.00
Gray 2015 X X
Europe and Central Asia 12.50
Lazo 2009 X
North America 6.18
Lazo 2015
Africa 1.78
Leviakangas et al. 2007
X X X X X Europe and Central Asia 4.13
Leviakangas et al. 2009
X X X X X X Europe and Central Asia 5.24
McMahon and Cronin1980
X X North America 1.30
National Hydrologic Warning Council 2006
X X X X North America 1.23
Perrels et al. 2013 X X X X X X X Europe and Central Asia 5.58
Stallings et al. 1997 X X X X X X North America 2.82

10
Walker 2000 X Europe and Central Asia 0.80
Walker 2000 X Europe and Central Asia 1.70
Walker 2000 X Europe and Central Asia 8.00
Walker 2000 X Europe and Central Asia 10.00

11
APPENDIX B: QUANTITATIVE STUDIES ON THE COSTS AND BENEFITS OF PUBLIC WATER INFORMATION Adams, R. M., L.L. Houston, B.A. McCarl, L.M. Tiscareño, G.J. Matus, and R.F. Weiher. 2003. “The
Benefits to Mexican Agriculture of an El Niño-Southern Oscillation (ENSO) Early Warning System.”
Agricultural and Forest Meteorology 115(3-4): 183–194. doi:10.1016/s0168-1923(02)00201-0.
Adeloye, A.J. 1996. “An Opportunity Loss Model for Estimating the Value of Streamflow Data for
Reservoir Planning.” Water Resources Management 10(1): 45–79.
Anaman, K.A., and S.C. Lellyett. 1996. “Contingent Valuation Study of the Public Weather Service in the
Sydney Metropolitan Area.” Economic Papers: A Journal of Applied Economics and Policy 15(3): 64–77.
Azar, J., D. Sellars, and D. Schroeter. 2003. Water Quantity Monitoring in British Columbia: A Business
Review of the BC Hydrometric Programs. Report by British Columbia Ministry of Sustainable Resource
Management.
Black, A., A. Bennett, N. Hanley, C. Nevin, and M. Steel. 1999. Evaluating the Benefits of Hydrometric
Networks. Environment Agency. Bristol, R&D Project Record.
Considine, T.J., C. Jablonowski, B. Posner, and C.H. Bishop. 2004. “The Value of Hurricane Forecasts to
Oil and Gas Producers in the Gulf of Mexico.” Journal of Applied Meteorology 43(9): 1270–1281.
Cordery, I., and P. Cloke. 1992. “An Overview of the Value of Collecting Streamflow Data: Transactions
of the Institution of Engineers, Australia.” Civil Engineering 34(3): 271–276.
Cordery, I., and P.S. Cloke. 1992. “Economics of Streamflow Data Collection.” Water International
17(1): 28–32.
Cordery, I., P.S. Cloke. 1990. “An Assessment of the Benefits of Streamflow Data Collection.” In The
Hydrological Basis for Water Resources Management, edited by Uri Shamir and Chen Jiaqi, 219–228.
http://hydrologie.org/redbooks/a206/iahs_206_0287.pdf.
EUMESTAT. 2014. The Case for the EPS/METOP Second Generation: Cost-Benefit Analysis. Report by
European Organisation for the Exploitation of Meteorological Satellites.
Frei, T. 2010. “Economic and Social benefits of Meteorology and Climatology in Switzerland.”
Meteorological Applications 17(1): 39–44.
Gray, M. 2015. Public Weather Service Value for Money Review. Public Weather Service Customer
Group Secretariat Met Office. http://www. metoffice. gov.uk/media/pdf/9/4/PWS
_Value_for_Money_Review_-_March_2015. pdf.
Hamilton, S. 2015. The Value of Water Monitoring. Aquatic Informatics. http://pages.aquaticinformatics.
com/rs/aquaticinformatics/images/Aquatic-Informatics-The-Value-of-Water-Monitoring.pdf.
Herschy, R., D. Newsome, and C. Green. 1991. The Benefit-Cost of Hydrometric Data-River Flow Gauging. Foundation for Water Research. CNS Scientific & Engineering, Marlow.
12
Hester, G., D. Ford, K. Carsell, C. Vertucci, and E. Stallings. 2006. Flood Management Benefits of USGS
Streamgaging Program: National Hydrologic Warning Council, Denver, Colorado.
Lazo, J.K. Survey of Mozambique Public on Weather, Water, and Climate Information.
Lazo, J.K., R.E. Morss, and J.L. Demuth. 2009. “300 Billion Served.” Bulletin of the American
Meteorological Society 90(6): 785–798. doi:10.1175/2008bams2604.1.
Leviäkangas, P., and R. Hautala. 2009. “Benefits and Value of Meteorological Information Services:The
Case of the Finnish Meteorological Institute.” Meteorological Applications 16(3): 369–379.
doi:10.1002/met.135
Leviakangas, P., R. Hautala, J. Rasanen, R. Oorni, S. Sonninen, M. Hekkanen, . . . S. Saku. 2007.
Benefits of Meteorological Services in Croatia. VTT TIEDOTTEITA, 2420.
McMahon, T., and D. Cronin. 1980. “An Approach to Marginal Economic Analysis of Hydrometric Data
Collection.” Journal of the American Water Resources Association 16(3): 414–420.
Perrels, A., T. Frei, F. Espejo, L. Jamin, and A. Thomalla. 2013. “Socio-economic Benefits of Weather
and Climate Services in Europe.” Advances in Science and Research 10: 65–70. doi:10.5194/asr-10-65-
2013.
Stallings, E.A., and D. Fread. 1997. The Benefits of Hydrologic Forecasting. EASPE, Incorporated.
Walker, S. 2000. “The Value of Hydrometric Information in Water Resources Management and Flood
Control.” Meteorological Applications 7(4), 387–397.

13
APPENDIX C: QUALITATIVE STUDIES ON THE COSTS AND BENEFITS OF PUBLIC WATER INFORMATION
Carsell, K.M., N.D. Pingel, and D.T. Ford. 2004. “Quantifying the Benefit of a Flood Warning System.”
Natural Hazards Review 5(3): 131–140.
Clements, J., and A. Ray. 2013. The Value of Climate Services Across Economic and Public Sectors.
Report to the United States Agency for International Development (USAID). Prepared by
Engility/International Resources Group (IRG). http: http://www. adaptationlearning.
net/sites/default/files/resource-files/The-Value-of-Climate-Services-report. pdf.
Freebairn, J.W., and J.W. Zillman. 2002. “Economic Benefits of Meteorological Services.”
Meteorological Applications 9(1): 33–44.
Hester, G., K. Carsell, and D. Ford. 2006. Benefits of USGS Streamgaging Program: Users and Uses of
USGS Streamflow Data. National Hydrologic Warning Council.
Norris, J.M., M. Lewis, M. Dorsey, R. Kimbrough, R.R. Holmes Jr., and W. Staubitz. 2008. Qualitative Comparison of Streamflow Information Programs of the US Geological Survey and Three Non-Federal
Agencies.
Rogers, D., and V. Tsirkunov. 2011. Costs and Benefits of Early Warning Systems. Global Assessment
Report on Disaster Risk Reduction. ISDR and World Bank.
Rogers, D., and V. Tsirkunov. 2013. Weather and Climate Resilience: Effective Preparedness through National Meteorological and Hydrological Services. World Bank Publications.
Stewart, B. 2015. “Measuring What We Manage: The Importance of Hydrological Data to Water
Resources Management.” Proceedings of the International Association of Hydrological Sciences 366:
80–85. doi:10.5194/piahs-366-80-2015.

14
RESOURCES Adeloye, A.J. 1996. “An Opportunity Loss Model for Estimating the Value of Streamflow Data for
Reservoir Planning.” Water Resources Management 10(1): 45–79.
Azar J., Sellars, and D. Schroeter. 2003. Water Quantity Monitoring in British Columbia: A Business Review of the BC Hydrometric Programs. Report by British Columbia Ministry of Sustainable Resource
Management.
Boardman, A.E. 2008. Cost-Benefit Analysis. Pearson.
Committee on Review of the USGS National Streamflow Information Program, National Research
Council. 2004. Assessing the National Streamflow Information Program. The National Academies Press.
Copeland, C. and T. Carter. 2017. Energy-Water Nexus: The Water Sector’s Energy Use. Congressional
Research Service.
Cordery, I., and P. Cloke. 1992. “An Overview of the Value of Collecting Streamflow Data: Transactions
of the Institution of Engineers, Australia.” Civil Engineering 34(3): 271–276.
Global Water Intelligence. 2016. Water’s Digital Future: The Outlook for Monitoring, Control and Data Management Systems.
Herschy, R., D. Newsome, and C. Green. 1991. The Benefit-Cost of Hydrometric Data-River Flow
Gauging. Foundation for Water Research. CNS Scientific & Engineering, Marlow.
Jeuland, M., and D. Whittington. 2014. “Water Resources Planning under Climate Change: Assessing the
Robustness of Real Options for the Blue Nile.” Water Resources Research 50(3): 2086–2107.
Jeuland, M., K. Hansen, H. Dohrety, L. Eastman, and M. Tchackimaka. Forthcoming. A Systematic
Review of Studies Related to the Benefits of Water Information Systems. The World Bank.
Kaufman, G. 2011. Socioeconomic Value of the Delaware River Basin in Delaware, New Jersey, New
York, and Pennsylvania.
Marquis, M., and P. Emch. 2012. “Metrics and Collaborations Are Key to Creating and Preserving New
Observation Records.” Bulletin of the American Meteorological Society 93(2): ES25-ES28.
National Hydrologic Warning Council. 2006. Flood Management Benefits of USGS Streamgaging
Program.
Norris, J.M., M.D. Lewis, M. Kimbrough, R. Holmes, and W. Staubitz. 2008. Qualitative Comparison of
Streamflow Information Programs of the U.S. Geological Survey and Three Non-Federal Agencies. U.S.
Geological Survey Open-File Report 2007–1426.
Stallings, E.A., and D. Fread. 1997. The Benefits of Hydrologic Forecasting. EASPE, Incorporated.

15
Sunding. 2016. The Farmer and the Data: How Wireless Technology Is Transforming Water Use in Agriculture. The Brattle Group.
Walker, S. 2000. “The Value of Hydrometric Information in Water Resources Management and Flood
Control.” Meteorological Applications 7(4): 387–397.
WMO. (World Meteorological Organization) 2015. Valuing the Weather and Climate: Economic
Assessment of Meteorological and Hydrological Services. WMO Report #1153.

AcknowledgmentsThis work was supported by the Aspen Institute’s Water Data Dialogue and by Xylem, Inc.
Nicholas Institute for Environmental Policy SolutionsThe Nicholas Institute for Environmental Policy Solutions at Duke University is a nonpartisan institute founded in 2005 to help decision makers in government, the private sector, and the nonprofit community address critical environmental challenges. The Nicholas Institute responds to the demand for high-quality and timely data and acts as an “honest broker” in policy debates by convening and fostering open, ongoing dialogue between stakeholders on all sides of the issues and providing policy-relevant analysis based on academic research. The Nicholas Institute’s leadership and staff leverage the broad expertise of Duke University as well as public and private partners worldwide. Since its inception, the Nicholas Institute has earned a distinguished reputation for its innovative approach to developing multilateral, nonpartisan, and economically viable solutions to pressing environmental challenges.
copyright (c) 2017 Nicholas Institute for Environmental Policy Solutions
ContactNicholas Institute, Duke UniversityP.O. Box 90335Durham, North Carolina 27708
1201 Pennsylvania Avenue, NWSuite 500Washington, D.C. 20004
Duke Marine Lab RoadBeaufort, North Carolina 28516
919.613.8709 phone919.613.8712 [email protected]