
Working Paper #90 March 2010 - fsi-live.s3.us-west-1 ...
41
PROGRAM ON ENERGY AND SUSTAINABLE DEVELOPMENT March 2010 #90 Working Paper GANG HE AND RICHARD K. MORSE M AKING C ARBON O FFSETS W ORK IN THE D EVELOPING W ORLD : L ESSONS FROM THE C HINESE W IND C ONTROVERSY FREEMAN SPOGLI INSTITUTE FOR INTERNATIONAL STUDIES
Transcript of Working Paper #90 March 2010 - fsi-live.s3.us-west-1 ...
PROGRAM ON ENERGY AND SUSTAINABLE DEVELOPMENT
March 2010
#90
Working Paper
GANG HE AND RICHARD K. MORSE
MAKING CARBON OFFSETS WORK IN THE DEVELOPING WORLD:
LESSONS FROM THE CHINESE WIND CONTROVERSY
FREEMAN SPOGLI INSTITUTE FOR INTERNATIONAL STUDIES
About the Program on Energy and Sustainable Development
The Program on Energy and Sustainable Development (PESD) is an international, interdisciplinary program that studies how institutions shape patterns of energy production and use, in turn affecting human welfare and environmental quality. Economic and political incentives and pre-existing legal frameworks and regulatory processes all play crucial roles in determining what technologies and policies are chosen to address current and future energy and environmental challenges. PESD research examines issues including: 1) effective policies for addressing climate change, 2) the role of national oil companies in the world oil market, 3) the emerging global coal market, 4) the world natural gas market with a focus on the impact of unconventional sources, 5) business models for carbon capture and storage, 6) adaptation of wholesale electricity markets to support a low-carbon future, 7) global power sector reform, and 8) how modern energy services can be supplied sustainably to the world’s poorest regions. The Program is part of the Freeman Spogli Institute for International Studies at Stanford University. PESD gratefully acknowledges substantial core funding from BP and EPRI.
Program on Energy and Sustainable Development Encina Hall East, Room E415
Stanford University Stanford, CA 94305-6055 http://pesd.stanford.edu
ii
iii
About the Authors Gang He is a research associate at the Program on Energy and Sustainable Development (PESD). Gang leads PESD’s research on China, focusing on China’s energy and climate change policies, the domestic coal sector, and its key role in both the global coal market and in international climate policy frameworks. He also studies other issues related to global climate change and the development of lower-carbon energy sources. Gang received a bachelor's degree in Geography from Peking University and a MA in Climate and Society from Columbia University. Richard K. Morse is a research associate at the Program on Energy and Sustainable Development (PESD). Richard leads PESD’s research on global coal markets, which examines the political economy of coal and coal's long-term role in the world's energy mix. Other research interests include climate policy, carbon markets, renewable energy markets, carbon capture and storage, and financial markets for energy commodities. Richard received a bachelor's degree in philosophy from Rice University, where he received an award as the top graduate in the field. He has worked in commodities markets for oil, natural gas, renewable energy, and emissions.
23 March 2010 1 He and Morse, PESD WP #90
Making Carbon Offsets Work in the Developing World: Lessons from the Chinese Wind Controversy
By Gang He and Richard K. Morse1
1. Introduction
The Clean Development Mechanism (CDM) is the leading international carbon market.2 But the eruption of controversy over carbon offsets from Chinese wind, once revered as a shining success story, exposes cracks at the core of how carbon credits are verified in developing economies. Those fissures will spread beyond wind in China – undermining the ability of carbon markets to deliver the long-term mitigation demanded by international climate policy – unless the problems posed by the wind controversy can be resolved.
The controversy revolves around proving the “additionality” of Chinese wind projects in the CDM. Additionality is the concept used to verify that carbon offset payments result in “real” emissions mitigation that “would not have happened otherwise”. Payments from carbon finance must truly alter the baseline of business as usual (BAU) investment in favor of a less emissions-intensive path if they are to be counted as reducing emissions against the caps set under Kyoto. If non-additional offsets were allowed into the CDM and counted towards meeting Kyoto targets, then the integrity of those targets is directly undermined.
In mid-2009 the CDM Executive Board (EB) shocked the carbon market by forcing an unprecedented review of whether a number of Chinese wind projects satisfied United Nations
1 The authors contributed equally to this publication. 2The Kyoto Protocol set emission caps in many of the world’s developed countries and created a market for international carbon offsets, known as the Clean Development Mechanism (CDM), which allowed for countries to meet their mitigation commitments by financing emissions reductions in the developing world.
Framework Convention on Climate Change (UNFCCC) additionality requirements.3 The controversy escalated when more projects were questioned at EB494 and 10 projects were outright rejected at EB51 in the days before COP15.5,6 CDM investors reeled as the safest CDM bet became the riskiest; the Chinese government publicly attacked the UN’s oversight of CDM markets; and the CDM EB prepared itself for an unprecedented fight over how carbon offsets could be verified in the world’s largest CDM market.
At the center of the controversy is the Chinese power tariff for wind. When the EB observed decreases in power tariffs granted by China’s National Development and Reform Commission (NDRC) to wind projects, it became concerned that China might be intentionally lowering power tariffs in order to artificially decrease the financial attractiveness of wind projects, thereby enhancing their additionality claim and ability to earn substantial revenues from carbon credits.7 The Chair of the EB succinctly explained the complex problem facing UN regulators: “We don’t know what is going on. Is the CDM replacing government subsidies? That is not what it was meant to do. […] If tariff levels would show to be orchestrated in order to win CDM approval, the board will not accept it. […] This is a very important issue and could have quite an impact on the credibility of the whole CDM” (Lex de Jonge, former Chair of the CDM EB).8 If the Chinese government were controlling additionality, then the CDM’s ability to validate “real” carbon offsets would be dealt a near-lethal blow.
This paper examines in detail the way in which additionality is determined in the Chinese wind power market and draws out broader implications for the design of effective global carbon 3 At EB47 and EB48 the CDM EB put multiple projects under review, or requested corrections, due to uncertainty around the power tariff used in the Project Design Documents (PDDs). 4 The EB commented in paragraph 48 of the EB49 meeting reports that they were concerned about the “suitability of the applied tariff as a means of assessing additionality.” Their two primary concerns were whether to apply the E+/E- guidance and whether tariffs were decreasing over time to enhance additionality claims. 5 The EB reiterated its’ comments from paragraph 48 of the EB49 meeting report and argued that project developers and CDM verifiers (Designated Operational Entities) had failed to sufficiently answer the questions posed there, and that they bore responsibility for explaining any changes in Chinese pricing policy. Project developers argued that they had in fact answered the relevant questions and publicly contested the EB judgment in various forums at COP15. 6 At EB 52 in February 2010 6 more Chinese wind projects were blocked, 32 were approved, and 2 rejected projects from the prior meeting were approved. 7 Carbon credits generated by the CDM are known as Certified Emissions Reductions, or CERs, and represent one metric ton CO2 equivalent of emissions reductions. 8 Point Carbon News, UN Defends CDM Rulings in China, July 27th 2009.
23 March 2010 2 He and Morse, PESD WP #90
offset policy. While this paper focuses on the specific challenges of additionality assessment in China, which has by far the largest number of CDM projects, it is important to note that the challenges of CDM project validation in China are relevant in most of the developing world. We suggest a resolution to the wind power controversy, highlight underlying structural flaws in how additionality is applied in China that created these problems, and chart a CDM reform path that can enable more efficient project approval and strengthen the credibility of global carbon markets.
We make the following four principal arguments. First, the structure of the current additionality test makes Chinese regulators the real
arbiters of additionality, whether they want to be or not. Wind additionality is largely determined by power tariffs (as we will show), and those tariffs are determined by China’s National Development and Reform Commission (NDRC). Because the NDRC determines power tariffs in a proprietary, non-market-based manner – as is their right in making sovereign decisions about energy policy – there is no real way to know what is business as usual and what constitutes gaming of the CDM. True verification of offsets is impossible in this context. Therefore the controversy cannot be resolved without reform of the additionality test to make outcomes less structurally dependent on Chinese regulatory decisions. Until that happens, the CDM approval process for Chinese wind might as well move from Bonn to Beijing. Second, the credibility of the CDM in the Chinese wind market is threatened by a system-wide failure of the additionality test that has never been exposed: almost no Chinese wind project has captured a realistic baseline that represents actual BAU in the Chinese power market to prove its additionality (without an accurate baseline for comparison to CDM investments, additionality can’t prove that the proposed wind investment isn’t business as usual). The most striking evidence of this failure is that wind is not being compared to coal-fired power – the blatantly obvious baseline in a market that is 80% coal-fired.9 The alternative “benchmark analysis” that is used as a proxy for real projects is both arbitrary and antiquated; it cannot serve as a credible baseline without major review and revision. We argue that a more careful effort to capture realistic baselines in the Chinese market will immediately bolster the credibility of CDM project approval.
9 Only one wind project has ever been compared to coal-fired power, Ningxia Helanshan Wind-farm Project, Ningxia Autonomous Region, China.
23 March 2010 3 He and Morse, PESD WP #90
Third, the underlying driver of both the problems discussed above is the incompatibility of the existing “internal rate of return” (IRR)-based additionality test with the actual market and regulatory structure in China. While the additionality test assumes profitability considerations to be the principal drivers of investment, China’s power sector is not fully market-oriented. Real investment and operations decisions are highly influenced by central government policy, which often supersedes profit logic.10 In this context true IRR, if it can be calculated at all, is not a sufficient indicator of whether a certain investment would be made. Better additionality metrics are required to capture the complex reality of the Chinese power market.
Fourth, we argue that the crucial question of how to incorporate domestic energy policies (in this case subsidies for a low-carbon technology like wind) into additionality calculations – as the EB has struggled with in the case of applying E+/E- to Chinese wind11 – presents a conundrum for climate policy.12 What we call the “Offsetters’ Paradox” traps climate policymakers in the following way. On the one hand, ignoring domestic subsidies for lesser- emitting investments results in CDM crediting for BAU domestic activity. On the other hand, incorporating emissions-reducing domestic policies into the baseline against which CDM projects are compared might create a perverse incentive against implementing such policies, as they would jeopardize CDM revenues. A comprehensive solution to this issue is beyond the scope of this paper, but we frame the problem and argue that baselines for Chinese wind should account for domestic wind subsidies rather than ignore them because in this case the risk of undermining Kyoto targets is greater than the risk of creating perverse incentives for policymakers.
10 For example, the majority of Chinese power generation is owned by state-owned firms, and politics drive generation decisions to such a high degree that coal plants sometimes have to run at a loss for political reasons. 11 The E+/E- guidance refers to the “Clarifications on the Consideration of National and/or Sectoral Policies and Circumstances in Baseline Scenarios”, Annex 3 of EB22. It states: “As a general principle, national and/or sectoral policies and circumstances are to be taken into account on the establishment of a baseline scenario, without creating perverse incentives that have impact the host Parties’ contributions to the ultimate objective of the convention.” But policies that give advantages to less emissions intensive technologies (E-) policies that were adopted after 2001 “need not be taken into account in developing a baseline scenario [. . .].” For more details see: http://cdm.unfccc.int/Reference/Guidclarif/meth/meth_guid08_v02.pdf 12 The E+/E- guidance is meant to deal with these kinds of issues but is not equipped to deal with complex subsidies as in the case of feed-in tariffs and no ruling has been made on how to apply it to Chinese wind at the time of publication. A more comprehensive, clearly articulated and enforced policy is required for the market to function properly.
23 March 2010 4 He and Morse, PESD WP #90
Fifth and finally, we suggest both a set of short term reforms that will improve additionality under the current regime and longer-term reforms for post-2012. In the near-term (before 2012), the first steps are to write clear policy on how to treat domestic subsidies for wind power pricing in China (and similar policies elsewhere) and to compare CDM projects to realistic baselines. In China, that baseline should be privately held coal-fired power that actually responds to market conditions. Longer-term (post-2012), CDM reform will need to create policy structures that are agnostic to developing country market structures. These reforms should enable more credible project approval and bolster both environmental integrity and market stability.
The paper is split into four sections. Section 2 provides an introduction to additionality and its importance to global carbon offset markets. Section 3 addresses the additionality controversy around Chinese wind power and demonstrates its underlying causes. Section 4 explores in detail how the additionality test has been applied in the Chinese market. Utilizing a detailed analysis of all registered Chinese CDM wind projects through 2009, the authors demonstrate the wholesale failure to capture accurate and credible baselines. Section 5 offers conclusions and suggests reforms to strengthen climate policy in the post-2012 period.
2. Introduction to Additionality and Its Role in Global Carbon
Markets
Under the CDM, eligible projects in non- Annex I countries can apply to the CDM EB for approval to generate carbon credits (CERs). Those credits can be bought by countries and compliance entities in capped economies, and because greenhouse gas emissions have the same effect whether they are emitted in Britain or Bangladesh, a reduction financed by CDM in the developing world is counted against Annex I targets.
But in order to maintain the integrity of those targets, the offset payment has to create real, “additional” reductions that would not have happened otherwise. Or else carbon finance is simply paying for business as usual while counting the resulting credits against its obligations, effectively undermining Annex I targets. Additionality is the concept employed to verify that payments for carbon reductions are not payments for business as usual.
23 March 2010 5 He and Morse, PESD WP #90

Additionality is at first glance a simple counterfactual.13 But proving a counterfactual is not easy. The CDM’s “additionality tool” attempts to do this by comparing the financial returns of all possible investments, with the logic that businesses will invest in the projects with the highest projected internal rate of return (IRR).14,15 Project developers wishing to receive CDM credits must demonstrate that the proposed CDM activity is not the most profitable under the BAU scenario, but that with CDM finance it becomes competitive with the alternative investments.
Two conditions are necessary for the IRR comparison to be a credible indicator of additionality: (1) the selected baseline that wind is compared to must represent actual BAU in the relevant market, and (2) IRR must be a credible indicator of behavior and investment patterns in the relevant market. There are serious problems meeting either of these conditions for Chinese wind because of the complex structure of China’s power market.
13 Marrakesh Accords, Annex: Modalities and procedures for a clean development mechanism, Section 43, “A CDM project activity is additional if anthropogenic emissions of greenhouse gases by sources are reduced below those that would have occurred in the absence of the registered CDM project activity.” http://unfccc.int/cop7/documents/accords_draft.pdf 14 We focus on the “investment analysis” portion of the “Tool for the demonstration and assessment of additionality” Version 05.2 (henceforth the “additionality tool” or “additionality test”), which is common to both Option II and Option III of the tool. While this version of the tool has evolved from prior versions, the core principles employed for Chinese wind are largely consistent throughout. 15 The “barrier analysis” and “common practice analysis” are also components of determining additionality, but we do not consider those here are as the “financial analysis” is the most important and controversial aspect of determining wind additionality in China.
23 March 2010 6 He and Morse, PESD WP #90

Figure 1. Using Financial Analysis to Demonstrate Additionality
Note: The arrow represents the change in project IRR with the introduction of revenues from CDM.
3. Controversy over the Additionality of Chinese Wind in the
CDM
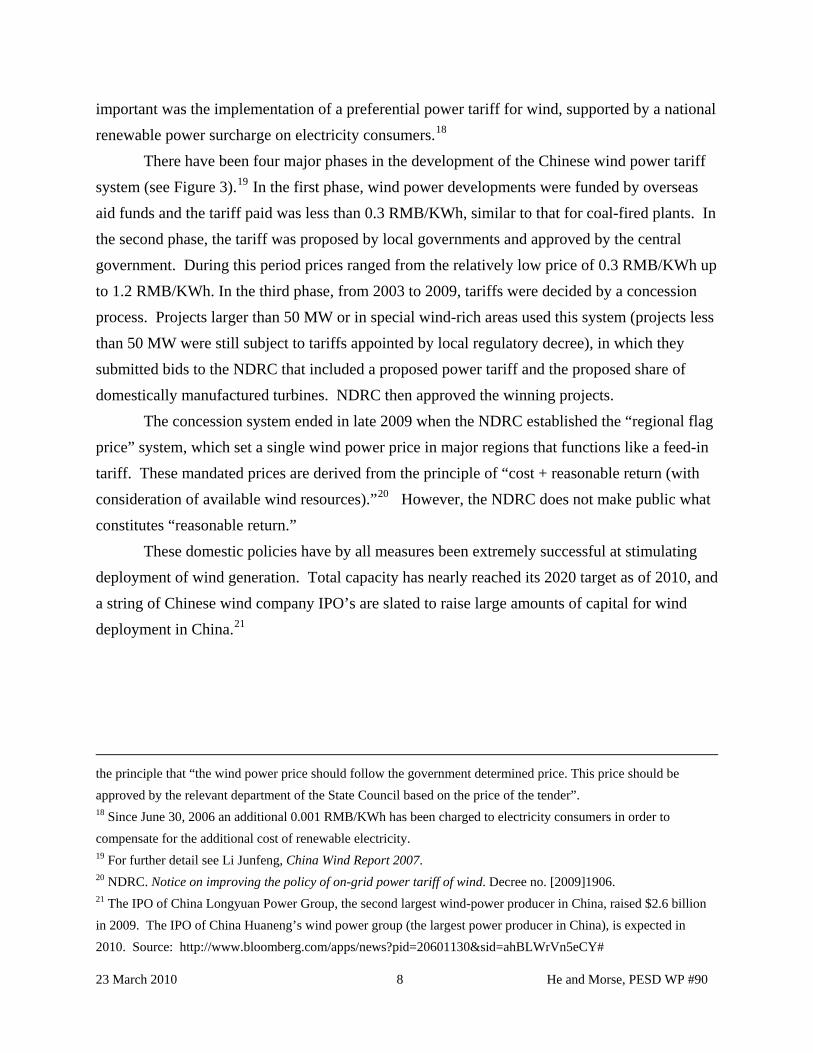
3.1 From CDM Success Story to International Controversy Chinese wind power development has experienced rapid growth since 2005 (see Figure
2). In 2009, China added more wind capacity than any other nation total and total capacity reached 25.1 GW.16 The backdrop for this impressive feat was support both from domestic Chinese policy and from carbon finance provided by the CDM.
China has instituted strong domestic support schemes for wind power development. NDRC’s 2005 Medium and Long Term Development Plan for Renewable Energy set a target of 15% of total primary energy that was to come from renewables by 2020. Total wind capacity was expected to reach 30 GW under this plan, but the government is now considering a new target of 100-150 GW. NDRC instituted a series of polices to support this goal.17 The most
16 Global Wind Energy Council, 2010. 17 On 4, January 2006, NDRC issued “Temporary implementation rules for establishing a feed-in tariff for renewable energy power and the sharing of expenses in purchasing electricity from renewable energy”, establishing
23 March 2010 7 He and Morse, PESD WP #90
important was the implementation of a preferential power tariff for wind, supported by a national renewable power surcharge on electricity consumers.18
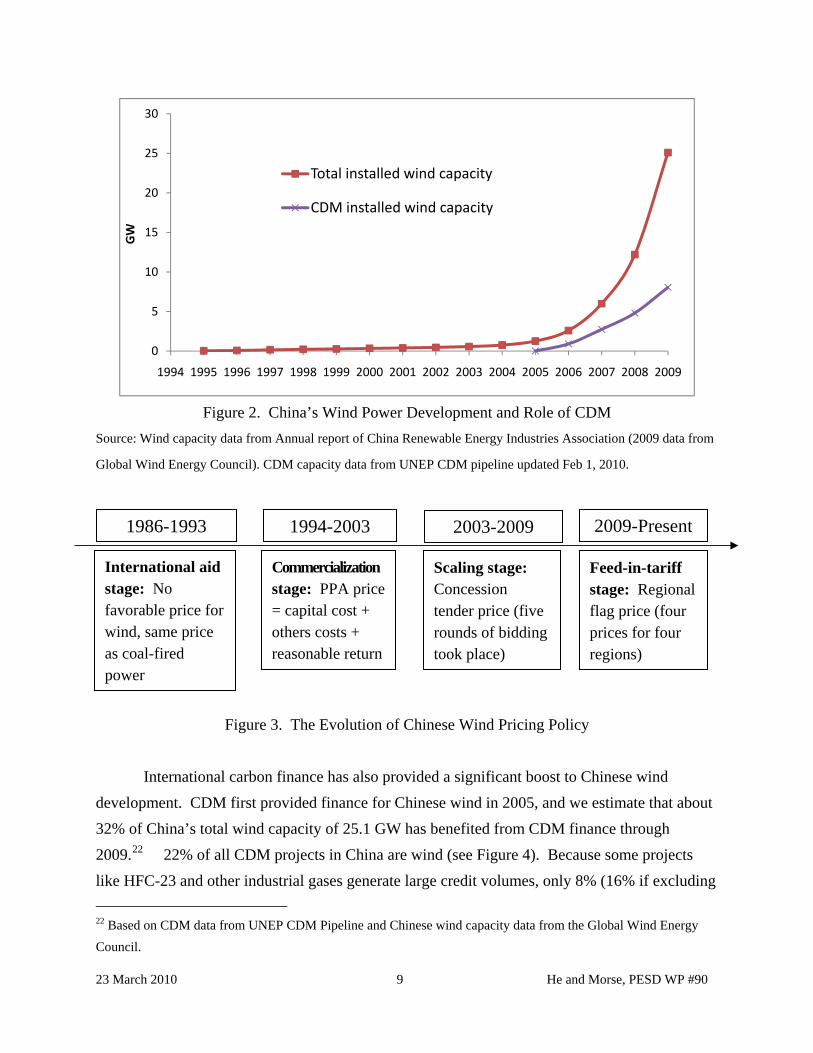
There have been four major phases in the development of the Chinese wind power tariff system (see Figure 3).19 In the first phase, wind power developments were funded by overseas aid funds and the tariff paid was less than 0.3 RMB/KWh, similar to that for coal-fired plants. In the second phase, the tariff was proposed by local governments and approved by the central government. During this period prices ranged from the relatively low price of 0.3 RMB/KWh up to 1.2 RMB/KWh. In the third phase, from 2003 to 2009, tariffs were decided by a concession process. Projects larger than 50 MW or in special wind-rich areas used this system (projects less than 50 MW were still subject to tariffs appointed by local regulatory decree), in which they submitted bids to the NDRC that included a proposed power tariff and the proposed share of domestically manufactured turbines. NDRC then approved the winning projects.
The concession system ended in late 2009 when the NDRC established the “regional flag price” system, which set a single wind power price in major regions that functions like a feed-in tariff. These mandated prices are derived from the principle of “cost + reasonable return (with consideration of available wind resources).”20 However, the NDRC does not make public what constitutes “reasonable return.”
These domestic policies have by all measures been extremely successful at stimulating deployment of wind generation. Total capacity has nearly reached its 2020 target as of 2010, and a string of Chinese wind company IPO’s are slated to raise large amounts of capital for wind deployment in China.21
the principle that “the wind power price should follow the government determined price. This price should be approved by the relevant department of the State Council based on the price of the tender”. 18 Since June 30, 2006 an additional 0.001 RMB/KWh has been charged to electricity consumers in order to compensate for the additional cost of renewable electricity. 19 For further detail see Li Junfeng, China Wind Report 2007. 20 NDRC. Notice on improving the policy of on-grid power tariff of wind. Decree no. [2009]1906. 21 The IPO of China Longyuan Power Group, the second largest wind-power producer in China, raised $2.6 billion in 2009. The IPO of China Huaneng’s wind power group (the largest power producer in China), is expected in 2010. Source: http://www.bloomberg.com/apps/news?pid=20601130&sid=ahBLWrVn5eCY#
23 March 2010 8 He and Morse, PESD WP #90
0
5
10
15
20
25
30
1994 1995 1996 1997 1998 1999 2000 2001 2002 2003 2004 2005 2006 2007 2008 2009
GW
Total installed wind capacity
CDM installed wind capacity
Figure 2. China’s Wind Power Development and Role of CDM
Source: Wind capacity data from Annual report of China Renewable Energy Industries Association (2009 data from
Global Wind Energy Council). CDM capacity data from UNEP CDM pipeline updated Feb 1, 2010.
Figure 3. The Evolution of Chinese Wind Pricing Policy
International carbon finance has also provided a significant boost to Chinese wind development. CDM first provided finance for Chinese wind in 2005, and we estimate that about 32% of China’s total wind capacity of 25.1 GW has benefited from CDM finance through 2009.22 22% of all CDM projects in China are wind (see Figure 4). Because some projects like HFC-23 and other industrial gases generate large credit volumes, only 8% (16% if excluding 22 Based on CDM data from UNEP CDM Pipeline and Chinese wind capacity data from the Global Wind Energy Council.
2009-Present1986-1993 1994-2003 2003-2009
International aid stage: No favorable price for wind, same price as coal-fired power
Commercialization stage: PPA price = capital cost + others costs + reasonable return
Scaling stage: Concession tender price (five rounds of bidding took place)
Feed-in-tariff stage: Regional flag price (four prices for four regions)
23 March 2010 9 He and Morse, PESD WP #90
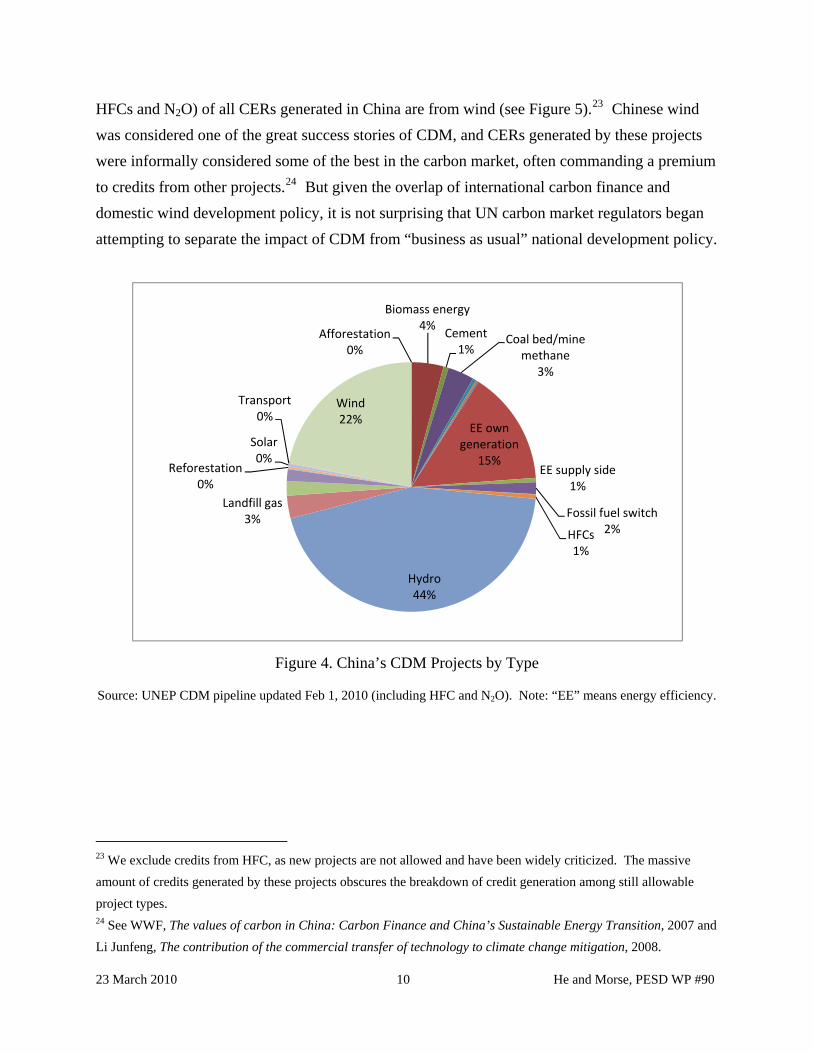
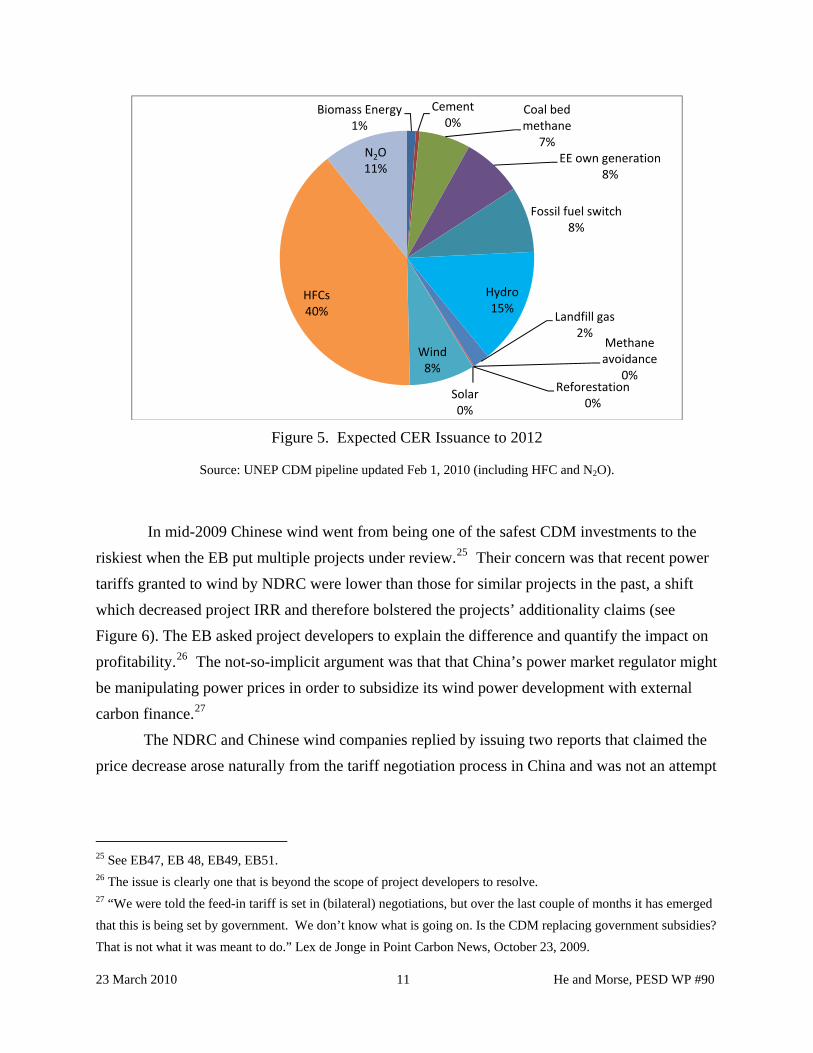
HFCs and N2O) of all CERs generated in China are from wind (see Figure 5).23 Chinese wind was considered one of the great success stories of CDM, and CERs generated by these projects were informally considered some of the best in the carbon market, often commanding a premium to credits from other projects.24 But given the overlap of international carbon finance and domestic wind development policy, it is not surprising that UN carbon market regulators began attempting to separate the impact of CDM from “business as usual” national development policy.
Afforestation0%
Biomass energy4%
Cement1%
Coal bed/mine methane
3%
EE own generation
15%EE supply side
1%
Fossil fuel switch2%HFCs
1%
Hydro44%
Landfill gas3%
Reforestation0%
Solar0%
Transport0%
Wind22%
Figure 4. China’s CDM Projects by Type
Source: UNEP CDM pipeline updated Feb 1, 2010 (including HFC and N2O). Note: “EE” means energy efficiency.
23 We exclude credits from HFC, as new projects are not allowed and have been widely criticized. The massive amount of credits generated by these projects obscures the breakdown of credit generation among still allowable project types. 24 See WWF, The values of carbon in China: Carbon Finance and China’s Sustainable Energy Transition, 2007 and Li Junfeng, The contribution of the commercial transfer of technology to climate change mitigation, 2008.
23 March 2010 10 He and Morse, PESD WP #90
Biomass Energy1%
Cement 0%
Coal bed methane
7%EE own generation
8%
Fossil fuel switch8%
Hydro15%
Landfill gas2%
Methane avoidance
0%Reforestation
0%Solar0%
Wind8%
HFCs40%
N2O11%
Figure 5. Expected CER Issuance to 2012
Source: UNEP CDM pipeline updated Feb 1, 2010 (including HFC and N2O).
In mid-2009 Chinese wind went from being one of the safest CDM investments to the riskiest when the EB put multiple projects under review.25 Their concern was that recent power tariffs granted to wind by NDRC were lower than those for similar projects in the past, a shift which decreased project IRR and therefore bolstered the projects’ additionality claims (see Figure 6). The EB asked project developers to explain the difference and quantify the impact on profitability.26 The not-so-implicit argument was that that China’s power market regulator might be manipulating power prices in order to subsidize its wind power development with external carbon finance.27
The NDRC and Chinese wind companies replied by issuing two reports that claimed the price decrease arose naturally from the tariff negotiation process in China and was not an attempt
25 See EB47, EB 48, EB49, EB51. 26 The issue is clearly one that is beyond the scope of project developers to resolve. 27 “We were told the feed-in tariff is set in (bilateral) negotiations, but over the last couple of months it has emerged that this is being set by government. We don’t know what is going on. Is the CDM replacing government subsidies? That is not what it was meant to do.” Lex de Jonge in Point Carbon News, October 23, 2009.
23 March 2010 11 He and Morse, PESD WP #90
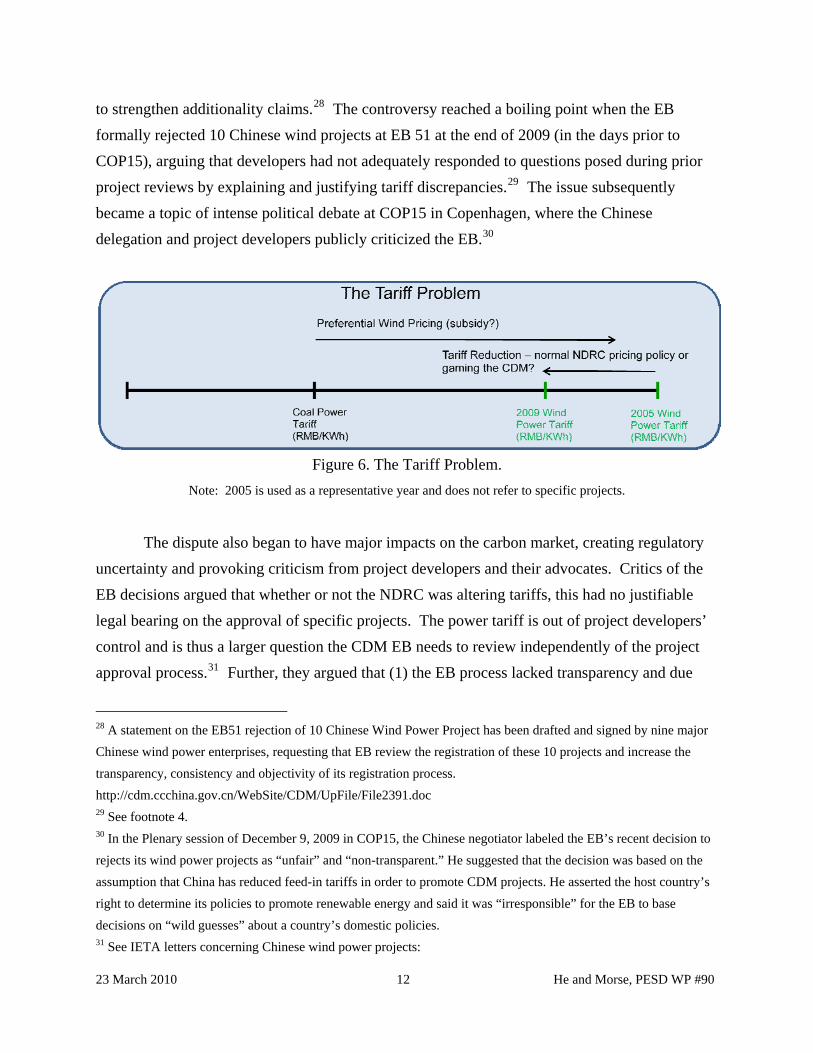
to strengthen additionality claims.28 The controversy reached a boiling point when the EB formally rejected 10 Chinese wind projects at EB 51 at the end of 2009 (in the days prior to COP15), arguing that developers had not adequately responded to questions posed during prior project reviews by explaining and justifying tariff discrepancies.29 The issue subsequently became a topic of intense political debate at COP15 in Copenhagen, where the Chinese delegation and project developers publicly criticized the EB.30
Figure 6. The Tariff Problem.
Note: 2005 is used as a representative year and does not refer to specific projects.
The dispute also began to have major impacts on the carbon market, creating regulatory
uncertainty and provoking criticism from project developers and their advocates. Critics of the EB decisions argued that whether or not the NDRC was altering tariffs, this had no justifiable legal bearing on the approval of specific projects. The power tariff is out of project developers’ control and is thus a larger question the CDM EB needs to review independently of the project approval process.31 Further, they argued that (1) the EB process lacked transparency and due
28 A statement on the EB51 rejection of 10 Chinese Wind Power Project has been drafted and signed by nine major Chinese wind power enterprises, requesting that EB review the registration of these 10 projects and increase the transparency, consistency and objectivity of its registration process. http://cdm.ccchina.gov.cn/WebSite/CDM/UpFile/File2391.doc 29 See footnote 4. 30 In the Plenary session of December 9, 2009 in COP15, the Chinese negotiator labeled the EB’s recent decision to rejects its wind power projects as “unfair” and “non-transparent.” He suggested that the decision was based on the assumption that China has reduced feed-in tariffs in order to promote CDM projects. He asserted the host country’s right to determine its policies to promote renewable energy and said it was “irresponsible” for the EB to base decisions on “wild guesses” about a country’s domestic policies. 31 See IETA letters concerning Chinese wind power projects:
23 March 2010 12 He and Morse, PESD WP #90
process, (2) regulatory instability was undermining CDM investment, and (3) the EB was not fairly applying its own regulations, namely its E+/E- guidance on how to treat domestic subsidies. If China’s wind pricing were ruled an E- (emissions-reducing) policy, it would make price differences within an emissions reducing policy irrelevant for additionality calculations.32
3.2 Underlying Causes of the Wind Controversy: Additionality as a Function of Domestic Policy There is no simple “additional” or “not additional” answer to the wind controversy. The
interaction between the structure of the additionality test and the Chinese power market makes this type of certainty unattainable. Because additionality is determined by IRR comparisons, which are largely a function of the power tariffs granted by the NDRC (as we will show), the NDRC is the most important arbiter of additionality, whether it wants to be or not.33 And because the NDRC decides power prices based on its proprietary system in a manner that is not fully market-based, any additionality test dependent on these price decisions will be inherently controversial and contestable.
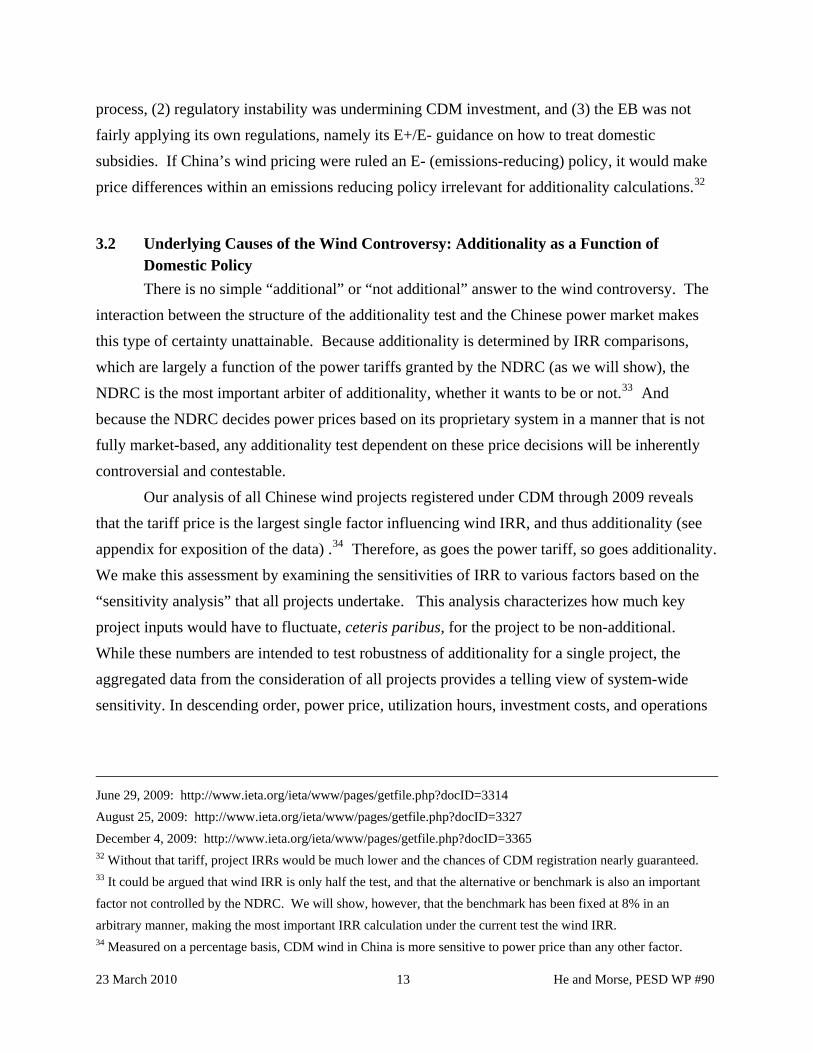
Our analysis of all Chinese wind projects registered under CDM through 2009 reveals that the tariff price is the largest single factor influencing wind IRR, and thus additionality (see appendix for exposition of the data) .34 Therefore, as goes the power tariff, so goes additionality. We make this assessment by examining the sensitivities of IRR to various factors based on the “sensitivity analysis” that all projects undertake. This analysis characterizes how much key project inputs would have to fluctuate, ceteris paribus, for the project to be non-additional. While these numbers are intended to test robustness of additionality for a single project, the aggregated data from the consideration of all projects provides a telling view of system-wide sensitivity. In descending order, power price, utilization hours, investment costs, and operations
June 29, 2009: http://www.ieta.org/ieta/www/pages/getfile.php?docID=3314 August 25, 2009: http://www.ieta.org/ieta/www/pages/getfile.php?docID=3327 December 4, 2009: http://www.ieta.org/ieta/www/pages/getfile.php?docID=3365 32 Without that tariff, project IRRs would be much lower and the chances of CDM registration nearly guaranteed. 33 It could be argued that wind IRR is only half the test, and that the alternative or benchmark is also an important factor not controlled by the NDRC. We will show, however, that the benchmark has been fixed at 8% in an arbitrary manner, making the most important IRR calculation under the current test the wind IRR. 34 Measured on a percentage basis, CDM wind in China is more sensitive to power price than any other factor.
23 March 2010 13 He and Morse, PESD WP #90
and maintenance costs are the variables with the highest influence on project IRR.35 Specifically, the data shows that on average, an 11.35% increase of the power tariff will make Chinese wind farms non-additional (see Figure 7).36
11.35%
12.03%
11.00%
11.50%
12.00%
12.50%
Power Tariff Investment Costs
% Cha
nge Re
quired
to M
ake Projects Non
‐ad
dtiona
l
Figure 7. Average Sensitivity of Chinese Wind Additionality to Key Inputs Note: Data from authors’ analysis of all registered Chinese CDM wind projects through 2009. Projects become non-additional when either power tariffs increase (revenues) or investment costs decrease sufficiently. We do not show sensitivity to operations and maintenance, because it is so low that many projects would have to reduce these costs more than 100% in order to cross the benchmark and it does not play an important role in the additionality determination. We do not show utilization hours sensitivity because (1) it is identical to power tariff sensitivity, and (2) it is determined by nature, not people.
What makes additionality determination even more problematic is that the power tariff is
set by regulatory decree, not by market pricing. While the national concession system (which influenced the setting of current regional feed-in tariffs) certainly helped China move some projects closer to a market-based price discovery mechanism, wind pricing mechanisms in China are still not a fully market-based for several reasons. First, major state-owned enterprises (SOEs) 35 We ignore the utilization sensitivity because it is identical to tariff sensitivity but is determined by how much the wind blows, not regulatory decree. We do not show operations sensitivity here because it is often so low (the change in costs would have to be very high) that often operations costs would have to decrease by 100% or more to affect additionality. Many projects do not bother to calculate it at all for this reason. 36 Alternatively, if the average investment costs were to drop by 12%, the average Chinese wind would not be additional.
23 March 2010 14 He and Morse, PESD WP #90
were known to bid below market prices in order to win projects and meet central government quotas.37 Second, the system favored projects with higher shares of domestically manufactured turbines in order to encourage the development of the domestic wind industry. Accordingly, observers have noted that the tariff outcomes of the concession system were artificially depressed. Prices were low enough to discourage investment from private, non-SOE investors.38 The EB also took note of the fact that wind power prices were being set by government regulators instead of the market during its review of CDM wind projects.39 Third, NDRC pricing policy clearly reveals that NDRC is setting the tariff based on its own judgment of appropriate IRR (as is China’s sovereign right). But they don’t specify what this level is or how it is determined. While there are surely a number of considerations that affect NDRC price decisions, the formula “cost + reasonable return (with consideration of available wind resources)” explicitly indicates that the NDRC is determining the “reasonable return” through the tariff. This again demonstrates that the Chinese regulator controls the most significant part of the additionality determination and suggests that IRR-based additionality tests are fundamentally incompatible with China’s power pricing regime.40
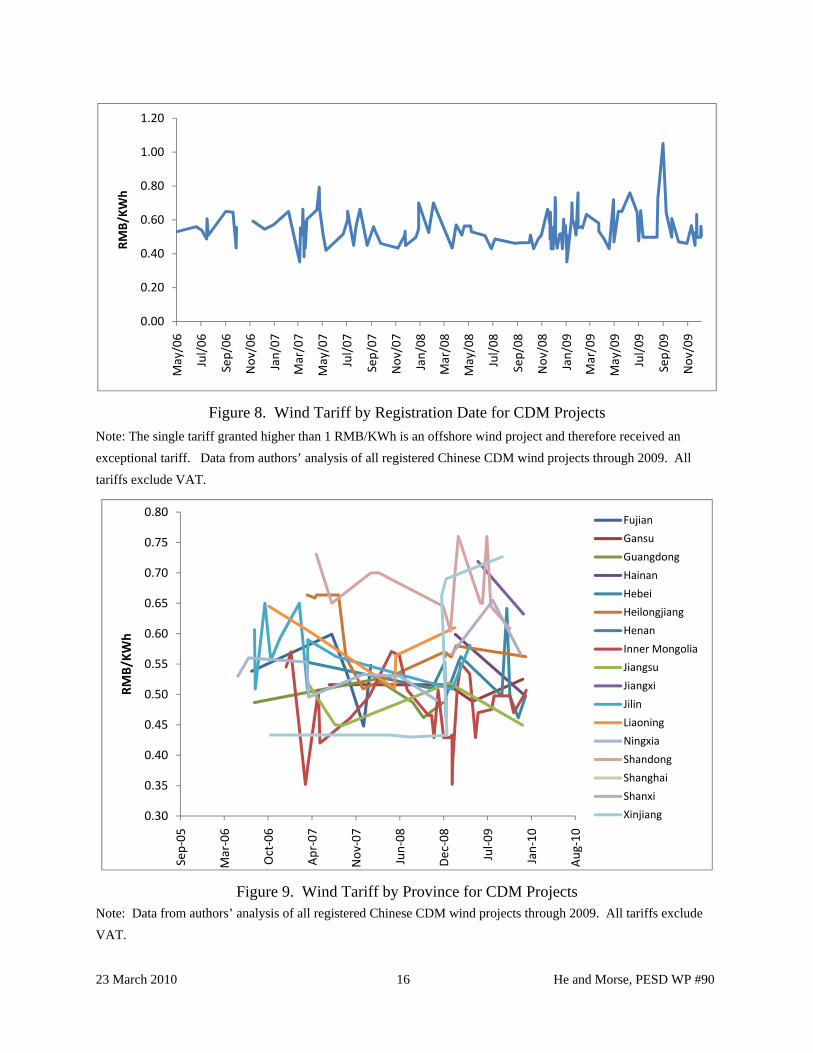
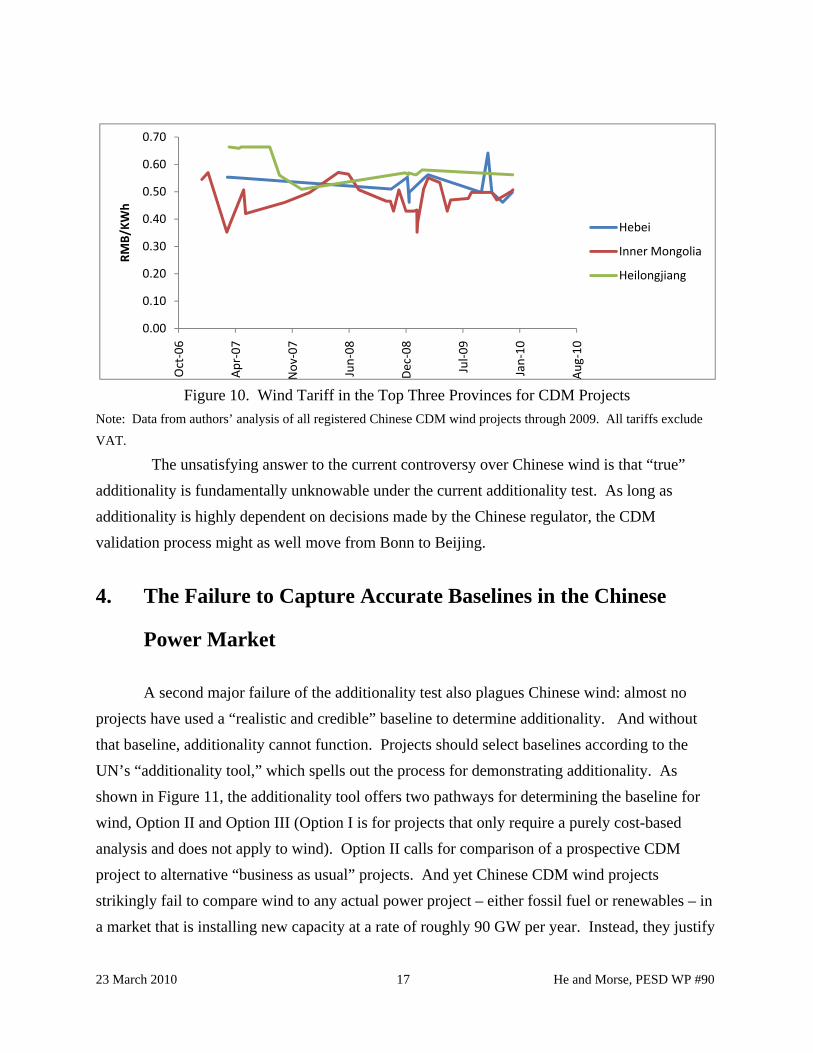
Our empirical analysis of power data for all CDM wind projects in China fails to show obvious evidence of dramatic changes in pricing policy that might reveal deliberate price manipulation by the NDRC. Figures 8-10 show the trends in power tariffs granted to all Chinese wind projects in the CDM. Figure 8 shows CDM wind tariffs by registration date, Figure 9 shows tariffs by province and registration date, and Figure 10 shows tariffs for the three provinces with the most CDM wind capacity by province and registration date.41
37 For further detail see Li Junfeng, China Wind Report 2008. This is another clear example of politics and policy rather than purely economic variables driving investment behavior and prices in the Chinese power market. 38 Li Junfeng, China Wind Report 2008. 39 “We were told the feed-in tariff is set in (bilateral) negotiations, but over the last couple of months it has emerged that this is being set by government. We don’t know what is going on. Is the CDM replacing government subsidies? That is not what it was meant to do.” Lex de Jonge in Point Carbon News, October 23, 2009. 40 IRR-based additionality would make more sense in liberalized power market with transparent, market-based electricity pricing. 41 Tariffs shown are by CDM registration date, not NDRC issuance date. This shows price trends based on how the EB would considers them in their decision making.
23 March 2010 15 He and Morse, PESD WP #90
0.00
0.20
0.40
0.60
0.80
1.00
1.20
May/06
Jul/06
Sep/06
Nov/06
Jan/07
Mar/07
May/07
Jul/07
Sep/07
Nov/07
Jan/08
Mar/08
May/08
Jul/08
Sep/08
Nov/08
Jan/09
Mar/09
May/09
Jul/09
Sep/09
Nov/09
RMB/KW
h
Figure 8. Wind Tariff by Registration Date for CDM Projects Note: The single tariff granted higher than 1 RMB/KWh is an offshore wind project and therefore received an exceptional tariff. Data from authors’ analysis of all registered Chinese CDM wind projects through 2009. All tariffs exclude VAT.
0.30
0.35
0.40
0.45
0.50
0.55
0.60
0.65
0.70
0.75
0.80
Sep‐05
Mar‐06
Oct‐06
Apr‐07
Nov
‐07
Jun‐08
Dec‐08
Jul‐0
9
Jan‐10
Aug
‐10
RMB/KW
h
Fujian
Gansu
Guangdong
Hainan
Hebei
Heilongjiang
Henan
Inner Mongolia
Jiangsu
Jiangxi
Jilin
Liaoning
Ningxia
Shandong
Shanghai
Shanxi
Xinjiang
Figure 9. Wind Tariff by Province for CDM Projects Note: Data from authors’ analysis of all registered Chinese CDM wind projects through 2009. All tariffs exclude VAT.
23 March 2010 16 He and Morse, PESD WP #90
0.00
0.10
0.20
0.30
0.40
0.50
0.60
0.70
Oct‐06
Apr‐07
Nov
‐07
Jun‐08
Dec‐08
Jul‐0
9
Jan‐10
Aug
‐10
RMB/KW
h
Hebei
Inner Mongolia
Heilongjiang
Figure 10. Wind Tariff in the Top Three Provinces for CDM Projects
Note: Data from authors’ analysis of all registered Chinese CDM wind projects through 2009. All tariffs exclude VAT.
The unsatisfying answer to the current controversy over Chinese wind is that “true” additionality is fundamentally unknowable under the current additionality test. As long as additionality is highly dependent on decisions made by the Chinese regulator, the CDM validation process might as well move from Bonn to Beijing.
4. The Failure to Capture Accurate Baselines in the Chinese
Power Market
A second major failure of the additionality test also plagues Chinese wind: almost no projects have used a “realistic and credible” baseline to determine additionality. And without that baseline, additionality cannot function. Projects should select baselines according to the UN’s “additionality tool,” which spells out the process for demonstrating additionality. As shown in Figure 11, the additionality tool offers two pathways for determining the baseline for wind, Option II and Option III (Option I is for projects that only require a purely cost-based analysis and does not apply to wind). Option II calls for comparison of a prospective CDM project to alternative “business as usual” projects. And yet Chinese CDM wind projects strikingly fail to compare wind to any actual power project – either fossil fuel or renewables – in a market that is installing new capacity at a rate of roughly 90 GW per year. Instead, they justify
23 March 2010 17 He and Morse, PESD WP #90
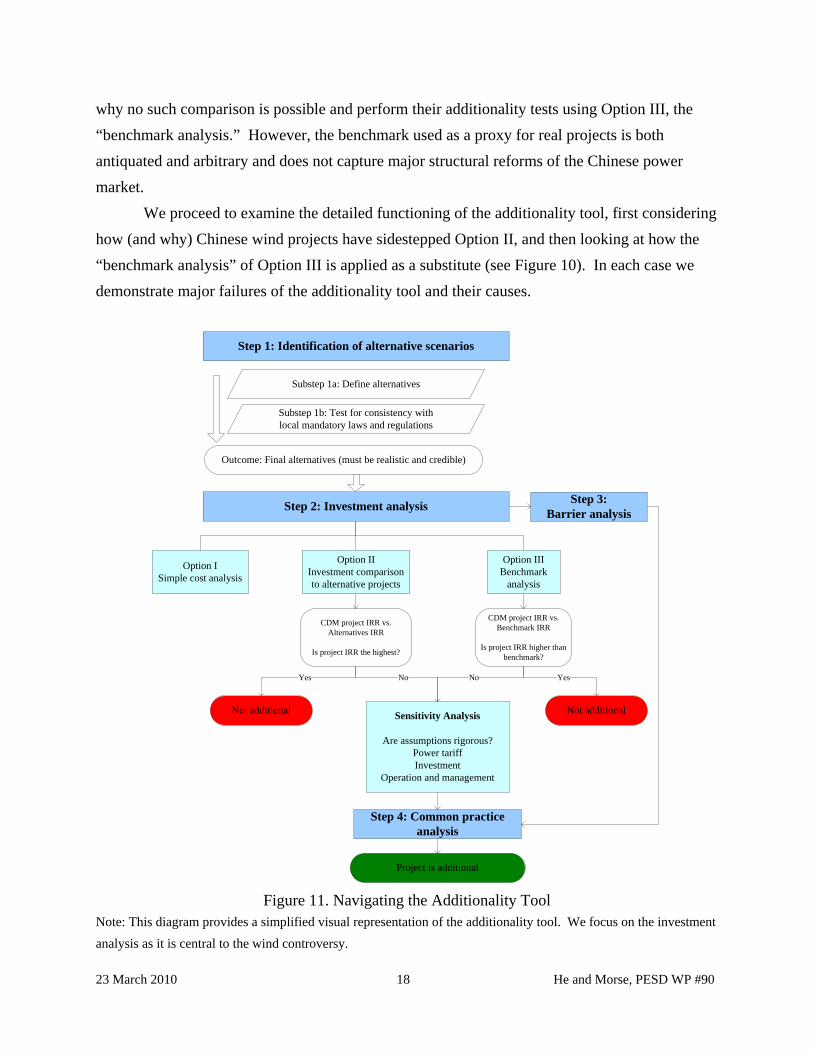
why no such comparison is possible and perform their additionality tests using Option III, the “benchmark analysis.” However, the benchmark used as a proxy for real projects is both antiquated and arbitrary and does not capture major structural reforms of the Chinese power market.
We proceed to examine the detailed functioning of the additionality tool, first considering how (and why) Chinese wind projects have sidestepped Option II, and then looking at how the “benchmark analysis” of Option III is applied as a substitute (see Figure 10). In each case we demonstrate major failures of the additionality tool and their causes.
Step 1: Identification of alternative scenarios
Substep 1a: Define alternatives
Substep 1b: Test for consistency with local mandatory laws and regulations
Outcome: Final alternatives (must be realistic and credible)
Step 2: Investment analysis
Option ISimple cost analysis
Option IIInvestment comparisonto alternative projects
Option IIIBenchmark
analysis
CDM project IRR vs. Alternatives IRR
Is project IRR the highest?
CDM project IRR vs. Benchmark IRR
Is project IRR higher than benchmark?
Step 3: Barrier analysis
Sensitivity Analysis
Are assumptions rigorous?Power tariffInvestment
Operation and management
Step 4: Common practice analysis
Project is additional
No No
Not additionalNot additional
Yes Yes
Figure 11. Navigating the Additionality Tool
Note: This diagram provides a simplified visual representation of the additionality tool. We focus on the investment analysis as it is central to the wind controversy.
23 March 2010 18 He and Morse, PESD WP #90
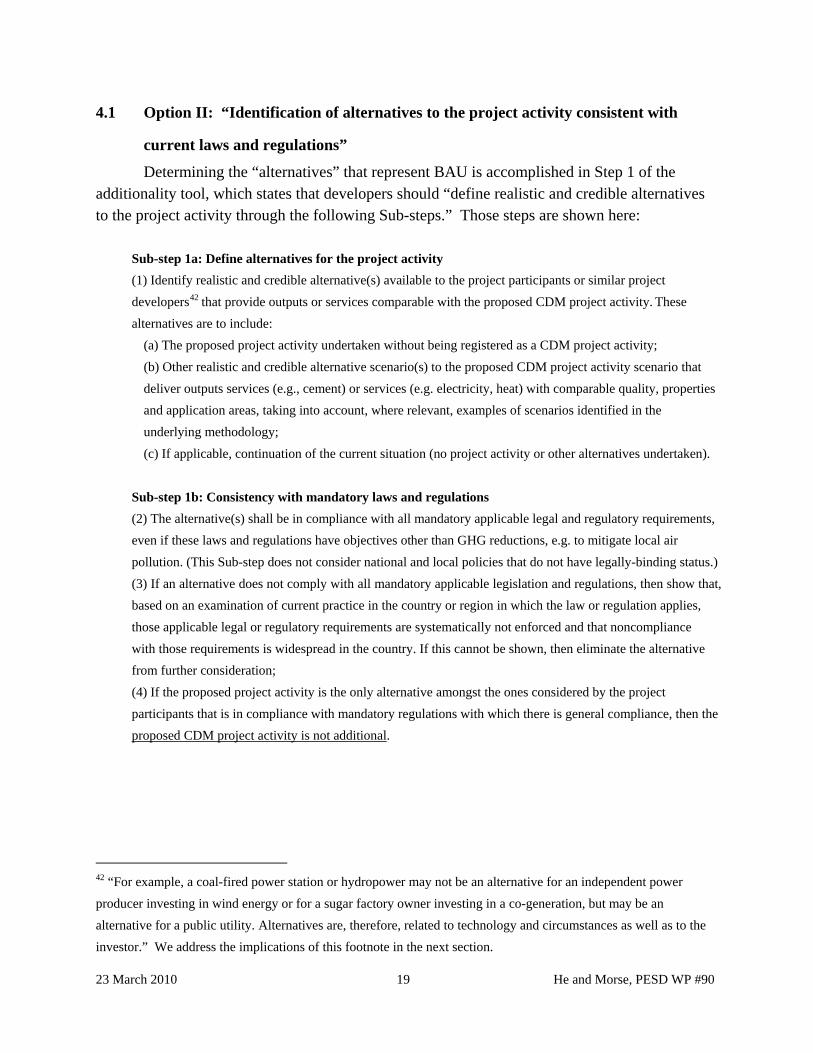
4.1 Option II: “Identification of alternatives to the project activity consistent with
current laws and regulations”
Determining the “alternatives” that represent BAU is accomplished in Step 1 of the additionality tool, which states that developers should “define realistic and credible alternatives to the project activity through the following Sub-steps.” Those steps are shown here:
Sub-step 1a: Define alternatives for the project activity (1) Identify realistic and credible alternative(s) available to the project participants or similar project developers42
that provide outputs or services comparable with the proposed CDM project activity.
These
alternatives are to include: (a) The proposed project activity undertaken without being registered as a CDM project activity; (b) Other realistic and credible alternative scenario(s) to the proposed CDM project activity scenario that deliver outputs services (e.g., cement) or services (e.g. electricity, heat) with comparable quality, properties and application areas, taking into account, where relevant, examples of scenarios identified in the underlying methodology; (c) If applicable, continuation of the current situation (no project activity or other alternatives undertaken).
Sub-step 1b: Consistency with mandatory laws and regulations (2) The alternative(s) shall be in compliance with all mandatory applicable legal and regulatory requirements, even if these laws and regulations have objectives other than GHG reductions, e.g. to mitigate local air pollution. (This Sub-step does not consider national and local policies that do not have legally-binding status.) (3) If an alternative does not comply with all mandatory applicable legislation and regulations, then show that, based on an examination of current practice in the country or region in which the law or regulation applies, those applicable legal or regulatory requirements are systematically not enforced and that noncompliance with those requirements is widespread in the country. If this cannot be shown, then eliminate the alternative from further consideration; (4) If the proposed project activity is the only alternative amongst the ones considered by the project participants that is in compliance with mandatory regulations with which there is general compliance, then the proposed CDM project activity is not additional.
42 “For example, a coal-fired power station or hydropower may not be an alternative for an independent power producer investing in wind energy or for a sugar factory owner investing in a co-generation, but may be an alternative for a public utility. Alternatives are, therefore, related to technology and circumstances as well as to the investor.” We address the implications of this footnote in the next section.
23 March 2010 19 He and Morse, PESD WP #90
Outcome of Step 1b: Identified realistic and credible alternative scenario(s) to the project activity that are in compliance with mandatory legislation and regulations taking into account the enforcement in the region or country and EB decisions on national and/or sectoral policies and regulations.
Source: UNFCCC, “Tool for the demonstration and assessment of additionality” (Version 05.2), pages 4-5.
The pathway to be followed is quite simple in principle: 1) determine what might be
built in absence of CDM to provide comparable services, 2) make sure it is compliant with domestic law, and 3) proceed to do a financial comparison between wind and that alternative, demonstrating that wind was not the most financially attractive option (see Figure 1). The implementation, however, is far from straightforward. The vast majority of Project Design Documents (the PDD is essentially a project’s application for CDM) suggest as possible alternatives other renewables, a thermal (coal) power plant, the proposed project undertaken without CDM finance, and increased power from the State grid. A typical list of alternatives is shown here:
a) The thermal power plant with the same capacity or the same annual electricity output as the proposed project. b) The proposed project not undertaken as a CDM project activity but as a commercial project. c) The other renewable energy power plant with the same capacity or the same annual electricity output as the proposed project. d) The Northeast Power Grid as the provider for the same capacity and electricity output as the proposed project. Source: Project 1487: Inner Mongolia Wudaogou 50.25MW Wind Power Project
Almost all PDDs for Chinese wind projects immediately set about ruling out every possible alternative project. Option (b) is quickly rejected – if the project was viable the developer wouldn’t be applying for CDM. Option (c) is next eliminated using a common set of rationales across projects: (1) other renewables technologies like solar or geothermal are in the “development stage” in China and are thus not competitive with wind, (2) the region in question does not have the resources to support biomass or hydro generation, or (3) the project developer does not have the expertise to develop these projects. The remaining alternatives are coal (a) and increased power from the grid (d).
23 March 2010 20 He and Morse, PESD WP #90
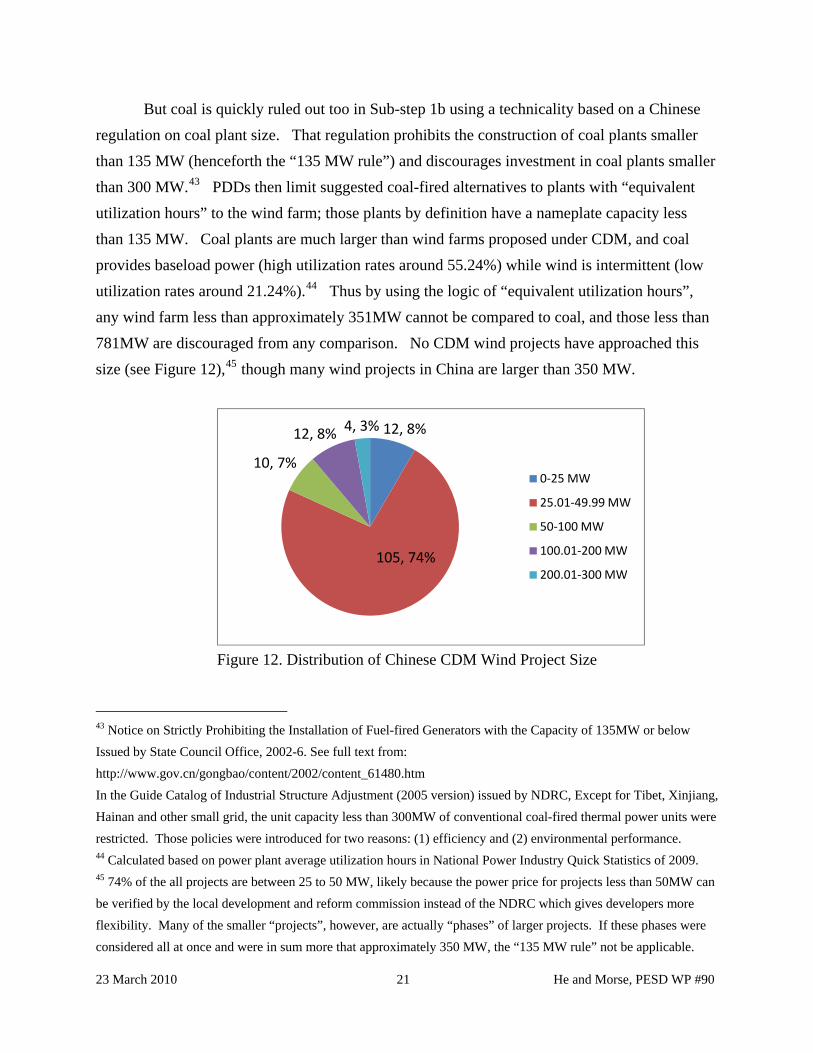
But coal is quickly ruled out too in Sub-step 1b using a technicality based on a Chinese regulation on coal plant size. That regulation prohibits the construction of coal plants smaller than 135 MW (henceforth the “135 MW rule”) and discourages investment in coal plants smaller than 300 MW.43 PDDs then limit suggested coal-fired alternatives to plants with “equivalent utilization hours” to the wind farm; those plants by definition have a nameplate capacity less than 135 MW. Coal plants are much larger than wind farms proposed under CDM, and coal provides baseload power (high utilization rates around 55.24%) while wind is intermittent (low utilization rates around 21.24%).44 Thus by using the logic of “equivalent utilization hours”, any wind farm less than approximately 351MW cannot be compared to coal, and those less than 781MW are discouraged from any comparison. No CDM wind projects have approached this size (see Figure 12),45 though many wind projects in China are larger than 350 MW.
12, 8%
105, 74%
10, 7%
12, 8% 4, 3%
0‐25 MW
25.01‐49.99 MW
50‐100 MW
100.01‐200 MW
200.01‐300 MW
Figure 12. Distribution of Chinese CDM Wind Project Size
43 Notice on Strictly Prohibiting the Installation of Fuel-fired Generators with the Capacity of 135MW or below Issued by State Council Office, 2002-6. See full text from: http://www.gov.cn/gongbao/content/2002/content_61480.htm In the Guide Catalog of Industrial Structure Adjustment (2005 version) issued by NDRC, Except for Tibet, Xinjiang, Hainan and other small grid, the unit capacity less than 300MW of conventional coal-fired thermal power units were restricted. Those policies were introduced for two reasons: (1) efficiency and (2) environmental performance. 44 Calculated based on power plant average utilization hours in National Power Industry Quick Statistics of 2009. 45 74% of the all projects are between 25 to 50 MW, likely because the power price for projects less than 50MW can be verified by the local development and reform commission instead of the NDRC which gives developers more flexibility. Many of the smaller “projects”, however, are actually “phases” of larger projects. If these phases were considered all at once and were in sum more that approximately 350 MW, the “135 MW rule” not be applicable.
23 March 2010 21 He and Morse, PESD WP #90
Note: Projects smaller than 50 MW can negotiate tariffs at the local level (hence we categorize sizes up to 49.99,
etc). It is likely that this provides for enhanced flexibility on tariff decisions for the developer, which has incentived
the vast majority of projects to apply in “Phases” where the project is just barely smaller than 50 MW, even if the
complete wind farm is much bigger.
This leaves only one possible “realistic and credible” alternative to be compared against,
which is used by every single Chinese wind PDD that has ever been registered: increased power from the state grid. However, because increased power from existing grid assets is not an actual project with an IRR, Option II fails. As a result, projects must proceed to Option III, the “benchmark analysis” (which we discuss at length in Section 4.3).
4.2 Problems with Option II
No wind additionality determinations are being made based on comparison to actual investments taking place in the Chinese power market. The additionality test therefore produces an alarmingly counterintuitive result: wind is almost never compared to coal in a market that is 80% coal-fired. In China, coal is nearly always “what would have happened otherwise,” and any test that does not capture this comparison cannot be viewed as a credible system for determining additionality. The failure to compare wind to coal is even more bizarre because conventional wisdom would suggest that wind will always be less profitable than coal, which should bolster wind’s additionality claim. Why then has almost no Chinese wind project ever justified its additionality with reference to coal?
We speculate that there are two principal causes for the failure to compare wind to coal. The first (see section 4.2.1) is the fact that the complex structure of China’s power market makes this comparison difficult and motivates projects to strategically avoid it. The second (see section 4.2.2) is the misapplication (deliberate or otherwise) of key additionality rules and concepts, which is not adequately challenged under the current system of CDM governance.
An important caveat to bear in mind in our analysis is that new CDM applications may tend to duplicate the additionality justification strategies of previous applications, both to minimize resources which must be devoted to the applications and to maximize chances of approval by applying proven strategies. (It could be argued that the ability of project developers to use “cookie cutter” approaches in their additionality tests is itself an indicator of inadequate systems for overseeing project additionality.)
23 March 2010 22 He and Morse, PESD WP #90

4.2.1 China’s Complex Power Market Structure Makes a Wind-Coal Comparison
Extremely Difficult
CDM applicants strategically seek to avoid having to ever compare wind to coal because either: (1) the coal IRR is unknowable given the regulatory structure of the Chinese coal and power markets, or (2) coal IRR may actually be lower than wind IRR because power prices from coal generation are kept artificially low while wind power benefits from feed-in tariffs. In either case, the additionality test is not compatible with the complex reality of China’s power sector governance.
Capturing coal IRR for the major part of coal capacity – capacity owned by SOEs – is extremely difficult. SOE generation in China is not completely profit-driven; operation of the energy system responds first to the political priorities of the central government. Government goals of boosting economic development and keeping inflation low in the interest of social stability dictate that power prices are artificially capped, often below the basic costs of power generation. In this context IRR is difficult to calculate in a reliable way and is not necessarily the primary driver of investment and operational choices.
A quick look at recent developments illustrates this point. In 2008, much of the Chinese power market could not even bear the cost fluctuations of its primary input – coal. Coal is the largest cost for power generators in China, and when the coal price rises in response to supply shortages or other market events, the power sector cannot proportionally increase electricity prices. In 2008 coal prices reached new heights due to transport constraints and the inability of the Chinese coal sector to keep up with booming demand. The price spike could not overcome the political motivation to keep power prices low, and power generators were forced to operate at massive losses—it is reported that Chinese power companies lost an estimated 70 billion RMB (40 billion for the Big 5 only) in 2008 (see Figure 13). Profit-oriented generators would simply shut down, but SOEs cannot (their continued operation is enabled by backdoor government subsidies of some sort, likely loan forgiveness from State banks that financed the assets in the first place). If the structure of Chinese power markets means that generators can barely support the cost of coal let alone all other operations costs, there is a strong case to be made that coal plant IRR could be either very low or even negative in some cases since the deregulation of the coal market in 2002. At the very least, it is easy to see why project developers would avoid an IRR comparison to the most realistic alternative in the Chinese market: they either cannot
23 March 2010 23 He and Morse, PESD WP #90
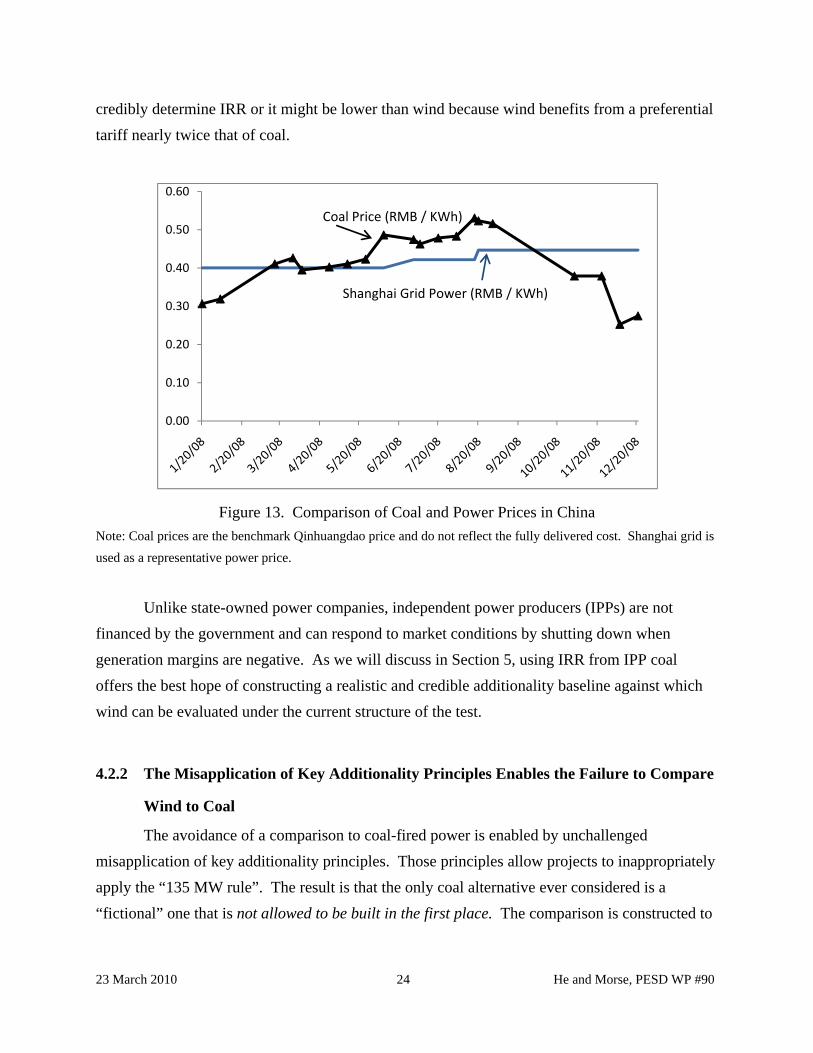
credibly determine IRR or it might be lower than wind because wind benefits from a preferential tariff nearly twice that of coal.
0.00
0.10
0.20
0.30
0.40
0.50
0.60
Coal Price (RMB / KWh)
Shanghai Grid Power (RMB / KWh)
Figure 13. Comparison of Coal and Power Prices in China Note: Coal prices are the benchmark Qinhuangdao price and do not reflect the fully delivered cost. Shanghai grid is used as a representative power price.
Unlike state-owned power companies, independent power producers (IPPs) are not
financed by the government and can respond to market conditions by shutting down when generation margins are negative. As we will discuss in Section 5, using IRR from IPP coal offers the best hope of constructing a realistic and credible additionality baseline against which wind can be evaluated under the current structure of the test.
4.2.2 The Misapplication of Key Additionality Principles Enables the Failure to Compare
Wind to Coal
The avoidance of a comparison to coal-fired power is enabled by unchallenged misapplication of key additionality principles. Those principles allow projects to inappropriately apply the “135 MW rule”. The result is that the only coal alternative ever considered is a “fictional” one that is not allowed to be built in the first place. The comparison is constructed to
23 March 2010 24 He and Morse, PESD WP #90
fail on a technicality.46 We argue that this legalistic and erroneous comparison should not be allowed and that instead the actual coal plants (on the order of 600 MW or larger) that China builds on a weekly basis should be posed as real, credible alternatives for financial comparison, for the following reasons.
First, proposing an alternative coal plant that is smaller than 135 MW fails the “reasonable and credible” standard that must be applied to any suggested alternatives. Power generation economics dictate a simple, universal fact – coal plants less than 135 MW are less efficient, more expensive per kilowatt and are almost never built. More than just being “unrealistic,” defining the coal alternative in this way is patently absurd.
Second, the logic that allows developers to posit an absurdly small coal plant depends on a contorted interpretation of “comparable services” 47 as meaning “identical utilization hours”. But this interpretation is not justified by the existing set of rules in the additionality tool. The rule only states that alternatives must provide the comparable type of output (electricity) and does not say that services or output must have the same quantity. This “identical utilization hours” interpretation also ignores the fact that wind and coal generation operate on a fundamentally different scale with crucially different technical parameters – wind is intermittent and coal generation is baseload power (but that doesn’t affect the ability to make the financial comparison that the additionality tool requires). Because of this, forcing a comparison based on utilization hours undermines the ability to compare intermittent renewables to any baseline from baseload non-renewable sources.
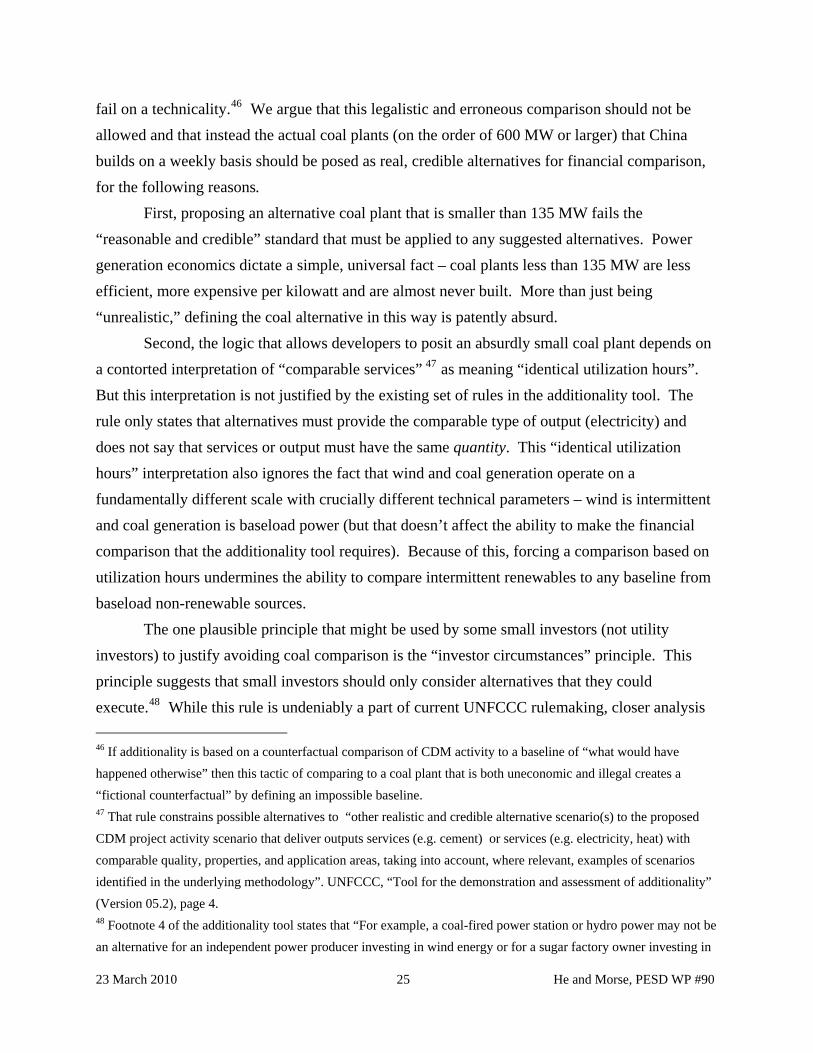
The one plausible principle that might be used by some small investors (not utility investors) to justify avoiding coal comparison is the “investor circumstances” principle. This principle suggests that small investors should only consider alternatives that they could execute.48 While this rule is undeniably a part of current UNFCCC rulemaking, closer analysis 46 If additionality is based on a counterfactual comparison of CDM activity to a baseline of “what would have happened otherwise” then this tactic of comparing to a coal plant that is both uneconomic and illegal creates a “fictional counterfactual” by defining an impossible baseline. 47 That rule constrains possible alternatives to “other realistic and credible alternative scenario(s) to the proposed CDM project activity scenario that deliver outputs services (e.g. cement) or services (e.g. electricity, heat) with comparable quality, properties, and application areas, taking into account, where relevant, examples of scenarios identified in the underlying methodology”. UNFCCC, “Tool for the demonstration and assessment of additionality” (Version 05.2), page 4. 48 Footnote 4 of the additionality tool states that “For example, a coal-fired power station or hydro power may not be an alternative for an independent power producer investing in wind energy or for a sugar factory owner investing in
23 March 2010 25 He and Morse, PESD WP #90
reveals that it dangerously undermines additionality and should be abandoned. When projects define the baseline as the set of options available to an individual rather than the actual projects being deployed in the market to meet demand (the same ones that make up the baseline emissions factor against which the project will generate CERs), they define the set of alternatives so narrowly that no comparison to “what would have happened otherwise” (the standard generation technologies in China) can occur.
The “investor circumstances” principle is also inconsistent with other CDM rulemaking that openly recognizes the danger of so narrowly defining “alternatives”. The methodology for natural gas power plants makes sure that alternatives considered are those that might reasonably be deployed in the market and are thus actual BAU. It states:49
These alternatives need not consist solely of power plants of the same capacity, load factor and operational characteristics (i.e. several smaller plants, or the share of a larger plant may be a reasonable alternative to the project activity), however they should deliver similar services (e.g. peak vs. baseload
power). Note further that the baseline scenario candidates identified may not be available to project participants, but could be other stakeholders within the grid boundary (e.g. other companies investing in power capacity expansions). Ensure that all relevant power plant technologies that have recently been constructed or are under construction or are being planned (e.g. documented in official power expansion plans) are included as plausible alternatives. [our emphasis] Source: Approved baseline methodology AM0029, “Baseline Methodology for Grid Connected Electricity Generation Plants Using Natural Gas”
Additionality should not be tethered to the subjective set of options available to individuals. The only appropriate way to define the baseline power generation options is in terms of the actual alternatives being deployed in a market with a multitude of producers who are capable of meeting demand. Wind should not be an exception to these common-sense rules that are already employed in other CDM methodologies.
co-generation, but may be alternative for a public utility. Alternatives are, therefore, related to the technology and circumstances as well as to the investor.” UNFCCC, “Tool for the demonstration and assessment of additionality” (Version 05.2), page 4. Methodology ACM0002, “Consolidated baseline methodology for grid-connected electricity generation from renewable sources,” page 4, also states that when selecting alternatives, “Only alternatives available to project participants should be taken into account.” 49 Approved baseline methodology AM0029, “Baseline Methodology for Grid Connected Electricity Generation Plants Using Natural Gas”
23 March 2010 26 He and Morse, PESD WP #90

In fact, the “investor circumstances” principle causes the entire additionality test to fail when it is consistently and broadly applied. Taken to its logical conclusion, the principle does not even allow one to consider the last remaining alternative besides coal: increased utilization of existing grid assets (which all PDDs use). Because increased utilization of existing on-grid assets is controlled by the national grids and other generators, it is an alternative entirely outside the scope of small project developers. Further, in reality, electricity demand growth is so rapid in China that the only way to increase utilization of the existing grid is to build new capacity. Thus any comparison to “increased utilization of the grid” really should be a comparison to the new generation assets that are required for such an increase. But as the PDDs themselves have already established, they cannot compare to the coal, wind, solar, geothermal, or other technologies that might actually meet that capacity. This leaves the project with no possible alternatives and the project developers have trapped themselves in a circular argument that they cannot win because a project with no possible alternatives is by definition business as usual. It therefore fails the additionality test.50
There remains no coherent justification for avoiding a comparison to China’s true baseline for energy supply growth, which consists of new coal capacity. Wind IRR should be compared to coal plants that are actually being built in the market. In fact, making a comparison to real coal plant economics will make the additionality test much more realistic and credible51 and should enable faster project approval for developers.
4.3 Option III: The Benchmark Analysis
As illustrated schematically in Figure 1, Option III utilizes the “benchmark analysis” as a proxy for typical project IRR where no specific alternative can be used.52 For Chinese power projects, the IRR quoted is always 8%, based on an “Internal Notice on New Project Feasibility
50 “If the proposed project activity is the only alternative amongst the ones considered by the project participants that is in compliance with all mandatory regulations with which there is general compliance, then the proposed CDM project activity is not additional.” Combined tool to identify the baseline scenario and demonstrate additionality, Version 02.2. 51 This has to be accomplished by comparing to IPP coal, which will require some increased NDRC transparency. We discuss this further in the reforms section. 52 Because no project is ever considered as an alternative under Option II, all wind PDDs use Option III.
23 March 2010 27 He and Morse, PESD WP #90
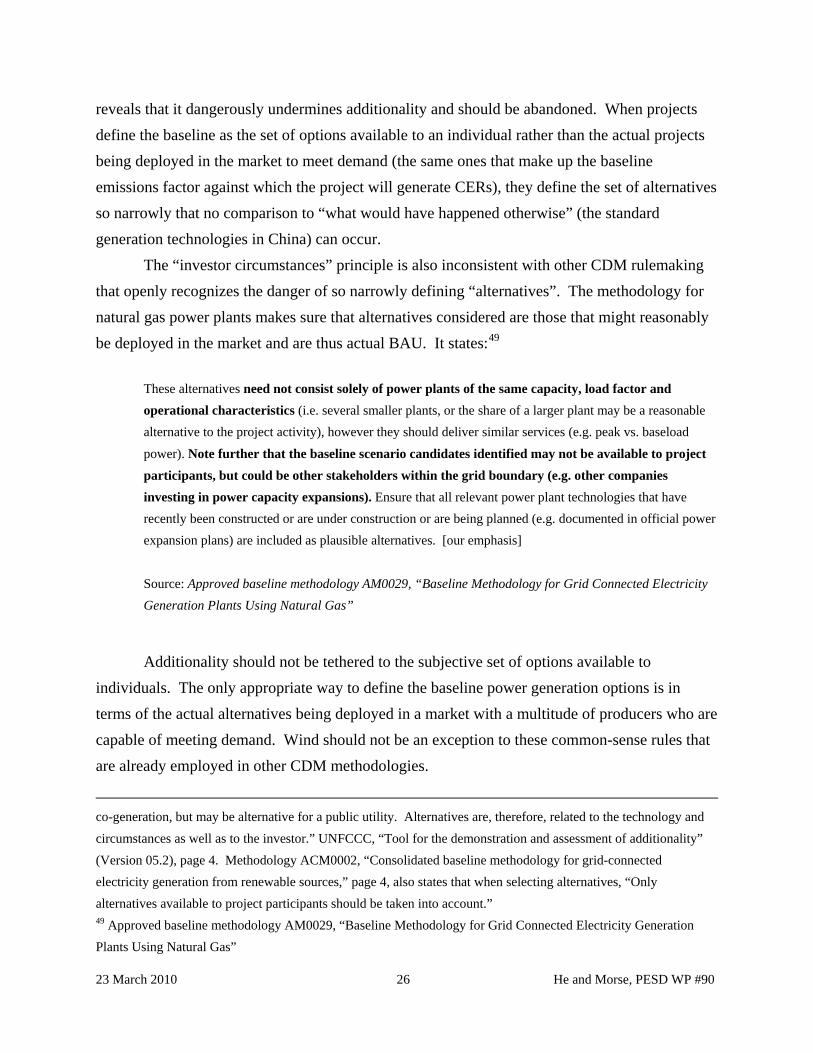
Assessment” by the State Power Company in 2002.53 Wind projects must then demonstrate that without revenue from the CDM their IRR will be below 8%, but with CDM revenues it will exceed 8%. If the project meets this test, financial additionality is demonstrated. Analysis of the entire Chinese CDM wind portfolio reveals that CDM adds 2.5% to IRR for the average wind project (see Figure 14).
6.40%
8.86%
0%
1%
2%
3%
4%
5%
6%
7%
8%
9%
10%
IRR w/o CDM IRR w/ CDM
Average IRRs
2.46%
Figure 14. Average Chinese CDM Wind IRR’s Note: Data from authors’ analysis of all registered Chinese CDM wind projects through 2009.
4.4 Problems with the Benchmark Analysis
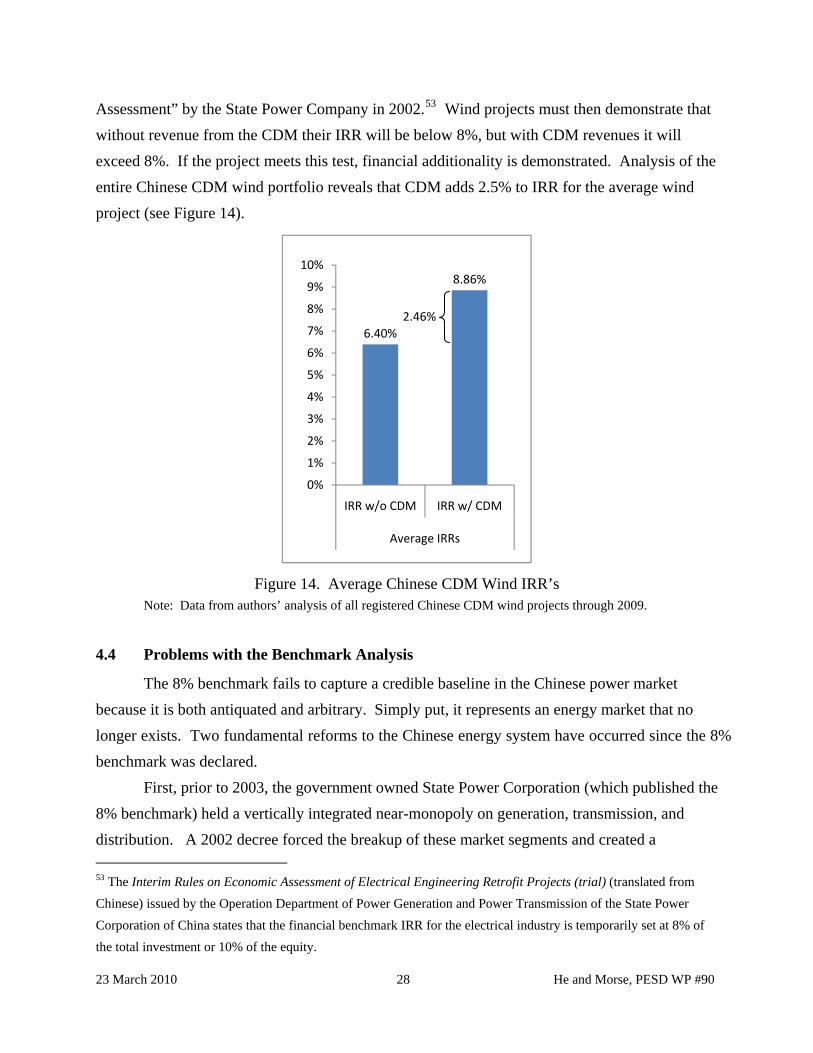
The 8% benchmark fails to capture a credible baseline in the Chinese power market because it is both antiquated and arbitrary. Simply put, it represents an energy market that no longer exists. Two fundamental reforms to the Chinese energy system have occurred since the 8% benchmark was declared. First, prior to 2003, the government owned State Power Corporation (which published the 8% benchmark) held a vertically integrated near-monopoly on generation, transmission, and distribution. A 2002 decree forced the breakup of these market segments and created a 53 The Interim Rules on Economic Assessment of Electrical Engineering Retrofit Projects (trial) (translated from Chinese) issued by the Operation Department of Power Generation and Power Transmission of the State Power Corporation of China states that the financial benchmark IRR for the electrical industry is temporarily set at 8% of the total investment or 10% of the equity.
23 March 2010 28 He and Morse, PESD WP #90
multitude of generation SOEs (the Big 5), two state grid companies, and numerous local distribution companies.54 As such, IRR targets taken from an interim decree of a defunct vertically integrated monopoly cannot be considered legitimate for CDM additionality determination in the current Chinese market.
Second, until 2002, when the decree was issued, coal prices were tightly capped along with power prices. But subsequent coal price liberalization radically altered the economics of generating power in China, as shown in the discussion above.55 This fundamental realignment of the relationship of coal to power in China alters the landscape of the market to such a dramatic degree that IRR estimations that do not capture these developments cannot represent the current Chinese energy market.
In order to make the benchmark credible, it needs to be updated to the current market, credibly justified, and regularly reviewed. And as we have already shown, pegging the benchmark to SOE IRR is fundamentally problematic in the Chinese market where politics often trump profit in the basic logic of generation investment and operation. Instead, reform of the benchmark should peg it to coal-fired power that is actually responsive to market conditions – IPP coal. We explore this reform solution in greater detail in Section 5.
5. Suggested Reforms and Key Conclusions
The current failures of the additionality test for Chinese wind, which are detailed at length in the analysis above, fall into two broad categories:
The first are failures of implementation. The inability of the additionality test to capture a “realistic and credible” baseline, either through the “alternative analysis” in Option II or the “benchmark analysis” in Option III, results primarily from the manner in which the test has been applied in the Chinese context rather than the design of the test itself. Wind could be compared to the actual investments in the Chinese markets – other renewables, coal, or a credible benchmark – under a more rigorous application of the additionality standard.
These failures of implementation are largely caused by a second set of structural failures. First, IRR-based additionality is incompatible with China’s market structure. Wind’s
54 For a more detailed history of the Chinese power sector, see Chi Zhang, Reform of Chinese Electric Power Market in Victor and Heller, The Political Economy of Power Sector Reform, Cambridge, 2007. 55 For additional details on Chinese coal and power sector reforms see PESD WP #86, Peng Wuyuan.
23 March 2010 29 He and Morse, PESD WP #90
additionality depends on proprietary, non-market oriented price decisions by Chinese regulators. Second, the lack of an appropriate mechanism to coherently deal with the impact of preferential wind pricing (domestic subsidies) on additionality cripples project developers and the EB. Without a well designed policy to address this issue (something that is extremely difficult to design, as we discuss in section 5.2.2), the additionality test is rendered incapable of dealing with wind in the Chinese market.
Implementation failures should be addressed with short term reforms that can enhance the credibility of the existing CDM regime and enable more efficient and credible project approval. Structural failures must be addressed by reform of the CDM in the post-2012 context. We propose a set of reforms in the following sections to address the issue at both levels.
5.1 Short Term Reforms – IPP Coal is the Most “Realistic and Credible” Baseline
Capturing a “realistic and credible” baseline in the Chinese market first and foremost means comparing against coal-fired power. However, as we have shown, comparing wind to IRR to SOE coal is extremely difficult if not impossible. Therefore, we argue that the most credible IRR coal comparison possible is to IPP coal projects that are fully exposed to market conditions and are not as influenced by political priorities. In this way additionality will come as close as possible under the current design to capturing China’s true baseline.56 IPP coal is only 10% of Chinese generation but it is the most market-oriented share of generation assets for several key reasons.57 First, these plants are built by private investors, not government owned firms. If they have negative IRRs or lose money they will not benefit from support from the central government’s balance sheet. Second, IPP operational decisions are most sensitive to profit, not policy. When generation margins are low or negative these plants can actually shut down. These key differences in ownership and operations between IPP and SOE coal allow for a realistic IRR calculation that should be a plausible indicator of investment behavior. However, because the power price is still fundamentally determined by NDRC, that IRR will still be highly influenced by the Chinese regulator. Thus while IPP coal is the most credible baseline option
56 This could be accomplished by using IPP coal as the alternate in Option II or by comprising a benchmark based on IPP coal in Option III. 57 State Electricity Regulatory Commission of China, 2009.
23 March 2010 30 He and Morse, PESD WP #90
available in the Chinese power market, it does not completely fix the problems associated with capturing an optimal baseline.58,59
This change in the implementation of additionality will yield an immediate benefit. If wind is more expensive than IPP coal plants it will be additional under the current standard. This change is beneficial for both project developers and China as it will reduce regulatory risk and attract more investment.
5.2 Long-term Reforms to Enhance the Integrity of Global Carbon Markets Post-2012
The two fundamental structural problems that must be addressed to strengthen global carbon offset policy are: (1) the incompatibility of IRR-based additionality with non-market power sectors and resulting dependency of additionality on domestic regulatory decisions, and (2) the lack of an adequate policy mechanism for incorporating the impact of emissions reducing domestic policies (E- policies). These problems have implications far beyond the case of Chinese wind alone, as they are observed in nearly all developing countries with non-market-oriented power sectors, and thus affect the credibility and efficacy of nearly the entire CDM. Several policy reforms now under discussion could begin to address the first problem. The second is inherent to additionality itself, no matter how it is structured.
5.2.1 Making Offset Policy Agnostic to Market Structure
Sectoral crediting has been proposed by the EU as a possible replacement for the CDM.60 The policy would define baselines in key sectors in terms of emissions intensity, and credits
58 The Chinese power market is rapidly evolving and any assumptions about benchmarks or alternatives will require regular review. For example, China is now testing partially market-oriented pricing systems in special “Demonstration Areas”, such as North East and East China. 59 Comparing to IPP coal will require access to project-level data on IPP facilities, though this data could be aggregated and published through a third party to protect proprietary commercial information. 60 There are a number of current proposals about the design and administration of a sectoral crediting system. For further information, see Meckling, J. and Chung. G.Y., “Sectoral Approaches to International Climate Policy”, Discussion Paper 2009-02, Harvard Kennedy School, January 2009 and Schmidt, J., Helme, N., Lee, J., and Houdashelt, M., “Sector-based approach to the post-2012 climate change policy architecture”, Climate Policy, August 2008 and Baron, R. and Ellis, J., “Sectoral Approaches and the Carbon Market”, IEA 2009.
23 March 2010 31 He and Morse, PESD WP #90
would accrue to those sectors emitting less per unit of production than the baseline.61 Additionality is still the core concept; carbon credits are generated when performance improves relative to “what would have happened otherwise.” But the emissions intensity metric would bypass many of the problems associated with additionality’s incompatibility with China’s market structure by making additionality agnostic to market structure and the economic returns of specific projects.62
The same is true for the Program of Activities (POA) approach to generating offsets, which credits for entire programs of activity that were not previously in existence.63 Experience with this mechanism has been limited thus far, but the World Bank is putting forward innovative efforts to expand credit generation from this type of program.64 Additionality under this mechanism, too, is agnostic to domestic market structure.
5.2.2 E+/E- and the Offsetters’ Paradox
While either of the above reforms would be better suited to determining additionality in the Chinese market, neither completely solves the challenge of how to incorporate into additionality domestic policies that reduce emissions.65 This challenge presents a paradox for policy makers. On one hand, including domestic subsidies in the baseline for additionality calculation creates perverse incentives for the host country by discouraging mitigation policies (E- policies), but on the other hand not incorporating these subsidies into additionality determinations means crediting for business as usual, thus reducing the integrity of emissions caps.
61 There are a number of problems with this policy need that still to be addressed. We will not consider them in detail here. 62 Of course power pricing policy will still affect baselines and possible deviations from baseline. If China provides wind power favorable tariffs in order to boost wind power production relative to coal power production, the emissions intensity of electricity production will drop as a result. 63 http://cdm.unfccc.int/ProgrammeOfActivities/index.html 64 http://go.worldbank.org/XZJKWR7UL0 65 Though one might argue that sectoral crediting is better equipped to deal with this problem from a practical perspective. If a sector-wide baseline is the aggregation of nationally appropriate mitigation actions (NAMAs), any policy that occurs after the baseline is set would likely not be used as a crediting baseline. However, from a theoretical perspective, the Offsetters’ Paradox remains because the host country will have the incentive to wait to deploy NAMAs until the baseline is already drawn.
23 March 2010 32 He and Morse, PESD WP #90
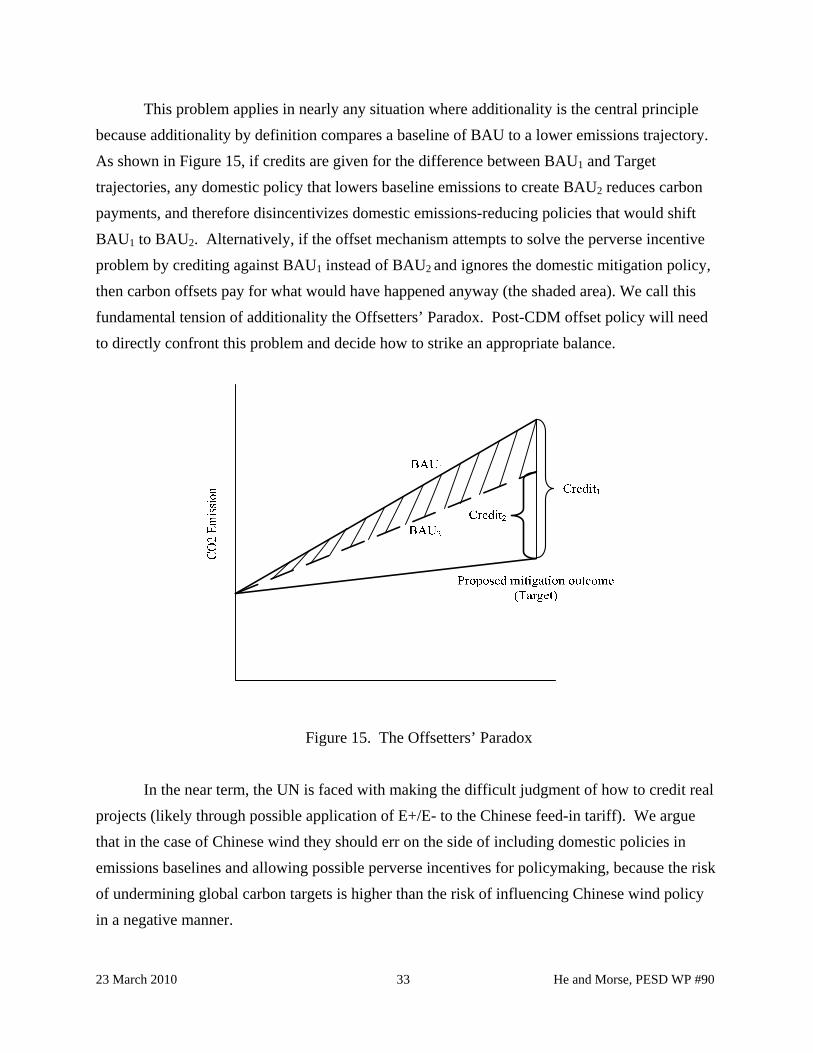
This problem applies in nearly any situation where additionality is the central principle because additionality by definition compares a baseline of BAU to a lower emissions trajectory. As shown in Figure 15, if credits are given for the difference between BAU1 and Target trajectories, any domestic policy that lowers baseline emissions to create BAU2 reduces carbon payments, and therefore disincentivizes domestic emissions-reducing policies that would shift BAU1 to BAU2. Alternatively, if the offset mechanism attempts to solve the perverse incentive problem by crediting against BAU1 instead of BAU2 and ignores the domestic mitigation policy, then carbon offsets pay for what would have happened anyway (the shaded area). We call this fundamental tension of additionality the Offsetters’ Paradox. Post-CDM offset policy will need to directly confront this problem and decide how to strike an appropriate balance.
Figure 15. The Offsetters’ Paradox
In the near term, the UN is faced with making the difficult judgment of how to credit real projects (likely through possible application of E+/E- to the Chinese feed-in tariff). We argue that in the case of Chinese wind they should err on the side of including domestic policies in emissions baselines and allowing possible perverse incentives for policymaking, because the risk of undermining global carbon targets is higher than the risk of influencing Chinese wind policy in a negative manner.
23 March 2010 33 He and Morse, PESD WP #90
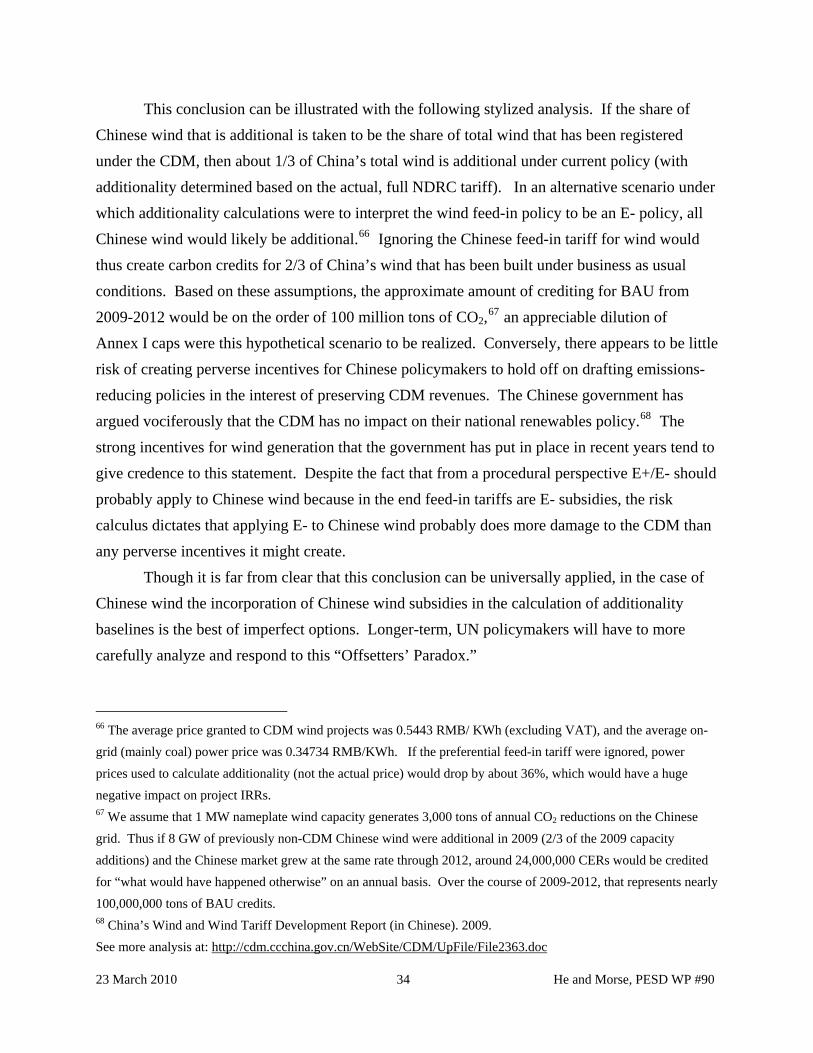
This conclusion can be illustrated with the following stylized analysis. If the share of Chinese wind that is additional is taken to be the share of total wind that has been registered under the CDM, then about 1/3 of China’s total wind is additional under current policy (with additionality determined based on the actual, full NDRC tariff). In an alternative scenario under which additionality calculations were to interpret the wind feed-in policy to be an E- policy, all Chinese wind would likely be additional.66 Ignoring the Chinese feed-in tariff for wind would thus create carbon credits for 2/3 of China’s wind that has been built under business as usual conditions. Based on these assumptions, the approximate amount of crediting for BAU from 2009-2012 would be on the order of 100 million tons of CO2,67 an appreciable dilution of Annex I caps were this hypothetical scenario to be realized. Conversely, there appears to be little risk of creating perverse incentives for Chinese policymakers to hold off on drafting emissions-reducing policies in the interest of preserving CDM revenues. The Chinese government has argued vociferously that the CDM has no impact on their national renewables policy.68 The strong incentives for wind generation that the government has put in place in recent years tend to give credence to this statement. Despite the fact that from a procedural perspective E+/E- should probably apply to Chinese wind because in the end feed-in tariffs are E- subsidies, the risk calculus dictates that applying E- to Chinese wind probably does more damage to the CDM than any perverse incentives it might create.
Though it is far from clear that this conclusion can be universally applied, in the case of Chinese wind the incorporation of Chinese wind subsidies in the calculation of additionality baselines is the best of imperfect options. Longer-term, UN policymakers will have to more carefully analyze and respond to this “Offsetters’ Paradox.”
66 The average price granted to CDM wind projects was 0.5443 RMB/ KWh (excluding VAT), and the average on-grid (mainly coal) power price was 0.34734 RMB/KWh. If the preferential feed-in tariff were ignored, power prices used to calculate additionality (not the actual price) would drop by about 36%, which would have a huge negative impact on project IRRs. 67 We assume that 1 MW nameplate wind capacity generates 3,000 tons of annual CO2 reductions on the Chinese grid. Thus if 8 GW of previously non-CDM Chinese wind were additional in 2009 (2/3 of the 2009 capacity additions) and the Chinese market grew at the same rate through 2012, around 24,000,000 CERs would be credited for “what would have happened otherwise” on an annual basis. Over the course of 2009-2012, that represents nearly 100,000,000 tons of BAU credits. 68 China’s Wind and Wind Tariff Development Report (in Chinese). 2009. See more analysis at: http://cdm.ccchina.gov.cn/WebSite/CDM/UpFile/File2363.doc
23 March 2010 34 He and Morse, PESD WP #90
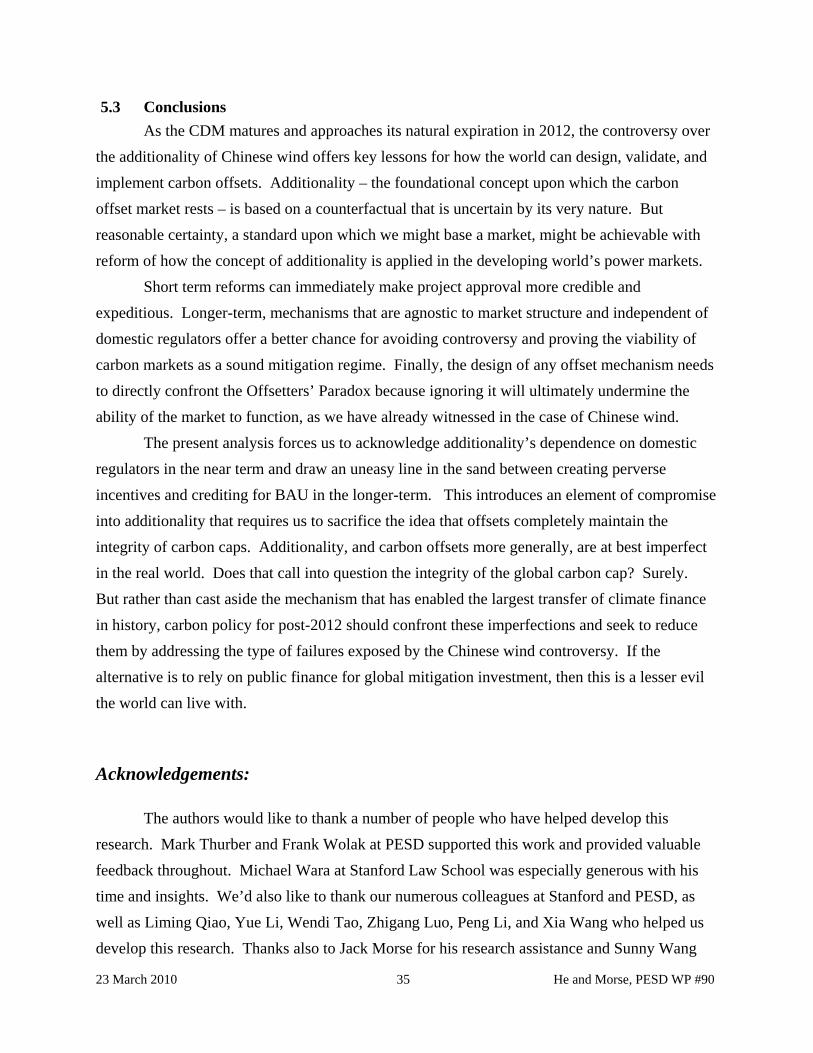
5.3 Conclusions As the CDM matures and approaches its natural expiration in 2012, the controversy over
the additionality of Chinese wind offers key lessons for how the world can design, validate, and implement carbon offsets. Additionality – the foundational concept upon which the carbon offset market rests – is based on a counterfactual that is uncertain by its very nature. But reasonable certainty, a standard upon which we might base a market, might be achievable with reform of how the concept of additionality is applied in the developing world’s power markets.
Short term reforms can immediately make project approval more credible and expeditious. Longer-term, mechanisms that are agnostic to market structure and independent of domestic regulators offer a better chance for avoiding controversy and proving the viability of carbon markets as a sound mitigation regime. Finally, the design of any offset mechanism needs to directly confront the Offsetters’ Paradox because ignoring it will ultimately undermine the ability of the market to function, as we have already witnessed in the case of Chinese wind.
The present analysis forces us to acknowledge additionality’s dependence on domestic regulators in the near term and draw an uneasy line in the sand between creating perverse incentives and crediting for BAU in the longer-term. This introduces an element of compromise into additionality that requires us to sacrifice the idea that offsets completely maintain the integrity of carbon caps. Additionality, and carbon offsets more generally, are at best imperfect in the real world. Does that call into question the integrity of the global carbon cap? Surely. But rather than cast aside the mechanism that has enabled the largest transfer of climate finance in history, carbon policy for post-2012 should confront these imperfections and seek to reduce them by addressing the type of failures exposed by the Chinese wind controversy. If the alternative is to rely on public finance for global mitigation investment, then this is a lesser evil the world can live with.
Acknowledgements:
The authors would like to thank a number of people who have helped develop this research. Mark Thurber and Frank Wolak at PESD supported this work and provided valuable feedback throughout. Michael Wara at Stanford Law School was especially generous with his time and insights. We’d also like to thank our numerous colleagues at Stanford and PESD, as well as Liming Qiao, Yue Li, Wendi Tao, Zhigang Luo, Peng Li, and Xia Wang who helped us develop this research. Thanks also to Jack Morse for his research assistance and Sunny Wang
23 March 2010 35 He and Morse, PESD WP #90
23 March 2010 36 He and Morse, PESD WP #90
for her copy editing. Finally, our thanks to the CDM EB and Lex de Jonge for their honest and helpful engagement of these difficult issues at COP15.

Appendix:
Data used in this paper was gathered by the authors from the UFCCC CDM official website. Key data from all registered Chinese wind Project Design Documents (PDDs) was compiled into a database and adjusted for consistency of currencies, exchange rates over time, and tax policies. 143 projects were analyzed, representing all Chinese wind CDM projects registered through the end of 2009. Some projects did not provide complete data in their sensitivity analysis because those projects were not highly sensitive to variations in several key inputs. In these cases the authors calculated sensitivities by extrapolating the available data.
Several additional charts not used in the text are included below.
8.78.88.99
9.19.29.39.49.59.6
2006 2007 2008 2009
Million RM
B/MW
Figure 16. Average Wind Investment Cost per Unit of Capacity for Chinese Wind in the CDM
The Chinese government and others have argued that the decrease in investment costs
justified a corresponding decrease in wind subsidies provided through the tariff. CDM data showed, however, that investment costs for CDM wind projects in China have actually increased in the last several years. This outcome is somewhat surprising as Chinese turbine costs have been decreasing, and suggests costs for CDM wind projects are for some reason not consistent with larger industry trends.
23 March 2010 37 He and Morse, PESD WP #90
23 March 2010 38 He and Morse, PESD WP #90
0
500
1000
1500
2000
2500
2002 2003 2004 2005 2006 2007 2008
Million RM
B
Figure 17. Total Subsides to Wind by Chinese Government. Source: Chinese Wind and Wind Tariff Development Report, 2009.
Absolute subsides for Chinese winds have increased dramatically. On a per-MW basis,
those subsidies have mostly decreased (see Figure 18).
0
0.05
0.1
0.15
0.2
0.25
0.3
0.35
0.4
0.45
2001 2002 2003 2004 2005 2006 2007 2008 2009
Million RM
B/MW
Figure 18. Total Subsides to Wind per Capacity by Chinese Government Source: Chinese Wind and Wind Tariff Development Report, 2009 and GWEC data for total 2009 installed wind capacity.


