Working Paper 287 - ICRIERicrier.org/pdf/Working_Paper_287.pdf · 1 Bilateral India-Pakistan...
44
Working Paper 287 Bilateral India-Pakistan Agricultural Trade: Trends, Composition and Opportunities Ramesh Chand Raka Saxena October 2014 INDIAN COUNCIL FOR RESEARCH ON INTERNATIONAL ECONOMIC RELATIONS
Transcript of Working Paper 287 - ICRIERicrier.org/pdf/Working_Paper_287.pdf · 1 Bilateral India-Pakistan...

1
Working Paper 287
Bilateral India-Pakistan Agricultural Trade:
Trends, Composition and Opportunities
Ramesh Chand
Raka Saxena
October 2014
INDIAN COUNCIL FOR RESEARCH ON INTERNATIONAL ECONOMIC RELATIONS

i
Table of Contents
Abstract ................................................................................................................................... iii
1. Backdrop ........................................................................................................................... 1
2. Data and Methodology ..................................................................................................... 2
3. Total Trade and Agricultural Trade between Pakistan and India .............................. 3
4. Trend and Composition of Indian Agricultural exports to Pakistan .......................... 5
5. Major Suppliers of Agricultural Products to Pakistan ............................................... 10
6. Trends and Composition of Indian Agricultural imports from Pakistan ................. 12
7. Share of Bilateral Trade in Total Trade ....................................................................... 14
8. Agricultural trade complementarily between India and Pakistan ............................ 15
9. Revealed Comparative Advantage ................................................................................ 16
10. Identifying Growth Opportunities ................................................................................ 18
11. Tariff and Non-Tariff Measures for India and Pakistan ............................................ 21
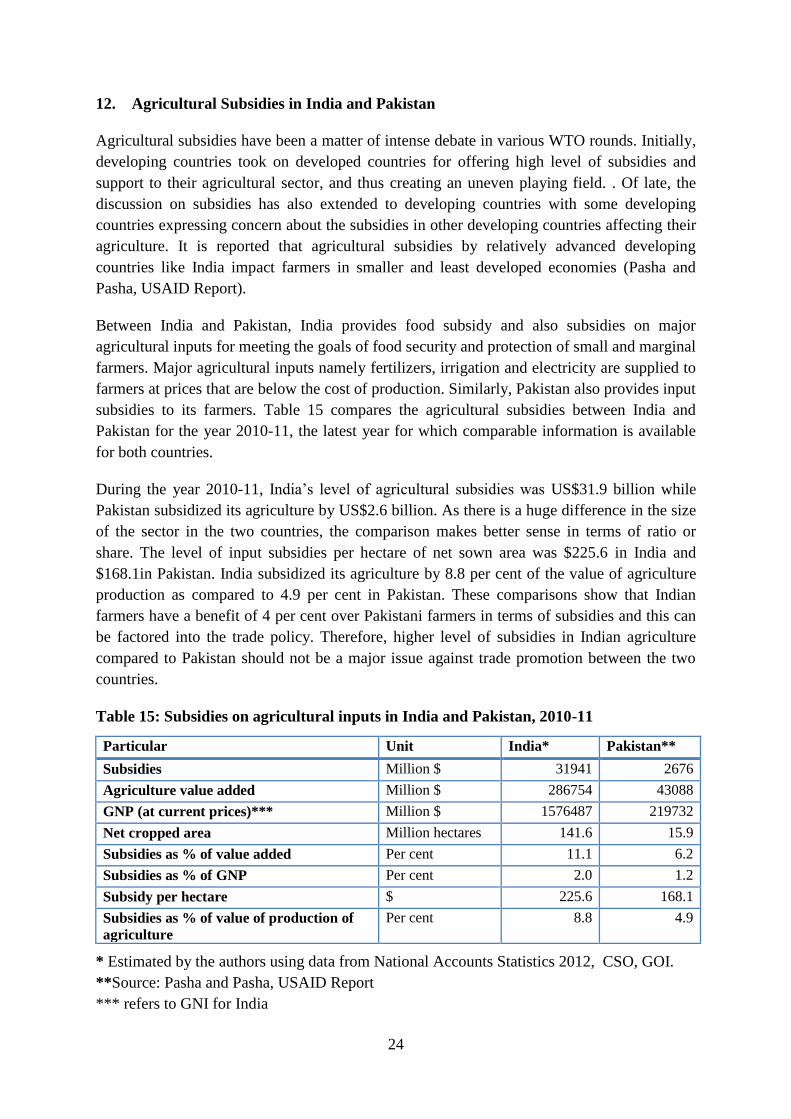
12. Agricultural Subsidies in India and Pakistan .............................................................. 24
13. Conclusions and Policy Implications ............................................................................ 25
References ............................................................................................................................... 27
Annexure I: List of Groups Covered in Agriculture .............................................................. 28
Annexure II : India’s major agricultural exports to Pakistan ($ million)) ............................. 29
Annexure III: India’s major agricultural imports from Pakistan ($ million) ......................... 30
Annexure IV: Pakistan's Tariff structure at HS 2 digit level .................................................. 31
Annexure V: India's Tariff structure at HS 2 digit level ........................................................ 33
Annexure VI: Non-Tariff Measures on Agricultural Commodities: Specific NTBs faced by
Indian Exporters in Pakistan ........................................................................... 35
Annexure VII: Non-Tariff barriers on Agricultural Commodities: Specific NTB's faced by
Pakistan’s Exporters in India .......................................................................... 37

ii
List of Tables and Figures
Table 1: Total and agricultural trade between India and Pakistan before and after SAFTA
implementation (Million $) ...................................................................................... 4
Table 2: Composition of Indian agricultural exports to Pakistan (%) ...................................... 8
Table 3: Growth trends in major exportable commodities to Pakistan ..................................... 9
Table 4: Pakistan’s imports of major agricultural commodities and major suppliers to
Pakistan, US$ 000 .................................................................................................. 11
Table 5: Composition of Indian agricultural imports from Pakistan (%) ............................... 12
Table 6: India’s imports of major agricultural commodities and major suppliers in Indian market,
US$ 000 ................................................................................................................... 13
Table 7: Growth trends in major exportable commodities of Pakistan .................................. 14
Table 8: RCA for major exportable commodities of India to Pakistan .................................. 17
Table 9: RCA for major exportable commodities of Pakistan to India .................................. 17
Table 10: India’s Agricultural Exports and Pakistan’s Imports (TE 2012-13, $Million) ....... 19
Table11: Pakistan’s Agricultural Exports and India’s Imports, TE 2012-13, $Million ......... 20
Table 12: Pakistan's Tariff structure for products identified as exportable from India to Pakistan ... 21
Table 13: India's Tariff structure for products identified as exportable from Pakistan to India ....... 22
Table 14: Indian and Pakistani sensitive list for agricultural commodities under SAFTA .... 23
Table 15: Subsidies on agricultural inputs in India and Pakistan, 2010-11 ............................ 24
Figure 1: India’s Trade (all commodities) with Pakistan (US $ million) ................................ 5
Figure 2: India’s Agricultural Trade with Pakistan (US $ million) ......................................... 6
Figure 3: India and Pakistan’s bilateral agricultural trade: share in total world agricultural trade of
two countries ..................................................................................................................... 15
Figure 4: Trade Complementarily Index for agricultural trade between India and Pakistan ............ 16

iii
Abstract
The paper examines the trend and composition of agricultural trade between Indian and
Pakistan and identifies opportunities for increasing bilateral trade. It examines the bilateral
agriculture trade before and after the implementation of SAFTA. The study also analyses the
comparative advantage and complementarities in agricultural trade between the two
countries. Despite the advantage of proximity, India and Pakistan did not trade much until the
late 1990s. Bilateral trade started expanding in the new century and picked up momentum
after SAFTA came into effect in 2006. Since then, agricultural exports from India to Pakistan
have grown at a faster rate than export of non-agricultural products. Trade in most of the
commodities show very large year-to-year variation and most of the trade took place to
stabilize fluctuations in the domestic market. Both countries have a comparative advantage
in the export of some commodities to each other. It is observed that despite implementation
of SAFTA, existence of tariff and non-tariff barriers continue to restrict agricultural trade
between the two countries.
_______________
JEL Classification: N55, F10, F13, F15, F50.
Keywords: India-Pakistan, agriculture trade, trade normalization, MFN, negative list
Authors Email: [email protected]
_________
Disclaimer: Opinions and recommendations in the paper are exclusively of the author and
not of any other individual or institution including ICRIER.

1
Bilateral India-Pakistan Agricultural Trade: Trends, Composition and Opportunities
Ramesh Chand and Raka Saxena1
1. Backdrop2
Trade among neighbouring nations has remained an important economic activity and has
played a significant role in the economic development of trading partners. The literature on
trade suggests that proximity is one of the major determinants of trade. Geographic proximity
is also used as an important explanation for regional trade groupings or blocs. Often, regional
economic relations are marred by historical hostility between neighbors, because of which
neighbouring countries trade less with each other than with more distant countries. Trade
between India and Pakistan is a classic case in this regard. Because of the historical hostility
between the two countries, not much progress has been achieved in increasing regional trade
in South Asia despite efforts to promote preferential trade (Chand 2006). The renowned
proponent of free, multilateral trade and an opponent of regional groupings, Jagdish
Bhagwati, cites the example of poor trade between India and Pakistan to refute the role of
geographic proximity in trade (Bhagwati 1993). However, history shows that neighborhood
hostility can check neighborhood trade for a long time, but not for ever. Eventually, trade
liberalisation prevails, even among hostile neighbours. One would expect trade to take place
based on inherent comparative and competitive advantages, but often, in case of sectors like
agriculture, trade occurs to meet the objectives of food security and achieving price stability.
At the time of partition, India accounted for about 70 per cent of Pakistan’s official trade
(Raihan and De, 2013). Ever since, political relations between the two countries have led to
frequent disruptions in trade. India granted the most favoured nation status to Pakistan after
the establishment of World Trade Organization in 1996.Pakistan is still in the process of
granting MFN status to India. The two countries have been trying to strengthen their bilateral
economic and trade relation despite these disruptions.
South Asia’s total trade has increased at a faster rate than the growth in world trade after
2005; however, trade within the South Asian bloc has increased at a lower rate than trade
with the rest of the world (Chand 2012). Studies suggest that deeper economic relations
between India and Pakistan would benefit not just the two countries but also the entire South
Asian region, leading, potentially, to a rise in economic growth and trade competitiveness in
the region. The study examines the trend and composition of agricultural trade between
Indian and Pakistan focusing on seven years before and after the implementation of SAFTA.
It discusses the effect of SAFTA in promoting agricultural trade between the two countries.
1 Ramesh Chand is Director at National Centre for Agricultural Economics and Policy Research, New Delhi and
Raka Saxena is Senior Scientist (Economics) at National Centre for Agricultural Economics and Policy
Research, New Delhi 2 This paper has been written as part of research studies conducted under the project “Strengthening Research
and Promoting Multi-level Dialogue for Trade Normalization between India and Pakistan” led by Dr. Nisha
Taneja. The author is thankful to reviewers for their comments.

2
The study also analyses the comparative advantage and trade complementarities in
agricultural trade between the two countries. Additionally, the paper compares the level of
subsidies given in agriculture in India and Pakistan in terms of their effect on fair trade. The
results of the study have been used to identify opportunities for agricultural trade between the
two countries.
2. Data and Methodology
The paper uses time series data on agricultural exports to Pakistan and agricultural imports
from Pakistan, which is taken from Export-Import Databank, Ministry of Commerce, and
Government of India. The data on Pakistan’s exports and imports to the World is taken from
International Trade Centre website. Information on tariff and non-tariff barriers was taken
from WTO, the respective Government websites and the MacMap website. Information
related to SAFTA was obtained from the SAARC Website. Other relevant data was obtained
from official, country specific sources. Theoretically, the value of export from country A to B
should be same as the value of import of country B from A. However, there is often a
mismatch between the two due to various reasons. In order to maintain consistency in trade
data, the imports from Pakistan to India are considered to be the same as Pakistan’s exports to
India.
The study uses time series data on trade for 17 years from 1996-97 to 2012-13. The choice of
the year 1996-97 was based on the consideration that this was the first year after the
constitution of the WTO, which marked a new beginning in agricultural trade liberalisation in
many developing countries. A major development related to trade in South Asia took place
with the formulation of South Asia Free Trade Agreement (SAFTA) which came into effect
in 2006. The study compares trade trends by dividing the relevant time period in two phases
i.e. before the formulation of SAFTA and after the formulation of SAFTA to assess its
influence on the trade flows between the two countries. Thus, 2006-7 was taken as the
benchmark year for analyzing trade trends between India and Pakistan. Trade trends during
2006-07 to 2012-13. This comparison was used to reveal the effect of the regional trade
agreement on bilateral agricultural trade. As the trade between the two countries fluctuates
from year to year, the trade data is presented as an average of triennium ending (TE).
The revealed comparative advantage, most commonly calculated by using the Balassa Index
(1965), indicates the relative advantage or disadvantage in major exportable commodities of
both the countries. The index is estimated as under:
RCAij = (Xij/Xi) / (Xwj/Xw)
Where,
RCAij =Revealed comparative advantage of ith country for jth commodity
Xij = ith country’s export of commodity j to world
Xi = ith country’s total exports to world

3
Xwj = World exports of commodity j
Xw =Total world exports
The revealed comparative advantage explains the position of a country with respect to global
trade levels and indicates how other competing countries are integrating themselves with
global trade.
The trade complementarily index was computed to assess the congruence in trade between
two nations. The index is given by the sum of the absolute difference between the import
share and the export share of the same commodity/category for one nation (exporting nation)
and the other (importing nation) for the considered commodity/category, divided by two. It
measures the degree to which the export pattern of one country (exporting country) matches
the import pattern of the other country (importing country). The index, converted in
percentage form, ranges from 0 to 100 and changes in the index over time indicate how
compatibility between the supply in partner country and the demand in the destination
country changes over time. An Index value of 0 indicates no match, while a value of 100
indicates a perfect match in import demand and export supply.
The trade complementarily index (TCI) for trade between India and Pakistan is estimated as
{1 − [𝛴𝑖(
𝛴𝑚𝑖𝑑𝛴𝑥𝑖𝑠𝛴𝑀𝑑𝛴𝑋𝑠
)
2]}*100
Where d is the importing country of interest, s is the exporting country of interest, i am the
set of commodities, x is the commodity export flow, X is the total export flow, m the
commodity import flow, and M the total import flow.
3. Total Trade and Agricultural Trade between Pakistan and India
The broad picture of total trade and total agricultural trade between India and Pakistan during
1996-97 to 2012-13, is presented in Table 1, while a list of selected items under the
agriculture category is provided in Annexure I. The trend in trade during the relevant before
and after the implementation of the SAFTA is explained in these tables. Since there were
yearly fluctuations in trade trends of the two countries, trade data is presented as triennium
averages. The total trade between India and Pakistan was $234 million during the late 1990s.
It increased to $610 million by TE 2005-06. There was a growth of almost 30% over the next
seven years in bilateral trade, which has now reached $2.3 billion. Trade flows between the
two countries show that India’s export to Pakistan remained far above Pakistan’s export to
India. During the seven years before SAFTA, Pakistan’s export to India shows a marginal
increase. In the seven years following SAFTA, Pakistan’s export to India rose by almost 4
times. India’s export to Pakistan after the implementation of SAFTA showed slightly lower
growth than its imports from Pakistan during the same period. However, due to the large
difference in the base in TE 2005-06, India’s net trade with Pakistan increased from $388
million to $1458 million.

4
Table 1: Total and agricultural trade between India and Pakistan before and after
SAFTA implementation (Million $)
Trade TE 1998/99 TE 2005/06 TE 2012/13
Total exports from India to Pakistan 135.5 499.1 1882.0
Total exports from Pakistan to India 98.4 110.7 424.0
Total trade 233.8 609.8 2306.0
Net Trade 37.1 388.3 1458.0
Agricultural Exports (India to Pakistan) 69.4 133.2 842.7
Agricultural Exports (Pakistan to India) 93.7 88.6 162.7
Total agricultural trade 163.1 221.8 1005.4
Net agricultural trade -24.3 44.6 680.0
Share of agricultural trade in total trade 69.8 36.4 43.6
Source: EXIM databank, Ministry of Commerce, Government of India.
Until the late 1990s, India and Pakistan traded a few non-agricultural commodities and 69.8
per cent of the total trade was in agricultural products. This dominance of agriculture
vanished during the next seven years, largely because of a sharp rise in non-agricultural
exports from India to Pakistan and partly because of a decline in agricultural exports from
Pakistan to India. Agriculture trade recovered some ground after 2005-06. Its share in total
trade increased from 36.4 per cent to 43.6 per cent. In volume, the trade between the two
countries in this sector increased from $221 million in 2005-06 to $842 million in TE 2012-
13. 85 per cent of this increase in agricultural trade was because of an increase in India’s
export to Pakistan and 15 per cent due to the increase in Pakistan’s exports to India. The
sluggish growth in Pakistan’s exports of agricultural products to India needs to be analyzed
by looking at supply side constraints in Pakistan’s agricultural sector.
The series of annual trade data of the two countries reveal some interesting patterns (Figure
1). Between 1996-97 and 2003-04, Indo-Pak trade did not increase much. However, in 2004-
05, the year when SAFTA was formulated, both India’s exports to Pakistan and Pakistan’s
exports to India increased significantly. In the next year, trade between the two countries
doubled. There was a further increase in bilateral trade in the year 2006-07 but the
momentum in trade seen during 2002-03 to 2006-07 could not be sustained in the subsequent
years, and SAFTA proved to be in the nature of a onetime gain.
From the data, it can be seen that India’s export to Pakistan has risen faster than India’s
imports from Pakistan for two years after the formulation of SAFTA. This resulted in net
trade favoring India to the tune of $1.66 billion in year 2007-8, which declined in subsequent
years except in 2010-11. It is also interesting to note that ever since the implementation of
SAFTA, Pakistan’s export to India increased from $323 million to $542 million during 2006-
7 to 2012-13, recording an increase of 67.8 per cent over six years, while India’s exports to
Pakistan in the same period increased by 56.4 per cent, from $1350 million to $2064 million.

5
Figure 1: India’s Trade (all commodities) with Pakistan (US $ million)
Source: EXIM databank, Ministry of Commerce, Government of India.
4. Trend and Composition of Indian Agricultural exports to Pakistan
SAFTA’s effect on India-Pakistan trade is much sharper on trade of agricultural goods as
compared to its effect on total trade (Figure 2 and Annexure I). India’s export of agricultural
products remained small till the year 2004-05 and followed a U-shaped trend during 1996-97
to 2004-05. Exports declined from $108 million to $26 million between 1996-97 and 1999-
2000 and then rose to $101 million in year 2003-04. In this period, Pakistan’s total exports to
India hovered around $40 million, except in the year 1998-99, when its exports reached $207
million – a record, which remained till the year 2012-13. Moreover, 1998-99 was the only
year when Pakistan’s exports to India exceeded its imports from India by a big margin.
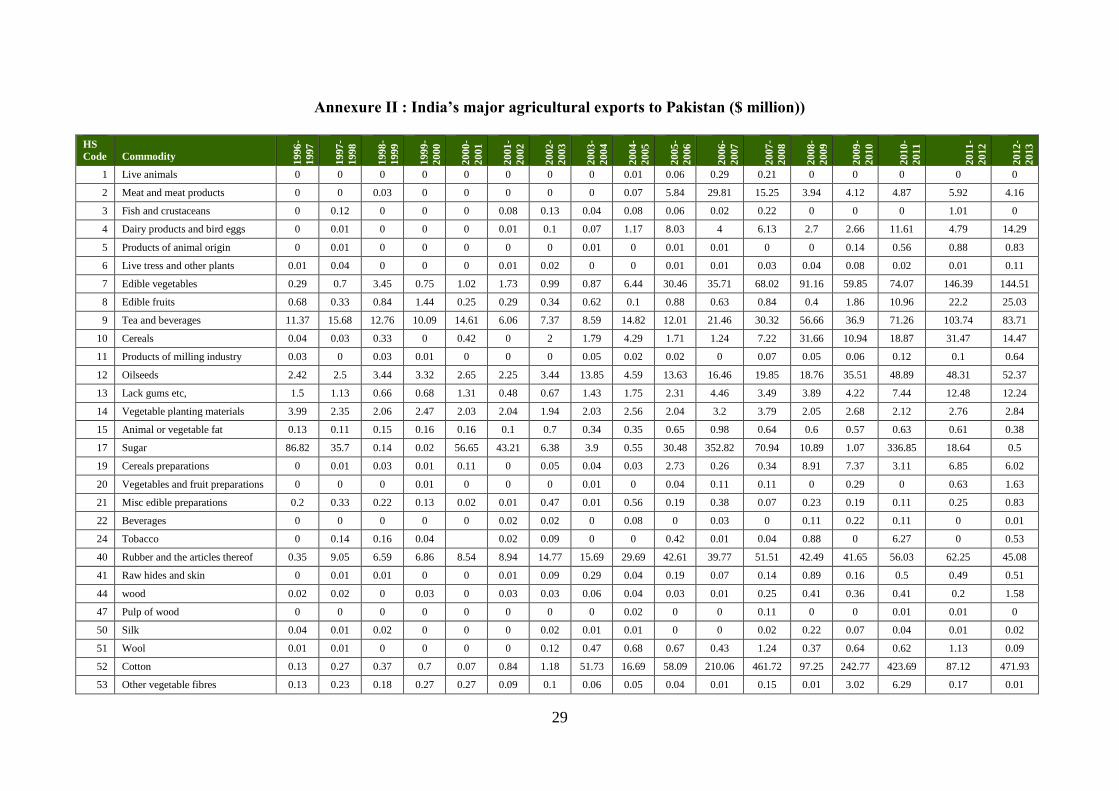
India’ agricultural exports to Pakistan started picking up in the year 2005-06 and have
increased substantially ever since. Exports increased three-and-a-half times to $722 million
in the year 2006-07. However, there was a break in this trend for three years, after which,
exports of agricultural products from India to Pakistan increased again and crossed the $ 1
billion mark. Thus, India’s exports to Pakistan have been characterized by a cyclical pattern
with an upward trend. Exports have increased to much higher levels since the implementation
of SAFTA.
India’s annual imports of agricultural products from Pakistan, (alternatively, Pakistan’s
annual agricultural exports to India) have ranged between $100 to $200 million since the year
2005-06, the period beginning with a decline in exports followed by an increase.
The sharp rise in India’s exports to Pakistan resulted in exports exceeding imports by more
than $500 million in year 2006-07. The gap declined to less than half in subsequent years and
again rose to another peak level of $ 969 million in 2010-11. The net trade pattern has been
12
1 99
-10
8
25
12
3 79
16
1
22
9
42
6
51
0
1,0
26
1,6
63
1,0
70
1,2
97
1,7
07
1,1
44
1,5
23
-500
0
500
1000
1500
2000
2500
Exports
Imports
Net trade

6
determined by the pattern of India’s agricultural exports to Pakistan because Pakistan’s
exports to India played a limited role in influencing it.
Agricultural trade trends between the two countries reveal a clear but one-time increase in
year 2006-07, the year in which the SAFTA agreement was implemented. After 2006-07,
agricultural exports from India to Pakistan remained higher than those from Pakistan to India
in all years but show a lot of variability. Agricultural imports from Pakistan, though small,
did not fluctuate as much as exports to Pakistan. It appears that a large part of India’s export
to Pakistan catered to stabilization of domestic supply in Pakistan. Such trade is usually not
based on strong comparative advantage but on climatic factors causing production
fluctuations in the destination country.
Figure 2: India’s Agricultural Trade with Pakistan (US $ million)
The composition of India’s agricultural exports to Pakistan during TE 1998-99 to TE 2005-06
and during TE 2005-06 to TE 2012-13 can be found in table 3The commodity composition of
export has undergone significant changes overtime as there has been export diversification.
During TE 1998-99, sugar and confectionery accounted for more than half the total
agricultural exports from India and close to one-fifth of exports consisted of coffee, tea, mate
and spices. These two groups accounted for almost 80 per cent of Pakistan’s agricultural
imports from India. Rubber and its article was the third important item of import with a 7.7
per cent share in India’s imports to Pakistan. Oilseeds accounted for 4 per cent while
vegetables, roots and tubers accounted for 2 per cent share in the export basket.
In the next seven years, sugar and sugar confectionary was relegated to the fifth position and
its share declined to less than 10 per cent. The volume of sugar and sugar confectionary
-400
-200
0
200
400
600
800
1000
1200
Agricultural Exports to Pakistan Agricultural Imports from Pakistan India's Net trade
After SAFTA Before SAFTA

7
imported by Pakistan from India declined from $40 million to $11.8 million between TE
1998-99 and TE 2005-06. Cotton emerged as a significant item of export from India to
Pakistan since the year 2003-04. During TE 2005-06, cotton, mainly lint, constituted 31 per
cent of India’s agricultural exports to Pakistan with an annual volume of $42 million. Rubber
and its articles ranked second, accounting for more than one-fifth of the total. Like sugar, the
share of coffee, tea, mate and spices also declined sharply. Vegetables emerged as an
important item of export to Pakistan, with an annual value of $12.6 million. Oilseeds like
soybean, groundnut and soy meal, vegetables seeds, and isabgul husk accounted for 7.9 per
cent of agricultural exports from India to Pakistan. Pakistan also started importing cereals like
maize and rice from India in the mid-2000s. Livestock products like meat and dairy produce
also figured as important Indian exports to Pakistan. Trade data, for the three-year period
ending 2012-13, reveals that cotton is now the dominant export item from India to Pakistan.
Cotton alone accounted for 38.8 per cent of total exports of agricultural products to Pakistan.
Year wise data show that cotton export dropped significantly in some years but the 3-year
average has remained quite high.
The volume of agriculture exports increased by more than six times during the seven year
period after 2005-06. Out of the total exports of $843 million during TE 2012-13, export of
cotton accounted for close to 40percent. It seems these imports are feeding into woven fabrics
and textile exports from Pakistan. This presents as an excellent example of a trade-led
agriculture industry link between India and Pakistan. Sugar is the second most important item
with a 14 per cent share and volume of $118 million. Export of edible vegetables, including
pulses, has increased since 2004-05; this includes export of tomatoes, onions and pulses. In
the year 2012-13, exports of these items crossed $144 million. Coffee, tea and spices, which
are traditional export items, accounted for 10 per cent of the total export while rubber and its
articles accounted for 6.5 per cent of export. Disaggregated data show that the growth in the
export of vegetable seeds, isabgul husk and groundnut has been robust and smooth. Other
important items figuring in export in recent years are milk and coconut.

8
Table 2: Composition of Indian agricultural exports to Pakistan (%)
HS
Code 2
digit
TE 1998/99 TE 2005/06 TE 2012/13
Total Agricultural Exports ($Million) 69.47 133.29 842.73
01 Live animals 0.00 0.03 0.00
02 Meat and meat products 0.04 2.20 0.59
03 Fish and crustaceans 0.09 0.04 0.12
04 Dairy products and bird eggs 0.01 2.30 1.21
05 Products of animal origin 0.01 0.00 0.09
06 Live trees and other plants 0.02 0.00 0.01
07 Edible Vegetables 2.13 9.35 14.42
08 Fruits 0.89 0.40 2.30
09 Tea and beverages 19.09 8.77 10.22
10 Cereals 0.19 1.93 2.56
12 Oilseeds 4.01 7.94 5.91
13 Lac, gums etc. 1.58 1.36 1.27
14 Vegetable planting material 4.03 1.64 0.31
15 Animal or vegetable fat 0.19 0.33 0.06
17 Sugar 58.81 8.65 14.07
19 Cereal preparations 0.02 0.69 0.63
20 Vegetable and fruit preparations 0.00 0.01 0.09
21 Misc. edible preparations 0.36 0.19 0.05
22 Beverages 0.00 0.06 0.01
24 Tobacco 0.14 0.31 0.27
40 Rubber and articles 7.67 21.79 6.46
41 Raw hides and skins 0.01 0.13 0.06
51 Wool 0.01 0.45 0.07
52 Cotton 0.37 31.33 38.84
53 Other vegetable fibres 0.26 0.04 0.26
Others items (11,44,47,50) 0.08 0.06 0.12
Source: EXIM databank, Ministry of Commerce, Government of India.
The growth rate in export of major items (measured in US dollars) during 1996 to 2004 is
presented in Table 3. During the eight year period before SAFTA, the export of more than
half the products on this list either declined or registered zero growth. These include milk,
egg, pulses, vegetables, coconut, spices, coarse cereals, groundnut and sugar. The remaining
items like tomato, rice, plants and parts of plants, vegetable seeds, rubber and cotton
registered positive growth. Between 2004-05 and 2012-13, all 21 products included in the
table except sugar showed a positive trend. Further, except rubber tyres and tubes, the annual
growth rate was more than 18 per cent for all the items.

9
Table 3: Growth trends in major exportable commodities to Pakistan
HS Code
4 digits
Commodity Compound Annual Growth
Rates %
Change in growth
1996 to 2004 2004 to 2012
0402 Milk and cream 0.00 23.38
0407 Bird eggs 0.00 18.23
0713 Dried leguminous vegetables -10.12 28.81
0702 Tomatoes 13.08 96.63
0703 Onion and other vegetables -14.85 28.66
0801 Coconut and other nuts -25.27 99.42
0902 Tea and beverages 37.09 29.26
0904 Pepper -31.07 85.09
0908 Nutmeg and spices -1.28 28.70
1006 Rice 46.38 24.54
1007 Grain sorghum -29.82 87.98
1008 Buckwheat and other cereals -26.44 115.22
1211 Plants and parts of plants 5.34 26.08
1209 Seeds and planting material 2.37 24.75
1202 Groundnuts -14.83 77.08
1701 Cane/beet sugar -21.85 -5.29
4011 Rubber tyres 46.51 3.37
4013 Rubber tubes 7.08 1.45
5201 Cotton 59.84 31.79
5205 Cotton yarn 45.91 34.99
5209 Woven fabrics 14.13 28.46
Due to very high year-to-year fluctuation in the export of some items, the growth rates do not
reveal the true picture of exports, particularly the case when exports cater to ensuring stability
in domestic supply. For Instance, India’s export of sugar to Pakistan has been significant in
some years like 2006-07 and 2010-11, when the export volume exceeded $335 million. As
very little was exported in other years, this trend growth rate is misleading. Therefore, we do
not place much weight on trend growth rate statistics for such items.
10
5. Major Suppliers of Agricultural Products to Pakistan
In order to assess India’s position in meeting import demand from Pakistan, this paper
identifies major overseas suppliers of agricultural products to Pakistan. Table 4 presents data
on agricultural import of major items by Pakistan from the world during TE 2004-5 and TE
2012-13 along with the share of top 5 exporting countries. Cotton has been the major item of
import by Pakistan and its volume has increased from $455 million during TE 2004-5 to $716
million in TE 2012/13. India is the largest supplier of raw cotton (carded or combed) as well
as cotton yarn. Tea and beverages are the second most important items imported by Pakistan.
Kenya meets 61 per cent and India meets one-tenth of the import demand for tea in Pakistan.
In case of dried leguminous vegetables, i.e., pulses, India meets one-tenth of Pakistan’s
imports. In the case of fresh vegetables like tomatoes and onions, India is the major overseas
supplier for Pakistan. Similarly, for plant and parts of plants, close to 80 per cent of the total
import demand is met from India. Pakistan’s import of milk and cream has increased sharply,
touching $88 million during TE 2012-13. This demand is met by imports from the USA and
Europe and India does not figure among the top five suppliers to Pakistan. Surprisingly, India
also does not figure among the top five suppliers of sugar, although it exports sugar to many
countries. Pakistan’s sugar import is quite sizable with half of import supply coming from
Malaysia. This is one area where India can push its exports. Pakistan imports small quantities
of coarse cereal, which is met almost entirely by India. India also meets half of Pakistan’s
groundnut import demand. The trend in Pakistan’s imports indicate that India has not been
able to take advantage of the growth in imports of many items such as milk, cream, sugar,
pulses, and tea and beverages. The commodities whose imports from India show a large
increase are tomatoes, onions, and other vegetables, pepper, seeds, and planting material and
cotton.

11
Table 4: Pakistan’s imports of major agricultural commodities and major suppliers to
Pakistan, US$ 000
HS
Code
TE 2004/05 TE
2012/13
Top Suppliers to Pakistan and their share %(2012)
0402 Milk and cream 13391 88381 USA (34.5), New Zealand (16.7), Germany (12.7),
Lithuania (10.6), France (6.2)
0407 Bird eggs 374 2759 USA (17.1), Germany (10.9), France (8.5), Jordan
(6.5), United Kingdom (1.5)
0702 Tomatoes 45 77728 India (97.9), Afghanistan (1.9), Iran (Islamic Republic
of) (0.2)
0703 Onion and other
vegetables
22107 72115 India (56.2), China (30.5), Afghanistan (12.9), Iran
(Islamic Republic of) (0.1), Iceland (0.1)
0713 Dried
leguminous
vegetables
105810 390160 Australia (31), Myanmar (11.1), India (10.8), Ethiopia
(8.8), Canada (7.4)
0801 Coconut and
other nuts
7529 9032 Sri Lanka (64.5), Malaysia (10), Vietnam (7.8), India
(7.1), Thailand (7)
0902 Tea and
beverages
207398 338359 Kenya (61.2), India (9.9), Rwanda (6), Sri Lanka
(4.3), Viet Nam (4.2)
0904 Pepper 7199 22657 India (49.4), Viet Nam (29.2), Sri Lanka (9.7), Brazil
(5.8), Indonesia (2.5)
0908 Nutmeg and
spices
7935 9961 Guatemala (71.6), India (19.2), Indonesia (5.5), Sri
Lanka (3.1), China (0.4)
1006 Rice 1455 35052 China (66.1), USA (29.6), Sri Lanka (2), Philippines
(1.6), India (0.4)
1007 Grain sorghum 115 2282 India (100)
1008 Buckwheat and
other cereals
157 3918 India (72.7), Ukraine (22.9), Canada (2.1), Australia
(1.5), China (0.6)
1202 Groundnuts 1746 6836 India (50.4), China (44.1), United Republic of
Tanzania (3.8), Madagascar(0.9), Kenya (0.3)
1209 Seeds and
planting
material
20298 57418 India (36.6), Egypt (26.9), USA (9.2), China (6.5),
Thailand (4.7)
1211 Plants and parts
of plants
3251 6016 India (79.6), Afghanistan (5.8), Ethiopia (3), Iran
(2.9), Syrian Arab Republic (1.9)
1701 Cane/beet sugar 153163 302262 Malaysia (54.3), United Arab Emirates (17.8), Saudi
Arabia (11.2), Germany (5.9), United Kingdom (3.1)
4011 Rubber tyres 111252 196561 China (62.6), India (10.4), Thailand (9.3), Japan (7.2),
Indonesia (2.6)
4013 Rubber tubes 3199 3421 China (62.4), India (22.2), Thailand (2.9), Indonesia
(2.7), Korea (2.6)
5201 Cotton 455467 716636 India (28.6), USA (21.1), Brazil (19.1), Afghanistan
(12.1), Egypt (6.4)
5205 Cotton yarn 8178 26611 India (71.2), China (12.9), Egypt (8.8), Turkmenistan
(4.4), Bangladesh (0.7)
5209 Woven fabrics 3556 9501 China (61.2), Hong Kong (7.2), India (5.6), Turkey
(4.8), Bahrain (4.4)
Source: www.intracen.org

12
6. Trends and Composition of Indian Agricultural imports from Pakistan
India imported agricultural items from Pakistan worth $94 million in the late 1990s (Table 5).
In the next seven years, the volume of India’s import from Pakistan dropped to $88.6 million
but recovered after the implementation of the SAFTA agreement in the year 2006. Pakistan’s
agricultural exports to India were dominated by a few commodities. In the late 1990s, sugar
and confectionery accounted for 69 per cent of India’s agricultural imports from Pakistan.
The share of sugar dropped to 14.6 per cent in the mid-2000s and has been shrinking ever
since, with Pakistan remaining a large net importer of sugar. Edible fruits and nuts emerged
as India’s largest import item from Pakistan, accounting for 48.4 per cent of total agricultural
imports. This mainly consists of dates. The second most important item in recent years has
been cotton fabric and textiles having a 30 per cent share in total agricultural imports. Annual
import data shows that India imported fruits worth $92.5 million and cotton fabric and
textiles worth $60 million in the year 2012-13 (Annexure II). The import of raw hides and
skins has been over $11 million for a couple of years. Annual import data also shows a
consistent increase from 2008-09 onward, which increased the value of India’s imports from
Pakistan from $107 million to $196 million in 2012-13.
Table 5: Composition of Indian agricultural imports from Pakistan (%)
HS
Code 2
digit
TE 1998/99 TE 2005/06 TE 2012/13
Total Agricultural Imports from
Pakistan ($ Million) 93.73 88.64 162.7
03 Fish and crustaceans 0.00 0.26 0.70
05 Products of animal origin 0.00 0.01 0.06
07 Edible Vegetables 0.52 36.98 2.16
08 Fruits 24.58 23.02 48.40
09 Tea and beverages 0.51 1.30 1.05
12 Oilseeds 1.24 1.42 2.55
13 Lac, gums etc 1.07 1.32 0.84
14 Vegetable planting material 0.01 0.02 0.01
15 Animal or vegetable fat 0.00 0.00 0.34
17 Sugar 69.22 14.59 1.38
19 Cereal preparations 0.00 0.00 0.01
20 Vegetable and fruit
preparations 0.00 0.00 0.38
21 Misc edible preparations 0.00 0.01 0.04
41 Raw hides and skins 1.02 1.31 7.43
51 Wool 1.44 2.12 5.22
52 Cotton 0.37 17.63 29.35
53 Other vegetable fibres 0.00 0.00 0.06
13
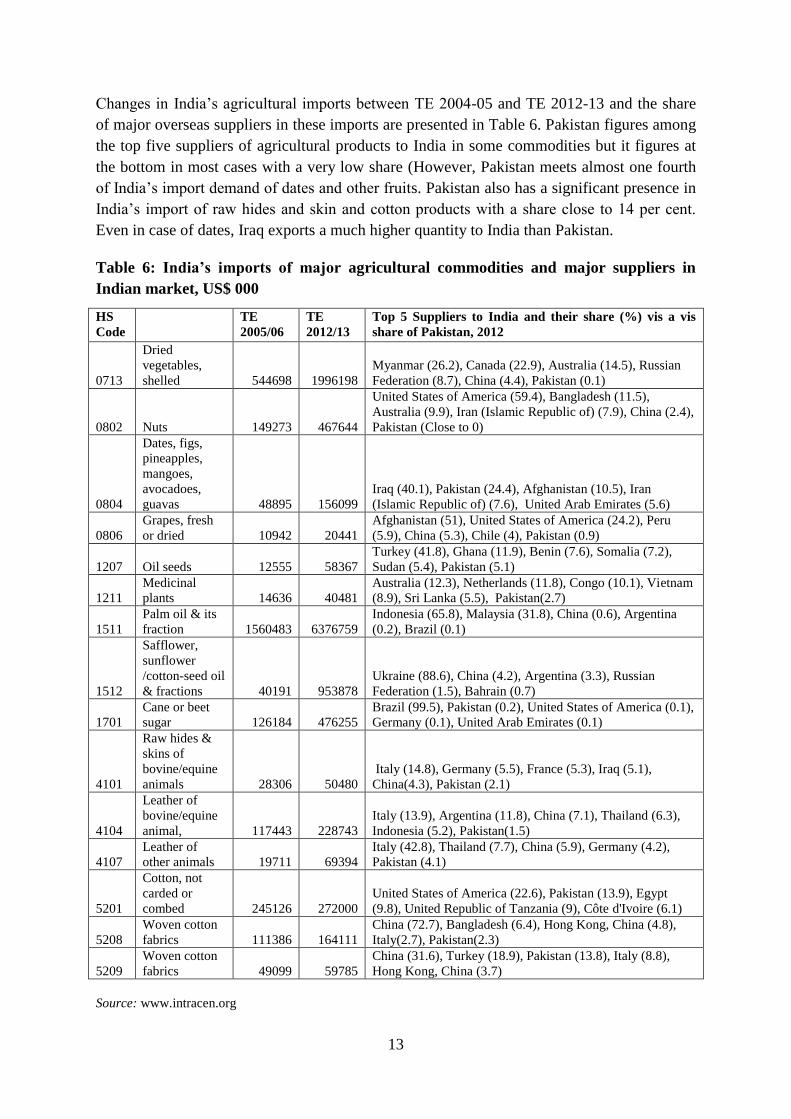
Changes in India’s agricultural imports between TE 2004-05 and TE 2012-13 and the share
of major overseas suppliers in these imports are presented in Table 6. Pakistan figures among
the top five suppliers of agricultural products to India in some commodities but it figures at
the bottom in most cases with a very low share (However, Pakistan meets almost one fourth
of India’s import demand of dates and other fruits. Pakistan also has a significant presence in
India’s import of raw hides and skin and cotton products with a share close to 14 per cent.
Even in case of dates, Iraq exports a much higher quantity to India than Pakistan.
Table 6: India’s imports of major agricultural commodities and major suppliers in
Indian market, US$ 000
HS
Code
TE
2005/06
TE
2012/13
Top 5 Suppliers to India and their share (%) vis a vis
share of Pakistan, 2012
0713
Dried
vegetables,
shelled 544698 1996198
Myanmar (26.2), Canada (22.9), Australia (14.5), Russian
Federation (8.7), China (4.4), Pakistan (0.1)
0802 Nuts 149273 467644
United States of America (59.4), Bangladesh (11.5),
Australia (9.9), Iran (Islamic Republic of) (7.9), China (2.4),
Pakistan (Close to 0)
0804
Dates, figs,
pineapples,
mangoes,
avocadoes,
guavas 48895 156099
Iraq (40.1), Pakistan (24.4), Afghanistan (10.5), Iran
(Islamic Republic of) (7.6), United Arab Emirates (5.6)
0806
Grapes, fresh
or dried 10942 20441
Afghanistan (51), United States of America (24.2), Peru
(5.9), China (5.3), Chile (4), Pakistan (0.9)
1207 Oil seeds 12555 58367
Turkey (41.8), Ghana (11.9), Benin (7.6), Somalia (7.2),
Sudan (5.4), Pakistan (5.1)
1211
Medicinal
plants 14636 40481
Australia (12.3), Netherlands (11.8), Congo (10.1), Vietnam
(8.9), Sri Lanka (5.5), Pakistan(2.7)
1511
Palm oil & its
fraction 1560483 6376759
Indonesia (65.8), Malaysia (31.8), China (0.6), Argentina
(0.2), Brazil (0.1)
1512
Safflower,
sunflower
/cotton-seed oil
& fractions 40191 953878
Ukraine (88.6), China (4.2), Argentina (3.3), Russian
Federation (1.5), Bahrain (0.7)
1701
Cane or beet
sugar 126184 476255
Brazil (99.5), Pakistan (0.2), United States of America (0.1),
Germany (0.1), United Arab Emirates (0.1)
4101
Raw hides &
skins of
bovine/equine
animals 28306 50480
Italy (14.8), Germany (5.5), France (5.3), Iraq (5.1),
China(4.3), Pakistan (2.1)
4104
Leather of
bovine/equine
animal, 117443 228743
Italy (13.9), Argentina (11.8), China (7.1), Thailand (6.3),
Indonesia (5.2), Pakistan(1.5)
4107
Leather of
other animals 19711 69394
Italy (42.8), Thailand (7.7), China (5.9), Germany (4.2),
Pakistan (4.1)
5201
Cotton, not
carded or
combed 245126 272000
United States of America (22.6), Pakistan (13.9), Egypt
(9.8), United Republic of Tanzania (9), Côte d'Ivoire (6.1)
5208
Woven cotton
fabrics 111386 164111
China (72.7), Bangladesh (6.4), Hong Kong, China (4.8),
Italy(2.7), Pakistan(2.3)
5209
Woven cotton
fabrics 49099 59785
China (31.6), Turkey (18.9), Pakistan (13.8), Italy (8.8),
Hong Kong, China (3.7)
Source: www.intracen.org

14
The trend growth rates of India’s import of major agricultural commodities during 1996-97 to
2004-05 and during 2004-05 to 2012-13 are presented in Table 7. Dates and other fruits,
which are the major items of India’s import from Pakistan, showed an annual decline of 6 per
cent for the eight year period ending in 2004-05. Thereafter, these imports increased at 16.7
per cent every year. A similar pattern is observed in the import of grapes. The import of
pulses, although small, showed a sharp rise before 2004-05 followed by a sharp decline
thereafter. The import of raw hide and skin and cotton products (fabric and textile) registered
a high rate of growth in both periods.
Table 7: Growth trends in major exportable commodities of Pakistan
HS
Code
4 digit
Commodity Compound Annual Growth
Rates
Direction of
growth
1996 to 2004 2004 to 2012
0713 Dried leguminous vegetables 77.98 -20.12
0804 Dates and other fruits -5.93 16.68
0806 Grapes -7.48 12.59
0802 Nuts -26.44 -2.88
1207 Oilseeds 5.04 5.67
1211 Plants and parts of plants -0.92 7.18
1701 Cane/beet sugar -26.76 13.86
4107 Leather -6.28 57.23
4104 Tanned/crust hides and skins -11.47 32.84
4101 Raw hides and skins 13.46 29.74
5201 Cotton 9.09 45.15
5209 Woven fabrics 26.47 2.96
5208 Woven fabrics 73.15 -7.96
7. Share of Bilateral Trade in Total Trade
Although agricultural trade between the two countries has been increasing, the share of
bilateral trade in the total trade with the world remained quite low for both the countries.
However, Indo-Pak trade increased much faster than each country’s trade with the rest of the
world during 2003 to 2006. After 2006, Indo-Pak trade could not keep pace with their trade
with the rest of the world (Fig 3). India’s agricultural trade with Pakistan constituted 0.59 per
cent of its total agricultural trade with all countries in 2003. The share steadily increased to
3.09 per cent by 2006. These gains were lost in the subsequent periods and the share of
India’s trade with Pakistan declined to 1.40 per cent in 2009 and 1.00 per cent of its total
agricultural trade by the year 2012. Pakistan’s trade with India presented a somewhat better
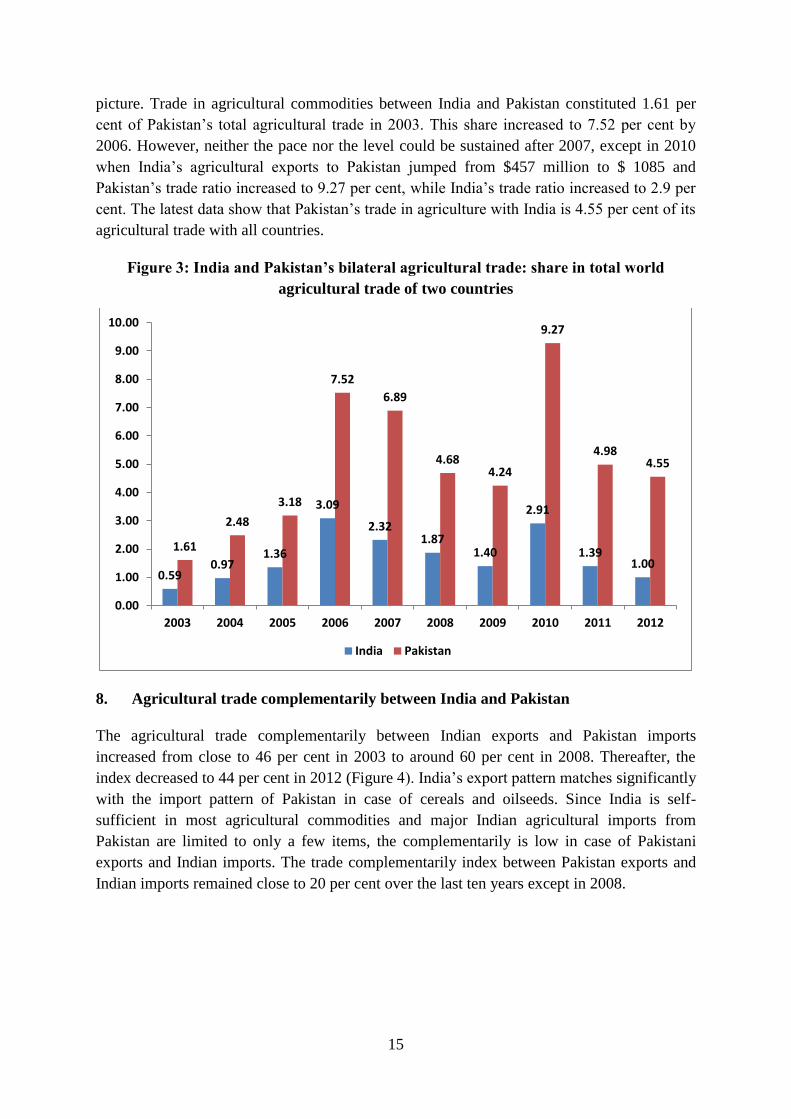
15
picture. Trade in agricultural commodities between India and Pakistan constituted 1.61 per
cent of Pakistan’s total agricultural trade in 2003. This share increased to 7.52 per cent by
2006. However, neither the pace nor the level could be sustained after 2007, except in 2010
when India’s agricultural exports to Pakistan jumped from $457 million to $ 1085 and
Pakistan’s trade ratio increased to 9.27 per cent, while India’s trade ratio increased to 2.9 per
cent. The latest data show that Pakistan’s trade in agriculture with India is 4.55 per cent of its
agricultural trade with all countries.
Figure 3: India and Pakistan’s bilateral agricultural trade: share in total world
agricultural trade of two countries
8. Agricultural trade complementarily between India and Pakistan
The agricultural trade complementarily between Indian exports and Pakistan imports
increased from close to 46 per cent in 2003 to around 60 per cent in 2008. Thereafter, the
index decreased to 44 per cent in 2012 (Figure 4). India’s export pattern matches significantly
with the import pattern of Pakistan in case of cereals and oilseeds. Since India is self-
sufficient in most agricultural commodities and major Indian agricultural imports from
Pakistan are limited to only a few items, the complementarily is low in case of Pakistani
exports and Indian imports. The trade complementarily index between Pakistan exports and
Indian imports remained close to 20 per cent over the last ten years except in 2008.
0.590.97
1.36
3.09
2.321.87
1.40
2.91
1.391.00
1.61
2.48
3.18
7.52
6.89
4.684.24
9.27
4.984.55
0.00
1.00
2.00
3.00
4.00
5.00
6.00
7.00
8.00
9.00
10.00
2003 2004 2005 2006 2007 2008 2009 2010 2011 2012
India Pakistan

16
Figure 4: Trade Complementarily Index for agricultural trade between India and
Pakistan
The trend in trade complementarily index explains why India’s exports to Pakistan have seen
higher growth than Pakistan’s exports to India. Pakistan’s import demand largely matches the
export supply of India whereas India’s import demand does not match too much with
Pakistan’s export supply.
9. Revealed Comparative Advantage
The pattern of RCA was examined at the HS 4-digit level for the last 10-12 years to
understand its movement over time. An RCA index value of greater than one indicates a
revealed comparative advantage in that product. Table 8 provides the estimates of RCA for
major Indian commodities being exported to Pakistan. Tea has been a traditional Indian item
of export, but analysis of its RCA, indicates declining comparative advantage over time even
though its value remains greater than unity. In case of raw cotton, there was a significant
increase in RCA after the adoption of Bt cotton technology in India. Trade in other
commodities like pulses and tomatoes seem to have risen due to neighborhood factors and
due to domestic stability concerns.
45.68
59.12
52.94 52.48
57.0360.31
53.8350.74
49.91
44.16
19.22 18.51 19.3722.13
30.30
20.7117.49 16.05 16.64
19.23
0.00
10.00
20.00
30.00
40.00
50.00
60.00
70.00
2003 2004 2005 2006 2007 2008 2009 2010 2011 2012
For Indian ag exports to Pakistan For Indian ag imports from Pakistan

17
Table 8: RCA for major exportable commodities of India to Pakistan
Year 0902 Tea 5201
Cotton
0713 Dried
leguminous
vegetables
0702
Tomatoes
1701
Cane/beet
sugar
2001 8.35 0.10 1.61 0.01 1.94
2002 7.34 0.07 1.56 0.04 1.77
2003 6.77 0.29 1.66 0.02 2.49
2004 7.02 1.07 2.04 0.02 0.3
2005 6.27 1.97 3.92 0.01 0.16
2006 5.55 4.92 2.68 0.08 1.86
2007 5.12 7.65 1.44 0.16 2.99
2008 5.19 7.31 0.72 0.24 3.89
2009 5.84 6.87 0.62 0.25 0.09
2010 5.01 9.17 1.15 0.14 1.34
2011 4.88 6.39 1.05 0.40 2.09
2012 3.51 5.92 0.7 0.22 1.94
Table 9 provides the RCA for major commodities being exported by Pakistan to India. Due to
the climatic factors, Pakistan has an inherent and sustained comparative advantage in case of
dates. The greatest comparative advantage lies in the exports of cotton textiles and woven
fabrics. Both countries have integrated themselves in creating a value chain, in which India is
exporting raw staple cotton to Pakistan and buying value added textiles and fabrics from it.
Similar customer taste and preferences for the fabrics/textiles and designs in the neighbouring
states of Punjab and Kashmir have further enhanced the cotton trade between the two
countries.
Table 9: RCA for major exportable commodities of Pakistan to India
Year 0804
Dates
etc
5201
Cotto
n
5209
Woven
fabrics
5208
Woven
fabrics
4107
Leathe
r
4104
Leather
of bovine
1701
Cane or
beet
sugar
2003 3.15 1.02 1.01 11.02 0.02 3.7 0.43
2004 3.18 1.42 1.67 8.65 0.12 3.78 0.32
2005 2.54 1.24 1.6 9.25 0.01 3.84 0.28
2006 2.34 0.85 4.06 8.93 0.19 3.15 0.14
2007 2.7 0.76 7.41 9.34 0.54 3.38 0.01
2008 2.29 1.79 10.22 9.55 1.41 1.08 0.84
2009 3.08 3.65 13.46 8.5 1.68 0.87 0.02
2010 2.49 2.4 14.81 7.87 2.45 0.52 0.01
2011 2.66 2.71 16.18 7.78 2.45 0.13 0.01
2012 3.15 3.01 19.98 7.97 2.72 0.26 0.82

18
10. Identifying Growth Opportunities
There are two types of opportunities to expand agricultural trade between the two countries –
one, by replacing existing trade with a third country and second through trade creation. The
neighborhood factor, as in the case of India and Pakistan, favors both. The opportunities to
expand bilateral trade by efficiently replacing third country trade can be identified by looking
at the export volume of country “A” to the world, import volume of country “B” from the
world and from country “A” and vice versa. Table 10 presents’ opportunities for export from
India to Pakistan and Table 11 presents f opportunities for export from Pakistan to India.
It can be observed from Table 10 that there is no scope for expanding exports of a few items
from India to Pakistan, although these are items of large export from India. For instance,
India exports meat and meat products worth $2720 million and Pakistan’s total import of this
item is $5.0 million. Since all of Pakistan’s export demand for this product is already met by
India, this implies no further scope for expanding exports by substituting third country
exports. In contrast to this, dairy products and eggs present with a significant export potential
to Pakistan. Pakistan’s import demand for dairy products and eggs is $114 million and it
meets less than one tenth of it from India, despite the fact that India’s export volume is 2.5
times the import demand in Pakistan. Similarly, an opportunity exists for promoting oilseeds
exports from India to Pakistan; the latter imports oilseeds worth $645 million, which is less
than 40 per cent of India’s exports of oilseeds. Like dairy products and eggs, Pakistan meets
less than one tenth of its oilseeds imports from India. Additionally, there is a much stronger
case for promoting cotton export from India to Pakistan. It emerges from Table 10 that,
except meat and meat products, there is a vast scope for India to promote agricultural exports
to Pakistan by taking advantage of the neighborhood factor, which gives it an edge over rest
of the world.

19
Table 10: India’s Agricultural Exports and Pakistan’s Imports (TE 2012-13, $Million)
Product India's Exports
to the world
Pakistan's
Imports from
India
Pakistan's
Imports
from world
Live animals 11.9 0.0 15.7
Meat and meat products 2720.4 4.2 4.9
Fish and crustaceans 2976.7 1.0 4.0
Dairy products and eggs 289.1 11.5 114.1
Products of animal origin 134.5 0.7 2.6
Live trees and plants of parts 73.0 0.0 1.4
Vegetables, roots and tubers 981.1 121.7 554.8
Fruits and nuts 1355.4 19.4 125.4
Tea and spices 2662.4 86.2 433.5
Cereals 6424.8 21.6 87.1
Oilseeds 1660.3 49.9 644.9
Lac gums etc 2951.5 10.7 10.7
Vegetable planting material and prod. 62.4 2.6 18.8
Animal or vegetable fats 937.6 0.5 2251.5
Sugar and sugar confectionery 1698.0 118.7 323.6
Cereal preparations 357.6 5.3 79.3
Vegetable, fruits and nuts prep 345.7 0.8 28.6
Misc edible preparations 437.7 0.4 48.4
Tobacco and tobacco products 877.6 2.3 16.4
Raw hides and skins 990.0 0.5 92.1
Wool and other products 184.1 0.6 15.5
Cotton 8261.6 327.6 808.1
Other vegetable textile fibres 364.4 2.2 67.8
Opportunities for Pakistan to promote its export to India are captured in the information
presented in Table 11. India imported raw hides and skins worth $515 million during TE
2012-13; only 2.5 per cent of this import was from Pakistan, although Pakistan’s exports of
raw hides and skins was large enough to meet 87 per cent of the demand in India.

20
Table11: Pakistan’s Agricultural Exports and India’s Imports, TE 2012-13, $Million
Item Pakistan's
Exports to world
India's
Imports from
Pakistan
India's Imports
from world
Live animals 23.0 0.0 10.0
Meat and meat products 166.7 0.0 1.6
Fish and crustaceans 261.4 1.1 83.1
Dairy products and eggs 71.4 0.0 157.0
Products of animal origin 48.0 0.1 39.7
Live trees and plants of parts 1.1 0.0 19.9
Vegetables, roots and tubers 189.0 3.5 2030.7
Fruits and nuts 304.3 78.7 1882.4
Tea and spices 57.8 1.7 432.8
Cereals 2382.6 0.0 32.8
Oilseeds 57.7 4.2 202.3
Lac gums etc 97.8 1.4 135.5
Vegetable planting material and
products
6.4 0.0 10.1
Animal or vegetable fats 166.4 0.6 9219.4
Sugar and sugar confectionery 136.0 2.3 486.5
Cereal preparations 40.6 0.0 40.7
Vegetable, fruits and nuts preparations 50.6 0.6 72.4
Misc edible preparations 19.6 0.1 108.1
Tobacco and tobacco products 25.2 0.0 36.8
Raw hides and skins 447.0 12.1 515.8
Wool and other products 11.7 8.5 399.1
Cotton 4778.7 47.8 572.0
Other vegetable textile fibres 4.8 0.2 251.9
Unlike India, Pakistan has limited opportunities to promote agricultural exports to India
because its export surplus matches India’s import needs only for a few commodities.
Pakistan’s major agricultural export is cereals and India itself is a large exporter of cereals.
Where India is in deficit, Pakistan is not in surplus. Therefore, the scope for Pakistan to
replace third country export to India is limited. However, Pakistan can take advantage of
rapid diversification of demand for several products in India, for instance, the expanding
demand for different varieties of fruits and vegetables. This will, of course, require
addressing supply side factors in Pakistan.
The paper also looks at opportunities for trade in farm inputs like fertilizer, farm machinery,
diesel oil and seed, which are tradable inputs for the agriculture sector. India imported
fertilizers worth $7.5 billion in TE 2012-13. Pakistan also imported fertilizers worth $0.8
billion in TE 2012-13. Fertilizer imports in both countries increased until 2011, but declined
thereafter. Further, both the countries import farm machinery, especially tractors, and diesel
oil. Thus, there are hardly any prospects of trade in these farm inputs between the two
countries.
However, there are opportunities in seed trade although these have not been properly
harnessed due to a variety of protection related issues and other non-tariff measures.

21
11. Tariff and Non-Tariff Measures for India and Pakistan
The previous section identified a number of opportunities for trade between India and
Pakistan. However, trade policies between the two countries restrict and create hindrance in
the movement of goods across borders. To address this, the two countries have agreed to
simplify their trade procedures and facilitate the flow of goods between them.
SAFTA was signed in 2004 to enhance and facilitate trade among South Asian countries and
reduce customs duties on all traded goods to zero by the year 2016. The agreement came into
force on January 1, 2006, and requires India, Pakistan and Sri Lanka (the developing
countries) in South Asia to bring their duties down in the form of annual cuts, until they are
reduced to zero. Besides the reduced tariff limits under South Asian Free Trade Area
(SAFTA), efforts are also being made to reduce non-tariff barriers.
The tariff structures for Pakistan and India were examined at the disaggregated product level
and are given in Table 12 and Table 13. The tariff structure for commodity groups at the HS
2-digit level are given in Annexure IV and V. SAFTA provisions indicated that the tariffs
would be reduced to 05 per cent with effect from January 1, 2013, for all products other than
those on the sensitive list. An analysis of changes in the protection level for agricultural
commodities traded between India and Pakistan reveals that the applied tariff rates were
significantly high for most of the traded agricultural commodities until 2011. But after the
implementation of SAFTA, tariffs have been reduced and brought to the desired level of 5 per
cent. Pakistan has reduced tariffs to 5 per cent for most exports from India. However, tariffs
still remain high for dried vegetables, dates, oilseeds and sugar in India.
Table 12: Pakistan's Tariff structure for products identified as exportable from India to
Pakistan
HS code Description Tariff (%)
(w.e.f. 31st Dec 2008)
Tariff (%)
(w.e.f.31st Dec 2012)
0402 Milk and cream 17 5
0407 Birds’ eggs 5 5
0703 Onion and other vegetables 7.4 5
0713 Dried leguminous vegetables 5 5
0801 Coconut and other nuts 7.4 5
0902 Tea and beverages 5 5
0904 Pepper 5 5
0908 Nutmeg and spices 5 5
1006 Rice 7.4 5
1007 Grain sorghum 5 5
1008 Buckwheat and other cereals 5 5
1202 Groundnuts 7.4 5
1209 Seeds and planting material 5 5
1211 Plants and parts of plants 5 5
1701 Cane/beet sugar 7.4 5
4011 Rubber tyres 5 5
5201 Cotton 5 5
5205 Cotton yarn 5 5
5209 Woven fabrics 17 5

22
Table 13: India's Tariff structure for products identified as exportable from Pakistan
to India
HS
code
Description Tariff (%)
(w.e.f. 1st Jan
2011)
Tariff (%)
(w.e.f. 1st Jan
2013)
0713 Dried vegetables, shelled 11 8
0802 Nuts Rs. 28 and 52/kg Rs. 28 and 52/kg
0804 Dates, figs, pineapples, mangoes, avocadoes,
guavas
11 8
0806 Grapes, fresh or dried 11 5
1207 Oil seeds 11 8
1211 Medicinal plants 7.8 5
1701 Cane or beet sugar NA 8
1703 Molasses from the extrctn/rfng of sugar 6.2 5
4101 Raw hides & skins of bovine/equine animals 7 5
4104 Leather of bovine/equine animal, 7 5
4107 Leather of other animals, 7 5
5201 Cotton, not carded or combed 6.2 5
5208 Woven cotton fabrics 7 5
5209 Woven cotton fabrics 7 5
Although countries have tried to relax their tariff structures, a number of non-tariff measures
are applied supposedly for protection of human life, animal life, health and safety. The details
are attached in Annexure V and VI. A few commodities are kept on the sensitive list to
protect the health of humans, animals and domestic industries. There are currently 614 items
on India’s sensitive list applicable to Pakistan, whereas Pakistan’s sensitive list applicable to
India includes 936 items. Out of these, there are 47 agricultural items in India’s sensitive list
and 246 in Pakistan’s sensitive list. The items on the sensitive list have to pass through
certain testing, labeling, packaging and certification requirements to check any harm to any
living organism.
Pakistan has considerably reduced the items on its sensitive list in various groups except in
dairy and animal products and fruits and nuts like apples, grapes and apricots (Table
14).Being an essential commodity, raw and refined sugar has also been kept on the sensitive
list. India has also restricted some fruits, vegetables and nuts and put these on the sensitive
list. Meat and fish products along with animal products are also part of India’s sensitive list
for Pakistan.

23
Table 14: Indian and Pakistani sensitive list for agricultural commodities under SAFTA
2
Digit
HS
Code
Description Sensitive list
of Pakistan
for India
Sensitive
list of
India for
Pakistan 2008 2012
01 Live animals. 31 0 0
02 Meat and edible meat offal. 54 0 8
03 Fish and crustaceans, molluscs and other aquatic
invertebrates.
106 0 8
04 Dairy produce; birds' eggs; natural honey; edible prod. of
animal origin, not elsewhere spec. or included.
11 10 10
05 Products of animal origin, not elsewhere specified or
included.
22 0 1
06 Live trees and other plants; bulbs; roots and the like; cut
flowers and ornamental foliage.
18 0 0
07 Edible vegetables and certain roots and tubers. 58 1 48
08 Edible fruit and nuts; peel or citrus fruit or melons. 40 4 33
09 Coffee, tea, mate and spices. 30 5 25
10 Cereals. 13 3 11
12 Oil seeds and olea, Fruits; misc. grains, seeds and fruit;
industrial or medicinal plants; straw and fodder.
44 0 32
13 Lac, gums, resins and other vegetable saps and extracts. 13 0 2
14 Vegetable plaiting materials; vegetable products not
elsewhere specified or included.
9 1 0
15 Animal or vegetable fats and oils and their cleavage
products; edible fats; animal or vegetable waxes.
22 13 32
16 Preparations of meat, of fish or of crustaceans, molluscs
or other aquatic invertebrates
28 0 2
17 Sugars and sugar confectionery. 18 2 4
19 Preparations of cereals, flour, starch or milk; and other
products.
25 0 1
20 Preparations of vegetables, fruit, nuts or other parts of
plants.
41 4 8
21 Miscellaneous edible preparations. 25 0 0
24 Tobacco and manufactured tobacco substitutes. 3 2 9
41 Raw hides and skins (other than fur skins) and leather 43 0 0
51 Wool, fine or coarse animal hair, horsehair yarn and
woven fabric.
38 0 0
52 Cotton 128 0 12
53 Other vegetable textile fibres; paper yarn and woven
fabrics of paper yarn
25 2 0
24
12. Agricultural Subsidies in India and Pakistan
Agricultural subsidies have been a matter of intense debate in various WTO rounds. Initially,
developing countries took on developed countries for offering high level of subsidies and
support to their agricultural sector, and thus creating an uneven playing field. . Of late, the
discussion on subsidies has also extended to developing countries with some developing
countries expressing concern about the subsidies in other developing countries affecting their
agriculture. It is reported that agricultural subsidies by relatively advanced developing
countries like India impact farmers in smaller and least developed economies (Pasha and
Pasha, USAID Report).
Between India and Pakistan, India provides food subsidy and also subsidies on major
agricultural inputs for meeting the goals of food security and protection of small and marginal
farmers. Major agricultural inputs namely fertilizers, irrigation and electricity are supplied to
farmers at prices that are below the cost of production. Similarly, Pakistan also provides input
subsidies to its farmers. Table 15 compares the agricultural subsidies between India and
Pakistan for the year 2010-11, the latest year for which comparable information is available
for both countries.
During the year 2010-11, India’s level of agricultural subsidies was US$31.9 billion while
Pakistan subsidized its agriculture by US$2.6 billion. As there is a huge difference in the size
of the sector in the two countries, the comparison makes better sense in terms of ratio or
share. The level of input subsidies per hectare of net sown area was $225.6 in India and
$168.1in Pakistan. India subsidized its agriculture by 8.8 per cent of the value of agriculture
production as compared to 4.9 per cent in Pakistan. These comparisons show that Indian
farmers have a benefit of 4 per cent over Pakistani farmers in terms of subsidies and this can
be factored into the trade policy. Therefore, higher level of subsidies in Indian agriculture
compared to Pakistan should not be a major issue against trade promotion between the two
countries.
Table 15: Subsidies on agricultural inputs in India and Pakistan, 2010-11
Particular Unit India* Pakistan**
Subsidies Million $ 31941 2676
Agriculture value added Million $ 286754 43088
GNP (at current prices)*** Million $ 1576487 219732
Net cropped area Million hectares 141.6 15.9
Subsidies as % of value added Per cent 11.1 6.2
Subsidies as % of GNP Per cent 2.0 1.2
Subsidy per hectare $ 225.6 168.1
Subsidies as % of value of production of
agriculture
Per cent 8.8 4.9
* Estimated by the authors using data from National Accounts Statistics 2012, CSO, GOI.
**Source: Pasha and Pasha, USAID Report
*** refers to GNI for India

25
13. Conclusions and Policy Implications
Despite strong neighborhood and proximity advantage, India and Pakistan did not trade much
until the late 1990s. Bilateral trade started expanding in the new century and it picked up
momentum after SAFTA came into effect in 2006. In case of the agricultural sector, trade
picked up after 2005-06. Since then, agricultural exports from India to Pakistan have grown
at a faster rate than export of non-agricultural products. However, agricultural exports from
Pakistan to India increased at a slow rate, seemingly due to supply side constraints in
Pakistan’s agricultural sector. Average trade showed a big jump after SAFTA came into
effect, but it proved to be a one-time gain, as the trend remained sluggish after the increase in
2006-07. On the whole, India’s agricultural exports to Pakistan show a much better
performance than agricultural exports from Pakistan to India.
Trade in most commodities show very large year-on -year variation and most of the
agriculture trade was taking place for stabilizing the fluctuations in domestic production. The
trade pattern of the past 15 years indicates that the Indo-Pak agriculture trade can be
classified in three categories namely (a) trade for domestic stabilization; (b) trade based on
comparative advantage of more or less permanent nature, and (c) trade in specialized
products. Some of India’s major exports, like sugar, onion and even cotton, are meant largely
for regulating the fluctuating domestic supply (due to production shocks) in Pakistan.
Experience shows that there is considerable delay in arranging import on both sides to
address domestic shortages. Suitable mechanisms need to be developed for liberalized trade
in such commodities to address price shocks that hurt consumers and also adversely affect the
economy. Bilateral trade is a cost effective and efficient instrument to address price and
market volatility in the two countries.
Both countries have comparative advantage in the export of some commodities to each other.
These include tomato, cane sugar, onion, fresh vegetables, cotton (carded and combed),
groundnut, coarse cereals as feed and dairy products for exports from India to Pakistan.
Similarly, Pakistan has comparative advantage in exporting dates, leather, hides and skins
and woven fabrics to India. There is considerable scope for promoting export of specialized
items as trade is stable and growing in this case. These include products with unique
attributes like herbs, medicinal and aromatic plants and some cereals. Buckwheat (kuttu) and
Psyllium (Isabgol) can be cited as specific examples here.
Despite implementation of SAFTA, some strong tariff and non-tariff barriers continue to
restrict agricultural trade between the two countries. This requires action in the following
areas:
Trade facilitation
Further lowering of tariffs
Pruning the negative list
Removal of non-tariff trade barriers
26
Of these, trade facilitation in the form of simplification of custom and other border
formalities, transport linkages, transparency in regulatory provisions, improved logistics for
rail, road, air and maritime transport, a better information network etc., are among the most
important measures to increase bilateral trade. Chand (2012) also reported that a major factor
for low volume and low share of intra-regional trade in South Asia seems to be the poor
facilitation for intra-regional trade, like efficiency of custom, other border procedures, quality
of transport and IT infrastructure etc. Other studies also reported that trade facilitation is a
major factor in the growth of intra-regional and total trade from South Asia (ADB 2009; Jain
and Singh 2009; Wilson and Otsuki 2006). Improved trade facilitation and logistics will
reduce the transaction cost of trade, which is more significant than tariff. India and Pakistan
must promptly take up measures individually and as a group to achieve higher trade
facilitation.
Differences in the level of agricultural subsidies between India and Pakistan are cited as an
important reason for not liberalizing India’s agricultural export to Pakistan. As there is a huge
difference in the size of the sector in the two countries, comparisons of subsidies make better
sense in terms of the ratio or share. The level of input subsidies per hectare of net sown area
was $225.6 in India and $168.1 in Pakistan. India subsidized its agriculture by 8.8 per cent of
the value of agriculture production as compared to 4.9 per cent in Pakistan. These
comparisons show that Indian farmers have a benefit of 4 per cent over Pakistani farmers in
terms of subsidies and this can be factored into the trade policy. Therefore, higher levels of
subsidy in Indian agriculture compared to Pakistan should not be a major issue in terms of
promoting trade between the two countries.
Another hitherto neglected area related to agriculture trade is the trade in technology.
Agriculture in both countries faces some serious challenges while there are tremendous
opportunities for science-led agricultural growth. Modern research also requires large
amounts of capital and a high level of skill and knowledge. India and Pakistan can benefit
immensely through trade in technology.

27
References
Asian Development Bank (2009), Regional Co-operation Strategy and Programme, South
Asia (2006-08), ADB, Manila.
Balassa, B. (1965), Trade Liberalisation and Revealed Comparative Advantage, The
Manchester School, 33 (2): 99-123.
Bhagwati, Jagdish (1993). “Regionalism and Multilateralism: An Overview.” In New
Dimensions in Regional Integration, edited by Jaime de Melo and Arvind Panagariya.
Cambridge: Cambridge Univ. Press, 1993.
Chand, Ramesh (2006), Free Trade Area in Asia, Academic Foundation, New Delhi.
Chand, Ramesh (2012), International trade, regional Integration and food security in south
Asia with special focus on LDCS, UNCTAD and Common Wealth Secretariat,
October 2012
Government of India (2011 and 2013). Notifications and Order, Ministry of Commerce and
Industry, Department of Commerce, India.
Government of Pakistan (2008 and 2012). Notifications and Orders, Ministry of
Commerce, Islamabad, Pakistan.
Hoda Anwarul and Gulati Ashok (2013). India's Agricultural Trade Policy and Sustainable
Development, ICTSD programme on agricultural trade and sustainable development,
September Issue no. 49 International Centre for Trade and Sustainable Development
(ICTSD), Switzerland
International Trade Centre (2012). Market Access Map, Improving transparency in
International Trade and market access, http://www.macmap.org/ Accessed on 22nd
April, 2014.
Jain Rajeev and Singh J. B. (2009). Trade Pattern in SAARC Countries: Emerging Trends
and Issues, Reserve Bank of India, Occasional Papers, Vol. 30, No.3, Winter 2009.
Pasha Hafiz Ahmed and Pasha Aisha Ghaus, Non-Tariff Barriers of India and Pakistan
and their Impact, Institute of Public Policy Beaconhouse National
University Pakistan, USAID Deliverable 2.
Raihan Selim and Prabir De (2013), India – Pakistan Economic Cooperation: Implications
for Regional Integration in South Asia, Commonwealth Secretariat.
Wilson, John S. and Otsuki, Tsunehiro (2007), Regional Integration in South Asia: What
Role for Trade Facilitation? Policy Research Working Paper, No. 4423, Development
Research Group, the World Bank, December.

28
Annexure I: List of Groups Covered in Agriculture
HS Code
(2 Digit)
Description
01 Live animals.
02 Meat and edible meat offal.
03 Fish and crustaceans, molluscs and other aquatic invertebrates.
04 Dairy produce; birds' eggs; natural honey; edible prod. Of animal origin, not
elsewhere spec. Or included.
05 Products of animal origin, not elsewhere specified or included.
06 Live trees and other plants; bulbs; roots and the like; cut flowers and ornamental
foliage.
07 Edible vegetables and certain roots and tubers.
08 Edible fruit and nuts; peel or citrus fruit or melons.
09 Coffee, tea, mate and spices.
10 Cereals.
12 Oil seeds and olea. Fruits; misc. Grains, seeds and fruit; industrial or medicinal
plants; straw and fodder.
13 Lac; gums, resins and other vegetable saps and extracts.
14 Vegetable plaiting materials; vegetable products not elsewhere specified or
included.
15 Animal or vegetable fats and oils and their cleavage products; pre. Edible fats;
animal or vegetable waxes.
16 Preparations of meat, of fish or of crustaceans, molluscs or other aquatic
invertebrates
17 Sugars and sugar confectionery.
19 Preparations of cereals, flour, starch or milk; pastry cook products.
20 Preparations of vegetables, fruit, nuts or other parts of plants.
21 Miscellaneous edible preparations.
24 Tobacco and manufactured tobacco substitutes.
41 Raw hides and skins (other than fur skins) and leather
51 Wool, fine or coarse animal hair, horsehair yarn and woven fabric.
52 Cotton.
53 Other vegetable textile fibres; paper yarn and woven fabrics of paper yarn.
29
Annexure II : India’s major agricultural exports to Pakistan ($ million))
HS
Code Commodity
1996
-
1997
1997
-
1998
1998
-
1999
1999
-
2000
2000
-
2001
2001
-
2002
2002
-
2003
2003
-
2004
2004
-
2005
2005
-
2006
2006
-
2007
2007
-
2008
2008
-
2009
2009
-
2010
2010
-
2011
2011
-
2012
2012
-
2013
1 Live animals 0 0 0 0 0 0 0 0 0.01 0.06 0.29 0.21 0 0 0 0 0
2 Meat and meat products 0 0 0.03 0 0 0 0 0 0.07 5.84 29.81 15.25 3.94 4.12 4.87 5.92 4.16
3 Fish and crustaceans 0 0.12 0 0 0 0.08 0.13 0.04 0.08 0.06 0.02 0.22 0 0 0 1.01 0
4 Dairy products and bird eggs 0 0.01 0 0 0 0.01 0.1 0.07 1.17 8.03 4 6.13 2.7 2.66 11.61 4.79 14.29
5 Products of animal origin 0 0.01 0 0 0 0 0 0.01 0 0.01 0.01 0 0 0.14 0.56 0.88 0.83
6 Live tress and other plants 0.01 0.04 0 0 0 0.01 0.02 0 0 0.01 0.01 0.03 0.04 0.08 0.02 0.01 0.11
7 Edible vegetables 0.29 0.7 3.45 0.75 1.02 1.73 0.99 0.87 6.44 30.46 35.71 68.02 91.16 59.85 74.07 146.39 144.51
8 Edible fruits 0.68 0.33 0.84 1.44 0.25 0.29 0.34 0.62 0.1 0.88 0.63 0.84 0.4 1.86 10.96 22.2 25.03
9 Tea and beverages 11.37 15.68 12.76 10.09 14.61 6.06 7.37 8.59 14.82 12.01 21.46 30.32 56.66 36.9 71.26 103.74 83.71
10 Cereals 0.04 0.03 0.33 0 0.42 0 2 1.79 4.29 1.71 1.24 7.22 31.66 10.94 18.87 31.47 14.47
11 Products of milling industry 0.03 0 0.03 0.01 0 0 0 0.05 0.02 0.02 0 0.07 0.05 0.06 0.12 0.1 0.64
12 Oilseeds 2.42 2.5 3.44 3.32 2.65 2.25 3.44 13.85 4.59 13.63 16.46 19.85 18.76 35.51 48.89 48.31 52.37
13 Lack gums etc, 1.5 1.13 0.66 0.68 1.31 0.48 0.67 1.43 1.75 2.31 4.46 3.49 3.89 4.22 7.44 12.48 12.24
14 Vegetable planting materials 3.99 2.35 2.06 2.47 2.03 2.04 1.94 2.03 2.56 2.04 3.2 3.79 2.05 2.68 2.12 2.76 2.84
15 Animal or vegetable fat 0.13 0.11 0.15 0.16 0.16 0.1 0.7 0.34 0.35 0.65 0.98 0.64 0.6 0.57 0.63 0.61 0.38
17 Sugar 86.82 35.7 0.14 0.02 56.65 43.21 6.38 3.9 0.55 30.48 352.82 70.94 10.89 1.07 336.85 18.64 0.5
19 Cereals preparations 0 0.01 0.03 0.01 0.11 0 0.05 0.04 0.03 2.73 0.26 0.34 8.91 7.37 3.11 6.85 6.02
20 Vegetables and fruit preparations 0 0 0 0.01 0 0 0 0.01 0 0.04 0.11 0.11 0 0.29 0 0.63 1.63
21 Misc edible preparations 0.2 0.33 0.22 0.13 0.02 0.01 0.47 0.01 0.56 0.19 0.38 0.07 0.23 0.19 0.11 0.25 0.83
22 Beverages 0 0 0 0 0 0.02 0.02 0 0.08 0 0.03 0 0.11 0.22 0.11 0 0.01
24 Tobacco 0 0.14 0.16 0.04
0.02 0.09 0 0 0.42 0.01 0.04 0.88 0 6.27 0 0.53
40 Rubber and the articles thereof 0.35 9.05 6.59 6.86 8.54 8.94 14.77 15.69 29.69 42.61 39.77 51.51 42.49 41.65 56.03 62.25 45.08
41 Raw hides and skin 0 0.01 0.01 0 0 0.01 0.09 0.29 0.04 0.19 0.07 0.14 0.89 0.16 0.5 0.49 0.51
44 wood 0.02 0.02 0 0.03 0 0.03 0.03 0.06 0.04 0.03 0.01 0.25 0.41 0.36 0.41 0.2 1.58
47 Pulp of wood 0 0 0 0 0 0 0 0 0.02 0 0 0.11 0 0 0.01 0.01 0
50 Silk 0.04 0.01 0.02 0 0 0 0.02 0.01 0.01 0 0 0.02 0.22 0.07 0.04 0.01 0.02
51 Wool 0.01 0.01 0 0 0 0 0.12 0.47 0.68 0.67 0.43 1.24 0.37 0.64 0.62 1.13 0.09
52 Cotton 0.13 0.27 0.37 0.7 0.07 0.84 1.18 51.73 16.69 58.09 210.06 461.72 97.25 242.77 423.69 87.12 471.93
53 Other vegetable fibres 0.13 0.23 0.18 0.27 0.27 0.09 0.1 0.06 0.05 0.04 0.01 0.15 0.01 3.02 6.29 0.17 0.01

30
Annexure III: India’s major agricultural imports from Pakistan ($ million)
HS
Code Commodity 19
96-
19
97
19
97-
19
98
19
98-
19
99
19
99-
20
00
20
00-
20
01
20
01-
20
02
20
02-
20
03
20
03-
20
04
20
04-
20
05
20
05-
20
06
20
06-
20
07
20
07-
20
08
20
08-
20
09
20
09-
20
10
20
10-
20
11
20
11-
20
12
20
12-
20
13
2 Meat and meat products 0 0 0 0 0 0 0 0 0 0 0 0.04 0.01 0 0 0 0
3 Fish and crustaceans. 0 0 0 0 0 0.11 0 0 0.04 0.65 0.21 0.89 0.74 0.89 0.61 1.35 1.48
4 Dairy produce; birds' eggs 0 0 0 0 0 0 0 0.01 0 0 0 0 0 0 0 0 0
5 Products of animal origin 0 0 0 0 0 0 0 0 0.01 0.02 0.04 0.04 0 0 0.14 0.16 0
7 Edible vegetables 0 0 1.47 0.03 3.91 7.02 12.34 25.56 4.83 67.94 1.38 1.35 0.05 5.55 7.31 0.28 2.97
8 Edible fruit 26.51 22.22 20.38 20.75 25.89 27.18 9.04 12 23.07 26.14 88.76 42.4 36.68 46.41 62.98 80.68 92.55
9 Tea and beverages 0.55 0.59 0.3 0.68 0.51 2.35 0.91 0.58 1.96 0.93 0.82 1.82 1.01 2.76 1.61 2.91 0.61
10 Cereals. 0 0 0 6.07 0.08 0 0 0 0 0 0 12.36 0 0 0 0 0
12 Oil seeds 1.25 0.79 1.46 2.31 1.05 1.59 0.23 0.61 1.44 1.73 1.6 3.02 5.39 8.29 3.63 2.96 5.87
13 Lac; gums, 0.93 1.26 0.83 1.75 2.71 3.66 2.1 1.53 1.13 0.86 1.28 0.62 1.27 1.25 1.03 1.44 1.63
14 Vegetable plaiting materials. 0.01 0.02 0.01 0.03 0.02 0.06 0 0.01 0.03 0.02 0.03 0.02 0.03 0.05 0.01
15 Animal or vegetable fats 0 0 0 0.07 0 0 0 0 0 0 0.02 0 0 0 1.65 0 0
16 Preparations of meat 0 0 0 0 0 0 0 0 0 0 0.02 0.03 0 0 0 0.01 0.01
17 Sugars 0 13.49 181.16 16.37 2.42 6.77 0 0 31.35 7.45 0 0 0 0 0 0 6.75
19 Preparations of cereals 0 0 0 0 0 0 0 0 0 0 0.01 0.01 0.02 0 0.02 0.01 0
20 Vegetables and fruit preparations 0 0 0 0 0 0 0 0 0.01 0 1.31 0.48 1.41 1.64 0 0 1.87
21 Miscellaneous edible preparations. 0 0 0 0 0 0 0 0 0.01 0.01 0 0.03 0.02 0 0.03 0.18 0
24 Tobacco and manufactured tobacco
substitutes.
0 0 0 0 0 0 0 0 0 0 0 0 0.01 0 0 0 0
41 Raw hides and skins 0.97 1.35 0.56 0.48 0.37 0.44 0.15 0.66 1.12 1.71 3.94 12.54 12.17 8.28 13.4 11.22 11.62
51 Wool 2.57 1.23 0.24 0.2 0.02 0.52 0.85 2.29 1.2 2.15 3.77 5.19 3.52 3.98 9.32 5.74 10.4
52 Cotton 0.39 0.03 0.62 1.82 1.05 3.03 1.51 3.64 15.13 28.11 48.88 45.29 44.76 39.1 22.45 60.43 60.38
53 Other vegetable textile fibres 0 0 0 0 0.01 0.01 0 0 0 0 0.02 0 0.22 0.13 0.05 0 0.26
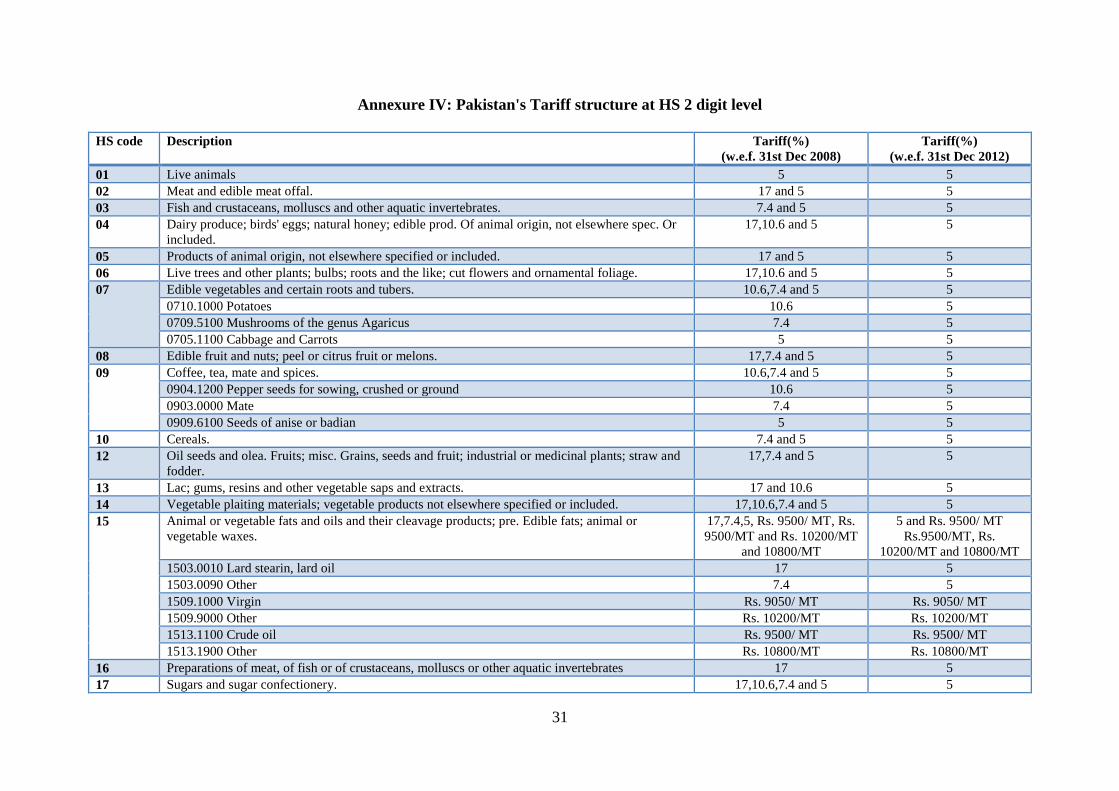
31
Annexure IV: Pakistan's Tariff structure at HS 2 digit level
HS code Description Tariff(%)
(w.e.f. 31st Dec 2008)
Tariff(%)
(w.e.f. 31st Dec 2012)
01 Live animals 5 5
02 Meat and edible meat offal. 17 and 5 5
03 Fish and crustaceans, molluscs and other aquatic invertebrates. 7.4 and 5 5
04 Dairy produce; birds' eggs; natural honey; edible prod. Of animal origin, not elsewhere spec. Or
included.
17,10.6 and 5 5
05 Products of animal origin, not elsewhere specified or included. 17 and 5 5
06 Live trees and other plants; bulbs; roots and the like; cut flowers and ornamental foliage. 17,10.6 and 5 5
07 Edible vegetables and certain roots and tubers. 10.6,7.4 and 5 5
0710.1000 Potatoes 10.6 5
0709.5100 Mushrooms of the genus Agaricus 7.4 5
0705.1100 Cabbage and Carrots 5 5
08 Edible fruit and nuts; peel or citrus fruit or melons. 17,7.4 and 5 5
09 Coffee, tea, mate and spices. 10.6,7.4 and 5 5
0904.1200 Pepper seeds for sowing, crushed or ground 10.6 5
0903.0000 Mate 7.4 5
0909.6100 Seeds of anise or badian 5 5
10 Cereals. 7.4 and 5 5
12 Oil seeds and olea. Fruits; misc. Grains, seeds and fruit; industrial or medicinal plants; straw and
fodder.
17,7.4 and 5 5
13 Lac; gums, resins and other vegetable saps and extracts. 17 and 10.6 5
14 Vegetable plaiting materials; vegetable products not elsewhere specified or included. 17,10.6,7.4 and 5 5
15 Animal or vegetable fats and oils and their cleavage products; pre. Edible fats; animal or
vegetable waxes.
17,7.4,5, Rs. 9500/ MT, Rs.
9500/MT and Rs. 10200/MT
and 10800/MT
5 and Rs. 9500/ MT
Rs.9500/MT, Rs.
10200/MT and 10800/MT
1503.0010 Lard stearin, lard oil 17 5
1503.0090 Other 7.4 5
1509.1000 Virgin Rs. 9050/ MT Rs. 9050/ MT
1509.9000 Other Rs. 10200/MT Rs. 10200/MT
1513.1100 Crude oil Rs. 9500/ MT Rs. 9500/ MT
1513.1900 Other Rs. 10800/MT Rs. 10800/MT
16 Preparations of meat, of fish or of crustaceans, molluscs or other aquatic invertebrates 17 5
17 Sugars and sugar confectionery. 17,10.6,7.4 and 5 5

32
1702.3000Glucose and glucose syrup 17 5
1702.5000Chemically pure fructose 10.6 5
1701.1200 Beet sugar 7.4 5
1703.1000Cane molasses 5 5
19 Preparations of cereals, flour, starch or milk; pastry cooks products. 17 and 10.6 5
20 Preparations of vegetables, fruit, nuts or other parts of plants 17 and 10.6 5
21 Miscellaneous edible preparations. 17, 10.6 and 7.4 5
24 Tobacco and manufactured tobacco substitutes. 5 5
41 Raw hides and skins (other than fur skins) and leather 17,7.4 and 5 5
51 Wool, fine or coarse animal hair, horsehair yarn and woven fabric 9.96, 7.4, 5.48 and 5 5
52 Cotton. 17, 9.96, 7.4 and 5 5
5204.1100 Cotton, carded or combed containing 85% or more by weight of cotton 17 5
5210.1100 Plain weave and fabrics 9.96 5
5202.1000 Yarn waste (including thread waste) 7.4 5
5201.0030 American or Egyptian Cotton 5 5
53 Other vegetable textile fibres; paper yarn and woven fabrics of paper yarn. 17, 9.96, 7.4 and 5 5

33
Annexure V: India's Tariff structure at HS 2 digit level
HS code Description Tariff(%)
(1st Jan 2011)
Tariff(%)
(1st Jan 2013)
01 Live animals. 11 5
02 Meat and edible meat offal. 11 5
03 Fish and crustaceans, molluscs and other aquatic invertebrates. 11 5
04 Dairy produce; birds' eggs; natural honey; edible prod. Of animal origin, not elsewhere spec. Or
included.
11 5
05 Products of animal origin, not elsewhere specified or included. 11 5
06 Live trees and other plants; bulbs; roots and the like; cut flowers and ornamental foliage. 11 5
07 Edible vegetables and certain roots and tubers. 11 5 and 8
08 Edible fruit and nuts; peel or citrus fruit or melons. Rs 28/kg, Rs. 52/kg,
7.8,11
Rs 28/kg, Rs. 52/kg, 5 and
8
0813 20 00 Cashew nuts fresh/dried shelled 11 5
0810 60 00 Durians 7.8 5
0802 11 00 Almonds fresh or dried in shell Rs 28 per Kg Rs 28 per Kg
0802 12 00 Shelled almonds fresh or dried Rs. 52 per kg Rs. 52 per kg
09 Coffee, tea, mate and spices. 11 5 and 8
10 Cereals. 5 and 8
12 Oil seeds and olea. Fruits; misc. Grains, seeds and fruit; industrial or medicinal plants; straw and
fodder.
7.8 and 11 5 and 8
12 all goods 11 5 and 8
1211 30 Coca leaf fresh/dried w/n cut crshd/pwdrd 7.8 5
13 Lac; gums, resins and other vegetable saps and extracts. 7.8 5 and 8
14 Vegetable plaiting materials; vegetable products not elsewhere specified or included. 11 5
15 Animal or vegetable fats and oils and their cleavage products; pre. Edible fats; animal or vegetable
waxes.
7.8 and 11 5 and 8
16 Preparations of meat, of fish or of crustaceans, molluscs or other aquatic invertebrates 11 5 and 8
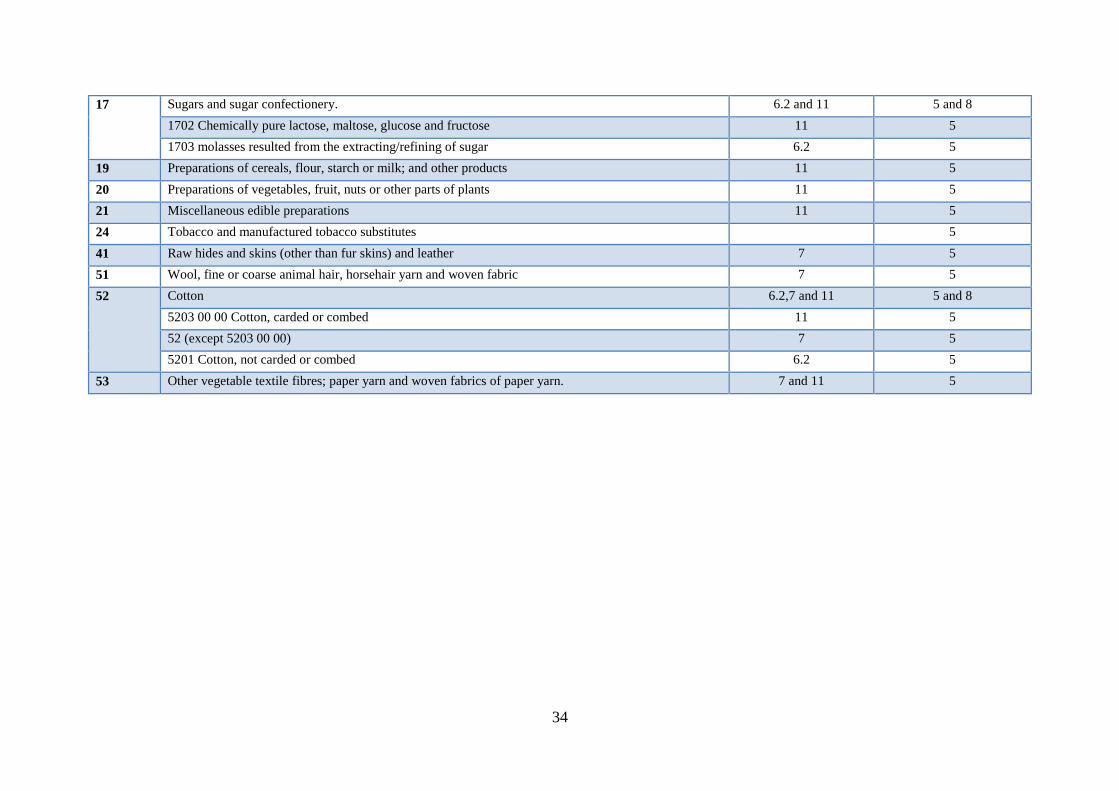
34
17 Sugars and sugar confectionery. 6.2 and 11 5 and 8
1702 Chemically pure lactose, maltose, glucose and fructose 11 5
1703 molasses resulted from the extracting/refining of sugar 6.2 5
19 Preparations of cereals, flour, starch or milk; and other products 11 5
20 Preparations of vegetables, fruit, nuts or other parts of plants 11 5
21 Miscellaneous edible preparations 11 5
24 Tobacco and manufactured tobacco substitutes 5
41 Raw hides and skins (other than fur skins) and leather 7 5
51 Wool, fine or coarse animal hair, horsehair yarn and woven fabric 7 5
52 Cotton 6.2,7 and 11 5 and 8
5203 00 00 Cotton, carded or combed 11 5
52 (except 5203 00 00) 7 5
5201 Cotton, not carded or combed 6.2 5
53 Other vegetable textile fibres; paper yarn and woven fabrics of paper yarn. 7 and 11 5

35
Annexure VI: Non-Tariff Measures on Agricultural Commodities: Specific NTBs faced by Indian Exporters in Pakistan
HS code and
product
NTM NTM Description NTM Objective Legislation
0407 Bird eggs Prohibition for political reasons
(embargo)
Goods of Israeli origin or imported
from Israel are banned
NA Ministry of Commerce, Pakistan
Treatment for elimination of plant and
animal pests and disease-causing
organisms in the final production
Poultry products are banned from
Avian Influenza H5N1 strain affected
countries
NA Ministry of Commerce, Pakistan
0702 Tomatoes Requirement to pass through specified
port of customs
Importable from India through land
route from Wagah
Protection of human life;
health and safety
Ministry of Commerce, Pakistan
0703 Onion
and other
vegetables
Requirement to pass through specified
port of customs
Importable from India through land
route from Wagah
Protection of human life;
health and safety
Ministry of Commerce, Pakistan
0713 Dried
leguminous
vegetables
Product quality or performance
requirement
Vetches (whole grain ,split or any
other form ) are banned
Protection of human life;
health and safety
Ministry of Commerce, Pakistan
0902 Tea and
beverages
Testing requirement Mandatory standards set out by
PSQCA
NA Government of Pakistan -
Mandatory standards and
conformity test by the PSQCA
0904 Pepper Requirement to pass through specified
port of customs
Importable from India through land
route from Wagah
Protection of human life;
health and safety
Ministry of Commerce, Pakistan
Product quality or performance
requirement
Vetches (whole grain, split or any
other form ) are banned
Protection of human life;
health and safety
Ministry of Commerce, Pakistan
Testing requirement Mandatory standards set out by
PSQCA
NA Government of Pakistan -
Mandatory standards and
conformity test by the PSQCA
1006 Rice Requirement to pass through specified
port of customs
If imported from India, import from
Wagah is also allowed
NA Ministry of Commerce, Pakistan
1209 Seeds and
planting
material
Product quality or performance
requirement
Vetches (whole grain, split or any
other form ) are banned
Protection of human life;
health and safety
Ministry of Commerce, Pakistan
Geographical restrictions on eligibility Opium poppy seeds shall be allowed
from those countries only where it is
legally produced
NA Ministry of Commerce, Pakistan
Testing requirement Importable subject to drawing sample
and testing quality by Deptt of Plant
Protection and Federal Seed
Protection of animal life and
health
Department of Plant Protection ,
Pakistan

36
Certification Agency
Quarantine requirement Rice seed shall be subject to strict
quarantine measures prescribed under
the Seed Act 1976
NA Department of Plant Protection ,
Pakistan
1211 Plants
and parts of
plants
Prohibition for non-economic reasons Extract and tinctures of cannabis are
banned
NA Ministry of Commerce, Pakistan
1701 Cane/beet
sugar
Requirement to pass through specified
port of customs
If imported from India, import from
Wagah is also allowed
NA Ministry of Commerce, Pakistan
5201 Cotton Product quality or performance
requirement
Vetches (whole grain ,split or any
other form ) are banned
Protection of human life;
health and safety
Ministry of Commerce, Pakistan
Additional taxes and charges levied in
connection to services provided by the
Government
Levy of value addition tax NA Federal Board of Revenue
website, Government of
Pakistan - SROs
Requirement to pass through specified
port of customs
Importable from India through land
route from Wagah
Protection of human life;
health and safety
Ministry of Commerce, Pakistan
5205 Cotton
yarn
Additional taxes and charges levied in
connection to services provided by the
Government
Levy of value addition tax NA Federal Board of Revenue
website, Government of
Pakistan - SROs
Requirement to pass through specified
port of customs
Importable from India through land
route from Wagah
Protection of human life;
health and safety
Ministry of Commerce, Pakistan
Product quality or performance
requirement
Vetches (whole grain ,split or any
other form ) are banned
Protection of human life;
health and safety
Ministry of Commerce, Pakistan
5209 Woven
fabrics
Additional taxes and charges levied in
connection to services provided by the
Government
Levy of value addition tax NA Federal Board of Revenue
website, Government of
Pakistan - SROs
Product quality or performance
requirement
Vetches (whole grain ,split or any
other form ) are banned
Protection of human life;
health and safety
Ministry of Commerce, Pakistan

37
Annexure VII: Non-Tariff barriers on Agricultural Commodities: Specific NTB's faced by Pakistan’s Exporters in India
NTM
NTM Description Legislation
Applicable for
Authorization
requirement for TBT
reasons
The regulation requires that a license has to be granted/obtained to (a) commence or
carry on the business as (i) a manufacturer of, or dealer in, any animal article, or ii)
a taxidermist; or (iii) a dealer in trophy or uncured trophy; or (iv) a dealer in captive
animal; or (v) a dealer in meat; or (b) cook or serve meat in any eating-house
Wild Life Protection Act,
1972
4101 Raw hides & skins of
bovine/equine animals
4107 Leather of other animals,
Conformity assessment
related to TBT
The regulation requires that no person without proof of ownership shall sell certain
animals and animal products without prior approval of the authorised officer
Wild Life Protection Act,
1972
4101 Raw hides & skins of
bovine/equine animals
4107 Leather of other animals,
Food and feed
processing
These Regulations mandate that a well-equipped laboratory for testing of food
materials shall be in place inside the premises of food business units for physical,
microbiological and chemical analysis.
Food Safety and
Standards(Licensing and
Registration of Food
Businesses) Regulations,
2011
1211 Medicinal plants
Fumigation The order provides for fumigation requirement when considered necessary based on
the authority’s discretion, the importer at its own cost is required to comply with the
same
Plant Quarantine
(Regulation of Import into
India) Order, 2003
802 Nuts
804 Dates, figs, pineapples,
mangoes, avocadoes, guavas
806 Grapes, fresh or dried
1207 Oil seeds
Geographical
restrictions on eligibility
The regulation prohibits imports of certain plants/planting materials from certain
countries based on specific justification provided thereof.
Plant Quarantine
(Regulation of Import into
India) Order, 2003
802 Nuts
804 Dates, figs, pineapples,
mangoes, avocadoes, guavas
806 Grapes, fresh or dried
1207 Oil seeds
Irradiation These Regulations mandate that certain food items such as onions, spices, potatoes,
wheat, atta, pulses etc. dried fruits such as raisins, figs and dried dates, meat and
meat products including chicken, etc. will not be subject to a dose of irradiation in
excess of the specified quantity in the Regulation. For instance, onions can be
subjected to an irradiation of a maximum of 0.09 KGY, spices can be subjected to
an irradiation of a maximum of 14 KGY etc. Further, such irradiation facility should
be approved and licensed by the Government, and in accordance with specified
procedures.
Food Safety and Standards
(Food Products Standards
and Food
Additives)Regulations,
2011
713 Dried vegetables, shelled
804 Dates, figs, pineapples,
mangoes, avocadoes, guavas
806 Grapes, fresh or dried
Licensing for non-
economic reasons
Import will be subject to provision of convention of international trade in
Endangered species of wild fauna and flora (CITES)
Director General Foreign
Trade (DGFT) Notification
1211 Medicinal plants

38
- Restricted items for
imports
Microbiological criteria
of the final product
These rules require certain food products to conform to certain microbiological
requirements such as the amount of E.coli, staphylococcus, salmonella that can be
found in various food items such as milk and milk products, fish and meat products,
fruits and vegetables products etc. For instance, in case of ice creams, the E.Coli
count cannot be more than 100/g and there should be no salmonella.
Food Safety and Standards
(Food Products Standards
and Food
Additives)Regulations,
2011
804 Dates, figs, pineapples,
mangoes, avocadoes, guavas
806 Grapes, fresh or dried
Non-automatic import
licensing procedures
Licensing is required to import Director General Foreign
Trade (DGFT) Notification
- Restricted items for
imports
1207 Oil seeds
1211 Medicinal plants
Price control measures When goods of the description mentioned in the Schedule chargeable with a duty of
excise under the Central Excise Act, 1944 (1 of 1944), read with any notification for
the time being in force issued by the Central Government in relation to the duty so
chargeable (not being a notification providing for any exemption for giving credit
with respect to, or reduction of duty of excise under the said Act on such goods
equal to, any duty of excise under the said Act, or the additional duty under Section
3 of the Customs Tariff Act, 1975 (51 of 1975), already paid on the raw material
used in the production or manufacture of such goods), are assessed to duty, there
shall be levied and collected a duty of excise equal to fifteen per cent of the total
amount so chargeable on such goods
Central Board of Excise
and Customs, Government
of India - ADDITIONAL
DUTIES OF EXCISE
(TEXTILES AND
TEXTILE ARTICLES)
ACT, 1978 (40 OF 1978)
5201 Cotton, not carded or
combed
5208 Woven cotton fabrics
5209 Woven cotton fabrics
Prohibitions/restrictions
of imports for
objectives set out in the
TBT agreement
The regulation specifies that no person shall carry on the business of selling,
exporting or importing seeds at any place except under and in accordance with the
terms and conditions of licence granted to him under this order.
Seed Control Order, 1983 1207 Oil seeds
Quarantine
requirement
The order specifies that plant and seed consignments that may pose a threat are to be
subjected to post-entry quarantine, as specified in the order, to be implemented by
using established quarantine facilities, at the importer’s expense.
Plant Quarantine
(Regulation of Import into
India) Order, 2003
802 Nuts
804 Dates, figs, pineapples,
mangoes, avocadoes, guavas
806 Grapes, fresh or dried
1207 Oil seeds
Special Authorization
requirement for SPS
reasons
The regulation specifies grant of permit by notified authorities as a pre - requisite to
a plant, plant product, seed etc being imported.
Plant Quarantine
(Regulation of Import into
India) Order, 2003
802 Nuts
1207 Oil seeds
TBT regulations on
production processes
The regulation requires that no person shall sell or offer or expose for sale or have in
his premises for the purpose of sale under any description, fruit which has been
artificially ripened by use of acetylene gas, commonly known as carbide gas.
The Prevention of Food
Adulteration Rules, 1955
804 Dates, figs, pineapples,
mangoes, avocadoes, guavas
806 Grapes, fresh or dried

39
LATEST ICRIER’S WORKING PAPERS
NO. TITLE Author YEAR
286 CREATING JOBS IN INDIA’S
ORGANISED MANUFACTURING
SECTOR
RADHICKA KAPOOR SEPTEMBER
2014
285 MAPPING THE FUTURE OF HIGH
VALUE MANUFACTURING IN
INDIA
RAJAT KATHURIA
MANSI KEDIA
UTTARA
BALAKRISHNAN
SEPTEMBER
2014
284 ASSESSING THE FUTURE OF
TRADE IN THE AUTOMOBILE
SECTOR BETWEEN INDIA AND
PAKISTAN: IMPLICATIONS OF
ABOLISHING THE NEGATIVE LIST
BISWAJIT NAG SEPTEMBER
2014
283 EVOLUTION AND CRITIQUE OF
BUFFER STOCKING POLICY OF
INDIA
SHWETA SAINI AND
MARTA KOZICKA
SEPTEMBER
2014
282 FACILITATING BILATERAL
INVESTMENTS BETWEEN INDIA
AND GERMANY:
THE ROLE OF NEGOTIATIONS
AND REFORMS
TANU M. GOYAL
RAMNEET GOSWAMI
TINCY SARA
SOLOMON
JULY 2014
281 TRADE AND INVESTMENT
BARRIERS AFFECTING
INTERNATIONAL PRODUCTION
NETWORKS IN INDIA
ANWARUL HODA
DURGESH KUMAR RAI
JULY 2014
280 INDIA-KOREA CEPA:
HARNESSING THE POTENTIAL IN
SERVICES
NISHA TANEJA
NEETIKA KAUSHAL
NAGPAL
SAON RAY
JULY 2014
279 SALIENT FEATURES OF
MEASURING, INTERPRETING
AND ADDRESSING INDIAN
INFLATION
KIRTI GUPTA
FAHAD SIDDIQUI
JULY 2014
278 THE ECONOMIC IMPACTS OF
TEMPERATURE ON INDUSTRIAL
PRODUCTIVITY: EVIDENCE
FROM INDIAN MANUFACTURING
ANANT SUDARSHAN
MEENU TEWARI
JULY 2014
277 JOINING THE SUPPLY CHAIN: A
FIRM-LEVEL PERSPECTIVE FROM
SOUTHEAST ASIA
GANESHAN
WIGNARAJA
JUNE 2014
276 EL NIÑO AND INDIAN
DROUGHTS- A SCOPING
EXERCISE
SHWETA SAINI
ASHOK GULATI
JUNE 2014
275 INDIA-PAKISTAN TRADE: AN
ANALYSIS OF THE
PHARMACEUTICAL SECTOR
MANOJ PANT
DEVYANI PANDE
JUNE 2014
40
About ICRIER
Established in August 1981, ICRIER is an autonomous, policy-oriented, not-for-profit,
economic policy think tank. ICRIER's main focus is to enhance the knowledge content of
policy making by undertaking analytical research that is targeted at informing India's policy
makers and also at improving the interface with the global economy. ICRIER's office is
located in the institutional complex of India Habitat Centre, New Delhi.
ICRIER's Board of Governors includes leading academicians, policymakers, and
representatives from the private sector. Dr. Isher Ahluwalia is ICRIER's chairperson. Dr.
Rajat Kathuria is Director and Chief Executive.
ICRIER conducts thematic research in the following seven thrust areas:
Macro-economic Management in an Open Economy
Trade, Openness, Restructuring and Competitiveness
Financial Sector Liberalisation and Regulation
WTO-related Issues
Regional Economic Co-operation with Focus on South Asia
Strategic Aspects of India's International Economic Relations
Environment and Climate Change
To effectively disseminate research findings, ICRIER organises workshops, seminars and
conferences to bring together academicians, policymakers, representatives from industry and
media to create a more informed understanding on issues of major policy interest. ICRIER
routinely invites distinguished scholars and policymakers from around the world to deliver
public lectures and give seminars on economic themes of interest to contemporary India.