Working Paper 176 - Medium-Term Sustainability of Fiscal ... · Medium-Term Sustainability of...
28
Medium-Term Sustainability of Fiscal Policy in Lesotho Edirisa Nseera No 176 – June 2013
-
Upload
nguyenhanh -
Category
Documents
-
view
217 -
download
2
Transcript of Working Paper 176 - Medium-Term Sustainability of Fiscal ... · Medium-Term Sustainability of...

Medium-Term Sustainability of Fiscal Policy in Lesotho
Edirisa Nseera
No 176 – June 2013
Correct citation: Edirisa, Nseera (2013), Medium-Term Sustainability of Fiscal Policy in Lesotho, Working
Paper Series N° 176 African Development Bank, Tunis, Tunisia.
Steve Kayizzi-Mugerwa (Chair) Anyanwu, John C. Faye, Issa Ngaruko, Floribert Shimeles, Abebe Salami, Adeleke Verdier-Chouchane, Audrey
Coordinator
Working Papers are available online at
http:/www.afdb.org/
Copyright © 2013
African Development Bank
Angle de l’avenue du Ghana et des rues
Pierre de Coubertin et Hédi Nouira
BP 323 -1002 TUNIS Belvédère (Tunisia)
Tel: +216 71 333 511
Fax: +216 71 351 933
E-mail: [email protected]
Salami, Adeleke
Editorial Committee Rights and Permissions
All rights reserved.
The text and data in this publication may be
reproduced as long as the source is cited.
Reproduction for commercial purposes is
forbidden.
The Working Paper Series (WPS) is produced
by the Development Research Department
of the African Development Bank. The WPS
disseminates the findings of work in progress,
preliminary research results, and development
experience and lessons, to encourage the
exchange of ideas and innovative thinking
among researchers, development
practitioners, policy makers, and donors. The
findings, interpretations, and conclusions
expressed in the Bank’s WPS are entirely
those of the author(s) and do not necessarily
represent the view of the African Development
Bank, its Board of Directors, or the countries
they represent.

Medium-Term Sustainability of Fiscal Policy in Lesotho
Edirisa Nseera1
1 Edirisa Nseera is a Senior Country Economist, Southern Africa Regional Resource Centre
AFRICAN DEVELOPMENT BANK GROUP
Working Paper No. 176 June 2013
Office of the Chief Economist
Abstract
Since the global financial and economic
crisis, fiscal sustainability has
increasingly become a topical issue for
all countries. This is of particular
concern to Lesotho given the permanent
drop in the countries revenue receipts
from the Southern African Customs
Revenue(SACU) Pool which finances
close to fifty percent of the country’s
recurrent budget. Given this situation,
access to concessional and non-
concessional resources from the donor
community remain critical for fiscal
sustainability in the short to medium-
term and even beyond. The objective of
this paper is to understand whether the
current trends in Lesotho’s fiscal policy
is sustainable in the short to medium-
term and in the event of shocks to key
fiscal drivers such as growth, interest
rates and concessional financing. The
projections of the primary deficit path
lead to the conclusion that Lesotho’s
fiscal policy is unsustainable in the
short-run. Drastic fiscal adjustment
measures are needed to put fiscal policy
on a sustainable path in the medium-
term and beyond. Sustainability
improves with higher growth, donor
willingness to provide concessional
funds and lower cost of concessional as
well as non-concessional funds. This
underlines the importance of improving
the investment environment which
accommodates faster growth and
mobilization of both concessional as well
as non-concessional resources. While
attainment of steady state primary
balance would be preferred, this would
require a lot of fiscal adjustment effort
which may not rhyme well given
Lesotho’s political sensitivities and
extreme poverty levels. It is, however,
possible to gradually move towards the
steady state primary balance by
improving expenditure efficiency and
rationalization as well as eliminating
unproductive spending in addition to
intensive resource mobilization
including widening the tax base. The
sustainable primary balance path
towards the steady state under various
scenarios is well discussed in the paper.
Additionally, the paper underlines the
need to take stock of the expected future
expenditures, in particular, those related
to pension and contingent liabilities
which might increase the fiscal
sustainability risk if not fully included in
the primary balance.
Keywords: Fiscal sustainability, access to concessional resources and growth

1
I. Introduction
This paper is designed to analyze the sustainability of Lesotho’s fiscal policy in the short to medium-
term which includes the period covered by the vision 2020. The recent global economic recession and
its impact on international trade poses significant challenges to small developing economies such as
Lesotho, which are already grappling with a number of issues including poverty in their pursuit of
sustainable development. The post crisis is clouded with uncertainties with regard to the future
recovery in the Southern African Customs Union (SACU) receipts to pre-crisis levels. These receipts
are dependent on the increased international trade between the SACU and the rest of the World,
which was affected post crisis. SACU receipts are the main source of budgetary resources which
finances close to 50 % of the country’s recurrent budget and yet dropped by close to a half post
crisis. In addition, the post crisis is clouded with uncertainties on the donors’ willingness to give not
only concessional but also non-concessional resources-a vulnerable financing situation. In an open
economy like Lesotho, a vulnerable public sector has potential damaging effect on the external sector.
It can lead to a twin deficit problem (government budget and current account balance) which
characterized developed, transition and developing economies including Lesotho in recent years. The
combined effect of these would be to increase the demand for domestically available non-concessional
resources (bonds) to finance the budget deficit which would raise domestic interest rates, appreciate
the exchange rate, cause loss of competitiveness and worsen the current account balance.
In light of the increasing competition for more concessional resources in the period after the global
economic crisis, to avoid the above situation, the country has to be a more attractive destination for
donor resources in particular concessional funds. In this respect, future access to these funds will
depend on creditor’s willingness to hold government assets in terms of debt, an aspect which was
incorporated in the sustainable primary balance path defined by (Edwards and Vergara 2002) and
which is adapted by this study. Additionally, given Lesotho’s vulnerability to external shocks during
the last decade, growth which is a key determinant of fiscal sustainability fluctuated. In view of the
above discussion, the objective of this paper is to understand whether the current trends in Lesotho’s
fiscal policy is sustainable in the short to medium-term and in the event of shocks to key fiscal drivers
such as growth, interest rates and concessional financing. A sustainable fiscal policy in this paper is
defined as a sustainable primary balance to GDP path which is consistent with a sustainable public debt
path of both types of debt. In turn, a sustainable public debt is defined as increases in each type of
debt in tandem with the willingness of the national and international community to accumulate the
government issued securities.
The question which this paper attempts to answer is whether or not the current course of fiscal policy in
Lesotho can be sustained in the short to medium-term or adjustments in taxes or spending will be
required to be sustainable. It also explores the question of how important is creditor’s willingness to
accumulate government securities, growth rate of the economy, interest rates and inflation for fiscal
sustainability. To arrive at fiscal sustainability, the government debt and fiscal profile would be firstly
observed as well as the key drivers. In this context, section II provides the background information on
Lesotho. Next, section III underpins the key literature which summarizes the conceptual review of
fiscal sustainability framework along with the previous studies in order to arrive at the research
method. Section IV describes the methodology, section V presents an empirical evaluation of the
results of the study under alternative scenarios informed by the country’s historical trends in the key

2
fiscal drivers including growth. Section VI underpins the policy discussions, recommendations and
conclusions.
II. Background Information on Lesotho
Fiscal sustainability has increasingly become an important topic for discussion in both developed and
developing countries following the global economic and financial crises. The crisis which was sparked
off by default on financial sector assets in the United States quickly transformed into an economic
crisis when it was transmitted to the real sector of the economy during 2008. While the impact on
developing countries such as Lesotho was not as pronounced due to their limited exposure to
financial assets from United States and other developed countries, they continued to be affected
by the secondly effects of these crises. In particular, Lesotho was affected through reduced demand
for its exports due to the slump conditions in the affected trading partners.
In the context of countries that depend on exports of limited products namely textiles to the
United States and Diamonds to Belgium, this was bound to inflict dampening effects on growth
(figure1). In a similar context, import trade flows to the SACU region were affected, culminating into
reduced trade receipts for the region.
Source: World Economic Outlook and Government of Lesotho data
These developments caused a substantial deterioration in Lesotho’s growth prospects coupled with
worsening of a number of key economic and social indicators. As demonstrated in figure 1, robust
recovery since 2006 was suddenly reversed in 2009 due to the global slump. Counter cyclical measures
supported by fiscal stimulus were implemented to abate the aftermath of the global economic slump.
This effort, however, was counteracted by the floods that affected the country in the early part of 2010.
Consequently, growth dropped from 5.6 in 2010 to 4.3 percent in 2011. Government revenues
continued to drop reflecting the global economic conditions. Customs receipts constitute the bulk of
budgetary revenues (40 percent) and the global economic crises directly fueled the widening of the
fiscal deficit through the international trade channel. Under a situation of constrained domestic
revenues and international inflows, foreign and domestic financing of the deficit has become
increasingly difficult for trade dependent economies like Lesotho. Lesotho has had to drawdown on
its long accumulated net international reserves in order to cover the gap left by the drop in the
SACU revenues at the risk of failing to maintain parity between the maloti and the rand.

3
Figure 2: Lesotho Primary Balance and General Government Gross debt (%of GDP)
-20
0
20
40
60
80
100
120
140
2000 2001 2002 2003 2004 2005 2006 2007 2008 2009 2010
Perce
nt G
DP
Lesotho General government gross debt
Lesotho General government primary net lending/borrowing
The economic crisis has made the fiscal position deteriorate from a surplus to a deficit position in the
post crisis. Lesotho’s main source of revenue continues to be Southern African Customs Union
(SACU) which, in the post crisis period has experienced precipitous decline thereby limiting
government’s fiscal space. Unfortunately, the government expenditure has not showed signs of
significant adjustment to the new fiscal realities. While the surpluses generated from SACU revenue
pool had in the past helped Lesotho to redeem non-concessional expensive loans and kept the debt to
GDP ratio at lower levels, it also contributed to higher levels of expenditures, in particular higher wage
bills (17 % of GDP, last ten years) which have proved difficult to reduce and this has in part
contributed to the worsening deficit (Figure 2).
Source: World Economic Outlook database
While Revenue to GDP ratio has declined, wages and salaries have been maintained at 15 percent of
GDP-post crisis, comparable to levels when the economy was experiencing surpluses from SACU
(2006-2008) and enjoying robust economic growth. Under constrained revenue situation and reduced
donor financing, the country’s fiscal position may prove unsustainable in the short to medium-term and
even beyond depending on the growth outlook and availability of budgetary resources, both external
and domestic.
The economic outlook for Lesotho in the medium-term appears gloomy and clouded with uncertainties
about the continued recovery of global demand for primary commodities (diamonds) and SACU
revenues as well as stiff competition in the export market for textiles after the expiry of the third party
clause on sourcing of inputs beyond 2015. In this respect, unless fiscal consolidation is intensified,
expenditures might supersede government revenue for several years and new financing both foreign
and domestic in the coming years will remain highly required to meet the expenditure needs.
Depending on the rate of growth of the economy and the willingness of the donor community to
provide concessional financing, Lesotho’s fiscal deficit might become unsustainable and thwart the
previous efforts which had drastically reduced its debt to lower levels (below 40 % threshold). The
same revelation has been emphasized by recent studies on selected HIPIC countries (Edward and
Vergara, 2002; Armendariz and Andrade, 2007).

4
As shown in figure 3, Lesotho has displayed sustained effort towards external debt reduction from
levels as high as 126 percent of GDP in 2001 to below 40 percent after 2008. This was a radical
approach towards debt reduction which was facilitated by a clear policy on contraction of new debt and
the appreciation of the Loti against the vehicle currencies for debt. This, however, was in addition to
the proper use of surpluses from SACU revenue which facilitated the redeeming of expensive non-
concessional external debts.
The joint World Bank and IMF 2010 debt sustainability assessment found Lesotho to be at a moderate
risk of debt distress provided fiscal position returns to balance. However, since 2010, the country’s
fiscal position has remained in deficits. The situation is compounded by the expenditure pressures
occasioned by the rehabilitation and resettlement requirements after the floods in 2011. The joint 2012
World Bank and IMF analysis Debt ratios are projected to remain manageable over the medium-term
as long as the fiscal position improves. The challenge is to find a sustainable primary balance path
under varying growth and debt path determined by external global environment including the
willingness of domestic and international community to supply financing resources.
In the post crisis period, Lesotho, like many other developing countries experienced deterioration in its
current account as a percent of GDP from surpluses up to 2008 to deficits during 2010 and 2011. As
shown in figure 3, the deterioration in the current account was mainly at the back of reduced exports
receipts due to global demand contraction for the country’s key exports: diamonds (less than 1 % 0f
exports) as well as textiles and apparels which constitute close to 70 % of Exports. The reduced current
transfers predominated by SACU receipts also contributed to the deterioration in the current account.
To a lesser extent, the successive decline in the factor income net from abroad contributed. They
dropped from 27 % of GDP in 2009 to 22 % in 2011. Additionally, the recessionary environment in the
neighbouring South Africa in the recent years somewhat affected the economy through retrenchment of
the Basotho workers, in particular, miners. However, while the number of mine workers dropped from
as high as 50,686 in 2008 to 41,427 in 2011, the remittances increased at a decreasing rate annually up
to 2010 before increasing again in 2011. The poor performance of exports as reflected by the drop of
about 4.4 percent of GDP between 2008 and 2011 echoed the concomitant decline in the export price
-40.0%
-20.0%
0.0%
20.0%
40.0%
60.0%
80.0%
100.0%
120.0%
2002 2003 2004 2005 2006 2007 2008 2009 2010 2011
per
cen
t o
f G
DP
Current Account Transfers SACU Receipts Merchandise Exports f.o.b. Merchandise Imports f.o.b. Current Account
source: Lesotho Authorities
Figure 3: Lesotho External Sector, 2002-2011

5
and volumes while the drop in imports absorption by close to 9.0 percent was due to reduced import
capacity occasioned by the successive drop in the gross national income growth. Over the same period
(2008-2011), receipts from SACU dropped by 19.2 percent of GDP reducing the wiggle room for the
government.
Domestic debt is an integral part of fiscal policy since it is a consequence of the government operated
deficit. The extent of domestic financing option largely depends on the cost involved in terms of the
interest rates. This is in addition to monetary and fiscal objectives of government. As shown in figure 4,
domestic debt has substantially dropped over time. For the period (2002-2010), public domestic debt
dropped to an annual average of 5 percent of GDP from 13 percent, largely, reflecting commitment to
debt management and the servicing of loans supported by the past surplus from the SACU revenue
pool.
However, the structure of domestic debt has remained the same predominated by short-term and then
long-term bank borrowing. It is, however, interesting to note that during 2008-2010; the period when
the financial crisis intensified, there was a systematic drop in domestic financing across instruments
(short-term, long-term and suppliers credit). However, since 2010, there are seemed to be a systematic
shift away from long-term borrowing to suppliers’ credit.
As demonstrated in figure 5, Lesotho’s external debt as a percent of GDP has evolved overtime,
dropping from an annual average of 60; 2002-2004 to 40; 2008-2010. The latter, was the period
affected by the global financial and economic crises. There was a steady drop in the external debt stock
as a percentage of GDP overtime, in part echoing the concerted effort to eliminate non-concessional
loans but largely reflecting the difficult in accessing new financing from the international donor
community, in particular after the global economic crises which intensified the scarcity of financing
resources. The stock of suppliers’ credit continued to grow during the crises as the bilateral and multi-
0.0%
2.0%
4.0%
6.0%
8.0%
10.0%
12.0%
14.0%
2002-2004 2005-2007 2008-2010
perc
ent
of G
DP
Domestic Debt Long-term domestic debt
Shorter-term domestic debt Suppliers credit
Figure 4: Lesotho's Domestic Debt and Structure, 2002-
Source: Lesotho Authorities

6
lateral debt stocks showed significant decline. This trend might continue as external financing prove
difficult to access.
While Lesotho is classified as a low debt country, however, in the aftermath of the global financial and
economic crisis, the economic outlook remains bleak. The basic debt ratios for Lesotho still showed a
moderate and safer position, however, depending on the growth scenario and the willingness of the
international as well as national community to hold Lesotho’s debt, the sustainability of Lesotho’s
primary deficit in the medium to long term remain a concern. These concerns are also founded on
increasing trends in new financing sought by both HIPIC and Non-HIPIC countries from international
financial institutions including the IMF in the aftermath of the crisis. These included both balance of
payments support and general budget support.
Source: Lesotho Authorities
III. Literature Review
This section explores the theoretical background of fiscal sustainability in order to provide a good
foundation for the model to be used in the paper. The debate on sustainability of fiscal policy
continues to be an important one and it remains unresolved in terms of definition, choice of variables
and methodology. Fiscal and debt sustainability are explicably bound because of the implications each
of them has on the other. Debt financing of government deficit is justified because of the failure of
the private sector to fully employ the available resources to match the aggregate demand for them,
which is a typical Keynesian argument. Under this argument, government is allowed to borrow to
bridge its fiscal gap as long as private investment is insufficient to absorb the available resources
(Domar 1944). Further, Domar demonstrated that fears of higher taxes to finance debt and their
detrimental effects could be arrayed by a constant overall deficit to GDP which would ensure
convergence of debt to GDP ratio and interest payments to GDP at finite values. In this respect,
constancy of debt to GDP ratio provided one of the important definitions of fiscal sustainability.
Another important contribution to the ongoing debate came from Blanchard (1990) who proposed two
necessary conditions for fiscal sustainability. The first condition requires that the ratio of debt to GNP
eventually converges back to initial level while the second one requires that the present discounted
0.0
6.0
12.0
18.0
24.0
30.0
36.0
42.0
48.0
54.0
60.0
66.0
2002-2004 2005-2007 2008-2010
p
e
r
c
e
n
t
o
f
G
D
P
Figure 5: Lesotho's External Debt and Structure, 2002-2010
External Debt External concessional External non-concessional

7
value of primary deficit to GNP is equal to the negative of the current level of debt to GNP.2This was
followed by debates on whether the two conditions were the same as argued by Blanchard (1990). The
conclusion, which was accepted by the author, was that the two were different. The second condition
is synonymous with the undiscounted value of debt ratio converging to its initial value or to any
finite value or diverging to any other value at a rate lower compared to the difference between
the growth rate of GDP and the interest rate, which are the dynamic factors in such a partial
equilibrium model (Buti and Franco, 2005). In this respect, they argued that while the second
condition implies the first condition, it is a necessary but not a sufficient condition for the latter.
Basing on the work of Blanchard 1990, in particular, the second condition for sustainability, various
studies have been conducted to test the inter-temporal budget constraint which has clear link to the
Ricardian equivalence3. Among these studies include Hamilton and Flavin (1986) who came to a
conclusion that by operating a deficit in one period, the government is indirectly making a commitment
to operate offsetting surpluses in the future period4. In the same category are studies by Aschauer 1985
and Seater and Mariano 1985.5 In a way, these are linked to (Domar, 1944) argument already alluded to
which is based on perfect foresight where agents are assumed to be ready to hold government debt all
times6.
However, some researchers including Ferguson and Kotlikoff (2003) have argued that agents’
willingness to hold a government paper is not without hiking the interest costs. Once the agents know
that the government fiscal policy is on an unsustainable path, they will raise the interest
premiums on government securities in order to compensate them from a default risk and high
inflation. This argument is also cognizant of the fact that in a modern money regime, rates on
securities usually follow a monetary policy stance in which case the interest rates can be higher
than the growth rate of GDP. In this case where the monetary policy is active, it has a strong
influence on whether a given fiscal path is sustainable or not. In this respect, it is important to note
that while some studies have argued that it only involuntary unemployment and excessive
unutilized capacities that the nation cannot “afford” (Arestis and Sawyer, 2003) , equally a nation
cannot “afford” high-interest-rate monetary policies when its objective is to achieve full employment
policy with non-inflationary fiscal deficits. This in part explains why the recent models of fiscal
sustainability have included a base money and domestic interest rate variable (Edward and Vergara,
2002; Armendariz and Andrade, 2007).
2
Equation for the first condition is lim bn exp-(rint-rg)n=0 as n tends to infinity. Where rint is real interest rate and rg is real growth rate of GNP.
This implies that as the debt/GNP ratio (b) tends to bo, the discounted value of debt tends to zero and for the second condition is ƒ0n ds exp-( rint-
rg) ds=-b0 . Where ds is the primary deficit to GNP ratio. This implies that for fiscal policy to be sustainable, the primary deficit to GNP must be
equal to the negative of the current debt to GNP ratio. In other words, government with an outstanding debt must sooner or later run a primary budget surplus for fiscal policy to be sustainable. 3 It is an economic theory which suggests that when a government tries to stimulate demand by increasing debt-financed government spending, demand
remains unchanged. This is because the public will save its excess money in order to pay for future tax increases that will be initiated to pay off the debt. This Ricardian equivalence was extended by Robert Baro. 4 While a deficit is financed through borrowing from creditors, future surpluses might mean expenditure adjustments or generating more revenues
through tax or other measures. This is also in line with recent studies by Cecchetti, S.G, Mohanty, M.S and Zampolli, F(2010). 5 Baro(1984) tested the budget constraint together with permanent income hypothesis, Hamiliton and flavin (1986) tested inter-temporal budget
constraint. Aschauer (1985) and Seater and Mariano (1985) tested the hypothesis that governments’ receipts must equal expenditures in present-value
terms jointly with a permanent income hypothesis. 6 This Ponzi type of argument may not hold all the times. In the context of developing countries with weak economic institutions, fiscal risks might limit
fiscal sustainability. Fiscal risks can potentially reduce the willingness of the economic agents to hold government securities which will in turn reduce
economic growth (Barnhill and Kopits, 2003).

8
In the literature, there are also views which are linked to “sound finance” which postulates that
sustainability is to do with good housekeeping(Blanchard et al. (1990). This study argues that it is a
judgment on whether based on the policy currently in books, a government is headed towards excessive
debt accumulation.
In literature, three methodologies for assessing and testing fiscal sustainability are identifiable. These
include stationarity test or cointegration test based on the inter-temporal budget constraint model, the
reaction function model7 and primary gap and tax gap indicators.
The current study draws more on the literature and definition of fiscal sustainability which is in
tandem with a stationary or constant debt to GDP ratio and the overall demand for government
securities (Edward and Vergara 2002). This is also in line with the inter-temporal budget constraint
literature. Armendariz and Andrade (2007) applied a similar model to assess debt sustainability in
Guyana and the results indicated that Guyana would have to make a stronger fiscal effort to achieve
debt sustainability if access to concessional funds is constrained. It was also highlighted that “most
debt sustainability analyses do not provide a more explicit or direct channel to assess and quantify the
fiscal impact of a decline in the availability of future subsidized funds”. This shortcoming was
however, addressed in the model by (Edward and Vergara 2002). Additionally, this model takes due
cognizance of the importance and role of domestic debt which is issued on non-concessional terms on
fiscal sustainability. This is of particular concern and relevance in countries like Lesotho where
domestic resources have the potential to significantly contribute towards debt accumulation in face
of dwindling concessional resources overtime. Hence, the approach in this paper is to compute public sector primary balance which is
compartible with sustainable and stable debt to GDP path. Following (Edward and Vergara 2002, it
develops a model to capture some factors determining fiscal sustainability. Like most recent studies in
these areas (Edward and Vergara, 2002; Armendariz and Andrade, 2007; Armendariz and Andrade
2007), this study uses both domestic and foreign debt to assess fiscal sustainability. While cognizant of
the existence of the backward-looking approaches to fiscal sustainability, the current study adapts a
forward-looking approach to assess fiscal sustainability for Lesotho.
IV. Methodology
This section outlines the methodology used in the study including the sensitivity analysis to be to
assess fiscal sustainability for Lesotho. The study recognizes the debt sustainability often conducted
by the Joint IMF and World Bank for most of the countries. The Joint IMF and World Bank analysis is
based on the framework for low-income countries which takes into account indicative thresholds for
debt burden indicators determined by the quality of the country’s policies and institutions. However,
due to its complexity and demand in terms of data for conducting formal tests of sustainability, the
current study adopts the definition and approach to fiscal sustainability used by Edwards and Vergara
(2002) as an alternative to the approach by the Joint World Bank and IMF approach. The major gain in
this approach is its simplicity and data economy and yet powerful in its forecast of the both the desired
primary balance and the debt path. As already alluded the model adapted in this study avoids the
shortcomings of other fiscal sustainability models by incorporating both domestic and foreign debt
to assess fiscal sustainability. The analytical framework followed is based on the model developed by
7 The emphasis under this approach is the mean-reverting debt-GDP ratio which signals positive response of the primary surpluses to the debt-GDP
ratio. Others use unit root to detect this tendency. This will be implied by the relationship between the primary balance and the debt-GDP ratio. Mean
reverting trend or no unit root will signal fiscal sustainability.

9
(Edwards and Vergara, 2002) in relation to post HIPIC countries with limited concessional financing
expected overtime. The relatively low levels of debt for Lesotho do not mean that debt is not a problem
for such a developing and open economy country. On the contrary, they mean that debt can be a much
bigger problem for such countries than for the developed countries. Japan has a public debt ratio to
GDP that is well above 150 percent and yet there is little concern about the solvency of Japan. At the
same time, developing countries often face debt crises with debt levels which are as low as 30 per cent
of GDP. The adapted model is premised on the following assumptions:
(a) Willingness of the international donor community to accumulate concessional debt at a
rate of θ and 0 ≤ θ < 1.
(b) Willingness of the national community to accumulate non-concessional debt at a rate of
B .
(c) In the long run, the rate of accumulation is bounded.
(d) All Debt is foreign currency denominated and no need for debt valuation adjustments.
(e) In the baseline scenario, domestic rate of inflation is not changed and income elasticity of
money demand is unity.
The model specification starts with the following public debt equation.
ΔDt = { rtCDCt-1 + rt
D DDt-1 } + pbt - Δ Bt…………………………………………………………………………(1)
Where t is a time variable while rtC and rtD are nominal interest rates on concessional and domestic
debt (non-concessional) respectively. Pbt is the primary balance to GDP and ΔBt is the change in the
monetary base which corresponds to seignorage. The actual magnitude of seignorage will depend on
the rate of domestic inflation, as well as on the ratio of the monetary base to nominal GDP. Denoting
the real rate of GDP growth by g, and the rate of dollar inflation by π *, these constraints may be
written as:
θ ≤ (g + π *) ; β ≤ ( g + π *) ………………………………………………………….……..(2)
From equation (1), and using the sustainable rates of growth (θ for concessional and β for domestic
debt), a dynamic behavior equation of the sustainable primary balance to GDP ratio is obtained. A
sustainable primary balance to GDP ratio at any period of time t has to be consistent with the aggregate
debt to GDP ratio being on a sustainable path. In the dynamic primary balance behavior equation
below, a positive number denotes a primary deficit.
( pb t / Y t ) = [ { θ - rtC } ( DC 0 / Y 0 ) e
( θ - g - π * ) ( t –1) +{ β - rt
D } ( DD 0 / Y 0 )
e ( β - g - π * ) (t –1)
] [1 / ( 1 + g + π *) ] + (g +π ) ( B 0 / Y 0 )………………………...…(3)
Where (DC 0 / Y 0) is the initial ratio of the face value of concessional debt to GDP and (DD 0 / Y 0) is
the initial domestic debt to GDP ratio. e is a base raised to its exponents, π is the (target) rate of
domestic inflation and ( B 0 / Y 0 ) is the initial ratio of base money to GDP. In equation (3), the initial
debt to GDP ratios (DC0 / Y0) and (DD0 / Y0) should be interpreted as the ratios in the starting year.
According to equation (3), the dynamic path for the sustainable primary balance depends on variables
comprising nominal interest rates on both types of debt, the rates of domestic and foreign inflation, the
rate of growth of real GDP, and the sustainable rates of growth of both types of debt (θ and β). In the
next section, assumptions on the availability of concessional financing as well as the rate of growth of
GDP and their effect on sustainability of the primary balance are discussed. The paper investigates the

10
role of growth on sustainability using alternative growth rates ranging from 0 to 7 percent per annum.
In the past decade, growth has fluctuated between 2 to 5 % which are included in the simulation. Also
included are growth rates of 0 to 1 and 6 to 7 at the extreme should the economy not reflect its
historical growth rates in the past decade. This stress tests the government and IMF growth
assumptions in the medium-term and their implications on sustainability of the primary balance.
The paper is largely based on macroeconomic data of selected parameters of the fiscal sustainability
model alluded to in the analytical framework. A summary description of the data is elucidated in the
table 1 below.
Parameter Symbol Assumed value Sources
Initial Concessional
debt to GDP ratio
(DC0/Y0) 30.4 % (96 percent of
external debt
assumed
concessional).
IMF, Article IV consultation;
Lesotho and World Economic
outlook.
Initial domestic
debt to GDP
DD0/Y0 4.8 % From different official
documents (difference
between.
Rate of
accumulation of
concessional debt
θ
Different
assumptions
depending on the
scenario under
consideration.
Rate of
accumulation of
domestic debt
β
(g + π *)
Assumes that the initial
ratio is maintained
Rate of growth of
nominal GDP in
US dollars
(g + π *)
Alternative values of
real GDP growth (0-7
percent) are assumed.
The rate of US
inflation is assumed
to be 2.5 percent
Growth assumptions (0-7
percent)
Interest rate on
concessional funds
rc 2.3 percent Derived from historical
(nominal effective interest
rates) average for the past four
years. Derived from public
debt data from Lesotho
Authorities.
Interest rate on
commercial funds
rd 8.9 percent Taken from historical
(nominal effective) average
for the past four years.
Derived from public debt data
from Lesotho Authorities.
Monetary base to
GDP
(BO/YO) 3.4 percent Computed as CIC to GDP
ratio from Central Bank Data
(several reports)
Domestic Rate of Average historical (past four

11
Inflation π 6.7 percent years), data from Lesotho
Authorities.
V. Empirical Evaluation
1. Required Primary Balance Path
The presentation and analysis of the results is based on three scenarios. Scenario I, assumes that the
nominal value of concessional debt is maintained constant overtime and no net funds (in nominal
dollars) are provided. Scenario II, assumes that the donor community is willing to maintain the real
dollar value of the concessional debt at its initial level while in Scenario III, the international
community is willing to increase concessional funds in real terms. The required primary balance can be
positive or negative and in this paper a positive balance is a deficit and a negative is a surplus. In the
figures for the sustainable primary balance, the more negative the number, the more the fiscal
adjustment effort required. Similarly, steady state primary balance can assume a negative or positive
value8. The choice of growth rate scenarios of 2-5 were based on the historically observed levels in the
last decade but to further stress the model, growth rates of 0-1 and 6-7 were included to take care of
the possibility and impact of any negative and positive shock at the extreme.
The results shown in figure 6 reveal that in all scenarios (I, II and III), the sustainable primary deficit to
GDP ratio (which excludes interest payment) is sensitive to the GDP growth rate. A higher GDP
growth rate reduces the required fiscal adjustment effort towards a sustainable primary deficit and the
steady state. For example, moving from figure 6a to 6h, GDP growth increases from zero percent to 7
percent and for a more fiscally restrictive scenario of declining concessional funding (scenario I), the
sustainable primary balance shifts from a required surplus of 0.8 percent to 0.2 percent in 2010. In a
more optimistic scenario of increasing concessional funding in real terms (scenario III), sustainable
primary balance increases from 0.0 percent of GDP to a deficit of 1.1 percent of GDP in 2010.
Similarly, with a moderate scenario where the donors maintain the real dollar value of concessional
funding at initial level (scenario II), the sustainable primary balance increases from 0.0 percent to a
deficit of 0.6 percent as the GDP growth shifts from zero to 7 percent per annum. This observation is
supported by the fact that at a given real interest, once growth rate of GDP is lower, the country has to
maintain a more restrictive fiscal position in order to remain sustainable (see figure 6a: zero growth
rate). At higher growth rate, however, this condition is continuously violated and the sustainable
primary balance required is eased (less restrictive), hence, the country can afford to run a deficit and
remain sustainable (see figure 6b-6h).
How sustainable is Lesotho’s fiscal policy in the short to medium-tem? Given Lesotho’s primary
deficit of about 4.5 percent of GDP in 2010 and 9 percent in 2011, it is clear from figure 6a through 6h
that this is far away from the sustainable primary deficit in all scenarios and hence the country’s fiscal
policy appears unsustainable. In the medium-term, given the current fiscal position and policies, a lot of
fiscal adjustment effort would be required to synchronize with the sustainable fiscal adjustment path in
all scenarios and under all considered growth rates (Figure 6a-6h). For example, assuming the growth
rate of 4.5 percent (IMF projected average growth, 2011-2016), under scenario I:declining concessional
funds, the country would have to run a sustainable primary surplus of 0.23 percent of GDP during
8 If the rate of growth of nominal GDP in dollars is low, relative to the interest rate on domestic debt, it is most likely that
the country will need to run a primary surplus in the long run. However, this will depend on seignorage, captured by base
money to GDP in this paper.
12
2012, decreasing gradually until it reaches a deficit of 0.19 percent in the 2030. In this case, the
required fiscal consolidation as percent of GDP would be 4.7 in 2012 and 4.3 in 2030, a lot of fiscal
effort. Beyond this, the sustainable primary deficit would increase and the required adjustment
successively decreases until; it gradually stabilizes at a steady state primary deficit of 0.55 percent of
GDP.
In the scenario II, under the growth rate of 4.5 percent per annum, sustainable fiscal policy would
require that the country runs a sustainable deficit of 0.35 percent in 2010 and 2012 increasing
gradually until it reaches 0.36 in 2030. In this case, given the 2010 primary deficit position of 4.5
percent of GDP, Lesotho would have to adjust its deficit as a percent of GDP by 4.1 in 2010 and 2012.
In 2030, the primary deficit would have to be adjusted by 4.2 percent of GDP. Beyond this, the trend
continues until a stable steady state sustainable primary deficit of 0.55 is attained. Again this is a lot of
fiscal adjustment which requires strong commitment from the authorities.
In a similar vein, given the fiscal position of 4.5 percent of GDP and with growth rate of 4.5 percent
annually, scenario III, which is less restrictive, would require fiscal adjustment of 3.5 percent of GDP
in 2010 and 2012 as well. The required fiscal adjustment, however, will increase to 3.8 percent of GDP
in 2030. Beyond this, more adjustment would be required until a stable steady state primary deficit of
0.55 percent of GDP is attained9.
9 In all scenarios, the same steady state sustainable primary balance is reported under each growth rate. This is explained by
having the steady state level of concessional debt equal to zero in all scenarios.

13
2. Preferred Scenario
-0.40%
-0.20%
0.00%
0.20%
0.40%
0.60%
0.80%
1.00%
1.20%
20
10
20
11
20
12
20
13
20
14
20
15
20
16
20
17
20
18
20
19
20
20
20
21
20
22
20
23
20
24
20
25
20
26
20
27
20
28
20
29
20
30
Figure 6f: Lesotho's Sustainable Primary Deficit Path (in percent of GDP) at 5 Percent GDP Growth Rate
scenario I scenario II
scenario III Steady state
-0.60%
-0.40%
-0.20%
0.00%
0.20%
0.40%
0.60%
0.80%
1.00%
20
10
20
11
20
12
20
13
20
14
20
15
20
16
20
17
20
18
20
19
20
20
20
21
20
22
20
23
20
24
20
25
20
26
20
27
20
28
20
29
20
30
Figure 6e: Lesotho's Sustainable Primary Deficit Path (in percent of GDP) at 4 Percent GDP Growth
Rate
Scenario I Scenario II
-0.60%
-0.40%
-0.20%
0.00%
0.20%
0.40%
0.60%
0.80%
20
10
20
11
20
12
20
13
20
14
20
15
20
16
20
17
20
18
20
19
20
20
20
21
20
22
20
23
20
24
20
25
20
26
20
27
20
28
20
29
20
30
Figure 6d: Lesotho's Sustainable Primary Deficit Path (in percent of GDP) at 3 Percent GDP Growth Rate
Scenario I Scenario II
-0.40%
-0.20%
0.00%
0.20%
0.40%
0.60%
0.80%
1.00%
1.20%
1.40%
20
10
20
11
20
12
20
13
20
14
20
15
20
16
20
17
20
18
20
19
20
20
20
21
20
22
20
23
20
24
20
25
20
26
20
27
20
28
20
29
20
30
Figure 6g: Lesotho's Sustainable Primary Deficit Path (in percent of GDP) at 6 Percent GDP Growth
Rate
Scenario I Scenario II
-0.80%
-0.60%
-0.40%
-0.20%
0.00%
0.20%
0.40%
0.60%
20
10
20
11
20
12
20
13
20
14
20
15
20
16
20
17
20
18
20
19
20
20
20
21
20
22
20
23
20
24
20
25
20
26
20
27
20
28
20
29
20
30
Figure 6c: Lesotho's Sustainable Primary Deficit Path (in percent of GDP) at 2 Percent GDP Growth
Rate
scenario I scenario II
scenario III Steady state
-0.80%-0.70%-0.60%-0.50%-0.40%-0.30%-0.20%-0.10%0.00%0.10%0.20%0.30%
20
10
20
11
20
12
20
13
20
14
20
15
20
16
20
17
20
18
20
19
20
20
20
21
20
22
20
23
20
24
20
25
20
26
20
27
20
28
20
29
20
30
Figure 6b: Lesotho's Sustainable Primary DeficitPath (in percent of GDP) at 1 Percent GDP Growth Rate
scenario I scenario IIscenario III Steady state
source : Author's computation
-0.80%
-0.70%
-0.60%
-0.50%
-0.40%
-0.30%
-0.20%
-0.10%
0.00%
0.10%
0.20%
20
10
20
11
20
12
20
13
20
14
20
15
20
16
20
17
20
18
20
19
20
20
20
21
20
22
20
23
20
24
20
25
20
26
20
27
20
28
20
29
20
30
Figure 6a: Lesotho's Sustainable Primary Deficit Path (in percent of GDP) at 0 Percent GDP Growth
Rate
scenario I scenario IIscenario III Steady state
-0.40%-0.20%0.00%0.20%0.40%0.60%0.80%1.00%1.20%1.40%1.60%1.80%
20
10
20
11
20
12
20
13
20
14
20
15
20
16
20
17
20
18
20
19
20
20
20
21
20
22
20
23
20
24
20
25
20
26
20
27
20
28
20
29
20
30
Figure 6h: Lesotho's Sustainable Primary Deficit Path (in percent of GDP) at 7 Percent GDP Growth Rate
scenario I scenario IIscenario III Steady state

14
Amongst the three scenarios, scenario one which assumes that the nominal value of concessional debt
is maintained constant overtime and no net funds (in nominal dollar terms) are provided appears the
most realistic for various reasons. The joint IMF and World Bank DSA (2010) projected grant
equivalent financing to drop overtime from 31.6 percent in 2010 to below 15 percent (2011-2015).
While the donors are willing to provide some concessional funds, these are meant to revamp the
economy from the damage caused by the floods in 2010. In particular, most of the concessional
financing are expected from the IMF under a three year Extended Credit Facility arrangement and
augmentation of access10
. This will also include concessional resources from the African Development
Bank11
. The IMF augmentation is meant to reduce pressure on the fiscal resources of government in
order to protect the country’s reserve position. Protection of reserves will help to maintain the peg
between the Loti and the Rand. This might not constitute a significant increase in concessional
resources in real terms. Additionally, the projection of the sustainable primary deficit in scenarios I, is
closer to the projections of the IMF for 2012-2031 for individual years and average (Figure 7). In view
of this, the subsequent stress tests and discussions in sections 5.3 are based on scenario I as the baseline
against alternative specifications of the parameters assumed constant; (inflation, domestic interest rate
and base money).
10
SDR 41.9 million approved by the Board of Directors on June 2, 2010 and with augmentation this will increase to
UA 50.6 million(US$ 77.84 million) 11
African Development Bank planned to extend about UA 15 million during the ADF12 Cycle.
-1.26
-1.83
-3.30
-5.15-5.03
-1.15
-0.60
-0.22 -0.18 -0.15 -0.11 -0.08 -0.170.150.39 0.38 0.38 0.38 0.38 0.38 0.36
1.06 1.04 1.03 1.01 0.99 1.04
-0.01
0.55 0.55 0.55 0.55 0.55 0.550.55
-5.50
-5.00
-4.50
-4.00
-3.50
-3.00
-2.50
-2.00
-1.50
-1.00
-0.50
0.00
0.50
1.00
1.50
2012 2013 2014 2015 2016 Average 2011-16 Average 2017-31
Figure 7: Comparison of Sustainable Primary Deficit at 5 Percent with IMF Projection (2012-2031)
IMF Projected Primary DeficitSustainable Primary Deficit (Scenario I at 5 percent growth)Sustainable Primary Deficit (Scenario II at 5 percent growth)Sustainable Primary Deficit (Scenario III at 5 percent growth)Steady State Primary Deficit
Source : IMF WEO,2012 Artcle IV consultation and Study Computations

15
3. Alternative Assumptions and Effect on Sustainability
Stress tests on the key results were conducted against the alternative assumptions of some of the
parameters of the model in order to identify the key aspects that need to be watched by the authorities
over the medium-term. Tests comprised lower cost of non-concessional financing, lower cost of
concessional debt and higher base money to GDP ratio. As demonstrated in figure 8, the higher base
money, lower cost of both concessional and non-concessional financing at 2010 levels (tend to be less
restrictive on the sustainable primary deficit (improve the headroom for accommodating a much larger
primary deficit) but still requires considerable fiscal adjustment for Lesotho’s fiscal policy to become
sustainable given the initial primary deficit of 4.5 percent of GDP. At the extreme, if there is a rise in
the cost of both concessional (3.0 percent)and non-concessional debt (9.6 percent) to their historical
average for the past ten years(2000-2010), the headroom for accommodating a higher sustainable
deficit will be significantly reduced, calling for more restrictive fiscal stance to remain on a
sustainable fiscal path ( figure 8).
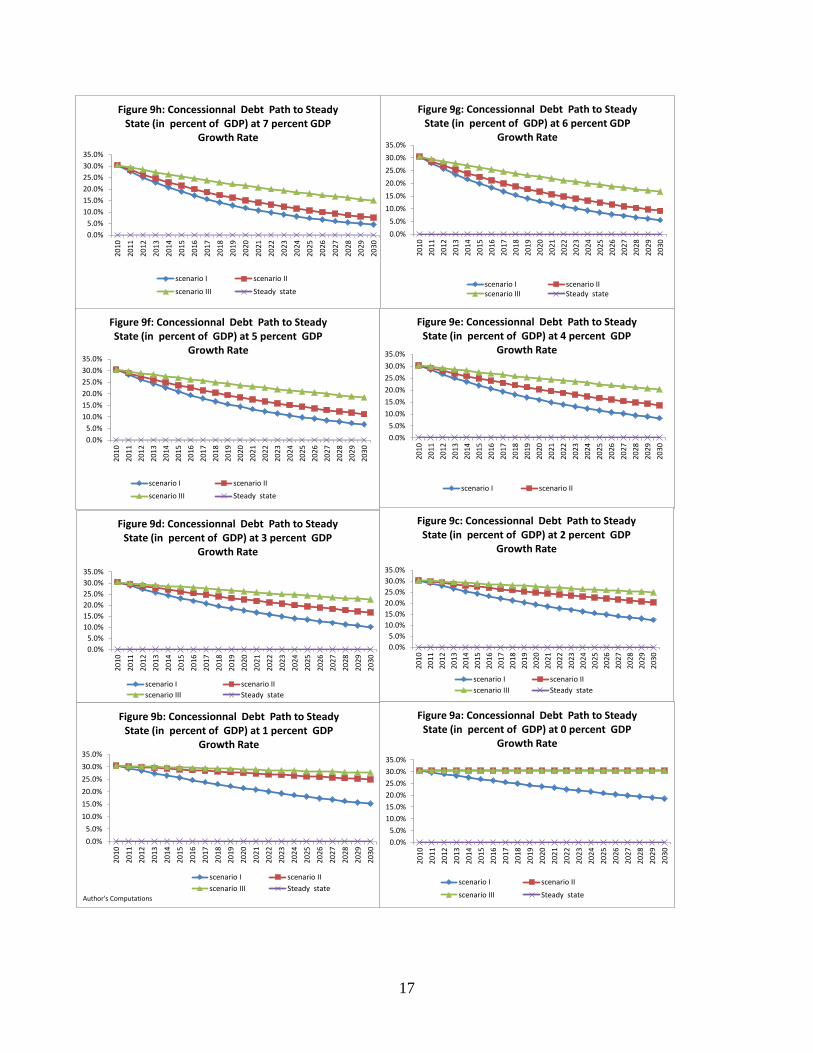
4. Public Concessional Debt Path
This section investigates how the willingness of the donors to hold Lesotho’s debt will affect the
concessional debt path towards the steady state. In order to provide answers to this question, the study
has considered three scenarios already alluded to in the previous sections. Scenario I, assumes that the
nominal value of concessional debt is maintained constant overtime and no net funds (in nominal
dollars) are provided. Scenario II, assumes that the donor community is willing to maintain the real
-0.6%
-0.4%
-0.2%
0.0%
0.2%
0.4%
0.6%
0.8%
2010 2011 2012 2013 2014 2015 2016 2017 2018 2019 2020 2021 2022 2023 2024 2025 2026 2027 2028 2029 2030 2031
%
o
f
G
D
P
Figure 8: Effect of changing some of the baseline assumptions(Scenario I at 5 percent growth) on Sustainable
Primary Deficit Path
Non-concessional interest rate at historical levels of 4.0 percent (2010, lower than baseline)
Sustainable primary surplus at steady state
Baseline (scenario I)
Interest rate on concessional funds at historical levels of 0.9 percent(2010, Lower than baseline)
Base money /GDP at 5 percent ( higher than the baseline)
Non-concessional interest rate at historical levels of 9.6 percent (past 10 years, higher than baseline)
Interest rate on concessional funds at historical levels of 3.0 percent( past 10 years, Higher than baseline)

16
dollar value of the concessional debt at its initial level while Scenario III the international community is
willing to increase concessional funds in real terms. The results are shown in figure 9below.
17
0.0%
5.0%
10.0%
15.0%
20.0%
25.0%
30.0%
35.0%
20
10
20
11
20
12
20
13
20
14
20
15
20
16
20
17
20
18
20
19
20
20
20
21
20
22
20
23
20
24
20
25
20
26
20
27
20
28
20
29
20
30
Figure 9h: Concessionnal Debt Path to Steady State (in percent of GDP) at 7 percent GDP
Growth Rate
scenario I scenario II
scenario III Steady state
0.0%
5.0%
10.0%
15.0%
20.0%
25.0%
30.0%
35.0%
20
10
20
11
20
12
20
13
20
14
20
15
20
16
20
17
20
18
20
19
20
20
20
21
20
22
20
23
20
24
20
25
20
26
20
27
20
28
20
29
20
30
Figure 9g: Concessionnal Debt Path to Steady State (in percent of GDP) at 6 percent GDP
Growth Rate
scenario I scenario IIscenario III Steady state
0.0%
5.0%
10.0%
15.0%
20.0%
25.0%
30.0%
35.0%
20
10
20
11
20
12
20
13
20
14
20
15
20
16
20
17
20
18
20
19
20
20
20
21
20
22
20
23
20
24
20
25
20
26
20
27
20
28
20
29
20
30
Figure 9f: Concessionnal Debt Path to Steady State (in percent of GDP) at 5 percent GDP
Growth Rate
scenario I scenario II
scenario III Steady state
0.0%
5.0%
10.0%
15.0%
20.0%
25.0%
30.0%
35.0%
20
10
20
11
20
12
20
13
20
14
20
15
20
16
20
17
20
18
20
19
20
20
20
21
20
22
20
23
20
24
20
25
20
26
20
27
20
28
20
29
20
30
Figure 9e: Concessionnal Debt Path to Steady State (in percent of GDP) at 4 percent GDP
Growth Rate
scenario I scenario II
0.0%
5.0%
10.0%
15.0%
20.0%
25.0%
30.0%
35.0%
20
10
20
11
20
12
20
13
20
14
20
15
20
16
20
17
20
18
20
19
20
20
20
21
20
22
20
23
20
24
20
25
20
26
20
27
20
28
20
29
20
30
Figure 9d: Concessionnal Debt Path to Steady State (in percent of GDP) at 3 percent GDP
Growth Rate
scenario I scenario II
scenario III Steady state
0.0%
5.0%
10.0%
15.0%
20.0%
25.0%
30.0%
35.0%
20
10
20
11
20
12
20
13
20
14
20
15
20
16
20
17
20
18
20
19
20
20
20
21
20
22
20
23
20
24
20
25
20
26
20
27
20
28
20
29
20
30
Figure 9c: Concessionnal Debt Path to Steady State (in percent of GDP) at 2 percent GDP
Growth Rate
scenario I scenario II
scenario III Steady state
0.0%
5.0%
10.0%
15.0%
20.0%
25.0%
30.0%
35.0%
20
10
20
11
20
12
20
13
20
14
20
15
20
16
20
17
20
18
20
19
20
20
20
21
20
22
20
23
20
24
20
25
20
26
20
27
20
28
20
29
20
30
Figure 9b: Concessionnal Debt Path to Steady State (in percent of GDP) at 1 percent GDP
Growth Rate
scenario I scenario II
scenario III Steady stateAuthor's Computations
0.0%
5.0%
10.0%
15.0%
20.0%
25.0%
30.0%
35.0%
20
10
20
11
20
12
20
13
20
14
20
15
20
16
20
17
20
18
20
19
20
20
20
21
20
22
20
23
20
24
20
25
20
26
20
27
20
28
20
29
20
30
Figure 9a: Concessionnal Debt Path to Steady State (in percent of GDP) at 0 percent GDP
Growth Rate
scenario I scenario II
scenario III Steady state

18
As demonstrated in this Figure 9, the debt path towards the steady state varies considerably depending
on the target growth rate and the scenario considered. In all scenarios, the higher the growth rate of the
economy in real terms, the faster the rate at which the concessional debt will decline. Under the same
growth target, the rate of decline of concessional debt towards the steady state will be fastest under
scenario I and then scenario II. Scenario III yields the slowest rate of decline of concessional debt. For
example, assuming growth rate of 5 percent per annum, it will take 10 years for the initial concessional
resources of 30.4 percent of GDP to drop by half under scenario I, 15 years under scenario II and 28
years under scenario III. Consistent with this trend (Figure 9f), the country would have to maintain an
average primary deficit as a percent of GDP of zero under scenario I, 0.37 under scenario II and 0.94
under scenario III. This means that with more access to concessional resources (scenario III), Lesotho
would sacrifice less in terms of the fiscal adjustment effort given its initial primary deficit position of
4.5 percent of GDP. It will, however, sacrifice more under scenario II and I where access to donor
resources is limited.
VI. Policy discussions, Conclusions and Recommendations
1. Policy Discussions
In view of the above analysis, it is clear that even if Lesotho is considered a low debt
country, under various assumptions with regard to availability of concessional financing and
growth, Lesotho’s fiscal deficit appears unsustainable in the short to medium-term and even
beyond. At the initial level of primary deficit of 4.5, a lot of fiscal effort would be required to bring
the fiscal balance down to sustainable levels until it eventually stabilizes at steady state levels of 0.15
-0.7 percent of GDP depending on the growth target chosen. The current plan of government to reduce
the fiscal deficits to 3 percent per annum as indicated in its new National Strategic Development Plan is
still far below the required fiscal effort. Given the level of the required fiscal effort and the political
implications of implementing the expenditure adjustment option, more concessional financing might be
required in the medium-term for the fiscal policy in Lesotho to remain sustainable. In the baseline scenario of declining concessional financing, Lesotho might need to operate
annual average primary surplus of 0.2 percent for 2011-2016 and 0.1 percent for the period 2017-
2031 in order to be sustainable. This assumes growth rate of 5 percent per annum but higher growth
will improve sustainability. This could be the case if investment in the phase II of the Lesotho Highland
Water Project and construction of the Metolong dam increases growth to 12 percent per annum. This
would allow the country to operate an annual average primary deficit of 0.5 percent (2011-2016) and
0.8 percent (2017-2031). This revelation remains a critical challenge to the implementation of the new
National Development Strategic Plan and the vision 2025 which would require more financial
resources to realize the overarching objective of inclusive growth and poverty reduction. The
government has been under the IMF Extended Credit Facility since 2010 and is implementing fiscal
adjustments as mitigation to the impact of the drop in SACU revenues.
In view of the political sensitivities, in particular, occasioned by the coalition arrangements and
extensive poverty, improving expenditure efficiency and rationalization as well as eliminating
unproductive spending and intensive resource mobilization including widening the tax base will
be critical for fiscal sustainability in the short to medium-term. Avoidance of budget leakages
through implementation of standardized guidelines on procurement of goods and services will create
the required savings and improve fiscal sustainability. However, even under these extreme scenarios,

19
there are concerns about the quality and durability of fiscal adjustments in the presence of inadequate
accounting for pension and other contingent liabilities in the budget projection. When these
expenditures are unveiled in the future and depending on their magnitude, they might crowd out the
rest of the expenditures and make it difficult to attain the required adjustments. This underscores the
need to take stock of these expected future expenditures, which might increase the fiscal sustainability
risk if not fully included in the primary balance. In other words, understatement of the primary balances
caries the risk of increasing the required adjustment in the future. As indicated by Cecchetti et al
(2010), failure to account for some of these costs including pension presents a number of countries with
the prospect of enormous future costs that are not fully recognized in current budget projections.
Finally, growth enhancement through a more favourable investment climate also becomes critical
in view of the link between higher growth and fiscal sustainability. Owing to limited resource
availability, enhancing growth calls for more participation of the private sector to generate the requisite
investment and growth. In this respect, deepening of reforms tailored towards attracting and retaining
foreign direct investment as well as broadening of the tax base becomes paramount.
2. Concluding Remarks and Recommendations
Fiscal sustainability in Lesotho remains a real challenge in the short to medium-term and even
beyond which calls for government’s deliberate effort towards fiscal adjustment and concessional
resource mobilization. In the event of a deterioration in the global growth environment, both
SACU and concessional donor resources might significantly drop. Such a fragile situation might
coincide with sluggish domestic growth and call for severe fiscal adjustment with significant political
ramifications given the state of unemployment and poverty in the country. Reforms tailored towards
creating a more favourable investment environment become more apparent than ever before.

20
Reference
Arestis, Philip and Malcolm Sawyer (2003) “The Case for Fiscal Policy”, Jerome Levy Economics
Institute Working Paper No. 382 (May).
Armwndariz, E. and G.Andrade (20007), “Debt Sustainability in Guyana”, Inter-American
Development Bank, Washington D.C: Available (on line) http://www.
.iadb.org/res/publications/pubfiles/pubCSI-156.pdf
Aschauer, D. (1985),“Fiscal Policy and Aggregate Demand”, Available on (on-line)
http://abacus.bates.edu/~daschaue/aschauer85.pdf
Barnhill, Theodore M., Jr. and George Kopits (2003) “Assessing Fiscal Sustainability Under
Uncertainty,” manuscript, George Washington University.
Blanchard, O (1990), “Suggestions for a New Set of Fiscal Indicators” OECD Department of Economic
and Statistics” http://www.oecd.org/tax/publicfinanceandfiscal/2002735.pdf.
Blanchard, O., J.C. Chouraqui, R.P. Hagemann and N. Sartor (1990), “The sustainability of Fiscal
Policy: New Answers to an Old question”, Available (on line)
http://www.oecd.org/eco/economicoutlookanalysisandforecasts/34288870.pdf.
Buti.M and Daniele Franco.D (2005), “Fiscal Policy in Economic and Monetary Union: Theory,
Evidence, and Institutions”, Edward Elga publishing, UK and Edward Elga publishing, Inc., USA.
Cecchetti, S.G, Mohanty, M.S and Zampolli, F(2010), “ The Future of Public Debt: Prospects and
implications”, Bank for International Settlement, Working Papers NO.300, Basel, Switzerland.
Available (online) http:\www.bis.org/publ/work300.pdf
Domar, Evsey D (1944), “The Burden of the Debt and the National Income”,
http://rethinkingcapitalism.ucsc.edu/wp-content/uploads/2010/03/Domar-Burden-of-Debt.pdf
Edwards,S. and R. Vergara (2002), “Fiscal Sustainability, debt dynamics and debt relief: The Cases
of Nicaragua and Honduras”, Economic and Sector Study Series RE2-02-005. Regional Operations
Department2. Washington, D.C: Inter-American Development Bank. Available on
http://lnweb90.worldbank.org/caw/cawdoclib.nsf/0/
Ferguson, Niall and Laurence J. Kotlikoff ( 2003) “Going Critical: American Power and the
Consequences of Fiscal Overstretch.” The National Interest (Fall): 22-32.
Fullwiller, C.T (2006), “Interest rates and fiscal sustainability”, Working Paper No. 53: Available at
http://ssrn.com/.
IDA (2006), “IDA Countries and Non-concessional Debt: Dealing with the “Free Ride” problem in
the context of IDA15 Grants”, Resource Mobilization Department , February.
21
IMF and World Bank (2010), “The Kingdom of Lesotho: Joint World Bank Debt Sustainability
Analysis”, Washington D.C: The World Bank and International Monetary Fund.
IMF and the Kingdom of Lesotho(2012), “Article IV Consultations and the Third Review under the
Extended Credit Facility and a Request for Augmentation of Access”, March, 23.
Seater, John J. and Roberto S. Mariano (1985), “new tests of the life cycle and tax discounting
Hypotheses”, Journal of Monetary Economics 15,195-215.
The Kingdom of Lesotho: Budget Speech, January 18, 2012
The Kingdom of Lesotho: Letter of Intent, March 23, 2012
United Nations and Economic Commission for Latin America and the Caribbean (2008), “Public Debt
Sustainability in the Caribbean”, http:\www.eclac.org/publications.

22
Annex I: Definition of concessional
Definition: Concessional external debt conveys information about the borrower's receipt of aid from
official lenders at concessional terms as defined by the Development Assistance Committee (DAC) of
the OECD. Concessional debt is defined as loans with an original grant element of 25 percent or more.
The grant element of a loan is the grant equivalent expressed as a percentage of the amount committed.
It is used as a measure of the overall cost of borrowing. The grant equivalent of a loan is its
commitment (present) value, less the discounted present value of its contractual debt service;
conventionally, future service payments are discounted at 10 percent.
Loans from major regional development banks--African Development Bank, Asian Development Bank,
and the Inter-American Development Bank--and from the World Bank are classified as concessional
according to each institution's classification and not according to the DAC definition, as was the
practice in earlier reports. Long-term debt outstanding and disbursed is the total outstanding long-term
debt at year end. Long-term external debt is defined as debt that has an original or extended maturity of
more than one year and that is owed to nonresidents and repayable in foreign currency, goods, or
services. Data are in current U.S. dollars (Source: World Bank, Global Development Finance).
ANNEX II
Assumptions on θ under various scenarios considered in the model
θ = 0 SCENARIO I
θ =π* SCENARIO II
θ = ( φ g + π * ) where 0 ≤ φ < 1 and cannot be 1 ; implying that GDP growth might be overstatedSCENARIO III
Derived Scenario Equations
( pb t / Y t ) =[- rtC ( DC 0 / Y 0 )e - ( g + π * ) (t –1) +{ g + π * - rtD } ( DD 0 / Y 0 )][1 / ( 1 + g + π *) ]+ (g + π ) ( B 0 / Y 0 ).SCENARIO I
( pb t / Y t ) =[ { π * - rtC } ( DC 0 / Y 0 )e - g ( t - 1) +{ g + π * - rtD } ( DD 0 / Y 0 )][1 / ( 1 + g + π *) ]+ (g + π ) ( B 0 / Y 0 )SCENARIO II
( pb t / Y t ) = [ { φ g + π * - rtC } ( DC 0 / Y 0 )e - φ g ( t - 1) +{ g + π * - rtD } ( DD 0 / Y 0 )][1 / ( 1 + g + π *) ]+ (g + π ) ( B 0 / Y 0 )SCENARIO III
( pb / Y ) ={ g + π * - r D }( DD 0 / Y 0 ) [1 / ( 1 + g + π *) ]+ (g + π ) ( B 0 / Y 0 ) Steady state
23
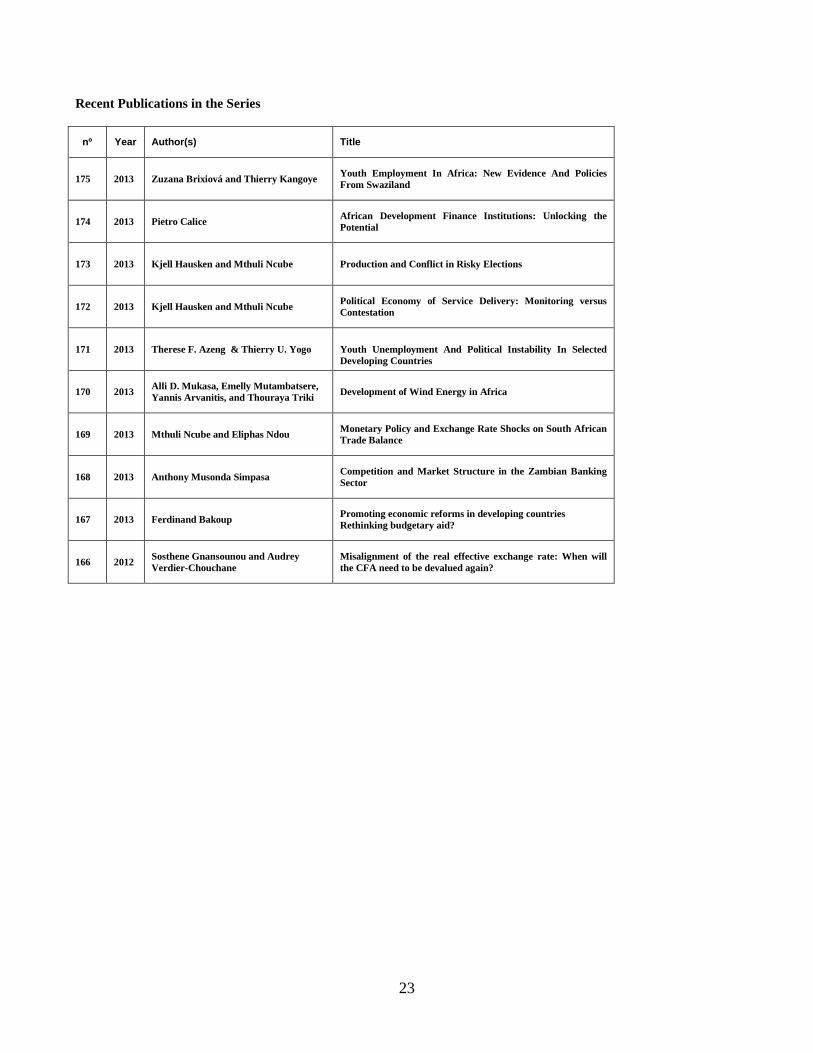
Recent Publications in the Series
nº Year Author(s) Title
175 2013 Zuzana Brixiová and Thierry Kangoye Youth Employment In Africa: New Evidence And Policies
From Swaziland
174 2013 Pietro Calice African Development Finance Institutions: Unlocking the
Potential
173 2013 Kjell Hausken and Mthuli Ncube Production and Conflict in Risky Elections
172 2013 Kjell Hausken and Mthuli Ncube Political Economy of Service Delivery: Monitoring versus
Contestation
171 2013 Therese F. Azeng & Thierry U. Yogo
Youth Unemployment And Political Instability In Selected
Developing Countries
170 2013 Alli D. Mukasa, Emelly Mutambatsere,
Yannis Arvanitis, and Thouraya Triki Development of Wind Energy in Africa
169 2013 Mthuli Ncube and Eliphas Ndou Monetary Policy and Exchange Rate Shocks on South African
Trade Balance
168 2013 Anthony Musonda Simpasa Competition and Market Structure in the Zambian Banking
Sector
167 2013 Ferdinand Bakoup Promoting economic reforms in developing countries
Rethinking budgetary aid?
166 2012 Sosthene Gnansounou and Audrey
Verdier-Chouchane
Misalignment of the real effective exchange rate: When will
the CFA need to be devalued again?