Working Harbor Reinvestment Strategy: Sanitary Sewer and
73
Working Harbor Reinvestment Strategy: Sanitary Sewer and Stormwater Infrastructure Analysis: Draft Report Prepared for Portland Bureau of Planning August 2007 Prepared by Portland Bureau of Environmental Services
Transcript of Working Harbor Reinvestment Strategy: Sanitary Sewer and

Working Harbor Reinvestment Strategy: Sanitary Sewer and
Stormwater Infrastructure Analysis: Draft Report
Prepared for
Portland Bureau of Planning
August 2007
Prepared by
Portland Bureau of Environmental Services


Contents
DRAFT WHRS_STORMWATER&SANITARY_SYSTEM_ANALYSIS_09052007KGHVA.DOC III
Chapter Page
Executive Summary.......................................................................................................... ES-1
Introduction......................................................................................................................... 1-1 Purpose of Report......................................................................................................... 1-1 Overview of Working Harbor Reinvestment Strategy................................................. 1-1 Stormwater and Sanitary System Analysis Scope of Work ......................................... 1-1
Study Area and Existing System ....................................................................................... 2-1
Sewer Infrastructure Issues ............................................................................................... 3-1 Approach ...................................................................................................................... 3-1
Sanitary Sewer Basins ........................................................................................ 3-1 Combined Sewer Basins ..................................................................................... 3-1 Stormwater Infrastructure................................................................................... 3-2
Sewer Infrastructure Issues .......................................................................................... 3-3 Sanitary Sewer Basins ........................................................................................ 3-4 Combined Sewer Basins ..................................................................................... 3-4 Stormwater Infrastructure................................................................................... 3-4
Issues Raised in Business Interviews ......................................................................... 3-17
Planned and Potential Infrastructure Improvements ..................................................... 4-1 Introduction .................................................................................................................. 4-1 Planned Improvements ................................................................................................. 4-1 Potential Improvements................................................................................................ 4-1
Sanitary Sewer System ....................................................................................... 4-3 Combined Sewer System.................................................................................... 4-5 Stormwater Sewer System.................................................................................. 4-5
Prioritization of Improvements ......................................................................................... 5-1
References............................................................................................................................ 6-1

CONTENTS, CONTINUED
Chapter Page
IV DRAFT WHRS_STORMWATER&SANITARY_SYSTEM_ANALYSIS_09052007KGHVA.DOC
Appendixes
A. Stormwater Analysis Information B. City of Portland Sewer Fee Code C. Capital Cost Estimate Details
Tables
Table 2-1 Constrained Opportunity Site Sanitary and Combined Sewer Basins .............................. 2-1 Table 2-2 Working Harbor Reinvestment Strategy, Constrained Opportunity Sites Proposed for
Infrastructure Analysis........................................................................................................... 2-6 Table 3-1 Summary of Significant Infrastructure Issues ................................................................... 3-3 Table 4-1 Potential Improvements and Planning Level Capital Cost Estimates ............................... 4-3 Table 4-2 Potential Stormwater System Connections ....................................................................... 4-5
Figures
Figure ES-1 Potential and Planned Improvement Projects .............................................................ES-3 Figure 2-1 Sanitary Sewer and Combined Sewer Basin Boundaries................................................. 2-3 Figure 2-2 Existing Sewer System .................................................................................................... 2-4 Figure 2-3 Overall Pump Station Schematic ..................................................................................... 2-5 Figure 3-1 Sewer Infrastructure Issues in the Vicinity of Opportunity Sites: RGID01 .................... 3-6 Figure 3-2 Sewer Infrastructure Issues in the Vicinity of Opportunity Sites: RGID02 .................... 3-7 Figure 3-3 Sewer Infrastructure Issues in the Vicinity of Opportunity Sites: RGID12 .................... 3-8 Figure 3-4 Sewer Infrastructure Issues in the Vicinity of Opportunity Sites: NWID03, NWID04,
NWID05, and NWID11 ......................................................................................................... 3-9 Figure 3-5 Sewer Infrastructure Issues in the Vicinity of Opportunity Sites: NWID07 and NWID10
............................................................................................................................................. 3-10 Figure 3-6 Sewer Infrastructure Issues in the Vicinity of Opportunity Sites: NWID08 ................. 3-11 Figure 3-7 Sewer Infrastructure Issues in the Vicinity of Opportunity Sites: NWID09 ................. 3-12 Figure 3-8 Sewer Infrastructure Issues in the Vicinity of Opportunity Sites: NWID14 ................. 3-13 Figure 3-9 Sewer Infrastructure Issues in the Vicinity of Opportunity Sites: SIID06 .................... 3-14 Figure 3-10 Sewer Infrastructure Issues in the Vicinity of Opportunity Sites: SIID13 .................. 3-15 Figure 3-11 Sewer Infrastructure Issues in the Vicinity of Opportunity Sites: SIID15 .................. 3-16 Figure 4-1 Potential and Planned Improvements .............................................................................. 4-2

DRAFT WHRS_STORMWATER&SANITARY_SYSTEM_ANALYSIS_09052007KGHVA.DOC ES-1
Executive Summary
Introduction The City of Portland Bureau of Environmental Services (BES) analyzed the projected sanitary sewer and stormwater infrastructure needs of three North Portland industrial sub-districts and fifteen potential industrial sites targeted for investment and development under the Working Harbor Reinvestment Strategy as prepared by the City of Portland Planning Bureau.
This report documents the results of that analysis, which included preliminary modeling of future infrastructure capacity deficiencies identified downstream of the industrial sites, an itemization of existing capital improvement plan (CIP) projects pertinent to the sites, identification of additional infrastructure improvements to address capacity constraints downstream of the sites, conceptual-level cost estimates to implement these improvements, and prioritization of the improvements.
Infrastructure Issues The existing and planned sanitary, combined, and stormwater sewer systems have sufficient capacity to accommodate the development of the targeted Constraint Opportunity Sites. It is not anticipated that development of these sites will significantly affect the sewer system capacity in the Rivergate, Northwest, and Swan Island Subdistricts. Existing and future sewer capacity issues that do exist downstream of the sites are minimal. They are as follows:
• Shipyard Pump Station is downstream of Site RGID01. Sanitary modeling shows capacity issues in the existing condition, which are worse in the future condition. Flows from Site RGID01 do not cause this capacity deficiency. Development of the site may be affected by these constraints.
• Site NWID05 is located approximately 1,000 feet from the nearest public stormwater system with capacity to convey estimated flows from the site. The public stormwater sewer will have to be extended if stormwater is not handled on-site at this location.
• Site NWID14 is located over a mile away from an existing public sanitary system, which has existing capacity deficiencies. This property will require on-site sewer facilities.
Planned and Potential Improvements As part of its ongoing engineering planning process, BES has developed recommended CIP infrastructure improvement projects for the sanitary, combined, and stormwater sewer systems in the study area. Those that have been approved are listed and shown in Figure ES-1. Also shown and listed are the Water Resources Development Act projects slated for the study area.

ES-2 DRAFT WHRS_STORMWATER&SANITARY_SYSTEM_ANALYSIS_09052007KGHVA.DOC
BES is currently in the process of preparing a System Plan Update that will incorporate the findings of recent hydrologic and hydraulic modeling of the City’s sewer systems and the consequential analyses of potential alternatives to address existing and future system deficiencies. At the end of this engineering planning process it is expected that many of these potential projects will be elevated to the list of approved 5-year CIP projects.
In the interim, for the purpose of addressing the few system deficiencies identified in this Working Harbor Reinvestment Strategy analysis, two other potential projects specifically related to the development of the targeted Constrained Opportunity Sites, were identified. These are listed in Table ES-1 with planning level cost estimates and are shown in Figure ES-1. These potential projects will need to be further evaluated and compared with other alternatives through the engineering planning process before they can be recommended and added to the list of approved 5-year CIP projects.
TABLE ES - 1 Potential Public Infrastructure Improvements and Planning Level Cost Estimates
Site Potential Improvement Planning Level
Capital Cost Estimate*
RGID01 Upsize Shipyard Pump Station $2,700,000
NWID05 Extend public stormwater sewer pipeline to be within reach of property $360,000
*These are preliminary order-of-magnitude capital cost estimates with an expected accuracy of +50/-30 percent. These estimates should be refined during the predesign and design phases of the projects.
This accounts for two of the three infrastructure issues identified by this analysis. The third concerns the PGE Site NWID14, which is approximately a mile away from the nearest sanitary connection. To serve Site NWID14 with a full public sanitary system would require:
• 70 to 350 gallons per minute pump station • Minimum diameter (4-inch) force main approximately 1.1 miles long • Possible upgrade to Linnton Pump Station to convey additional sewage to Guilds Lake
Pump Station
The cost to implement this type of sanitary system for the small number of potential customers anticipated renders it impractical and economically infeasible. Therefore, it will be necessary for the developer of this site to install and operate on-site facilities to handle sanitary and stormwater flows.
Prioritization of Improvements Only two potential public infrastructure improvements were identified as part of this infrastructure analysis for the Working Harbor Reinvestment Strategy Constrained Opportunity Sites. With so few projects to consider, it was found to be unnecessary to rank the improvements by priority in order to select which ones to carry forward for further evaluation in the engineering planning process. Both are recommended for further evaluation in the Sanitary and Storm System Plans.

DRAFT WHRS_STORMWATER&SANITARY_SYSTEM_ANALYSIS_09052007KGHVA.DOC ES-3
Figure ES-1 Potential and Planned Improvement Projects


DRAFT WHRS_STORMWATER&SANITARY_SYSTEM_ANALYSIS_09052007KGHVA.DOC 1-1
CHAPTER 1
Introduction
Purpose of Report The City of Portland Bureau of Environmental Services (BES) analyzed the projected sanitary sewer and stormwater infrastructure needs of three North Portland industrial sub-districts, along with fifteen potential industrial sites targeted for investment and development under the Working Harbor Reinvestment Strategy as prepared by the City of Portland Planning Bureau.
This report documents the results of that analysis, which included preliminary modeling of future infrastructure capacity deficiencies identified downstream of the industrial sites, an itemization of existing capital improvement plan (CIP) projects pertinent to the sites, identification of additional infrastructure improvements to address capacity constraints downstream of the sites, conceptual-level cost estimates to implement these improvements, and prioritization of the improvements.
Overview of Working Harbor Reinvestment Strategy The Working Harbor Reinvestment Strategy is being developed as a 10-year program of public investments by the City of Portland, Port of Portland (Port), and Portland Development Commission (PDC) to advance the economic vitality of the harbor industrial districts. These districts include Northwest, Swan Island, and Rivergate. Project goals are to stimulate private industrial reinvestment and competitiveness in these districts with public investments in infrastructure, developable land, and workforce, and to coordinate such investments among City bureaus, PDC, and the Port.
The Bureau of Planning is preparing the reinvestment strategy in partnership with the Port, PDC, Office of Transportation, Bureau of Environmental Services, and Water Bureau. The reinvestment strategy will be part of the River Plan, which is an area-planning project underway to address economic development, natural resources, recreation, and land use along the Willamette riverfront.
Stormwater and Sanitary System Analysis Scope of Work At the request of the City of Portland Planning Bureau, BES agreed to perform a 10-year infrastructure needs analysis regarding the stormwater and sanitary sewer systems as follows:
I. Characterize Existing System & Deficiencies (capacity and condition) for the Stormwater & Sanitary Infrastructure Needed to Support District Growth A. Develop Maps and summary tables of existing stormwater & systems

WORKING HARBOR REINVESTMENT STRATEGY: SANITARY SEWER AND STORMWATER INFRASTRUCTURE ANALYSIS
1-2 DRAFT WHRS_STORMWATER&SANITARY_SYSTEM_ANALYSIS_09052007KGHVA.DOC
1. By Industrial Area Sub-districts: Swan Island, Northwest, & Rivergate (See Industrial District Atlas, 2004)
2. By Selected Industrial Sites (15) B. Describe significant deficiencies in the current sewer/stormwater systems in
the harbor industrial districts 1.
C. Evaluate and confirm deficiencies identified in project interviews with area businesses (to be provided by Bureau of Planning).
II. Characterize Current Stormwater & Sanitary System CIP Projects for Next 10-Years in Harbor Sub-districts. A. Develop maps and summary tables by sub-district of the projects in CIP that
are in process or will be implemented by 2017. B. Develop maps and summary tables for projects that directly serve Selected
Industrial Sites
III. Develop and Recommend System Improvements in Harbor Sub-Districts for Next 10-Years. A. General Improvements for Sub-Districts
1. Sanitary System Improvements 2. Stormwater System Improvements
B. System Improvements to Support Development of Specific Sites using development assumptions provided by Planning Bureau (Average increased water consumption data provided by Water Bureau Report Table 52 & Figure 33)
1. Sanitary System Improvements 2. Stormwater System Improvements
C. Provide summary of capacity improvements, area served, and approximate cost estimates
D. Prioritize Improvements according to the following considerations: 1. Ability to meet 10-year employment and land absorption forecasts
(provided by Bureau of Planning), 2. System deficiencies identified above 3. Project-selection criterion that gives weight to economic development
catalyst projects: a. Identified by businesses as priority to support traded sector
investment. Score 1 for projects identified as a high priority in business interviews (e.g., stormwater rates). Score 2 for projects identified as a high priority by many business leaders (e.g., Harbor Superfund project).
b. Support traded sector land supply and development. Score 1 for projects that improve capacity, remove impediments, or enhance access in the project area (a traded-sector employment area). Score 2 for projects that also directly support

WORKING HARBOR REINVESTMENT STRATEGY: SANITARY SEWER AND STORMWATER INFRASTRUCTURE ANALYSIS
DRAFT WHRS_STORMWATER&SANITARY_SYSTEM_ANALYSIS_09052007KGHVA.DOC 1-3
development of 20 or more acres of land development in the project area.
E. Analyze (e.g., cost estimates and next steps, as budget allows) and consider whether to recommend adding the project to the Public Facilities Plan for evaluation and potential recommendation to the CIP process.
IV. Develop Draft & Final Report
A. Incorporate results into draft report and provide for BES and Planning Bureau Review
B. Assemble comments and updates into a Final Report.

DRAFT WHRS_STORMWATER&SANITARY_SYSTEM_ANALYSIS_09052007KGHVA.DOC 2-1
CHAPTER 2
Study Area and Existing System
The study area for this stormwater and sanitary sewer infrastructure analysis encompasses fifteen Constrained Opportunity Sites identified by the Working Harbor Reinvestment Strategy project for evaluation. These sites are located in the Rivergate, Northwest, and Swan Island industrial subdistricts. The sanitary and combined sewer basins associated with the Constrained Opportunity Sites are delineated in Figure 2-1 and summarized in Table 2-1. In the sanitary sewer basins the sanitary sewers are separated from the stormwater sewers. In the combined sewer basins, sanitary and stormwater sewers are combined into one system.
Table 2-1 Constrained Opportunity Site Sanitary and Combined Sewer Basins
Constrained Opportunity Site Systems Analysis ID Basin
Rivergate Industrial Subdistrict
RGID01 Peninsular/Rivergate A Sanitary Sewer
RGID02 St. Johns B Combined Sewer
RGID12 Peninsular/Rivergate B Sanitary Sewer
Northwest Industrial Subdistrict
NWID03 Guilds Lake Sanitary Sewer
NWID04 Guilds Lake Sanitary Sewer
NWID05 Guilds Lake Sanitary Sewer
NWID07 Nicolai Combined Sewer
NWID08 Linnton Combined Sewer
NWID09 Guilds Lake Sanitary Sewer
NWID10 Nicolai Combined Sewer
NWID11 Guilds Lake Sanitary Sewer
NWID14 No sanitary sewer system in the area; nearest system is North Linnton Sanitary Sewer
Swan Island Subdistrict
SIID06 Riverside Combined Sewer
SIID13 Riverside Combined Sewer
SIID15 Beech-Essex Combined Sewer

WORKING HARBOR REINVESTMENT STRATEGY: SANITARY SEWER AND STORMWATER INFRASTRUCTURE ANALYSIS
2-2 DRAFT WHRS_STORMWATER&SANITARY_SYSTEM_ANALYSIS_09052007KGHVA.DOC
The existing sewer system is shown in Figure 2-2. This shows the stormwater, sanitary, and combined sewer infrastructure located in the vicinity of the Constrained Opportunity Sites. Also shown are potential flood hazard areas, which overlap some of the sites. [The source of the flood hazard delineation is a compilation of Portland Planning Bureau and METRO Title 5 GIS coverages. It represents the 100-year floodplain and 1996 flood inundated areas, which represents the likely extent of flooding in the area. This delineation can impact the requirements and limitations for development on a given site.]
The City’s hierarchy of wastewater pump stations, interceptors, and tunnels is shown schematically in Figure 2-3 with pump stations downstream of the Constrained Opportunity Sites highlighted.
Group Mckenzie completed an initial review of the development potential of the Constrained Opportunity Sites. Their conclusions are summarized along with ownership and location information in Table 2-2. The Working Harbor Reinvestment Strategy site numbers are shown on Table 2-2 with the corresponding system analysis identification numbers for cross reference. This report uses the system analysis identification numbers to be consistent with the Water Bureau analysis report. The system analysis identification number prefixes signify the industrial subdistrict where the site is located. RG is an abbreviation for Rivergate, NW for Northwest, and SI for Swan Island.

WORKING HARBOR REINVESTMENT STRATEGY: SANITARY SEWER AND STORMWATER INFRASTRUCTURE ANALYSIS
DRAFT WHRS_STORMWATER&SANITARY_SYSTEM_ANALYSIS_09052007KGHVA.DOC 2-3
Figure 2- 1 Sanitary Sewer and Combined Sewer Basin Boundaries

WORKING HARBOR REINVESTMENT STRATEGY: SANITARY SEWER AND STORMWATER INFRASTRUCTURE ANALYSIS
2-4 DRAFT WHRS_STORMWATER&SANITARY_SYSTEM_ANALYSIS_09052007KGHVA.DOC
Figure 2-2 Existing Sewer System

WORKING HARBOR REINVESTMENT STRATEGY: SANITARY SEWER AND STORMWATER INFRASTRUCTURE ANALYSIS
DRAFT WHRS_STORMWATER&SANITARY_SYSTEM_ANALYSIS_09052007KGHVA.DOC 2-5
Figure 2-3 Overall Pump Station Schematic

2-6
TABLE 2-2 Working Harbor Reinvestment Strategy, Constrained Opportunity Sites Proposed for Infrastructure Analysis PDC Site No.
System Analysis
ID Site Owner Location Assumed Developable
Acres
Group Mackenzie (GM) or Parsons Brinkerhoff (PB)
Analysis GM or PB Infrastructure Needs Identified Special Issues to Consider Notes
Unoccupied Brownfields
1 RGID01 Time Oil N. Time Oil Rd., Rivergate 45-acre unoccupied site GM: 465,000 sf distribution, 137,500 sf flex space
GM: $510,000 street upgrade, CIP includes $260,000 drainage and $405,000 sewer improvements on Time Oil Rd.
Owner requests taking public street
2 RGID02 Langley St. Johns (south half of former Marcom site)
N. Bradford St., St. Johns 7-acre unoccupied site Substandard street with railroad, possible access from T-4
3 NWID03 Arkema
N. end of NW Front, Northwest
59-acre unoccupied site
4 NWID04 ESCO
N. end of NW Front, Northwest
10-acre unoccupied site GM: 450,000 sf mfg., site combined with Aventis
GM: $24,000 for half street, site combined with Gould/RP
Reclaimed landfill site
5 NWID05 Aventis Cropscience USA LP
N. end of NW Front, Northwest
16-acre unoccupied site GM: 450,000 sf mfg., site combined with ESCO
GM: $24,000 for half street, site combined with ESCO BNSF proposes closing Balboa Railroad crossing
6 SIID06 City of Portland – BES (Swan Is. lagoon site)
Basin Ave. at Swan Island lagoon
10-acre vacant (unimproved) site
GM: 225,000 sf distribution, 106,000 sf flex space
GM: $50,000 improvements to Basin Ave., $50,000 to Lagoon Ave. frontage
Floodplain, temporary use for CSO project
7 NWID07 City of Portland – BES (T-1 North)
2400 NW Front, Northwest 19-acre unoccupied site Temporary use for CSO project
8 NWID08 Linnton Plywood 10504 NW St. Helens Rd., Linnton
25-acre unoccupied site PB: six flex space parcels PB: $3.1 million street, $1.1 million rail crossing, $1.9 million sewer/water/stormwater, $2.9 million pump station replacement
Consider large single user, dead end water line, railroad crossing
9 NWID09 Lakea Corp. 3003 NW 35th Ave., Northwest
1-acre unoccupied site Cost of improvements on small site
Vacant / Partly Vacant Sites
10 NWID10 Oregonian NW Yeon at Nicolai, Northwest
11-acre vacant site GM: 150,000 sf of general industrial, 20,000 sf office
GM: $40,000 improvements to Yeon Ave. frontage, 5-foot R/W dedication, may benefit from traffic signal.
Long-term vacancy
11 NWID11 Siltronic 7200 NW Front, Northwest 15 vacant acres on 80-acre site
Consider Front Ave. extension to cul-de-sac
DEQ active investigation
12 RGID12 Stauffer Chemical
4429 N Suttle Rd., Rivergate
15 vacant acres on 31-acre site
DEQ active cleanup, floodplain
Redevelopment/Expansion Sites
13 SIID13 Vigor (Cascade General)
5555 N. Channel Ave., Swan Island
25 redevelopment acres on 65-acre site
14 NWID14 PGE 12500 NW Marina Way, Linnton
18 redevelopment acres + 16 vacant acres on 74-acre site
Dead end water line, railroad crossing
24-acre Greenway Natural zone, 38-acre mapped wetland
15 SIID15 Malafouris 1300 N. River St., Lower Albina
2-acre site Substandard street with railroad, cost of improvements on small site
Riverfront site not in river-dependent use

DRAFT WHRS_STORMWATER&SANITARY_SYSTEM_ANALYSIS_09052007KGHVA.DOC 3-1
CHAPTER 3
Sewer Infrastructure Issues
Approach The Bureau of Environmental Services (BES) performed hydrologic and hydraulic modeling to analyze sewer infrastructure issues in the study area for existing and future conditions. The sanitary, combined, and stormwater systems were analyzed separately using methods and criteria appropriate to each.
Sanitary Sewer Basins Sanitary sewer models for this analysis were developed using the sanitary sewer explicit modeling approach developed as part of the BES Sanitary Sewer System Plan. This is a very accurate and reliable model that is currently used in model production work for a variety of modeling tasks.
The sanitary sewer explicit modeling approach included models for both existing (2005) and future (2015) conditions. Existing conditions were based on development assumption data compiled in 2005. Year 2015 conditions were developed by modeling both existing (2005) and future (2040) scenarios and assuming a linear increase in flows over this time period. The 2040 scenarios were previously established for ongoing system planning modeling based on development assumptions provided by the City of Portland Bureau of Planning and approved by the BES Standards & Practices committee. In addition to the interpolated 2015 flow, anticipated flows from the 15 proposed development sites were added to the manholes where the proposed development was deemed likely to connect to the existing sewer system.
The sanitary sewer basins were modeled for the 5-year design storm. The model reflects system response to estimated 2015 flow from all properties in the basin along with flows from the Constrained Opportunity Sites. The expected flows from the 15 sites were assumed to be equal to the water demand estimated by the Water Bureau. The sub-district system was analyzed as a complete system and did not isolate individual site contributions to downstream capacity deficiencies.
Combined Sewer Basins For Constrained Opportunity Sites located in combined sewer basins, this analysis relied on the recently completed combined sewer system plan hydraulic modeling results, which are documented for each of the combined basins in the Combined Sewer Basin Hydraulic Characterization Technical Memoranda (BES, 2006). These results are from the most accurate and reliable models used in systems analysis.
The existing conditions assumed for the combined sewer basins were the same as those assumed for the sanitary basins; that is, they were based on 2005 data. The design storm for capacity analysis of the combined system is the 25-year event. Future 2015 conditions were

WORKING HARBOR REINVESTMENT STRATEGY: SANITARY SEWER AND STORMWATER INFRASTRUCTURE ANALYSIS
3-2 DRAFT WHRS_STORMWATER&SANITARY_SYSTEM_ANALYSIS_09052007KGHVA.DOC
not computed as part of the system planning effort and were not required to determine what capacity issues may be related to development of the constrained sites in the combined basins. This is because the capacity deficiencies in the combined system are predominantly caused by storm flows into the combined system. The sanitary flows from the Constrained Opportunity Sites in 2015 would be insignificant contributors to system capacity deficiencies. Therefore, analyzing the capacity of the existing system is sufficient for this study.
Stormwater Infrastructure For new developments and redevelopments, the standard City of Portland stormwater management approach is to limit stormwater runoff from the development site. The details of this approach are described in the City of Portland Bureau of Environmental Services September 2004 Stormwater Management Manual (SWMM). The applicable level of on-site stormwater management depends on technical feasibility.
The range of stormwater management approaches is bracketed by the following two options:
Option A. Stormwater is infiltrated on-site to the maximum extent possible with any excess disposed, after treatment, to the river. This approach would involve permitting for the direct discharge to the river.
Option B. All stormwater runoff from new development is conveyed to public storm facilities after treatment onsite.
This analysis evaluates Option B to determine the maximum possible public infrastructure that may be necessary to address run off created by development of the constrained sites.
The site stormwater needs analyses were performed using a standard engineering estimate for runoff called the Rational Method, or a commercial numerical hydraulics modeling program called XP-SWMM, depending on site and system characteristics and other factors such as data availability. For example, if the site or drainage area was less than 50 acres, the Rational Method was used. The Rational Method, which is a standardized approach described in the City’s Sewer and Drainage Facilities Design Manual, is generally observed to produce higher peak flow estimates than XP-SWMM. Stormwater modeling for this type of analysis is based on rudimentary estimation methods. The modeling of stormwater is the least reliable of the three systems analyzed because of the complex nature of hydrologic events and the preliminary nature of available data. In keeping with regulatory requirements, stormwater capacity needs were evaluated using the 10-year design storm.
BES analyzed public stormwater infrastructure needs using "incremental flow rates," which consisted of only those flows attributable to the "assumed developable acres" specified in the Planning Bureau’s matrix of Constrained Opportunity Site information (See Table 2-2). Developments were assumed to be commercial with 85-percent of the area covered by impervious surfaces. Because the upstream areas are already nearly built out and consist primarily of industrial and commercial land uses that are currently assigned high impervious percentages, it was not considered necessary to model system capacity based on estimated future conditions. Future conditions are likely to have similar amounts of impervious surfaces as existing conditions. Also, in most cases the stormwater system was observed to have extra capacity that would be expected to be adequate to handle marginally increased

WORKING HARBOR REINVESTMENT STRATEGY: SANITARY SEWER AND STORMWATER INFRASTRUCTURE ANALYSIS
DRAFT WHRS_STORMWATER&SANITARY_SYSTEM_ANALYSIS_09052007KGHVA.DOC 3-3
potential upstream runoff flows. Moreover, the SWMM requirements for increased on-site stormwater management of new developments and redevelopments should help to curb stormwater runoff increases in the basins.
Sewer Infrastructure Issues Significant sewer infrastructure characteristics and issues are summarized in Table 3-1 for the fifteen Constrained Opportunity Sites and discussed for each of the systems separately below. Infrastructure issues identified to occur in the vicinities of the Constrained Opportunity Sites are shown in Figures 3-1 through 3-11.
Table 3-1 Summary of Significant Infrastructure Issues
Site ID Significant Associated Infrastructure Issues
Rivergate Subdistrict
RGID01 Downstream sanitary sewer Shipyard Pump Station has insufficient capacity to handle existing and future condition flows.
RGID02 None.
RGID12 None.
Northwest Subdistrict
NWID03 None.
NWID04 None.
NWID05 No capacity issues, but nearest connection to stormwater pipe is approximately 1,140 feet away.
NWID07 None.
NWID08 None.
NWID09 None.
NWID10 None.
NWID11 None.
NWID14 Nearest sanitary sewer connection is approximately a mile away and downstream system has insufficient capacity to handle additional flows from the site.
Swan Island Subdistrict
SIID06 None.
SIID13 None.
SIID15 None.

WORKING HARBOR REINVESTMENT STRATEGY: SANITARY SEWER AND STORMWATER INFRASTRUCTURE ANALYSIS
3-4 DRAFT WHRS_STORMWATER&SANITARY_SYSTEM_ANALYSIS_09052007KGHVA.DOC
Sanitary Sewer Basins Hydraulic analyses indicated that most of the sanitary sewer basins serving the Constrained Opportunity Sites have no significant capacity deficiencies for the planning period. The exceptions were the Shipyard Pump Station, which serves RGID01, and the lack of a sanitary sewer system in the vicinity of NWID14. These deficiencies are described separately below.
RGID01: Shipyard Pump Station This Shipyard Pump Station, shown in Figure 3-1, is technically under-capacity for the estimated flows for the 2015 conditions. This pump station has a rated firm capacity of 1,200 gallons per minute (gpm), which is the capacity when one pump is running and the backup pump is off. Yet the peak modeled flow for existing conditions during the 5-year design storm is estimated at 2,500 gpm. The pump station keeps up by running both pumps during large storms for short peak period. The future condition flow for 2015 conditions during the 5-year design storm is estimated at 2,750 gpm. Therefore, we would expect this pump station to eventually be overloaded and should be analyzed in more detail to determine the true upgrade needs.
NWID14: No Sanitary Sewer Basin The PGE site, shown in Figure 3-8, is in an area of the city where sanitary sewer system currently exists. Most properties in this area are likely served by older septic systems. The nearest sanitary connection is the Linnton system located approximately one mile away.
Combined Sewer Basins Based on a review of recently completed hydraulic modeling results, the proposed developments or redevelopments of the Constrained Opportunity Sites are not expected to cause any downstream hydraulic deficiencies in the combined system by the year 2015.
However, the NWID07 and NWID10 sites are located in a combined basin that is predicted to have hydraulic deficiencies by the year 2040. The Northwest Neighborhoods Predesign combined system basin model shows hydraulic capacity issues downstream of NWID07 and NWID10. These capacity issues are predominantly caused by stormwater flows into the combined system. The sanitary flows from NWID07 and NWID10 are insignificant contributions to the flows creating the hydraulic deficiencies. The projects recommended to address these hydraulic deficiencies are not considered critical and may not be built within the 10-year planning window for the constrained site development.
The 2040 system deficiencies and recommended projects are displayed on Figure 3-5 for informational purposes. They are not caused by and very likely will not impact the development of the constrained sites within the 10-year planning window.
Stormwater Infrastructure The stormwater infrastructure analysis concluded that the existing stormwater systems have sufficient capacity to accommodate stormwater flows from all of the Constrained Opportunity Sites assuming all of the stormwater flows are conveyed to the City’s stormwater system. However, for Site NWID05 it will be necessary to extend the public stormwater system pipeline approximately 1,140 feet.

WORKING HARBOR REINVESTMENT STRATEGY: SANITARY SEWER AND STORMWATER INFRASTRUCTURE ANALYSIS
DRAFT WHRS_STORMWATER&SANITARY_SYSTEM_ANALYSIS_09052007KGHVA.DOC 3-5
Information gathered as part of the stormwater infrastructure analysis is summarized in Appendix A.

WORKING HARBOR REINVESTMENT STRATEGY: SANITARY SEWER AND STORMWATER INFRASTRUCTURE ANALYSIS
3-6 DRAFT WHRS_STORMWATER&SANITARY_SYSTEM_ANALYSIS_09052007KGHVA.DOC
Figure 3 - 1 Sewer Infrastructure Issues in the Vicinity of Opportunity Sites: RGID01

WORKING HARBOR REINVESTMENT STRATEGY: SANITARY SEWER AND STORMWATER INFRASTRUCTURE ANALYSIS
DRAFT WHRS_STORMWATER&SANITARY_SYSTEM_ANALYSIS_09052007KGHVA.DOC 3-7
Figure 3 - 2 Sewer Infrastructure Issues in the Vicinity of Opportunity Sites: RGID02

WORKING HARBOR REINVESTMENT STRATEGY: SANITARY SEWER AND STORMWATER INFRASTRUCTURE ANALYSIS
3-8 DRAFT WHRS_STORMWATER&SANITARY_SYSTEM_ANALYSIS_09052007KGHVA.DOC
Figure 3 - 3 Sewer Infrastructure Issues in the Vicinity of Opportunity Sites: RGID12

WORKING HARBOR REINVESTMENT STRATEGY: SANITARY SEWER AND STORMWATER INFRASTRUCTURE ANALYSIS
DRAFT WHRS_STORMWATER&SANITARY_SYSTEM_ANALYSIS_09052007KGHVA.DOC 3-9
Figure 3 - 4 Sewer Infrastructure Issues in the Vicinity of Opportunity Sites: NWID03, NWID04, NWID05, and NWID11

WORKING HARBOR REINVESTMENT STRATEGY: SANITARY SEWER AND STORMWATER INFRASTRUCTURE ANALYSIS
3-10 DRAFT WHRS_STORMWATER&SANITARY_SYSTEM_ANALYSIS_09052007KGHVA.DOC
Figure 3 - 5 Sewer Infrastructure Issues in the Vicinity of Opportunity Sites: NWID07 and NWID10

WORKING HARBOR REINVESTMENT STRATEGY: SANITARY SEWER AND STORMWATER INFRASTRUCTURE ANALYSIS
DRAFT WHRS_STORMWATER&SANITARY_SYSTEM_ANALYSIS_09052007KGHVA.DOC 3-11
Figure 3 - 6 Sewer Infrastructure Issues in the Vicinity of Opportunity Sites: NWID08

WORKING HARBOR REINVESTMENT STRATEGY: SANITARY SEWER AND STORMWATER INFRASTRUCTURE ANALYSIS
3-12 DRAFT WHRS_STORMWATER&SANITARY_SYSTEM_ANALYSIS_09052007KGHVA.DOC
Figure 3 - 7 Sewer Infrastructure Issues in the Vicinity of Opportunity Sites: NWID09
WORKING HARBOR REINVESTMENT STRATEGY: SANITARY SEWER AND STORMWATER INFRASTRUCTURE ANALYSIS
DRAFT WHRS_STORMWATER&SANITARY_SYSTEM_ANALYSIS_09052007KGHVA.DOC 3-13
Figure 3 - 8 Sewer Infrastructure Issues in the Vicinity of Opportunity Sites: NWID14

WORKING HARBOR REINVESTMENT STRATEGY: SANITARY SEWER AND STORMWATER INFRASTRUCTURE ANALYSIS
3-14 DRAFT WHRS_STORMWATER&SANITARY_SYSTEM_ANALYSIS_09052007KGHVA.DOC
Figure 3 - 9 Sewer Infrastructure Issues in the Vicinity of Opportunity Sites: SIID06

WORKING HARBOR REINVESTMENT STRATEGY: SANITARY SEWER AND STORMWATER INFRASTRUCTURE ANALYSIS
DRAFT WHRS_STORMWATER&SANITARY_SYSTEM_ANALYSIS_09052007KGHVA.DOC 3-15
Figure 3 - 10 Sewer Infrastructure Issues in the Vicinity of Opportunity Sites: SIID13

WORKING HARBOR REINVESTMENT STRATEGY: SANITARY SEWER AND STORMWATER INFRASTRUCTURE ANALYSIS
3-16 DRAFT WHRS_STORMWATER&SANITARY_SYSTEM_ANALYSIS_09052007KGHVA.DOC
Figure 3 - 11 Sewer Infrastructure Issues in the Vicinity of Opportunity Sites: SIID15


WORKING HARBOR REINVESTMENT STRATEGY: SANITARY SEWER AND STORMWATER INFRASTRUCTURE ANALYSIS
DRAFT WHRS_STORMWATER&SANITARY_SYSTEM_ANALYSIS_09052007KGHVA.DOC 3-17
Issues Raised in Business Interviews Project staff of the Planning Bureau, Port, and PDC conducted interviews with 25 businesses and four focus groups, approximately 60 people. The interviews were selected to reflect a cross section of industries in the harbor districts. Four focus group discussions consisted of industrial developers, industrial real estate brokers, human resource managers, and industrial association representatives. The results of the interviews were summarized in a report that served as the first product of the reinvestment strategy project.
There was no specific sanitary or stormwater infrastructure deficiencies identified in the interview results summary. However, several key stormwater policy issues were raised such as the rate and the rate structure for stormwater fees, as well as the requirements for detention and water quality treatment. Each topic is addressed below.
Stormwater Rates “Our stormwater costs are extremely high” - Business Interview
Portland’s stormwater costs reflect the accumulated impacts of more than 150 years of urban development on the health of our watersheds. The City has been playing catch-up for the past 30 years, investing hundreds of millions of dollars in facilities to control flooding, improve drainage, remove pollutants and manage billions of gallons of stormwater runoff. Our efforts have been driven by an evolving set of federal and state regulations, and supported by advancements in environmental science and engineering. Portland’s stormwater charges are high because we have been working to manage urban stormwater runoff longer than other US cities. Portland organized a separate stormwater utility back in 1977 in anticipation of the investments needed to address urban flooding, and comply with the requirements of the federal Clean Water Act, Safe Drinking Water Act, Endangered Species Act, and other environmental laws. We were one of the first cities in the country to confront the dual challenges of combined sewer overflows and stormwater management. In the coming years, we expect other US cities to catch up to Portland as they come into compliance with federal stormwater regulations and court orders. Cities like Seattle, Tacoma, Cincinnati, Atlanta and Sacramento have combined sanitary and stormwater management charges that are nearly equal to or exceed Portland’s charges. We are trying to reign in the escalating costs of stormwater management by developing new technologies that meet our regulatory requirements at lower costs, and requiring new and redeveloped properties to manage stormwater runoff on-site. Portland is investing in a sustainable future by attacking the stormwater challenge close to home, promoting the use of “green” stormwater facilities that mimic natural hydrology wherever practical, and requiring on-site stormwater management when properties develop or redevelop. These efforts will reduce the long-term costs of stormwater management and advance our efforts to provide healthy watersheds.

WORKING HARBOR REINVESTMENT STRATEGY: SANITARY SEWER AND STORMWATER INFRASTRUCTURE ANALYSIS
3-18 DRAFT WHRS_STORMWATER&SANITARY_SYSTEM_ANALYSIS_09052007KGHVA.DOC
Stormwater Rate Structure “Some businesses are viewing these fees as a tax, because they are not tied to city services. Also, there’s nothing you can do to eliminate or reduce the fee, such as by using pervious paving.” - Business Interview
Portland’s stormwater charges are calculated based on the amount of measured impervious area on your property. The City uses impervious area as a proxy for calculating your charges because it has been the most cost-effective, equitable and easiest method to administer. The City may propose new methods of charging for stormwater management services as our mapping and billing technologies improve. In the meantime, we have tried to minimize the administrative costs of the utility by relying on the simple and direct approach of measuring impervious area.
Your stormwater bill consists of two charges: on-site stormwater and off-site stormwater. The on-site charge represents 35% of the stormwater utility, and recovers City stormwater management costs attributed to stormwater runoff from private property. The off-site charge represents 65% of the stormwater utility, and recovers City stormwater management costs attributed to the public street system and watersheds.
You have the ability to control both of these charges by reducing the amount of impervious area on your property. In addition, you may control the amount of your on-site stormwater charge by participating in Clean River Rewards, the City’s stormwater discount program. The amount of your on-site stormwater discount is based on the extent and effectiveness of your on-site stormwater management. For complete information about this program, visit our website at www.CleanRiverRewards.com.
Stormwater Detention Requirements “We take issue with the stormwater fees and the requirement for retention ponds on sites with limited area. We have to build retention ponds for everyone else’s water while the land down near the river is at a premium.” - Business Interview
Portland’s Stormwater Management Manual requires detention / retention systems when the soils do not allow infiltration and when discharging into the public system away from the riverbank. Detention is required to ensure there is available capacity for all users during the peak design storm (typically a 10-year storm). If discharging directly to the river or to the city outfall at the riverbank, then detention is not required.
Stormwater Treatment Requirements “After all we did creating a 130-foot wide greenway with bioswales to filter runoff, we’re still paying the same stormwater fee at our facility as the guy down the street who runs a pipe straight into the river.” - Business Interview

WORKING HARBOR REINVESTMENT STRATEGY: SANITARY SEWER AND STORMWATER INFRASTRUCTURE ANALYSIS
DRAFT WHRS_STORMWATER&SANITARY_SYSTEM_ANALYSIS_09052007KGHVA.DOC 3-19
The City’s stormwater discount program – Clean River Rewards – provides a number of ways for ratepayers to qualify for on-site stormwater discounts. City Council adopted the program following years of public review and comment. The program reflects existing City stormwater policies and regulations, as well as state and federal permitting requirements. It is true that the program places the same value to direct riparian outfalls to the Willamette River, as is attributed to bioswales and other water quality facilities that discharge to the Willamette River. City Council adopted this particular standard, in response to testimony from the Port of Portland. The Port’s testimony highlighted the fact that most riparian ratepayers along the Willamette River must comply with Oregon DEQ stormwater permit requirements governing their stormwater outfalls.


DRAFT WHRS_STORMWATER&SANITARY_SYSTEM_ANALYSIS_09052007KGHVA.DOC 4-1
CHAPTER 4
Planned and Potential Infrastructure Improvements
Introduction As part of its ongoing engineering planning and design process, BES has developed recommended infrastructure improvement projects for the sanitary, combined, and stormwater sewer systems in the study area. Those that have been previously approved are represented in the City of Portland 5-year capital improvements plan (CIP).
BES is currently in the process of preparing a System Plan Update that will incorporate the findings of recent hydrologic and hydraulic modeling of the City’s sewer systems and the consequential analyses of potential alternatives to address existing and future system deficiencies. At the end of this engineering planning process it is expected that many of these potential projects will be recommended for funding under the approved 5-year CIP.
In the interim, for the purpose of addressing the few system deficiencies identified in this Working Harbor Reinvestment Strategy analysis, other potential projects specifically related to the development of the targeted Constrained Opportunity Sites, were identified. These potential projects will need to be further evaluated and compared with other alternatives through the engineering planning process before they can be recommended and added to the list of approved 5-year CIP projects.
Planned Improvements The locations of City of Portland’s Bureau of Environmental Services 5-year capital improvements plan (CIP) projects and Water Resources Development Act projects are depicted in Figure 4-1. These improvements, which have been developed via the BES engineering planning process and recommended for implementation, are also listed in tables inset on Figure 4-1.
Potential Improvements The stormwater and sanitary sewer system improvements that would potentially be needed in addition to the existing planned improvements are both shown on Figure 4-1 and listed in Table 4-1. They are also depicted in Figures 4-1 and 3-1 through 3-11. Standard and conventional types of improvements, such as upsizing of pipelines and pump stations, were assumed to help establish conservative planning level estimates for evaluation of the potential development plans. The specific potential improvements are discussed below by system.


WORKING HARBOR REINVESTMENT STRATEGY: SANITARY SEWER AND STORMWATER INFRASTRUCTURE ANALYSIS
4-2 DRAFT WHRS_STORMWATER&SANITARY_SYSTEM_ANALYSIS_09052007KGHVA.DOC
Figure 4 - 1 Potential and Planned Improvements


WORKING HARBOR REINVESTMENT STRATEGY: SANITARY SEWER AND STORMWATER INFRASTRUCTURE ANALYSIS
DRAFT WHRS_STORMWATER&SANITARY_SYSTEM_ANALYSIS_09052007KGHVA.DOC 4-3
Table 4-1 Potential Improvements and Planning Level Capital Cost Estimates
Site Potential Improvement Planning Level
Capital Cost Estimate*
RGID01 Upsize Shipyard Pump Station $2,700,000
NWID05 Extend public stormwater sewer pipeline to be within reach of property (15-inch diameter pipe approximately 1,140 feet long)
$360,000
NWID14 Extend sanitary sewer system 1.1 miles to be within reach of property and increase downstream system capacity
Prohibitive for anticipated number of customers to be served
*These are preliminary order-of-magnitude capital cost estimates with an expected accuracy of +50/-30 percent. The assumptions for these estimates are detailed in Appendix C. These estimates should be refined during the predesign and design phases of the projects.
Sanitary Sewer System Of the fifteen Constrained Opportunity Sites, only Site RGID01 and NWID14 were found to require sanitary sewer system improvements.
Site RGID01 As discussed in Chapter 3, the Shipyard Pump Station was identified as having insufficient capacity to handle future condition flows. A potential for future improvements at the Shipyard Pump Station would therefore include increasing the firm capacity (capacity with the largest pump offline) of the pump station to 2,750 gpm.
Increasing the pumping capacity of the Shipyard Pump Station may require replacing the force main. The current force main is 2200 feet long, consisting of 1,238 feet of 12-inch high-density polyethylene (HDPE) pipe, 850 feet of 14-inch HDPE pipe, and 120 feet of 14-inch steel pipe. According to the BES Sewer Design Manual, it is desirable for velocity in a force main to not exceed 10 feet per second (fps), although 8 fps is often considered a practical limit due to increased operating costs at higher velocities. It appears that the 12-inch portion of the force main would be incapable of conveying flows from a 2,750-gpm pump station within this range, and that this portion of the force main would likely require upsizing. It may be sufficient to replace the 12-inch portion of the force main with 14-inch diameter, generating velocity in the force main of 5.7 fps.
Site NWID14 The nearest public sanitary sewer connection for the PGE site is the Linnton system located approximately one mile away. To serve this area with a full public sanitary system would require:
• 70 to 350 gpm pump station • Minimum diameter (4-inch) force main approximately 1.1 miles long • Possible upgrade to Linnton Pump Station to convey additional sewage to Guilds Lake
Pump Station

WORKING HARBOR REINVESTMENT STRATEGY: SANITARY SEWER AND STORMWATER INFRASTRUCTURE ANALYSIS
4-4 DRAFT WHRS_STORMWATER&SANITARY_SYSTEM_ANALYSIS_09052007KGHVA.DOC
The cost to implement this type of sanitary system for the small number of potential customers renders it impractical and economically infeasible.
Development of the PGE site for heavy industrial/manufacturing uses would require on-site management of both sanitary wastes and industrial wastes. Management of industrial wastes will be specific to the type of industrial manufacturing process to be implemented at this site. Because it is not possible at this time to know what that industrial process may be, it is assumed for the purposes of this analysis that the process waste treatment needs will be incorporated into the design and implementation of the manufacturing process and will not be addressed further in this report.
There are three options for the onsite management of typical sanitary waste:
• Onsite treatment of Small Flows • Onsite storage of Small Flows with frequent pump-out and removal via septage
hauler service • Onsite treatment and discharge via NPDES permit for Large Flows
Option 1: Onsite Treatment of Small Flows This option assumes that the site generates a small amount of sanitary waste and that the land conditions allow for a septic and sand filter system. This will be the most cost-effective approach for sanitary service for this site assuming that the demand can be accommodated by an onsite system. The sizing requirements are directly tied to the number of employees being served which is unknown at this time.
For more information:
• Bureau of Development Services: (503) 823-7300; www.portlandonline.com/bds for information and Sanitation Permit Application
Option 2: Onsite Storage of Small Flows This option assumes that the site is not capable of sustaining a septic / sand filter system but still generates a small amount of sanitary waste (less than 1,000 gallons per day), which could be stored on-site in a septage tank. Either daily or several times per week the septage could be pumped out into a septage truck and hauled to the treatment plant. DEQ requires a Water Pollution Control Facility (WPCF) permit for Interim Septage Storage Tanks. This permit requires septage storage tanks to be a minimum of 1,500 gallons in size.
For more information:
• Orenco Systems in Sutherlin, Oregon manufactures 1,500-gallon fiberglass tanks for on-site septage storage.
• Local septage haulers include MRP (Metro Rooter & Plumbing) and A All Pump Sanitary Services.
• Bureau of Development Services: (503) 823-7300; www.portlandonline.com/bds for information and Sanitation Permit Application
• Oregon DEQ WPCF Permits: http://www.deq.state.or.us/WQ/wqpermit/permits.htm

WORKING HARBOR REINVESTMENT STRATEGY: SANITARY SEWER AND STORMWATER INFRASTRUCTURE ANALYSIS
DRAFT WHRS_STORMWATER&SANITARY_SYSTEM_ANALYSIS_09052007KGHVA.DOC 4-5
Option 3: Onsite Treatment of Large Flows This option assumes that the site generates from 70 to 350 gallons per minute of sanitary waste than could be treated using a package treatment plant such as a membrane bio-reactor (MBR) system. This type of system can treat normal sanitary waste along with potential low-strength organic waste that did not possess chemicals corrosive to the membrane system. Costs were obtained from a local vendor (WH Reilly & Co.) for three different sized systems:
• 70 gallons per minute: $1.5 million • 140 gallons per minute: $ 2.0 million • 350 gallons per minute: $2.5 million
Costs provided here include $250,000 for onsite piping and 50 percent design/contingency. The outfall to the Willamette River (or Multnomah Channel) would need to be permitted by DEQ and the Corps of Engineers.
In contrast, the costs to build a pump station and a mile-long forcemain to direct sanitary flow to the Linnton sewer system, along with upgrades of that system to convey the additional flow, would likely be ten times these costs.
Combined Sewer System The combined sewer system analysis concluded that no improvements are needed to accommodate the Constrained Opportunity Sites.
Stormwater Sewer System Based on the analyses described in Table 3-2, it was determined that the existing stormwater sewer system has sufficient capacity to accommodate stormwater flows from all fifteen of the Constrained Opportunity Sites. All of the sites, however, will need to connect to the stormwater system via on-site laterals. The potential stormwater lateral locations are shown on Figures 3-1 through 3-11. The actual configurations of the laterals may differ from the conceptual layouts shown in these figures. The anticipated characteristics of these laterals are summarized in Table 4-2. Of all the stormwater connections, only the one for Site NWID05 will require extension of the public stormwater collection system.
Table 4-2 Potential Stormwater System Connections
Site ID Potential Stormwater System Connections*
Rivergate Subdistrict
RGID01 145-foot connection to existing ditch. Ultimate outfall is on Columbia Slough (AAA538). Assumes ditch has adequate capacity to convey flow to outfall. Estimated 10-year peak flow is 43 cfs.
RGID02 85-foot connection pipe to nearest storm drainage pipe with appropriate capacity (36 inches). Drains to OF 52A. Estimated 10-year peak flow is 12 cfs.

WORKING HARBOR REINVESTMENT STRATEGY: SANITARY SEWER AND STORMWATER INFRASTRUCTURE ANALYSIS
4-6 DRAFT WHRS_STORMWATER&SANITARY_SYSTEM_ANALYSIS_09052007KGHVA.DOC
Site ID Potential Stormwater System Connections*
RGID12 60-foot connection pipe for one of two pipes needed to connect site to two distinct outfalls. Both outfalls needed for adequate capacity. Estimated 10-year peak flow is 21 cfs.
Northwest Subdistrict
NWID03 100-foot private lateral to existing stormwater pipe (OF-22B). Estimated 10-year peak flow is 56 cfs.
NWID04 50-foot connection pipe to existing stormwater pipe (OF-22B) with adequate capacity for future development. May be combined with other line from adjoining site (NWID05). Estimated 10-year peak flow is 10 cfs.
NWID05 1,140-foot connection pipe along current street alignment to storm pipe with appropriate capacity (OF-22B). Existing pipe along this alignment is not adequate for future development at this site. Estimated 10-year peak flow is 8 cfs.
NWID07 15-foot connection pipe to existing 102-inch storm pipe to Outfall AAX560. Capacity fine given timing of potential tunnel overflow versus site discharge for a large storm event. Estimated 10-year peak flow is 15 cfs.
NWID08 4-foot connection pipe to exiting 60-inch private storm pipe currently on property. Estimated 10-year peak flow is 20 cfs.
NWID09 Connection pipe to existing storm pipe with appropriate capacity. Site currently drains to this same drainage pipe, but due to size of site any extra development should have minimal impact on capacity here.
NWID10 Capacity constraints downstream of this site require that the flow from future development be divided into two separate stormwater pipes. One 55-foot connection pipe will drain to an existing 18-inch stormwater line to the north of the site, while another 32-foot connection pipe will drain to an existing 27-inch stormwater line to the south of the site.
NWID11 15-foot connection pipe to existing 84-inch storm pipe with appropriate capacity. Estimated 10-year peak flow is 25 cfs.
NWID14 Connection to existing on-site wetlands. Assumes flow will first enter wetlands before discharge to the river/slough.
Swan Island Subdistrict
SIID06 30-foot connection pipe to existing 60 -inch storm line currently running across the site. Estimated 10-year peak flow is 10 cfs.
SIID13 15-foot connection pipe to existing line to outfall OFS-6. Conveyance all on site currently. Most site flow needs to go here due to capacity constraints. Estimated 10-year peak flow is 23 cfs.
SIID15 Connection to nearest pipe with known available capacity (Outfall ABC079). Nearer pipe may be better, but data currently limited or contradictory.
*The connections described are conceptual. Actual configurations may differ from those assumed for conceptual assessments. For example, the configurations will depend on site development layouts and inlet locations.
DRAFT WHRS_STORMWATER&SANITARY_SYSTEM_ANALYSIS_09052007KGHVA.DOC 5-1
CHAPTER 5
Prioritization of Improvements
Only two potential public infrastructure improvements were identified as part of this infrastructure analysis for the Working Harbor Reinvestment Strategy Constrained Opportunity Sites:
• Upsize Shipyard Pump Station to accommodate sanitary flows from RGID01 and other sites in the area.
• Extend existing stormwater sewer pipeline approximately 1,140 feet to the NWID05 site to provide point of connection.
With so few projects to consider, it was unnecessary to rank the improvements by priority in order to select which ones to carry forward for further evaluation in the engineering planning process. Both are recommended for further evaluation.


DRAFT WHRS_STORMWATER&SANITARY_SYSTEM_ANALYSIS_09052007KGHVA.DOC 6-1
CHAPTER 6
References
City of Portland, Bureau of Planning. 2006. Working Harbor Reinvestment Strategy Business Interview Results. December 2006.
City of Portland, Bureau of Environmental Services (BES). 1998. Public Facilities Plan.
City of Portland, Bureau of Environmental Services (BES). 2004. Stormwater Management Manual. September 2004, Revision 3.
City of Portland, Bureau of Environmental Services (BES). 2006a. Combined Sewer Basin Sewer Hydraulics Characterization Summary Report.
City of Portland, Bureau of Environmental Services (BES). 2006b. Combined Sewer Basin Sewer Hydraulics Characterization Technical Memoranda.
City of Portland, Bureau of Environmental Services (BES). 2006c. Northwest Neighborhoods Combined Sewer Relief and Reconstruction Predesign (Tanner B, Fremont, Nicolai, and Balch Basins) BES #6675 Final Predesign Report. May 2006.
City of Portland, Bureau of Environmental Services (BES). 2007. Sewer and Drainage Facilities Design Manual. June 2007.
Hofeld, Evan, City of Portland Water Bureau. 2007. Working Harbors Reinvestment Strategy Water System Infrastructure Analysis. June 2007.
Murray, Smith & Associates, Inc. 1992. Rivergate Industrial District Sanitary Sewer Master Plan Update. May 1992.
Rivergate Pump Station Modeling Project BES#7330.
Whitaker, Dave, City of Portland Bureau of Planning and Portland Development Commission. 2006. Memorandum: Linnton Pump Station Evaluation to Patrick Sweeney/Parsons Brinkerhoff. April 14, 2006.


DRAFT WHRS_STORMWATER&SANITARY_SYSTEM_ANALYSIS_09052007KGHVA.DOC
APPENDIX A
Stormwater Analysis Information


DRAFT WHRS_STORMWATER&SANITARY_SYSTEM_ANALYSIS_09052007KGHVA.DOC
APPENDIX A
Stormwater Analysis Information
Information gathered as part of the stormwater infrastructure analysis is summarized in Table A-1. This includes site information, modeling notes, and preliminary results. This information is provided to document initial modeling assumptions about the sites and to serve as a resource for more detailed future follow-up analyses.
TABLE A-1 Stormwater Infrastructure Analysis Information
Site Site Information Stormwater System Capacity Analysis Notes and
Results
Rivergate Subdistrict
RGID01 About 80 percent of this site consists of grassy fields. Another 10 percent supports about 20 large tanks. The rest is bare dirt and buildings.
No existing storm sewer was identified inside the site boundary. All existing sewers/ditch system drain away from the site towards east to the North Slough. There is a roadside ditch along N. Time Oil Rd.
Assumed runoff from future development will be discharged to the road site ditch along N. Time Oil Rd. The ditch eventually discharges to MS4 outfall AAA538 (a 60-inch pipe). Based on MS4 delineation, existing capacity of the 60-inch pipe will be reviewed to evaluate if there is extra room available for runoff from future developments on-site. XP-SWMM was used to estimate runoff.
The 60-inch outfall pipe (MS4 AAA538) appears to have adequate capacity to accommodate 10-year peak flow from future developments. Since no information was available about the roadside ditch, capacity check was not performed.
RGID02 This lot is primarily paved or graveled, sloping SW to the Willamette. Trees and shrubs cover the SW and S corners.
There is an existing 36-inch storm pipe located just north of the site. MS4 delineation is available for this stormwater outfall.
Used Rational Method to estimate 10-year peak flow from the site for future development. The capacity of the 36-inch pipe was evaluated using Manning’s equation. The existing 10-year peak flow was estimated using the Rational Method.
The 36-inch pipe outfall (MS4 Willamette OF52A) appears to have adequate capacity to accommodate peak flow from the site under 10-year storm.
RGID12 About half of this site is vegetated and half is impermeable. Vegetated areas include the NW portion and the area north of N. Marine Dr. Impermeable areas include a street, parking area, and buildings.
This site is located between Smith Lake and Columbia River. There are existing storm sewers (pipe and open ditch) on-site. Capacity of the sewer pipe needs to be checked to see if it can convey extra flow from the new development.
The site can be divided based on location of existing outfalls. Capacity of the outfalls and flow they are currently carrying can be estimated based on MS4 outfall delineation. Estimated peak discharge from the site under future condition and identified if there is any capacity deficiency. Rational Method was used.
Runoff from future development can be split and discharged to two existing storm sewer systems along N. Marine Drive (MS4 outfalls AAA672 and AAA673). The two outfall pipes appear to have adequate capacity if working together to accommodate runoff from future developments.

A-2 DRAFT WHRS_STORMWATER&SANITARY_SYSTEM_ANALYSIS_09052007KGHVA.DOC
TABLE A-1 Stormwater Infrastructure Analysis Information
Site Site Information Stormwater System Capacity Analysis Notes and
Results
Northwest Subdistrict
NWID03 The larger portion of this site is primarily bare earth and concrete building pad with about 15 percent vegetated in shrubs to the NW. There is an existing storm sewer system in the vicinity that might be able to carry additional runoff from future development.
The northwestern portion of the site partially under the bridge is primarily vegetated in shrubs, with a small pump station and parking lot at the south end. There are existing storm sewer pipes along south boundary.
XP-SWMM model results indicate that runoff from future developments at these sites can be discharged into the existing sewer pipeline along NW Front Avenue to MS4 outfall AAJ638 (or MS4 outfall OF22B) without causing significant surcharge problems in the existing system. The outfall pipe is assumed to receive sanitary overflow from Guilds Lake Pump Station. Based on sanitary analysis, the pump station has adequate capacity and will not spill into the storm system under 10-year event. Therefore, no flow from Guilds Lake Pump Station is assumed. There is also an existing storm sewer along NW 61st Avenue and eventually discharges to outfall AAM088. XP-SWMM model results indicate there is no extra capacity in this sewer line to accommodate flow from future developments at the site.
NWID04 This level lot is entirely vegetated with grass and few shrubs. There are existing storm sewer system in the vicinity that might be able to carry additional runoff from future development. MS4 delineation available for the site. If pipe size/inverts information available, capacity can be estimated to evaluate the extra loading.
XP-SWMM model results indicate that runoff from future developments at these sites can be discharged into the existing sewer pipe line along NW Front Avenue to MS4 outfall AAJ638 (or MS4 outfall OF22B) without causing significant surcharge problems in the existing system. The outfall pipe is assumed to receive sanitary overflow from Guilds Lake Pump Station. Based on sanitary analysis, the pump station has adequate capacity and will not spill into the storm system under 10-year event. Therefore, no flow from Guilds Lake PS is assumed. There is also an existing storm sewer along NW 61st Avenue and eventually discharges to outfall AAM088. XP-SWMM model results indicate there is no extra capacity in this sewer line to accommodate flow from future developments at the site.

DRAFT WHRS_STORMWATER&SANITARY_SYSTEM_ANALYSIS_09052007KGHVA.DOC A-3
TABLE A-1 Stormwater Infrastructure Analysis Information
Site Site Information Stormwater System Capacity Analysis Notes and
Results
NWID05 The site is split into two portions: 8.6 acres and 7.5 acres.
In the 8.6-acre portion, about 90 percent of this level site is covered in grass or bare earth, the rest is paved and supports 7 tanks. There is an existing storm sewer system in the vicinity that might be able to carry additional runoff from future development. MS4 delineation available for the site. If pipe size/inverts information available, capacity can be estimated to evaluate the extra loading.
In the 7.5-acre portion, this lot is about 75 percent impermeable with pavement and buildings. The rest is grassy. There is an existing storm sewer system in the vicinity that might be able to carry additional runoff from future development. MS4 delineation available for the site. If pipe size/inverts information available, capacity can be estimated to evaluate the extra loading.
XP-SWMM model results indicate that runoff from future developments at these sites can be discharged into the existing sewer pipeline along NW Front Avenue to MS4 outfall AAJ638 (or MS4 outfall OF22B) without causing significant surcharge problems in the existing system. The outfall pipe is assumed to receive sanitary overflow from Guilds Lake Pump Station. Based on sanitary analysis, the pump station has adequate capacity and will not spill into the storm system under 10-year event. Therefore, no flow from Guilds Lake PS is assumed. There is also an existing storm sewer along NW 61st Avenue and eventually discharges to outfall AAM088. XP-SWMM model results indicate there is no extra capacity in this sewer line to accommodate flow from future developments at the site.
NWID07 The entire level lot is paved, graveled, or supports buildings.
This site is almost 100 percent impervious. This site could discharge to the 102-inch pipe along west perimeter of the site. No MS4 delineation was done for this outfall.
Used Rational Method to estimate 10-year peak flow from the site for future condition.
The 102-inch pipe outfall should have adequate capacity to accommodate peak flow from future development at the site for the following reasons: (1) The timing of the peak due to the outfall mainly receives overflow from Nicolai Shaft which takes a relatively long time to fill up the tunnel before overflow occurs. (2) Ratio of the 10-year peak flow from the site versus capacity of the 102-inch pipe.
NWID08 The NW half of this site is paved with buildings, and the SE half is a mixture of bare earth, with vegetated boundaries to two ponds and the shore.
There are three private storm sewers (one unknown size running across the site at west side, one 60-inch running across in the middle of the site and collects flow from an unknown stream, and one 36-inch along east boundary of the site) nearby that discharge to the Willamette River. Runoff from future developments may be able to be conveyed by these two existing sewer pipes.
Since three outfalls are private outfalls, not quite sure if runoff from future development can be discharged into them. Only estimated the 10-year peak flow from future development on-site and compared with the full capacity of the 60-inch pipe.
10-year peak flow from future development at this site is approximately 10 percent of the total capacity the 60-inch pipe outfall. Considering the difference in timing of the peak, the 60-inch pipe might be able to accommodate the peak flow from future development at the site.

A-4 DRAFT WHRS_STORMWATER&SANITARY_SYSTEM_ANALYSIS_09052007KGHVA.DOC
TABLE A-1 Stormwater Infrastructure Analysis Information
Site Site Information Stormwater System Capacity Analysis Notes and
Results
NWID09 About 40 percent of this small, level lot supports buildings, 40 percent is bare grass, and less than 20 percent is covered in shrubs with a few small trees.
This site is located at the upstream end of an existing storm sewer with an MS4 delineation of 103 acres. Due to the small size of the site and current impervious percentage, a simple flow ratio estimate could be performed to estimate impact of the future development at the site.
Used Rational Method to estimate 10-year peak flow from the site for future condition. With the current impervious percentage and future flow reduction requirements by SWMM, the site is unlikely to have capacity deficiencies unless there are problems now.
Given the size of the site, and the fact that it is currently 75 percent impervious and discharges to existing sewer system along NW 35th Ave., the incremental flow from future development at this site is considered insignificant compared to the minimum size of the existing collection system (i.e., 24-inch). It is safe to assume that any incremental flow from future development can be conveyed by the existing storm pipe along NW 35th Ave.
NWID10 This level lot is entirely covered in lawn with one tree.
There are existing storm sewers along perimeter of the site. MS4 delineation is done for the pipe system along north portion of the site. However, since the site is located at the US end of the system, capacity of the entire storm pipe network needs to be checked to ensure adequate capacity. There is also existing sewer pipe located at east portion of the site. No MS4 delineation is performed for this system. Again, the site is located at relatively US of the system.
Used XP-SWMM model to estimate 10-year peak flow from the site for future condition.
If all of the site runoff is sent to the existing 12-inch storm sewer along NW Yeon Ave. to MS4 outfall 16, some storm pipe segments in the existing sewer system will experience surcharge problems because of increased flow from the site. Therefore, it is likely that the site runoff would be split, sending a portion of future flow to another 27-inch to 30-inch existing storm sewer along NW Nicolai Street, which eventually goes to the 102-inch outfall pipe. Site NWID07 will also send future flow to this outfall.
NWID11 This site is about half vegetated and half impermeable. The vegetated half includes fairly level fields of grass and shrubs with some small trees. Impermeable areas include roads, paved lots, and buildings.
There is an existing 84-inch storm pipe along east boundary of the site. The existing storm sewer collects significant drainage area including drainage area for the Dianne Creek. Runoff from future new developments can be carried by existing pipe. Due to existing storm drainage area size, a percentage of flow estimate for the site versus outfall pipe capacity might be adequate.
Used XP-SWMM to estimate 10-year peak flow from the site for future condition. Estimated capacity of the 84-inchpipe outfall and performed a scale analysis.
10-year peak flow from future development at this site is less than 10 percent of the total capacity the 84-inch pipe outfall. Considering the difference in timing of the peak, the 84-inch pipe might be able to accommodate the peak flow from future development at the site.

DRAFT WHRS_STORMWATER&SANITARY_SYSTEM_ANALYSIS_09052007KGHVA.DOC A-5
TABLE A-1 Stormwater Infrastructure Analysis Information
Site Site Information Stormwater System Capacity Analysis Notes and
Results
NWID14 More than half this site is vegetated, primarily in the NW, but also to the SW. Vegetation includes grass, shrubs, and trees, possibly with a creek or wetland. 25 to 40 percent is impermeable, primarily paved with small structures and two large tanks.
There is a wetland located in the SW corner of the site. A 30-inch culvert and a roadside ditch carry runoff from upstream basins and discharge into the wetland. The wetland outlet appears to be an open ditch that eventually merges with Miller Creek and then discharges to the Willamette River. The wetland can potentially receive runoff from future developments located at west portion of the site. There is an unknown sized culvert that carries runoff from portions of NW Marina Way and NW St Helens Road to the site. There is also an 18-inch private culvert discharging to a low point at SE corner of the site (green space for now).
Assumed runoff from future development will be discharged to the wetland. No calculation was performed for this site.
No capacity check is performed for this site. Runoff from future development is assumed to discharge to the wetland first before it discharges to the river.
Swan Island Subdistrict
SIID06 This level lot slopes steeply to the Willamette at the NW edge. Nearly 90 percent is bare grass, and more than 10 percent is paved roads and parking lot.
There is a 60-inch storm sewer line along north boundary of the site, which eventually discharges into the Willamette. MS4 delineation is available for the outfall. Runoff from future developments at the site could be discharged into the 60-inch pipe after checking the capacity of existing pipe.
Used Rational Method to estimate 10-year peak flow from the site for future condition. The capacity of the 60-inch pipe was estimated using Manning’s equation. XP-SWMM was used to estimate the 10-year peak flow.
The 60-inch outfall pipe (MS4 OFM-3) appears to have adequate capacity to accommodate 10-year peak flow from future development at the site.
SIID13 This entire lot is impermeable with roads, parking lots, buildings, and 8 large storage tanks.
There are existing storm sewers on-site. MS4 delineations are done for identified outfalls on site. Runoff from future developments at the site could split and discharge into two outfalls at the site. Capacity of existing sewer pipe can be evaluated.
Divided the site based on the location of existing outfalls. Estimated peak flow for each piece of the lot. Identified extra capacity of each outfall and evaluated if the existing system has adequate capacity to carry the runoff from future developments using Rational Method. Checked capacity only at outfall pipes.
The two existing MS outfalls on-site (Willamette OFS-6 and OFS-1) appear to have adequate capacity to accommodate flow from future development at the site. The future runoff can be split and sent to two pipe outfalls. Outfall OFS-6 has more capacity than OFS-01.

A-6 DRAFT WHRS_STORMWATER&SANITARY_SYSTEM_ANALYSIS_09052007KGHVA.DOC
TABLE A-1 Stormwater Infrastructure Analysis Information
Site Site Information Stormwater System Capacity Analysis Notes and
Results
SIID15 Nearly this entire lot is one large building.
This site is 100 percent impervious now. There are parallel storm sewers (27-inch and 36-inch) at west side of the site. MS4 delineation is done for the 27-inch outfall.
Used Rational Method to estimate 10-year peak flow from the site for future condition. Estimated peak flow for the 27-inch outfall drainage area and compared with the capacity of the 27-inch to see if there is extra capacity available.
The 27-inch BES outfall pipe (MS4 OF45) has adequate capacity to accommodate runoff from future development from the site. The capacity of the 36-inch pipe outfall was not reviewed because its drainage area is not clearly defined.

DRAFT WHRS_STORMWATER&SANITARY_SYSTEM_ANALYSIS_09052007KGHVA.DOC
APPENDIX B
City of Portland Sewer Fee Code


City Code for Sewer Fees Applied to Properties Within the City of Portland 17.36.010 Sewer User Service Charges. - Printable Version
(Amended by Ordinance Nos. 159797, 161643, 163001, 164262, 165135, 165622, 166574, 166778, 168893, 169940, 170198, 170717, 173367, 174178, 174508 and 174615, effective June 30, 2000.) Sewer user service charges, as authorized by the Charter, are established and made effective as follows: A. Charges for Sanitary Sewer Services. Except as otherwise provided by this Title, sewer user service charges shall be paid by all sanitary sewage customers who cause or permit the discharge of sanitary sewage from a property in their possession into sewage facilities owned or maintained by the City. The charges shall begin upon connection. Charges for sanitary sewer services include sanitary sewer volume charges, account service charges and penalties for non-payment or late-payment of sewer charges and may include other charges as provided for in this Chapter.
1. Dwelling units. Charges for dwelling units shall be based on the volume of sewage discharge to the sanitary sewer system. When discharge meter readings are not available, the Bureau may elect to use the water meter consumption as the calculation for the sanitary sewage discharge. To avoid including irrigation water usage in this calculation, the Bureau will establish a procedure that allows for irrigation credit. When a water meter reading is not available, a sanitary sewer discharge estimate shall be made based on the customer class of characteristics as determined by the Director. The sewer user rates for dwellings are shown in Figure 3 published at the end of this Title.
2. Commercial, industrial and all occupancies other than residential. The calculation of the charges for commercial, industrial and all occupancies other than residential shall be based on the amount of incoming water volume as measured by the City water meter or information from the water district serving the property or by a Bureau approved meter that measures actual discharge volume. Discharge meters must meet the current standards for such meters as described by the Director. To establish reduced charges or credit for water not subject to sewer charges, customers must comply with the requirements in Section 17.36.040 "Special Provisions." If a sewer customer does not have a City meter or water district meter measuring the supply of water to the property, the private water supply must be metered in accordance with Section 17.36.040. In areas served by separated storm and sanitary sewer systems, the City may accept the discharge of contaminated stormwater into the sanitary sewer. The discharge volumes will be based upon the impervious area producing the contaminated stormwater and the average rainfall or a discharge meter. The discharge will be charged sanitary sewer volume rates. The sewer user rates for commercial, industrial and occupancies other than residential are as shown in Figure 3 at the end of this Title.
3. Combined dwelling units and other. Where dwelling units and other occupancies are combined on the same water supply, the charges for sanitary sewage service shall be computed in the same manner as those for commercial, industrial and all occupancies other than residential.
B. Charges for drainage services. Except as otherwise provided by this Title, drainage service charges shown in Figure 3 shall be paid by all drainage service customers who benefit from stormwater drainage system services or drainage facilities owned or maintained by the City. The Water account customer is assumed to be the drainage service customer for the purposes of drainage services. If there is no Water account customer, the Bureau of Environmental Services shall determine the drainage service customer.
1. Basis for charge. Drainage fees shall be charged based on each drainage service customer’s proportionate share of stormwater drainage system services. For administrative purposes, the

user’s proportionate share will be assumed to be perfectly correlated with the amount of impervious area on the user’s site. Unless the Bureau of Environmental Services measures actual site characteristics, impervious area shall be assumed to be the average impervious area for the customer’s class as shown in the most recent rate study.
2. Dwelling units. Unless the City chooses to measure the actual amount of impervious area on a site in the drainage service customer’s possession, the City shall assume average dwelling unit characteristics, including impervious area, for each class of dwelling unit. The averages used shall be 2,400 square feet for one or two dwelling units, 3,000 square feet for three dwelling units, and 4,000 square feet for 4 dwelling units. Impervious area for buildings with 5 or more dwelling units shall be measured. The charge per 1000 square feet of impervious area is shown in Figure 3.
3. Properties other than dwelling units. The drainage service customer’s proportionate share of stormwater drainage system services shall be calculated based on the amount of impervious area on that site rounded to the nearest 1000 square feet, and calculated as a multiple of the charge for 1000 square feet of impervious area that is shown in Figure 3.
4. Drainage Districts. Payments from Multnomah Drainage District No. 1, Peninsula Drainage District No. 1, and Peninsula Drainage District No. 2 under an Intergovernmental Agreement will constitute payment of monthly stormwater charges by properties within the boundaries of the districts, for purposes of this section.


DRAFT WHRS_STORMWATER&SANITARY_SYSTEM_ANALYSIS_09052007KGHVA.DOC
APPENDIX C
Capital Cost Estimate Details

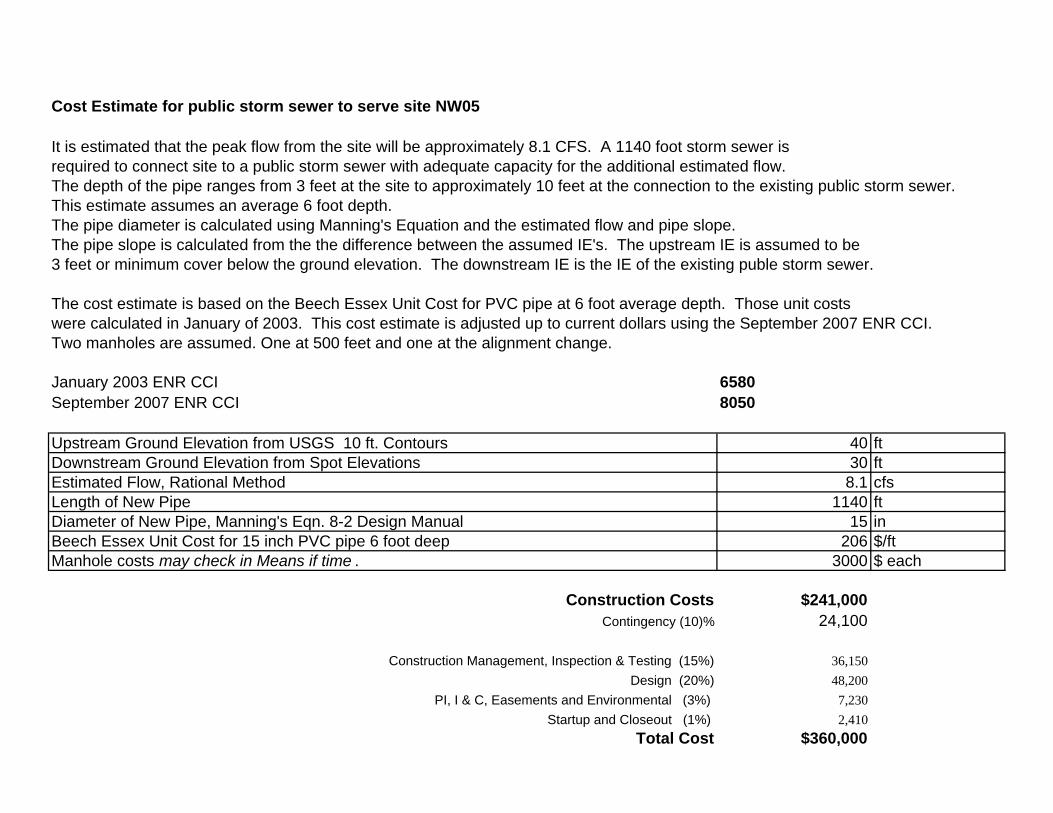
Cost Estimate for public storm sewer to serve site NW05
It is estimated that the peak flow from the site will be approximately 8.1 CFS. A 1140 foot storm sewer is required to connect site to a public storm sewer with adequate capacity for the additional estimated flow. The depth of the pipe ranges from 3 feet at the site to approximately 10 feet at the connection to the existing public storm sewer.This estimate assumes an average 6 foot depth.The pipe diameter is calculated using Manning's Equation and the estimated flow and pipe slope.The pipe slope is calculated from the the difference between the assumed IE's. The upstream IE is assumed to be3 feet or minimum cover below the ground elevation. The downstream IE is the IE of the existing puble storm sewer.
The cost estimate is based on the Beech Essex Unit Cost for PVC pipe at 6 foot average depth. Those unit costswere calculated in January of 2003. This cost estimate is adjusted up to current dollars using the September 2007 ENR CCI.Two manholes are assumed. One at 500 feet and one at the alignment change.
January 2003 ENR CCI 6580September 2007 ENR CCI 8050
Upstream Ground Elevation from USGS 10 ft. Contours 40 ftDownstream Ground Elevation from Spot Elevations 30 ftEstimated Flow, Rational Method 8.1 cfsLength of New Pipe 1140 ftDiameter of New Pipe, Manning's Eqn. 8-2 Design Manual 15 inBeech Essex Unit Cost for 15 inch PVC pipe 6 foot deep 206 $/ftManhole costs may check in Means if time . 3000 $ each
Construction Costs $241,000Contingency (10)% 24,100
Construction Management, Inspection & Testing (15%) 36,150Design (20%) 48,200
PI, I & C, Easements and Environmental (3%) 7,230Startup and Closeout (1%) 2,410
Total Cost $360,000

Shipyard Pump Station Cost Estimating Assumptions
Pump Station If the peak projected influent rate is 2,750-gpm, the firm pumping capacity of the station should be designed for a higher pumping capacity. A firm pumping capacity of 3,000-gpm would provide about a 9% allowance for pump wear. The current PS Design Manual requirement is to allow 20% for pump wear. The existing wet well active storage volume is approximately 2,450-gallons, and there is no opportunity to increase that volume because the Duty Pump ON Setpoint is already at a water surface elevation that is the same as the influent pipe I.E. The available active volume is not sufficient to accommodate the suggested pumping rate without excessive pump cycling and motor starts. The City design standard is to size wet well active volume capacity for a minimum cycle time of 10-minutes, or a maximum of 6 motor starts per hour. As indicated in the attached spreadsheet, to achieve a maximum of 6 motor starts/hr would require an active wet well volume of about 7,000 gallons. Dropping the motor starts/hr criteria to allow 10 starts/hr, which is the limit recommend by BES engineering staff, would require an active volume of more than 4,100 gallons. The existing electrical distribution system has the capacity to operate the two existing 50-hp submersible pumps, and other ancillary station equipment and lighting. This is inadequate to support the motor horsepower required to achieve a 130% increase in the station firm pumping capacity. A completely new, upsized electrical system would be needed. To achieve the target pumping capacity at this location would require a completely new pump station facility with an appropriately sized wet well, and supporting electrical, control, and alarm systems. If the modeling shows a wide range of projected influent flow rates, BES should consider the installation of a triplex pumping system similar to what was done at the Montana PS, Simmons PS, and Columbia Slough PS for the same reasons. The most similarly sized pump station project recently completed by BES was the Montana PS (Project No. 7017), which incurred at total project life cost of $1,517,439, of which $1,114,181 was expended in the construction phase.
Pressure Line With regard to the pressure line, it appears from the 1997 drawings that 1,160-lf of 12-inch HDPE pipe was installed and tied into the existing 14-inch pipe. The alignment also includes a cased crossing under two parallel railroad tracks that appears to be about 75-ft long, which would also need to be replaced.

Rough/Preliminary Project Cost Estimate Planning, Design, of a new 2,750 - 3,000-gpm PS (assume triplex submersible PS configuration)
$ 450,000
Construction of the PS $ 1,200,000 Design of the pressure main modifications $ 40,000 Construction of the pressure main modifications (assumes $240/lf for 14-inch pipe, and a $ 50,000 allowance for the railroad crossing
$ 328,000
Demolition and decommissioning of the “old” PS $ 60,000 Sub-total $ 2,078,000 30% Contingency $ 623,000 Rough/Preliminary Total Project Cost Estimate $ 2,701,000

SHIPYARD PSROUGH PRELIMINARY EVALAUTION OF THE IMPACT OF INCREASING FIRM PUMPING CAPACITY FROM 1,200-gpm to 2,750-gpm
Maximum Active Wetwell Volume 327 ft3 2,450 galProposed Firm Pumping Capacity 2,750 gpm
Check Pump Cycle Times:
Influent Flow Fill Time
Pump Run Time Cycle Time QRATED CAPACITY
(gpm)f (min) (min) (min) (gpm) (gallons) (cf) (gallons) (cf) (gallons) (cf) (gallons) (cf)0 0.00 0.00 1,200 3,000 401 1,800 241 1,500 201 1,200 160
100 24.50 0.92 25.42 1,300 3,250 434 1,950 261 1,625 217 1,300 174200 12.25 0.96 13.21 1,400 3,500 468 2,100 281 1,750 234 1,400 187300 8.17 1.00 9.17 1,500 3,750 501 2,250 301 1,875 251 1,500 201400 6.13 1.04 7.17 1,600 4,000 535 2,400 321 2,000 267 1,600 214500 4.90 1.09 5.99 1,700 4,250 568 2,550 341 2,125 284 1,700 227600 4.08 1.14 5.22 1,800 4,500 602 2,700 361 2,250 301 1,800 241700 3.50 1.20 4.70 1,900 4,750 635 2,850 381 2,375 318 1,900 254800 3.06 1.26 4.32 2,000 5,000 668 3,000 401 2,500 334 2,000 267900 2.72 1.32 4.05 2,100 5,250 702 3,150 421 2,625 351 2,100 281
1,000 2.45 1.40 3.85 2,200 5,500 735 3,300 441 2,750 368 2,200 2941,100 2.23 1.48 3.71 2,300 5,750 769 3,450 461 2,875 384 2,300 3071,200 2.04 1.58 3.62 2,400 6,000 802 3,600 481 3,000 401 2,400 3211,300 1.88 1.69 3.57 2,500 6,250 836 3,750 501 3,125 418 2,500 3341,400 1.75 1.81 3.56 2,600 6,500 869 3,900 521 3,250 434 2,600 3481,500 1.63 1.96 3.59 2,700 6,750 902 4,050 541 3,375 451 2,700 3611,600 1.53 2.13 3.66 2,750 6,875 919 4,125 551 3,438 460 2,750 3681,700 1.44 2.33 3.77 2,800 7,000 936 4,200 561 3,500 468 2,800 3741,800 1.36 2.58 3.94 2,900 7,250 969 4,350 582 3,625 485 2,900 3881,900 1.29 2.88 4.17 3,000 7,500 1,003 4,500 602 3,750 501 3,000 4012,000 1.23 3.27 4.492,100 1.17 3.77 4.942,200 1.11 4.45 5.57 Wetwell Type Round concrete caisson, I.D. 9-ft2,300 1.07 5.44 6.51 Pumps two 50-hp Flygt CP-3201 submersible pumps2,400 1.02 7.00 8.02 High Water Alarm Water Surface Elevation 13.3-ft2,500 0.98 9.80 10.78 18-inch Influent Invert Elevation 11.8-ft2,600 0.94 16.33 17.28 Duty Pump ON Water Surface Elevation 11.8-ft2,700 0.91 49.00 49.91 Duty Pump OFF Water Surface Elevation 6.6-ft2,800 0.88 Exceeds Firm Capacity Bottom Elevation 3.5-ft +/-
Key Data on the Existing Wetwell Configuration at Shipyard PS
6 motor starts/hr 10 motor starts/hr 12 motor starts/hr 15 motor starts/hrMin. W W Active Volume Required (TCYCLE= 6 min.)
Min. W W Active Volume Required (TCYCLE= 5 min.)
Min. W W Active Volume Required (TCYCLE= 4 min.)
Min. W W Active Volume Required (TCYCLE= 10 min.)
Appendix_C_Wetwell Evaluation.xlsCycle Time & Volume Tables Page 1 of 1