
Working Group Phase II Final Report - United States Energy … Power Brid… · Working Group Phase...
237
AZERBAIJAN-GEORGIA-TURKEY AGT POWER BRIDGE PROJECT Working Group Phase II Final Report Study of the Technical Potential for Trade of Electricity Between the Countries of Azerbaijan, Georgia and Turkey Thursday, March 08, 2012 This publication was produced for review by the United States Agency for International Development. It was prepared by the United States Energy Association and the Turkish Electricity Transmission Company as the volunteer Technical Coordinator of the AGT Power Bridge Project
Transcript of Working Group Phase II Final Report - United States Energy … Power Brid… · Working Group Phase...

AZERBAIJAN-GEORGIA-TURKEY AGT POWER BRIDGE PROJECT
Working Group Phase II
Final Report
Study of the Technical Potential for Trade of Electricity Between the
Countries of Azerbaijan, Georgia and Turkey
Thursday, March 08, 2012
This publication was produced for review by the United States Agency for International Development. It was prepared by the United States Energy Association and the Turkish Electricity Transmission Company as the volunteer Technical Coordinator of the AGT Power Bridge Project

Page 2 of 35
AZERBAIJAN-GEORGIA-TURKEY
AGT POWER BRIDGE PROJECT:
Working Group Phase II
Final Report Prepared for:
Office of Energy and Infrastructure
Bureau for Europe and Eurasia
United States Agency for International Development
Cooperative Agreement EEE-A-00-02-00054-00
This Report was prepared by the United States Energy Association and
Turkish Electricity Transmission Company as the volunteer Technical
Coordinator of the AGT Power Bridge Project
İnönü Bulvarı No: 27 Bahçelievler
Ankara, Turkey
United States Energy Association
1300 Pennsylvania Avenue, NW
Suite 550, Mailbox 142
Washington, DC 20004
+1 202 312-1230 (USA)
This report is made possible by the support of the American people through the United States Agency for
International Development (USAID). The contents are the responsibility of the United States Energy
Association and do not necessarily reflect the views of USAID or the United States Government.

Contents
EXECUTIVE SUMMARY ...................................................................................................... 4
1. INTRODUCTION ........................................................................................................... 7
2. ANALYSIS PERFORMED BY TEIAS & TUBITAK UZAY FOR THE TURKISH POWER
SYSTEM ................................................................................................................................ 9
2.1. Studies performed by TEIAS and TUBITAK UZAY................................................................. 10
2.2. Main Results ...................................................................................................................... 10
2.3. Main Conclusions .............................................................................................................. 16
3. ANALYSIS PERFORMED BY GSE FOR GEORGIAN POWER SYSTEM ...................... 18
3.1. Studies performed by GSE ................................................................................................. 18
3.2. Main Results ...................................................................................................................... 18
3.3. Main Conclusions .............................................................................................................. 21
4. ANALYSIS PROVIDED BY AZERENEJI FOR AZERBAIJAN UNIFIED POWER
SYSTEM AND PERFORMED BY THE AZERBAIJAN RESEARCH AND DESIGN INSTITUTE
OF POWER ENGINEERING. .............................................................................................. 24
4.1. Studies performed by Azerenerji ....................................................................................... 25
4.2. Main Results ...................................................................................................................... 25
4.3. Main Conclusions .............................................................................................................. 27
5. AGT WORKING GROUP RECOMMENDATIONS ....................................................... 29
6. AGT STEERING COMMITTEE MEETING RECOMMENDATIONS ............................ 32
ANNEX 1. Azerbaijan-Georgia-Turkey Power Bridge Project Memorandum of
Understanding ..................................................................................................................... 35
ANNEX 2. Technical Feasibility Analysis for Georgia–Turkey HVDC Interconnection, Final
Report, TEIAS & TUBITAK UZAY Power System Analysis and Planning Group, 12.05.2011.
35
ANNEX 3. Technical Feasibility Analysis of Power Export From Georgia and Azerbaijan to
Turkey Final Report, GSE.................................................................................................... 35
ANNEX 4. Analysis of Energy Export capabilities from Azerbaijan and Georgiya to Turkey
“AGT Power Brige” Project, Report, Azerenerji, Baku-2011 .............................................. 35

Page 4 of 35
EXECUTIVE SUMMARY
The Azerbaijan-Georgia-Turkey (AGT) Power Bridge Project was established in 2009 by
Azerenerji, the Georgian State Electrosystem and the Turkish Electricity Transmission
Company. It is supported by the United States Agency for International Development and the
United States Energy Association. This report marks the completion of Phase II of its
analysis. It includes the study of the technical potential for trade of electricity between the
countries of Azerbaijan, Georgia and Turkey utilizing load flow studies, short circuit analysis,
contingency analysis and dynamic analysis. The Turkish Electricity Transmission Company
(TEIAS) of Turkey was responsible for drafting the full report.
AGT Project Goals and Objectives
The AGT Power Bridge Project was developed to study and analyze the high voltage
electricity networks in Turkey, Georgia and Azerbaijan from a sub-regional perspective to
determine their capacity to support increased trade and exchange of electricity. The project is
supported by the participating transmission system opertors, USAID and USEA. TEIAS of
Turkey serves as the technical coordinator and sub-regional model integrator.
The project recognizes that Azerbaijan and Georgia have excess generating capacity and
Turkey has a rapidly growing demand for electricity. Turkey is in the final phase of testing
for synchronous operation with ENTSO-E, providing an export route to Europe for
Azerbaijan, Georgia and Turkey in the near future.
The AGT Power Bridge Project Phase II studies complement the analysis performed in AGT
Project Phase I, which conducted preliminary load flow analyses.
The goals of the AGT Project Phase II studies are:
Complement the AGT Project Phase I study results with dynamic analysis, including
voltage and frequency stability and power quality, with a focus by the countries on the
analysis which is most important from the perspective of their individual transmission
grids. For example, given its large size and connection to the ENTSO-E network, voltage
stability and power quality at the transmission grid close to the Georgian border are more
important to TEIAS than overall frequency stability. For the Georgian State
Electrosystem (GSE), frequency stability in addition to voltage stability and power quality
was most important. Azerenerji did not focus on power quality as a concern given its
synchronous connection with GSE. Instead, it focused on frequency and voltage stability.
By combining these analyses, this report identifies the most critical technical issues for
regional trade within each transmission system operator (TSO).
Analyze the high voltage networks in each of the countries from a sub-regional
perspective to identify investments that will improve the network’s capacity to support
trade and exchange while optimizing overall system security and reliability.
Provide engineers and policy makers with information on transmission reinforcements
within the networks necessary to support increased trade and improve system security.
Promote the results of the analysis to a wide audience of policy and regulatory authorities,

Page 5 of 35
and international donors and financial institutions, and
Emphasize the conclusions of the project and give recommendations for follow up studies.
The scope of the Phase II studies includes the following:
Define realistic load flow scenarios.
Conduct computer simulation analyses based on the load flow scenarios agreed to by each
party, including:
o Static load flow analysis,
o Contingency analysis,
o Dynamic simulations and stability analysis,
o Power quality analysis for the border substations in Turkey and Georgia due to
asynchronous connection through the high voltage direct current back-to-back
(HVDC B2B) substations being constructed to connect the GSE and TEIAS systems.
Organize interim meetings to ensure that the load flow scenarios are consistent and
interim results of each party are discussed and agreed mutually, before proceding further.
Project History
The Azerbaijan-Georgia-Turkey (AGT) Power Bridge Project was established in 2009 with
the signing of the Project Memoandum of Understanding by Azerenerji, the Georgian State
Electrosystem (GSE), the Turkish Electricity Transmission Company (TEIAS) and the United
States Energy Association. Upon execution of the MOU, the Power System Simulator for
Engineers (PSS/E) was selected as the common software planning platform for the project and
the United States Energy Association procured a license for the PSS/E software for
Azerenreji. The Georgian State Electrosystem and TEIAS provided training in load flow and
transient behavior analysis during the life of the project for Azerenerji and the Azerbaijan
Research and Design Institute of Power Engineering.
The following Working Group and Steering Committee meetings were conducted at strategic
intervals to discuss and review work products:
April 2009 – Project Memorandum of Understanding Executed
July 2009 – GSE and TEIAS conduct training for Azereneri and the Azerbaijan
Research and Design Institute of Power Engineering on the Use and Application of
PSS/E for load flow analysis. Azerenerji load flow model created
November 2009 – Working Group meeting to select four analytical scenarios for the
2015 planing horizon.
January 2010 – Working Group meeting to review preliminary load flow analysis
April 2010 – GSE conducts training for Azerenerji and the Azerbaijan Research and
Design Institute of Power Engineering on the use and application of PSS/E for
transient analysis.

Page 6 of 35
September 2010 – Working Group meeting to finalize Phase I Load Flow study
March 2011 – Working Group meeting to commence Phase II Transient Analysis
study, add interim planning year models for 2013, 2015 and 2017 and select additional
scenarios for analysis
November 2011 – Working Group meeting to review of draft findings of Phase II
Transient Analysis study
February 2012 – Steering Committee meeting to accept Final Phase II report
Main Conclusions
Capacity values of the HVDC B2B substations are utilized in the analysis as the physical
transfer limits to determine the secure transfer limits. After establishing the asychronous
connections in the future, the actual transfer amounts will be determined based on the
realization of transmission investments, network security level and electricity market
conditions of all countries.
Particularly during Spring scenarios, when most of the hydroelectric power plants in the
Turkish region close to border are operating with a high capacity factor, the import
capacity from Georgia should be determined by the dispatching department considering
the most recent system topology and giving the priority to system security.
o Depending on the electricity market conditions in Turkey, redispatching might be
necessary in this region as a short term measure to resolve the transmission
bottleneck (e.g., 2013 expected minimum load conditions) in either the day ahead
market mechanism or the balancing and settlement market mechanism.
The secure amount of electricity export/import between countries depends on the
following:
o For the converter station in Akhaltsikhe, it is observed that power transfer via the
converter station is possible in the sense of power quality/converter operational
stability. This level can be reached under the typical transmission system conditions
from the power quality point of view (i.e., high SCMVA) by including synchronous
condensers. Each converter block should be equipped with its own switchable filter
blocks to cope with various SCMVA levels.
o Important transmission reinforcements and/or installing emergency measures and
phase measurement units (PMU) are necessary in the countries for the secure and
reliable power exhange between the countries and to increase the amount of power
exhange gradually.

Page 7 of 35
1. INTRODUCTION
The studies performed within the scope of AGT Power Bridge Project Phase II complent
studies conducted during Phase I of the the project. Details of the AGT Project Phase I studies
are given in the AGT Project Phase I Final Report.
The main purpose of Phase I was to identify bottlenecks to exchanging power between
Turkey and Georgia and also between Georgia and Azerbaijan based on short circuit MVA
(SCMVA) and load flow analysis for selected scenarios. Although very important results are
drawn in Phase I, complementary AGT Project Phase II studies were necessary given the
following considerations:
Energy exports to Turkey from Georgia were modeled as a constant load at the 500 kV
Akhaltsikhe Substation (SS). Although the results give important indications from a static
analysis point of view, these results required further investigation and verification using
dynamic and power quality analyses, since the connection between Turkey and Georgia
will be asynchronous through the HVDC B2B substation. One of the main concerns of the
power transfer through HVDC B2B stations is the behavior of reactive power and voltage
stability. Therefore, the static analysis conducted in Phase I, which did not take into
account reactive power, has been complemented with dynamic analysis (voltage and
frequency stability and power quality analysis).
Secure and reliable power transfer between the countries depends on the different loading
conditions in each country. In the Phase I study, power flow and contingency analysis
were performed for only four seasonal scenarios; summer minimum loads, summer
maximum loads, winter minimum loads and winter maximum loads. However, spring
minimum loading conditions are perhaps more important than summer/winter peak and
minimum loading conditions, especially given the prevalence of hydroelectric generation
in the Turkish and Georigian power systems located in close proximity to the border.
Also, given that hydro conditions in the border regions of Turkey and Georgia are quite
similar, in addition to loading scenarios the anlaysis must conisder generation scenarios
from existing and potential hydroelectric generators (to be constructed).
These were the the main drivers of the AGT Power Bridge Project Phase II studies, which
were performed based on the following methodology agreed to in advance by each of the
participating TSOs:
Analysis of country’s system was performed by the following companies:
o Turkey : TEIAS (by the support of TUBITAK UZAY Institute Power Systems
Department)
o Georgia: GSE
o Azerbaijan: Azerenerji (by the support of the Azerbaijan Research and Design
Institute of Power Engineering)
Each party considered the secure limits of power transfer from their own transmission
network’s point of view based on static, dynamic and power quality analyses and
investigated necessary transmission enforcements for their system security and reliability.

Page 8 of 35
Analysis was based on mutually agreed to load flow scenarios, with each party focused on
weak points of their transmission system for security and reliability.
PSS/E software was the common analytical platform. Matlab Simulink were also utilized
in power quality analysis performed by TUBITAK UZAY for TEIAS.
The report is organized as follows. Section four gives a brief summary of the analysis
performed for the Turkish Power System by TEIAS and the TUBITAK UZAY Power
Systems Department. The analysis performed for the Georgian Power System by GSE and the
Azerbaijan Power System by Azerenerji are summarized in Section five and six. The
conclusions are given in Section seven, which is indeed the overall conclusion of the AGT
Project (including both Phase I and II). The conclusions also include important
recommendations for follow up projects.
The full analytical reports from each party are given in the Appendices. The full report
corresponding to the Turkish Power System in the region close to border with Georgia is
given in Annex two. The report corresponding to the analysis performed for the Georgian
Power System and the Azerbaijan Power System are given in Annexes three and four,
respectively.

Page 9 of 35
2. ANALYSIS PERFORMED BY TEIAS & TUBITAK UZAY FOR THE TURKISH
POWER SYSTEM
The original version of the study prepared by TEIAS and TUBITAK UZAY Power Systems
Department is attached to this report as Annex two. The full report includes three main
sections: 1) Power quality analysis (switching analysis) in which the HVDC B2B substations’
capacities are evaluated for SCMVA of the busbars at the coupling points; 2) Security
analysis in which load flow and contingency analysis are performed to determine safe transfer
limits; 3) Dynamic analysis in which voltage stability is analysed. The focus of the report is to
analyze the effects of different levels of power import from Georgia to Turkey to identify
possible transmission bottlenecks in the Turkish network and to identify measures needed to
increase safe transfer amounts.
A brief history is also given about the full Turkish study. Important milestones are described
as follows. According to the Minutes of Meeting (MoM) in Ankara between the Turkish and
Georgian parties on 08-09.12.2010, feasibility analysis for power transfer to Turkey through
the HVDC substations was performed by both countries’ experts, individually. Each party
considered the secure limits of power transfer from their own transmission network point of
view. A second meetng was organized between the Turkish and Georgian parties in Tbilisi on
18.02.2011 to discuss the initial results and ensure that the ongoing studies were aligned.
Finally, a workshop was performed in Ankara with participation of TEIAS, GSE and
Azerenerji on 19-20 April 2011 to share the draft results. The scenarios were also fixed in this
workshop before finalizing the study. Several draft reports were prepared in the interim.
The full Turkish report provided in Annex 1 includes the feasibility analysis methodology and
final results. The feasibility of power transfer from Georgia to Turkey was analyzed with
computer simulations (MATLAB TM
under the license of TUBITAK UZAY and PSS/E TM
under the license of TEIAS) based on the scenarios and network models (as described in
detail later in this report).
The report provides an introduction to the HVDC B2B substations which will enable
asynchronous power transfer between Turkey and Georgia. It can be summarized as follows:
As agreed by the Turkish and Georgian parties, asynchronous interconnection between
Georgia and Turkey will be established via HVDC B2B Substations (SS) located in the
Akhaltsikhe and Batumi regions of Georgia. The details of the substations are:
o 3x350 MW HVDC B2B converters will be installed at the Akhaltsikhe SS by the
Georgian party by 2017.
This interconnection between the Akhaltsikhe region of Georgia and the Borcka
region of Turkey is planned to be established at the Akhaltsikhe SS (in Georgia)
and Borcka SS (in Turkey) (see Figure 1).
A second line from that region is planned to connect the Akhaltsikhe SS and
Tortum SS, which is included in the investment plan of Turkey (see Figure 1).

Page 10 of 35
Figure 1.The basic transmission routes (blue line: Muratli – Batumi line representation; dark red line: Borcka –
Akhaltsikhe line representation, light red line: Y. Tortum-Akhaltsikhe line representation).
o 2x175 MW HVDC B2B converters are planned to be installed at the Batumi region by
the Georgian party by 2015.
The interconnection in the Batumi region of Georgia will be between the
Batumi substation and the Muratli substation in Turkey (see Figure 1).
2.1. Studies performed by TEIAS and TUBITAK UZAY
Load Flow and Contingency Analysis
Dynamic Analysis
Switching and Power Quality Analysis
2.2. Main Results
Capacity values of HVDC B2B substations are utilized in the analysis as the physical
transfer limits to determine the secure transfer limits. After the establishment of the
asychronous connections in the future, the actual transfer amounts will be determined
based on both network security and electricity market conditions of both countries. The
relationships between these concepts are illustrated below:

Page 11 of 35
According to the Turkish Grid Code, the Turkish Electricity Transmission System is
designed based on the (n-1) criterion, which means that no element of the power system
should be overloaded in the event of a single contingency. Within this scope, (n-1)
security analyses were performed for the above summarized scenarios.
The contingency simulation results regarding the Georgia HVDC Interconnection are
provided in the following tables. The most important contingencies regarding the
interconnection with Georgia are classified with respect to their effect on the security of
the Turkish electricity transmission system and possible protective (and/or preventive)
measures required to maintain stability in the Turkish network.

Page 12 of 35
Legends for the following tables CS: Contingency Single 350 MW Import: Only one block of 2x350 MW Akhaltsikhe converter is in operation
700 MW Import: Two blocks of 2x350 MW Akhaltsikhe converter are in operation
1050 MW Import: Two blocks of 2x350 MW Akhaltsikhe converter and 350 MW Batumi converter
are in operation
No problems related to Georgia Interconnection
Minor redispatch problems related to Georgia Interconnection ( < 100 MW)
Major redispatch problems related to Georgia Interconnection ( > 100 MW)
Unsecure
Table 1. Summary Results for 2013 Scenarios
2013 Expected Peak Load Conditions 2013 Expected Spring Load Conditions
350 MW
Import
700 MW
Import
1050 MW
Import
350 MW
Import
700 MW
Import
1050 MW
Import
N Case (Base Case, i.e., no outage) Appendix A-
I
BASE CASE
Appendix A-
II
BASE CASE
Appendix A-
III
BASE CASE
Appendix A-
IV
BASE CASE
No Base Case
(Unsecure)
No Base
Case
(Unsecure)
The Outage of Borcka-Deriner 380
kV Line
Appendix A-
I
CS 514
Appendix A-
II
CS 514
Appendix A-
III
CS 514
Appendix A-
IV
CS 527
The Outage of Deriner-Artvin 380 kV
Line
Appendix A-
I
CS 577
Appendix A-
II
CS 577
Appendix A-
III
CS 577
Appendix A-
IV
CS 597
The Outage of Y. Tortum-Erzurum
380 kV Line
Appendix A-
I
CS 330
Appendix A-
II
CS 330
Appendix A-
III
CS 330
Appendix A-
IV
CS 341
The Outage of Erzurum-Ozluce 380
kV Line
Appendix A-
I
CS 8
Appendix A-
II
CS 8
Appendix A-
III
CS 8
Appendix A-
IV
CS 8
The Outage of Ozluce-Keban 380 kV
Line
Appendix A-
I
CS 7
Appendix A-
II
CS 7
Appendix A-
II
CS 7
Appendix A-
IV
CS 7
The Outage of Borcka-Kalkandere
380 kV Line
Appendix A-
I
CS 516
Appendix A-
II
CS 516
Appendix A-
III
CS 516
Appendix A-
IV
CS 529
The Outage of Kalkandere-Tirebolu
380 kV Line
Appendix A-
I
CS 161
Appendix A-
II
CS 161
Appendix A-
III
CS 161
Appendix A-
IV
CS 161
The Outage of Tirebolu-Borasco 380
kV Line
Appendix A-
I
CS 162
Appendix A-
II
CS 162
Appendix A-
III
CS 162
Appendix A-
IV
CS 162
The Outage of Borasco-Kayabasi 380
kV Line
Appendix A-
I
CS 116
Appendix A-
II
CS 116
Appendix A-
III
CS 116
Appendix A-
IV
CS 115
The Outage of Borasco-Carsamba 380
kV Line
Appendix A-
I
CS 192
Appendix A-
II
CS 192
Appendix A-
III
CS 192
Appendix A-
IV
CS 193
The Outage of Carsamba-Kayabasi
380 kV Line
Appendix A-
I
CS 115
Appendix A-
II
CS 115
Appendix A-
III
CS 115
Appendix A-
IV
CS 114
The Outage of Boyabat-Kursunlu 380
kV Line
Appendix A-
I
CS 93
Appendix A-
II
CS 93
Appendix A-
III
CS 93
Appendix A-
IV
CS 92
The Outage of Borcka-Artvin Double
Circuit 154 kV Line
Appendix A-
I
CS 519 &
520
Appendix A-
II
CS 519 &
520
Appendix A-
III
CS 519 &
520
Appendix A-
IV
CS 532 &
533
The Outage of Muratli-Borcka
Double Circuit 154 kV Line
Appendix A-
I
CS 509 &
510
Appendix A-
II
CS 509 &
510
Appendix A-
III
CS 509 &
510
Appendix A-
IV
CS 521 &
522

Page 13 of 35
Table 2. Summary Results for 2015 Scenarios
2015 Expected Summer Peak Load Conditions 2015 Expected Spring Load Conditions
350 MW
Import
700 MW
Import
1050 MW
Import
350 MW
Import
700 MW
Import
1050 MW
Import
N Case (Base Case, i.e., no outage) Appendix B-
I
BASE
CASE
Appendix B-
II
BASE
CASE
Appendix B-
III
BASE CASE
Appendix B-
IV
BASE CASE
Appendix B-
V
BASE
CASE
No Base Case
(Unsecure)
The Outage of Borcka-Deriner 380
kV Line
Appendix B-
I
CS 530
Appendix B-
II
CS 530
Appendix B-
III
CS 530
Appendix B-
IV
CS 552
Appendix B-
V
CS 552
The Outage of Deriner-Artvin 380
kV Line
Appendix B-
I
CS 595
Appendix B-
II
CS 595
Appendix B-
III
CS 595
Appendix B-
IV
CS 627
Appendix B-
V
CS 627
The Outage of Borçka-Ispir 380 kV
Line
Appendix B-
I
CS 531
Appendix B-
II
CS 531
Appendix B-
III
CS 531
Appendix B-
IV
CS 554
Appendix B-
V
CS 554
The Outage of Y. Tortum-Erzurum
380 kV Line
Appendix B-
I
CS 340
Appendix B-
II
CS 340
Appendix B-
III
CS 340
Appendix B-
IV
CS 360
Appendix B-
V
CS 360
The Outage of Erzurum-Ozluce 380
kV Line
Appendix B-
I
CS 10
Appendix B-
II
CS 10
Appendix B-
III
CS 10
Appendix B-
IV
CS 10
Appendix B-
V
CS 10
The Outage of Erzurum-Agri 380 kV
Line
Appendix B-
I
CS 343
Appendix B-
II
CS 343
Appendix B-
III
CS 343
Appendix B-
IV
CS 363
Appendix B-
V
CS 363
The Outage of Erzurum-Ispir 380 kV
Line
Appendix B-
I
CS 341
Appendix B-
II
CS 341
Appendix B-
III
CS 341
Appendix B-
IV
CS 361
Appendix B-
V
CS 361
The Outage of Ozluce-Keban 380
kV Line
Appendix B-
I
CS 9
Appendix B-
II
CS 9
Appendix B-
III
CS 9
Appendix B-
IV
CS 9
Appendix B-
V
CS 9
The Outage of Borcka-Kalkandere
380 kV Line
Appendix B-
I
CS 532
Appendix B-
II
CS 532
Appendix B-
III
CS 532
Appendix B-
IV
CS 555
Appendix B-
V
CS 555
The Outage of Kalkandere-Tirebolu
380 kV Line
Appendix B-
I
CS 166
Appendix B-
II
CS 166
Appendix B-
III
CS 166
Appendix B-
IV
CS 168
Appendix B-
V
CS 168
The Outage of Tirebolu-Ordu 380
kV Line
Appendix B-
I
CS 167
Appendix B-
II
CS 167
Appendix B-
III
CS 167
Appendix B-
IV
CS 169
Appendix B-
V
CS 169
The Outage of Ordu-Borasco 380 kV
Line
Appendix B-
I
CS 297
Appendix B-
II
CS 297
Appendix B-
III
CS 297
Appendix B-
IV
CS 305
Appendix B-
V
CS 305
The Outage of Borasco-Kayabasi
380 kV Line
Appendix B-
I
CS 118
Appendix B-
II
CS 118
Appendix B-
III
CS 118
Appendix B-
IV
CS 117
Appendix B-
V
CS 117
The Outage of Borasco-Carsamba
380 kV Line
Appendix B-
I
CS 197
Appendix B-
II
CS 197
Appendix B-
III
CS 197
Appendix B-
IV
CS 200
Appendix B-
V
CS 200
The Outage of Carsamba-Kayabasi
380 kV Line
Appendix B-
I
CS 191
Appendix B-
II
CS 191
Appendix B-
III
CS 191
Appendix B-
IV
CS 194
Appendix B-
V
CS 194
The Outage of Ordu-Resadiye 380
kV Line
Appendix B-
I
CS 135
Appendix B-
II
CS 135
Appendix B-
III
CS 135
Appendix B-
IV
CS 134
Appendix B-
V
CS 134
The Outage of Boyabat-Kursunlu
380 kV Line
Appendix B-
I
CS 95
Appendix B-
II
CS 95
Appendix B-
III
CS 95
Appendix B-
IV
CS 94
Appendix B-
V
CS 94
The Outage of Ispir-Bagistas 380 kV
Line
Appendix B-
I
CS 5
Appendix B-
II
CS 5
Appendix B-
III
CS 5
Appendix B-
IV
CS 5
Appendix B-
V
CS 5
The Outage of Bagistas-Keban 380
kV Line
Appendix B-
I
CS 4
Appendix B-
II
CS 4
Appendix B-
III
CS 4
Appendix B-
IV
CS 4
Appendix B-
V
CS 4
The Outage of Borcka-Artvin
Double Circuit 154 kV Line
Appendix B-
I
CS 535 &
536
Appendix B-
II
CS 535 &
536
Appendix B-
III
CS 535 & 536
Appendix B-
IV
CS 559 &560
Appendix B-
V
CS 559
&560
The Outage of Muratli-Borcka
Double Circuit 154 kV Line
Appendix B-
I
CS 525 &
526
Appendix B-
II
C S 525 &
526
Appendix B-
III
C S 525 & 526
Appendix B-
IV
CS 546 & 547
Appendix B-
V
CS 546 &
547

Table 3. Summary Results for 2017
2017 Expected Peak Load Conditions 2017 Expected Spring Load Conditions
350 MW
Import
700 MW
Import
1050 MW
Import
1400 MW
Import
350 MW Import 700 MW Import 1050 MW
Import
1400 MW
Import
N Case (Base Case, i.e., no outage) Appendix C-I
BASE CASE
Appendix C-
II
BASE CASE
Appendix C-
III
BASE CASE
Appendix C-IV
BASE CASE
Appendix C-V
BASE CASE
Appendix C-VI
BASE CASE
No Base Case
(Unsecure)
No Base Case
(Unsecure)
The Outage of Borcka-Deriner 380 kV Line Appendix C-I
CS 535
Appendix C-
II
CS 535
Appendix C-
III
CS 535
Appendix C-IV
CS 535
Appendix C-V
CS 564
Appendix C-VI
CS 563
The Outage of Deriner-Artvin 380 kV Line Appendix C-I
CS 600
Appendix C-
II
CS 600
Appendix C-
III
CS 600
Appendix C-IV
CS 600
Appendix C-V
CS 637
Appendix C-VI
CS 636
The Outage of Y. Tortum-Erzurum 380 kV Line Appendix C-I
CS 344
Appendix C-
II
CS 344
Appendix C-
III
CS 344
Appendix C-IV
CS 344
Appendix C-V
CS 370
Appendix C-VI
CS 370
The Outage of Erzurum-Ozluce 380 kV Line Appendix C-I
CS 11
Appendix C-
II
CS 11
Appendix C-
III
CS 11
Appendix C-I
CS 11
Appendix C-V
CS 11
Appendix C-VI
CS 11
The Outage of Erzurum-Agri 380 kV Line Appendix C-I
CS 341
Appendix C-
II
CS 341
Appendix C-
III
CS 341
Appendix C-IV
CS 341
Appendix C-V
CS 373
Appendix C-VI
CS 367
The Outage of Erzurum-Ispir380 kV Line Appendix C-I
CS 345
Appendix C-
II
CS 345
Appendix C-
III
CS 345
Appendix C-IV
CS 345
Appendix C-V
CS 371
Appendix C-VI
CS 367
The Outage of Ozluce-Keban 380 kV Line Appendix C-I
CS 10
Appendix C-
II
CS 10
Appendix C-
III
CS 10
Appendix C-IV
CS 10
Appendix C-V
CS 10
Appendix C-VI
CS 10
The Outage of Borcka-Kalkandere 380 kV Line Appendix C-I
CS 537
Appendix C-
II
CS 537
Appendix C-
III
CS 537
Appendix C-IV
CS 537
Appendix C-V
CS 566
Appendix C-VI
CS 565
The Outage of Kalkandere-Tirebolu 380 kV Line Appendix C-I
CS 167
Appendix C-
II
CS 167
Appendix C-
III
CS 167
Appendix C-IV
CS 167
Appendix C-V
CS 169
Appendix C-VI
CS 169
The Outage of Tirebolu-Ordu 380 kV Line Appendix C-I
CS 168
Appendix C-
II
CS 168
Appendix C-
III
CS 168
Appendix C-IV
CS 168
Appendix C-V
CS 170
Appendix C-VI
CS 170
The Outage of Ordu-Borasco 380 kV Line Appendix C-I
CS 298
Appendix C-
II
CS 298
Appendix C-
III
CS 298
Appendix C-I
CS 298
Appendix C-V
CS 307
Appendix C-VI
CS 307
The Outage of Borasco-Kayabasi 380 kV Line Appendix C-I
CS 119
Appendix C-
II
CS 119
Appendix C-
III
CS 119
Appendix C-IV
CS 119
Appendix C-V
CS 118
Appendix C-VI
CS 118
The Outage of Borasco-Carsamba 380 kV Line Appendix C-I
CS 198
Appendix C-
II
CS 198
Appendix C-
III
CS 198
Appendix C-IV
CS 198
Appendix C-V
CS 201
Appendix C-VI
CS 201
The Outage of Carsamba-Kayabasi 380 kV Line Appendix C-I
CS 192
Appendix C-
II
CS 192
Appendix C-
III
CS 192
Appendix C-IV
CS 192
Appendix C-V
CS 195
Appendix C-VI
CS 195

Page 15 of 35
The Outage of Ordu-Resadiye 380 kV Line Appendix C-I
CS 136
Appendix C-
II
CS 136
Appendix C-
III
CS 136
Appendix C-IV
CS 136
Appendix C-V
CS 135
Appendix C-VI
CS 135
The Outage of Boyabat-Kursunlu 380 kV Line Appendix C-I
CS 96
Appendix C-
II
CS 96
Appendix C-
III
CS 96
Appendix C-IV
CS 96
Appendix C-V
CS 95
Appendix C-VI
CS 95
The Outage of Ispir-Bagistas 380 kV Line Appendix C-I
CS 6
Appendix C-
II
CS 6
Appendix C-
III
CS 6
Appendix C-IV
CS 6
Appendix C-V
CS 6
Appendix C-VI
CS 6
The Outage of Ispir-Borçka 380 kV Line Appendix C-I
CS 5
Appendix C-
II
CS 5
Appendix C-
III
CS 5
Appendix C-IV
CS 5
Appendix C-V
CS 5
Appendix C-Iı
CS 5
The Outage of Borcka-Artvin Double Circuit 154 kV
Line Appendix C-I
CS 540 &
541
Appendix C-
II
CS 540 &
541
Appendix C-
III
CS 540 &
541
Appendix C-IV
CS 540 & 541
Appendix C-V
CS 569&570
Appendix C-VI
CS 569&570
The Outage of Muratli-Borcka Double Circuit 154 kV
Line Appendix C-I
CS 530 &
531
Appendix C-
II
CS 530 &
531
Appendix C-
III
CS 530 &
531
Appendix C-IV
CS 530 & 531
Appendix C-V
CS 557&558
Appendix C-VI
CS 557&558

2.3. Main Conclusions
The main conclusions drawn from the report are given below:
For the 2013 scenario it is considered that the 400kV Borcka – Akhaltsikhe
interconnection line is in service. The conclusions for the 2013 scenario regarding the
secure operation of the transmission system and system stability can be summarized as
follows:
o For the converter station in Akhaltsikhe (2x350 MW), 700 MW power transfer via the
converter station is technically possible in the sense of power quality and converter
operational stability concerns, provided that 3x60 MVar synchronous condensers are
constructed at 400 kV side (i.e., Turkish side) of Akhaltsikhe substation.
o According to the simulation results, the expected feasible operation band could be
between ~470-700 MW depending on the operational constraints of the Turkish
system (ESCR, etc.). Therefore, each converter block should be equipped with its
own switchable filter blocks. This fact should be taken into account in the Back to
Back substations’ design. If systems’ regimes allow, the Back to Back station can be
used at its maximum capacity.
o For the B2B Converter Station in Batumi, it has been observed that the capacity of
350 MW is within the limits of safe power transfer, satisfying dynamic overvoltage
and frequent commutation failure constraints.
o Considering the transmission bottleneck in the Turkish region for the analyzed 2013
scenarios, the initial power import capacity from Georgia to Turkey is recommended
not to exceed 700 MW in the normal transmission system conditions, with the
presence of a special protection scheme that coordinates the outages of Deriner-
Erzurum 400 kV and/or Borcka-Tirebolu 400 kV lines with fast reduction of power
import from Georgia and/or tripping some hydropower units in Turkey and even
tripping the Akhaltsikhe 400 kV transmission line (if necessary). A special protection
scheme for coordinating outages is planned to be completed with collaboration
between GSE and TEIAS by the beginning of 2013.
o Especially during the spring flood period (aproximately 3-3,5months) depending on
the water regime, when most of the hydroelectric power plants in the Turkish region
are in operation with high capacity factor, the total import capacity from Georgia
could be less than 350 MW. The total import capacity should be determined by the
Dispatching Department of both parties by considering the most recent system
topology, available generation capacity and giving the priority to system security.
o Accordingly, the net transfer capacity (NTC) of the interconnection lines should be
determined for each settlement period.
For the 2015 scenario results regarding the secure operation of the transmission system
and system stability can be summarized as follows:
o The effect of adding new 400 kV transmission lines which will start from Borcka and
end at the 400kV Keban substation and other reinforcements included in the TEIAS
investment program increases trading capacity up to 1050 MW depending on the
network constraints. This means that Batumi-Muratli and Borcka-Akhaltsikhe B2B

Page 17 of 35
substations can be utilized at their full capacity provided that the corresponding
reinforcements stated in the Final Report will be realized.
o When the total installed generating capacity in the Turkish region increases
(especially for HPPs); the total import capacity is restricted during flood (spring)
period (aproximately 3-3,5months) by up to 700 MW. The total import capacity
should be determined by the Dispatching Department of both parties by considering
the most recent system topology, available generation capacity and giving the priority
to system security.
For the 2017 scenario, the second interconnection line from Akhaltsikhe to Yeni Tortum
in the Georgian and Turkish power systems enable power imports from Georgia up to
1400 MW (3x350 MW B2B at Akhaltsikhe substation and 350 MW B2B at Batumi
Substation) depending on the network constraints of both power systems.

Page 18 of 35
3. ANALYSIS PERFORMED BY GSE FOR GEORGIAN POWER SYSTEM
The original version of the study report prepared by GSE is attached as Annex three. The full
Georgian report focuses on the power export capabilities from Georgia to Turkey and power
transfer capabilities from Azerbaijan to Turkey through Georgia for the years 2013, 2015 and
2017. The report was prepared by the Georgian State Electrosystem (GSE).
3.1. Studies performed by GSE
The report gives details of the following analyses:
Load Flow and Contingency
Dynamic
Switching and Power Quality
Short Circuit
PSS/E software was used to conduct steady state, N-1 dynamic and static analysis, and
analysis of emergency automation systems. Simplorer software was used to conduct
switching analysis, including N-1. Details regarding the scenarios, modeling, assumptions,
and results are provided in Annex three.
3.2. Main Results
A summary of the principle findings in the full report are as follows:
In each scenario, given the loss of the Akhaltske –Borcka line or the Batumi-Muratli line,
generation at the the Enguri hydro plant must be re-dispatched by automated protection
systems. For example, in the 2015 Spring Minimum scenario, the loss of the Akhaltske-
Borcka line would require Enguri to reduce generation by 620 MW, while the loss of the
Batumi-Murtatli line would require Enguri to reduce generation by 300 MW. In the 2015
Summer and Winter maximum load scenarios, the loss of Akhaltske-Borcka would
require Enguri to reduce its generation by 720 MW.
Similar calculations are made for the loss of the Mukrhani overhead line (OHL)
connecting Gardabani with the Samukh substation in Azerbaijan. In the event of the loss
of this line, 225 MW and 300 MW of Georgian load must be shed to restore system
balance in both the Winter Max 2015 and Winter Max 2017 Scenarios 1, respectively.
In all cases, the adjustments are presumed to be made by automated protection systems,
which are already installed on the GSE system.
The following tables summarize the study results. Light green signifies that following an
N-1 outage all system parameters remain in normal ranges; orange color signifies that
following an N-1 outage, some system parameters deviate from permitted ranges. These
may be improved by dispatch actions. Red signifies that the system parameters have
inadmissible values or the system will not converge following an N-1 incident.

Page 19 of 35
Figure 2. N-1 Steady State Analysis Results for 2013.
Out of servise Winter Spring Summer Autumn
max min max min max min max min
Enguri-Zestafoni 1-6
Enguri-Jvari
Zestafoni-Qsani
Zestafoni-Akhalcikhe
Qsani-Gardabani
Gardabani-Marneuli
Qsani-Marneuli
Marneuli-Akhalcikhe
Gardabani-Samukh 9-3 9-8
Samukh-AzTPP
AzTPP-Apsheron
AT-Enguri 12-1 12-3
AT-Zestafoni
AT-Qsani
AT-Jvari
AT-Gardabani
Figure 3. N-1 Steady State Analysis Results for 2015.
Out of servise Winter Spring Summer Autumn
max min max min
Enguri-Tskhaltubo
Enguri-Jvari
Jvari-Tskhaltubo
Tskhaltubo-Zestafoni
Tskhaltubo-Akhaltsikhe
Zestafoni-Qsani
Zestafoni-Akhalcikhe
Qsani-Gardabani
Gardabani-Marneuli
Qsani-Marneuli
Marneuli-Akhalcikhe
Gardabani-Samukh 12-1
Samukh-AzTPP
AzTPP-Apsheron
AT-Enguri 15-1
AT-Zestafoni
AT-Tskhaltubo
AT-Qsani
AT-Jvari
AT-Gardabani
AT-Akhaltsikhe

Page 20 of 35
Figure 4. N-1 Analysis for 2017-1 (1400 MW Export to TR) Year
Out of servise Winter Spring Summer Autumn
max min max min
Enguri-Tskhaltubo
Enguri-Jvari
Jvari-Tskhaltubo
Tskhaltubo-Akhaltsikhe
Tskhaltubo-Zestafoni
Khudoni-Jvari
Zestafoni-Qsani
Zestafoni-Akhalcikhe
Qsani-Gardabani
Gardabani-Marneuli
Qsani-Marneuli
Marneuli-Akhalcikhe
Gardabani-Samukh 12-1 12-4
Samukh-AzTPP
AzTPP-Apsheron
AT-Enguri
AT-Zestafoni
AT-Qsani
AT-Jvari
AT-Gardabani
AT-Alhaltsikhe
AT-Marneuli
AT-Tskhaltubo
AT-Knudoni
Power Quality Analysis Results:
o For the 2013 Scenarios: according to the simulation results, at some busburs
without ac filters, the harmonic contents exceed the desirable value. After filters
are installed, even in the worst case when a 500 kV line is out of service, total
harmonic distortion (THD) is reduced to a permissible value. The maximum value
of THD is in Akhaltsikhe and it is 1.75%. Thus, approximate harmonic analysis
shows that results are within permissible levels.
o For the 2015 Scenarios: at the Akhaltsikhe 500 kV busbars in normal and N-1
conditions without filters, THD = 3.98 % and 4.35 % respectively. When filters
are installed the normal condition for THD = 2.24% and in N-1 the THD = 2.57.
As long as for Georgia three percent or less is treated as permitted, the THD
values at the Akhaltsikhe 500 kV busbars with filters are within permissible levels
for normal and N-1 operating conditions.
o For the 2017 Scenarios: during 700 MW export to Turkey via the Akhaltsikhe
B2B, at the Akhaltsikhe 500 kV busbars in normal and N-1 conditions without
filters, THD = 3.44% and 3.85% respectively. When filters are installed THD =
2.12% in normal oprerating conditions and in N-1 condition THD = 2.23. As long
as Georgia permits three percent, the THD values at the Akhaltsikhe 500 kV
busbars in normal and N-1 conditions are within permissible levels when filters
are installed.
During 1050 MW exports to Turkey via the Akhaltsikhe B2B, at the Akhaltsikhe
500 kV busbars in normal and N-1 conditions without filters, THD = 3.7% and
3.95% respectively. When filters are installed in normal condition operating
conditions, THD = 2.35% and in N-1 condition THD = 2.3%. As long as Georgia

Page 21 of 35
permits three percent, the THD values at the Akhaltsikhe 500 kV busbars in
normal and N-1 conditions are within permissible levels when filters are installed.
3.3. Main Conclusions
The following high voltage transmission reinforcements are necessary to satisfy the
reliability criterion in Georgian Power System.
o For 2013, an asynchronous interconnection between Georgia and Turkey is planned
to be established via a line commutated HVDC back to back (B2B) Substation located
in the Akhaltsikhe region of Georgia. The second end of mentioned line will be tied
with substation located in Borcka region of Turkey.
To provide reliable power exports from Georgia and Azerbaijan to Turkey, in
addition to the Akhaltsikhe substation it is necessary to build new 500 kV
substations at Jvari and Marneuli. It is also necessary to construct internal 500 kV
lines connecting the Akhaltsikhe B2B with 500 kV substations at Zestafoni and
Marneuli and 500 kV lines between substations at Ksani -- Marneuli, Gardabani --
Marneuli and Enguri – Jvari. Moreover, the reinforcement of the 220 kV power
gird in the western part of Georgia should be considered (see Figure 5).
Figure 5. Map of Georgian System for 2013.

Page 22 of 35
o For 2015, a second asynchronous interconnection between Georgia and Turkey will
be in service. The connection will be provided by a B2B substation, which will be
located in the Adjara region of Georgia, near Batumi. The second end of the tie line
will be connected with a substation located in the Muratli region of Turkey.
In order to provide power export from Georgia and Azerbaijan to Turkey in a
reliable manner, after the 2013 reinforcements of the Georgian system, there are
plans to construct a 500 kV component of the Tskaltubo substation, with 500 kV
lines connecting to the 500 kV substations at Akhaltsikhe and Jvari. Moreover, the
existing 500 kV line Imereti between the 500 kV substations at Enguri and
Zestafoni will be split. It will enter and exit from the 500 KV Substation at
Tskaltubo. New power plants will also start operation (see Figure 6).
Figure 6. Map of Georgian System for 2015.
o For 2017, power plants including the Khudoni Hydro Power Plant (HPP), the
Namakhvani HPP Cascade and others, with corresponding substations and OHLs
connecting to system will be put into operation (see Figure 7).

Page 23 of 35
Figure 7. Map of Georgian System for 2017.
In the event of a loss of an important transmission line (i.e., N-1 contingency cases):
o The Enguri Hydro Plant must be re-dispatched by automated protection systems.
The amount of redispatch depends on the contingency and energy import/export
from/to Azerbaijan/Turkey.
o Georgian load must be shed to restore system balance in the Winter Max 2015 and
Winter Max 2017 Scenario 1, respectively.
o The adjustments should be made by automated protection systems, which are
already installed on the GSE system.

Page 24 of 35
4. ANALYSIS PROVIDED BY AZERENEJI FOR AZERBAIJAN UNIFIED POWER
SYSTEM AND PERFORMED BY THE AZERBAIJAN RESEARCH AND DESIGN
INSTITUTE OF POWER ENGINEERING.
The study report prepared by Azernerji is attached as Annex four. Priorities for the
Azerbaijan power sector include increasing efficiency, operational security, energy trading,
as well as integration of renewable energy and interconnection with neighboring systems.
Currently, there are 21 power plants with a total generating capacity of 6.5 GW (with a per
capita of more than 700 kW). The total length of all transmission lines at all voltage classes
(500-35 kV) is 12,000 km. Approximately 98 % of the generation sources on the grid are
managed by JSC "Azerenerji". The map of Azerbaijan Power System is shown below.
Figure 8. Map of Azerbaijan Power System.
The strategic directions of the development of the electric power industry of Azerbaijan are
as follow:
1. Replacing technology and equipment for the generation, transport and distribution of
electricity by the most advanced and efficient technologies and equipment;
2. Balancing development of power generating facilities and backbone networks to
provide the necessary level of reliability and efficiency for electricity consumers;
3. Optimization of development and operation of power generating facilities, i.e. a
system capable of reducing production costs and electricity tariffs while ensuring
supply;

Page 25 of 35
4. Integrating the Azerbaijan power generation system with the systems of neighboring
countries;
5. Developing renewable energy source and reducing the negative impact of traditional
generation on the environment through the use of innovative technologies.
One of the priority directions of development of the National Power System is expansion and
integration with power systems of of others countries. Currently, there are interconnections
at 330 kV with the Russian Federation and three interconnection lines of 330, 220 and 110
kV level with Iran.
In the South Caucasus region, Azerbaijan’s power system is rapidly developing. Over the
past 10 years, the installed capacity has increased by more than 30% (2000 MW). In 2015
and 2017, there is a plan to connect the Azerbaijan power system to the Georgian and Turkish
power systems through the "Power Bridge". This parallel work will strengthen the strategic
importance of Azerbaijan in the South Caucasus, as well as in the Eurasian Union.
4.1. Studies performed by Azerenerji
Load Flow and Contingency Analysis
Dynamic Analysis
Though development of the high voltage interstate connections and the creation of bulk
power systems have the potential for significant benefits, the potential for instability
increases due to complications in monitoring, operating and controling a large-scale,
interconnected system. Therefore, it is necessary to check system stability in normal and
forced modes of operation.
The PSS-E software was used to develop the analysis in Annex four of this report. The first
section of Annex four provides stability analysis carried out both for the current system and
for potential connections from Azerbaijan to Georgia and Turkey, and the North Caucasus
(the Russian Federation) through the “Power Bridge” for the years 2012-2013. In the the
second part, the schemes and operation modes of the Azerbaijan power system during power
transmission to Georgia are modeled for the 2015 and 2017 planning horizon. The following
types of disturbance were invesitaged: switching off the most overloaded 500 kV and 330
kV OHLs and third phase short circuit in plant buses. Results for power flow, frequency,
voltage, and the processes of the relative angle change are presented in the annex.
4.2. Main Results
Load flow analysis results for normal and N-1 contingency conditions are summarized in
the following tables for 2012-2013, 2015 and 2017, respectively.

Page 26 of 35
Table 4. 2012-2013 Load Flow Analysis Results (Normal conditions and N-1)
Table 5. 2015 Load Flow Analysis Results (Normal conditions and N-1)

Page 27 of 35
Dynamic Stability Studies for 2012 and 2013 Scenarios:
When each of the the following two interconnection lines are lost, 500 kV Samukh-
Gardabani and 330 kV Akhstafa-Gardabani, a power deficit on Georgia side is observed and
frequency reduces to 48.29Hz. The investigations in the Georgia power system shows that in
the event of a loss of 891 MW, frequency drops to 47.5 Hz. The frequency changes at the
Azerbaijan Thermal Power Plant are negligible.
Simulating a loss of the Azerbaijan Thermal Power Plant and the Shimal Combined Cycle
plant by switching them off leads to a reduction of power flow. Switching off the Enguri
hydropower plant leads to an increase in the power flow from the Azerbaijan system.
Frequency changes are minimal during the transient processes. Based on the relative angles
of the fluctuation of power generators located in Azerbaijan and Georgia, the system is
stable.
When simulating a loss of the 500 kV and 330 kV interconnection lines equipped with
automatic reclosers, changes of voltage and power and the relative angles show that the
system remains stable. The cycle of the first amplitude depends on the load rejection scale.
The calculation of the three phase short circuit shows that the system is stable. Oscillation of
power plant’s relative angles is more noticable under a three phase chort circuit on the 500
kV busbar at the Azerbaijan Thermal Power Plant buses.
Dynamic Stability Studies for 2015 Scenario:
The system remains stable in all types of disturbances. Changes in real time angles occur
during the loss of units in the Baku TPP and the Shimal Combined Cycle Power Plant. The
level of the decrease in frequency depends on the strength of the static characteristics of the
Azerbaijan power System. For example, during a power reduction of 1360 MW, i.e., at the
330 kV buses at the Azerbaijan Thermal Power Plant generator when 5 units are lost (26,3%),
frequency drops to 48.874 Hz. The coefficient K = 11.679.
When simulating a loss by switching off the Gardabani overhead lines of 330 kV and 500 kV
and the 600 MW load buses are switched off, the frequency in the Azerbaijan power system
increases in value up to 50.248 Hz. Generators in the Shimal combined cycle power plant are
connected to the 330 kV Samukh substation. When switching off interconnection lines with
automatic recloser units with a two second time delay units on the 500 kV and 330 kV
busbars are swiched. The process changes of the relative angles shows that the system is
stable.
4.3. Main Conclusions
The main conclusions drawn in the report are as follow:
In case of losing important transmission lines, the frequency of the Azerbaijan Themal Power
Plant does have significant changes in all of the scenarios
The scheme and modes in Georgian and Turkishpower systems ("Power Bridge"), as well as
the North Caucasus (RF) match the conditions of the power systems functioning with
interconnection lines. The modes, the elements of the design parameters and the scheme of
the years 2012-2013 were , taken into account, as given by the Georgian power system). The

Page 28 of 35
required load for 2015 and 2017 for Azerbaijan-Georgia-Turkey through the “Power Bridge”
was demonstrated.
The results obtained can be used to solve emergency control issues in power unions (pools) in
the future when the Azerbaijan power system is both an importer and exporter.
Effective “Anti - Emergency Management” is important. The optimal location of hardware
smart grid technology, in particular, PMU, is essential. The location may be obtained on the
basis of a theory of measurement (criteria of observability and controllability) and sensitivity.
The results of the pre-project studies on “AGT Power Bridge” shows the capability of
controlling the transient processes by using simultaneous measurement of the complex
voltage and current (PMU) at the end of the ties.

Page 29 of 35
5. AGT WORKING GROUP RECOMMENDATIONS
Capacity values of HVDC B2B substations are utilized in the analysis as the physical
transfer limits in determining the secure transfer limits. After the establishment of the
asychronous connections in the future, the actual transfer amounts will be determined
based on both network security and electricity market conditions of all countries.
Particularly during Spring scenarios, when most of the hydroelectric power plants in the
Turkey close to border are operating with a high capacity factor, the import capacity from
Georgia should be determined by the dispatching department considering the most recent
system topology and giving the priority to system security.
o Depending on the electricity market conditions in Turkey, redispatching might be
necessary in this region as a short term measure to resolve the transmission
bottleneck (e.g., 2013 expected minimum load conditions) in either the day ahead
market mechanism or the balancing and settlement market mechanism.
Secure amount level of electricity export/import between countries depends on the
followings:
o For the converter station in Akhaltsikhe, it is observed that power transfer via the
converter station is possible in the sense of power quality/converter operational
stability. This level can be reached under the typical transmission system conditions
from the power quality point of view (i.e., high SCMVA) by including synchronous
condensers.
o Each converter block should be equipped with its own switchable filter blocks to
cope with various SCMVA levels.
o Following transmission reinforcements and emergency measures are necessary for
the secure and reliable power exhange between the countries:
Turkish Grid:
New 400 kV transmission routes that connect the region with the strong
substations at south and west part of Turkey increases the transmission capacity.
However, the total installed hydroelectric generating capacity in the region is
also expected to increase. This restricts the import capacity during the Spring
season due to the water regime. Therefore, although total import capacity should
be determined by the Dispatching Department of both parties by considering the
most recent system topology, available generation capacity and giving the
priority to system security, to be on the safe side, a special protection scheme
must be considered in case of emergency system conditions.
2013 Scenarios: Especially during flood (Spring) period (aproximately 3-
3,5months) in Turkish side, considering the transmission bottleneck and water
regime in the region, when most of the hydroelectric power plants in the Turkish
region are in operation with high capacity factor, the total import capacity from
Georgia could be less than 350 MW. The initial power import capacity from
Georgia to Turkey is recommended not to exceed 700 MW along the year, even
in the normal transmission system conditions. The total import capacity should

Page 30 of 35
be determined by the Dispatching Department of both parties by considering the
most recent system topology, available generation capacity and giving the
priority to system security.
These power exports even require presence of a special protection scheme
that coordinates the outages of Deriner-Erzurum or Borcka Tirebolu lines
with fast power reduction of power import from Georgia and/or the
possibility of tripping of Akhaltsikhe 400 kV transmission line (and/or
some units of Borcka-Deriner HPPs), if necessary.
2015 Scenarios: When the total installed generating capacity among the Turkish
region increases (especially for HPPs); the total import capacity is restricted
during flood(spring) period (aproximately 3-3,5months) up to 700 MW. The
total import capacity should be determined by the Dispatching Department of
both parties by considering the most recent system topology, available
generation capacity and giving the priority to system security.
2017 Scenarios: the second interconnection line from Akhaltsikhe to Yeni
Tortum in Turkish and Georgian power systems enable power import from
Georgia up to 1400 MW (3x350 MW B2B at Akhaltsikhe substation and 350
MW B2B at Batumi Substation) depending on the network constraints of both
power systems.
Georgian Grid:
To provide reliable power exports from Georgia and Azerbaijan to Turkey in
addition to the Akhaltsikhe substation, it is necessary to build in Georgia new
500 kV substations at Jvari and Marneuli. It is also necessary to construct
internal 500 kV lines connecting the Akhaltsikhe B2B with 500 kV substations
Zestafoni and Marneuli and 500 kV lines between substations Ksani -Marneuli,
Gardabani - Marneuli and Enguri – Jvari. Moreover, the reinforcement of the
220 kV power gird in the western part of Georgia should be considered.
In order to provide power export from Georgia and Azerbaijan to Turkey in
reliably manner, after 2013 years reinforcements of Georgian system, it is
planned to build 500 kV part in Tskaltubo substation, with 500 kV lines
connecting with 500 kV substations Akhaltsikhe and Jvari. Moreover, existing
500 kV line Imereti between 500 kV substations Enguri and Zestafoni will be
split, it will enter and exit from substation Tskaltubo 500 kV substation.
Enguri Hydro Plant must be re-dispatched by automated protection systems. The
amount of redispatch depends on the contingency and energy import/export
from/to Azerbaijan/Turkey.
Georgian load must be shed to restore system balance in some maximum
loading. The adjustments should be made by automated protection systems.
Azerbaijan Grid:
500 kV Samukh-Gardabani OHL between Azerbaijan and Georgia is the key
reinforcement to support energy exchange between the countries.
Page 31 of 35
In case of loosing important transmission lines, the frequency of the Azerbaijan
TPP changes unimportantly in all scenarios.
Effective “Anti - Emergency Management” is important for the solution of the
problem optimal location of hardware intellectual technology, in particular,
phaser measurement units (PMU). The answer may be obtained on the basis of a
theory of measurement (criteria of observability and controllability) and
sensitivity.
Example of the results of the pre-project studies on “AGT Power Bridge” shows
the capability of controlling and transient processes in this regard by using
simultaneous measurement of the complex voltage and current (PMU) at the end
of the ties.

Page 32 of 35
6. AGT STEERING COMMITTEE MEETING RECOMMENDATIONS
The Azerbaijan-Georgia-Turkey (AGT) Power Bridge Working Group and Steering
Committee conducted meetings in Istanbul, Turkey on February 2 and 3, 2012. Participating
in the meetings were representatives from the Turkish Ministry of Energy and Natural
Resources, Georgian Ministry of Energy and Natural Resources, Azerenerji, Georgian State
Electrosystem, Turkish Electricity Transmission Company, Tubitak Uzay, United States
Agency for International Development and the United States Energy Association. The
International Finance Corporation participated as an observer to the Steering Committee
meeting.
The objective of the meetings was to review the final draft of the AGT Power Bridge Phase II
report, which analyzes the sub-regional network to identify investments necessary to increase
trade and exchange of electricity and to strengthen network reliability. The draft was
presented to the Steering Committee on February 3. The Steering Committee evaluated the
findings and made a consensus recommendation on potential follow-up actions to be taken
based on the findings of this phase of the project. During the meetings each TSO presented
the findings of its own analysis. Taken together, the individual analyses form the combined
findings and recommendations of the Phase II report.
The underlying analysis contained in the report proves export of electricity from Azerbaijan
and Georgia through the back-to-back interconnection being constructed to connect Akhalske
(GE) to Borcka (TR) is feasible in terms of capacity, power quality and system stability.
Although proven feasible, significant congestion in Turkey’s transmission network limits the
capacity Turkey’s network to securely accept imports from Georgia. Coupled with
development of Georgia’s export oriented generating capacity, this factor presents challenges
to allocating cross-border transmission capacity between Georgia and Azerbaijan at the back-
to-back station.
The addition of the new 500 kV line connecting Azerbaijan’s power system with Georgia’s
strengthens their synchronous connection and confers obvious benefits to both parties. It
provides an export path for Azeri electricity to Georgia and through Georgia to Turkey. It
gives Georgia seasonal access to Azerbaijan’s thermal capacity when Georgia’s hydroelectric
plants operate at low capacity factors. And, it provides Azerbaijan with additional fast
reacting reserves for frequency and voltage control through access to Georgian hydropower
plants.
It also increases the risk that instability in one system will spread to the other. As a result, the
Working Group and Steering Committee recommended that the TSOs focus on a coordinated
approach to developing and deploying elements of an automated emergency protection
system. Such a system would monitor the networks with the use of smart grid technology
(phasor measurement units (PMU)) and in the event of a forced outage, take pre-emptive
actions to avoid cascading blackouts.
Discussions at the Working Group and Steering Committee emphasized the importance of
developing mechanisms for sharing primary and secondary reserves and settling payments
when one system uses another system’s reserves. While it is premature to contemplate an
ancillary services market in this sub-region, all parties would benefit from further discussion
on this subject. Turkey, which is now synchronously connected with ENTSO-E and has a
maturing energy market, volunteered to serve as an educator and facilitator in such
discussions.
Page 33 of 35
The following summarizes the most important points of discussion at the Working Group and
Steering Committee meetings.
TEIAS
TEIAS reported that although it is technically feasible to import power through the back-to-
back station in terms of power quality, bottlenecks in its transmission system limit imports to
a considerable extent. This is because there are no load centers in northeast Turkey, which is
the region where the back-to-back station is located. As such, imports from Georgia must
pass through a single 400kV line that is already heavily loaded. The situation is exacerbated
by development of some 6,000 MW of new hydroelectric generation capacity on the Turkish
side of the border with Georgia. When Turkish hydropower plants are operating with high
capacity factors and the load is low in the spring flood season, they will compete for access to
the transmission line with the Georgian plants located just across the border. This will create
additional congestion if not managed properly by dispatchers from each TSO. Though
TEIAS plans to add a second parallel 400 kV line in 2015, it may not contribute significantly
to alleviating congestion as additional generation capacity will be developed in the same
border region.
TEIAS reports that for the 2013 planning scenario, it is technically possible to transfer up to
700 MW from Georgia to Turkey via the back-to-back station depending on the seasonal
generation/loading conditions of the Turkish network. During the spring season when
Turkish hydropower plants are operating with high capacity factors, the upper limit for secure
import capacity will be 350 MW due to Turkish network congestion. Even under normal
operating conditions, the secure limit for imports will be no greater than 700 MW.
The effect of adding a second 400 kV line from Borcka to Keban will increase the physical
import capacity up to 1050 MW for the 2015 planning scenario depending on seasonal
generation/loading conditions. However, during the spring season the secure import capacity
will most likely be limited to 700 MW, again due to expected congestion in the Turkish
network.
For the 2017 planning scenario, it is assumed that a second back-to-back station will be
constructed to connect Batumi (GE) to Muratli (TR) with the capacity of 350 MW. This will
raise the potential capacity to import from Georgia to 1,400 MW (1,050 MW from
Akhaltske-Borcka and 350 MW from Batumi-Muratli). However, the secure import limits
will be dictated by the generation patterns and loading conditions of the Turkish network,
which for 2017 is difficult to accurately forecast.
Azerenerji
Azerenerji reported that with the completion of the 500 kV line connecting it to Georgia it
plans to export up to 650 MW to Turkey through Georgia via the back-to-back substation
being constructed to connect Akhaltske (GE) to Borcka (TR). The analysis performed by
Azerenerji proves that it will be technically feasible to do so once the 500 kV interconnection
to Georgia is energized. Even with the loss of a major transmission line in Azerbaijan or its
interconnection with Georgia, the Azerenerji transmission system will remain stable and
frequency will not fluctuate.
However, in the event of the loss of the back-to-back substation due to an unplanned outage,
the 650 MW exported to Georgia and Turkey will flow inadvertently to Russia causing
instability in the North Caucasus grid. To avoid this and other stability problems that may
arise as Azerbaijan and Georgia strengthen their synchronous interconnection, Azerenerji

Page 34 of 35
recommended a coordinated, automated emergency management protection system be
deployed by the three TSOs participating in the Project. Such a system could include the
phasor measurement units (PMU) to provide wide area awareness of frequency and voltage in
real time. In addition to the pre-emptive actions an automated protection scheme takes to
avoid cascading blackouts, it would play an important role in coordinating the use of primary
and secondary reserves, which are called upon to restore the system in the event of unplanned
transmission and generation outages.
As discussed above, planning for, coordinating the use of, and settling payment when one
system’s reserves are used by another is a commercial/market issue that arises as connections
among the three countries are strengthened. A second commercial/market issue arising from
the findings of the study is the allocation of cross-border transmission capacity between
Georgia and Turkey at the back-to-back station.
Currently, Azerbaijan shares a limited interconnection with Russia through a 330 kV line.
Though Azerbaijan could consider building a stronger interconnection to the Northern
Caucasus, Russia’s network in this region is not well developed. Therefore, there will be
considerable limitations to Azerbaijan’s exports to Russia for the foreseeable future. The
Steering Committee in its meeting report recommended including Russia in the AGT Power
Bridge Project and conducting analyses of the Northern Caucasus network.
GSE
The analysis conducted by the Georgian State Electrosystem focused on the stability of its
network when exporting through the back-to-back station to Turkey. GSE reported that
assuming the addition of a second back-to-back station connecting Batumi (GE) and Muratli
(TR) and other planned network reinforcements, it is technically feasible to export to Turkey
700 MW in 2013; 1000 MW in 2015; and up to 1,400 MW in 2017. While doing so, power
quality remains acceptable and the system remains stable in the event of an unplanned outage
by redispatching the Enguri hydropower plant and, in limited cases load shedding, triggered
by automated protection systems already installed on the GSE network.
Based on the findings and recommendations contained in the Phase II report, the Steering
Committee recommended the following subjects for the third phase of the project:
Update the sub-regional model to reflect actual developments in each system in the out
year planning scenarios
Update the analyses to take into account developments of each of the power systems –
load flow, static and dynamic behavior
Include Russia to take the Northern Caucasus power system into account
Study the establishment of automated emergency management systems, including the
deployment of PMUs to support wide are awareness among the three TSOs
Verify the dynamic models by comparing them to results of actual unplanned outages
Calculate net transfer capacities (NTC) and available (ATC) using ENTSO-E
methodologies
Propose grid code modifications in each country needed to improve reliability
Recommend methodologies for allocating transfer capacity using ENTSO-E rules
Discuss potential settlement processes used to develop compensation for reserves used by
each country and other rules for electricity markets and ancillary services

Page 35 of 35
ANNEX 1.
Azerbaijan-Georgia-Turkey Power Bridge Project Memorandum of Understanding
ANNEX 2.
Technical Feasibility Analysis for Georgia–Turkey HVDC Interconnection, Final Report,
TEIAS & TUBITAK UZAY Power System Analysis and Planning Group, 12.05.2011.
ANNEX 3.
Technical Feasibility Analysis of Power Export From Georgia and Azerbaijan to Turkey
Final Report, GSE.
ANNEX 4.
Analysis of Energy Export capabilities from Azerbaijan and Georgiya to Turkey “AGT
Power Brige” Project, Report, Azerenerji, Baku-2011

ANNEX 1
Azerbaijan‐Georgia‐Turkey Power Bridge Project Memorandum of Understanding


ANNEX 2
Technical Feasibility Analysis for Georgia–Turkey HVDC Interconnection, Final Report,
TEIAS & TUBITAK UZAY Power System Analysis and Planning Group, 12.05.2011.

1 | 60
Technical Feasibility Analysis for
Georgia–Turkey HVDC Interconnection
Final Report
By;
Power Systems Department Turkish Electricity Transmission Company
Power System Analysis and Planning Group Planning Department
12.05.2011

2 | 60
Table of Contents 1. Introduction ................................................................................................................................4
2. Analysis Scenarios and Modeling .................................................................................................5
2.1. Turkish Regional Grid Model ................................................................................................6
2.1.1. Generation and Loading Profile of the Region in Turkey ...............................................6
2.1.2. Key transmission line and substation investments at the region (EHV) .........................9
2.1.3. Equivalent Representation of the Remaining Turkish network .....................................9
2.2. Georgian Grid Model ...........................................................................................................9
2.3. Transmission Line between Borcka SS (Turkey) to Akhaltsike SS (Georgia) ......................... 10
2.4. Transmission Line between Yeni Tortum SS (Turkey) to Akhaltsike SS (Georgia) ................. 10
2.5. Transmission Line between Muratli SS (Turkey) to Batumi SS (Georgia) ............................. 10
2.6. HVDC Converter Stations at 400 kV Akhaltsikhe SS ............................................................ 10
2.7. HVDC Converter Stations at 220 kV Batumi SS ................................................................... 12
2.8. HVDC B2B Converter Model............................................................................................... 13
3. Part 1: Power Quality Analysis (Switching Analysis) ................................................................... 14
3.1. Calculation of Effective Short Circuit Ratio (ESCR) .............................................................. 15
3.2. Analysis for the Converter Station at Akhaltsikhe 500 kV SS ............................................... 15
3.2.1. Optimistic Scenario (in the sense of grid conditions in Turkey) ................................... 15
3.2.2. Pessimistic Scenario (in the sense of grid conditions in Turkey) .................................. 20
3.3. Analysis for the Converter Station at Batumi 220 kV SS ...................................................... 26
3.3.1. Optimistic Scenario (in the sense of grid conditions in Turkey) ................................... 26
3.3.2. Pessimistic Scenario (in the sense of grid conditions in Turkey) .................................. 32
4. Part 2: Security Analysis (Load Flows and Contingency Analysis) ................................................ 38
4.1. SCMVA Calculation ............................................................................................................ 38
4.2. Contingency Analysis ......................................................................................................... 38
4.2.1. 2013 Scenarios ........................................................................................................... 39
4.2.2. 2015 Scenarios ........................................................................................................... 40
4.2.3. 2017 Scenarios ........................................................................................................... 41
5. Part 3: Short Term Voltage Stability Analysis ............................................................................. 43
5.1. Analysis for the Converter Station at Akhaltsikhe 500 kV SS ............................................... 43
5.1.1. Optimistic Scenario (in the sense of grid conditions in Turkey) ................................... 43
5.1.2. Pessimistic Scenario (in the sense of grid conditions in Turkey) .................................. 44
5.2. Analysis for the Converter Station at Batumi 220 kV SS ...................................................... 45
5.2.1. Optimistic Scenario (in the sense of grid conditions in Turkey) ................................... 45

3 | 60
5.2.2. Pessimistic Scenario (in the sense of grid conditions in Turkey) .................................. 46
6. Special Protection Requirement ................................................................................................ 46
7. Conclusions ............................................................................................................................... 47
8. Other Remarks .......................................................................................................................... 50
9. Sonuçlar (Conclusions in Turkish) ............................................................................................... 50
10. References ............................................................................................................................ 51
APPENDICES...................................................................................................................................... 53
SCMVA Calculation Results for 2013-2015-2017 ................................................................................ 53
APPENDIX A-I – 2013 Peak Load Scenario 350 MW Import from Georgia ........................................... 59
APPENDIX A-II – 2013 Peak Load Scenario 700 MW Import from Georgia .......................................... 59
APPENDIX A-III – 2013 Peak Load Scenario1050 MW Import from Georgia ........................................ 59
APPENDIX A-IV – 2013 Spring Load Scenario 350 MW Import from Georgia ...................................... 59
APPENDIX B-I – 2015 Peak Load Scenario 350 MW Import from Georgia ........................................... 59
APPENDIX B-II – 2015 Peak Load Scenario 700 MW Import from Georgia .......................................... 59
APPENDIX B-III – 2015 Peak Load Scenario 1050 MW Import from Georgia ....................................... 59
APPENDIX B-IV – 2015 Spring Load Scenario 350 MW Import from Georgia ...................................... 59
APPENDIX B-V – 2015 Spring Load Scenario 700 MW Import from Georgia ....................................... 59
APPENDIX C-I – 2017 Peak Load Scenario 350 MW Import from Georgia ........................................... 60
APPENDIX C-II – 2017 Peak Load Scenario 700 MW Import from Georgia .......................................... 60
APPENDIX C-III – 2017 Peak Load Scenario 1050 MW Import from Georgia ....................................... 60
APPENDIX C-IV – 2017 Peak Load Scenario 1400 MW Import from Georgia ....................................... 60
APPENDIX C-V – 2017 Spring Load Scenario 350 MW Import from Georgia ....................................... 60
APPENDIX C-VI – 2017 Spring Load Scenario 700 MW Import from Georgia ...................................... 60
Contact People
Cihangir Gençoğlu [email protected]
Özgür Tanıdır [email protected]
Osman Bülent Tör [email protected]
TUBITAK UZAY Power Systems Department / TÜBİTAK UZAY Güç Sistemleri Bölümü
METU Campus, 06531, Ankara, Turkey / ODTÜ Yerleşkesi, 06531, Ankara, Türkiye
T: +90 312 2101054
F: +90 312 2101315

4 | 60
1. Introduction
As agreed by by both Turkish and Georgian parties, asynchronous interconnection between Georgia
and Turkey is planned to be established via line commutated back to back (B2B) HVDC Substations
(SS) located in Akhaltsikhe and Batumi regions of Georgia. Details of the substations are:
3x350 MW HVDC B2B converters are planned to be installed at Akhaltsikhe SS by the
Georgian party until 2017.
o This interconnection between Akhaltsikhe region of Georgia and Borcka region of
Turkey is planned to be established between Akhaltsikhe SS (in Georgia) and Borcka
SS (in Turkey) (see Figure 1).
o The second line from that region is planned to be between Akhaltsikhe SS and
Tortum SS which is under investment planning program of Turkey (see Figure 1).
2x175 MW HVDC B2B converters are planned to be installed at the Batumi region by the
Georgian party until 2015.
o The interconnection between Batumi region of Georgia will be between Batumi SS
and Muratli SS in Turkey (see Figure 1).
Figure 1: The basic transmission routes (blue line: Muratli – Batumi line representation; dark red line: Borcka – Akhaltsikhe line representation, light red line: Y. Tortum-Akhaltsikhe line representation).
According to the Minutes of Meeting (MoM) in Ankara between Turkish and Georgian parties on 08-
09.12.2010 [1], feasibility analysis for power transfer to Turkey through these HVDC substations has
to be performed by both countries’ experts individually. Each party should consider secure limits of
power transfer from their transmission network point of view. Another meeting was organized
between Turkish and Georgian parties in Tbilisi on 18.02.2011 [2] in order to discuss the initial results
and ensure that the ongoing studies are aligned. Finally, a workshop was performed in Ankara on 19-
20 April 2011 to share the draft results [3]. The scenarios are also fixed in this workshop before
finalizing the study. Several draft reports have been prepared until finalization of the study [4], [5].

5 | 60
This report includes the feasibility analysis methodology and final results of TUBITAK UZAY Power
System Analysis Group, in the context of general consultancy agreement that signed between
TUBITAK UZAY and TEIAS on 24.08.2010, in the scope of planning studies for Turkish power system.
The feasibility of power transfer from Georgia to Turkey is analyzed with computer simulations
(MATLAB TM under the license of TUBITAK UZAY and PSS/E TM under the license of TEIAS) based on
the scenarios and network models (as described in detail later in this report) that agreed during the
meetings mentioned above.
The report includes 3 main parts: 1) Power quality analysis (switching analysis) in which HVDC B2B
substations’ capacities are evaluated in the sense of short circuit MVA (SCMVA) of the busbars at the
coupling points, 2) Security analysis in which load flow and contingency analysis are performed in
order to determine safe transfer limits, 3) Dynamic analysis in which voltage stability is analysed.
Main focus of this report is to analyze the effects of different levels of power import from Georgia to
Turkey on the possible transmission bottlenecks in Turkish network and measures in order to
increase safe transfer amounts.
The report is organized as follows. Section 4 presents all the scenarios to be analysed and modeling
of the network including all assumptions. Power quality, security and dynamic analysis and results
are given in Section 5, 6 and 7, respectively. Section 8 emphasizes the requirement for a special
protection scheme in order to ensure that Turkish network will not operate in a state which can
result in a regional black out. The report ends with conclusion and remarks. All supportive documents
including analysis results are included as attachments.
2. Analysis Scenarios and Modeling
The following scenarios have been fixed by both parties to be analysed during the meetings [1]-[3]:
B2B substations’ capacity:
2013: 2x350 MW Akhaltsike; 2x175 MW Batumi
2015: 2x350 MW Akhaltsike; 2x175 MW Batumi
2017: 3x350 MW Akhaltsike; 2x175 MW Batumi
It is important to note that, those capacity values of HVDC B2B substations are utilized in the analysis
as the physical transfer limits in determining the secure transfer limits. After the establishment of
the asychronous connections in the future, the actual transfer amounts will be determined based on
both network security and electricity market conditions of both countries. The relationship between
these concepts are illustrated below:
Physical Transfer Limits ≥ Secure Transfer Limits ≥ Actual Transfer Amounts
(per settlement period) (per settlement period)
HVDC B2B SS capacity Security Analysis Market Conditions

6 | 60
In Turkey, grid planning scenarios are generally based on summer peak, winter peak and spring
minimum loading conditions. Given the hydraulic conditions at the region during the spring and
occurance of recent Turkish annual peak loading in summer, the most important scenarios for Turkey
in the sense of secure energy import form Georgia are envisaged to be determined by summer peak
and spring minimum loading conditions. Depending on the network conditions as well as
trnasmission line and substation investments, the analysis results of those two scenarios will provide
upper and lower limits of secure power transfer from Georgia to Turkey.
2.1. Turkish Regional Grid Model
2.1.1. Generation and Loading Profile of the Region in Turkey
2.1.1.1. Key power plants in the region (existing, under construction and planned)
The following table (Table 1) summarizes the loading scenarios of the key generators of the region
that affect the power flow in the 400 kV backbone of Turkey. The seasonal loading conditions of the
similar generators existing in the network are taken as reference in developing the corresponding
generation scenarios. Different loadings of the generators with respect to summer/spring loading
conditions are colored in the table to emphasize the increase of generation from hydraulic power
plants in the region during spring loading conditions. Representation of the existing and planned
small power plants is presented in the following section.
Table 1: Generation scheme of the key power plants in the region (existing and under construction (UC))
2013 2015 2017
Summer Spring Summer Spring Summer Spring
Borçka HPP: Single Unit (1/2), 130 MW
Borçka HPP: Two Units (2/2), 300 MW
Borçka HPP: Single Unit (1/2), 130 MW
Borçka HPP: Two Units (2/2), 300 MW
Borçka HPP: Single Unit (1/2), 130 MW
Borçka HPP: Two Units (2/2), 300 MW
Deriner HPP (UC*):
Two Units (2/4), 335 MW
Deriner HPP: Four Units (4/4), 670 MW
Deriner HPP: Two Units (2/4), 335 MW
Deriner HPP: Four Units (4/4), 670 MW
Deriner HPP: Two Units (2/4), 335 MW
Deriner HPP: Four Units (4/4), 670 MW
Arkun HPP (UC*):
Single Unit (1/1), 118 MW
Arkun HPP: Single Unit (1/1), 118 MW
Arkun HPP: Single Unit (1/1), 118 MW
Arkun HPP: Two Units (2/2), 237 MW
Arkun HPP: Single Unit (1/2), 118 MW
Arkun HPP: Two Units (2/2), 237 MW
Boyabat HPP (UC*):
Three Units (3/3), 570 MW
Boyabat HPP: Three Units (3/3), 570 MW
Boyabat HPP: Three Units (3/3), 570 MW
Boyabat HPP: Three Units (3/3), 570 MW
Boyabat HPP: Three Units (3/3), 570 MW
Boyabat HPP: Three Units (3/3), 570 MW
H. Ugurlu HPP: Four Units (4/4), 456 MW
H. Ugurlu HPP: Four Units (4/4), 456 MW
H. Ugurlu HPP: Four Units (4/4), 456 MW
H. Ugurlu HPP: Four Units (4/4), 456 MW
H. Ugurlu HPP: Four Units (4/4), 456 MW
H. Ugurlu HPP: Four Units (4/4), 456 MW
Altınkaya HPP: Four Units (4/4), 600 MW
Altınkaya HPP: Three Units (3/4), 288 MW
Altınkaya HPP: Four Units (4/4), 600 MW
Altınkaya HPP: Three Units (3/4), 288 MW
Altınkaya HPP: Four Units (4/4), 600 MW
Altınkaya HPP: Three Units (3/4), 288 MW
Borasco NGCCPP (UC*):
Single Unit (1/1), 867 MW
Borasco NGCCPP: Single Unit (1/1), 867 MW
Borasco NGCCPP: Single Unit (1/1), 867 MW
Borasco NGCCPP: Single Unit (1/1), 867 MW
Borasco NGCCPP: Single Unit (1/1), 867 MW
Borasco NGCCPP: Single Unit (1/1), 867 MW
- - - - Yusufeli HPP: Single Unit (1/3), 190 MW
Yusufeli HPP: Single Unit (1/3),
190
2.1.1.2. Small hydraulic power generation potential in the region
In Figure 2, the generating facilities (red circles) either in operation or construction or planned,
together with the main load centers (yellow circles) and the expected main transmission routes in
2013 (black lines) related to the Georgia Interconnection, are illustrated. Given considerable amount
of generation with respect to consumption of the region itself, it is essential that there is (and will be)

7 | 60
a unidirectional power flow from the Black Sea Region to the load centers located in the South East
Anatolia region, Ankara region and the Marmara region (Istanbul, Adapazari).
Note that, although dispatch of the generating units in Turkey is subjected to system security and
electricity market conditions in Turkey, almost all those generators around the region are hydraulic
type (many run-of-river), and therefore, it is reasonable to assume that a considerable amount of
generation is to be dispatched particularly during spring and initial summer periods, given the
hydrological conditions and competitiveness of those generating units. In order to reflect this to the
analysis, the following study is performed:
Figure 2: The basic transmission routes related to Georgia Interconnection (blue line: Muratli – Batumi line representation; red line: Borcka – Akhaltsikhe line representation, black lines: expected transmission highways in 2013, red circles: major generating facilities, yellow circles: major load centers).
First, the existing hydraulic generation is investigated for typical days to represent:
o 2010 Summer maximum loading conditions, and
o 2010 Spring minimum loading conditions
Then, maximum loading of the run of the river type generation with respect to total capacity is
determined both for each hour and the day. The results are summarized in the following tables.
A loading factor for the run of the river type generation is determined to be utilized in the
analysis as marked with red in the corresponding tables.
The hydroelectric power plants with reservoir storage capacity are assumed to operate at 50% of
their capacity during summer and full capacity during spring conditions (see also Table 1 above).
Finally, license applications to Energy Market Regulatory Authority (EMRA) of Turkey or project
applications to TEIAS are investigated in order to determine total capacity potential at the region.
The following tables (Tables 1-5) summarize the methodology to assign loading factors of run-of-river
type hydraulic power plants (both existing and planned) utilized in the analysis.

8 | 60
Table 2: Typical day representing spring minimum loading conditions in 2010
Table 3: Typical day representing summer maximum loading conditions in 2010
Table 4: Summary of the loading factors for typical maximum and minimum loading conditions of run-of-river type htdraulic power plants in 2010.
Loading condition Maximum loading factor of the analysed day
Average loading factor of the analyzed day
Loading factor utilized in the analysis
Spring minimum 58% 41% 60%
Summer maximum 33% 20% 20%

9 | 60
Table 5: Total foreseen small hydraulic electricity generation installed capacity in the region.
Year Expected total small scale hydraulic electricity generation (installed) capacity
2013 ~4125 MW
2015 ~5100 MW
2017 ~5514 MW
2.1.2. Key transmission line and substation investments at the region (EHV)
The following table summarizes the key transmission line and substation projects which are assumed
to be completed by the corresponding years in sequence. This table is developed by the collaboration
between TEIAS and TUBITAK UZAY experts and approved by TEIAS.
Table 6: The key planned transmission system investments
2013 2015 2017
Agri-Van 400 kV Tr. Line
Van-Siirt and Siirt-Batman 400 kV Tr. lines
Kalkandere 400 kV substation
Resadiye 400 kV substation
Kayabasi-Resadiye 400 kV Tr. line
Arkun-Y. Tortum 400 kV Tr. lines
Borcka-Artvin and Artvin-Y. Tortum 154 kV double circuit Tr. Lines
300 MVA autotransformer at Borcka SS
Agri-Van 400 kV Tr. Line
Van-Siirt and Siirt Batman 400 kV Tr. Lines
Borcka-Ispir 400 kV Tr. Line
Ispir-Bagistas 400 kV Tr. Line
Ispir-Erzurum 400 kV Tr. Line
Bagistas-Keban 400 kV Tr. Line
Ispir 400 kV substation
Ordu 400 kV substation
Ordu-Resadiye 400 kV Tr. Line
Arkun-Ispir 400 kV Tr. Line
Akhaltsikhe-Y.Tortum 400 kV Tr. Line
2.1.3. Equivalent Representation of the Remaining Turkish network
In the analysis, the Turkish network is represented with infinite buses at the Kayabasi, Kursunlu and
Keban substations (i.e., the entire Black Sea Region and East Anatolia Region transmission systems
are modeled in detail). The transmission ring between Van and Keban buses is modeled with an
equivalent line.
The Parameters of the Equivalent Line: For peak load conditions: 0.0075+0.1353j For minimum load conditions: 0.00571+0.1247j
2.2. Georgian Grid Model Akhaltsikhe 500 kV SS and Batumi 220 kV SS are modeled as infinite buses to model Georgian Grid in
the analysis (i.e., the security analysis are only performed for the Turkish transmission system). That
is, both substations in Georgia are assumed to have a sufficient SCMVA to provide a secure power
transfer from Georgian network to Turkey, which is indeed verified by the analysis of Georgian party
[1]-[3].

10 | 60
2.3. Transmission Line between Borcka SS (Turkey) to Akhaltsike SS
(Georgia) Technical Specifications taken from TEIAS, as (see Figure 1 above):
Ubase = 400 kV Type and cross-section of conductor : 3B Cardinal 954 MCM Length = ~160 km effective length Rated current (thermal limit) = 3144 A Rated power (thermal limit) = 2178 MVA Series resistance = 0.0208 Ω/km. per phase Series reactance = 0.266 Ω/km. per phase (the line is assumed to be perfectly transposed) Charging susceptance = 4.31 µS/km per phase
2.4. Transmission Line between Yeni Tortum SS (Turkey) to Akhaltsike
SS (Georgia) Technical Specifications taken from TEIAS, as (see Figure 1 above):
Ubase = 400 kV Type and cross-section of conductor : 3B Cardinal 954 MCM Length = ~160 km effective length Rated current (thermal limit) = 3144 A Rated power (thermal limit) = 2178 MVA Series resistance = 0.0208 Ω/km. per phase Series reactance = 0.266 Ω/km. per phase (the line is assumed to be perfectly transposed) Charging susceptance = 4.31 µS/km per phase
2.5. Transmission Line between Muratli SS (Turkey) to Batumi SS
(Georgia) Technical Specifications taken from TEIAS, as (see Figure 1 above):
Ubase = 154 kV Type and cross-section of conductor : 2 x 1272 MCM (i.e., double circuit) Length = ~15 km Rated current (thermal limit) = 2 x 1260 A Rated power (thermal limit) = 2 x 336 MVA Series resistance = 0.0472 Ω/km. per phase Series reactance = 0.372 Ω/km. per phase (the line is assumed to be perfectly transposed) Charging susceptance = 3.154 µS/km per phase
2.6. HVDC Converter Stations at 400 kV Akhaltsikhe SS The technical details of the AC and DC interface between the two power systems at Akhaltsikhe
substation are as listed below:
DC B2B Station (Structure of a Single Block: 350 MW transfer capacity):
Following data are based on either those data that provided by TEIAS or the assumptions (typical applications/parameters) proposed by TUBITAK UZAY experts, and notated by “Assumptions”.
Converter Transformer: o Assumptions: (Georgian side 500 kV, Turkish side 400 kV (Yg)) / 45 kV (Y ∆), 420 MVA
(%Uk= 0.12 pu at each winding) at Akhaltsike (Georgia) SS with On-Load Tap Changing Capability (at least 5 steps).
Converter Blocks: Twelve pulse configuration

11 | 60
Vdcrated = 107 kV Irated =3271 A (=350 MW/107 kV) Simulation Assumptions:
o γrated ~ 18o (inverter side) o αrated ~ 18o (rectifier side) o γmin = 15o, γmax = 28o, (inverter side) o αmin = 5o, αmax = 20o, (rectifier side)
DC line smoothing reactance: 2x50 mH
Thyristor Valves Assumptions: the thyristor valves to be utilized in the converter blocks are modeled with their system level equivalents, which includes the following assumptions:
No voltage drop on the thyristor valves (i.e., forward voltage = 0V, both at the rectifier side and at the inverter side)
No switching losses in the converter
The basic configuration of the two six pulse bridges that comprise the twelve pulse converter is illustrated is illustrated in Figure 3.
Figure 3: The topology of a 12 pulse B2B Substation
Harmonic filters: No data provided regarding the harmonic filters. Therefore, the following topology
is assumed in computer simulations:
Filter Blocks Assumptions: 2 separate harmonic filter blocks (i.e., one for each 350 MW
converter) are utilized in this study. The reason of this selection will be explained in the short
circuit analysis section of this report. Note that no additional power factor correction shunt
capacitors are utilized. The technical details of the harmonic filters are given below:
11th Harmonic Filter: Single tuned series RLC filter (band pass) (the reason of this
selection will be explained in detail at the harmonic analysis section (i.e., Section
4.2.1.3.a)):
o Vrated = 400 kV
o frated = 50 Hz
o Qrated = 52.5 MVAr (for each 350 MW block)
o f0 = 550 Hz
o Q (quality factor) = 300
13th Harmonic Filter: Single tuned series RLC filter (band pass) (the reason of this
selection will be explained in detail at the harmonic analysis section):
o Vrated = 400 kV
o frated = 50 Hz

12 | 60
o Qrated = 52.5 MVAr (for each 350 MW block)
o f0 = 650 Hz
o Q (quality factor) = 100
24th Harmonic Filter: High pass RLC filter (the reason of this selection will be explained in
detail at the harmonic analysis section):
o Vrated = 400 kV
o frated = 50 Hz
o Qrated = 52.5 MVAr (for each 350 MW block)
o f0 = 1200 Hz
o Q (quality factor) = 3
It has also been assumed that 3x60 MVA synchronous condensers are installed in the 400 kV
Akhaltsikhe swithchyard. This information is approved by Georgian party although the
corresponding project was not provided.
Important: The independent operation of two single converter blocks necessitates independent
harmonic filters in both sides of the converter substation as well (i.e. 400 kV Akhaltsikhe side
and 500 kV Akhaltsikhe side). Explicitly, there should be seperate 11th, 13th and 24th harmonic
filters, each rated at 52.5 MVAr for each 350 MW converter block, which means extra feeder,
circuit breaker, disconnecting switch, related auxiliary equipments (for measurement,
protection and telecommunication) and space requirement at both AC switchyards. This should
be kept in mind.
2.7. HVDC Converter Stations at 220 kV Batumi SS It is also planned to construct a 2x175 MW capacity converter substation at Batumi region of
Georgia. It is assumed that the B2B converter will be of the same technology with the single one to
be installed at Akhaltsikhe substation described above, except the following differences:
DC B2B Station (Structure of a Single Block):
Following data are based on either those data that provided by TEIAS or the assumptions (typical applications/parameters) proposed by TUBITAK UZAY experts, and notated by “Assumptions”.Converter Transformer:
o Assumptions: (Georgian side 220 kV, Turkish side 154 kV (Yg)) / 45 kV (Y ∆), 420 MVA (%Uk= 0.12 pu at each winding) at Akhaltsikhe (Georgia) SS with On-Load Tap Changing Capability.
Converter Blocks: Twelve pulse configuration Vdcrated = 107 kV Irated =3271 A (=350 MW/107 kV) Simulation Assumptions:
o γrated ~ 18o (inverter side) o αrated ~ 18o (rectifier side) o γmin = 15o, γmax = 28o, (inverter side) o αmin = 5o, αmax = 20o, (rectifier side)
DC line smoothing reactance: 2x50 mH
Thyristor Valves Assumptions: the thyristor valves to be utilized in the converter blocks are modeled with their system level equivalents, which includes the following assumptions:
No voltage drop on the thyristor valves (i.e., forward voltage = 0V, both at the rectifier side and at the inverter side)

13 | 60
No switching losses in the converter
The basic configuration of the converter station is illustrated in Figure 3.
Harmonic filters: The following topology is assumed in computer simulations:
Filter Blocks Assumptions: The technical details of the harmonic filters are given below:
11th Harmonic Filter: Single tuned series RLC filter (band pass):
o Vrated = 154 kV
o frated = 50 Hz
o Qrated = 52.5 MVAr
o f0 = 550 Hz
o Q (quality factor) = 100
13th Harmonic Filter: Single tuned series RLC filter (band pass):
o Vrated = 154 kV
o frated = 50 Hz
o Qrated = 52.5 MVAr
o f0 = 650 Hz
o Q (quality factor) = 100
24th Harmonic Filter: High pass RLC filter:
o Vrated = 154 kV
o frated = 50 Hz
o Qrated = 52.5 MVAr
o f0 = 1200 Hz
o Q (quality factor) = 3
Power Factor Correction Capacitor
o Vrated = 154 kV
o frated = 50 Hz
o Qrated = 52.5 MVAr (for each 350 MW block)
2.8. HVDC B2B Converter Model The CDC7T model in PSS-E [6] as illustrated in Figure 4 is utilized to model the HVDC B2B station in
load flow studies. Although the B2B converter enables bilateral transfer of power between both
sides, since it is expected that Turkish side will generally be the importing side, the inverter side of
the B2B station is assumed to be Turkey, whereas the rectifier side is assumed to be Georgia
throughout the analysis.

14 | 60
Figure 4: The CDC7T HVDC link model [1]
3. Part 1: Power Quality Analysis (Switching Analysis)
The de facto control philosophy of HVDC B2B stations is as follows [7]:
The inverter side controls the DC bus voltage (on D-F line in Figure 6)
The rectifier side controls the DC bus current (on B-C line in Figure 6)
The B2B station models in this study are constructed based on this methodology. Note that the
normal operating point of the B2B converter is point E in Figure 6. The controller structures of the
bridge converters are of the discrete nonlinear PI type (together with limiters, mode selection logic,
etc.). It should be mentioned here that the inverter side control is more dependent on grid
conditions than the rectifier side (due to minimum off time of the thyristors). Although the B2B
converter enables bilateral transfer of power between both sides, since it is expected that Turkish
side will generally be the importing side, the inverter side of the B2B station is assumed to be Turkey,
whereas the rectifier side is assumed to be Georgia throughout the analysis.

15 | 60
Figure 5: The operating curves of B2B converter stations [7]
3.1. Calculation of Effective Short Circuit Ratio (ESCR) The most crutial parameter that determines the capability of the grid to handle conventional line
frequency commutated B2B stations is the strength of the AC system, which is related to the
equivalent Thevenin impedance of the grid. HVDC interfaces at the weak points of AC systems may
result in problems such as harmonic resonance, instability and frequent commutation failures [2].
Effective Short Circuit Ratio is an index for evaluating some of the complex and variable interactions
between AC and DC systems, which is calculated according to the below formula:
A figure of merit for the healthy operation of conventional line frequency commuted HVDC interfaces
is ESCR ≥ 2.5 (3 is a more conservative and safe limit) [2]. Therefore, the results of the analysis in the
following sections will be discussed based on this criterion.
3.2. Analysis for the Converter Station at Akhaltsikhe 500 kV SS In the following sections, the feasibility of power transfer via DC back to back substation located at
Akhaltsikhe SS will be analyzed for different grid conditions in Turkish side. Two different grid
conditions will be analyzed, which are classified as optimistic and pessimistic scenarios, based on the
effective short circuit ratio at the DC back to back substation connection point, as described below.
3.2.1. Optimistic Scenario (in the sense of grid conditions in Turkey)
3.2.1.1. ESCR Calculation
The maximum value of SCMVA at Borcka SS is expected to be 3000 MVA (in case of all expected
generating units are in operation, without the synchronous condensers at Akhaltsikhe SS). Therefore,
considering also the transmission line between Borcka and Akhaltsikhe, the maximum value of
SCMVA at Akhaltsikhe end of the line is reduced to 1668 MVA due to 160 km single circuit overhead

16 | 60
line between Borcka and Akhaltsikhe substations. However, the synchronous condensers increase
the SCMVA by ~570 MVA.
In addition, the harmonic filters generally produce a total reactive power at an amount of 60% of the
rated DC power, which means:
11th harmonic filters = 2x52.5 MVAr
13th harmonic filters = 2x52.5 MVAr
24th harmonic filters = 2x52.5 MVAr
Note that no power factor compensation is required for the optimistic scenario (will be explained in
the reactive power requirement calculation)
Therefore, the amount of safe power transfer which will avoid dynamical overvoltages (DOV) and
frequent commutation failures is calculated as:
≈ 720 MW
3.2.1.2. Reactive Power Requirement Calculation
As a result of the power quality simulation studies, it has been found out that transfer of 700 MW from Georgia to Borcka seems possible only for the optimistic scenario in the sense of power quality standards of the Turkish Grid Code, provided the compensation of at least two of the proposed 3x75 MVA synchronous condensers. However, static and dynamic analysis results should be taken into account before giving any final decision.
3.2.1.3. Simulation Results
a) Harmonics Analysis
It is essential that any nonlinear load is a harmonic current source and hence should be sufficiently
compensated in order not to overload the electrical equipment with excessive reactive power that
has no practical use. Since a group of customers are interconnected to the power system at a specific
node (Point of Common Coupling, PCC), the transmission system operator is responsible from
maintaining an acceptable sinusoidal voltage wave shape for the quality of supply.
Any B2B converter is, similarly, a source of harmonic currents and hence should be compensated
adequately so as to maintain the power quality standards defined in the Turkish Grid Code [9].
Similar to the case in the 5.2.1.2. section of this report, as the optimistic scenario, 700 MW power
transfer from Georgia is analyzed in this section (i.e., Turkey is the inverter side). The time domain
simulation results of the B2B converter is illustrated in Figure 6.

17 | 60
Figure 6: Time domain transient switching results of the B2B converter
One can immediately see the distortion on the voltage wave shape at Borcka substation, due to the
nonlinear nature of the inverter. The harmonic spectrum of the inverter current is illustrated in
Figure 7.
Figure 7: The harmonic spectrum of inverter current
1 1.01 1.02 1.03 1.04 1.05 1.06 1.07 1.08 1.09 1.1-1
-0.5
0
0.5
1Time Domain Transient Simulation Results
Vo
ltag
e
@ A
kh
alt
sik
he S
S
(pu
)
1 1.01 1.02 1.03 1.04 1.05 1.06 1.07 1.08 1.09 1.1-5
0
5
Invert
er
Cu
rren
t
(pu
)
1 1.01 1.02 1.03 1.04 1.05 1.06 1.07 1.08 1.09 1.1-1
-0.5
0
0.5
1
Vo
ltag
e
@ B
orc
ka S
S
(pu
)
1 1.01 1.02 1.03 1.04 1.05 1.06 1.07 1.08 1.09 1.1-10
-5
0
5
10
Time (sec)
Lin
e C
urr
en
t
(Filte
red
)
(pu
)
0 500 1000 1500 2000 2500 30000
0.5
1
1.5
2
2.5Amplitude Spectrum of Inverter Current
Frequency (Hz)
Am
plitu
de o
f V
olt
ag
e
(pu
)

18 | 60
As can be readily seen in Figure 7, the most dominant harmonic of the inverter current is the 11th
harmonic. This verifies the necessity of the harmonic filters that should be tuned as mentioned in the
3.4. section of this report. It should be noted that in most applications, the 11th and 13th harmonic
filters are tuned with a quality factor of 100.
The harmonic spectrum of line current at the receiving end of the transmission line (i.e., Borcka
substation) is illustrated in Figure 8. It can be observed that the problematic harmonic components
are eliminated by analyzing Figure 6 and Figure 8 together.
The harmonic spectrum of voltage at Borcka substation is illustrated in Figure 9. The comparison of
the harmonic components of the voltage waveform illustrated in Figure 6 and Figure 9 are listed in
Table 7. It can be seen that all requirements of the grid code are satisfied with the topology
expressed in the third part of this study. Another very important point for the assessment of the
results of Table 7 is that, according to the power quality measurements taken by TEIAS power quality
monitoring system it can be seen that no serious harmonic distortion at Borcka busbar (PCC for
Turkish transmission system) is present and hence most of the permitted room for harmonic voltage
distortion will be occupied by the B2B converter (especially by the 11th harmonic, which is written in
red in Table 7).
Figure 8: The harmonic spectrum of the current at the receiving end (Borcka substation) of the transmission line
0 500 1000 1500 2000 2500 30000
0.1
0.2
0.3
0.4
0.5
0.6
0.7
0.8
0.9
1Amplitude Spectrum of Filtered Current
Frequency (Hz)
Am
plitu
de o
f V
olt
ag
e
(pu
)

19 | 60
Figure 9: The harmonic spectrum of the voltage at Borcka substation
Table 7: The comparison of the voltage harmonics related to the B2B converter and Turkish grid code requirements
Odd Harmonics (Non multiples of 3) Odd Harmonics (Multiples of 3) Even Harmonics
Harmonic
Number
Harmonic
Voltage (%)
Simulation
Results (%)
Harmonic
Number
Harmonic
Voltage (%)
Simulation
Results (%)
Harmonic
Number
Harmonic
Voltage (%)
Simulation
Results (%)
5
7
11
13
17
19
23
25
>25
1.25
1.0
0.7
0.7
0.4
0.4
0.4
0.4
0.2+0.2 (25/h)
0.1468
0.0391
0.6106
0.0348
0.0873
0.0109
0.0399
0.0386
OK
3
9
15
21
>21
1.0
0.4
0.2
0.2
0.2
0.5145
0.0654
0.0594
0.0230
OK
2
4
6
8
10
12
>12
0.75
0.6
0.4
0.4
0.4
0.2
0.2
0.4000
0.1543
0.0045
0.0724
0.0579
0.1136
OK
THD < % 2 OK, but very close to the limit
b) Voltage Dips and Swells Analysis, and Voltage Regulation for Converter Start up
Since the converter station is connected at a relatively weak transmission node, it has been
observed that with the operation of the converter station:
0 500 1000 1500 2000 2500 30000
0.1
0.2
0.3
0.4
0.5
0.6
0.7
0.8
0.9
1Amplitude Spectrum of Bus Voltage
Frequency (Hz)
Am
plitu
de o
f V
olt
ag
e
(pu
)

20 | 60
i) If the converter is not in service, by the compensation of the synchronous condensers,
the voltage at the 400 kV Akhaltsikshe substation terminal of the line can be maintained
within the permissible limits (which will most probably not cause a breakdown) despite
the capacitive effect of the harmonic filter blocks at nominal frequency and the long
transmission line, in case the unregulated voltage at Borcka substation tends to be
around 400 kV (i.e., Borcka HPP is not in operation).
ii) However, in order to minimize the risk of failures, while the converter is being put into
service (note that any switching operation should not cause a voltage dip larger than 2%
according to Turkish Grid Code),
o Coordination should be provided via the Turkish regional load dispatch center to
maintain rated voltage at Borcka substation.
o The inverter should be brought to its desired operating point (Note that as the
converter will increase its power, it will draw reactive power from the system,
hence it should be brought to its desired operating point progressively in
coordination with the RLDC).
In conclusion, voltage regulation by Borcka and/or Deriner HPPs might be necessary in order to
start up the converter.
c) Voltage Imbalance
Within the operation of the converter station, all three phases are expected to be loaded in a
balanced manner, in case no failures occur.
d) Flicker
Since the converter station is connected at a relatively weak transmission node, depending on its
controller parameters and operating point, it might cause flicker problems at Borcka SS. Since the
aforementioned phenomenon is a stochastic process, the exact value of the flicker amplitude
should be determined by measurements in the future.
e) Interharmonics and Subharmonics
Since the converter station (a considerable size nonlinear load) is connected to the transmission
system, depending on its operating point (note that although the nominal frequency of the both
systems is 50 Hz, in practice, the frequencies of two systems at any instant will most probably be
different) and nature of future transmission customers connected at the PCC (i.e., Borcka SS), it
might cause problems related to interharmonics and/or subharmonics. Therefore, in the future,
special attention should be paid by the TSO, particularly if any industrial loads are to be
connected at Borcka SS.
3.2.2. Pessimistic Scenario (in the sense of grid conditions in Turkey)
Important: This scenario is analyzed to assess the behavior of the Akhaltsikhe 2x350 MW B2B
converter in the case of weakest grid conditions (i.e., for the lowest SCMVA possible in Borcka SS) in
Turkey. Hence the results should be evaluated as the maximum power that the converter can survive
its operation in the worst grid conditions (i.e., when all units of Borcka and Deriner HPPs are out of
service (due to hydrological or market conditions) and Borcka-Kalkandere line is lost, (i.e., n-1)) of
Turkey from the power quality point of view. Note that this case is different from the spring

21 | 60
conditions analyzed in the security analysis section!!! This scenario is denoted as pessimistic from
the power quality point of view.
3.2.2.1. ESCR Calculation
The minimum value of SCMVA at Borcka SS is expected to be 1700 MVA when both hydraulic units of
Borcka and Deriner HPPs are not in operation (without the synchronous condenser at Akhaltsikhe SS.
This corresponds to SCMVA of 1177 MVA at the Akhaltsikhe end of the line (160 km single circuit
overhead line). However, the synchronous condensers increase the SCMVA by ~530 MVA.
In addition, the harmonic filters generally produce a total reactive power at an amount of 60% of the
rated DC power, which means:
11th harmonic filters = 2x52.5 MVAr
13th harmonic filters = 2x52.5 MVAr
24th harmonic filters = 2x52.5 MVAr
Therefore, the amount of safe power transfer which will avoid dynamical overvoltages (DOV) and
frequent commutation failures is found as:
≈ 469 MW
3.2.2.2. Reactive Power Requirement Calculation
As a result of the power quality simulation studies, it has been found out that transfer of 470 MW
from Georgia to Borcka seems possible for the pessimistic scenario in the sense of power quality
standards of the Turkish Grid Code, provided the compensation of at least two of the proposed 3x75
MVA synchronous condensers. However, static and dynamic analysis results should be taken into
account before giving any final decision.
3.2.2.3. Simulation Results
a) Harmonics Analysis
The transmission system operator is responsible from maintaining an acceptable sinusoidal wave
shape for the quality of supply. Any B2B converter is, similarly, a source of harmonic currents and
hence should be compensated adequately so as to maintain the power quality standards defined in
the Turkish Grid Code [3].
Similar to the case in the 4.2.2.2. section of this report, as the pessimistic scenario, 470 MW power
transfer from Georgia is analyzed in this section (i.e., Turkey is the inverter side). The time domain
simulation results of the B2B converter is illustrated in Figure 10. No clear distortion on the wave
shape at Borcka substation can be seen in this case.
The harmonic spectrum of the inverter current is illustrated in Figure 11. As can be readily seen in
Figure 11, the most dominant harmonic of the inverter current is the 11th harmonic. Therefore, the
harmonic filters should be tuned as mentioned in the 3.4. section of this report.

22 | 60
The harmonic spectrum of line current at the receiving end of the transmission line (i.e., Borcka
substation) is illustrated in Figure 12. It can be observed that the problematic harmonic components
are eliminated by analyzing Figure 10 and Figure 12 together.
The harmonic spectrum of voltage at Borcka substation is illustrated in Figure 13. The comparison of
the harmonic components of the voltage waveform illustrated in Figure 10 and Figure 13 are listed in
Table 8. It can be seen that all requirements of the grid code are satisfied with the topology
expressed in the third part of this study.
Figure 10: Time domain transient switching results of the B2B converter
1 1.01 1.02 1.03 1.04 1.05 1.06 1.07 1.08 1.09 1.1-1
-0.5
0
0.5
1Time Domain Transient Simulation Results
Vo
ltag
e
@ A
kh
alt
sik
he S
S
(pu
)
1 1.01 1.02 1.03 1.04 1.05 1.06 1.07 1.08 1.09 1.1-5
0
5
Invert
er
Cu
rren
t
(pu
)
1 1.01 1.02 1.03 1.04 1.05 1.06 1.07 1.08 1.09 1.1-1
-0.5
0
0.5
1
Vo
ltag
e
@ B
orc
ka S
S
(pu
)
1 1.01 1.02 1.03 1.04 1.05 1.06 1.07 1.08 1.09 1.1-4
-2
0
2
4
Time (sec)
Lin
e C
urr
en
t
(Filte
red
)
(pu
)

23 | 60
Figure 11: The harmonic spectrum of inverter current
Figure 12: The harmonic spectrum of the current at the receiving end (Borcka substation) of the transmission line
0 500 1000 1500 2000 2500 30000
0.5
1
1.5
2
2.5Amplitude Spectrum of Inverter Current
Frequency (Hz)
Am
plitu
de o
f C
urr
en
t
(pu
)
0 500 1000 1500 2000 2500 30000
0.2
0.4
0.6
0.8
1
1.2
1.4
1.6
1.8Amplitude Spectrum of Filtered Current
Frequency (Hz)
Am
plitu
de o
f C
urr
en
t
(pu
)

24 | 60
Figure 13: The harmonic spectrum of the voltage at Borcka substation
Table 8: The comparison of the voltage harmonics related to the B2B converter and the grid code requirements
Odd Harmonics (Non multiples of 3) Odd Harmonics (Multiples of 3) Even Harmonics
Harmonic
Number
Harmonic
Voltage (%)
Simulation
Results (%)
Harmonic
Number
Harmonic
Voltage (%)
Simulation
Results (%)
Harmonic
Number
Harmonic
Voltage (%)
Simulation
Results (%)
5
7
11
13
17
19
23
25
>25
1.25
1.0
0.7
0.7
0.4
0.4
0.4
0.4
0.2+0.2 (25/h)
0.1328
0.0263
0.0898
0.0341
0.0385
0.0286
0.0300
0.0297
OK
3
9
15
21
>21
1.0
0.4
0.2
0.2
0.2
0.1950
0.0609
0.0345
0.0240
OK
2
4
6
8
10
12
>12
0.75
0.6
0.4
0.4
0.4
0.2
0.2
0.7400
0.1750
0.0001
0.0462
0.2227
0.0576
OK
THD < % 2 OK
b) Voltage Dips and Swells Analysis, and Voltage Regulation for Converter Start up
Since the converter station is connected at a relatively weak transmission node, it has been
observed that with the operation of the converter station:
i) If the converter is not in service, by the compensation of the synchronous condensers,
the voltage at the 400 kV Akhaltsikshe substation terminal of the line can be maintained
within the permissible limits (which will most probably not cause a breakdown) despite
0 500 1000 1500 2000 2500 30000
0.2
0.4
0.6
0.8
1
1.2
1.4Amplitude Spectrum of Bus Voltage
Frequency (Hz)
Am
plitu
de o
f V
olt
ag
e
(pu
)

25 | 60
the capacitive effect of the harmonic filter blocks at nominal frequency and the long
transmission line, in case the unregulated voltage at Borcka substation tends to be
around 400 kV (i.e., Borcka HPP is not in operation).
ii) However, in order to minimize the risk of failures, while the converter is being put into
service (note that any switching operation should not cause a voltage dip larger than 2%
according to Turkish Grid Code),
o Coordination should be provided via the Turkish regional load dispatch center to
maintain rated voltage at Borcka substation.
o The inverter should be brought to its desired operating point (Note that as the
converter will increase its power, it will draw reactive power from the system,
hence it should be brought to its desired operating point progressively in
coordination with the RLDC).
In conclusion, voltage regulation by Borcka and/or Deriner HPPs might be necessary in order to
start up the converter.
c) Voltage Imbalance
Within the operation of the converter station, all three phases are expected to be loaded in a
balanced manner, in case no failures occur.
d) Flicker
Since the converter station is connected at a weak transmission node, depending on its controller
parameters and operating point, it might also cause additional flicker problems at Borcka SS.
Since the aforementioned phenomenon is a stochastic process, the exact value of the flicker
amplitude should be determined by measurements.
e) Interharmonics and Subharmonics
Since the converter station (a considerable size nonlinear load) is connected to the transmission
system, depending on its operating point (note that although the nominal frequency of the both
systems is 50 Hz, in practice, the frequencies of two systems at any instant will most probably be
different) and nature of future transmission customers connected at the PCC (i.e., Borcka SS), it
might cause problems related to interharmonics and/or subharmonics. Therefore, in the future,
special attention should be paid by the TSO, in case any industrial loads are to be connected at
Borcka SS.

26 | 60
3.3. Analysis for the Converter Station at Batumi 220 kV SS
3.3.1. Optimistic Scenario (in the sense of grid conditions in Turkey)
3.3.1.1. ESCR Calculation
The maximum value of SCMVA at Muratli SS is expected to be 1734 MVA when both hydraulic units
are in operation. This corresponds to SCMVA of 1172 MVA at the Batumi end of the line (35 km
double circuit overhead line).
The harmonic filters generally produce a total reactive power at an amount of 60% of the rated DC
power, which means:
11th harmonic filters = 52.5 MVAr
13th harmonic filters = 52.5 MVAr
24th harmonic filters = 52.5 MVAr
Shunt capacitor = 52.5 MVAr (power factor correction)
Therefore, the amount of safe power transfer which will avoid dynamical overvoltages (DOV) and
frequent commutation failures is found as:
= 385 MW
3.3.1.2. Reactive Power Requirement Calculation
As a result of the simulation studies for the optimistic scenario, it has been found out that transfer of 350 MW from Georgia to Muratli is possible, provided that the following compensation scheme as illustrated in Figure 14, is equipped.
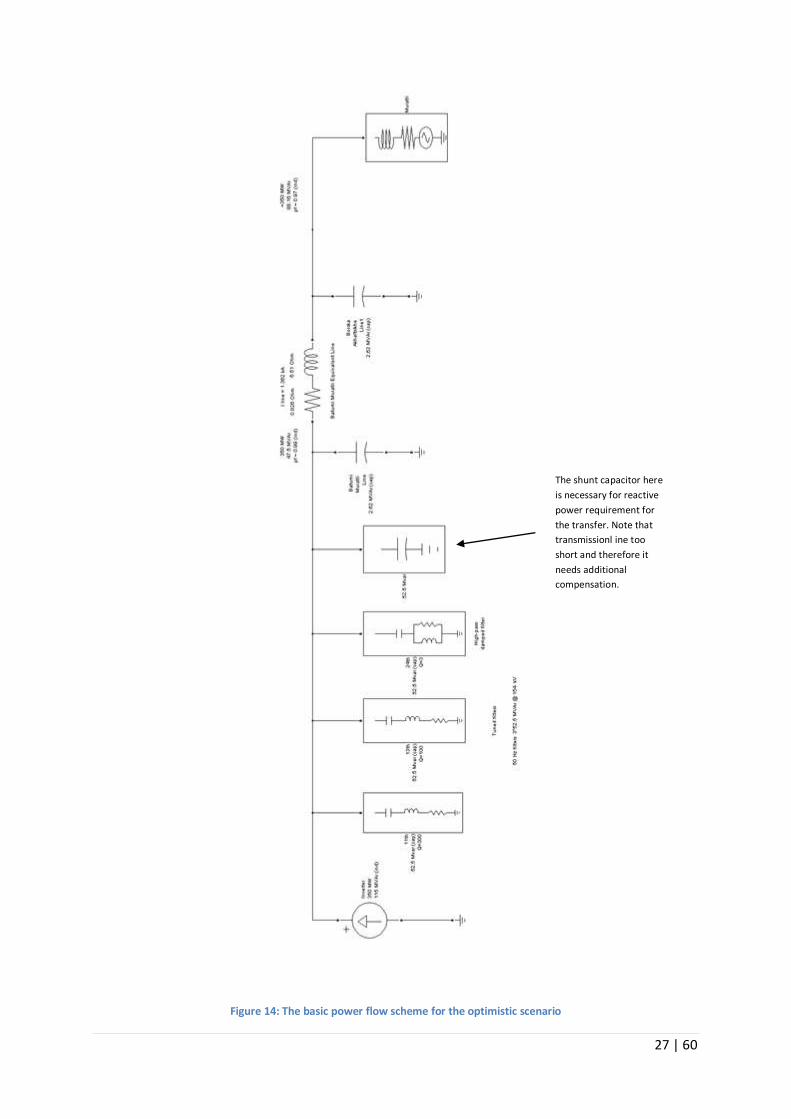
27 | 60
Figure 14: The basic power flow scheme for the optimistic scenario
The shunt capacitor here
is necessary for reactive
power requirement for
the transfer. Note that
transmissionl ine too
short and therefore it
needs additional
compensation.

28 | 60
3.3.1.3. Simulation Results
a) Harmonics Analysis
The transmission system operator is responsible from maintaining an acceptable sinusoidal wave
shape for the quality of supply. Any B2B converter is, similarly, a source of harmonic currents and
hence should be compensated adequately so as to maintain the power quality standards defined in
the Turkish Grid Code [3].
As the optimistic scenario, 350 MW power transfer from Georgia is analyzed in this section (i.e.,
Turkey is the inverter side). The time domain simulation results of the B2B converter is illustrated in
Figure 15. No clear distortion on the wave shape at Muratli substation can be seen in this case.
The harmonic spectrum of the inverter current is illustrated in Figure 16. As can be readily seen in
Figure 16, the most dominant harmonic of the inverter current is the 11th harmonic. Therefore, the
harmonic filters should be tuned as mentioned in the 4.5. section of this report.
The harmonic spectrum of line current at the receiving end of the transmission line (i.e., Muratli
substation) is illustrated in Figure 17. It can be observed that the problematic harmonic components
are eliminated by analyzing Figure 15 and Figure 17 together.
The harmonic spectrum of voltage at Muratli substation is illustrated in Figure 18. The comparison of
the harmonic components of the voltage waveform illustrated in Figure 15 and Figure 18 are listed in
Table 9. It can be seen that all requirements of the grid code are satisfied with the topology
expressed in the third part of this study.

29 | 60
Figure 15: Time domain transient switching results of the B2B converter
Figure 16: The harmonic spectrum of inverter current
1 1.01 1.02 1.03 1.04 1.05 1.06 1.07 1.08 1.09 1.1-1
-0.5
0
0.5
1Time Domain Transient Simulation Results
Vo
ltag
e
@ A
kh
alt
sik
he S
S
(pu
)
1 1.01 1.02 1.03 1.04 1.05 1.06 1.07 1.08 1.09 1.1-5
0
5
Invert
er
Cu
rren
t
(pu
)
1 1.01 1.02 1.03 1.04 1.05 1.06 1.07 1.08 1.09 1.1-1
-0.5
0
0.5
1
Vo
ltag
e
@ B
orc
ka S
S
(pu
)
1 1.01 1.02 1.03 1.04 1.05 1.06 1.07 1.08 1.09 1.1-4
-2
0
2
4
Time (sec)
Lin
e C
urr
en
t
(Filte
red
)
(pu
)
0 500 1000 1500 2000 2500 30000
0.5
1
1.5
2
2.5Amplitude Spectrum of Inverter Current
Frequency (Hz)
Am
plitu
de o
f C
urr
en
t
(pu
)

30 | 60
Figure 17: The harmonic spectrum of the current at the receiving end (Muratli substation) of the transmission line
Figure 18: The harmonic spectrum of the voltage at Muratli substation
0 500 1000 1500 2000 2500 30000
0.2
0.4
0.6
0.8
1
1.2
1.4
1.6
1.8
2Amplitude Spectrum of Filtered Current
Frequency (Hz)
Am
plitu
de o
f C
urr
en
t
(pu
)
0 500 1000 1500 2000 2500 30000
0.2
0.4
0.6
0.8
1
1.2
1.4Amplitude Spectrum of Bus Voltage
Frequency (Hz)
Am
plitu
de o
f V
olt
ag
e
(pu
)
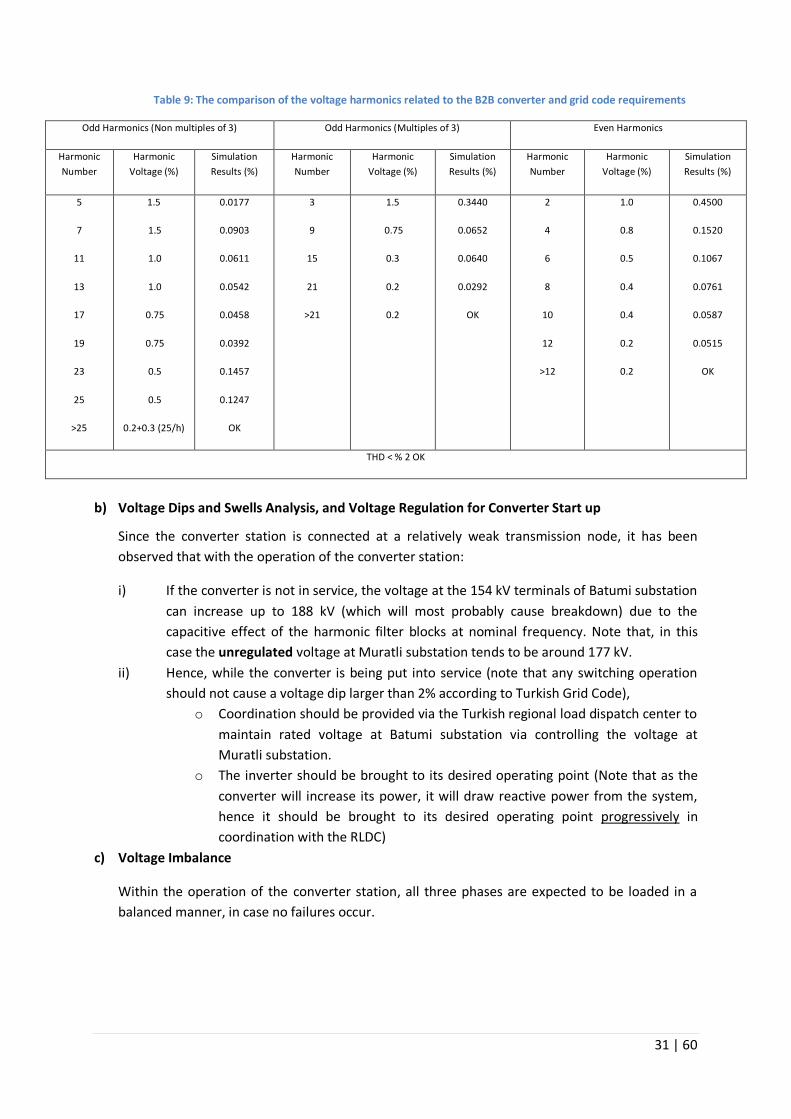
31 | 60
Table 9: The comparison of the voltage harmonics related to the B2B converter and grid code requirements
Odd Harmonics (Non multiples of 3) Odd Harmonics (Multiples of 3) Even Harmonics
Harmonic
Number
Harmonic
Voltage (%)
Simulation
Results (%)
Harmonic
Number
Harmonic
Voltage (%)
Simulation
Results (%)
Harmonic
Number
Harmonic
Voltage (%)
Simulation
Results (%)
5
7
11
13
17
19
23
25
>25
1.5
1.5
1.0
1.0
0.75
0.75
0.5
0.5
0.2+0.3 (25/h)
0.0177
0.0903
0.0611
0.0542
0.0458
0.0392
0.1457
0.1247
OK
3
9
15
21
>21
1.5
0.75
0.3
0.2
0.2
0.3440
0.0652
0.0640
0.0292
OK
2
4
6
8
10
12
>12
1.0
0.8
0.5
0.4
0.4
0.2
0.2
0.4500
0.1520
0.1067
0.0761
0.0587
0.0515
OK
THD < % 2 OK
b) Voltage Dips and Swells Analysis, and Voltage Regulation for Converter Start up
Since the converter station is connected at a relatively weak transmission node, it has been
observed that with the operation of the converter station:
i) If the converter is not in service, the voltage at the 154 kV terminals of Batumi substation
can increase up to 188 kV (which will most probably cause breakdown) due to the
capacitive effect of the harmonic filter blocks at nominal frequency. Note that, in this
case the unregulated voltage at Muratli substation tends to be around 177 kV.
ii) Hence, while the converter is being put into service (note that any switching operation
should not cause a voltage dip larger than 2% according to Turkish Grid Code),
o Coordination should be provided via the Turkish regional load dispatch center to
maintain rated voltage at Batumi substation via controlling the voltage at
Muratli substation.
o The inverter should be brought to its desired operating point (Note that as the
converter will increase its power, it will draw reactive power from the system,
hence it should be brought to its desired operating point progressively in
coordination with the RLDC)
c) Voltage Imbalance
Within the operation of the converter station, all three phases are expected to be loaded in a
balanced manner, in case no failures occur.

32 | 60
d) Flicker
Since the converter station is connected at a weak transmission node, depending on its controller
parameters and operating point, it might also cause additional flicker problems at Muratli SS.
Since the aforementioned phenomenon is a stochastic process, the exact value of the flicker
amplitude should be determined by measurements.
e) Interharmonics and Subharmonics
Since the converter station (a considerable size nonlinear load) is connected to the transmission
system, depending on its operating point (note that although the nominal frequency of the both
systems is 50 Hz, in practice, the frequencies of two systems at any instant will most probably be
different) and nature of future transmission customers connected at the PCC (i.e., Muratli SS), it
might cause problems related to interharmonics and/or subharmonics. Therefore, in the future,
special attention should be paid by the TSO, in case any industrial loads are to be connected at
Muratli SS.
3.3.2. Pessimistic Scenario (in the sense of grid conditions in Turkey)
3.3.2.1. ESCR Calculation
The minimum value of SCMVA at Muratli SS is expected to be 1147 MVA when both hydraulic units
are not in operation. This corresponds to SCMVA of 870 MVA at the Batumi end of the line (35 km
single circuit overhead line).
The harmonic filters generally produce a total reactive power at an amount of 60% of the rated DC
power, which means:
11th harmonic filters = 52.5 MVAr
13th harmonic filters = 52.5 MVAr
24th harmonic filters = 52.5 MVAr
Shunt capacitor = 52.5 MVAr (power factor correction)
Therefore, the amount of safe power transfer which will avoid dynamical overvoltages (DOV) and
frequent commutation failures is found as:
= 264 MW
However, in the simulation studies it has been found out that transfer of 350 MW is also possible
(Note that the safe limit is 264 MW<350 MW) with the reactive power compensation scheme
explained in the following section.

33 | 60
3.3.2.2. Reactive Power Requirement Calculation
As a result of the simulation studies for the optimistic case, it has been found out that transfer of 350 MW from Georgia to Muratli is possible, provided that the following compensation scheme as illustrated in Figure 19, is equipped.
Figure 19: The basic power flow scheme for the optimistic scenario
Filter ratings in the
pessimistic scenario is
same as the case in
optimistic scenario. The shunt capacitor here
is necessary for reactive
power requirement for
the transfer. Note that
transmissionl ine too
short and therefore it
needs additional
compensation.
34 | 60
3.3.2.3. Simulation Results
a) Harmonics Analysis
The transmission system operator is responsible from maintaining an acceptable sinusoidal wave
shape for the quality of supply. Any B2B converter is, similarly, a source of harmonic currents and
hence should be compensated adequately so as to maintain the power quality standards defined in
the Turkish Grid Code [3].
As the pessimistic scenario, 350 MW power transfer from Georgia is analyzed in this section (i.e., the
Turkey is the inverter side). The time domain simulation results of the B2B converter is illustrated in
Figure 20. No clear distortion on the wave shape at Muratli substation can be seen in this case.
The harmonic spectrum of the inverter current is illustrated in Figure 21. As can be readily seen in
Figure 21, the most dominant harmonic of the inverter current is the 11th harmonic. Therefore, the
harmonic filters should be tuned as mentioned in the 3.5. section of this report.
The harmonic spectrum of line current at the receiving end of the transmission line (i.e., Muratli
substation) is illustrated in Figure 22. It can be observed that the problematic harmonic components
are eliminated by analyzing Figure 20 and Figure 22 together.
The harmonic spectrum of voltage at Muratli substation is illustrated in Figure 23. The comparison of
the harmonic components of the voltage waveform illustrated in Figure 20 and Figure 23 are listed in
Table 10. It can be seen that all requirements of the grid code are satisfied with the topology
expressed in the third part of this study.

35 | 60
Figure 20: Time domain transient switching results of the B2B converter
Figure 21: The harmonic spectrum of inverter current
1 1.01 1.02 1.03 1.04 1.05 1.06 1.07 1.08 1.09 1.1-1
-0.5
0
0.5
1Time Domain Transient Simulation Results
Vo
ltag
e
@ A
kh
alt
sik
he S
S
(pu
)
1 1.01 1.02 1.03 1.04 1.05 1.06 1.07 1.08 1.09 1.1-5
0
5
Invert
er
Cu
rren
t
(pu
)
1 1.01 1.02 1.03 1.04 1.05 1.06 1.07 1.08 1.09 1.1-1
-0.5
0
0.5
1
Vo
ltag
e
@ B
orc
ka S
S
(pu
)
1 1.01 1.02 1.03 1.04 1.05 1.06 1.07 1.08 1.09 1.1-4
-2
0
2
4
Time (sec)
Lin
e C
urr
en
t
(Filte
red
)
(pu
)
0 500 1000 1500 2000 2500 30000
0.5
1
1.5
2
2.5Amplitude Spectrum of Inverter Current
Frequency (Hz)
Am
plitu
de o
f C
urr
en
t
(pu
)

36 | 60
Figure 22: The harmonic spectrum of the current at the receiving end (Muratli substation) of the transmission line
Figure 23: The harmonic spectrum of the voltage at Muratli substation
0 500 1000 1500 2000 2500 30000
0.2
0.4
0.6
0.8
1
1.2
1.4
1.6
1.8
2Amplitude Spectrum of Filtered Current
Frequency (Hz)
Am
plitu
de o
f C
urr
en
t
(pu
)
0 500 1000 1500 2000 2500 30000
0.2
0.4
0.6
0.8
1
1.2
1.4Amplitude Spectrum of Bus Voltage
Frequency (Hz)
Am
plitu
de o
f V
olt
ag
e
(pu
)

37 | 60
Table 10: The comparison of the voltage harmonics related to the B2B converter and grid code requirements
Odd Harmonics (Non multiples of 3) Odd Harmonics (Multiples of 3) Even Harmonics
Harmonic
Number
Harmonic
Voltage (%)
Simulation
Results (%)
Harmonic
Number
Harmonic
Voltage (%)
Simulation
Results (%)
Harmonic
Number
Harmonic
Voltage (%)
Simulation
Results (%)
5
7
11
13
17
19
23
25
>25
1.5
1.5
1.0
1.0
0.75
0.75
0.5
0.5
0.2+0.3 (25/h)
0.1643
0.0887
0.0543
0.0532
0.0616
0.0376
0.1385
0.1552
OK
3
9
15
21
>21
1.5
0.75
0.3
0.2
0.2
0.2741
0.0615
0.0197
0.0171
OK
2
4
6
8
10
12
>12
1.0
0.8
0.5
0.4
0.4
0.2
0.2
0.8604
0.1741
0.1023
0.0819
0.0642
0.0528
OK
b) Voltage Dips and Swells Analysis, and Voltage Regulation for Converter Start up
Since the converter station is connected at a relatively weak transmission node, it has been
observed that with the operation of the converter station:
i) If the converter is not in service, the voltage at the 154 kV terminals of Batumi substation
can increase up to 205 kV (which will most probably cause breakdown) due to the
capacitive effect of the harmonic filter blocks at nominal frequency. Note that, in this
case the unregulated voltage at Muratli substation tends to be around 192.5 kV.
ii) Hence, while the converter is being put into service (note that any switching operation
should not cause a voltage dip larger than 2% according to Turkish Grid Code),
o Coordination should be provided via the Turkish regional load dispatch center to
maintain rated voltage at Batumi substation via controlling the voltage at
Muratli substation.
o The inverter should be brought to its desired operating point (Note that as the
converter will increase its power, it will draw reactive power from the system,
hence it should be brought to its desired operating point progressively in
coordination with the RLDC)
c) Voltage Imbalance
Within the operation of the converter station, all three phases are expected to be loaded in a
balanced manner, in case no failures occur.
d) Flicker
Since the converter station is connected at a weak transmission node, depending on its controller
parameters and operating point, it might also cause additional flicker problems at Muratli SS.

38 | 60
Since the aforementioned phenomenon is a stochastic process, the exact value of the flicker
amplitude should be determined by measurements.
e) Interharmonics and Subharmonics
Since the converter station (a considerable size nonlinear load) is connected to the transmission
system, depending on its operating point (note that although the nominal frequency of the both
systems is 50 Hz, in practice, the frequencies of two systems at any instant will most probably be
different) and nature of future transmission customers connected at the PCC (i.e., Muratli SS), it
might cause problems related to interharmonics and/or subharmonics. Therefore, in the future,
special attention should be paid by the TSO, in case any industrial loads are to be connected at
Muratli SS.
4. Part 2: Security Analysis (Load Flows and Contingency Analysis)
4.1. SCMVA Calculation SCMVA calculation results regarding 2013, 2015 and 2017 scenarios are given in Appendix D.
4.2. Contingency Analysis The detailed simulation results of the corresponding scenarios are given in the Appendices.
According to Turkish Grid Code [9], the Turkish Electricity Transmission System is designed according
to the (n-1) criterion, which means that no element of the power system should be overloaded in
case of a single contingency. Within this scope, (n-1) security analyses are performed for the above
summarized scenarios (only for the Turkish Electricity Transmission System).
The important contingencies regarding the Georgia HVDC Interconnection are tabulated in the following tables, where the most important contingencies (regarding Georgia Interconnection) are classified with respect to the extent of their effect on electricity transmission system security and possible protective (and/or preventive) measures. The annotation of the classification of the tables is as given in the legend below.

39 | 60
4.2.1. 2013 Scenarios Legend
CS: Contingency Single
350 MW Import: Only one block of 2x350 MW Akhaltsikhe converter is in operation
700 MW Import: Two blocks of 2x350 MW Akhaltsikhe converter are in operation
1050 MW Import: Two blocks of 2x350 MW Akhaltsikhe converter and 350 MW Batumi converter are in operation
No problems related to Georgia Interconnection Minor redispatch problems related to Georgia Interconnection ( < 100 MW)
Major redispatch problems related to Georgia Interconnection ( > 100 MW) Unsecure
Table 11: Summary Results for 2013
2013 Expected Peak Load Conditions 2013 Expected Spring Load Conditions
350 MW Import
700 MW Import
1050 MW Import
350 MW Import
700 MW Import
1050 MW Import
N Case (Base Case, i.e., no outage) Appendix A-I BASE CASE
Appendix A-II BASE CASE
Appendix A-III BASE CASE
Appendix A-IV
BASE CASE
No Base Case (Unsecure)
No Base Case (Unsecure)
The Outage of Borcka-Deriner 380 kV Line
Appendix A-I
CS 514
Appendix A-II
CS 514
Appendix A-III
CS 514
Appendix A-IV
CS 527
The Outage of Deriner-Artvin 380 kV Line
Appendix A-I CS 577
Appendix A-II CS 577
Appendix A-III CS 577
Appendix A-IV
CS 597
The Outage of Y. Tortum-Erzurum 380 kV Line
Appendix A-I
CS 330
Appendix A-II
CS 330
Appendix A-III
CS 330
Appendix A-
IV CS 341
The Outage of Erzurum-Ozluce 380 kV Line
Appendix A-I CS 8
Appendix A-II CS 8
Appendix A-III CS 8
Appendix A-IV
CS 8
The Outage of Ozluce-Keban 380 kV Line
Appendix A-I CS 7
Appendix A-II CS 7
Appendix A-II CS 7
Appendix A-
IV CS 7
The Outage of Borcka-Kalkandere 380 kV Line
Appendix A-I CS 516
Appendix A-II CS 516
Appendix A-III CS 516
Appendix A-IV
CS 529
The Outage of Kalkandere-Tirebolu 380 kV Line
Appendix A-I CS 161
Appendix A-II CS 161
Appendix A-III CS 161
Appendix A-
IV CS 161
The Outage of Tirebolu-Borasco 380 kV Line
Appendix A-I CS 162
Appendix A-II CS 162
Appendix A-III CS 162
Appendix A-IV
CS 162
The Outage of Borasco-Kayabasi 380 kV Line
Appendix A-I CS 116
Appendix A-II CS 116
Appendix A-III CS 116
Appendix A-IV
CS 115
The Outage of Borasco-Carsamba 380 kV Line
Appendix A-I CS 192
Appendix A-II CS 192
Appendix A-III CS 192
Appendix A-IV
CS 193
The Outage of Carsamba-Kayabasi 380 kV Line
Appendix A-I CS 115
Appendix A-II CS 115
Appendix A-III CS 115
Appendix A-IV
CS 114
The Outage of Boyabat-Kursunlu 380 kV Line
Appendix A-I CS 93
Appendix A-II CS 93
Appendix A-III CS 93
Appendix A-IV
CS 92
The Outage of Borcka-Artvin Double Circuit 154 kV Line
Appendix A-I CS 519 & 520
Appendix A-II CS 519 & 520
Appendix A-III CS 519 & 520
Appendix A-IV
CS 532 & 533
The Outage of Muratli-Borcka Double Circuit 154 kV Line
Appendix A-I CS 509 & 510
Appendix A-II CS 509 & 510
Appendix A-III CS 509 & 510
Appendix A-IV
CS 521 & 522

40 | 60
4.2.2. 2015 Scenarios Legend
CS: Contingency Single
350 MW Import: Only one block of 2x350 MW Akhaltsikhe converter is in operation
700 MW Import: Two blocks of 2x350 MW Akhaltsikhe converter are in operation
1050 MW Import: Two blocks of 2x350 MW Akhaltsikhe converter and 350 MW Batumi converter are in operation
No problems related to Georgia Interconnection
Minor redispatch problems related to Georgia Interconnection ( < 100 MW) Major redispatch problems related to Georgia Interconnection ( > 100 MW)
Unsecure
Table 12: Summary Results for 2015
2015 Expected Summer Peak Load Conditions 2015 Expected Spring Load Conditions
350 MW Import
700 MW Import
1050 MW Import
350 MW Import
700 MW Import
1050 MW Import
N Case (Base Case, i.e., no outage) Appendix B-I
BASE CASE
Appendix B-II
BASE CASE
Appendix B-III
BASE CASE
Appendix B-IV
BASE CASE
Appendix B-V
BASE CASE
No Base Case
(Unsecure)
The Outage of Borcka-Deriner 380 kV Line
Appendix B-I CS 530
Appendix B-II CS 530
Appendix B-III CS 530
Appendix B-IV CS 552
Appendix B-V CS 552
The Outage of Deriner-Artvin 380 kV Line
Appendix B-I CS 595
Appendix B-II CS 595
Appendix B-III CS 595
Appendix B-IV CS 627
Appendix B-V CS 627
The Outage of Borçka-Ispir 380 kV Line
Appendix B-I CS 531
Appendix B-II CS 531
Appendix B-III CS 531
Appendix B-IV CS 554
Appendix B-V CS 554
The Outage of Y. Tortum-Erzurum 380 kV Line
Appendix B-I CS 340
Appendix B-II CS 340
Appendix B-III CS 340
Appendix B-IV CS 360
Appendix B-V CS 360
The Outage of Erzurum-Ozluce 380 kV Line
Appendix B-I CS 10
Appendix B-II CS 10
Appendix B-III CS 10
Appendix B-IV CS 10
Appendix B-V CS 10
The Outage of Erzurum-Agri 380 kV Line
Appendix B-I CS 343
Appendix B-II CS 343
Appendix B-III CS 343
Appendix B-IV CS 363
Appendix B-V CS 363
The Outage of Erzurum-Ispir 380 kV Line
Appendix B-I CS 341
Appendix B-II CS 341
Appendix B-III CS 341
Appendix B-IV CS 361
Appendix B-V CS 361
The Outage of Ozluce-Keban 380 kV Line
Appendix B-I CS 9
Appendix B-II CS 9
Appendix B-III CS 9
Appendix B-IV CS 9
Appendix B-V CS 9
The Outage of Borcka-Kalkandere 380 kV Line
Appendix B-I CS 532
Appendix B-II CS 532
Appendix B-III CS 532
Appendix B-IV CS 555
Appendix B-V CS 555
The Outage of Kalkandere-Tirebolu 380 kV Line
Appendix B-I
CS 166
Appendix B-II
CS 166
Appendix B-III
CS 166
Appendix B-IV
CS 168
Appendix B-V
CS 168
The Outage of Tirebolu-Ordu 380 kV Line
Appendix B-I CS 167
Appendix B-II CS 167
Appendix B-III CS 167
Appendix B-IV CS 169
Appendix B-V CS 169
The Outage of Ordu-Borasco 380 kV Line
Appendix B-I
CS 297
Appendix B-II
CS 297
Appendix B-III
CS 297
Appendix B-IV
CS 305
Appendix B-V
CS 305
The Outage of Borasco-Kayabasi 380 kV Line
Appendix B-I CS 118
Appendix B-II CS 118
Appendix B-III CS 118
Appendix B-IV CS 117
Appendix B-V CS 117
The Outage of Borasco-Carsamba 380 kV Line
Appendix B-I CS 197
Appendix B-II CS 197
Appendix B-III CS 197
Appendix B-IV CS 200
Appendix B-V CS 200
The Outage of Carsamba-Kayabasi 380 kV Line
Appendix B-I CS 191
Appendix B-II CS 191
Appendix B-III CS 191
Appendix B-IV CS 194
Appendix B-V CS 194
The Outage of Ordu-Resadiye 380 kV Line
Appendix B-I CS 135
Appendix B-II CS 135
Appendix B-III CS 135
Appendix B-IV CS 134
Appendix B-V CS 134
The Outage of Boyabat-Kursunlu 380 kV Line
Appendix B-I CS 95
Appendix B-II CS 95
Appendix B-III CS 95
Appendix B-IV CS 94
Appendix B-V CS 94
The Outage of Ispir-Bagistas 380 kV Line
Appendix B-I CS 5
Appendix B-II CS 5
Appendix B-III CS 5
Appendix B-IV CS 5
Appendix B-V CS 5
The Outage of Bagistas-Keban 380 kV Line
Appendix B-I CS 4
Appendix B-II CS 4
Appendix B-III CS 4
Appendix B-IV CS 4
Appendix B-V CS 4
The Outage of Borcka-Artvin Double Circuit 154 kV Line
Appendix B-I CS 535 & 536
Appendix B-II CS 535 & 536
Appendix B-III CS 535 & 536
Appendix B-IV CS 559 &560
Appendix B-V CS 559 &560
The Outage of Muratli-Borcka Double Circuit 154 kV Line
Appendix B-I CS 525 & 526
Appendix B-II C S 525 &
526
Appendix B-III C S 525 & 526
Appendix B-IV CS 546 & 547
Appendix B-V CS 546 & 547

41 | 60
4.2.3. 2017 Scenarios Legend
CS: Contingency Single
350 MW Import: Only one block of 2x350 MW Akhaltsikhe converter is in operation
700 MW Import: Two blocks of 2x350 MW Akhaltsikhe converter are in operation
1050 MW Import: Two blocks of 2x350 MW Akhaltsikhe converter and 350 MW Batumi converter are in operation
1400 MW Import: Three blocks of 3x350 MW Akhaltsikhe converter and 350 MW Batumi converter are in operation
No problems related to Georgia Interconnection
Minor redispatch problems related to Georgia Interconnection ( < 100 MW) Major redispatch problems related to Georgia Interconnection ( > 100 MW)
Unsecure

42 | 60
Table 13: Summary Results for 2017
2017 Expected Peak Load Conditions 2017 Expected Spring Load Conditions
350 MW Import
700 MW Import
1050 MW Import
1400 MW Import
350 MW Import
700 MW Import
1050 MW Import
1400 MW Import
N Case (Base Case, i.e., no outage) Appendix C-I BASE CASE
Appendix C-II BASE CASE
Appendix C-III BASE CASE
Appendix C-IV BASE CASE
Appendix C-V BASE CASE
Appendix C-VI BASE CASE
No Base Case (Unsecure)
No Base Case (Unsecure)
The Outage of Borcka-Deriner 380 kV Line Appendix C-I CS 535
Appendix C-II CS 535
Appendix C-III CS 535
Appendix C-IV CS 535
Appendix C-V CS 564
Appendix C-VI CS 563
The Outage of Deriner-Artvin 380 kV Line Appendix C-I CS 600
Appendix C-II CS 600
Appendix C-III CS 600
Appendix C-IV CS 600
Appendix C-V CS 637
Appendix C-VI CS 636
The Outage of Y. Tortum-Erzurum 380 kV Line Appendix C-I CS 344
Appendix C-II CS 344
Appendix C-III CS 344
Appendix C-IV CS 344
Appendix C-V CS 370
Appendix C-VI CS 370
The Outage of Erzurum-Ozluce 380 kV Line Appendix C-I
CS 11
Appendix C-II
CS 11
Appendix C-III
CS 11
Appendix C-I
CS 11
Appendix C-V
CS 11
Appendix C-VI
CS 11
The Outage of Erzurum-Agri 380 kV Line Appendix C-I CS 341
Appendix C-II CS 341
Appendix C-III CS 341
Appendix C-IV CS 341
Appendix C-V CS 373
Appendix C-VI CS 367
The Outage of Erzurum-Ispir380 kV Line Appendix C-I CS 345
Appendix C-II CS 345
Appendix C-III CS 345
Appendix C-IV CS 345
Appendix C-V CS 371
Appendix C-VI CS 367
The Outage of Ozluce-Keban 380 kV Line Appendix C-I CS 10
Appendix C-II CS 10
Appendix C-III CS 10
Appendix C-IV CS 10
Appendix C-V CS 10
Appendix C-VI CS 10
The Outage of Borcka-Kalkandere 380 kV Line Appendix C-I CS 537
Appendix C-II CS 537
Appendix C-III CS 537
Appendix C-IV CS 537
Appendix C-V CS 566
Appendix C-VI CS 565
The Outage of Kalkandere-Tirebolu 380 kV Line
Appendix C-I
CS 167
Appendix C-II
CS 167
Appendix C-III
CS 167
Appendix C-IV
CS 167
Appendix C-V
CS 169
Appendix C-VI
CS 169
The Outage of Tirebolu-Ordu 380 kV Line Appendix C-I CS 168
Appendix C-II CS 168
Appendix C-III CS 168
Appendix C-IV CS 168
Appendix C-V CS 170
Appendix C-VI CS 170
The Outage of Ordu-Borasco 380 kV Line Appendix C-I
CS 298
Appendix C-II
CS 298
Appendix C-III
CS 298
Appendix C-I
CS 298
Appendix C-V
CS 307
Appendix C-VI
CS 307
The Outage of Borasco-Kayabasi 380 kV Line Appendix C-I CS 119
Appendix C-II CS 119
Appendix C-III CS 119
Appendix C-IV CS 119
Appendix C-V CS 118
Appendix C-VI CS 118
The Outage of Borasco-Carsamba 380 kV Line Appendix C-I CS 198
Appendix C-II CS 198
Appendix C-III CS 198
Appendix C-IV CS 198
Appendix C-V CS 201
Appendix C-VI CS 201
The Outage of Carsamba-Kayabasi 380 kV Line Appendix C-I CS 192
Appendix C-II CS 192
Appendix C-III CS 192
Appendix C-IV CS 192
Appendix C-V CS 195
Appendix C-VI CS 195
The Outage of Ordu-Resadiye 380 kV Line Appendix C-I CS 136
Appendix C-II CS 136
Appendix C-III CS 136
Appendix C-IV CS 136
Appendix C-V CS 135
Appendix C-VI CS 135
The Outage of Boyabat-Kursunlu 380 kV Line Appendix C-I CS 96
Appendix C-II CS 96
Appendix C-III CS 96
Appendix C-IV CS 96
Appendix C-V CS 95
Appendix C-VI CS 95
The Outage of Ispir-Bagistas 380 kV Line Appendix C-I CS 6
Appendix C-II CS 6
Appendix C-III CS 6
Appendix C-IV CS 6
Appendix C-V CS 6
Appendix C-VI CS 6
The Outage of Ispir-Borçka 380 kV Line Appendix C-I CS 5
Appendix C-II CS 5
Appendix C-III CS 5
Appendix C-IV CS 5
Appendix C-V CS 5
Appendix C-Iı CS 5
The Outage of Borcka-Artvin Double Circuit 154 kV Line
Appendix C-I CS 540 & 541
Appendix C-II CS 540 & 541
Appendix C-III CS 540 & 541
Appendix C-IV CS 540 & 541
Appendix C-V CS 569&570
Appendix C-VI CS 569&570
The Outage of Muratli-Borcka Double Circuit 154 kV Line
Appendix C-I CS 530 & 531
Appendix C-II CS 530 & 531
Appendix C-III CS 530 & 531
Appendix C-IV CS 530 & 531
Appendix C-V CS 557&558
Appendix C-VI CS 557&558

43 | 60
5. Part 3: Short Term Voltage Stability Analysis
5.1. Analysis for the Converter Station at Akhaltsikhe 500 kV SS
5.1.1. Optimistic Scenario (in the sense of grid conditions in Turkey)
A 3 phase balanced temporary fault of 0.15 sec on the transmission line at a very close location to the
converter busbar with zero fault impedance is simulated, which essentially means full load rejection of the
converter. As can be observed from Figure 24, the B2B converter blocks are expected to recover after a
temporary fault of 0.15 sec, in case the relevant protection schemes in the literature (e.g. Voltage
Dependent Current Order Limiter, VDCOL) are utilized. The dynamic overvoltage observed (along ~0.05 sec,
with respect to the ground potential) in this case, which should be considered in the insulation coordination
studies are:
DOVAkhaltsikhe = 1.27 pu (508 kV)
DOVBorcka = 1.15 pu (460 kV)
Figure 24: Short term voltage stability simulation results – Optimistic Scenario
0.7 0.8 0.9 1 1.1 1.2 1.3 1.40
0.5
1
1.5Time Domain Transient Simulation Results
Vo
ltag
e
@ A
kh
alt
sik
he S
S
(pu
)
0.7 0.8 0.9 1 1.1 1.2 1.3 1.40.4
0.6
0.8
1
1.2
1.4
Vo
ltag
e
@ B
orc
ka S
S
(pu
)
0.7 0.8 0.9 1 1.1 1.2 1.3 1.4-2
0
2
4
6
8
Acti
ve P
ow
er
(pu
)
Time (sec)

44 | 60
5.1.2. Pessimistic Scenario (in the sense of grid conditions in Turkey)
A 3 phase balanced temporary fault of 0.15 sec on the transmission line at a very close location to the
converter busbar with zero fault impedance is simulated, which essentially means full load rejection of the
converter. As can be observed from Figure 25, the B2B converter blocks are expected to recover after a
temporary fault of 0.15 sec, in case the relevant protection schemes in the literature (e.g. Voltage
Dependent Current Order Limiter, VDCOL) are utilized. The dynamic overvoltage observed (along ~0.05 sec,
with respect to the ground potential) in this case, which should be considered in the insulation coordination
studies are:
DOVAkhaltsikhe = 1.37 pu (548 kV)
DOVBorcka = 1.25 pu (500 kV)
Figure 25: Short term voltage stability simulation results – Pessimistic Scenario
0.7 0.8 0.9 1 1.1 1.2 1.3 1.40
0.5
1
1.5Time Domain Transient Simulation Results
Vo
ltag
e
@ A
kh
alt
sik
he S
S
(pu
)
0.7 0.8 0.9 1 1.1 1.2 1.3 1.40
0.5
1
1.5
Vo
ltag
e
@ B
orc
ka S
S
(pu
)
0.7 0.8 0.9 1 1.1 1.2 1.3 1.4-4
-2
0
2
4
6
Acti
ve P
ow
er
(pu
)
Time (sec)

45 | 60
5.2. Analysis for the Converter Station at Batumi 220 kV SS
5.2.1. Optimistic Scenario (in the sense of grid conditions in Turkey)
A 3 phase balanced temporary fault of 0.15 sec on the transmission line at a very close location to the
converter busbar with zero fault impedance is simulated, which essentially means full load rejection of the
converter. As can be observed from Figure 26, the B2B converter blocks are expected to recover after a
temporary fault of 0.15 sec, in case the relevant protection schemes in the literature (e.g. Voltage
Dependent Current Order Limiter, VDCOL) are utilized. The dynamic overvoltage observed (along ~0.05 sec,
with respect to the ground potential) in this case, which should be considered in the insulation coordination
studies are:
DOVBatumi = 1.28 pu (197 kV)
DOVMuratli = 1.18 pu (182 kV)
Figure 26: Short term voltage stability simulation results – Optimistic Scenario
0.7 0.8 0.9 1 1.1 1.2 1.3 1.40
0.5
1
1.5Time Domain Transient Simulation Results
Vo
ltag
e
@ B
atu
mi S
S
(pu
)
0.7 0.8 0.9 1 1.1 1.2 1.3 1.40.2
0.4
0.6
0.8
1
1.2
Vo
ltag
e
@ M
ura
tli S
S
(pu
)
0.7 0.8 0.9 1 1.1 1.2 1.3 1.4-1
0
1
2
3
4
Acti
ve P
ow
er
(pu
)
Time (sec)

46 | 60
5.2.2. Pessimistic Scenario (in the sense of grid conditions in Turkey)
A 3 phase balanced temporary fault of 0.15 sec on the transmission line at a very close location to the
converter busbar with zero fault impedance is simulated, which essentially means full load rejection of the
converter. As can be observed from Figure 26, the B2B converter blocks are expected to recover after a
temporary fault of 0.15 sec, in case the relevant protection schemes in the literature (e.g. Voltage
Dependent Current Order Limiter, VDCOL) are utilized. The dynamic overvoltage observed (along ~0.05 sec,
with respect to the ground potential) in this case, which should be considered in the insulation coordination
studies are:
DOVBatumi = 1.35 pu (208 kV)
DOVMuratli = 1.25 pu (193 kV)
Figure 27: Short term voltage stability simulation results – Pessimistic Scenario
6. Special Protection Requirement
Regarding the analysis made for 2013, it has been observed that, any outage of particularly:
Yeni Tortum-Erzurum (at present Deriner-Erzurum) line
Borcka-Tirebolu line
has the possibility of causing insecure electricity transmission system conditions, by the year 2012, under the
circumstances when the HPPs in the region (the key ones are Borcka and Deriner HPPs) operate close to
0.7 0.8 0.9 1 1.1 1.2 1.3 1.40
0.5
1
1.5Time Domain Transient Simulation Results
Vo
ltag
e
@ B
atu
mi S
S
(pu
)
0.7 0.8 0.9 1 1.1 1.2 1.3 1.40
0.5
1
1.5
Vo
ltag
e
@ M
ura
tli S
S
(pu
)
0.7 0.8 0.9 1 1.1 1.2 1.3 1.4-2
0
2
4
Acti
ve P
ow
er
(pu
)
Time (sec)
47 | 60
their rated capacity together with the 700 MW import from Georgia. This can also be observed from the
contingency analysis result tables (Tables 11-13).
Therefore, against the risk of regional system collapse in the case of the above mentioned line outages,
equipment of a special protection scheme that coordinates the outages of the above two lines with
instantaneous tripping of Akhaltsikhe 400 kV transmission line (or fast reduction of power import from
Georgia and/or some units of Borcka-Deriner HPPs), when the loading on the other line will exceed a specific
threshold, is recommended.
The most suitable location for such a relay is proposed to be Borcka SS due to:
Ease of measurement and signal transmission (i.e., only some status signals from the protective
relays and the corresponding circuit breakers of the substations and loading level measurement
signals from the protective current transformers of the lines through Deriner-Erzurum route and
Borcka-Tirebolu route have to be carried via redundant communication channels (e.g., redundant
fiber optic connection, fiber optic and PLC, etc.))
Note: The “route” expression above refers to the substations and lines between the two substations.
Speed and reliability of protective action (i.e., when a trip signal is given to a circuit breaker the
communication channel in between the two stations and the electronic media in between inevitably
introduce some time delay. In addition, due to increased number of equipment, the reliability level
of the protective system decreases. Therefore, considering the fact that two of the candidates for
tripping (i.e., Borcka HPP and Borcka-Akhaltsikhe line) are located in Borcka SS, Borcka SS is
proposed to be the location for such a special protection relay.)
It should also be emphasized that, Table 11 together with the corresponding appendices, can be utilized as
the trip matrix for determining the specifications for such a relay. The technical specifications of such a
protection scheme should be analyzed in detail.
7. Conclusions
In this report, technical feasibility of the power import form Georgia to Turkey through HVDC B2B converter
stations in both Akhaltsikhe and Batumi substations are analyzed and the effects of different levels of power
import from Georgia to Turkey on the possible transmission bottlenecks in Turkish network and measures in
order to increase safe transfer amounts are investigated.
The conclusions made about the operation of the proposed converters regarding the secure operation of
the transmission system can be summarized as follows:
Back to Back Converter Station in Akhaltsikhe
2013 Scenario Results:
o For the converter station in Akhaltsikhe, in the simulation studies, it is observed that 700 MW
power transfer via the converter station is possible in the sense of power quality/converter
operational stability concerns. This level can be reached under the typical transmission system
conditions from the power quality point of view (i.e., high SCMVA) with the inclusion of the
synchronous condensers. The result is that, the most dominant harmonic, i.e., the 11th

48 | 60
harmonic, is very close to the operational limits specified in the Turkish Grid Code in this case
[3].
Note that, the above mentioned limit is 470 MW in the worst grid conditions (i.e., the worst (n-
1) condition, meaning lowest possible SCMVA). Given the calculated feasible operation band,
which is between 470-700 MW, each converter block should be equipped with its own
switchable filter blocks. This fact should be taken into account in design.
Back to Back Converter Station in Batumi (2x175 MW)
2013 Scenario Results:
o For the converter station in Batumi, the maximum safe power transfer limit, in order to avoid
dynamic overvoltages and frequent commutation failures, is calculated as ≈385 MW (already
greater than the prospective converter capacity), in the typical transmission system conditions.
Note that, this limit is 264 MW in the worst grid conditions in the sense of power
quality/converter operational stability concerns.
In the simulation studies, it has been observed that 350 MW power transfer via the converter
station is also possible in the worst transmission system conditions.
o Batumi B2B project is concluded to be premature, if it is to be scheduled for 2013 and
considered together with the 2x350 MW Akhaltsikhe converter, regarding the present
transmission bottleneck in the region (see 1050 MW power transfer cases in Table 11).
Transmission System Security
Even by a deductive approach, there are two basic transmission routes connecting the generation in the
region of interest to the load centers in Turkey, as illustrated in Figure 2. The total thermal capacity of
those two transmission paths is about ~3000 MW, whereas the generating capacity (installed capacity,
planned for 2013) in the region is around ~7500 MW. Therefore, extra transmission investments are
required in order to enable safe power transfer from the region.
Considering the transmission bottleneck in the region for the analyzed 2013 scenarios, the initial power
import capacity from Georgia to Turkey is recommended not to exceed 700 MW, even in the normal
transmission system conditions, with the presence of a special protection scheme that coordinates the
outages of Deriner-Erzurum or Borcka Tirebolu lines with fast power reduction of power import from
Georgia and/or the possibility of tripping of Akhaltsikhe 400 kV transmission line (and/or some units of
Borcka-Deriner HPPs), if necessary. Note that especially during spring season, according to the water
regime, when most of the hydroelectric power plants in the region are operational with high capacity
factor, the import capacity from Georgia should be determined by the dispatching department by
considering the most recent system topology and giving the priority to system security.
Depending on the electricity market conditions, redispatching might be necessary in this region as a
short term measure to resolve the transmission bottleneck (e.g., 2013 expected minimum load
conditions in Table 11) either via the day ahead market mechanism or the balancing and settlement
market mechanism.

49 | 60
According to the analyzed 2015 scenario, the effect of adding new transmission route to the region
(Ispir-Bağıştaş-Keban line) increases transmission capacity; nonetheless, total installed generating
capacity among the region also increases (especially for HPPs) which restricts import capacity during
spring season due to water regime. Therefore, to be on the safe side, special protection scheme must
also be considered in case of emergency system conditions. (see Table 12).
According to the analyzed 2017 scenario, the results are found to be similar with analysis made for 2015.
Addition of second transmission line to the Akhaltsikhe back to back station (Akhaltsikhe-Y.Tortum)
enables power import from Georgia up to 1400 MW, depending on the generation profile of the black
sea region. However, it should be noted that due to the generation capacity and profile in the region,
safe power transfer limits reduces especially in spring season.
Although it seems import capacity will increase in 2017, realization of the transmission (by TEIAS) and
generation (by the private sector) investments is going to determine the future of import capacity. As
2017 is still far beyond to evaluate generation scheme and capacity in the region, assumptions made on
2017 analysis may not be valid and import capacity can increase or decrease.
A possible way to increase the power transfer limits is to install new transmission lines from the region to
the load centers (such as Gaziantep, Kahramanmaras, Diyarbakir and Sanliurfa), which will both enable
wheeling possibility and increase the electricity trading capacity with the Southern neighbors (Syria and
Iraq). A planned transmission line in the Borcka-Ispir-Bagistas and Keban route as illustrated in Figure 28 will
serve such purposes. This option should also be evaluated in detail by technical feasibility analysis.
It should also be denoted here that the power export from Turkey to Georgia is another factor that solves
the transmission bottleneck in the region.
Figure 28: Borcka-Arkun-Ispir-Bagistas-Keban Electricity Transmission Route

50 | 60
8. Other Remarks
In the following stage of the project (i.e., design and commissioning phase), it is recommended to consider
the following issues together with the manufacturer
Inter-area oscillation mode: the superposed oscillation of active power transferred to Turkey (e.g.,
+/- 10 MW) antiphase with the low frequency inter area frequency oscillations, in case the amplitude
of the oscillations exceed a specific threshold (e.g., 15 or 20 mHz peak).
Interaction with the special protection schemes of Georgia and Turkey.
9. Sonuçlar (Conclusions in Turkish)
Bu çalışmada, Gürcistan ve Türkiye İletim Sistemleri arasında enerji ticaretini mümkün kılmak amacıyla,
Ahıska (2017 yılına kadar toplam 3x350 MW) ve Batum’da (2013 yılına kadar 2x175 MW) kurulması
hedeflenen, DC Back to Back teknolojisine dayalı çözümlerin (asenkron enterkonneksiyon), Türkiye İletim
Sistemi güvenliğine olan etkileri incelenmiştir. Yapılan simulasyon çalışmaları sonucunda iletim sistemi
güvenliği ve sistem işletimini ilgilendiren aşağıdaki sonuçlara ulaşılmıştır:
Ahıska Back to Back İstasyonu (3x350 MW)
2013 Yılı Sonuçları:
o Dinamik aşırı gerilim ve yarı iletken anahtarlama arızaları risklerini gözeterek, en iyi şebeke
şartlarında, güvenli azami çalışma gücü 700 MW olarak hesaplanmıştır. Bu değer en kötü iletim
sistemi şartlarında (Borçka-Deriner HESlerin devre harici olduğu üretim senaryosunda (n-1)
durumu) ≈470 MW’a kadar düşmektedir. Her iki durumda da Akhaltsikhe istasyonunun 400 kV
barasında 3x75 MVA kapasitesinde senkron kondensör bulunduğu varsayılmıştır. Simulasyon
çalışmalarında, güç kalitesi açısından, en iyi şebeke koşullarında 700 MW çalışma gücü mümkün
görünse de, bölgesel iletim şebekesinin zayıflığından ötürü, bahsedilen çalışma koşullarında,
Şebeke Yönetmeliği’nde [3] 380 kV iletim sistemi için müsade edilen güç kalitesi limitlerine çok
yaklaşılmıştır (Özellikle 11. harmonik için, bkz. Table 7). Pratikte bu çalışma koşullarının, 400 kV
Borçka barasındaki gerilim dalga şeklinde, Şebeke Yönetmeliği’nde müsade edilenden daha fazla
harmonik bozulma yaratma olasılığı bulunmaktadır. Bu durumun temel sebebi, bölgedeki iletim
altyapısının göreceli olarak güçsüz oluşudur.
Dolayısıyla filtre bloklarının 470-700 MW arası çalışma rejimi gözetilerek tasarlanmaları
önerilmektedir.
Batum Back to Back İstasyonu (2x175 MW)
2013 Yılı Sonuçları:
o Bu projenin, Ahıska’da 2013 yılında kurulması hedeflenen 2x350 MW konvertör ile birlikte
düşünüldüğü zaman, gerçekleşmesi için gerekli iletim sistemi koşullarının 2013 yılı için
olgunlaşmamış olacağı öngörülmektedir.
İletim Planlama Çalışmalarını İlgilendiren Konular
Tümdengelim yöntemiyle dahi görülebileceği üzere, bölgede bulunan ~7000 MW kurulu gücün
enterkonnekte sisteme aktarılabileceği, toplam termik kapasiteleri ~3000 MW olan iki adet ana iletim
koridoru bulunmaktadır. Gürcistan bağlantısı da göz önüne alındığında, söz konusu elektrik enerjisi

51 | 60
üretim potansiyelinin emniyetli bir şekilde enterkonnekte sisteme entegre edilebilmesi için ek iletim
yatırımlarına ihtiyaç olduğu görülmektedir.
Bölgede oluşacağı öngörülen iletim kısıtı risklerini gözeterek, en iyi şebeke şartlarında dahi, iki ülke
arasındaki ticaret kapasitesinin azami 700 MW ile başlatılması önerilmektedir. Bu durumda bile Erzurum-
Deriner veya Borçka Kalkandere 400 kV EİH’larının açmasının, detayları ayrıca analiz edilmesi gereken
özel koruma sistemi ile Borçka-Akhaltsikhe 400 kV EİH (ve/veya Borçka-Derine HESlerin bazı üniteleri ile)
ile koordine edilmesi önerilmektedir.
Piyasa koşullarına bağlı olarak, özellikle 2013-2014 yılları için, Doğu Karadeniz ve Erzurum bölgesinde
oluşabilecek iletim kısıtlarının önüne geçmek amacıyla (sistem güvenliği, kısa vadeli çözüm), MYTM
tarafından bazı durumlarda bölgedeki santrallerin ya da Gürcistan elektrik enerjisi ticareti programının
değiştirilmesinin (gün öncesi piyasası ya da dengeleme uzlaştırma piyasası aracılığıyla) gerekebileceği
öngörülmektedir. (örnek: beklenen 2013 minimum yük koşulları, bkz. Table 11)
2015 yılı için yapılan analizlerde, yapılması planlanan Borçka-İspir-Bağıştaş-Keban hatttının bölgedeki
iletim kapasitesini dolayısıyla Gürcistan’dan elektrik enerjisi alım kapasitesini artırdığı gözlenmiştir. Fakat,
bölgede artan hidroelektrik üretim kapasitesi göz önüne alındığında, özellikle bahar ayları için, elektrik
enerjisi ithalat kapasitesi, söz konusu dönem için en güncel iletim sistemi verisine dayanarak, iletim
sistemi güvenliği ön planda olacak şekilde hesaplanmalıdır.
2017 yılı için yapılan analizler ile 2015 yılı için yapılan analizler paralellik göstermektedir. Yapılan
analizerde, Ahıska-Y.Tortum arasında inşa edilmesi plananlanan ikinci iletim hattının, 1400 MW elektrik
ithalatına olanak sağlayabileceği görülmüştür. Ancak, diğer analizlere benzer şekilde, özellikle bahar
ayları için, elektrik enerjisi ithalat kapasitesi, söz konusu dönem için en güncel iletim sistemi verisine
dayanarak, iletim sistemi güvenliği ön planda olacak şekilde hesaplanmalıdır.
Her ne kadar analiz çalışmalarında elektrik enerjisi ithalat kapasitesi artsa da, hem özel sektör tarafından
üretim alanında, hem de TEİAŞ tarafından iletim sistemi alanında gerçekleştirilecek / ertelenecek /
gerçekleştirilmeyecek yatırımlara bağlı olarak, üretim profilinin değişebileceği ve bu durumun Gürcistan
ile elektrik enerjisi ticaretine kapasite artışı ya da kısıtı olarak yansıyabileceği göz önüne alınmalıdır.
İki ülke arasındaki elektrik ticaret kapasitesini arttırmanın bir yolu, bölgeden (Doğu Karadeniz) yük merkezleri
(Gaziantep, Kahramanmaraş, Diyarbakır, Şanlıurfa gibi) istikametlerinde iletim yatırımları gerçekleştirmektir.
Bu yatırımların, aynı zamanda hem ülkeler arası elektrik enerjisi geçiş güzergahı olma (“wheeling”) imkanı
doğuracakları hem de güney komşuları Suriye ve Irak ile elektrik enerjisi ticareti kapasitesini arttıracakları
öngörülmektedir. Borçka-Ispir-Bağıştaş ve Keban güzergahında yapılması planlanan EİH, bu kapsamda
kullanılabilecek seçeneklerden bir tanesidir (bkz. Figure 28).
10. References
[1] MoM in Ankara between Turkish and Georgian parties on 8-9.12.2010 [2] MoM in Tbilisi between Turkish and Georgian parties on 18.02.2011 [3] MoM in Ankara (workshop) between Turkish and Georgian parties on 19-20.04.2011 [4] C. Gencoglu, O. B. Tor, “Technical Feasibility Analysis for Georgia-Turkey HVDC Interconnection, Part I:
Power Quality and Short Term Voltage Stability Analysis,” TUBITAK UZAY Power Systems Department, Ankara, Turkey, Jan. 2009.

52 | 60
[5] C. Gencoglu, O. Tanidir, O. B. Tor, “Technical Feasibility Analysis for Georgia-Turkey HVDC Interconnection, Part II: Transmission System Security Analysis,” TUBITAK UZAY Power Systems Department, Ankara, Turkey, Feb. 2009.
[6] Siemens PTI eNewsletter Issue 103. Available:https://www.ptius.com/pti/company/eNewsletter/2009January/Generic_PSSE_HVDC_Dynamic_Simulation_Model.html. [Accessed Feb. 10, 2010].
[7] T. Gonen, Electric Power Transmission System Engineering: Analysis and Design, CRC Press. [8] Chan-Ki Kim, Vijay K. Sood, Gil-Soo Jang, Seong-Joo Lim, Seok-Jin Lee, HVDC Transmission: Power
Conversion Applications in Power Systems, Singapore: Wiley, 2009. [9] Turkey. Energy Market Regulatory Authority of Turkey. Elektrik Piyasası Şebeke Yönetmeliği, Ankara:
Energy Market Regulatory Authority of Turkey, 2003. Available: http://www.epdk.org.tr/documents/10157/2be5c128-9cd4-447f-a23f-8c87da44d238. [Accessed Jan. 16, 2010].

53 | 60
APPENDICES
SCMVA Calculation Results for 2013-2015-2017
SCMVA Analysis Tables
Table 14: SCMVA vs Scenario Table for 2013 (Borcka- Akhaltsikhe Connection Analysis)
Bus SCMVA Pdc capacity max Scenario Remarks Borcka 400 kV SS 7747 MVA*
926 MW
Summer
All transmission lines are in operation Akhaltsikhe 400 kV SS (border line side)
2473 MVA*
Borcka 400 kV SS 5897 MVA* 843 MW Borcka-Kalkandere line is out of service Akhaltsikhe 400 kV SS
(border line side) 2266 MVA*
Borcka 400 kV SS 6412 MVA* 868 MW Borcka-Deriner line is out of service Akhaltsikhe 400 kV SS
(border line side) 2329 MVA*
Borcka 400 kV SS 6793 MVA* 886 MW Borcka-Arkhun line is out of service Akhaltsikhe 400 kV SS
(border line side) 2374 MVA*
Borcka 400 kV SS 9063 MVA** 962 MW
Spring
All transmission lines are in operation Akhaltsikhe 400 kV SS (border line side)
2564 MVA**
Borcka 400 kV SS 7211 MVA** 897 MW Borcka-Kalkandere line is out of service Akhaltsikhe 400 kV SS
(border line side) 2401 MVA**
Borcka 400 kV SS 6931 MVA** 885 MW Borcka-Deriner line is out of service Akhaltsikhe 400 kV SS
(border line side) 2370 MVA**
Borcka 400 kV SS 8035 MVA** 928 MW Borcka-Arkhun line is out of service Akhaltsikhe 400 kV SS
(border line side) 2479 MVA**

54 | 60
Table 15: SCMVA vs Scenario Table for 2013 (Muratli-Batumi Connection Analysis)
Bus SCMVA Pdc capacity max Scenario Remarks
Muratli 154 kV SS 4005 MVA* 698 MW
Summer
All transmission lines are in operation Batumi 154 kV SS (border line side)
1956 MVA*
Muratli 154 kV SS 3943 MVA* 694 MW Borcka-Kalkandere line is out of service Batumi 154 kV SS
(border line side) 1946 MVA*
Muratli 154 kV SS 3957MVA* 694 MW Borcka-Deriner line is out of service Batumi 154 kV SS
(border line side) 1947 MVA*
Muratli 154 kV SS 3987 MVA* 697 MW Borcka-Arkhun line is out of service Batumi 154 kV SS
(border line side) 1954 MVA*
Muratli 154 kV SS 4099 MVA*** 700 MW
Spring
All transmission lines are in operation Batumi 154 kV SS (border line side)
1962 MVA***
Muratli 154 kV SS 3982 MVA*** 683 MW Borcka-Kalkandere line is out of service Batumi 154 kV SS
(border line side) 1918 MVA***
Muratli 154 kV SS 4023 MVA*** 693 MW Borcka-Deriner line is out of service Batumi 154 kV SS
(border line side) 1944 MVA***
Muratli 154 kV SS 4082 MVA*** 698 MW Borcka-Arkhun line is out of service Batumi 154 kV SS
(border line side) 1957 MVA***

55 | 60
Table 16: SCMVA vs Scenario Table for 2015 (Borcka- Akhaltsikhe Connection Analysis)
Bus SCMVA Pdc capacity max Scenario Remarks
Borcka 400 kV SS 8699 MVA*
950 MW
Summer
All transmission lines are in operation Akhaltsikhe 400 kV SS (border line side)
2525 MVA*
Borcka 400 kV SS 6759 MVA* 875 MW Borcka-Kalkandere line is out of service Akhaltsikhe 400 kV SS
(border line side) 2342 MVA*
Borcka 400 kV SS 7057 MVA* 900 MW Borcka-Deriner line is out of service Akhaltsikhe 400 kV SS
(border line side) 2401 MVA
*
Borcka 400 kV SS 7318 MVA* 900 MW Borcka-Arkhun line is out of service Akhaltsikhe 400 kV SS
(border line side) 2401 MVA*
Borcka 400 kV SS 10262 MVA**
1000 MW
Spring
All transmission lines are in operation Akhaltsikhe 400 kV SS (border line side)
2651 MVA**
Borcka 400 kV SS 8242 MVA**
940 MW Borcka-Kalkandere line is out of service Akhaltsikhe 400 kV SS (border line side)
2502 MVA**
Borcka 400 kV SS 7720 MVA**
915 MW Borcka-Deriner line is out of service Akhaltsikhe 400 kV SS (border line side)
2454 MVA**
Borcka 400 kV SS 8697 MVA**
955 MW Borcka-Arkhun line is out of service Akhaltsikhe 400 kV SS (border line side)
2540 MVA**

56 | 60
Table 17: SCMVA vs Scenario Table for 2015 (Muratli-Batumi Connection Analysis)
Bus SCMVA Pdc capacity max Scenario Remarks
Borcka 400 kV SS 4202 MVA*
714 MW
Summer
All transmission lines are in operation Akhaltsikhe 400 kV SS (border line side)
1997 MVA*
Borcka 400 kV SS 4158 MVA*
712 MW Borcka-Kalkandere line is out of service Akhaltsikhe 400 kV SS (border line side)
1990 MVA*
Borcka 400 kV SS 4154 MVA*
712 MW Borcka-Deriner line is out of service Akhaltsikhe 400 kV SS (border line side)
1990 MVA*
Borcka 400 kV SS 4168 MVA*
712 MW Borcka-Arkhun line is out of service Akhaltsikhe 400 kV SS (border line side)
1991 MVA*
Borcka 400 kV SS 4366 MVA***
724 MW
Spring
All transmission lines are in operation Akhaltsikhe 400 kV SS (border line side)
2020 MVA***
Borcka 400 kV SS 4299 MVA***
714 MW Borcka-Kalkandere line is out of service Akhaltsikhe 400 kV SS (border line side)
1997 MVA***
Borcka 400 kV SS 4293 MVA***
717 MW Borcka-Deriner line is out of service Akhaltsikhe 400 kV SS (border line side)
2004 MVA***
Borcka 400 kV SS 4337 MVA***
721 MW Borcka-Arkhun line is out of service Akhaltsikhe 400 kV SS (border line side)
2013 MVA***

57 | 60
Table 18: SCMVA vs Scenario Table for 2017 (Borcka- Akhaltsikhe Connection Analysis)
Bus SCMVA Pdc capacity max Scenario Remarks
Borcka 400 kV SS 9269 MVA*
1640 MW
Summer
All transmission lines are in operation Akhaltsikhe 400 kV SS (border line side)
4273 MVA*
Borcka 400 kV SS 7323 MVA*
1515 MW Borcka-Kalkandere line is out of service Akhaltsikhe 400 kV SS (border line side)
3948 MVA*
Borcka 400 kV SS 8003 MVA*
1635 MW Borcka-Arkhun line is out of service Akhaltsikhe 400 kV SS (border line side)
4248 MVA*
Borcka 400 kV SS 9103 MVA* 975 MW Akhaltsikhe-Y.Tortum line is out of service Akhaltsikhe 400 kV SS
(border line side) 2593 MVA*
Borcka 400 kV SS 10794 MVA**
1710 MW
Spring
All transmission lines are in operation Akhaltsikhe 400 kV SS (border line side)
4436 MVA**
Borcka 400 kV SS 8747 MVA**
1600 MW Borcka-Kalkandere line is out of service Akhaltsikhe 400 kV SS (border line side)
4158 MVA**
Borcka 400 kV SS 9376 MVA**
1700 MW Borcka-Arkhun line is out of service Akhaltsikhe 400 kV SS (border line side)
4413 MVA**
Borcka 400 kV SS 10572 MVA**
1000 MW Akhaltsikhe-Y.Tortum line is out of service Akhaltsikhe 400 kV SS (border line side)
2658 MVA**

58 | 60
Table 19: SCMVA vs Scenario Table for 2017 (Muratli-Batumi Connection Analysis)
Bus SCMVA Pdc capacity max Scenario Remarks
Borcka 400 kV SS 4246 MVA*
718 MW
Summer
All transmission lines are in operation Akhaltsikhe 400 kV SS (border line side)
2005 MVA*
Borcka 400 kV SS 4211 MVA*
717 MW Borcka-Kalkandere line is out of service Akhaltsikhe 400 kV SS (border line side)
1999 MVA*
Borcka 400 kV SS 4215 MVA*
717 MW Borcka-Arkhun line is out of service Akhaltsikhe 400 kV SS (border line side)
1998 MVA*
Borcka 400 kV SS 4255 MVA* 719 MW Akhaltsikhe-Y.Tortum line is out of service Akhaltsikhe 400 kV SS
(border line side) 2009 MVA*
Borcka 400 kV SS 4383 MVA***
722 MW
Spring
All transmission lines are in operation Akhaltsikhe 400 kV SS (border line side)
2017 MVA***
Borcka 400 kV SS 4296 MVA***
710 MW Borcka-Kalkandere line is out of service Akhaltsikhe 400 kV SS (border line side)
1984 MVA***
Borcka 400 kV SS 4362 MVA***
721 MW Borcka-Arkhun line is out of service Akhaltsikhe 400 kV SS (border line side)
2013 MVA***
Borcka 400 kV SS 4376 MVA***
721 MW Akhaltsikhe-Y.Tortum line is out of service Akhaltsikhe 400 kV SS (border line side)
2014 MVA***
* Condition in which calculations are made is 350MW import from Akhaltsikhe, 350MW import from Batumi, 225 MVar
synchronous condensers exists in Akhaltsikhe 400kV busbar.
** Condition in which calculations are made is 350MW import from Akhaltsikhe, 225 MVar synchronous condensers
exists in Akhaltsikhe 400kV busbar.
*** Condition in which calculations are made is 350MW import from Batumi, 225 MVar synchronous condensers exists in Akhaltsikhe 400kV busbar.

59 | 60
The following Appendices are not added to the report given their large size (300 pages). They
are available upon request.
APPENDIX A-I – 2013 Peak Load Scenario 350 MW Import from Georgia
Contingency Analysis Results
APPENDIX A-II – 2013 Peak Load Scenario 700 MW Import from Georgia
Contingency Analysis Results
APPENDIX A-III – 2013 Peak Load Scenario1050 MW Import from Georgia
Contingency Analysis Results
APPENDIX A-IV – 2013 Spring Load Scenario 350 MW Import from Georgia
Contingency Analysis Results
APPENDIX B-I – 2015 Peak Load Scenario 350 MW Import from Georgia
Contingency Analysis Results
APPENDIX B-II – 2015 Peak Load Scenario 700 MW Import from Georgia
Contingency Analysis Results
APPENDIX B-III – 2015 Peak Load Scenario 1050 MW Import from Georgia
Contingency Analysis Results
APPENDIX B-IV – 2015 Spring Load Scenario 350 MW Import from Georgia
Contingency Analysis Results
APPENDIX B-V – 2015 Spring Load Scenario 700 MW Import from Georgia
Contingency Analysis Results

60 | 60
APPENDIX C-I – 2017 Peak Load Scenario 350 MW Import from Georgia
Contingency Analysis Results
APPENDIX C-II – 2017 Peak Load Scenario 700 MW Import from Georgia
Contingency Analysis Results
APPENDIX C-III – 2017 Peak Load Scenario 1050 MW Import from Georgia
Contingency Analysis Results
APPENDIX C-IV – 2017 Peak Load Scenario 1400 MW Import from Georgia
Contingency Analysis Results
APPENDIX C-V – 2017 Spring Load Scenario 350 MW Import from Georgia
Contingency Analysis Results
APPENDIX C-VI – 2017 Spring Load Scenario 700 MW Import from Georgia
Contingency Analysis Results

ANNEX 3
Technical Feasibility Analysis of Power Export From Georgia and Azerbaijan to Turkey
Final Report, GSE.

Technical Feasibility Analysis of Power Export
From Georgia and Azerbaijan to Turkey
2013, 2015, 2017-1, 2017-2
(FINAL)
Akhaltsikhe- Borcka Connection through HVDC Back to Back Subtation at Akhaltsikhe (Georgia)
Batumi‐Muratli Connection through HVDC Back to Back Subtation
at Batumi (Georgia)

Introduction
This report mainly is focused on research power export capabilities from Georgia to Turkey and power transfer capabilities from Azerbaijan to Turkey through Georgia for 2013, 2015 and 2017 years. The report is provided by specialists of Georgian State Electrosystem (GSE). It’s prepared for meeting with specialists of TEIAS and TUBITAK UZAY, in Istanbul, to discuss power export/import feasibilities of Georgia/Turkey via Akhaltsikhe back to back substation.
For 2013 year, An asynchronous interconnection between Georgia and Turkey is planned to be established via a line commutated back to back (B2B) HVDC Substation located in the Akhaltsikhe region of Georgia. The second end of mentioned line will be tied with substation located in Borcka region of Turkey.
In order to provide power export from Georgia and Azerbaijan to Turkey in reliably manner, besides Akhaltsikhe substation, It’s considered to be built in Georgia new 500 kV substations Jvari and Marneuli, also internal 500 kV lines connecting Akhaltsikhe B2B with 500 kV substations Zestafoni and Marneuli and 500 kV lines between substations Ksani -Marneuli, Gardabani - Marneuli and Enguri – Jvari. Moreover, its considered the reinforcement of 220 kV power gird’s western part of Georgia (fig 1.1).
For 2015 year, will be in service another asynchronous interconnection between Georgia and Turkey. The connection will be provided by B2B substation, which will be located in Adjara region of Georgia, near Batumi. The second end of the tie line will be connected with substation located in Muratli region of Turkey.
In order to provide power export from Georgia and Azerbaijan to Turkey in reliably manner, after 2013 years reinforcements of Georgian system, it is planned to build 500 kV part in Tskaltubo substation, with 500 kV lines connecting with 500 kV substations Akhaltsikhe and Jvari. Moreover, existing 500 kV line Imereti between 500 kV substations Enguri and Zestafoni will be split, it will enter and exit from substation Tskaltubo 500 kV substation. New power plants also will start operation. (see the map on fig 1.2).
For 2017 year, it’s planned entrance in service of new power plants – Khudoni HPP, Namakhvani HPP Cascade and etc, with corresponding substations and OHLs connecting with system.

This report includes:
Steady state scenarios;
N-1 steady state analysis results;
N-1 dynamic simulation analysis results;
Switching analysis results, including N-1;
System emergency automatics.
Short Circuit Power calculation results;
For steady state, N-1 dynamic and static analysis, also for analysis of emergency automatic action had been used PSS/E software.
For switching analysis, including N-1 had been used Simplorer software.
Steady states and dynamic model includes:
Full 220, 330 and 500 kV power gird of systems of Georgia and Azerbaijan;
power gird with rated voltage 110 kV and lines, by witch generation units are connected with high voltage system;
Generation units with capacity 5 MVA and more.
For 2013, All above mentioned analysis were done for 8 basic characteristic steady state scenarios:
Winter Maximum;
Winter Minimum;
Spring Maximum;
Spring Minimum;
Summer Maximum;
Summer Minimum;
Autumn Maximum;
Autumn Minimum;

Dynamic simulation and analysis were provided for emergency outage of Each 500 kV OHL of Georgia and Azerbaijan, after faults with 0.1 sec duration. B2B blocking time 0.2 sec was considered.
Based on dynamic simulation analysis, it has been obtained dynamic limits and had been obtained “new” steady scenarios had been changed, so that after each internal 500 kV line and 500/220 kV autotransformer emergency outage, Georgian-Azerbaijan system stability is preserved. So, steady state scenarios, given bellow are tested on N-1 disturbance in static and dynamic simulations.
For 2015 and 2017, Based on appendices of “Minutes of Meeting on Electrical Interconnections with the joint working group of TEIASH(Turkey) and GSE / Energo-pro (Georgia), 18 February 2011, Tbilisi/GEORGIA”, all above mentioned analysis were done for 4 basic characteristic steady state scenarios:
Winter Maximum;
Spring Minimum;
Summer Maximum;
Autumn Minimum;
Dynamic simulation and analysis were provided for emergency outage of Each 500 kV OHL of Georgia, after faults with 0.1 sec duration. B2B blocking time 0.2 sec was considered.

Fig 1.1 Map of Georgian System for 2013

Fig 1.2 Map of Georgian System for 2015

Fig 1.3 Map of Georgian System for 2017

2. Steady state scenarios
2.1 Winter Maximum 2013
GENERATION = 1652 MW, LOAD = 1617 MW, IMPORT (AZ) = 348 MW, EXPORT (TR) = 350 MW
ONE B2B OF AKHALTSIKHE IS IN OPERATION Fig 2.1

2.2 Winter Minimum 2013
GENERATION = 1021 MW, LOAD = 952 MW, IMPORT (AZ) = 298 MW, EXPORT (TR) = 350 MW
ONE B2B OF AKHALTSIKHE IS IN OPERATION Fig 2.2

2.3 Spring Maximum 2013
GENERATION = 1543 MW, LOAD = 1549 MW, IMPORT (AZ) = 388 MW, EXPORT (TR) = 350 MW
ONE B2B OF AKHALTSIKHE IS IN OPERATION Fig 2.3

2.4 Spring Minimum 2013 GENERATION = 970 MW, LOAD = 778 MW, IMPORT (AZ) = 170 MW, EXPORT (TR) = 350 MW
ONE B2B OF AKHALTSIKHE IS IN OPERATION Fig 2.4

2.5 Summer Maximum 2013
GENERATION = 1340 MW, LOAD = 1100 MW, IMPORT (AZ) = 280 MW, EXPORT (TR) = 500 MW
TWO B2B OF AKHALTSIKHE ARE IN OPERATION Fig 2.5

2.6 Summer Minimum 2013
GENERATION = 1220 MW, LOAD = 780 MW, IMPORT (AZ) = 70 MW, EXPORT (TR) = 500 MW
TWO B2B OF AKHALTSIKHE ARE IN OPERATION Fig 2.6

2.7 Autumn Maximum 2013
GENERATION = 1460 MW, LOAD = 1410 MW, IMPORT (AZ) = 373 MW, EXPORT (TR) = 400 MW
TWO B2B OF AKHALTSIKHE ARE IN OPERATION Fig 2.7

2.8 Autumn Minimum 2013
GENERATION = 745 MW, LOAD = 742 MW, IMPORT (AZ) = 367 MW, EXPORT (TR) = 400 MW
TWO B2B OF AKHALTSIKHE ARE IN OPERATION Fig 2.8

2.9 Summer Maximum 2013– 1 (Retrieved by taking account of system automatics) GENERATION = 1340 MW, LOAD = 1100 MW,
IMPORT (AZ) = 490 MW, EXPORT (TR) = 700 MW
TWO B2B OF AKHALTSIKHE ARE IN OPERATION Fig 2.9

2.10 Summer Minimum 2013– 1 (Retrieved by taking account of system automatics) GENERATION = 1220 MW, LOAD = 780 MW,IMPORT (AZ) = 334 MW, EXPORT (TR) = 700 MW
TWO B2B OF AKHALTSIKHE ARE IN OPERATION Fig 2.10

2.11 Autumn Maximum 2013 – 1 (Retrieved by taking account of system automatics) GENERATION = 1790 MW, LOAD = 1410 MW,
IMPORT (AZ) = 373 MW, EXPORT (TR) = 700 MW
TWO B2B OF AKHALTSIKHE ARE IN OPERATION Fig 2.11

2.12 Autumn Minimum 2013– 1 (Retrieved by taking account of system automatics) GENERATION = 1075 MW, LOAD = 742 MW,
IMPORT (AZ) = 367 MW, EXPORT (TR) = 700 MW
TWO B2B OF AKHALTSIKHE ARE IN OPERATION Fig 2.12

2.13 Spring Min 2015 GENERATION = 1856 MW, LOAD = 950 MW,
IMPORT(AZ) = 115 MW, EXPORT (TR) = 1000 MW
[AKHALTSIKHE B2B = 700 MW, BATUMI B2B = 300 MW]
Fig 2.13

2.14 Summer max 2015
GENERATION = 2303 MW, LOAD = 1366 MW,
IMPORT(AZ) = 96 MW, EXPORT (TR) = 1000 MW
[AKHALTSIKHE B2B = 700 MW, BATUMI B2B = 300 MW]
Fig 2.14

2.15 Autumn – min 2015
GENERATION = 1534 MW, LOAD = 897 MW,
IMPORT(AZ) = 333 MW, EXPORT (TR) = 950 MW
[AKHALTSIKHE B2B = 700 MW, BATUMI B2B = 250 MW]
Fig 2.15

2.16 winter max 2015 GENERATION = 2242 MW, LOAD = 1731 MW,
IMPORT(AZ) = 531 MW, EXPORT (TR) = 1000 MW
[AKHALTSIKHE B2B = 700 MW, BATUMI B2B = 300 MW]
Fig 2.16

2.17 Spring Min 2017-1 GENERATION = 2280 MW, LOAD = 1012 MW,
IMPORT = 0 MW, EXPORT (TR) = 1050 MW[AKHALTSIKHE B2B = 700 MW, BATUMI B2B = 350 MW], EXPORT (AZ) = 187
MW
Fig 2.17

2.18 Summer max 2017-1 GENERATION = 2765 MW, LOAD = 1497 MW,
IMPORT = 0 MW, EXPORT (TR) = 1050 MW[AKHALTSIKHE B2B = 700 MW, BATUMI B2B = 350 MW], EXPORT (AZ) = 179
MW
Fig 2.18

2.19 Autumn – min 2017-1 GENERATION = 1802 MW, LOAD = 1028 MW,
IMPORT (AZ) = 302 MW, EXPORT (TR) = 1050 MW[AKHALTSIKHE B2B = 700 MW, BATUMI B2B = 350 MW]
fig 2.19

2.20 winter max 2017-1 GENERATION = 2452 MW, LOAD = 1920 MW,
IMPORT (AZ) = 562 MW, EXPORT (TR) = 1050 MW [AKHALTSIKHE B2B = 700 MW, BATUMI B2B = 350 MW]
Fig 2.20

2.21 Spring Min 2017-2 GENERATION = 2280 MW, LOAD = 1012 MW,
IMPORT (AZ) = 163 MW, EXPORT (TR) = 1400 MW[AKHALTSIKHE B2B = 1050 MW, BATUMI B2B = 350 MW]
Fig 2.21

2.22 Summer max 2017-2 GENERATION = 2765 MW, LOAD = 1497 MW,
IMPORT (AZ) = 173 MW, EXPORT (TR) = 1400 MW [AKHALTSIKHE B2B = 1050 MW, BATUMI B2B = 350 MW]
Fig 2.22

2.23 Autumn –min 2017-2 GENERATION = 2022 MW, LOAD = 1032 MW,
IMPORT (AZ) = 448 MW, EXPORT (TR) = 1400 MW [AKHALTSIKHE B2B = 1050 MW, BATUMI B2B = 350 MW]
fig 2.23

2.24 winter max 2017 GENERATION = 2739 MW, LOAD = 1920 MW,
IMPORT (AZ) = 633 MW, EXPORT (TR) = 1400 MW [AKHALTSIKHE B2B = 1050 MW, BATUMI B2B = 350 MW]
Fig 2.24

Table2.1. Steady state summary table, for 2013 year with taking in account the system automatic actions
WINTER MAX
GENERATION = 1652 MW
LOAD = 1617 MW
IMPORT (AZ) = 348 MW
EXPORT (TR) = 350 MW
ONE B2B IN AKHALTSIKHE
IS IN OPERATION
WINTER MIN
GENERATION = 1021 MW
LOAD = 952 MW
IMPORT (AZ) = 298 MW
EXPORT (TR) = 350 MW
ONE B2B IN AKHALTSIKHE
IS IN OPERATION
SPRING MAX
GENERATION = 1543 MW
LOAD = 1549 MW
IMPORT (AZ) = 388 MW
EXPORT (TR) = 350 MW
ONE B2B IN AKHALTSIKHE
IS IN OPERATION
SPRING MIN
GENERATION = 970 MW
LOAD = 778 MW
IMPORT (AZ) = 170 MW
EXPORT (TR) = 350 MW
ONE B2B IN AKHALTSIKHE
IS IN OPERATION
SUMMER MAX
GENERATION = 1340 MW
LOAD = 1100 MW
IMPORT (AZ) = 490 MW
EXPORT (TR) = 700 MW
TWO B2B IN AKHALTSIKHE
ARE IN OPERATION
SUMMER MIN
GENERATION = 1220 MW
LOAD = 780 MW
IMPORT (AZ) = 334 MW
EXPORT (TR) = 700 MW
TWO B2B IN AKHALTSIKHE
ARE IN OPERATION
AUTUMN MAX
GENERATION = 1790 MW
LOAD = 1410 MW
IMPORT (AZ) = 373 MW
EXPORT (TR) = 700 MW
TWO B2B IN AKHALTSIKHE
ARE IN OPERATION
AUTUMN MIN
GENERATION = 1075 MW
LOAD = 761 MW
IMPORT (AZ) = 403 MW
EXPORT (TR) = 700 MW
TWO B2B IN AKHALTSIKHE
ARE IN OPERATION

Table2.2 Steady state summary table, for 2015 year
SPRING MIN
GENERATION = 1856 MW, LOAD = 950 MW,
IMPORT(AZ) = 115 MW, EXPORT (TR) = 1000 MW
AKHALTSIKHE B2B = 700 MW,
BATUMI B2B = 300 MW
ENGURI GENERATION = 720 MW
SUMMER MAX
GENERATION = 2303 MW, LOAD = 1366 MW,
IMPORT(AZ) = 96 MW, EXPORT (TR) = 1000 MW
AKHALTSIKHE B2B = 700 MW,
BATUMI B2B = 300 MW,
ENGURI GENERATION = 622 MW
AUTUMN MIN
GENERATION = 1534 MW, LOAD = 897 MW,
IMPORT(AZ) = 333 MW, EXPORT (TR) = 950 MW
AKHALTSIKHE B2B = 700 MW,
BATUMI B2B = 250 MW,
ENGURI GENERATION = 125 MW
WINTER MAX
GENERATION = 2242 MW, LOAD = 1731 MW,
IMPORT(AZ) = 531 MW, EXPORT (TR) = 1000 MW
AKHALTSIKHE B2B = 700 MW,
BATUMI B2B = 300 MW,
ENGURI GENERATION = 700 MW

Table2.3 Steady state summary table, for 2017-1 year (1050 MW Export to TR)
SPRING MIN
GENERATION = 2280 MW, LOAD = 1012 MW,
IMPORT = 0 MW, EXPORT (TR) = 1050 MW, EXPORT (AZ)=187 MW
AKHALTSIKHE B2B = 700 MW, BATUMI B2B = 350 MW
ENGURI GENERATION = 600 MW, KHUDONI GENERATION = 300 MW
SUMMER MAX
GENERATION = 2765 MW, LOAD = 1497 MW,
IMPORT = 0 MW, EXPORT (TR) = 1050 MW, EXPORT (AZ)=179 MW
AKHALTSIKHE B2B = 700 MW, BATUMI B2B = 350 MW
ENGURI GENERATION = 910 MW, KHUDONI GENERATION = 390 MW
AUTUMN MIN
GENERATION = 1802 MW, LOAD = 1028 MW,
IMPORT (AZ) = 302 MW, EXPORT (TR) = 1050 MW,
AKHALTSIKHE B2B = 700 MW, BATUMI B2B = 350 MW
ENGURI GENERATION = 150 MW, KHUDONI GENERATION = 185 MW
WINTER MAX
GENERATION = 2452 MW, LOAD = 1920 MW,
IMPORT (AZ) = 562 MW, EXPORT (TR) = 1050 MW,
AKHALTSIKHE B2B = 700 MW, BATUMI B2B = 350 MW
ENGURI GENERATION = 625 MW, KHUDONI GENERATION = 50 MW

Table2.4 Steady state summary table, for 2017-2 year (1400 MW Export to TR)
SPRING MIN
GENERATION = 2280 MW, LOAD = 1012 MW
IMPORT (AZ) = 163 MW, EXPORT (TR) = 1400 MW
AKHALTSIKHE B2B = 1050 MW,
BATUMI B2B = 350 MW,
ENGURI GENERATION = 600 MW
SUMMER MAX
GENERATION = 2766 MW, LOAD = 1497 MW
IMPORT (AZ) = 173 MW, EXPORT (TR) = 1400 MW
AKHALTSIKHE B2B = 1050 MW,
BATUMI B2B = 350 MW,
ENGURI GENERATION = 910 MW
AUTUMN MIN
GENERATION = 2022 MW, LOAD = 1032 MW
IMPORT (AZ) = 448 MW, EXPORT (TR) = 1400 MW
AKHALTSIKHE B2B = 1050 MW,
BATUMI B2B = 350 MW,
ENGURI GENERATION = 150 MW
SUMMER MAX
GENERATION = 2739 MW, LOAD = 1920 MW
IMPORT (AZ) = 633 MW, EXPORT (TR) = 1400 MW
AKHALTSIKHE B2B = 1050 MW,
BATUMI B2B = 350 MW,
ENGURI GENERATION = 655 MW

3. N-1 Steady State Analysis
3.1 N-1 analysys for 2013 Year. This analyses was conducted for all 8 scenarios (Winter, Spring, Summer and Autumn Maximum and Minimum) considering outages of 500 kV internal lines and 500/220 kV autotransformers of Georgia and for 500 kV line connecting Azerbaijan (s/s Samukh) and Georgia (s/s Gardabani). Summary table is given bellow:
Table 3.1
Out of servise
Winter Spring Summer Autumn
max min max min max min max min
Enguri-Zestafoni
1-6
Enguri-Jvari
Zestafoni-Qsani
Zestafoni-Akhalcikhe
Qsani-Gardabani
Gardabani-Marneuli
Qsani-Marneuli
Marneuli-Akhalcikhe
Gardabani-Samukh 9-3
9-8
Samukh-AzTPP
AzTPP-Apsheron
AT-Enguri 12-1
12-3
AT-Zestafoni
AT-Qsani
AT-Jvari
AT-Gardabani

In this table light green color means that after N-1 outage all system parameters remain in normal ranges; orange color means that after corresponding N-1 outage, some system parameters are deviated from permitted ranges, but so that they may be improved by dispatch actions; red color means that system parameters have inadmissible values or after N-1 system does not converges.
(1-6) In Summer Minimum scenario, system operation without 500 kV OHL between substations Enguri and Zestafoni, forces overloading of its parallel 220 kV OHLs: Tskaltubo-Kutaisi (117%) and Kutaisi-Zestafoni, circuit 1 (127%);
(9-3) In Spring Maximum scenario, system operation without 500 kV OHL Samukh-Gardabani, forces overloading of its parallel line Agstafa-Gardabani (112%).
(9-8) In Autumn Minimum scenario, system operation without 500 kV OHL Samukh-Gardabani, forces overloading of its parallel line Agstafa-Gardabani (113%).
(12-1), (12-3) In Winter Maximum and Spring Maximum scenarios, system operation without 500/220 kV autotransformer of Enguri, forces voltage reduction in Abkhazia region.

3.2 N-1 Analysis for 2015 Year This analyses was conducted for all 4 scenarios (Winter and Summer Maximum, Spring and Autumn Minimum) considering system operation with out of service 500 kV OHLs of Georgia and Azerbaijan and 500/220 kV autotransformers of Georgia.
Table 3.2. N-1 steady state summary
Out of servise Winter Spring Summer Autumn
max min max min
Enguri-Tskhaltubo
Enguri-Jvari
Jvari-Tskhaltubo
Tskhaltubo-Zestafoni
Tskhaltubo-Akhaltsikhe
Zestafoni-Qsani
Zestafoni-Akhalcikhe
Qsani-Gardabani
Gardabani-Marneuli
Qsani-Marneuli
Marneuli-Akhalcikhe
Gardabani-Samukh 12-1
Samukh-AzTPP
AzTPP-Apsheron
AT-Enguri 15-1
AT-Zestafoni
AT-Tskhaltubo
AT-Qsani
AT-Jvari
AT-Gardabani
AT-Akhaltsikhe

In this table light green color means that after N-1 outage all system parameters remain in normal ranges; yellow color means that after corresponding N-1 operation, some system parameters are deviated from permitted ranges, but so that they may be improved by dispatch actions orange color means that system converges but the parameters deviation from normal is not permitable and requires intervention of automatics; red color means that system does not converges.
(12-1) In Winter Maximum scenario, operation without 500 kV OHL Mukhrani (Gardabani –Samukh) causes overloading of 330 kV line Gardabani (Gardabani-Agstafa): Load = 135 % and 330/220 kV transformer of Gardabani: Load = 135 %.
(15-1) In Winter Maximum scenario, system operation without 500/220 kV autotransformer of Enguri, causes voltage reduction in Abkhazia region.

3.3 N-1 Analysis for 2017-1 (1050 MW Export to TR) Year. This analyses was conducted for all 4 scenarios (Winter and Summer Maximum, Spring and Autumn Minimum) considering system operation with out of service 500 kV OHLs of Georgia and Azerbaijan and 500/220 kV autotransformers of Georgia.
Table 3.3. N-1 steady state summary
Out of servise Winter Spring Summer Autumn
max min max min
Enguri-Tskhaltubo
Enguri-Jvari
Jvari-Tskhaltubo
Tskhaltubo-Akhaltsikhe
Tskhaltubo-Zestafoni
Khudoni-Jvari
Zestafoni-Qsani
Zestafoni-Akhalcikhe
Qsani-Gardabani
Gardabani-Marneuli
Qsani-Marneuli
Marneuli-Akhalcikhe
Gardabani-Samukh 12-1
Samukh-AzTPP
AzTPP-Apsheron
AT-Enguri
AT-Zestafoni
AT-Qsani
AT-Jvari
AT-Gardabani
AT-Alhaltsikhe
AT-Marneuli
AT-Tskhaltubo
AT-Knudoni

In this table light green color means that after N-1 outage all system parameters remain in normal ranges; yellow color means that after corresponding N-1 operation, some system parameters are deviated from permitted ranges, but so that they may be improved by dispatch actions orange color means that system converges but the parameters deviation from normal is not permutable and requires intervention of automatics; red color means that system does not converges.
(12-1) In Winter Maximum scenario, operation without 500 kV OHL Mukhrani (Gardabani –Samukh) causes overloading of 330 kV line Gardabani (Gardabani-Agstafa): Load = 145 % and 330/220 kV transformer of Gardabani: Load = 146 %.

3.4 N-1 Analysis for 2017-1 (1400 MW Export to TR) Year. This analyses was conducted for all 4 scenarios (Winter and Summer Maximum, Spring and Autumn Minimum) considering system operation with out of service 500 kV OHLs of Georgia and Azerbaijan and 500/220 kV autotransformers of Georgia.
Table 3.4. N-1 steady state summary
Out of servise Winter Spring Summer Autumn
max min max min
Enguri-Tskhaltubo
Enguri-Jvari
Jvari-Tskhaltubo
Tskhaltubo-Akhaltsikhe
Tskhaltubo-Zestafoni
Khudoni-Jvari
Zestafoni-Qsani
Zestafoni-Akhalcikhe
Qsani-Gardabani
Gardabani-Marneuli
Qsani-Marneuli
Marneuli-Akhalcikhe
Gardabani-Samukh 12-1 12-4
Samukh-AzTPP
AzTPP-Apsheron
AT-Enguri
AT-Zestafoni
AT-Qsani
AT-Jvari
AT-Gardabani
AT-Alhaltsikhe
AT-Marneuli
AT-Tskhaltubo
AT-Knudoni

In this table light green color means that after N-1 outage all system parameters remain in normal ranges; yellow color means that after corresponding N-1 operation, some system parameters are deviated from permitted ranges, but so that they may be improved by dispatch actions orange color means that system converges but the parameters deviation from normal is not permutable and requires intervention of automatics; red color means that system does not converges.
(12-1) In Winter Maximum scenario, operation without 500 kV OHL Mukhrani (Gardabani –Samukh) causes overloading of 330 kV line Gardabani (Gardabani-Agstafa): Loading = 167 % and 330/220 kV transformer of Gardabani: Loading = 167 %.
(12-4) In Winter Maximum scenario, operation without 500 kV OHL Mukhrani (Gardabani –Samukh) causes overloading of 330 kV line Gardabani (Gardabani-Agstafa): Loading = 115 % and 330/220 kV transformer of Gardabani: Loading = 115 %.

4. N-1 Dynamic Analysis 4.1. N-1 Dynamic Analysis for 2013
For 2013 year, power systems of Azerbaijan and Georgia will be connected by two OHLs: Perspective 500 kV “Mukhrani” and Existing 330 kV “Gardabani”. Outage 330 kV OHL “Gardabani” does not force problems in N-1 disturbance cases and neither in dynamics. But outage of 500 kV line “Mukhrani” in some cases may force overloading of 330 kV OHL “Gardabani”. Hence, in case of outage of above mentioned 500 kV line between Azerbaijan and Georgia, system automatics have to trip loads and reactors in Georgia, so that not reduce power export to Turkey by transfer capability of “Gardabani”. By consideration of action of mentioned automatics, steady state scenarios of Georgia in Summer and Autumn had been changed (Fig 4.1-4.3).
System automatic actions summary in Georgia
WINTER MAX
NO ACTION IS RE
WINTER MIN
TRIPPING
REACTORS IN S/Ss
GARDABANI AND QSANI
SPRING MAX
TRIPPING
REACTORS IN S/Ss
GARDABANI AND QSANI
SPRING MIN
TRIPPING
REACTORS IN S/Ss
GARDABANI AND QSANI
SUMMER MAX
TRIPPING OF 180 MW LOAD
SUMMER MIN
TRIPPING
120 MW LOAD;
REACTORS IN S/S GARDABANI
AND S/S MARNEULI
AUTUMN MAX
TRIPPING
75 MW LOAD;
REACTORS IN S/Ss
GARDABANI, QSANI,
ZESTAFONI
AUTUMN MIN
TRIPPING
100 MW LOAD;
REACTORS IN S/Ss
GARDABANI, QSANI,
ZESTAFONI

Dynamic simulation results, for Summer and Autumn Maximal and Minimal scenarios
Fig 4.1. Load flow at OHL Gardabani 330 kV

Fig 4.2. Load flow at b2b of Akhaltsikhe
Fig 4.3. Frequency in Menji (Georgia)

4.2 N-1 dynamic analysis and emergency automatics For 2015
Dynamic simulation showed that, each internal 500 kV OHL and 500/220 kV
autotransformer outage, like N-1 static analysis, did not force system stability loss or any significant deviation of system parameters from normal. The exclusion was Gardabani – Akhaltsikhe 500 kV OHL, after emercgency outage of witch have to be performed tripping of reactors by system automatics, depending on given system scenario (see table 3).
For 2015 year, as well as for 2013, power systems of Azerbaijan and Georgia will be connected by two OHLs: Perspective 500 kV Mukhrani and Existing 330 kV Gardabani. Outage 330 kV OHL Gardabani does not force problems in N‐1 disturbance cases and neither in dynamics. The same is for Mukhrani outage, except Winter Maximum scenario. In this case, outage of Mukhrani have to be accompanied with tripping of about 225 MW loads in Georgian system (see table 3) by system automatics.
Emergency outage of 400 kV OHL between Akhaltsikhe and Borcka or Akhaltsikhhe B2B have to be accompanied with tripping of Generating units in Enguri HPP and/or Gardabani TPP with total loading approximately equal to pre disturbance power flow of mentioned 400 kV line, by system automatics (see table 3) .
Emergency outage Batumi B2B have to be accompanied with tripping of Generating units at Enguri HPP and/or Gardabani TPP with total loading approximately equal to pre disturbance power flow of mentioned B2B, by system automatics (see table 3).
Dynamic simulation results, for outages Akhaltsikhe-Borchka and Mukhrani OHLs are given on fig7-fig10.

4.2.1 Outage of OHL Akhaltsikhe – Borchkha.
Fig 4.4. Freqency in Menji 220 kV S/S (Georgia)
Fig 4.5. Voltage in Zestafoni 500 kV S/S (Georgia)

4.2.2 Outage of Mukhrani 500 kV line (Az-Ge)
Fig 4.6. Power Flow on Gardabani 330 kV OHL
Fig 4.7. Power Flow on Akhaltsikhe B2B

Table 4.2. Emergency automatics summary for 2015 year
SPRING MIN
EXPORT (TR) = 1000 MW
1.AKHALTSIKHE BORCHKA OHL
OUTAGE – 620 MW GENERATION
HAVE TO BE TRIPPED IN
ENGURI HPP BY SYSTEM
AUTOMATICS;
2.BATUMI B2B OUTAGE –
APPROX 300 MW GENERATION
HAVE TO BE TRIPPED IN
ENGURI HPP BY SYSTEM
AUTOMATICS;
SUMMER MAX
EXPORT (TR) = 1000 MW
1. AKHALTSIKHE BORCHKA OHL
OUTAGE – 720 MW GENERATION
HAVE TO BE TRIPPED IN
ENGURI HPP BY SYSTEM
AUTOMATICS;
2.BATUMI B2B OUTAGE –
APPROX 300 MW GENERATION
HAVE TO BE TRIPPED IN
ENGURI HPP BY SYSTEM
AUTOMATICS;
AUTUMN MIN
EXPORT (TR) = 950 MW
1. AKHALTSIKHE BORCHKA OHL
OUTAGE – 225 MW GENERATION
ON ENGURI AND 250 MW ON TPP
#9 AT GARDABANI HAVE TO BE
TRIPPED BY SYSTEM
AUTOMATICS;
2.BATUMI B2B OUTAGE –
APPROX 300 MW GENERATION
HAVE TO BE TRIPPED IN
ENGURI HPP BY SYSTEM
AUTOMATICS;
3.MARNEULI-AKHALTSIKHE OHL
OUTAGE – REACTORS HAVE TO
BE TRIPPED BY SYSTEM
AUTOMATICS IN GARDABANI AND
QSANI;
WINTER MAX
EXPORT (TR) = 1000 MW
1. AKHALTSIKHE BORCHKA OHL
OUTAGE – 720 MW GENERATION
HAVE TO BE TRIPPED IN
ENGURI HPP BY SYSTEM
AUTOMATICS;
2.BATUMI B2B OUTAGE –
APPROX 300 MW GENERATION
HAVE TO BE TRIPPED IN
ENGURI HPP BY SYSTEM
AUTOMATICS;
3.MARNEULI-AKHALTSIKHE OHL
OUTAGE – REACTORS HAVE TO
BE TRIPPED BY SYSTEM
AUTOMATICS IN GARDABANI;
4.MUKHRANI (GARDABANI-
SAMUKH) OHL OUTAGE – 225 MW
LOAD HEVE TO BE TRIPPED IN
GEORGIAN SYSTEM

4.3 N-1 dynamic analysis and emergency automatics for 2017-1 (1050 MW Export to TR) year
Dynamic simulation showed that, each internal 500 kV OHL and 500/220 kV autotransformer outage, like N-1 static analysis, did not force system stability loss or any significant deviation of system parameters from normal.
For 2017 year, as well as for 2013 and 2015, power systems of Azerbaijan and Georgia will be connected by two OHLs: Perspective 500 kV Mukhrani and Existing 330 kV Gardabani. Outage 330 kV OHL Gardabani does not force problems in N‐1 disturbance cases and neither in dynamics. The same is for Mukhrani outage, except Winter Maximum scenario. In this case, outage of Mukhrani have to be accompanied with tripping of about 300 MW loads in Georgian system (see table 3) by system automatics.
Emergency outage of 400 kV OHL between Akhaltsikhe and Borcka or Akhaltsikhhe B2B have to be accompanied with tripping of Generating units in Enguri HPP and/or Gardabani TPP with total loading approximately equal to half (because entering of big number of new power plants increases total inertia constant of united system) of pre disturbance power flow of mentioned 400 kV line, by system automatics (see table 3) .
Dynamic simulation results, for outages Akhaltsikhe-Borchka and Mukhrani OHLs are given on fig6-fig9.

4.3.1 Outage of OHL Akhaltsikhe – Borchkha.
Fig 4.8. Freqency in Menji 220 kV S/S (Georgia)
Fig 4.9. Voltage in Zestafoni 500 kV S/S (Georgia)

4.3.2 Outage of Mukhrani 500 kV line
Fig 4.10. Power Flow on Gardabani 330 kV OHL ( from AZ to GE)
Fig 4.11. Power Flow on Akhaltsikhe B2B

Table 4.3. Emergency automatics summary
SPRING MIN
EXPORT (TR) = 1050 MW
1.AKHALTSIKHE BORCHKA OHL
OUTAGE – GENERATION HAVE TO
BE TRIPPED IN ENGURI HPP BY
SYSTEM AUTOMATICS;
SUMMER MAX
EXPORT (TR) = 1050 MW
1. AKHALTSIKHE BORCHKA OHL
OUTAGE – GENERATION HAVE TO
BE TRIPPED IN ENGURI HPP BY
SYSTEM AUTOMATICS;
AUTUMN MIN
EXPORT (TR) = 1050 MW
1. AKHALTSIKHE BORCHKA OHL
OUTAGE – GENERATION ON
ENGURI HAVE TO BE TRIPPED
BY SYSTEM AUTOMATICS;
WINTER MAX
EXPORT (TR) = 1050 MW
1. AKHALTSIKHE BORCHKA OHL
OUTAGE – GENERATION HAVE TO
BE TRIPPED IN ENGURI HPP BY
SYSTEM AUTOMATICS;
2.MUKHRANI (GARDABANI-
SAMUKH) OHL OUTAGE – 300 MW
LOAD HEVE TO BE TRIPPED IN
GEORGIAN SYSTEM

4.4 N-1 dynamic analysis and emergency automatics For 2017-2 (1400 MW Export to TR)
Dynamic simulation showed that, each internal 500 kV OHL and 500/220 kV
autotransformer outage, like N-1 static analysis, did not force system stability loss or any significant deviation of system parameters from normal.
For 2017 year, as well as for 2013 and 2015, power systems of Azerbaijan and Georgia will be connected by two OHLs: Perspective 500 kV Mukhrani and Existing 330 kV Gardabani. Outage 330 kV OHL Gardabani does not force problems in N‐1 disturbance cases and neither in dynamics. The same is for Mukhrani outage, except Winter Maximum And Autumn Minimum scenarios. In this cases, outage of Mukhrani have to be accompanied with tripping of about 300 MW loads in Georgian system (see table 3) by system automatics.
Emergency outage of 400 kV OHL between Akhaltsikhe and Borcka or Akhaltsikhhe B2B have to be accompanied with tripping of Generating units in Enguri HPP and/or Gardabani TPP with total loading approximately equal to half (because entering of big number of new power plants increases total inertia constant of united system) of pre disturbance power flow of mentioned 400 kV line, by system automatics (see table 3) .
Dynamic simulation results, for outages Akhaltsikhe-Borchka and Mukhrani OHLs are given on fig6-fig9.

4.4.1 Outage of OHL Akhaltsikhe – Borchkha.
Fig 4.12. Freqency in Menji 220 kV S/S (Georgia)
Fig 4.13. Voltage in Zestafoni 500 kV S/S (Georgia) 4.4.2 Outage of Mukhrani 500 kV line

Fig 4.14. Power Flow on Gardabani 330 kV OHL ( from AZ to GE)
Fig 4.15. Power Flow on Akhaltsikhe B2B

Table 4.4. Emergency automatics summary
SPRING MIN
EXPORT (TR) = 1400 MW
1.AKHALTSIKHE BORCHKA OHL
OUTAGE – NO AUTOMATIC NEEDS
SUMMER MAX
EXPORT (TR) = 1400 MW
1. AKHALTSIKHE BORCHKA OHL
OUTAGE – NO AUTOMATIC NEEDS
AUTUMN MIN
EXPORT (TR) = 1400 MW
1. AKHALTSIKHE BORCHKA
OHL OUTAGE –
GENERATION ON ENGURI
HAVE TO BE TRIPPED BY
SYSTEM AUTOMATICS;
2. MUKHRANI OHL OUTAGE - LOADS IN GEORGIA HAVE TO
BE TRIPPED
WINTER MAX
EXPORT (TR) = 1400 MW
1. AKHALTSIKHE BORCHKA
OHL OUTAGE –
GENERATION ON ENGURI
HAVE TO BE TRIPPED BY
SYSTEM AUTOMATICS;
2. MUKHRANI OHL OUTAGE - LOADS IN GEORGIA HAVE TO
BE TRIPPED


5 Switching analysis results, including N-1 5.1 Switching analysis for 2015
Harmonic analysis had been carried out for two cases. First is the summer max
scenario when the export from Georgia to Turkey by b2b station is 500MW. Second one is for n-1 analysis , when happens outage of 500 kV line “Zestafoni – Akhaltsikhe”. Simulations are realized with and without AC filters. Simulated parameters aren’t very exact, because at this moment we don’t have precise data of b2b station. We are waiting for Siemens, in the nearest future they should give us essential information for simulations.
Power flow in B2B ---- 500 MW
AKHALTSIKHE 500
without AC filters
with AC filters
100.00 110.00 120.00 130.00 140.00 150.00Time [ms]
-500.00
-250.00
0.00
250.00
500.00
AK
HA
LT
SIK
HE
.V [kV
]
0.00 0.25 0.50 0.75 1.00 1.25 1.50 1.75Spectrum [kHz]
0.00
50.00
100.00
150.00
200.00
250.00
300.00
350.00
400.00
450.00
500.00
ma
g(A
KH
AL
TS
IKH
E.V
) [k
V]
H1
H5 H11 H13 H17 H19
Name X Y
H1 0.0500 421.2871
H5 0.2500 6.4888
H11 0.5500 8.8718
H13 0.6500 8.4010
H17 0.8500 0.0000
H19 0.9500 0.0000
100.00 110.00 120.00 130.00 140.00 150.00Time [ms]
-500.00
-250.00
0.00
250.00
500.00
AK
HA
LT
SIK
HE
.V [kV
]
0.00 0.25 0.50 0.75 1.00 1.25 1.50 1.75Spectrum [kHz]
0.00
50.00
100.00
150.00
200.00
250.00
300.00
350.00
400.00
450.00
500.00
ma
g(A
KH
AL
TS
IKH
E.V
) [k
V]
H1
H5 H11 H13 H17 H19H7
Name X Y
H1 0.0500 412.7431
H5 0.2500 0.0000
H11 0.5500 0.0000
H13 0.6500 0.0000
H17 0.8500 0.0000
H19 0.9500 0.0000
H7 0.3500 5.3481
THD=3.28%
THD=1.29%

ZESTAFONI 500
without AC filters
with AC filters
100.00 110.00 120.00 130.00 140.00 150.00Time [ms]
-500.00
-250.00
0.00
250.00
500.00
Ze
sta
fon
i.V
[kV
]
0.00 0.25 0.50 0.75 1.00 1.25 1.50 1.75Spectrum [kHz]
0.00
50.00
100.00
150.00
200.00
250.00
300.00
350.00
400.00
450.00
500.00
ma
g(Z
esta
fon
i.V
) [k
V]
H1
H5H11 H13
H17 H19
Name X Y
H1 0.0500 405.1439
H5 0.2500 0.0000
H11 0.5500 13.9283
H13 0.6500 8.8438
H17 0.8500 0.0000
H19 0.9500 0.0000
100.00 110.00 120.00 130.00 140.00 150.00Time [ms]
-500.00
-250.00
0.00
250.00
500.00
Ze
sta
fon
i.V
[kV
]
0.00 0.25 0.50 0.75 1.00 1.25 1.50 1.75Spectrum [kHz]
0.00
50.00
100.00
150.00
200.00
250.00
300.00
350.00
400.00
450.00
500.00
ma
g(Z
esta
fon
i.V
) [k
V]
H1
H5 H11 H13 H17 H19H7
Name X Y
H1 0.0500 411.1206
H5 0.2500 0.0000
H11 0.5500 0.0000
H13 0.6500 6.3326
H17 0.8500 0.0000
H19 0.9500 0.0000
H7 0.3500 5.6253
THD=4.07%
THD=1.54%

N-1, outage of “Zestafoni -Akhaltsikhe”,
AKHALTSIKHE 500
without AC filters
with AC filters
100.00 110.00 120.00 130.00 140.00 150.00Time [ms]
-500.00
-250.00
0.00
250.00
500.00
AK
HA
LT
SIK
HE
.V [kV
]
0.00 0.25 0.50 0.75 1.00 1.25 1.50 1.75Spectrum [kHz]
0.00
50.00
100.00
150.00
200.00
250.00
300.00
350.00
400.00
450.00
ma
g(A
KH
AL
TS
IKH
E.V
) [k
V]
H1
H5 H11 H13
Name X Y
H1 0.0500 417.1358
H5 0.2500 13.9433
H11 0.5500 10.1781
H13 0.6500 11.9481
100.00 110.00 120.00 130.00 140.00 150.00Time [ms]
-500.00
-250.00
0.00
250.00
500.00
AK
HA
LT
SIK
HE
.V [kV
]
0.00 0.25 0.50 0.75 1.00 1.25 1.50 1.75Spectrum [kHz]
0.00
50.00
100.00
150.00
200.00
250.00
300.00
350.00
400.00
450.00
500.00
ma
g(A
KH
AL
TS
IKH
E.V
) [k
V]
H1
H5 H11 H13 H17 H19
Name X Y
H1 0.0500 425.5612
H5 0.2500 0.0000
H11 0.5500 0.0000
H13 0.6500 0.0000
H17 0.8500 5.8587
H19 0.9500 4.5941
THD=5.03%
THD=1.75%

ZESTAFONI 500
without AC filters
with AC filters
As seems form simulation results, at some busburs without ac filters, harmonic contents exceeds of desirable value, but after filters installation even in the worst case, when 500 kV line is out of service, THD reduces to permissible value. The max value of THD is in Akhaltsikhe and it is 1.75%. So, approximate harmonic analysis shows that everything is ok.
100.00 110.00 120.00 130.00 140.00 150.00Time [ms]
-500.00
-250.00
0.00
250.00
500.00
Ze
sta
fon
i.V
[kV
]
100.00 110.00 120.00 130.00 140.00 150.00Time [ms]
-500.00
-250.00
0.00
250.00
500.00
Ze
sta
fon
i.V
[kV
]
0.00 0.25 0.50 0.75 1.00 1.25 1.50 1.75Spectrum [kHz]
0.00
50.00
100.00
150.00
200.00
250.00
300.00
350.00
400.00
450.00
500.00
ma
g(Z
est
afo
ni.V
) [k
V]
H1
H5 H11 H13 H17 H19
Name X Y
H1 0.0500 428.2606
H5 0.2500 6.1537
H11 0.5500 0.0000
H13 0.6500 0.0000
H17 0.8500 0.0000
H19 0.9500 0.0000
0.00 0.25 0.50 0.75 1.00 1.25 1.50 1.75Spectrum [kHz]
0.00
50.00
100.00
150.00
200.00
250.00
300.00
350.00
400.00
450.00
ma
g(Z
esta
fon
i.V
) [k
V]
H1
H11 H13
H5
Name X Y
H1 0.0500 421.6428
H5 0.2500 21.4809
H11 0.5500 0.0000
H13 0.6500 0.0000
THD=5.09%
THD=1.44%

5.2 Switching analysis for 2015
Harmonic analysis had been carried out for Akhaltsikhe 500 and Batumi 220 busburs for two cases: with and without AC filters.
Fig 5.1. Simulated part of Georgian system in “Simplorer” software


5.2.1 Batumi 220 kV (300 MW Export to TR via Batumi B2B)
Calculations are considering that 220 kV OHL connecting substations Batumi and Menji is out of service. Results are shown on the following pictures:
without AC filters
with AC filters
without AC filters the THD factot
At Batumi 220 busbur is 8.51% , and with ac filters it reduces to 2.78% , p range of the THD in our power grid is below 3 %, so it has permitted value .
100.00 110.00 120.00 130.00 140.00 150.00Time [ms]
-400.00
-200.00
0.00
200.00
400.00
ba
tum
i22
0.V
[kV
]
THD=8.51%
100.00 110.00 120.00 130.00 140.00 150.00Time [ms]
-400.00
-200.00
0.00
200.00
400.00
ba
tum
i22
0.V
[kV
]
THD=2.78%

5.2.2 Akhaltsikhe 500 kV (700 MW Export to TR via Batumi B2B)
Calculations are considering that 500 kV OHL connecting substations Tskaltubo and Akhaltsikhe is in and out of service. Results are shown on the following figures:
without AC filters with AC filters
N-1
without AC filters with AC filters
At Akhaltsikhe 500 kV busbars in normal and N-1 conditions without filters, THD = 3.98 % and 4.35 % respectively. In case of installed filters in normal condition
0.00 0.25 0.50 0.75 1.00 1.25 1.50Spectrum [kHz]
0.18
100.00
200.00
300.00
400.00
ma
g(A
kh
altsik
he
.V)
[kV
]
H1
H5 H7H11 H13
H23
Name X Y
H1 0.0500 420.5944
H5 0.2500 5.6428
H7 0.3500 0.0000
H11 0.5500 13.7212
H13 0.6500 7.7762
H23 1.1500 0.0000
0.00 0.25 0.50 0.75 1.00 1.25 1.50Spectrum [kHz]
0.18
100.00
200.00
300.00
400.00
ma
g(A
kh
altsik
he
.V)
[kV
]
H1
H5 H7H11 H13 H23
Name X Y
H1 0.0500 424.4780
H5 0.2500 6.8029
H7 0.3500 4.6470
H11 0.5500 14.9517
H13 0.6500 7.0854
H23 1.1500 0.0000
THD=3.98% THD=2.24%
THD=4.35% THD=2.57%

THD =2.24% and in N-1 condition THD=2.57. As long as for Georgia 3% and less is treated as permitted, THD values at Akhaltsikhe 500 busbars in case of installed filters in both (normal and N-1 conditions) are OK.

5.3. Switching analysis for 2017
Harmonic analysis had been carried out for Akhaltsikhe 500 and Batumi 220 busburs for two cases: with and without AC filters.
5.3.1 Batumi 220 kV (350 MW Export to TR via Batumi B2B)
In N-1 condition, (Menji – Batumi 220 kV OHL is out of service) at Batumi 220 busburs THD = 7.81 % , and with ac filters it reduces to 2.54%. Permitted range of the THD in Georgian power grid is below 3 %, so 2.54% is OK.
5.3.2 Akhaltsikhe 500 kV (700 MW Export to TR via Batumi B2B)
Calculations are considering that 500 kV OHL connecting substations Tskaltubo and Akhaltsikhe is in and out (in N-1) of service.
At Akhaltsikhe 500 kV busbars in normal and N-1 conditions without filters,
THD = 3.44 % and 3.85 % respectively. In case of installed filters in normal condition THD =2.12% and in N-1 condition THD=2.23. As long as for Georgia 3% and less is treated as permitted, THD values at Akhaltsikhe 500 busbars in case of installed filters in both (normal and N-1 conditions) are OK.


5.4. Switching analysis for 2017-2
Harmonic analysis had been carried out for Akhaltsikhe 500 and Batumi 220 busburs for two cases: with and without AC filters.
5.4.1 Batumi 220 kV (350 MW Export to TR via Batumi B2B)
In N-1 condition, (Menji – Batumi 220 kV OHL is out of service) at Batumi 220 busburs THD = 7.89 % , and with ac filters it reduces to 2.64%. Permitted range of the THD in Georgian power grid is below 3 %, so 2.64% is OK.
5.4.2 Akhaltsikhe 500 kV
(1050 MW Export to TR via Akhaltsikhe B2B)
Calculations are considering that 500 kV OHL connecting substations Tskaltubo and Akhaltsikhe is in and out (in N-1) of service.
At Akhaltsikhe 500 kV busbars in normal and N-1 conditions without filters,
THD = 3.7 % and 3.95 % respectively. In case of installed filters in normal condition THD =2.35% and in N-1 condition THD=2.3. As long as for Georgia 3% and less is treated as permitted, THD values at Akhaltsikhe 500 busbars in case of installed filters in both (normal and N-1 conditions) are OK.

6. Short Circuit Power Calculation Results 6.1. 2013 year
6.2. 2015 year
SHORT CIRCUIT POWER (MVA) AT AKHALTSIKHE 500 BUSBURS
SPRING
MAX
SPRING
MIN
SUMMER
MAX
SUMMER
MIN
AUTUMN
MAX
AUTUMN
MIN
WINTER
MAX
WINTER
MIN
GE+AZ 2919.75 2469.1 2754.5 2383 2862.75 2388.05 3010.85 2654.25
GE 2441.5 1877.95 2148.65 1814 2333.85 1909.7 2588.2 2226.5
SHORT CIRCUIT POWER (MVA) AT AKHALTSIKHE 500
BUSBURS
SPRING
MIN
SUMMER MAX AUTUMN
MIN
WINTER MAX
GE+AZ 3586.75 3894.3 3645.55 4221.2
GE 2833.85 3139.1 3145.35 3730.5
SHORT CIRCUIT POWER (MVA) AT BATUMI 220 BUSBURS
SPRING
MIN
SUMMER MAX AUTUMN
MIN
WINTER MAX
GE+AZ 1279.5 1266.0 1128.1 1234.5
GE 1246.3 1237.9 1107.2 1220.6

6.3. 2017 year
SHORT CIRCUIT POWER (MVA) AT AKHALTSIKHE 500 BUSBURS
SPRING
MIN
SUMMER
MAX
AUTUMN
MIN
WINTER
MAX
GE+AZ 3965.0 4567.0 4213.5 4635.0
GE 3273.1 3920.7 3658.6 4147.5
SHORT CIRCUIT POWER (MVA) AT BATUMI 220 BUSBURS
SPRING MIN SUMMER MAX AUTUMN MIN WINTER MAX
GE+AZ 1376.1 1334.1 1304.1 1314.3
GE 1354.1 1320.2 1285.6 1299.3

ANNEX 4
Analysis of Energy Export capabilities from Azerbaijan and Georgia to Turkey “AGT Power Bridge” Project,
Report, Azerenerji, Baku‐2011

1
Analysis of Energy Export capabilities
from Azerbaijan and Georgiya to Turkey
“AGT Power Brige” Project
R E P O R T
Baku-2011

2
Preface
One of the significant factors to increase efficiency (operation security, energy
trading, as well as integration of renewable energy) of PG is Interstate Integration.
In this respect it is possible to realize the known number of system effects as
structural, capacity, frequency, regime, ecological effects and so on.
As Azerbaijan PG is currently an integrated part of “AGT Power Bridge”
project.
At present time, there are 21 power plants with a total capacity of 6.5 GW
(with a per capita of more than 700 kW) and total length of all transmission lines at
all voltage classes (500-35 kV) is 12000 km. About 98 % of the generation source
concentrated in the grid and is managed by JSC "Azerenerji".
Thermal power plants (PP) dominate in the structure of the Country
Generation system, which forms 84% of the installed generation capacity,
therewith share of hydraulic PP is 16%.
Over the past 10 years the economy of Azerbaijan Republic shows positive
dynamics of almost all macro indices, the downward trend is also the energy
intensity of GDP, which over the past 10 years has fallen almost 4 times and
reached the level of 1.28 toe/USA$ thousand. These and other macroeconomic
indicators on the one hand many times surpass.
The main strategic direction of development of electric power industry of
Azerbaijan is follow:
1. Replacement of technology and equipment for the generation, transport and
distribution of electricity by the most advanced and efficient technologies and
equipment;
2. The balanced development of power generating facilities and Backboned
Networks to provide the necessary level of reliability and efficiency of the
electricity consumers;
4. The establishment of an effective system of optimum management of the
operation and development of PG countries, i.e. a system capable of reducing

3
production costs and optimize accordingly, electricity tariffs, so as ensuring
reliable power supply;
5. Development of PG and its integration with systems of other countries;
6. Development of renewable energy source and reduce the negative impact
of traditional generation on the environment through the use of innovative
technologies.
One of the priority directions of development of National Power System is
expansion and integration with PG’s of others countries.
Azerbaijan PG has extensive work experience in IPG: about 30 years – in the
structure of the no longer existing IPG of USSR. At present time, there are
interconnection at a voltage level of 330 kV in the PG of the Russian Federation,
three interconnection lines of 330, 220 and 110 kV level with PG of Iran. In the
South Caucasus region Azerbaijan’s PG remains the dominant and rapidly
developing. Over the past 10 years, the installed capacity has increased by more
than 30% (2000 MW).
In 2015 and 2017, it is planned to connect Azerbaijan PS to Georgia and
Turkey PS through "Power Bridge", this parallel work will strengthen the strategic
importance of Azerbaijan in the South Caucasus, as well as in the Eurasian Union.
Meanwhile, the development of the High Voltage Interstate connections and
as a result creation of bulk power systems may encounter huge black-outs, which
originate by increasing complication in monitoring, operating and control large-
scale interconnected PG as well as in limited knowledge of the total system state.
Therefore, interconnection between Azerbaijan, Georgia and Turkey requires
checking its stability, disturbance in any normal and forced modes in each stage of
PS development. Such results of the analysis are used to improve the anti-
emergency control.
The results of the following calculations processed on PSS-E software are
given in the current report.

4
In the first part, calculations were performed and due to this, the analysis of
stability were carried out both for operation mode and draft-scheme covering a
connection frame-scale as Azerbaijan PS to Georgia and Turkey, Iran and the
North Caucasus (the Russian Federation) through “Power Bridge” for the years
2012-2013
In the second part, the schemes and operation modes of Azerbaijan PS during
power transmission to Georgia and Iran PS modeled for the 2015 and 2017 years.
5
1. The stability of operation modes and schemas of Azerbaijan PS during
paralel mode conditions
(The mode and scheme of the years 2012-2013)
1.1. The mode and scheme features.
Azerbaijan PS mode is characterized in the following way:
P∑gen = 4400 MW;
P∑load = Pload, max + Pexport =3200 + 1144 = 4344 MW;
Here : Pload,max – PS specific load,
Pexport – total load through interconnection lines
thus,
- to Georgia PS 594 MW (500 kV Samukh-Gardabani OHL – 396 MW and
330kV Akstafa-Gardabani OHL – 198 MW);
- to Iran PS 550 MW (330 kV OHL – 350 MW, 230 kV OHL – 100 MW,
110kV OHL – 100 MW);
- to the North Caucasus PS – 0 MW.
In the Table 1-1 - modes of the system in the normal and N-1 modes, the
main modifier of 500-330 kV OHL power flows are shown.

6
AZERBAIJAN POWER SYSTEM OF THE YEAR 2012-2013
Pgen=4400 MW, Pload=3200 MW (Personal)
Power Transmission:
Georgia – 595 MW:
- 500 kV Samukh-Gardabani OHL – 396 MW
- 330 kV Akstafa-Gardabani OHL – 198 MW
Iran – 550 MW,
Russia – 0 MW/
AZERBAIJAN POWER SYSTEM OF THE YEAR 2015
Pgen=5320 MW, Pload=4031 MW (Personal)
Power Transmission:
Georgia – 594 MW
- 500kV Samukh-Gardabani OHL- 413 MW
- 330kV Akstafa-Gardabani OHL - 181 MW
Iran – 550 MW
Russia – 0 MW
AZERBAIJAN POWER SYSTEM OF THE YEAR 2017
Pgen=6777 MW, Pload=5505 MW (Personal)
Power Transmission:
Georgia – 588 MW
- 500 kV Samukh-Gardabani OHL - 391 MW
- 330 kV Akstafa-Gardabani OHL - 197 MW
Iran – 550 MW
Russia – 0 MW

7
Normal conditions and N-1 Table 1-1
P, MW
1 s
t A
psh
eron
330 k
V O
HL
2nn
d A
psh
eron
500
kV
OH
L
1 s
t A
zTP
P-G
ora
nb
oy
330 k
V O
HL
2st
A
zTP
P-G
ora
nb
oy
330 k
V O
HL
AzT
PP
- S
am
uk
h
500
kV
OH
L
AzT
PP
- S
am
uk
h
330
kV
OH
L
3 M
ingec
ha
vir
330 k
V O
HL
Ap
sher
on
- Y
ash
ma
330
kV
OH
L
Ag
jab
edi
- G
ora
nb
oy
330
kV
OH
L
Imis
hli
– G
ora
nb
oy
330
kV
OH
L
Ak
stafa
- G
ard
ab
an
i
330k
V O
HL
Sam
uk
h -
Gard
ab
an
i
500 k
V O
HL
4402 3200
205 356 316 282 421 198 65 108 350 237 198 396
X 437 360 321 408 217 98 88 401 280 197 391
323 X 365 325 501 174 153 139 438 311 180 399
219 367 X 472 454 258 72 108 332 222 191 400
217 365 493 X 448 248 71 108 335 224 192 395
196 407 404 361 X 417 57 106 331 221 259 329
211 351 375 335 501 X 69 109 347 234 187 406
220 384 326 204 417 291 X 112 361 246 199 394
192 368 315 281 418 199 69 X 348 235 198 391
268 431 251 224 388 185 94 104 X 432 199 383
244 402 275 246 402 190 83 105 490 X 199 390
207 345 295 263 506 160 66 111 354 240 X 594
202 378 357 319 294 275 62 108 341 229 585 X

8
According to the given in the Table 1-1 analysis, in normal mode, the largest
part of the load are referred to 500 kV AzTPP-Samukh OHL, 500 kV 2nd
Absheron OHL, 330 kV Agjabedi-Goranboy OHL.
In n-1 mode a large load (≥50% Pn) is given:
- 330 kV 1st Absheron OHL (58,3%) 500 kV 2nd Absheron during OHL
switch off;
- 330 kV AzTPP-Goranboy OHL (67,4%) 330 kV AzTPP-Goranboy during
OHL switch off;
- 330 kV AzTPP-Samukh OHL (110%) 500 kV- AzTPP-Samukh during OHL
switch off,
- 330 kV AzTPP-Mingachevir OHL (3-rd Mingachivir) (135%) 500 kV 2nd
Absheron during OHL switch off;
- 330 kVt İmishli-Goranboy OHL (82,3%) 330 kV Agjabadi-Goranboy during
OHL switch off;
- 330 kV Akstafa-Gardabani interconnection OHL (195%) 500 kV Samukh-
Gardabani interconnection OHL switch off.
Load Increasing along the lines are shown relative to normal mode load.
During OHL switch off on Samukh-Gardabani 500 kV, interconnection OHL
Akstafa-Gardabani 330 kV due to current are overloaded.
The automatic shutdown may lead to 600 MW loss in Georgia PS and
pressure drop, this can be proved by the calculations performed below.

9
1.2. Dynamic stability of Azerbaijan PS during operation conditions
(The mode and the scheme of the years 2012-2013)
The following types of disturbance are considered:
1. Switch off on both interconnection lines on Azerbaijan and Georgia PS.
At that time frequency variation in both PS was recorded .
The calculation of results is given in fig.1-2 and fig.1-3.
2. Switch off – in AzTPP (270 MW) and Shimal CCPP (350 MW).
In this case, changes in voltage and power flows on 500 kV Samukh-
Gardabani and 330 kV Akstafa - Gardabani OHLs, as well as frequency and
generator rotors of Azerbaijan TPP, and relative angles of generators in Azerbaijan
and Georgia PSs were recorded.
The calculation of results is given in fig.1-4 ÷ 1-21.
3. Switch off load rejection lines:
500 kV AzTPP-Samukh (421 MW)
500 kV AzTPP -Absheron (356 MW)
500 kV Samukh-Gardabani (396 MW)
330 kV- AzTPP-Goranboy (316 MW)
500 kV- Akhalsikhe-Tskhaltu ( 562 MW)
0,2 s by means of automatic reclosing .
In this case, changes in voltage and power flows on 500 kV Samukh-
Gardabani and 330 kV Akstafa-Gardabani OHLs, as well as frequency in transient
mode and generator rotors of Azerbaijan TPP, and relative angles of generators in
Azerbaijan and Georgia PSs were recorded.
The calculation of results is given in fig.1-5 ÷ 1-18
4. on the 3rd phase short circuit buses.:
500 kV Samukh
500 kV AzTPP
500 kV Samukh-Gardabani interconnection OHL and voltage and power in
330 kV Akstafa - Gardabani OHL, frequency and Azerbaijan PS-generator rotors

10
the generators in Azerbaijan and Georgia PS recorded changes of the below
relative angles.
The results of the analysis:
1. During Switch off on each two interconnection lines - 500 kV Samukh- -
Gardabani and 330 kV Akhstafa-Gardabani OHL, we observe power deficit on
Georgia side, as well as frequency reduces to 48.29Hz (fig.1-2). The investigations
in Georgia PS shows that in case of power loss as 891 MW, frequency drops to
47.5Hz.
The frequency of the Azerbaijan TPP changes unimportantly (fig.1-3).
2. Switch off on AzTPP and Shimal CCTP leads to reduction of Power flow,
Switch off on Inquri HPP leads to increasing of Power flow in Azerbaijan PS
(fig.1-5, 1-10, 1-15). It is shown in changes of tension in the interconnection lines -
(fig 1-4, 1-9, 1-14). Frequency changes are miserable during transient processes
(fig.1-6, 1-11, 1-16). The relative angles in generators of Azerbaijan and Georgia
Power Grids and generators of Azerbaijan THPP and among dedicated generators
are recorded (fig.1-7, 1-8, 1-12, 1-13, 1-17, 1-18).
The system is stable. Oscillation processes are the same.
3. During switch off on the 500 kV and 330 kV interconnection lines with
automatic reclosing, the changes of voltage and power, relative angles shows that
the system is stable. (Fig.1-19 ÷ 1-34). The cycle of the first amplitude depends on
load rejection scale.
4. The calculation of the 3 phase s.c. shows that the system is stable (fig.1-
35÷1-42). Oscillation of the generators between the relative angles in 500 kV
AzTPP buses, the initial amplitude of 3-phase s.c is more noticeable (fig.1-37, 1-
38, 1-41, 1-42).
Switch off time has been set-up:
500 kv in Samukh busses during s.c. th = 0,28 s.
500 kv in AzTPP buses during s.c. th = 0,23 s.
The process is given in fig.1-19 ÷ 1-26. After t = 0,12s. the process is stopped.

11
DISTURBANCE: switch off both high-voltage on Gardabani (Georgia) 500 KV Samukh-Gardabani OHL
330 KV Akstafa-Gardabani OHL
Fig.1-2: Frequency on bus 500 kV Gardabani (Georgia) SS
Fig.1-3: Frequency on bus 500 kV Samukh (Azerbaijan) SS

12
DISTURBANCE : switch off block on AzTPP
Fig.1-4: Voltage on bus 500 kV Samukh SS, 330kV Akstafa SS
Fig.1-5: Power flow 500 kV Samukh-Gardabani (Georgia) OHL, 330 kV Akstafa-
Gardabani (Georgia) OHL

13
Fig.1-6: Frequency on bus 500 kV Samukh SS
Fig.1-7: Angle of AzTPP Relative to Shimal CCPP

14
Fig.1-8: Angle of AzTPP Relative to Inguri HPP (Georgia)

15
DISTURBANCE: switch off block on Inguri HPP (Georgia)
Fig.1-9: Voltage on bus 500 kV Samukh SS, 330 kV Akstafa SS
Fig.1-10: Power flow 500 kV Samukh-Gardabani (Georgia) OHL,
330 kV Akstafa-Gardabani (Georgia) OHL

16
Fig.1-11: Frequency on bus 500 kV Samukh SS
Fig.1-12: Angle of AzTPP Relative to Inguri HPP (Georgia)

17
Fig.1-13: Angle of AzTPP Relative to Shimal CCPP

18
DISTURBANCE: switch off block on Shimal CCPP
Fig.1-14: Voltage on bus 500 kV Samukh, 330 kV Akstafa
Fig.1-15: Power flow 500 kV Samukh-Gardabani (Georgia) OHL,
330 kV Akstafa-Gardabani (Georgia) OHL

19
Fig.1-16: Frequency on bus 500 kV Samukh SS
Fig.1-17: Angle of AzTPP Relative to Inguri HPP (Georgia)

20
Fig.1-18: Angle of AzTPP Relative to Sumgait CCPP

21
DISTURBANCE: switch off high-voltage 500 kV AzTPP-Apsheron (2nd
Apsheron) OHL
Fig.1-19: Voltage on bus 500 kV Samukh SS , 330 kV Akstafa SS,
500 kV Gardabani (Georgia) SS, 330 kV Gardabani (Georgia) SS
Fig.1-20: Power flow - 500kV Samukh-Gardabani (Georgia) OHL, 330kV Akstafa-
Gardabani (Georgia)OHL, 500 kV Akhaltsikhe-Tskaltubo (Georgia) OHL,

22
Fig.1-21: Angle of AzTPP Relative to Inguri HPP (Georgia)
Fig.1-22: Angle of AzTPP Relative to Shimal CCPP

23
DISTURBANCE: switch off high-voltage 500 kV Samukh-Gardabani (Georgia) OHL
Fig.1-23: Voltage on bus 500kV Samukh SS , 330kV Akstafa SS, 500kV Gardabani SS,
330kV Gardabani SS
Fig.1-24: Power flow 500kV Samux-Gardabani OHL, 330kV Akstafa-Gardabani OHL,
500kV Akhaltsikhe-Tskaltubo (Georgia) OHL

24
Fig.1-25: Angle of AzTPP Relative to Inguri HPP (Georgia)
Fig.1-26: Angle of AzTPP Relative to Shimal CCPP

25
DISTURBANCE: switch off high-voltage 500KV Akhaltsikhe-Tskaltubo
Fig. 1-27: Voltage on bus 500 kV Samukh SS, 330 kV Akstafa SS
Fig.1-28: Power flow 500kV Samukh-Gardabani (Georgia) OHL,
330kV Akstafa-Gardabani (Georgia) OHL

26
Fig. 1-29: Angle of AzTPP, Shimal CCPP Relative to Inguri HPP
Fig. 1-30: Angle of AzTPP, Sumgayit CCPP Relative to Shimal CCPP

27
DISTURBANCE: switch off both high-voltage 330 kV AzTPP-Goranboy OHL
Fig.1-31: Voltage on bus 500kV Samukh SS, 330kV Akstafa SS, 500kV Gardabani SS
(Georgia), 330kV Gardabani SS (Georgia)
Fig.1-32: Power flow 500kV Samux-Gardabani (Georgia)OHL, 330kV Akstafa-Gardabani
(Georgia) OHL, 500kV Akhaltsikhe-Tskaltubo (Georgia) OHL

28
Fig.1-33: Angle of AzTPP Relative to Inguri HPP (Georgia)
Fig.1-34: Angle of AzTPP Relative to Shimal CCPP

29
DISTURBANCE: 3-phase short circuit on bus AzTPP 500 kV t=0.12sec, tlimit=0.23sec
Fig. 1-35: Voltage on bus 500 kV Samukh SS , 330 kV Akstafa SS
Fig. 1-36: Power flow 500 kV Samukh-Gardabani (Georgia) OHL,
330 kV Akstafa-Gardabani (Georgia) OHL, 330 kV Imishli-Ardabil (Iran) OHL,
330 kV Xachmaz-Derbent (Russia) OHL

30
Fig. 1-37: Angle of AzTPP, Shimal CCPP Relative to Inguri HPP
Fig.1-38: Angle of AzTPP, Sumgayit CCPP Relative to Shimal CCPP

31
DISTURBANCE: 3-phase short circuit on bus 500KV Samukh SS t=0.12sec, Tlimit=0.28sec
Fig.1-39: Voltage on bus 500kV Samukh SS, 330kV Akstafa SS
Fig.1-40: Power flow 500kV Samukh-Gardabani (Georgia) OHL, 330kV Akstafa-
Gardabani (Georgia) OHL, 330kV Xachmaz-Derbent (Russia) OHL, 330kV Imishli-
Ardabil (Iran) OHL

32
Fig.1-41: Angle of AzTPP, Sumgayit CCPP Relative to Shimal CCPP
Fig.1-42: Angle of AzTPP, Shimal CCPP Relative to Inguri HPP

33
2. Stability of modes and schemes during operaton process in Azerbaijan PS
(the scheme and the mode of the year 2015)
2.1. The characteristics of the mode and scheme:
The followings are taken into consideration in the scheme of development
Azerbaijan PS for the year of 2015:
– Connecting 220 kV Shimal CCPP network voltage, inclusion of the
2nd unit with 400 MW;
– 220/110 kV the inclusion of Boyuk Shor SS;
– 220 kV Govsan – Simal OHL (2 cycle);
– 110 kV Boyuk Shor-Binagadi OHL (2 cycle);
– 110 kV Boyuk Shor -205 OHL.
PS modes are characterized in the following way:
Pgen. = 5344 MW,
Pload = 5175 MW.
The power load consist of 2:
– special load of PS – 4031 MW;
– imitation of the nearest PS load – 1144 MW.
Load to the nearest PS:
Georgia PS: Total - 594 MW:
– 500 kV Samukh-Gardabani OHL – 413 MW;
– 330 kV Agstafa-Gardabani OHL – 181 MW,
İran PS:
– 330 kV İmishli-Parsabad OHL – 550 MW,
North Caucasus PS (RF):
– 330 kV Xachmaz-Derband OHL – 0 MW.
Power flows of the main modifier 500-330 kV in OHL are shown in Table 2-1
N-1 modes.

34
Normal conditions and N-1 Table 2-1
P, MW
1st
A
psh
eron
330
kV
OH
L
2n
d
Ap
sher
on
500
kV
OH
L
1st
A
zTP
P-
Gora
nb
oy
330 k
V O
HL
2 n
d A
zHP
P-
Gora
nb
oy
330
kV
OH
L
AzH
PP
-Sam
uk
h
330
kV
OH
L
AzT
PP
-Sam
uk
h
500
kV
OH
L
3 M
ing
ech
avir
330
kV
OH
L
Ap
sher
on
-Yash
ma
330
kV
OH
L
Ag
jab
edi-
Gora
nb
oy
330
kV
OH
L
Imis
hli
-Gora
nb
oy
330
kV
OH
L
5344 5175
244 381 375 336 240 446 87 163 413 282
x 478 430 385 264 435 130 137 474 334
374 x 434 388 222 528 189 193 507 362
262 395 x 565 313 481 96 163 391 264
259 393 589 x 301 475 95 163 395 267
252 376 450 403 x 539 92 164 409 279
237 436 470 421 478 x 79 159 393 265
265 419 389 348 247 440 x 168 428 295
225 400 374 334 241 442 95 x 409 279
325 473 304 272 228 415 128 158 x 519
291 436 329 294 232 426 111 160 581 x

35
The obtained results show that the normal mode of 500 kV AzTPP-Samukh
OHL, 500 kV 2nd Absheron OHL and 330 kV 1st Absheron OHL are overloaded.
In N-1 mode the following lines accept more load (≥Pn):
– when 500 kV 2nd Absheron OHL switch off, 330 kV 1st Absheron OHL
- 53,3 %;
– when 330 kV 2nd AzTPP-Goranboy OHL switch off, 330 kV 1st AzTPP-
Goranboy OHL – 57 %;
– when 330 kV 1st AzTPP-Goranboy OHL switch off, 330 kV 2st AzTPP-
Goranboy OHL – 68 %;
– when 500 kV AzTPP-Samukh OHL switch off, 330 kV AzTPP-Samukh
OHL – 99 %;
when 330 kV Agcabadi-Goranboy OHL switch off, 330 kV- İmishli-
Goranboy OHL – 84 %;
Overload due to current didn’t occur in any modes.

36
2.2. Dynamic stability of Azerbaijan PS during operation conditions
(The mode and the scheme of the year 2015)
The following types of disturbance are considered:
1. Switch off in power plants:
– switch off 4 units in Yenikend HPP– 150 MW (fig. 2-2);
– switch off 2 units in Baku TPP– 110 MW ( fig. 2-3);
– switch off 2 units in AzTPP– 540 MW (fig. 2-4);
– switch off units in Shimal CCPP– 350 MW (fig. 2-5);
– switch off 2 units in Simal CCPP – 700 MW(fig. 2-6);
– switch off units in 330 kV AzTPP buses – 1360 MW (fig. 2-7);
– switch off in AzTPP – 2170 MW (fig. 2-8).
Frequency in normal mode is f = 49.997 Hz.
The minimum frequency during the process and as well as changes of the
relative angles in power plants generators was recorded.
2. the 3rd phase s.c. in PP high voltage buses
In this case, the time of the dynamic stability was defined. The process of is
designed for the following cases:
– s.c. 500 kV in AzTPP bus (fig. 2-9);
– s.c. 330 kV in AzTPP bus. (fig. 2-10);
– s.c. 110 kV in Shimal CCPP bus. (fig. 2-11);
– s.c. 220 kV in Shimal CCPP bus (fig. 2-12);
– s.c. 110 kV in JanubCCPP bus (fig. 2-13);
– s.c. 110 kV in Sumgaıt CCPP buses (fig. 2-14, 2-15);
– s.c. 110 kV-in Sangachal TPP buses (fig. 2-16, 2-17).
Relative angles of the PS generators and voltage change in s.c. were recorded
3. Load rejection
Load rejection occured in the following SS:
– Power flow to Georgia in 330 kV Gardabani SS (181 MW) and in 500
kV Gardabani SS (413 MW);

37
– In Boyuk Shor SS (289 MW).
Frequency, changes of the relative angles and voltage were recorded.
The calculation of the results is given in fig.2-18 and fig.2-19.
4. Load rejection of more than 500 kV and 330 kV OHL:
The following switch offs were considered:
- 500 kV AzTPP-Samukh OHL (fig 2-20)
- 330 kV AzTPP-Samukh OHL (fig. 2-21)
Switched off lines after 0.2 s were connected with automatic reclosing
Frequency, changes of the relative angles and voltage were recorded.
The results of the analysis are given below:
1. The system remains stable in all types of disturbance,
2. The changes of relatime angles can occur during switch off units in Bakı
TPP (fig.2-3) and Shimal CCPP (fig.2-6)
Frequency of the power generation change (decrease) depends on the strength
of the static characteristics of PS in Azerbaijan PS as it’s given in fig.2-8. It
characterize each point of characteristics (Table 2-2). Thus, during power
reduction of 1360 MW, i.e. in 330 kV buses AzTPP generator during switch off 5
generators (26,3%) frequency reduces to 48.874 Hz. The consistent equals
coefficient K = 11.679.
3. During the 3rd phase s.c. switch off was calculated according to the
following values:
– 500 kV in AzTPP bus - 0,35s;
– 330 kV in AzTPP bus - 0,3s;
– 110 kV in Shimal CCPP bus - 0,55s;
– 220 kV in Shimal CCPP bus - 0,65s;
– 110 kV in Janub CCPP bus - 0,55s;
– 110 kV in Sumgaıt CCPP bus - 0,6s;
– 110 kV in Sangachal TPP bus - 0,15s.
In Sumgait CCPP 110 kV bus within th = 0,6s , 110 kV Sangachal TPP
changes are shown in fig.2-15. At the same time, the changes in 110 kV Sangachal

38
buses during s.c. and within th = 0.2s are given in (fig.2-17). In Sangachal buses
within th – the value is 0,15s. The reason for this is the stability of plants which
makes th = 2,74s
4. In Gardabani OHLs of 330 kV and 500 kV, in 600 MW load buses switch off In
Azerbaijan PS increases in value up to 50.248 Hz (fig.2-18). Generators in the
Shimal CCPP lead to the 330 kV Samukh SS (fig.2-19).
5. During switch off interconnection lines with automatic reclosing (t = 0.2 s) of
500 kV and 330 kV voltage and power, the process of the changes of the relative
angles, are given in fig.2-202-21.
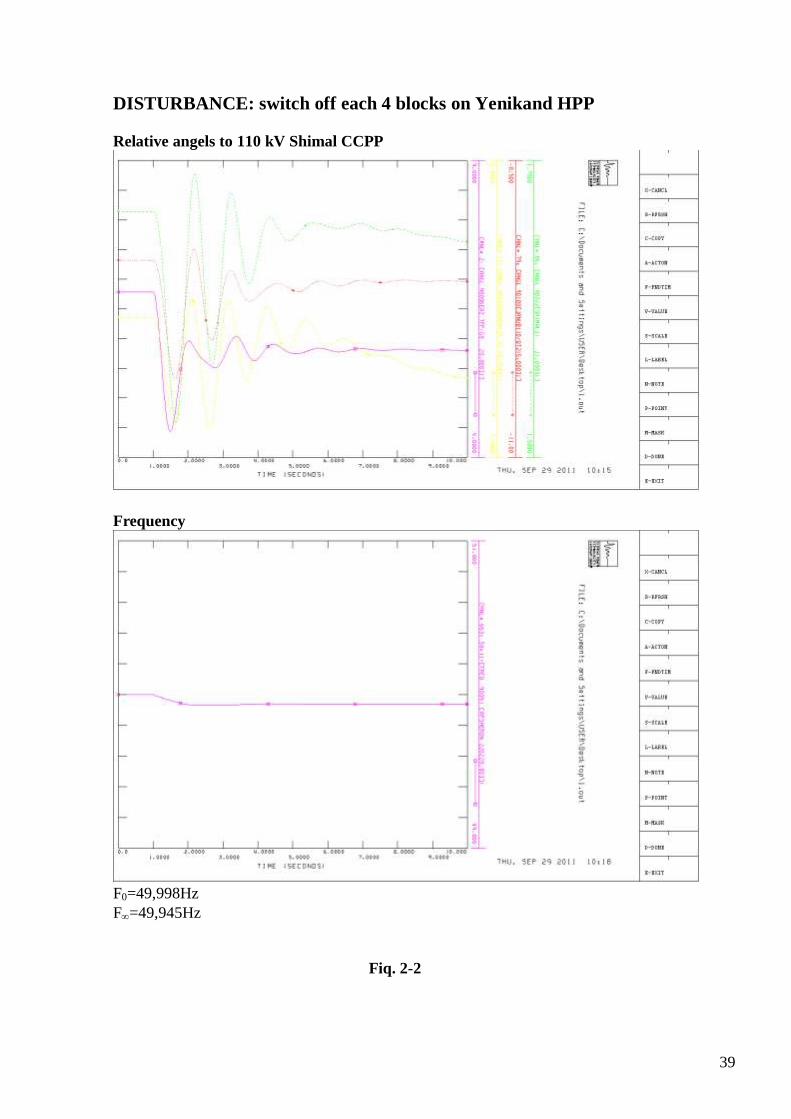
39
DISTURBANCE: switch off each 4 blocks on Yenikand HPP
Relative angels to 110 kV Shimal CCPP
Frequency
F0=49,998Hz
F=49,945Hz
Fiq. 2-2

40
DISTURBANCE: switch off on both BAKI TPP
Relative angels to 220 kV Shimal CCPP
Frequency
F0=49,997Hz
F=49,968Hz
Fig. 2-3

41
DISTURBANCE: switch off 2 units on 330 kV AzTPP
Relative angels to 110 kV Shimal CCPP
Frequency
F0=49,998Hz
F=49,744Hz
Fiq. 2-4

42
DISTURBANCE: switch off on 110 kV Shimal CCPP
Relative angles to 500 kV AzTPP
Frequency
F0=49,998Hz
F=49,858Hz
Fig. 2-5

43
DISTURBANCE: switch off 2 units on Shimal CCPP
Relative angels to 330 AzTPP
Frequency on 110 kV Khirdalan semi-plant
F0=49,997Hz
Fmin=49,671Hz
F=49,676Hz
Fiq. 2-6

44
DISTURBANCE: switch off blocks on AzTPP (1360MW)
Angles relative to 110 kV Sumgait CCPP
Frequency (Azerbaijan)
f0v= 49,998 Hz
f v= 48,874 Hz
Fig. 2-7

45
DISTURBANCE: 3-phase short circuit on AzTPP 500 kV buses (t=0,35s)
Fig.2-9 Relative angels to 500 kV AzTPP
DISTURBANCE: 3-phase short circuit on AzTPP 330 kV busses (t=0,3s)
Fig. 2-10. Relative angels to 330 kV AzTPP

46
DISTURBANCE: 3-phase short circuit on 110 kV buses Shimal CCPP
(t=0,55s)
Relative angels to 110 kV Shimal CCPP
Voltage on 110 kV bus Shimal CCPP
Fig. 2- 11

47
DISTURBANCE: 3-phase short circuit on 220 kV buses Shimal CCPP
(t=0,65s)
Relative angels to 220 kV Shimal CCPP
Voltage on 220 kV Shimal CCPP bus
Fig. 2-12

48
DISTURBANCE: 3-phase short circuit on 110 kV Janub CCPP buses (t=0,55s)
Relative angels to 110 kV Janub CCPP
Voltage on 110 kV Janub CCPP bus
Fiq. 2-13

49
DISTURBANCE: 3-phase short circuit on 110 kV busses Sumgait CCPP (t=0,6s)
Relative angels to 110 kV Janub CCPP
Voltage on 110 kV Sumqait CCPP bus
Fig. 2-14

50
DISTURBANCE: 3-phase short circuit on 110 kV Sangachal TPP (t=0.2s,t=0,15s)
Relative angels to 110kV Sangachal TPP
Fig. 2-15: 3-phase short circut on 110 kV Sumgait CCPP buses (t=0,6s)
Relative angels to 110 kV Sumgait CCPP
Fig. 2-16 3-phase short circut on 110 kV Sangachal TPP buses (t=0,15s)
Relative angels to 110 kV Shimal CCPP (instability to Sangachal TPP)
Fig. 2-17

51
DISTURBANCE: load rejection on 330 KV Gardabani OHL and 500 kV Gardabani OHL
Relative angels to 110 kV Shimal CCPP
Frequency on 220 kV Absheron semi-plant
F0=49,997Hz
Fmax=50,292Hz
F=50,248Hz
Voltage on bus 330 kV, 500 kV Samukh SS
Fig. 2-18

52
DISTURBANCE: load rejection on 290 MW Boyuk-Shor SS
Relative angels to 220 kV Shimal CCPP
Frequency on 220 kV Absheron semi-plant
F0=49,997Hz
Fmax=50,135Hz
F=50,124Hz
Voltage on bus 220 kV Boyuk-Shor SS
Fig. 2-19

53
DISTURBANCE: switch off high-voltage 500 kV AzTPP-Samukh OHL
(t=0,2 sec switch on)
Power flow 330 kV AzTPP-Mingechaur OHL, 330 kV AzTPP-Samukh OHL,
330 kV AzTPP-Goranboy OHL, 500 kV 2ndAbsheron OHL
Voltage on bus 500 kV and 330kV AzTPP
Angles relative to 500 kV AzTPP
Fig. 2-20

54
DISTURBANCE: switch off high-voltage 330 kV AzTPP-Samukh OHL
(t=0,2 sec switch on)
Power flow on 330 kV AzTPP-Mingechaur OHL, 330 kV AzTPP-Samukh OHL,
330 kV AzTPP-Goranboy OHL
Voltage on bus 500 kV and 330 kV AzTPP
Angles relative to 330 kV AzTPP
Fig. 2-21

55
2.3. Dynamic stability of Azerbaijan PS during operation conditions
(The mode and the scheme of the year 2017)
AZERBAIJAN POWER SYSTEM OF THE YEAR 2017
Pgen = 6777 MW, Plod=5505 MW (Personal)
Power Transfer
- Georgia – 588 MW:
- 500 kV Samukh-Gardabani OHL – 391 MW,
- 330 kV Akstafa-Gardabani OHL – 197 MW,
- Iran – 550 MWt,
- Russia – 0 MW.

56
DISTURBANCE: 3-phase short circuit on 110 kV bus JANUB CCPP
Fig. 2-22: Angles relative to Janub CCPP (t=0.3s)
Fig. 2-23: Voltage on 110 kV bus Janub CCPP

57
DISTURBANCE: 3-phase short circuit on 110 kV bus SUMGAIT CCPP
Fig. 2-24: Angles relative to Janub CCPP
Fig. 2-25: Voltage on 110 kV bus Sumgait CCPP

58
DISTURBANCE: switch off block on AzTPP
Fig. 2-26: Voltage on 500 kV Samukh SS , 330 kV Akstafa SS busses
Fig. 2-27: Power flow 500 kV Samukh-Gardabani OHL, 330 kV Agstafa-Gardabani OHL

59
Fig. 2-28: Frequency on 500 kV bus Samukh SS
Fig. 2-29: Angle of AzTPP relative to Shimal CCPP

60
DISTURBANCE: switch off high-voltage 500 kV Samukh-Gardabani OHL
Fig. 2-30: Voltage on 500 kV Samukh , 330 kV Akstafa, 500kV Gardabani, 330 kV
Gardabani SS buses
Fig. 2-31: Angle of AzTPP Relative to Shimal CCPP

61
Conclusion
The modes and the schemes of Azerbaijan PS for the years 2013, 2015 and
2017 was carried out by PSS-E software.
The scheme and modes in Georgia and Turkey Power Systems ("Power
Bridge"), as well as the North Caucasus (RF) and Iran match the conditions of the
power systems functioning with interconnection lines. Including Modes, the
elements of the design parameters and the scheme of the years 2012-2013, the
substitution of the full power system was taken into account (given by the Georgia
PS). The required load for 2015 and 2017 mode Azerbaijan-Georgia-Turkey
through “Power Bridge” was shown.
The following types of disturbance were considered: units, switch off most
overloaded 500 kV and 330 kV OHLs, 3rd phase s.c. in plant buses.
Power flow, frequency, voltage, and the processes of the relative angle change
were presented in drawings collection.
The obtained results can be used for to solve emergency control issues in
power unions (pools) in the future where Azerbaijan PS playing both importer and
exporter functions.
Effective “Anti - Emergency Management” is important for the solution of the
problem optimal location of hardware intellectual technology, in particular, PMU.
The answer may be obtained on the basis of a theory of measurement (criteria of
observability and controllability) and sensitivity.
Example of the results of the pre-project studies on “AGT Power Bridge”
shows the capability of controlling and transient processes in this regard by using
simultaneous measurement of the complex voltage and current (PMU) at the end of
the ties.