Working group on space-based winds January 27-30, 2009 Destin, FL Sara C. Tucker, Wm. Alan Brewer,...
21
Working group on space-based winds January 27-30, 2009 Destin, FL Sara C. Tucker, Wm. Alan Brewer, Scott Sandberg, Mike Hardesty CIRES, University of Colorado and NOAA/ESRL/CSD With thanks to Dan Wolfe and other scientists and crew of the RHB TexAQS and VOCALS cruises Lidar wind measurements in the Southeastern Pacific lower troposphere: stratus versus clear conditions
-
Upload
leslie-bruce -
Category
Documents
-
view
214 -
download
1
Transcript of Working group on space-based winds January 27-30, 2009 Destin, FL Sara C. Tucker, Wm. Alan Brewer,...
Working group on space-based winds January 27-30, 2009 Destin, FL
Sara C. Tucker, Wm. Alan Brewer, Scott Sandberg, Mike HardestyCIRES, University of Colorado and NOAA/ESRL/CSD
With thanks to Dan Wolfe and other scientists and crew of the RHB TexAQS and VOCALS cruises
Lidar wind measurements in the Southeastern Pacific lower troposphere:
stratus versus clear conditions

VOCALS 2008: The VAMOS Ocean-Cloud-Atmosphere-Land Study Regional Experiment VAMOS : Variability of the American Monsoon Systems
A study in the region of the Southeastern Pacific to improve understanding of:
• the processes controlling properties of stratocumulus clouds and ocean transport of cold fresh water offshore,
• aerosol, drizzle, cloud interactions, and
• the chemical and physical interactions between ocean, atmosphere, and land.
HIGH RESOLUTION DOPPLER LIDAR (HRDL) – VOCALS
Wavelength 2.02 µm
Pulse Energy 2-3 mJ
Pulse Repetition Frequency
200 Hz
Maximum Range 4-8 km
Range Resolution 30 m
Beam rate 2 Hz
Scanning Full Hemispheric
Precision 15-30 cm/s

• Ship-based studies help to characterize wind (horizontal wind profiles and vertical winds) and scattering over the oceans
• Arctic (IPY) cruise Southeastern Pacific
• Data in the tropics and down near -21 South
• Lidar, cloud radar (w-band), c-band, flux tower, sondes, & lots of oceanography (Buoys 101)
HRDL RV Brown – VOCALS 2008

VOCALS 2008: Stratus deck over the SEP
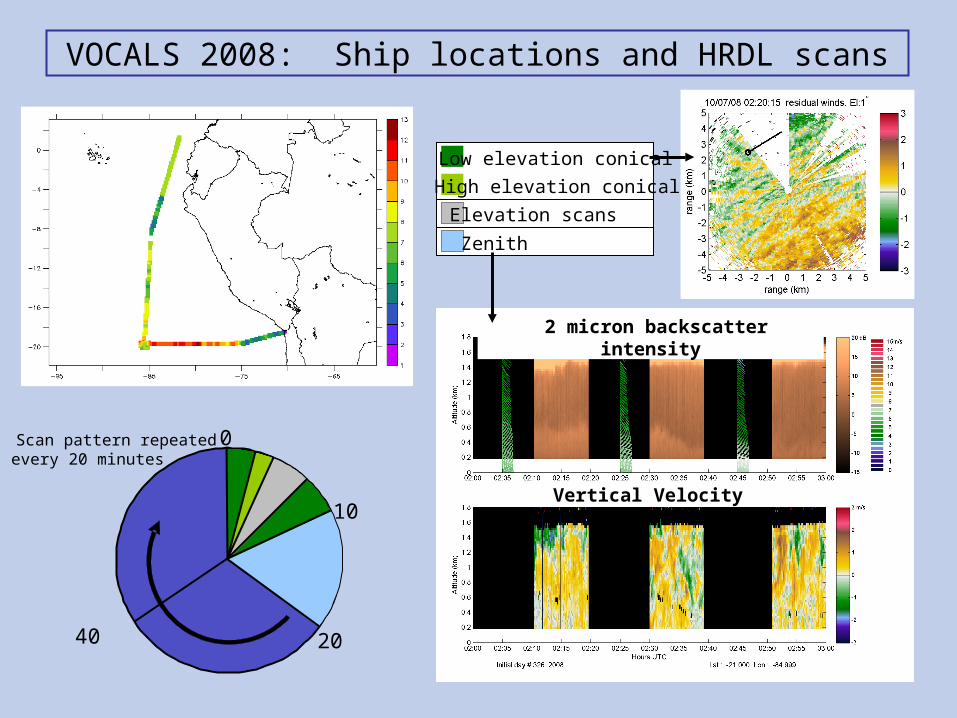
VOCALS 2008: Ship locations and HRDL scans
Low elevation conical
High elevation conical
Elevation scans
Zenith
0
10
Scan pattern repeated every 20 minutes
2040
2 micron backscatter intensity
Vertical Velocity

Horizontal mean wind speed & direction
Vertical velocity variance, σw2
Wideband SNR (proxy for backscatter)
Dynamical• Profiles of horizontal wind speed
and direction and small scale σw
2
• Turbulence strength and mixing height
• Rolls, outflows/convergence, divergence, etc.
• Atmospheric decoupling• Cloud base velocity
Aerosol Backscatter• Aerosol layers• Spatial variability in vertical and
horizontal planes• Cloud base height and cloud
fraction• Atmospheric decoupling
Atmospheric Studies with the NOAA/ESRL
High Resolution Doppler Lidar (HRDL)

HRDL - RV Brown, VOCALS 2008: Horizontal mean wind speed
HRDL - RV Brown, VOCALS 2008: Horizontal mean wind direction
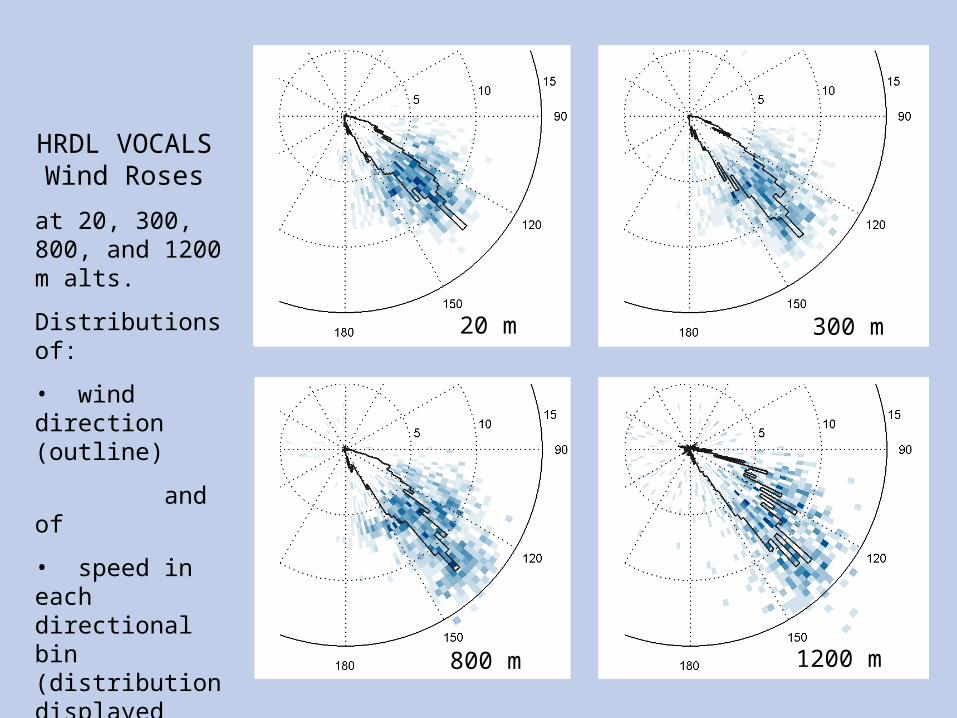
HRDL VOCALS
Wind Roses
at 20, 300, 800, and 1200 m alts.
Distributions of:
• wind direction (outline)
and of
• speed in each directional bin (distribution displayed using color intensity).
20 m 300 m
800 m 1200 m

VOCALS 2008: HRDL SNR and clouds
dB
• Stratus deck over much of the Southeastern Pacific• During VOCALS: ~90% cloud cover (according to HRDL
signals)
In port
HRDL RV Brown VOCALS 2008 – 20 min Zenith wbSNR 10/21/08-11/30/08

VOCALS 2008: HRDL-derived Cloud Height vs. lat/lon

What’s going on above the stratus deck?
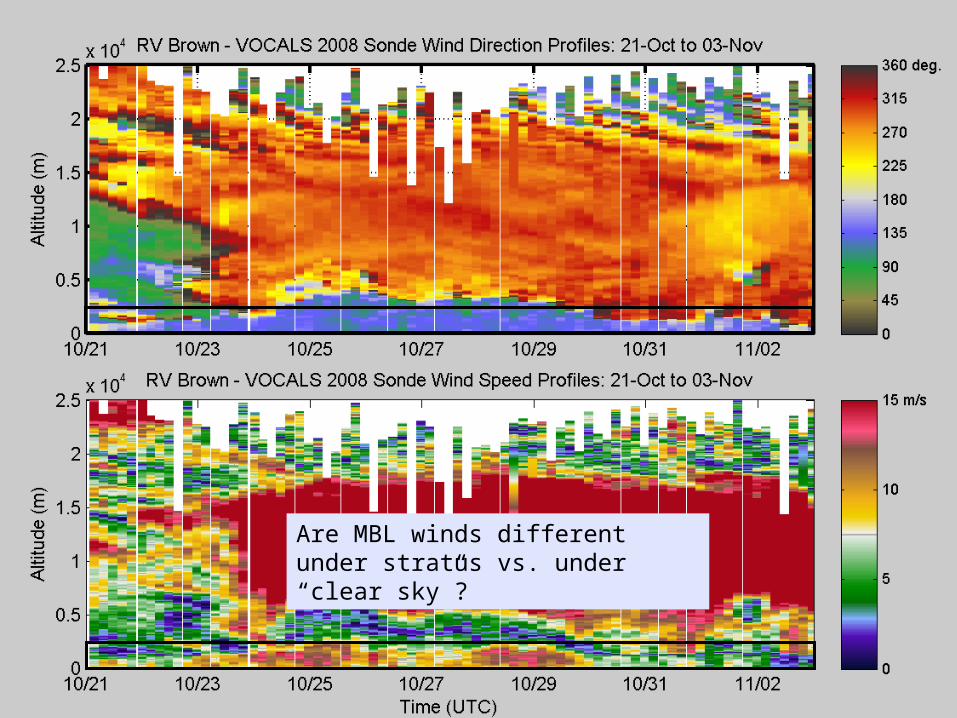
Are MBL winds different under stratus vs. under “clear sky”?

HRDL VOCALS: Distributions of horizontal mean wind speed and direction vs. altitude

HRDL VOCALS: Statistics of horizontal mean wind speed and direction vs. altitude
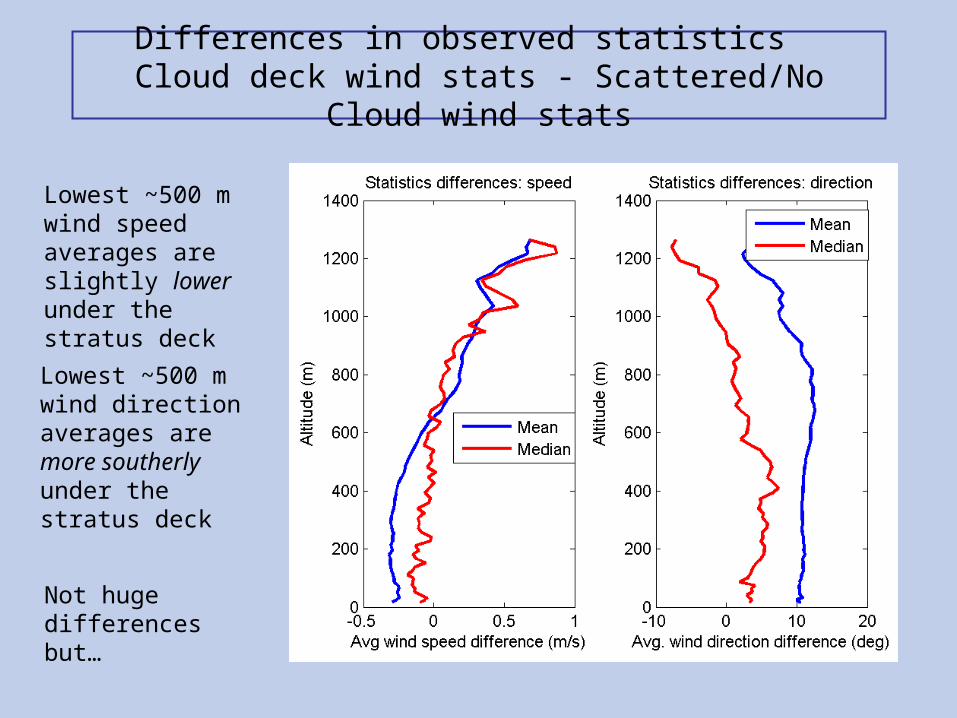
Differences in observed statistics Cloud deck wind stats - Scattered/No Cloud wind stats
Lowest ~500 m wind speed averages are slightly lower under the stratus deck
Lowest ~500 m wind direction averages are more southerly under the stratus deck
Not huge differences but…

Implications of SEP cloud cover for use of future Space-Based Wind Lidar data
• What will this mean for models?– Weather forecasting
– Aerosol transport (smelters, fires, etc.)
– Aerosol generation (sea-salt): winds/turbulence/waves
– Aerosol/cloud interactions (winds/turbulence)
• Still need to factor in vertical winds during clear periods
• Would buoy (surface) data suffice for some applications? Surface wind speeds are almost always lower than those aloft.
• Combine with other types of satellite (i.e. Scatterometer, visible imagery) data?
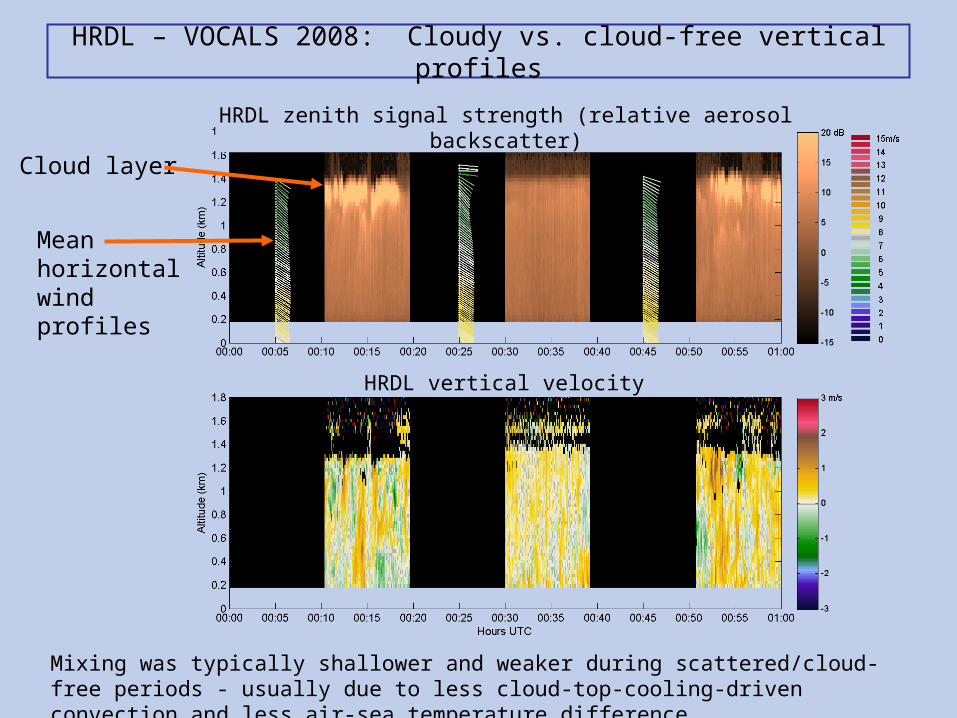
HRDL – VOCALS 2008: Cloudy vs. cloud-free vertical profiles
Mixing was typically shallower and weaker during scattered/cloud-free periods - usually due to less cloud-top-cooling-driven convection and less air-sea temperature difference.
HRDL zenith signal strength (relative aerosol backscatter)
HRDL vertical velocity
Cloud layer
Mean horizontalwind profiles
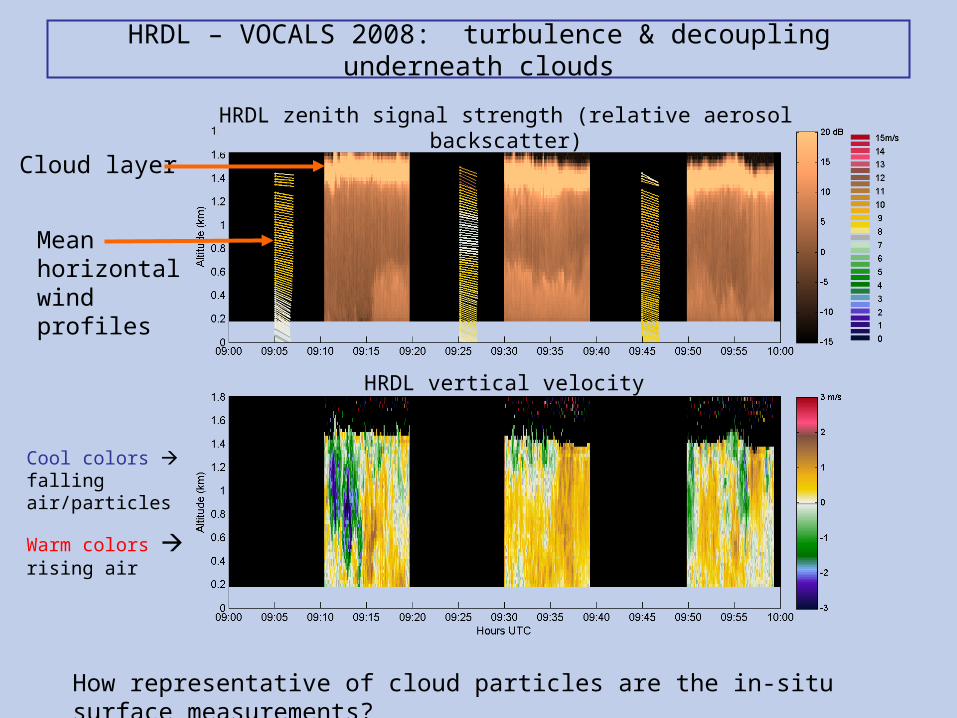
HRDL zenith signal strength (relative aerosol backscatter)
HRDL vertical velocity
Cloud layer
Mean horizontalwind profiles
Cool colors falling air/particles
Warm colors rising air
How representative of cloud particles are the in-situ surface measurements?
HRDL – VOCALS 2008: turbulence & decoupling underneath clouds

Atmospheric Decoupling in the Southeastern Pacific

Just getting started…
• Impact of vertical velocities
• Vertical transport (etrainment & venting)
• Mixing heights• Aerosol layer(s)
• Relationship between MBL winds & SST
• Higher temporal resolution cloud height, % cloud cover, & time of day
• Model implications
Thanks to NASA, NOAA/CPPA and NOAA/HOA for funding this work
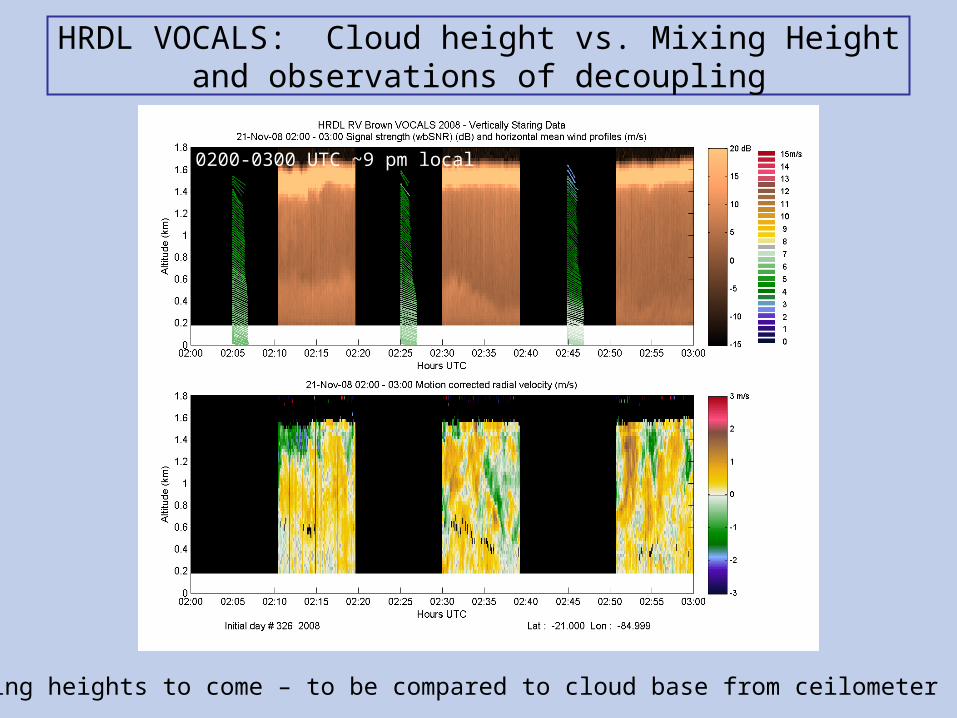
HRDL VOCALS: Cloud height vs. Mixing Height and observations of decoupling
0200-0300 UTC ~9 pm local
Mixing heights to come – to be compared to cloud base from ceilometer