Working Capital Management, Government Ownership… · Working Capital Management, Government...
30
Working Capital Management, Government Ownership, and Shareholder Wealth Haifeng Guo Harbin Institute of Technology School of Management 92 Xidazhi St, Harbin, China 150001 Email: [email protected] Robert Kieschnick University of Texas at Dallas School of Management 800 W. Campbell Rd, SM31 Richardson, TX 75080 Email: [email protected] Current Draft: May 12, 2015
Transcript of Working Capital Management, Government Ownership… · Working Capital Management, Government...
Working Capital Management, Government Ownership,
and Shareholder Wealth
Haifeng Guo Harbin Institute of Technology
School of Management 92 Xidazhi St, Harbin, China 150001 Email: [email protected]
Robert Kieschnick University of Texas at Dallas
School of Management 800 W. Campbell Rd, SM31
Richardson, TX 75080 Email: [email protected]
Current Draft: May 12, 2015

Working Capital Management, Government Ownership,
and Shareholder Wealth
ABSTRACT
Working capital management involves the management of a firm’s cash holdings, its extension of credit to its customers, its investment in inventories, and its use of trade credit. While these are important concerns, it is not clear whether they are more or less important to shareholders in an emerging market such as China. Further, it is not clear whether state ownership or tunneling are significant influences on how outside shareholders value these financial choices. We use data on a sample of Chinese firms traded on the Shanghai (SHSE) and Shenzhen Stock Exchanges (SZSE) to address these issues. We find that: (1) there are differences in how working capital in China is valued by shareholders from how it is valued in the U.S., (2) we extend Jiang, Lee and Yue (2010) by demonstrating that tunneling affects the valuation of the use of trade credit as well as the extension of trade credit, (3) increased government ownership reduces shareholder wealth but not through working capital channels, and (4) we do find evidence that government ownership may reduce the wealth losses associated with tunneling in firms open only to domestic investors.
Key words: Working capital management, cash management, state ownership, emerging market
1. Introduction
Working capital management involves the management of a firm’s cash holdings, its
extension of credit to its customers, its investment in inventories, and its use of trade credit
offered by suppliers. As such, both industry surveys (e.g., CFO Magazine) and academic studies
(e.g., Faulkender and Wang (2006), Kieschnick, LaPlante, and Moussawi (2013)) demonstrate
the importance to shareholders of how a firm’s manages these aspects of its operations.
While prior research provides evidence on the valuation of a firm’s choices on these
aspects of its operations for shareholders in a developed economy, such as the U.S. economy,
there is less evidence on the value of these corporate choices in a developing economy,
particularly one in which the state plays a large role in business affairs. For this reason we focus
on the value that Chinese shareholders place on these aspects of the behavior of Chinese firms.
We also focus on Chinese firms because of the increasing importance of China to the world
economy.
There are several reasons that one might conjecture why the value to Chinese
shareholders of how a firm manages its working capital might differ from how U.S. shareholders
value these same aspects. First, Chinese firms may face greater constraints on their access to
capital, particularly from non-government controlled sources. Chinese security markets, and
particularly their corporate debt markets, are still developing. Consequently many firms, who
are not cross-listed in other capital markets, potentially face constraints in their access to capital
from non-governmental controlled sources.
Second, because the Chinese government retains an equity interest in many Chinese
businesses it can play an influential role in a company’s affairs, and particularly in how it
manages its working capital. Here, however, there are two conflicting possibilities. On one
hand, Chinese governmental influence can increase conflicts of interests by requiring or allowing
managers to pursue political or personal objectives at the expense of outside shareholders. On
the other hand, Chinese governmental influence can increase the value of the firm to outside
shareholders by giving firms in which they have an equity interest better access to capital or
preferences in how they are treated by authorities in contract awards, regulatory decisions, etc.
Ultimately these conjectures raise empirical questions and so we focus on estimating the
value to shareholders of Chinese of how these firms manage their cash, their inventories, and
their use of as well as extension of trade credit using a sample of Chinese corporation with stocks
traded on the Shanghai and Shenzhen Stock Exchanges (SHSE and SLSE) between 1993 and
2012.
Based on our analysis of these data we draw the following conclusions. First, unlike
Megginson and Wei (2012) or Sun and Wang (2012), we do not find that government ownership
significantly influences the value of cash in Chinese corporations. Second, in contrast to the
evidence for U.S. firms, increases in the extension of trade credit to their customers do not
increase shareholder wealth, but rather reduces it. This evidence is consistent with the evidence
in Jiang, Lee and Yue (2010) which use other receivable scaled by total assets (ORECTA) to
capture tunneling in Chinese corporations. Thus, it appears that market participants are aware of
such behavior and view increases in the extension of trade credit in a negative light unlike that
for U.S. firms. Third, like the evidence for U.S. firms, increases in inventory investment is
associated with increases in shareholder wealth. However, unlike U.S. firms, the magnitude of
these increases is on par with those associated with an increase in cash holdings. Such evidence
might reflect the role of many Chinese firms in the supply chain of foreign companies serving
developed markets. Fourth, even stronger than in the U.S., the use of trade credit by Chinese
firms reduces shareholders wealth. This evidence is consistent with tunneling through
intercorporate loans and represents the flip side of the evidence for accounts receivable reported.
Consequently we identify another aspect of tunneling unrecognized in prior research on this
topic. Fifth, we find evidence that increases in government share ownership significantly reduces
shareholder wealth on average. There are several potential reasons for this evidence. For
example, government control might reduce workers incentives to work hard and control costs,
which is consistent with prior evidence on the effect of government share ownership on Chinese
firm performance. In addition, such control might influence their long-run investment decisions.
Such a conjecture would be consistent with anecdotal evidence on the push of the Chinese
government to invest in long-run projects and some of their disastrous consequences. And,
finally, we do find evidence that government ownership does appear to reduce the negative effect
of tunneling through other receivables in domestic investor only firms, it does not do so in firms
with non-domestic investors. We interpret this evidence as implying government ownership

reduces tunneling in firms only open to domestic investors while non-domestic investors play a
role in mitigating such behavior in dual listed firms.
2. Review of the literature
2.1. The effects of Chinese state ownership on firm behavior
Many studies highlight the effect of structure of shareholdings on a firm’s behavior and
performance in China. Although most of the studies indicate that such structures have a
significant influence on a firm’s behavior (Wang, 2005), there isn’t an agreement on how the
different types of shareholders influence the firm’s performance. Specially, the effect of state-
owned shares on firm’s behavior has led to contradictory statements.
Among these studies, a majority of scholars find the state shareholders negatively
influence the firm’s performance (Wei and Varela, 2003, Qi, et al., 2000, Bai, et al., 2007), i.e.
government ownership is detrimental to corporate performance (Tian and Estrinb, 2008). Many
reasons may explain this evidence: agency problems, rent seeking, extraction of objectives, and
protection of government intervention (Shleifer and Vishny, 1998). Wei et al. (2005) indicate
that there are conflicts of interest between state-owned shareholders and other kinds of
shareholders, which will decrease firm value.
These conflict of interest problems are further magnified by the agency problem in firms
with high state ownership, since top managers are likely to be appointed by the government
without meaningful personal ownership in these firms. Firms with higher government control
concentrate on objectives besides the profit maximization (Estrin and Perotin, 1991) and thus
state ownership cam create inefficiencies in corporate governance (Xu and Yan, 1999). Shleifer
and Vishny (1998) further indicate that government has a “grabbing hand” that extorts firms for
the benefit of politicians and bureaucrats. Fana, et al. (2007) provide evidence that there exists
the “grabbing hand” effect in China. They find that the performance of the firms run by
politically connected CEOs is poor relative to their politically unconnected counterparts. Further,
Su (2005) adopts political cost approach and find that firms with higher government ownership
are more vulnerable to political interference and thus investor’s reaction more positively to SEOs
in which government ownership is smaller.
On the other hand, some scholars argue that Chinese government ownership can assist
firm’s development and Chinese economic growth (Blanchard and Shleifer, 2001, Tian and

Estrinb, 2008). Firth et al. (2009) find that having the state as a minority owner helps firms
obtain bank loans and this suggests that political connections play a role in gaining access to
bank finance. Li et al. (2009) further finds that state ownership is positively associated with
leverage and firm’s access to long-term debt and thus state-owned firm’s easy access to long-
term debt is positively associated with long-term investment.
2.2. The value of working capital management for shareholders
The studies discussed above primarily focus on the effect of Chinese government
ownership on either firm performance or access and use of debt. There is only limited attention
paid to the effect of Chinese government ownership on the working capital policies of Chinese
firms, and that has solely focused on the effects of Chinese government ownership on the value
of cash holdings to shareholders.
Concerning the value of cash to Chinese investors, there are two studies that provide
conflicting evidence. Megginson and Wei (2012) examine the value of cash holdings to
shareholders in Chinese privatized firms over the period 1993 to 2007. To do this, they use the
approach set out in Faulkender and Wang (2006). They report evidence that not only does
increased governmental share ownership reduce shareholder wealth, but it also reduces the value
of a firm’s cash holdings to shareholders.
In contrast, Sun and Wang (2012) arrive at the opposite conclusion using data only on
single listed Chinese companies from 1996 to 2009. Further they report evidence that
government ownership reduce the effect on tunneling on firm value. Sun and Wang argue that
the difference between their results and Megginson and Wei’s (2012) results are driven by the
fact that Megginson and Wei include dual listed firms in their sample – which Sun and Wang
argue is inappropriate.
However, Sun and Wang (2012) also use a different valuation model than do Megginson
and Wei (2012), and unfortunately it is one subject to a lot of criticism. For example, Faulkender
and Wang (2006) point out a number of flaws with their type of firm value measure. The most
serious of which is that it assumes that all firms face the same cost of capital. In addition,
Dybvig and Warachka (2012) point out that this type of measure really does not measure firm
performance or value.
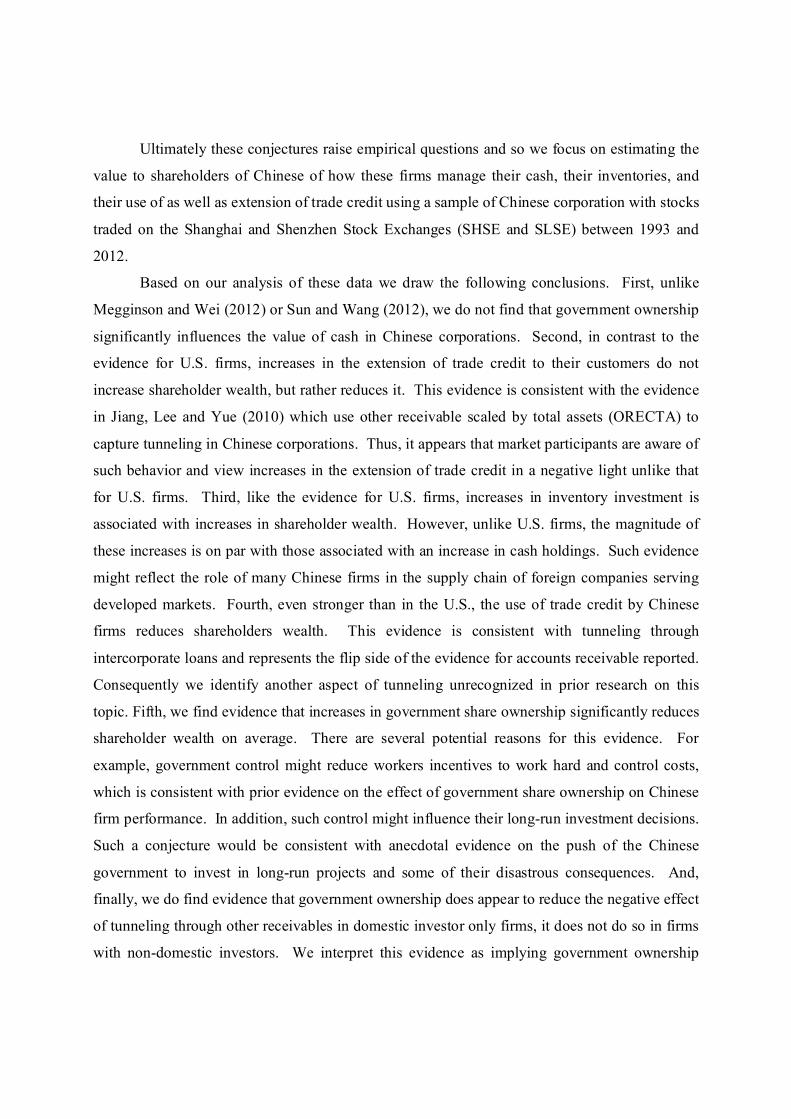
3. Sample, Data, Model
3.1 Sample and data sources
The primary data include firms’ financial statements and trading data, which are obtained
from the CSMAR database (China Stock Market Financial Database). The data covers the firms
which offered A-shares and are list on the Shanghai Stock Exchange (SHSE) and Shenzhen
Stock Exchange (SZSE) from 1993 to 2012. Besides the firms’ data, the corresponding SHSE
and SZSE market returns are also included into our research data. The final sample consists of
21023 firm-year observations for 1701 companies.
3.2 Model
Faulkender and Wang (2006) focus on what might influence excess returns to equity and
specify the following type of model:
0 1 2 3 4
5 6 7 8 9 10
( 1) ( ) ( 1)* ( ) ( )( ) ( ) ( ) ( ) ( ) ( ) ,
Bt t
t
r R C t C t C t C t E tNA t RD t I t D t L t NF t
(1)
where the dependent variable, Bt tr R , represents a stock’s excess return during the 12 months
ending at fiscal period end of year t, where tr is the realized return on the firm’s stock during the
fiscal year t and BtR is the benchmark return for the stock. This model is like a hedonic price
equation in that it relates excess stock returns (value) to firm characteristics that influence cash
flows to stockholders. 1
Following Faulkender and Wang (2006), we define each of the variables in equation 1 as
follows. tr represents the firm’s stock return over year t. BtR represents a benchmark return over
the same period. C(t) represents the firm’s cash holdings. I(t) represents the firm’s interest
expense. D(t) represents the firm’s total dividends. L(t) represents the firm’s market leverage
(total debt over total debt plus the market value of equity). NF(t) represents the firm’s net
financing during the fiscal year (total equity issuance minus repurchases plus debt issuance
minus debt redemption). E(t) represents the firm’s earnings before interest and extraordinary
1 Fraulkender and Wang (2006) extensively discuss the motivation for their specification and so we will not repeat their discussion.
items. NA(t) represents the firm’s total assets net of cash. RD(t) represents the firm’s R&D
expenditures (0 if missing).
We use the notation, X, for unexpected changes in X over the current year. Faulkender
and Wang (2006) find that using actual changes in X provide similar estimates to various
expected change estimates and so we will use actual changes as well. We then divide each of
these variables, except L(t), by the firm’s market value of equity at the beginning of the fiscal
year, so that X(t) is the level of variable X in year t divided by the firm’s market value of equity
(MVE) in year t-1. Because of this scaling by market capitalization at t-1, the regression
coefficients are a gauge for how investors perceive each 1 dollar investment in X; measured
relatively to how β*ΔX is able to explain the unanticipated change in a company’s valuation
( ( Bt tr R )*MVEt-1 ).
Given this benchmark estimation, we now focus on the effect of net operating working
capital investment on shareholder wealth while accounting for its prior level. To do this we
incorporate ARt-1 , ARt , INVt-1 , INVt , APt-1 , APt in equation 1 to captures accounts
receivable, inventories and account payable respectively. Also, we adjust our measurement of
net assets. NNA(t) represents total assets less the sum of cash and marketable securities and net
operating working capital. As noted earlier, this should capture the effects of investments in
different components of working capital on shareholder wealth.
3.3 Variables
In Appendix A we set out the details on how each of the above variables are measured
and so we will refer the reader to that presentation since they are very similar to the measures
used in Faulkender and Wang (2006), except with respect to two variables.
First, rather than use the income statement to compute changes in dividend and interest
payments, we use the statement of cash flows. Further, as CSMAR database combines these
payments into one measure and this measure does not match the sum of interest and dividends
from the income statement we use the combined measure from the statement of cash flows.
Second, we only take market risk into account as the evidence in Berk and Van
Binsbergen (2013) and other recent research suggest that multifactor models do not improve on
the Capital Asset Pricing Model. Consistent with this point, Lin, Wang and Cai (2012) report
evidence that the Fama-French factors are not good proxies for latent risk factors and that only

market risk appears to be a good proxy for such a factor. While we did compute excess return
using the CAPM, we only report results from estimating models with the market factor as a
regressor. We did this for three reasons. First, computing excess returns introduces another
source of variation that affects estimates of the standard errors (though not the estimates of the
coefficients). Second, the regression models with market return as an explanatory variable fit the
data better – which is consistent with the first point. Third, we derive the same inferences and so
the choice is not essential.
In addition to these differences, we will focus on three issues raised by Sun and Wang
(2012) study. First, unlike Megginson and Wei (2012), Sun and Wang (2012) create a dummy
variable to capture state ownership. Unfortunately, they are not clear on how they defined this
variable. Further, it is not clear whether it is appropriate to capture state ownership as a dummy
variable when it is a continuous variable. Consequently we follow Megginson and Wei (2012)
and measure our variable, State, as the fraction of total shares retained by the state after share-
issue privatization.
Second, Sun and Wang (2012) bring up the issue of tunneling in Chinese firms,
particularly in firms that have issued only a single class of shares (Class A shares). Following
Jiang, Lee and Yue (2010), Sun and Wang create two variables to capture tunneling: OREC (the
ratio of other receivable to assets) and NOI (the ratio of non-operating income to sales). While
we created two variables that are similar to their measures, to be consistent with the Faulkender
and Wang (2006) framework, we scale other receivables by the lagged value of the market value
of equity. In what follows, we only report evidence for OREC because the NOI measure is
never significant in our regressions when we include both.
A third issue raised by the Sun and Wang (2012) study does not really concern a variable,
but rather the sampling design of the Megginson and Wei (2012) study. Specifically, Sun and
Wang argue that because Megginson and Wei’s study included dual-listed shares (AB, ABH, and
AH shares) that their results are biased because the market value of firms in Chinese are
computed only using the A shares. Consequently we will conduct our subsequent analyses with
both a full sample (like Megginson and Wei’s (2012) sample) and a reduced sample (like Sun
and Wang’s (2012) sample).
Summary statistics for each of these variables are reported in Table I. Panel A reports the
summary statistics for the full sample and Panel B reports the summary statistics for the reduced
sample. Note that we winsorize each variable based on accounting data at the 1% and 99%
levels. While unreported, we also examined the pairwise correlations between all the variables
used in our study and do not observe any correlations that would suggest that multicollinearity
will be a serious concern in our regression models.
4. Analysis
4.1. The value of cash management for shareholders
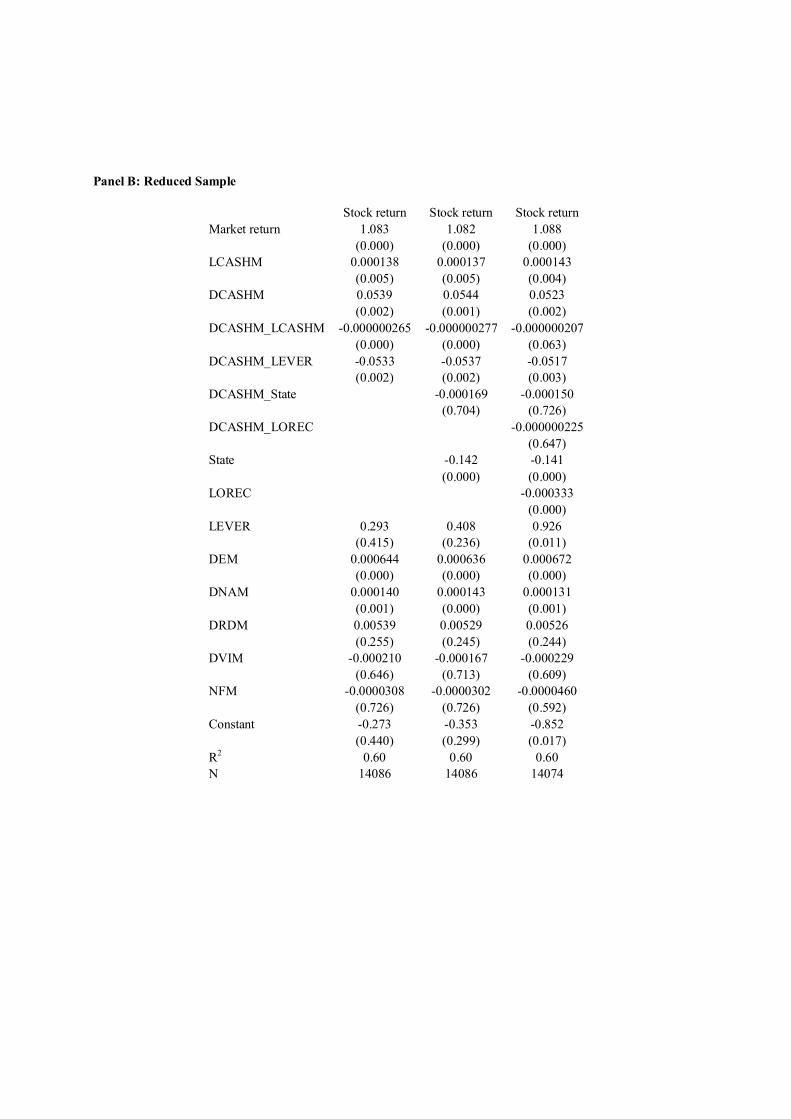
We begin with an analysis of the value of a Chinese corporation’s cash holdings to its
shareholders that mirrors the baseline analysis in Faulkender and Wang (2006). The results of
estimating this baseline equation for our full sample are reported in column 2 of Panel A of
Table 2 and the results of estimating this baseline equation for our reduced sample are reported
in column 2 of Panel B of Table 2.
Contrary to argument in Sun and Wang (2012) we do not observe a significant difference
in the evidence produced by these two samples, which suggests that the differences that they
observed may be due the valuation model that they used rather than to the samples. Given that
their model assumes that all firms have the same cost of capital, the differences in their results
may be generated by the failure to account for differences between firms in terms of their
response to variation in market returns. Regardless of interpretation, the results from either panel
suggests that like the results in Faulkender and Wang (2006), increases in corporate cash
holdings increases shareholder wealth but at a diminishing rate conditional on the firm’s prior
cash holdings.
With these baseline results, we next turn to the effect of government share ownership on
the value of changes in a firm’s cash holdings. The results addressing this issue are reported in
column 3 of Panel A of Table 2 for the full sample and column 3 of Panel B of Table 2 for the
reduced sample. Again, we find the results produced by the two samples to be very similar. In
both cases, the interaction between changes in corporate cash holdings and government share
ownership is statistically insignificant. These results are inconsistent with the inferences drawn
in either Megginson and Wei (2012) or Sun and Wang (2012). However, consistent with both
papers, we find that shareholder wealth is decreasing in government share ownership. Taken
together these results imply that shareholders value the equity of Chinese corporation less, the
more stock the government holds, but does not condition their valuation of the firm’s cash
holdings based on government’s ownership position.
The difference between our results and Sun and Wang’s evidence, for example, can be
accounted for by the differences between our valuation model and theirs. While we observe the
same negative sign on the interaction between changes in a firm’s cash holdings and
government’s share ownership as Megginson and Wei do, we do not find this coefficient to be
significantly different from zero, as they do. One reason for this difference is there are
differences between their controls and our controls. First, they exclude the R&D expenditures
and net financing variables, which were included in both Faulkender and Wang and our study.
Second, we use the cash paid for interest and dividend off the statement of cash flows rather than
the income statement – which we note above do not match. Consequently differences in controls
likely account for the differences in statistical significance.
Turning to another issue, Sun and Wang point out that Jiang, Lee and Yue (2010) observe
evidence of tunneling in Chinese corporations with a single share class and argue that this
reduces the value of changes in cash holdings. Further they argue that government share
ownership mitigates this problem. Whether this reduces shareholder wealth or affects how
shareholders values changes in corporate cash holdings is unclear from their evidence. We
include the lagged ratio of other receivables (the key proxy from the Jiang, Lee and Yue study)
to the prior year’s market value of equity and its interaction with changes in a firm’s cash
holdings.
These results from estimating regression models that incorporate these additional
variables are reported in column 4 of Panel A of Table 2 for the full sample, and in column 4 of
Panel B of Table 2 for the reduced sample. As before, both samples lead to very similar results.
The reported evidence suggests two conclusions. First, the potential for tunneling significantly
reduces shareholder wealth. However, shareholders do not significantly condition their valuation
of changes in the firm’s cash holdings based on this potential.
Altogether our results are consistent with arguments that the potential for either
government interference in a company’s operations or for a controlling private shareholder to
tunnel resources from the company to another reduces shareholder wealth. However,
shareholders do not appear to significantly condition their valuation of changes in a firm’s cash
holdings on these potentials, which suggests that the reduction in shareholder from government

share ownership works through different channels. For example, shareholders appear to be more
concerned with the potential use of additional cash to benefit debt holders in the firm (the
significant interaction between leverage and changes in cash holdings). This result is particularly
interesting given the role of the government in Chinese capital markets, and particularly its debt
markets.
4.2. The value of working capital management for shareholders
The prior analyses have focused on how shareholders value the cash holdings of Chinese
corporations. We now broaden our view to include how shareholders value other aspects of a
Chinese corporation working capital management practices. To do this, we begin by estimating
a model similar to that used in Kieschnick, LaPlante, and Moussawi (2013) to examine the value
to shareholders of a firm’s use of different components of working capital for U.S. corporations.
To do this, as suggested earlier, we follow their breakdown of working capital into cash (CASH),
accounts receivable (AR), inventories (INV) and accounts payable (AP). We report summary
statistics for the market value of equity scaled versions of the lagged and first difference versions
of these measures in Table 1.
The results of estimating the implied baseline model for the full and reduced samples are
reported in Table 3. Panel A reports the coefficient estimates and the p-values associated with
their marginal significance. Since the results for the cash measure are similar to what we report
in the prior section, we focus on the results for the other elements of a firm’s working capital.
First, prior levels and increases in accounts receivable are associated with reductions in
shareholder wealth. These results contrast with the results in Kieschnick, LaPlante, and
Moussawi (2013) and suggest that shareholders view the extension of trade credit to a firm’s
customer differently in Chinese firms than in U.S. firms. One reason for this difference might be
the use of account receivable to channel funds to sister companies by a controlling shareholder.
Another reason is that shareholders may question how well the firm will collect on its extension
of credit.
Second, prior investments in and increases in investment in inventories are associated
with an increase in shareholder wealth; though at a diminishing rate. This evidence is similar to
the evidence reported in Kieschnick, LaPlante, and Moussawi for U.S. firms. Such evidence
suggests that shareholders view an increase in inventory investment as a signal that the firm
expects an increase in future sales, and thereby cash flows.
Third, while the prior use of trade credit offered by supplier is view positively by outside
shareholders, increases in such financing is not. This evidence is similar to the evidence report
in Kieschnick, LaPlante, and Moussawi for U.S. firms. Interestingly, this evidence suggests that
shareholders view the use of trade credit differently than they view the use of other forms of debt
financing – since increases in prior level of such financing is associated with reduction in
shareholder wealth.
To get a better sense of the economic significance of these components to shareholders,
we use the delta method to estimate the elasticities of shareholder returns to increases in cash
holdings, account receivable, inventories and accounts payable and report these estimates in
Panel B of Table 3. Somewhat consistent with our regression evidence, we find that increases in
a firm’s cash holdings and inventories are associated with increases in shareholder wealth, while
reductions, rather than increases, in their accounts receivable (extensions of trade credit to
customers) are associated with increases in shareholder wealth. Changes in their use of trade
credit provided by suppliers do not appear to have any significant effect on shareholder wealth.
What is particularly interesting about these estimates is that increases in investment in
inventories increase shareholder wealth by about the same magnitude as increases in investment
in cash. This result may reflect the large role of Chinese firms in supplying products for the
supply chain of companies in other economies.
4.3. The effect of government share ownership on the value of working capital to shareholders
The prior analyses provide a baseline for an analysis of how government share ownership
affects the value of working capital to other shareholders. To conduct this analysis, we interact
government share ownership (State) with our change in cash (DCASHM), accounts receivable
(DARM), inventories (DINVM) and trade credit (DAPM) measures. These interactions allow us
to evaluate the effect of government share ownership on how outside shareholders value the
different elements of a Chinese firm’s working capital management practices.
The results from estimating the implied regression model are reported in column 2 of
Panel A of Table 4 for the full sample and in column 4 of Panel A of Table 4 for the reduced
sample. The reported results for either sample are similar and imply that government’s share
ownership does not significantly influence how outside shareholders value the working capital
practices of Chinese firms. These results are consistent with our prior evidence on how state
share ownership influences the valuation of changes in a firm’s cash holdings. Altogether, the
evidence reported in these regressions implies that while government share ownership reduces
shareholder wealth, it does so through different channels.
To evaluate the economic significance of these estimates, we compute the elasticities of
stock returns to changes in a firm’s cash holdings, accounts receivable (extension of trade credit),
inventories, and accounts payable (use of trade credit). The estimates are very similar to the
estimates reported in Panel B of Table 3 and so we will not focus on them. Rather we will focus
on the elasticity of stock returns to state share ownership. The reported estimate suggests that a
1% increase in government share ownership reduces the firm’s stock returns by 0.09%, which is
roughly double the effect that changes in cash holdings or inventories exercise. Put differently,
government share ownership has a large and negative effect on the shareholder wealth of these
companies.
One consideration missing from these analyses that was raised by Sun and Wang’s
evidence is the role of tunneling and how government share ownership might mitigate the
negative consequences of such behavior by a private controlling shareholder. To address this
issue, we create a measure of a firm’s other receivables, which they consider a marker for
tunneling and interact changes in it with our government share ownership variables (State). We
report the results of estimating the implied regression model in column 3 of Panel A of Table 4
for the full sample and in column 5 of Panel A of Table 4 for the reduced sample.
Unlike prior evidence, we do observe more statistically significant evidence of
government ownership mitigating the effects of tunneling in reduced sample than in the full
sample. This difference is consistent with the evidence that government share ownership reduces
the negative consequences of tunneling in Chinese A-share firms in Sun and Wang (2012) as
they also used a reduced sample in their study. One way of interpreting the differences in the
significance of this interaction term in the two samples is that in dual listed firms (Class AB,
ABH, AH) firms, non-domestic investors play a larger role in reducing tunneling than the
government, whereas the government plays a larger role in reducing tunneling in firms with
domestic only investors.
4.4. Robustness Checks
We explored the robustness of our evidence to the following considerations.
Excess returns rather than simple returns as a dependent variable. As noted earlier this
change in how we measure the dependent variable does not change our inferences.
The use of a different measure of market returns. We computed market returns using the
current-value weighted method rather than the total value weighted method and derive also
identical results. We also computed market returns using just traded shares (Class A only).
The use of dividend payments and interest payments off the income statement rather than
the cash flow statement. While this change does not change our key inferences, it does
reduce the fit of our models to the data.
The use of a firm’s value based on the market value of its traded shares (Class A only)
rather than its total shares. As the evidence for the full and reduced sample shows, this does
not change our conclusions.
The use of different industry and time dummies. Again, our evidence appears robust to
these additional fixed effect controls.
5. Conclusions
We have examined the value to shareholders of a Chinese firm’s management of its
working capital, which we take to include its cash holdings, its extension of trade credit
(accounts receivable), its investment in inventories, and its use of trade credit provided by
suppliers using data on Chinese public companies from 1993 to 2012. Using the type of
valuation framework used in Faulkender and Wang (2006) and Kieschnick, LaPlante, and
Moussawi (2013), we find evidence for the following conclusions.
First, we do not think that the differences in results reported Megginson and Wei (2012)
and Sun and Wang (2012) are due to their samples but rather due to differences in the valuation
models that they use.
Second, while we find that coefficient on the interaction between government share
ownership and changes in a firm’s cash holdings to be negative, as in Megginson and Wei (2012),
we do not find it to be significantly so. We conjecture that this is due to our inclusion of controls
missing from their analyses.
Third, in contrast to the evidence for U.S. firms, increases in the extension of trade credit
to their customers do not increase shareholder wealth, but rather reduces it. This evidence is
consistent with the evidence in Jiang, Lee and Yue (2010) which use other receivable scaled by
total assets (ORECTA) to capture tunneling in Chinese corporations. Thus, it appears that
market participants are aware of such behavior and view increases in the extension of trade credit
in a negative light unlike that for U.S. firms.
Fourth, like the evidence for U.S. firms, increases in inventory investment is associated
with increases in shareholder wealth. However, unlike U.S. firms, the magnitude of these
increases is on par with those associated with an increase in cash holdings. Such evidence might
reflect the role of many Chinese firms in the supply chain of foreign companies serving
developed markets.
Fifth, even stronger than in the U.S., the use of trade credit by Chinese firms reduces
shareholders wealth. This evidence is consistent with tunneling through intercorporate loans and
represents the flip side of the evidence for accounts receivable reported. Consequently we
identify another aspect of tunneling unrecognized in prior research on this topic.
Sixth, we find evidence that increases in government share ownership significantly
reduces shareholder wealth on average. There are several potential reasons for this evidence.
For example, government control might reduce workers incentives to work hard and control
costs, which is consistent with prior evidence on the effect of government share ownership on
Chinese firm performance. In addition, such control might influence their long-run investment
decisions. Such a conjecture would be consistent with anecdotal evidence on the push of the
Chinese government to invest in long-run projects and some of their disastrous consequences.
Nevertheless, we do find evidence that government ownership does appear to reduce the
negative effect of tunneling through other receivables in domestic investor only firms, it does not
do so in firms with non-domestic investors. We interpret this evidence as implying government
ownership reduces tunneling in firms only open to domestic investors while non-domestic
investors play a role in mitigating such behavior in dual listed firms.
References
Altman, E. (1968) Financial Ratios, Discriminant Analysis and the Prediction of Corporate Bankruptcy, Journal of Finance 23, 189–209.
Altman, E. (2000) Predicting Financial Distress of Companies: Revisiting the Z-score and Zeta Models, working paper, http://pages.stern.nyu.edu/~ealtman/Zscores.pdf .
Asquith, P., Gertner, R., and Scharfstein, D. (1994) Anatomy of Financial Distress: An Examination of Junk-Bond Issuers, Quarterly Journal of Economics 109, 625-658.
Autukaite, R. and E. Molay, E. (2011) Cash Holdings, Working Capital and Firm Value: Evidence from France, working paper, SSRN: http://ssrn.com/abstract=1836900 .
Bai, Chong-En, Liu, Qiao, Lu, Joe, Song, Frank M., and Zhang, Junxi. (2004) Corporate governance and market valuation in China. Journal of Comparative Economics 32, 599–616.
Berk, J. and van Binsbergen, J. (2013) Assessing Asset Pricing Models Using Revealed Preference, SSRN: http://ssrn.com/abstract=2340784 .
Beranek, W. (1967) Financial Implications of Lot-Size Inventory Models, Management Science 13, B401-B408.
Blanchard, O. and Shleifer, A. (2001) Federalism with and without political centralization: China versus Russia. IMF Staff Working Papers, Special Issue.
Brigham, E. and Daves, P. (2007) Intermediate Financial Management, 9th edition, Mason, OH: Thomson Learning.
Carpenter, R., Fazzari,S., and Petersen, B. (1998) Financing Constraints and Inventory Investment: A Comparative Study with High-Frequency Panel Data, Review of Economics and Statistics, 513-519.
Corsten, D. and T. Gruen, T. (2004) Stock-Outs Cause Walkouts,” Harvard Business Review 82, 26-28.
Daniel, K. and Titman, E. (1997) Evidence on the Characteristics of Cross Sectional Variation in Stock Returns, Journal of Finance 52, 1-33.
Danielson, M. and Scott, J. (2004) Bank Loan Availability and Trade Credit Demand, Financial Review 39, 579-600.
Deloof, M. (2003) Does Working Capital Management Affect Profitability of Belgian Firms?, Journal of Business Finance and Accounting 30, 573-587.
Dittmar, A. and Mahrt-Smith, J. (2007) Corporate governance and the value of cash holdings, Journal of Financial Economics 83, 599-634.
Dybvig, P. and M. Warachka (2012) Tobin’s q Does Not Measure Firm Performance: Theory, Empirics, and Alternative Measures, SSRN: http://ssrn.com/abstract=1562444.
Ehrhardt, M. and Brigham, E. (2009) Corporate Finance: A Focused Approach, 3rd edition, Mason, OH: South-Western.
Fama, E. and French, K. (1998) Taxes, Financing Decisions, and Firm Value, Journal of Finance 53, 819-843.
Fama, E. and French, K. (1997) Industry cost of equity, Journal of Financial Economics 43, 153-193.
Fana Joseph P.H., Wonga T.J. and Zhang Tianyu. (2007) Politically connected CEOs, corporate governance, and Post-IPO performance of China’s newly partially privatized firms. Journal of Financial Economics 84, 330–357
Faulkender, M. and Wang, R. (2006) Corporate Financial Policy and the Value of Cash, Journal of Finance 61, 1957-1990.
Fazzari, S. and Petersen, B. (1993) Working capital and fixed investment: new evidence on financing constraints, RAND Journal of Economics 24, 328-342.
Firth Michael, Lin Chen, Liu Ping and Wong Sonia M.L. (2009) Inside the black box: Bank credit allocation in China’s private sector. Journal of Banking & Finance 33, 1144–1155
Garcia-Teruel, P. and Martinez-Solano, P. (2007) Effects of working capital management on SME profitability, International Journal of Managerial Finance 3, 164-177.
Gitman, L. (1974) Estimating Corporate Liquidity Requirements: A Simplified Approach, Financial Review 9, 79-88.
Hadlock, C. and Pierce, J. (2010) New Evidence on Measuring Financial Constraints: Moving Beyond the KZ Index, The Review of Financial Studies 23, 1909-1940.
Haley, C. and Higgins, R. (1973) Inventory Policy and Trade Credit Financing, Management Science 20, 464-471.
Hill, M., Kelly, G., and Highfield, M. (2010) Net Operating Working Capital Behavior: A First Look, Financial Management 39, 783-805.
ITworld.com (2002), Poor capital management costs industry billions, http://www.itworld.com/Man/4215/020614capitalmgmt/pfindex.htm (6/14/02).
Jensen, M. (1986) Agency Costs of Free Cash Flow, Corporate Finance, and Takeovers, American Economic Review 76, 323-329.
Jiang, G., C. Lee, and H. Yue. (2010) Tunneling through intercorporate loans: The China experience. Journal of Financial Economics 98, 1-20.
Kieschnick, R., LaPlante, M., and Moussawi, R. (2013), Working Capital Management and Shareholder Wealth, Review of Finance 17, 1827-1852.
Kim, Y. and Chung, K. (1990) An Integrated Evaluation of Investment in Inventory and Credit: A Cash Flow Approach, Journal of Business Finance and Accounting 17, 381-390.
Lewellen, W., McConnell, J., and Scott, J. (1980) Capital Market Influences on Trade Credit Practices, Journal of Financial Research, 105-14.
Li, Kai, Yue, Heng, and Zhao, Longkai. (2009) Ownership, institutions, and capital structure: Evidence from China. Journal of Comparative Economics 37, 471–490.
Lin, J. , M. Wang, and L. Cai. (2012) Are the Fama-French factors good proxies for latent risk factors? Evidence from the data of SHSE in China. Economic Letters 116, 265-268.
Megginson, W. and Z. Wei (2012) State Ownership, Soft-Budget Constraint and Cash Holdings: Evidence from China’s Privatized Firms, http://ssrn.com/abstract=1652860.
Meltzer, A. (1960) Mercantile Credit, Monetary Policy, and Size of Firms, Review of Economics and Statistics 42, 429-437.
Molina, C. and Preve, L., (2009) Trade Receivables Policy of Distressed Firms and Its Effect on the Costs of Financial Distress, Financial Management 38, 663-686.
Petersen, M. and Rajan, R. (1997) Trade Credit: Theories and Evidence, Review of Financial Studies 10, 661-691.
Preve, L. and Sarria-Allende, V. (2010) Working Capital Management, Financial Management Association: Survey and Synthesis Series, Oxford University Press.
Qi Daqing, Wu Woody and Zhang Hua. (2000) Shareholding structure and corporate performance of partially privatized firms: Evidence from listed Chinese companies. Pacific-Basin Finance Journal. 8, 587–610
REL Consultancy (2005), REL 2005 Working Capital Survey, http://www.relconsult.com/CFO;jsessionid=CA3EDDA21398FB627617D2345C115D07
Richards, V. and Laughlin, E. (1980) A Cash Conversion Cycle Approach to Liquidity Analysis, Financial Management 9, 32-38.
Sartoris, W. and Hill, N. (1983) A Generalized Cash Flow Approach to Short-Term Financial Decisions, Journal of Finance 38, 349-360.
Schiff, M. and Lieber, Z. (1974) A Model for the Integration of Credit and Inventory Management, Journal of Finance 29, 133-140.
Shin, H. and Soenen, L. (1998) Efficiency of Working Capital Management and Corporate Profitability, Financial Practice and Education 8, 37-45.
Shleifer, A., Vishny, R., 1998. The Grabbing Hand: Government Pathologies and Their Cures. Harvard Univ. Press, Cambridge, MA.
Soenen, L. (1993) Cash conversion cycle and corporate profitability, Journal of Cash Management 13, 53-58.
Su Dongwei. (2005) Corporate finance and state enterprise reform in China. China Economic Review, 16, 118– 148.
Sun, Z. and Y. Wang (2012) Does Ownership Structure Matter? Evidence from the Excess Cash in China, http://ssrn.com/abstract=1787360.
Tian Lihui and Estrinb Saul. (2008) Retained state shareholding in Chinese PLCs: Does government ownership always reduce corporate value? Journal of Comparative Economics 36, 74–89
Wadsworth, G. and Bryan, J. (1974) Applications of Probability and Random Variables, 2nd edtion, New York: McGraw-Hill.
Wang, Changyun. (2005). Ownership and operating performance of Chinese IPOs. Journal of Banking and Finance 29 (9), 467–488.
Wei Gang. (2007) Ownership Structure, Corporate Governance and Company Performance in China. Asia Pacific Business Review 13, 519-545
Wei Zuobao, Xie Feixue and Zhang Shaorong. (2005) Ownership Structure and Firm Value in China’s Privatized Firms: 1991–2001. Journal of Financial and Quantitative Analysis. 40, 87-108
Xu Xiaonian and Wang Yan. (1999) Ownership structure and corporate governance in Chinese stock companies. China Economic Review 10, 75–98
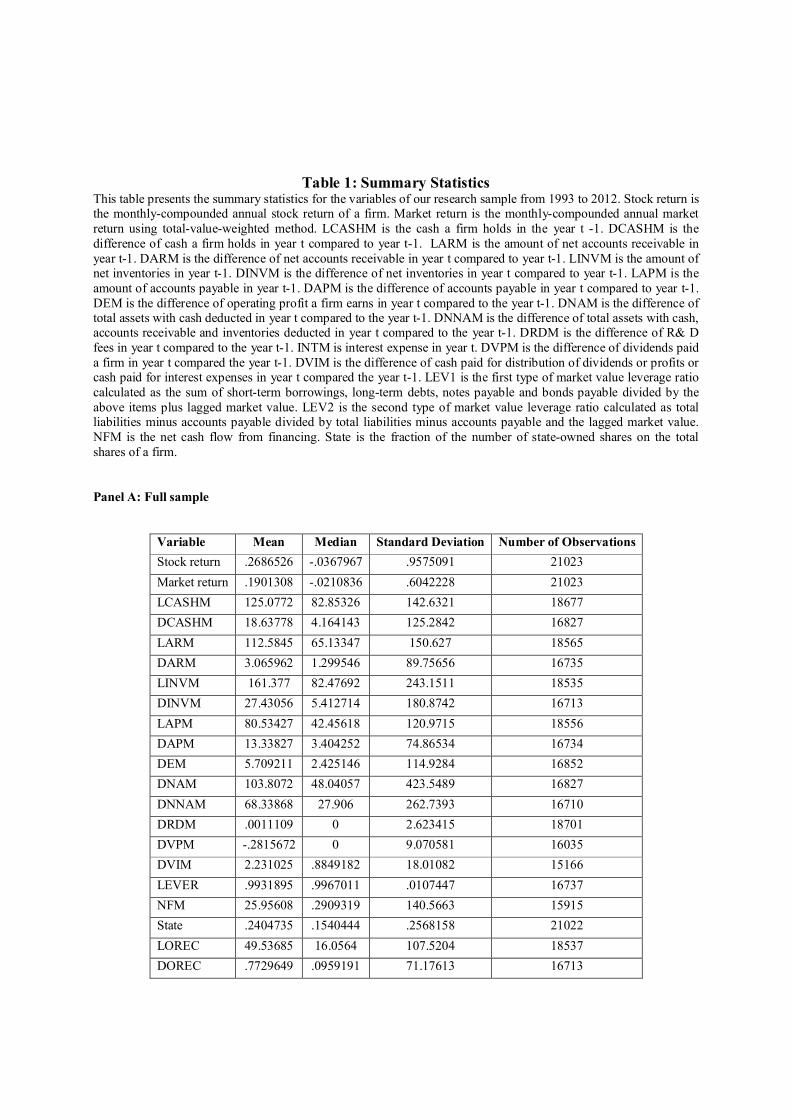
Table 1: Summary Statistics This table presents the summary statistics for the variables of our research sample from 1993 to 2012. Stock return is the monthly-compounded annual stock return of a firm. Market return is the monthly-compounded annual market return using total-value-weighted method. LCASHM is the cash a firm holds in the year t -1. DCASHM is the difference of cash a firm holds in year t compared to year t-1. LARM is the amount of net accounts receivable in year t-1. DARM is the difference of net accounts receivable in year t compared to year t-1. LINVM is the amount of net inventories in year t-1. DINVM is the difference of net inventories in year t compared to year t-1. LAPM is the amount of accounts payable in year t-1. DAPM is the difference of accounts payable in year t compared to year t-1. DEM is the difference of operating profit a firm earns in year t compared to the year t-1. DNAM is the difference of total assets with cash deducted in year t compared to the year t-1. DNNAM is the difference of total assets with cash, accounts receivable and inventories deducted in year t compared to the year t-1. DRDM is the difference of R& D fees in year t compared to the year t-1. INTM is interest expense in year t. DVPM is the difference of dividends paid a firm in year t compared the year t-1. DVIM is the difference of cash paid for distribution of dividends or profits or cash paid for interest expenses in year t compared the year t-1. LEV1 is the first type of market value leverage ratio calculated as the sum of short-term borrowings, long-term debts, notes payable and bonds payable divided by the above items plus lagged market value. LEV2 is the second type of market value leverage ratio calculated as total liabilities minus accounts payable divided by total liabilities minus accounts payable and the lagged market value. NFM is the net cash flow from financing. State is the fraction of the number of state-owned shares on the total shares of a firm. Panel A: Full sample
Variable Mean Median Standard Deviation Number of Observations Stock return .2686526 -.0367967 .9575091 21023 Market return .1901308 -.0210836 .6042228 21023 LCASHM 125.0772 82.85326 142.6321 18677 DCASHM 18.63778 4.164143 125.2842 16827 LARM 112.5845 65.13347 150.627 18565 DARM 3.065962 1.299546 89.75656 16735 LINVM 161.377 82.47692 243.1511 18535 DINVM 27.43056 5.412714 180.8742 16713 LAPM 80.53427 42.45618 120.9715 18556 DAPM 13.33827 3.404252 74.86534 16734 DEM 5.709211 2.425146 114.9284 16852 DNAM 103.8072 48.04057 423.5489 16827 DNNAM 68.33868 27.906 262.7393 16710 DRDM .0011109 0 2.623415 18701 DVPM -.2815672 0 9.070581 16035 DVIM 2.231025 .8849182 18.01082 15166 LEVER .9931895 .9967011 .0107447 16737 NFM 25.95608 .2909319 140.5663 15915 State .2404735 .1540444 .2568158 21022 LOREC 49.53685 16.0564 107.5204 18537 DOREC .7729649 .0959191 71.17613 16713
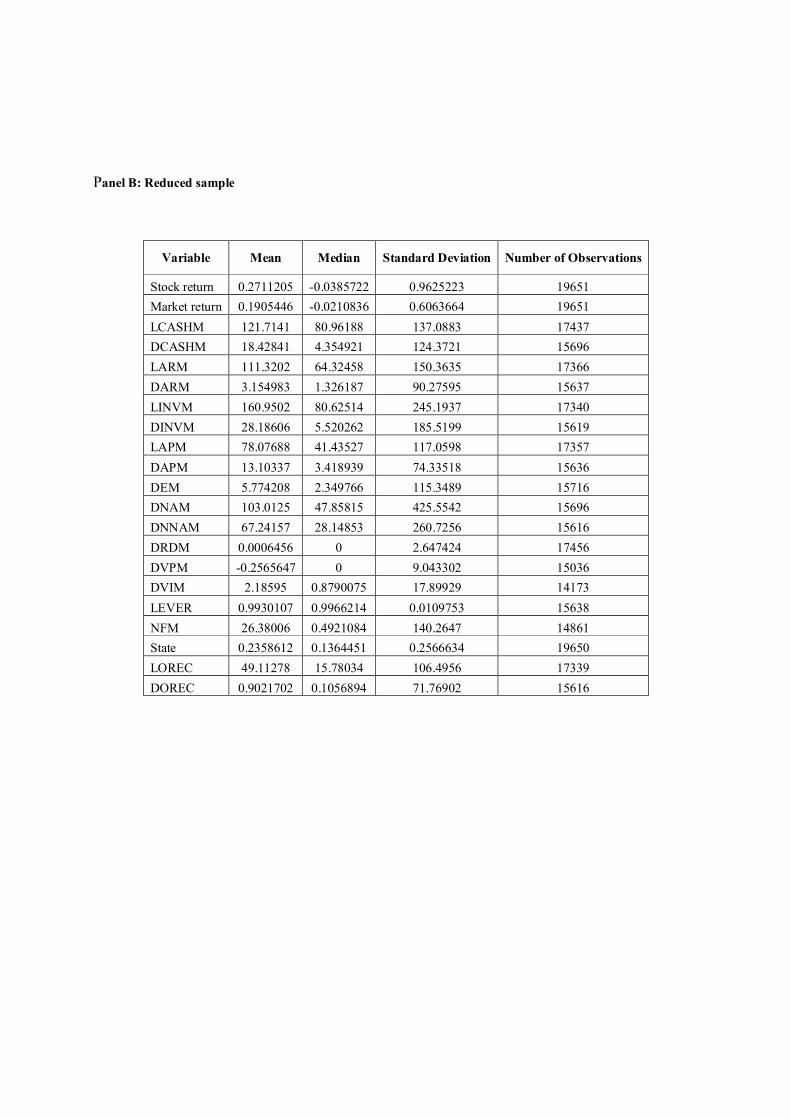
Panel B: Reduced sample
Variable Mean Median Standard Deviation Number of Observations
Stock return 0.2711205 -0.0385722 0.9625223 19651 Market return 0.1905446 -0.0210836 0.6063664 19651 LCASHM 121.7141 80.96188 137.0883 17437 DCASHM 18.42841 4.354921 124.3721 15696 LARM 111.3202 64.32458 150.3635 17366 DARM 3.154983 1.326187 90.27595 15637 LINVM 160.9502 80.62514 245.1937 17340 DINVM 28.18606 5.520262 185.5199 15619 LAPM 78.07688 41.43527 117.0598 17357 DAPM 13.10337 3.418939 74.33518 15636 DEM 5.774208 2.349766 115.3489 15716 DNAM 103.0125 47.85815 425.5542 15696 DNNAM 67.24157 28.14853 260.7256 15616 DRDM 0.0006456 0 2.647424 17456 DVPM -0.2565647 0 9.043302 15036 DVIM 2.18595 0.8790075 17.89929 14173 LEVER 0.9930107 0.9966214 0.0109753 15638 NFM 26.38006 0.4921084 140.2647 14861 State 0.2358612 0.1364451 0.2566634 19650 LOREC 49.11278 15.78034 106.4956 17339 DOREC 0.9021702 0.1056894 71.76902 15616

Table 2: Shareholder Valuation of Cash Management This table presents evidence on the value of cash management for shareholders. This table presents the regression results of short-term financial management. Stock return is dependent variable which is the monthly-compounded annual stock return. All other variables are defined in Appendix A. XXX_YYY represents the interaction between XXX and YYY. Standard errors were estimated as robust standard errors with clustering at the firm level. P values associated with the null that a coefficient equal zero are reported within parenthesis. Panel A: Full Sample
Stock return Stock return Stock return Market return 1.082 1.081 1.086 (0.000) (0.000) (0.000) LCASHM 0.000138 0.000137 0.000137 (0.002) (0.002) (0.002) DCASHM 0.0513 0.0516 0.0495 (0.002) (0.002) (0.004) DCASHM_LCASHM -0.000000268 -0.000000278 -0.000000223 (0.000) (0.000) (0.039) DCASHM_LEVER -0.0506 -0.0509 -0.0488 (0.003) (0.003) (0.005) DCASHM_State -0.000152 -0.000133 (0.730) (0.755) DCASHM_LOREC -0.000000169 (0.722) State -0.134 -0.132 (0.000) (0.000) LOREC -0.000291 (0.000) LEVER 0.225 0.349 0.819* (0.522) (0.303) (0.022) DEM 0.000666 0.000658 0.000686 (0.000) (0.000) (0.000) DNAM 0.000135 0.000138 0.000127 (0.000) (0.000) (0.001) DRDM 0.00491 0.00479 0.00478 (0.258) (0.249) (0.247) DVIM -0.000298 -0.000262 -0.000328 (0.489) (0.538) (0.437) NFM -0.0000414 -0.0000429 -0.0000601 (0.620) (0.600) (0.459) Constant -0.208 -0.297 -0.750 (0.550) (0.374) (0.033) R2 0.60 0.60 0.60 (0.000) (0.000) (0.000) N 15042 15042 15024
Panel B: Reduced Sample
Stock return Stock return Stock return Market return 1.083 1.082 1.088 (0.000) (0.000) (0.000) LCASHM 0.000138 0.000137 0.000143 (0.005) (0.005) (0.004) DCASHM 0.0539 0.0544 0.0523 (0.002) (0.001) (0.002) DCASHM_LCASHM -0.000000265 -0.000000277 -0.000000207 (0.000) (0.000) (0.063) DCASHM_LEVER -0.0533 -0.0537 -0.0517 (0.002) (0.002) (0.003) DCASHM_State -0.000169 -0.000150 (0.704) (0.726) DCASHM_LOREC -0.000000225 (0.647) State -0.142 -0.141 (0.000) (0.000) LOREC -0.000333 (0.000) LEVER 0.293 0.408 0.926 (0.415) (0.236) (0.011) DEM 0.000644 0.000636 0.000672 (0.000) (0.000) (0.000) DNAM 0.000140 0.000143 0.000131 (0.001) (0.000) (0.001) DRDM 0.00539 0.00529 0.00526 (0.255) (0.245) (0.244) DVIM -0.000210 -0.000167 -0.000229 (0.646) (0.713) (0.609) NFM -0.0000308 -0.0000302 -0.0000460 (0.726) (0.726) (0.592) Constant -0.273 -0.353 -0.852 (0.440) (0.299) (0.017) R2 0.60 0.60 0.60 N 14086 14086 14074
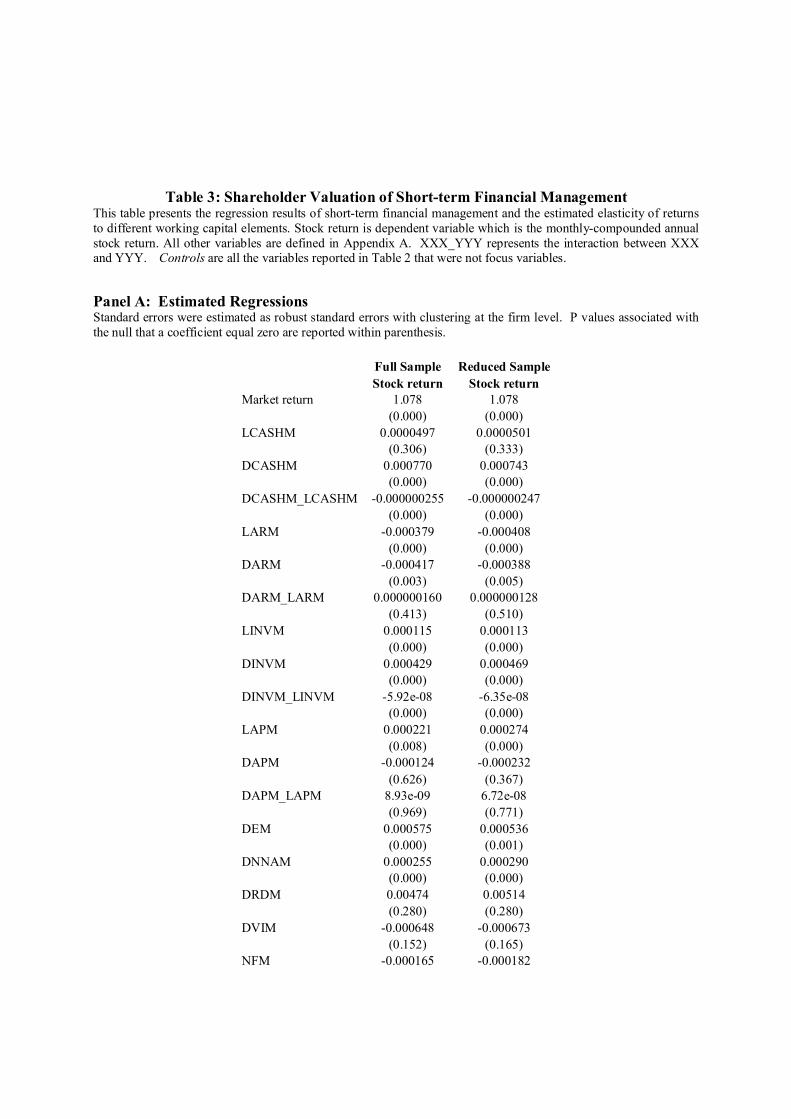
Table 3: Shareholder Valuation of Short-term Financial Management
This table presents the regression results of short-term financial management and the estimated elasticity of returns to different working capital elements. Stock return is dependent variable which is the monthly-compounded annual stock return. All other variables are defined in Appendix A. XXX_YYY represents the interaction between XXX and YYY. Controls are all the variables reported in Table 2 that were not focus variables.
Panel A: Estimated Regressions Standard errors were estimated as robust standard errors with clustering at the firm level. P values associated with the null that a coefficient equal zero are reported within parenthesis.
Full Sample Reduced Sample Stock return Stock return Market return 1.078 1.078 (0.000) (0.000) LCASHM 0.0000497 0.0000501 (0.306) (0.333) DCASHM 0.000770 0.000743 (0.000) (0.000) DCASHM_LCASHM -0.000000255 -0.000000247 (0.000) (0.000) LARM -0.000379 -0.000408 (0.000) (0.000) DARM -0.000417 -0.000388 (0.003) (0.005) DARM_LARM 0.000000160 0.000000128 (0.413) (0.510) LINVM 0.000115 0.000113 (0.000) (0.000) DINVM 0.000429 0.000469 (0.000) (0.000) DINVM_LINVM -5.92e-08 -6.35e-08 (0.000) (0.000) LAPM 0.000221 0.000274 (0.008) (0.000) DAPM -0.000124 -0.000232 (0.626) (0.367) DAPM_LAPM 8.93e-09 6.72e-08 (0.969) (0.771) DEM 0.000575 0.000536 (0.000) (0.001) DNNAM 0.000255 0.000290 (0.000) (0.000) DRDM 0.00474 0.00514 (0.280) (0.280) DVIM -0.000648 -0.000673 (0.152) (0.165) NFM -0.000165 -0.000182

(0.073) (0.065) LEVER 0.229 0.249 (0.552) (0.526) Constant -0.199 -0.220 (0.598) (0.570) R2 0.61 0.61 N 15027 14076
Panel B: Estimated Elasticities of Working Capital Variables
The elasticities were estimated using the delta method. P values associated with z-tests of whether they are significantly different from zero are reported in a separate column.
Full sample Reduced sample ey/ex P>z ey/ex P>z DCASHM 0.049 0.00 0.046 0.00 DARM -0.001 0.00 -0.001 0.01 DINVM 0.040 0.00 0.045 0.00 DAPM -0.006 0.63 -0.011 0.37
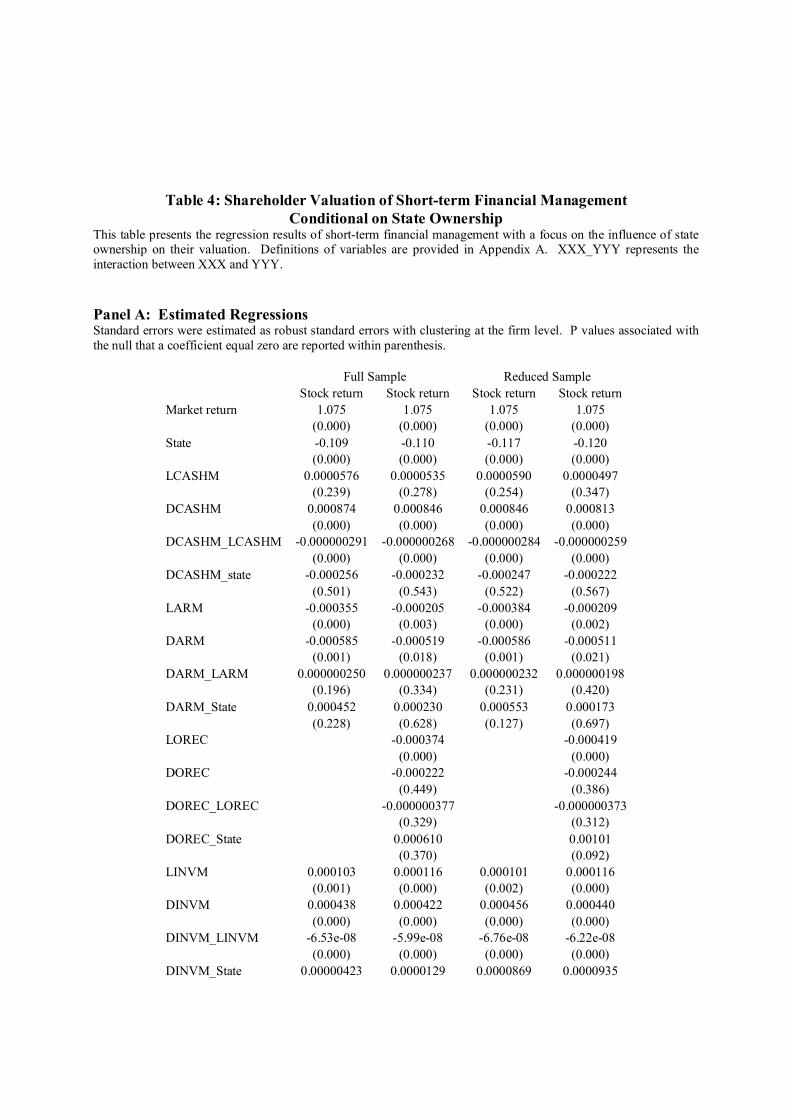
Table 4: Shareholder Valuation of Short-term Financial Management
Conditional on State Ownership This table presents the regression results of short-term financial management with a focus on the influence of state ownership on their valuation. Definitions of variables are provided in Appendix A. XXX_YYY represents the interaction between XXX and YYY.
Panel A: Estimated Regressions Standard errors were estimated as robust standard errors with clustering at the firm level. P values associated with the null that a coefficient equal zero are reported within parenthesis.
Full Sample Reduced Sample Stock return Stock return Stock return Stock return Market return 1.075 1.075 1.075 1.075 (0.000) (0.000) (0.000) (0.000) State -0.109 -0.110 -0.117 -0.120 (0.000) (0.000) (0.000) (0.000) LCASHM 0.0000576 0.0000535 0.0000590 0.0000497 (0.239) (0.278) (0.254) (0.347) DCASHM 0.000874 0.000846 0.000846 0.000813 (0.000) (0.000) (0.000) (0.000) DCASHM_LCASHM -0.000000291 -0.000000268 -0.000000284 -0.000000259 (0.000) (0.000) (0.000) (0.000) DCASHM_state -0.000256 -0.000232 -0.000247 -0.000222 (0.501) (0.543) (0.522) (0.567) LARM -0.000355 -0.000205 -0.000384 -0.000209 (0.000) (0.003) (0.000) (0.002) DARM -0.000585 -0.000519 -0.000586 -0.000511 (0.001) (0.018) (0.001) (0.021) DARM_LARM 0.000000250 0.000000237 0.000000232 0.000000198 (0.196) (0.334) (0.231) (0.420) DARM_State 0.000452 0.000230 0.000553 0.000173 (0.228) (0.628) (0.127) (0.697) LOREC -0.000374 -0.000419 (0.000) (0.000) DOREC -0.000222 -0.000244 (0.449) (0.386) DOREC_LOREC -0.000000377 -0.000000373 (0.329) (0.312) DOREC_State 0.000610 0.00101 (0.370) (0.092) LINVM 0.000103 0.000116 0.000101 0.000116 (0.001) (0.000) (0.002) (0.000) DINVM 0.000438 0.000422 0.000456 0.000440 (0.000) (0.000) (0.000) (0.000) DINVM_LINVM -6.53e-08 -5.99e-08 -6.76e-08 -6.22e-08 (0.000) (0.000) (0.000) (0.000) DINVM_State 0.00000423 0.0000129 0.0000869 0.0000935

(0.986) (0.958) (0.721) (0.702) LAPM 0.000205* 0.000147 0.000257 0.000183 (0.014) (0.087) (0.001) (0.028) DAPM 0.000236 0.000227 0.000214 0.000199 (0.283) (0.305) (0.352) (0.389) DAPM_LAPM -0.000000173 -0.000000184 -0.000000156 -0.000000160 (0.414) (0.388) (0.476) (0.467) DAPM_State -0.00117 -0.00114 -0.00153 -0.00146 (0.054) (0.064) (0.005) (0.008) (0.553) (0.269) (0.549) (0.252) Controls *** *** *** *** R2 0.61 0.61 0.61 0.61 N 15027 15021 14076 14071
Panel B: Estimated Elasticities of Working Capital Variables The elasticities were estimated using the delta method. P values associated with z-tests of whether they are significantly different from zero are reported in a separate column.
Full Reduced ey/ex P>z ey/ex P>z State -0.091 0.00 -0.097 0.00 DCASHM 0.053 0.00 0.050 0.00 DARM -0.001 0.02 -0.001 0.02 DINVM 0.040 0.00 0.042 0.00 DAPM 0.011 0.31 0.009 0.39
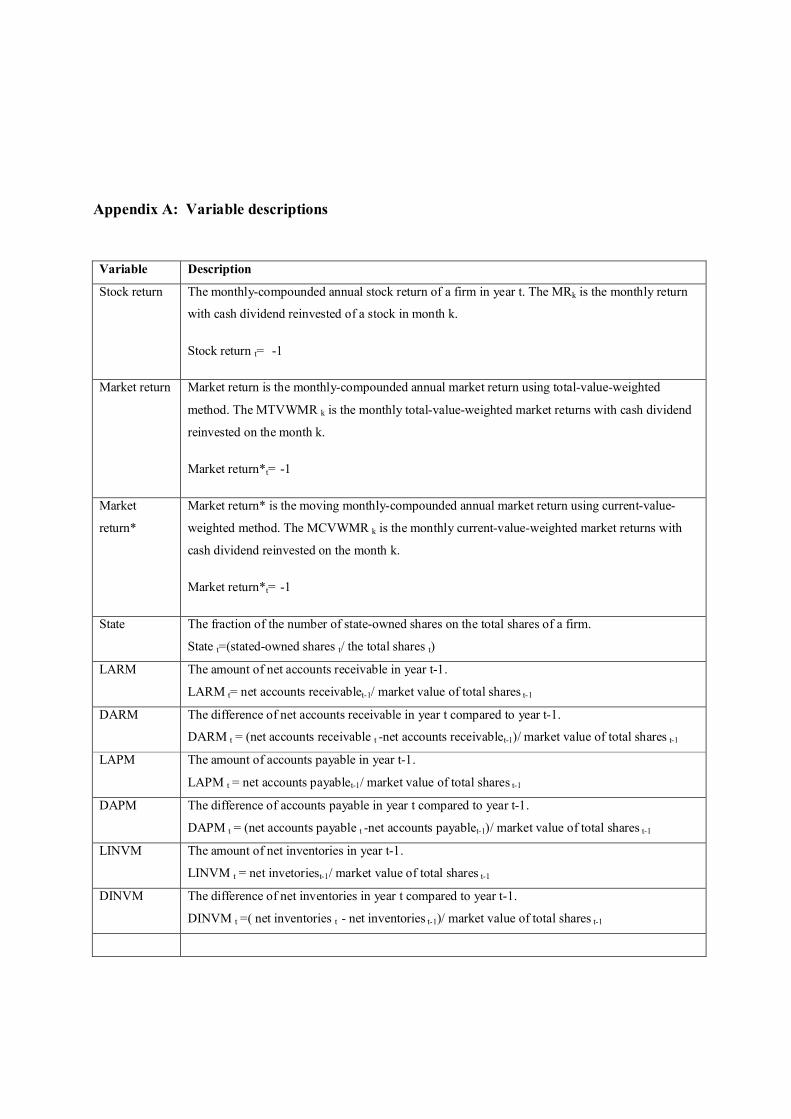
Appendix A: Variable descriptions
Variable Description
Stock return The monthly-compounded annual stock return of a firm in year t. The MRk is the monthly return
with cash dividend reinvested of a stock in month k.
Stock return t= -1
Market return Market return is the monthly-compounded annual market return using total-value-weighted
method. The MTVWMR k is the monthly total-value-weighted market returns with cash dividend
reinvested on the month k.
Market return*t= -1
Market
return*
Market return* is the moving monthly-compounded annual market return using current-value-
weighted method. The MCVWMR k is the monthly current-value-weighted market returns with
cash dividend reinvested on the month k.
Market return*t= -1
State The fraction of the number of state-owned shares on the total shares of a firm.
State t=(stated-owned shares t/ the total shares t)
LARM The amount of net accounts receivable in year t-1.
LARM t= net accounts receivablet-1/ market value of total shares t-1
DARM The difference of net accounts receivable in year t compared to year t-1.
DARM t = (net accounts receivable t -net accounts receivablet-1)/ market value of total shares t-1
LAPM The amount of accounts payable in year t-1.
LAPM t = net accounts payablet-1/ market value of total shares t-1
DAPM The difference of accounts payable in year t compared to year t-1.
DAPM t = (net accounts payable t -net accounts payablet-1)/ market value of total shares t-1
LINVM The amount of net inventories in year t-1.
LINVM t = net invetoriest-1/ market value of total shares t-1
DINVM The difference of net inventories in year t compared to year t-1.
DINVM t =( net inventories t - net inventories t-1)/ market value of total shares t-1
LCASHM The lagged value of a firm’s cash holdings scaled by the market value of its total sharest-1
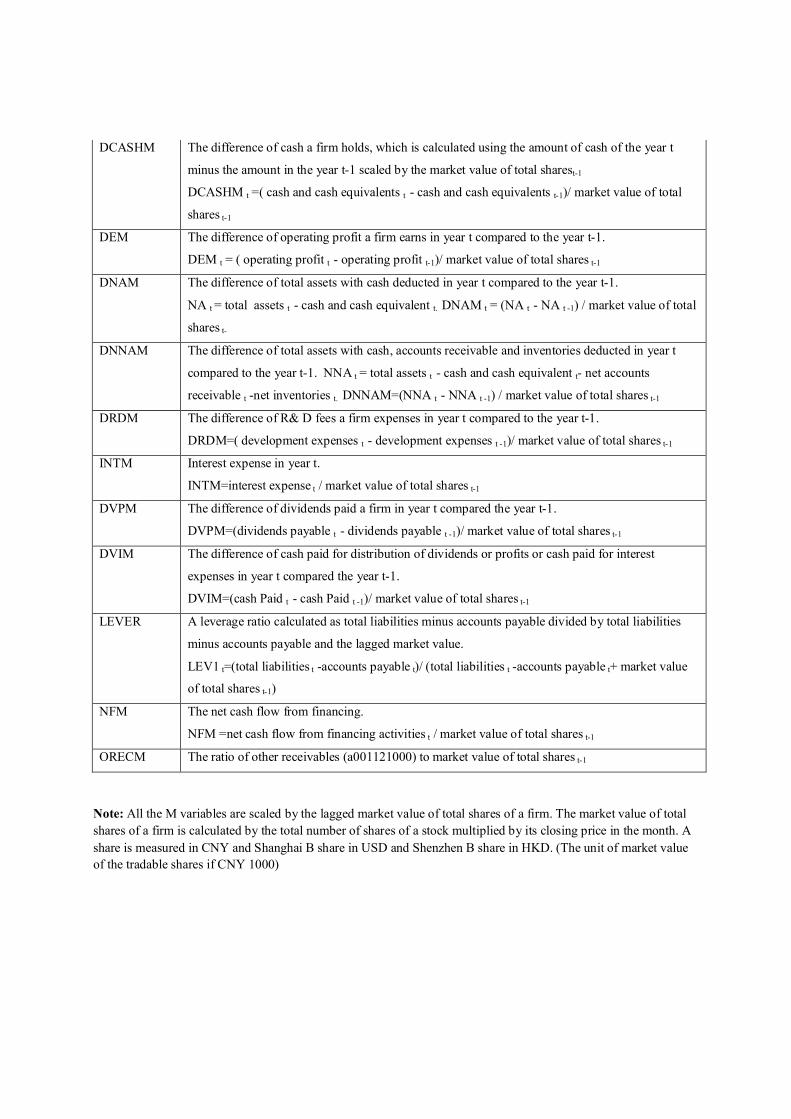
DCASHM The difference of cash a firm holds, which is calculated using the amount of cash of the year t
minus the amount in the year t-1 scaled by the market value of total sharest-1
DCASHM t =( cash and cash equivalents t - cash and cash equivalents t-1)/ market value of total
shares t-1
DEM The difference of operating profit a firm earns in year t compared to the year t-1.
DEM t = ( operating profit t - operating profit t-1)/ market value of total shares t-1
DNAM The difference of total assets with cash deducted in year t compared to the year t-1.
NA t = total assets t - cash and cash equivalent t. DNAM t = (NA t - NA t -1) / market value of total
shares t-
DNNAM The difference of total assets with cash, accounts receivable and inventories deducted in year t
compared to the year t-1. NNA t = total assets t - cash and cash equivalent t- net accounts
receivable t -net inventories t. DNNAM=(NNA t - NNA t -1) / market value of total shares t-1
DRDM The difference of R& D fees a firm expenses in year t compared to the year t-1.
DRDM=( development expenses t - development expenses t -1)/ market value of total shares t-1
INTM Interest expense in year t.
INTM=interest expense t / market value of total shares t-1
DVPM The difference of dividends paid a firm in year t compared the year t-1.
DVPM=(dividends payable t - dividends payable t -1)/ market value of total shares t-1
DVIM The difference of cash paid for distribution of dividends or profits or cash paid for interest
expenses in year t compared the year t-1.
DVIM=(cash Paid t - cash Paid t -1)/ market value of total shares t-1
LEVER A leverage ratio calculated as total liabilities minus accounts payable divided by total liabilities
minus accounts payable and the lagged market value.
LEV1 t=(total liabilities t -accounts payable t)/ (total liabilities t -accounts payable t+ market value
of total shares t-1)
NFM The net cash flow from financing.
NFM =net cash flow from financing activities t / market value of total shares t-1
ORECM The ratio of other receivables (a001121000) to market value of total shares t-1
Note: All the M variables are scaled by the lagged market value of total shares of a firm. The market value of total shares of a firm is calculated by the total number of shares of a stock multiplied by its closing price in the month. A share is measured in CNY and Shanghai B share in USD and Shenzhen B share in HKD. (The unit of market value of the tradable shares if CNY 1000)