Working Capital Analytics Overview - Community Archive · PDF file ·...
32
Working Capital Analytics Overview SAP Business Suite – Application Innovation March 2015
Transcript of Working Capital Analytics Overview - Community Archive · PDF file ·...
Working Capital Analytics
Overview
SAP Business Suite – Application Innovation
March 2015
© 2015 SAP SE or an SAP affiliate company. All rights reserved. 2
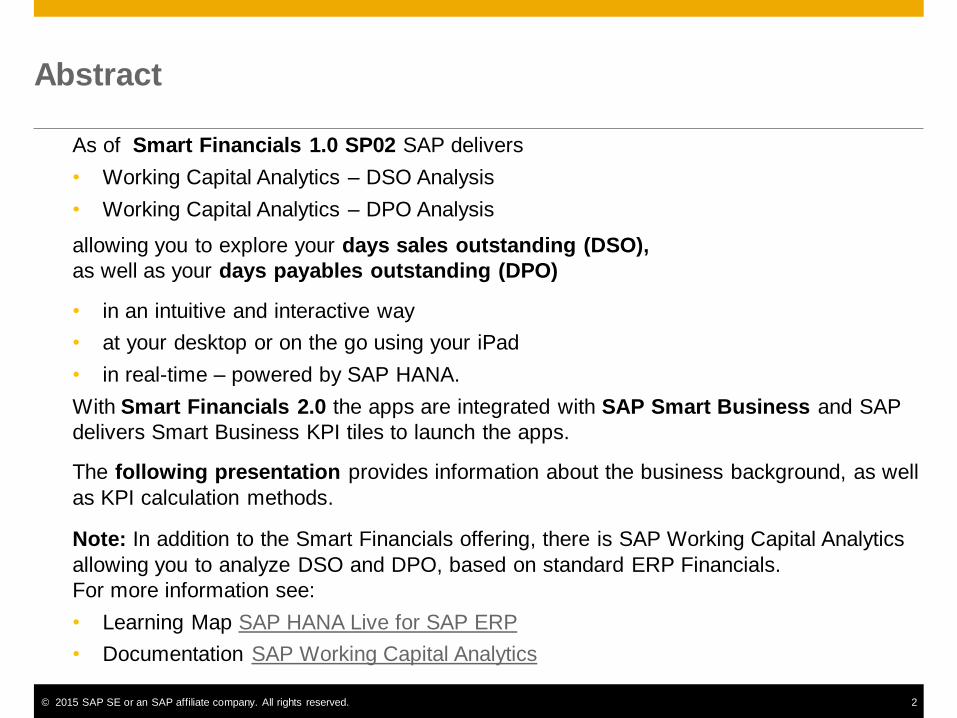
As of Smart Financials 1.0 SP02 SAP delivers
• Working Capital Analytics – DSO Analysis
• Working Capital Analytics – DPO Analysis
allowing you to explore your days sales outstanding (DSO),
as well as your days payables outstanding (DPO)
• in an intuitive and interactive way
• at your desktop or on the go using your iPad
• in real-time – powered by SAP HANA.
With Smart Financials 2.0 the apps are integrated with SAP Smart Business and SAP
delivers Smart Business KPI tiles to launch the apps.
The following presentation provides information about the business background, as well
as KPI calculation methods.
Note: In addition to the Smart Financials offering, there is SAP Working Capital Analytics
allowing you to analyze DSO and DPO, based on standard ERP Financials.
For more information see:
• Learning Map SAP HANA Live for SAP ERP
• Documentation SAP Working Capital Analytics
Abstract

© 2015 SAP SE or an SAP affiliate company. All rights reserved. 3
Agenda
Introduction Working Capital Analytics
Overview Working Capital Analytics – DSO Analysis
Overview Working Capital Analytics – DPO Analysis
DSO/ DPO Calculation Working Capital Analytics
Overview calculation methods – example DSO
Calculation formulas Working Capital Analytics – DSO Analysis
Calculation formulas Working Capital Analytics – DPO Analysis
Summary calculation methods

Introduction Working Capital Analytics

© 2015 SAP SE or an SAP affiliate company. All rights reserved. 5
Working Capital Analytics
Definition of Working Capital
= Current Assets – Current Liabilities A measure of both a company's efficiency and
its short-term financial health.
Inventory
Accounts
Receivable
Cash
Other Liquid
Assets
Accounts
Payable
Wo
rkin
g C
ap
ita
l
Cu
rre
nt
As
se
ts
Other Short
Term
Liabilities
Cu
rre
nt
Lia
bil
itie
s
Working Capital
Represents the value of all assets that are
reasonably expected to be converted into cash
within one year in the normal course of
business.
Current Assets
Current Liabilities
A company's debts or obligations that are due
within one year.
© 2015 SAP SE or an SAP affiliate company. All rights reserved. 6
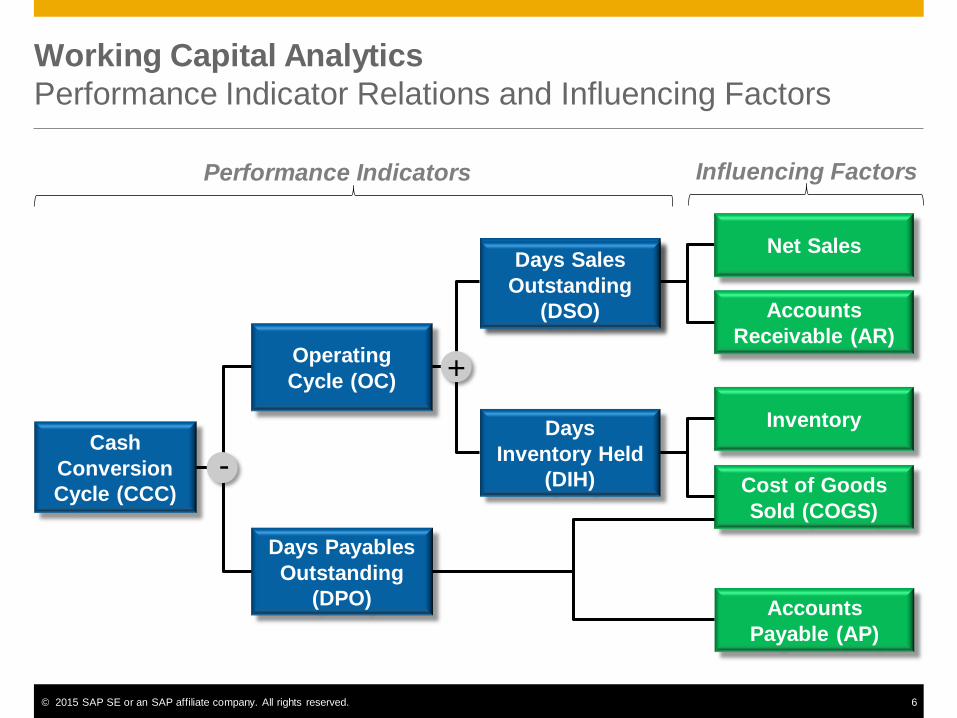
Working Capital Analytics
Performance Indicator Relations and Influencing Factors
Cash
Conversion
Cycle (CCC)
Days Sales
Outstanding
(DSO)
Days
Inventory Held
(DIH)
Days Payables
Outstanding
(DPO)
Inventory
Cost of Goods
Sold (COGS)
Net Sales
Accounts
Receivable (AR)
Accounts
Payable (AP)
Operating
Cycle (OC)
Influencing Factors Performance Indicators
+
-
Days Sales
Outstanding
(DSO)

© 2015 SAP SE or an SAP affiliate company. All rights reserved. 7
Working Capital Analytics
Fiori App Working Capital Analytics – DSO Analysis
Cash
Conversion
Cycle (CCC)
Days Sales
Outstanding
(DSO)
Days
Inventory Held
(DIH)
Days Payables
Outstanding
(DPO)
Inventory
Cost of Goods
Sold (COGS)
Net Sales
Accounts
Receivable (AR)
Accounts
Payable (AP)
Operating
Cycle (OC)
Influencing Factors Performance Indicators
+
-
Days Sales
Outstanding
(DSO)
Working Capital Analytics – DSO Analysis helps companies analyze
aspects relevant for
• Days Sales Outstanding
(DSO)

© 2015 SAP SE or an SAP affiliate company. All rights reserved. 8
Intuitively analyze DSO and related KPIs e.g. by company code,
country, sales organization, customer or receivables document
line item, based on real-time ERP data
Interactively explore data by drilling-down across multiple
dimensions and KPIs
Save every step of your analysis as analysis path, reuse and
modify analysis paths for data exploration
View every step of an analysis path at a glance in an easily
consumable format
Drill-down to line item level to fine-tune tactics regarding
receivables
Features and Capabilities
Working Capital Analytics – DSO Analysis
In today's volatile financial markets a company’s efficiency and
financial health is more important than ever.
Influencing working capital is of high significance in this context,
especially in a global environment with major regional differences,
e.g. with regards to payment terms.
This version of Working Capital Analytics - DSO Analysis is
based on Smart Financials 1.0 SP02 and helps companies
analyze all aspects of days sales outstanding (DSO) and
related KPIs
explore root causes of working capital changes
optimize strategies to improve the company’s liquidity,
efficiency and overall financial health
Business/Process Context
Facts & Figures
Help Portal: http://help.sap.com/fiori_bs2013
Role: Accounting Information for Managers
Target Segment: Financial Management/ Controlling
Software Stack/
Support Level:
Smart Financials 1.0 SP02, see SAP Notes
no. 1970542 (Financials Add-On for Suite on SAP
HANA 1.0 RIN for NW),
no. 1925902 (Financials Add-On for Suite on SAP
HANA 1.0 Core RIN)
Frontend related
Prerequisites
See SAP Note no. 1955437 (Financials Add-On for
Suite on SAP HANA 1.0 RIN for Fiori)
© 2015 SAP SE or an SAP affiliate company. All rights reserved. 9
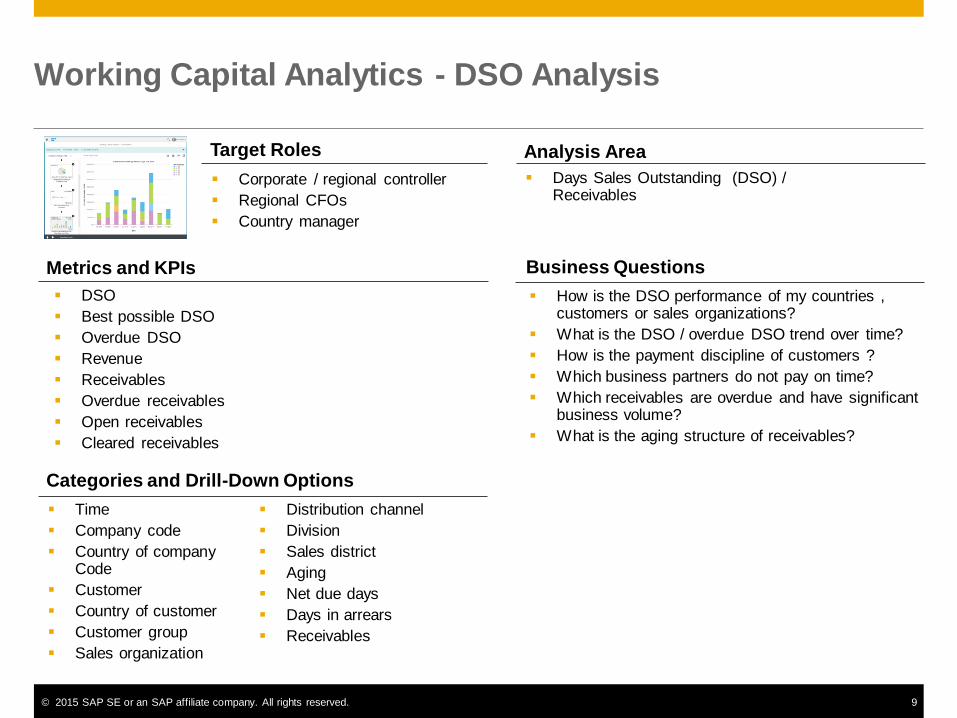
Working Capital Analytics - DSO Analysis
Target Roles
Corporate / regional controller
Regional CFOs
Country manager
Analysis Area
Days Sales Outstanding (DSO) / Receivables
Business Questions
How is the DSO performance of my countries , customers or sales organizations?
What is the DSO / overdue DSO trend over time?
How is the payment discipline of customers ?
Which business partners do not pay on time?
Which receivables are overdue and have significant business volume?
What is the aging structure of receivables?
Metrics and KPIs
DSO
Best possible DSO
Overdue DSO
Revenue
Receivables
Overdue receivables
Open receivables
Cleared receivables
Categories and Drill-Down Options
Time
Company code
Country of company Code
Customer
Country of customer
Customer group
Sales organization
Distribution channel
Division
Sales district
Aging
Net due days
Days in arrears
Receivables

© 2015 SAP SE or an SAP affiliate company. All rights reserved. 10
Working Capital Analytics
Fiori App Working Capital Analytics – DPO Analysis
Cash
Conversion
Cycle (CCC)
Days Sales
Outstanding
(DSO)
Days
Inventory Held
(DIH)
Days Payables
Outstanding
(DPO)
Inventory
Cost of Goods
Sold (COGS)
Net Sales
Accounts
Receivable (AR)
Accounts
Payable (AP)
Operating
Cycle (OC)
Influencing Factors Performance Indicators
+
-
Days Sales
Outstanding
(DSO)
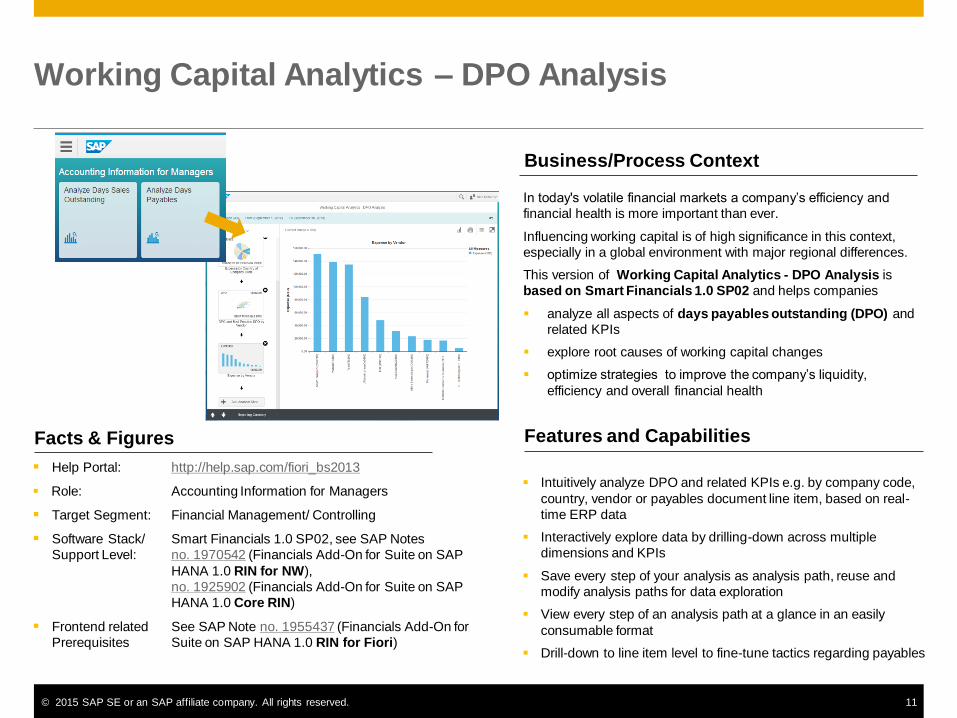
Working Capital Analytics – DPO Analysis helps companies analyze
aspects relevant for
• Days Payables Outstanding
(DPO)
© 2015 SAP SE or an SAP affiliate company. All rights reserved. 11
Intuitively analyze DPO and related KPIs e.g. by company code,
country, vendor or payables document line item, based on real-
time ERP data
Interactively explore data by drilling-down across multiple
dimensions and KPIs
Save every step of your analysis as analysis path, reuse and
modify analysis paths for data exploration
View every step of an analysis path at a glance in an easily
consumable format
Drill-down to line item level to fine-tune tactics regarding payables
Features and Capabilities
Working Capital Analytics – DPO Analysis
In today's volatile financial markets a company’s efficiency and
financial health is more important than ever.
Influencing working capital is of high significance in this context,
especially in a global environment with major regional differences.
This version of Working Capital Analytics - DPO Analysis is
based on Smart Financials 1.0 SP02 and helps companies
analyze all aspects of days payables outstanding (DPO) and
related KPIs
explore root causes of working capital changes
optimize strategies to improve the company’s liquidity,
efficiency and overall financial health
Business/Process Context
Facts & Figures
Help Portal: http://help.sap.com/fiori_bs2013
Role: Accounting Information for Managers
Target Segment: Financial Management/ Controlling
Software Stack/
Support Level:
Smart Financials 1.0 SP02, see SAP Notes
no. 1970542 (Financials Add-On for Suite on SAP
HANA 1.0 RIN for NW),
no. 1925902 (Financials Add-On for Suite on SAP
HANA 1.0 Core RIN)
Frontend related
Prerequisites
See SAP Note no. 1955437 (Financials Add-On for
Suite on SAP HANA 1.0 RIN for Fiori)
© 2015 SAP SE or an SAP affiliate company. All rights reserved. 12
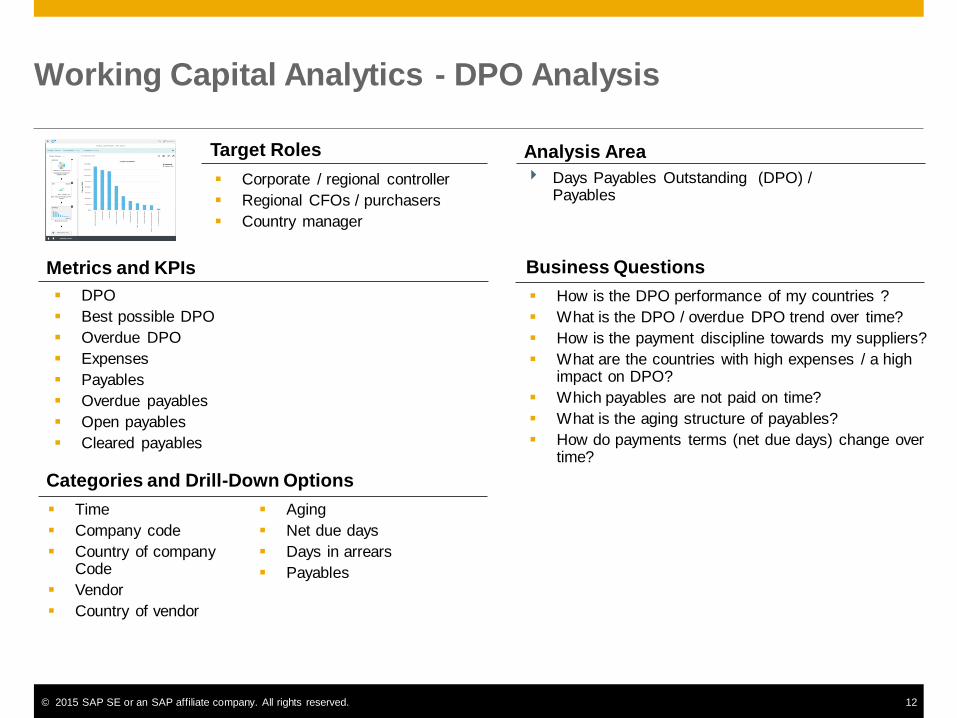
Working Capital Analytics - DPO Analysis
Target Roles
Corporate / regional controller
Regional CFOs / purchasers
Country manager
Analysis Area
Days Payables Outstanding (DPO) / Payables
Business Questions
How is the DPO performance of my countries ?
What is the DPO / overdue DPO trend over time?
How is the payment discipline towards my suppliers?
What are the countries with high expenses / a high impact on DPO?
Which payables are not paid on time?
What is the aging structure of payables?
How do payments terms (net due days) change over time?
Metrics and KPIs
DPO
Best possible DPO
Overdue DPO
Expenses
Payables
Overdue payables
Open payables
Cleared payables
Categories and Drill-Down Options
Time
Company code
Country of company Code
Vendor
Country of vendor
Aging
Net due days
Days in arrears
Payables

DSO/ DPO calculation Working Capital Analytics

© 2015 SAP SE or an SAP affiliate company. All rights reserved. 14
Working Capital Analytics
Example: Calculation Methods for DSO
Working Capital Analytics allows analysts to calculate relevant measures based on
financial line items (referred to as direct method).
The following slides provide details about typical calculation methods in comparison to the
direct calculation based on financial line items.
The calculation methods are explained by looking at a calculation example for DSO.
The example is based on a simulation as outlined on the next slide.
Calculation: Introduction

© 2015 SAP SE or an SAP affiliate company. All rights reserved. 15
Date Revenue DSO Clearing Date Receivables
01.06.2011 999,41 € 15 16.06.2011 11.878,96 €
02.06.2011 992,26 € 15 17.06.2011 12.417,71 €
03.06.2011 977,11 € 15 18.06.2011 12.886,84 €
04.06.2011 954,28 € 15 19.06.2011 13.276,78 €
05.06.2011 924,23 € 15 20.06.2011 13.579,59 €
06.06.2011 887,58 € 15 21.06.2011 13.789,09 €
07.06.2011 845,07 € 15 22.06.2011 13.901,03 €
08.06.2011 797,56 € 15 23.06.2011 13.913,11 €
09.06.2011 746,03 € 15 24.06.2011 13.825,10 €
10.06.2011 691,53 € 15 25.06.2011 13.638,78 €
11.06.2011 635,16 € 15 26.06.2011 13.357,95 €
12.06.2011 578,07 € 15 27.06.2011 12.988,34 €
13.06.2011 521,43 € 15 28.06.2011 12.537,47 €
14.06.2011 466,39 € 15 29.06.2011 12.014,53 €
15.06.2011 414,07 € 15 30.06.2011 11.430,17 €
16.06.2011 365,54 € 15 01.07.2011 10.796,31 €
17.06.2011 321,79 € 15 02.07.2011 10.125,84 €
18.06.2011 283,71 € 15 03.07.2011 9.432,44 €
19.06.2011 252,07 € 15 04.07.2011 8.730,23 €
20.06.2011 227,52 € 15 05.07.2011 8.033,51 €
21.06.2011 210,55 € 15 06.07.2011 7.356,49 €
22.06.2011 201,53 € 15 07.07.2011 6.712,95 €
23.06.2011 200,62 € 15 08.07.2011 6.116,00 €
24.06.2011 207,84 € 15 09.07.2011 5.577,81 €
25.06.2011 223,06 € 15 10.07.2011 5.109,35 €
26.06.2011 245,95 € 15 11.07.2011 4.720,14 €
27.06.2011 276,06 € 15 12.07.2011 4.418,14 €
28.06.2011 312,77 € 15 13.07.2011 4.209,48 €
29.06.2011 355,33 € 15 14.07.2011 4.098,43 €
30.06.2011 402,88 € 15 15.07.2011 4.087,23 €
Working Capital Analytics
Example: Calculation Methods for DSO
• Each day a certain amount of revenue is generated.
• Revenue always results in a corresponding accounts receivable position.
• Customers always pay after 15 days.
Obviously, the DSO is 15 days!
Simulation Example
The table shows revenue and receivables for June 2011.
The graphic above illustrates how revenue and receivables are
distributed over time, assuming that positions are cleared after
15 days. .

© 2015 SAP SE or an SAP affiliate company. All rights reserved. 16
Working Capital Analytics
Indirect Calculation Method for DSO (classical)
DSOt = x 30* Receivablest
Revenue of last 30 days*
* Could also be any other number of days
In a first step, the “classical” DSO calculation (indirect method) is explained in more detail.
DSOt = x 30 4.087,23 €
Receivables as of June 30, 2011: 4.087,23 €
Revenue June 1 – June 30, 2011: 15.517,40 €
15.517,40 €
DSOt = 7,9 days
DSO Calculation Example
Indirect Method “classical”
DSO Formula
Indirect Method “classical”
days
Result
Although the DSO should be 15 days, we see that the ‚classical‘ approach to calculate DSO results in
considerable variations of DSO values (e.g. DSO June 03: 19,3 days/ DSO June 30: 7,9 days), depending
on when the calculation is performed. This effect even increases in case of seasonal fluctuations.
DSO variations resulting from calculation method

© 2015 SAP SE or an SAP affiliate company. All rights reserved. 17
Working Capital Analytics
Indirect Calculation Method for DSO (rolling avg. receivables)
The following example shows how DSO is calculated using rolling averages.
DSOt = x 30 5.764,15 €
Avg. Receivables June 19 – June 30, 2011: 5.764,15 €
Revenue June 1 – June 30, 2011: 15.517,40 €
15.517,40 €
DSOt = 11,1 days
DSO Calculation Example Indir.
Method ‚Rolling avg. Receiv.‘
DSO Formula Indirect Method
‚Rolling avg. Receivables‘
DSOt = x 30* Rol. Av. Receivables 12 days**
Revenue of last 30 days*
* Could also be any other number of days
** Could also be a rolling average over other perdiod
days
Result
Using rolling averages to calculate DSO decreases variations to some degree. However, DSO values are
only approximations that are subject to certain assumptions.
DSO variations slightly decreased
© 2015 SAP SE or an SAP affiliate company. All rights reserved. 18
Working Capital Analytics
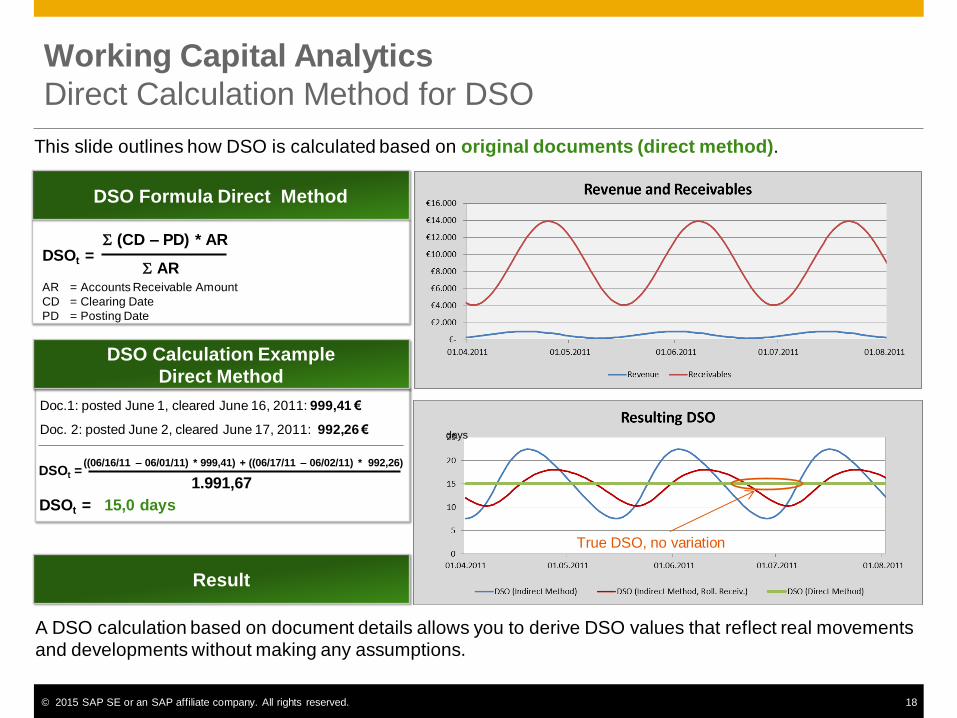
Direct Calculation Method for DSO
This slide outlines how DSO is calculated based on original documents (direct method).
DSOt =
Doc.1: posted June 1, cleared June 16, 2011: 999,41 €
Doc. 2: posted June 2, cleared June 17, 2011: 992,26 €
1.991,67
DSOt = 15,0 days
DSO Calculation Example
Direct Method
DSO Formula Direct Method
days
DSOt = S (CD – PD) * AR
S AR AR = Accounts Receivable Amount
CD = Clearing Date
PD = Posting Date
((06/16/11 – 06/01/11) * 999,41) + ((06/17/11 – 06/02/11) * 992,26)
Result
A DSO calculation based on document details allows you to derive DSO values that reflect real movements
and developments without making any assumptions.
True DSO, no variation
© 2015 SAP SE or an SAP affiliate company. All rights reserved. 19
Working Capital Analytics – DSO Analysis
Formulas for DSO Calculation
The following slides depict the formulas provided with
Working Capital Analytics – DSO Analysis to calculate the KPI DSO.
Important note:
By default, Working Capital Analytics- DSO Analysis uses the direct calculation
method based on financial line items for DSO.
You can change the configuration so that calculations are performed using the
indirect method instead.
For more information how to switch the calculation method see the Working
Capital Analytics – DSO Analysis documentation, chapter Switching to Indirect
Calculation of DSO, available at help.sap.com - SAP Smart Business for
Smart Financials.
.
Formulas Provided with the Application

© 2015 SAP SE or an SAP affiliate company. All rights reserved. 20
Working Capital Analytics – DSO Analysis
Definitions
DSO Indicates the average number of days that it takes a
company to collect its outstanding accounts receivable.
Overdue DSO Indicates the average number of days that an invoice has
been overdue.
Best Possible DSO The DSO that can be reached if payment is always made
on the due date.

© 2015 SAP SE or an SAP affiliate company. All rights reserved. 21
S ( - ) * Line Item Amount
Working Capital Analytics – DSO Analysis
Direct Calculation of DSO
S (Line Item Clearing Date – Line Item Posting Date) * Line Item Amount
S Line Item Amount DSO =
Best Possible
DSO
Overdue
DSO =
=
DSO – Best Possible DSO
Line Item
Net due Date
Line Item Reference Date for
Net Due Receivable Calculation¹
S Line Item Amount
¹ The Reference Date for Net Due Receivable Calculation is either the Baseline Date
for Due Date Calculation (table BSEG field ZFBDT) or the Document Date (table
BKPF field BLDAT) in case the Baseline Date is not filled.

© 2015 SAP SE or an SAP affiliate company. All rights reserved. 22
Average Overdue AR Balance of last X Months²
Average Monthly Revenues of last Y Months³
Working Capital Analytics – DSO Analysis
Indirect Calculation of DSO – Calculation per Month
Average Accounts Receivable Balance of last X Months²
Average Monthly Revenues of last Y Months³ DSO = x 30
Overdue
DSO x 30
² Parameter X: can be any positive number of months (Default parameter = 1)
³ Parameter Y: can be any positive number of months (Default parameter = 1)
Best Possible
DSO
=
= DSO – Overdue DSO

© 2015 SAP SE or an SAP affiliate company. All rights reserved. 23
Average Overdue AR Balance of Analysis Time Frame
Average Monthly Revenues of Analysis Time Frame
Working Capital Analytics – DSO Analysis
Indirect Calculation of DSO – Overall Calculation
Average Accounts Receivable Balance of Analysis Time Frame
Average Monthly Revenues of Analysis Time Frame DSO = x 30
Overdue
DSO x 30
Best Possible DSO = DSO – Overdue DSO
=

© 2015 SAP SE or an SAP affiliate company. All rights reserved. 24
Working Capital Analytics – DPO Analysis
Formulas for DPO Calculation
The following slides depict the formulas provided with
Working Capital Analytics – DPO Analysis to calculate the KPI DPO.
Important note:
By default, Working Capital Analytics - DPO Analysis uses the direct calculation
method based on financial line items for DPO.
You can change the configuration so that calculations are performed using the
indirect method instead.
For more information how to switch the calculation method see the Working
Capital Analytics – DPO Analysis documentation, chapter Switching to Indirect
Calculation of DPO, available at help.sap.com - SAP Smart Business for
Smart Financials.
.
Formulas Provided with the Application

© 2015 SAP SE or an SAP affiliate company. All rights reserved. 25
Working Capital Analytics – DPO Analysis
Definitions
DPO Indicates the average number of days that it takes a
company to pay its suppliers.
Overdue DPO Indicates the average number of days that an invoice
from a supplier has been overdue.
Best Possible DPO The DPO that can be reached if payment is always made
on the due date.

© 2015 SAP SE or an SAP affiliate company. All rights reserved. 26
Working Capital Analytics - DPO Analysis
Direct Calculation of DPO
S (Line Item Clearing Date – Line Item Posting Date) * Line Item Amount
S Line Item Amount DPO =
Best Possible
DPO
Overdue
DPO =
=
DPO – Best Possible DPO
S ( - ) * Line Item Amount
Line Item
Net due Date
Line Item Reference Date for
Net Due Payable Calculation⁴
S Line Item Amount
⁴ The Reference Date for Net Due Payable Calculation is either the Baseline Date
for Due Date Calculation (table BSEG field ZFBDT) or the Document Date (table
BKPF field BLDAT) in case the Baseline Date is not filled.

© 2015 SAP SE or an SAP affiliate company. All rights reserved. 27
Average Overdue AP Balance of last X Months⁵
Average Monthly Expenses of last Y Months⁶
Working Capital Analytics - DPO Analysis
Indirect Calculation of DPO – Calculation per Month
Average Accounts Payable Balance of last X Months⁵
Average Monthly Expenses of last Y Months⁶ DPO = x 30
Overdue
DPO x 30
⁵ Parameter X: can be any positive number of months (Default parameter = 1)
⁶ Parameter Y: can be any positive number of months (Default parameter = 1)
Best Possible DPO = DPO – Overdue DPO
=

© 2015 SAP SE or an SAP affiliate company. All rights reserved. 28
Average Overdue AP Balance of Analysis Time Frame
Average Monthly Expenses of Analysis Time Frame
Working Capital Analytics - DPO Analysis
Indirect Calculation of DPO – Overall Calculation
Average Accounts Payable Balance of Analysis Time Frame
Average Monthly Expenses of Analysis Time Frame DPO = x 30
Overdue
DPO x 30
Best Possible DPO = DPO – Overdue DPO
=
© 2015 SAP SE or an SAP affiliate company. All rights reserved. 29
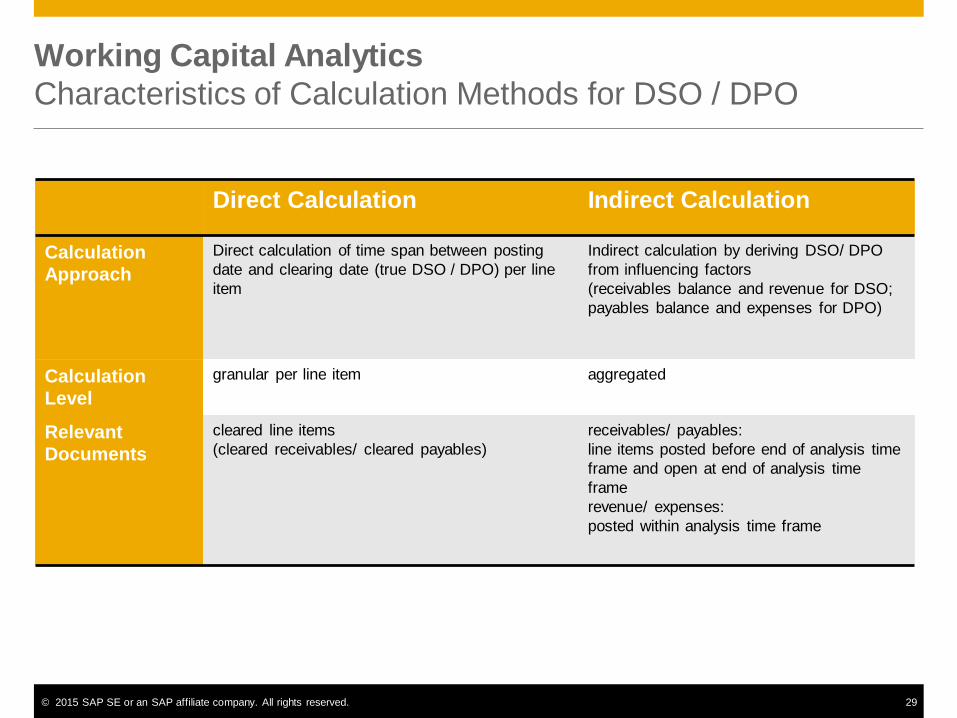
Working Capital Analytics
Characteristics of Calculation Methods for DSO / DPO
Direct Calculation Indirect Calculation
Calculation
Approach
Direct calculation of time span between posting
date and clearing date (true DSO / DPO) per line
item
Indirect calculation by deriving DSO/ DPO
from influencing factors
(receivables balance and revenue for DSO;
payables balance and expenses for DPO)
Calculation
Level
granular per line item aggregated
Relevant
Documents
cleared line items
(cleared receivables/ cleared payables)
receivables/ payables:
line items posted before end of analysis time
frame and open at end of analysis time
frame
revenue/ expenses:
posted within analysis time frame

© 2015 SAP SE or an SAP affiliate company. All rights reserved. 30
Working Capital Analytics
Pros and Cons of Calculation Methods for DSO / DPO
Direct Calculation Indirect Calculation
Pros • More precise
• Independent from calculation effects
caused by seasonal business or big scale
transactions.
• Less affected by a high proportion of special
business transactions such as credit memos,
invoice pooling, partial payments.
Cons Effects in case of special business
transactions:
• Unexpected effects in case of a high
proportion of credit memos.
• Lower values in case of invoice pooling or
partial payments.
• Highly key date dependent, that is, KPI
calculations are more affected by influences
and assumptions causing considerable KPI
variations with limited informative value.
• Effects can be reduced to some degree using
rolling averages.

© 2015 SAP SE or an SAP affiliate company. All rights reserved. 31
SAP Community Network ■ http://scn.sap.com/docs/DOC-58907
Video Tutorials ■ UI Overview: http://www.youtube.com/watch?v=XBRshH5lBf8
■ Creating an Analysis Path: http://www.youtube.com/watch?v=jx-VeS4KcaU
■ Further Options for Analysis Paths: http://www.youtube.com/watch?v=BHPeOfKVEJo
■ Filter Data in an Analysis Path: http://www.youtube.com/watch?v=x0W3IGR1V4Y
Documentation ■ Working Capital Analytics – DPO Analysis:
http://help.sap.com//helpdata/en/0f/7279536dab0350e10000000a44176d/frameset.htm
■ Working Capital Analytics – DSO Analysis:
http://help.sap.com//helpdata/en/e2/8985530a5df37ae10000000a44176d/frameset.htm
Further Information

© 2015 SAP SE or an SAP affiliate company. All rights reserved. 32
© 2014 SAP AG or an SAP affiliate company.
All rights reserved.
No part of this publication may be reproduced or transmitted in any form or for any purpose without the express permission of SAP AG or an
SAP affiliate company.
SAP and other SAP products and services mentioned herein as well as their respective logos are trademarks or registered trademarks of SAP AG
(or an SAP affiliate company) in Germany and other countries. Please see http://global12.sap.com/corporate-en/legal/copyright/index.epx for additional
trademark information and notices.
Some software products marketed by SAP AG and its distributors contain proprietary software components of other software vendors.
National product specifications may vary.
These materials are provided by SAP AG or an SAP affiliate company for informational purposes only, without representation or warranty of any kind,
and SAP AG or its affiliated companies shall not be liable for errors or omissions with respect to the materials. The only warranties for SAP AG or
SAP affiliate company products and services are those that are set forth in the express warranty statements accompanying such products and
services, if any. Nothing herein should be construed as constituting an additional warranty.
In particular, SAP AG or its affiliated companies have no obligation to pursue any course of business outlined in this document or any related
presentation, or to develop or release any functionality mentioned therein. This document, or any related presentation, and SAP AG’s or its affiliated
companies’ strategy and possible future developments, products, and/or platform directions and functionality are all subject to change and may be
changed by SAP AG or its affiliated companies at any time for any reason without notice. The information in this document is not a commitment,
promise, or legal obligation to deliver any material, code, or functionality. All forward-looking statements are subject to various risks and uncertainties
that could cause actual results to differ materially from expectations. Readers are cautioned not to place undue reliance on these forward-looking
statements, which speak only as of their dates, and they should not be relied upon in making purchasing decisions.