Workflow for Food Classification and Authenticity using ...
10
Application Note Food Testing and Agriculture Author Sofia Nieto and Melissa Churley Agilent Technologies, Inc. Abstract This application note provides an example of a novel food authenticity workflow that can be used for food classification and detection of food fraud. Different brands of yerba mate, a South American herbal tea, were used to illustrate the workflow. The food authenticity workflow described here takes advantage of high-resolution accurate mass GC/Q-TOF data, as well as differential analysis software that enables routine screening of food samples. Workflow for Food Classification and Authenticity using Yerba Mate and High-Resolution GC/Q-TOF
Transcript of Workflow for Food Classification and Authenticity using ...

Application Note
Food Testing and Agriculture
AuthorSofia Nieto and Melissa Churley Agilent Technologies, Inc.
AbstractThis application note provides an example of a novel food authenticity workflow that can be used for food classification and detection of food fraud. Different brands of yerba mate, a South American herbal tea, were used to illustrate the workflow. The food authenticity workflow described here takes advantage of high-resolution accurate mass GC/Q-TOF data, as well as differential analysis software that enables routine screening of food samples.
Workflow for Food Classification and Authenticity using Yerba Mate and High-Resolution GC/Q-TOF

2
IntroductionFood fraud is a highly profitable business and includes various activities such as misbranding, mislabeling, dilution, counterfeiting, and adulteration.1 Among foods and food ingredients, the most frequently adulterated are olive oil, seafood, milk, honey, fruit juices, spices, coffee, and tea.2 To identify adulteration of a broad variety of food products, numerous analytical techniques, including high-resolution time-of-flight (TOF) mass spectrometry are used.3 Previously, a complete food authentication workflow for both method development and routine sample testing was demonstrated using an LC/Q-TOF.4 To streamline the characterization of foods with high-resolution GC/Q-TOF, a similar workflow using Agilent Mass Profiler Professional (MPP) and Classifier software has been developed. The workflow was evaluated using yerba mate (Ilex paraguariensis), a traditional South American herbal tea. Adulteration of yerba mate (intentional or not) with different Ilex species is a common issue, and contributes to a change in flavor, as well as a bitter taste of the final product.5,6 On the other hand, the processing of yerba mate involves several steps, such as blanching (rapid heating to deactivate enzymes), drying, and ageing that will also affect the aroma and chemical composition of yerba mate.5-7
The classification model for yerba mate authenticity described in this application note was able to distinguish between different brands of commercially available yerba mate. The three yerba mate brands presented distinct profiles of the volatile aroma, as well as detectable levels of contaminating polycyclic aromatic hydrocarbons (PAHs).
Experimental
Samples and extractionsYerba mate samples of four different brands, A, B, C, and D were obtained from a supermarket in Buenos Aires, Argentina. Brand A was a premium brand and brand C was one of the less expensive supermarket brands. Before the extraction, the dry yerba samples of brand A were mixed with C to yield 5, 10, 20, 50, and 80% adulterated yerba A samples. In one instance, yerba A and D were also mixed at a 50/50 ratio. The replicates of each of the pure samples, as well as adulterated samples, were extracted separately. Deionized (DI) water (10 mL) was added to each individual 2 g yerba sample. This was mixed, soaked for 30 minutes, then extracted using a standard unbuffered EN QuEChERS protocol along with method blanks.
Data acquisition and processingThe samples were analyzed in random order using an Agilent 7890B GC coupled to an Agilent 7250 high-resolution Q-TOF MS. The full spectrum data were acquired in EI mode. The parameters are described in detail in Table 1. The Unknowns Analysis tool of Agilent MassHunter Quantitative Analysis software 10.1 was used to perform the chromatographic deconvolution and NIST 17.L library search. The retention indices were calculated based on the alkane ladder to improve accuracy of compound identification. The yerba mate classification model was built using pure yerba mate samples in MPP 15.1. Classifier 1.1 was further used to validate the model and analyze the “unknown”, or adulterated, yerba samples along with positive and negative controls.
Table 1. GC/Q-TOF acquisition parameters.
Parameter Value
Q-TOF Agilent 7250 Q-TOF MS
GC 7890B
Column Agilent DB-5ms UI, 30 m × 0.25 mm, 0.25 µm
Inlet MMI, 4 mm UI liner single taper with wool
Injection Volume 1 µL
Injection Mode Splitless
Inlet Temperature 280 °C
Oven Temperature Program50 °C for 2 min; 10 °C/min to 300 °C; 10 min hold
Carrier Gas Helium
Column Flow 1.2 mL/min
Transfer Line Temperature 300 °C
Quadrupole Temperature 150 °C
Source Temperature 200 °C
Electron Energy 70 eV
Emission Current 5 µA
Spectral Acquisition Rate 5 Hz
Mass Range 45 to 650 m/z

3
Results and discussion
Yerba mate classification workflowTo build the classification model, six replicates of each type of yerba mate from three different brands were extracted and analyzed using a high-resolution GC/Q-TOF. A chromatogram overlay from these extracts is displayed in Figure 1. Although a few prominent components differentiating between the three yerba brands were observed, chromatographic profiles were very similar overall, suggesting that some minor but robust components would likely also have to be included in the class prediction model.
The general workflow is outlined in Figure 2. First, a classification model is built and validated in MPP and Classifier following the feature finding step in Unknowns Analysis tool (Figure 2A). After the classification model is created and exported, unknown samples can be characterized directly using Unknowns Analysis and Classifier, bypassing MPP (Figure 2B). Classifier software is designed for routine processing of unknown samples based on the existing classification model and features a few effective visualization tools.
Feature finding was performed in Unknowns Analysis using SureMass deconvolution followed by NIST17.L library search (Figure 3). Identity of the compounds was confirmed with retention indices (RIs) as well as accurate mass (using the ExactMass
feature of Unknowns Analysis, Figure 3A). For a true hit, the mass error for the majority of prominent peaks was within 2 ppm. The mass error for a false positive was significantly greater (Figure 3B). Accurate compound identification was key to correct
0
0.1
0.2
0.3
0.4
0.5
0.6
0.7
0.8
0.9
1.0
1.1
1.2
1.3
1.4
5 6 7 8 9 10 11 12 13 14 15 16 17 18 19 20 21 22 23 24 25 26 27 28 29 30 31 32 33 34 35 36
×108
Acquisition time (min)
Caffeine
Co
un
ts
A
B
C
Figure 1. Overlaid chromatograms from the extracts of the three brands of yerba mate labeled A, B, and C. An arrow points to caffeine.
A
B
GC/Q -TOF
Data acquisition in full MS mode
Featurefinding
UnknownsAnalysis
BuildingClassification
Model
MPP
Sampleclassification and
resultsvisualization
Classifier
Building Classification
Model
Sampleclassification and
resultsvisualization
Featurefinding
Model Building
Sample testing
Figure 2. Workflow for sample classification. (A) Class prediction model building and validation. (B) Unknown samples classification, with MPP bypassed.

4
Figure 3. Compound identification and ID confirmation in Unknowns Analysis. The ExactMass feature (shown in the bottom table and the mirror plot of each screen capture) uses accurate mass information from a compound spectrum to check if a fragment formula is a subset of the molecular formula of the library hit. (A) Library hit confirmed by ExactMass. (B) False positives displaying large mass error on the component’s fragment ions.
A
B

5
alignment in MPP and, although not always an essential part of a routine authenticity workflow, it helped create a robust class prediction model by monitoring the compound selection.
The classification model was built using the soft independent modeling of class analogy (SIMCA) algorithm in MPP. In the first step, the data were imported into MPP from the Unknowns Analysis. This was followed by sample grouping, alignment, normalization, filtering, and quality control (QC) using principle component analysis (PCA). As shown in Figure 4, all three sample
Figure 4. All three sample groups can easily be separated on a PCA plot.
ACB
Figure 5. Building SIMCA model in MPP. (A) Setting parameters for model validation. (B) Output of training algorithm: model distance for each sample group from sample A. (C) Discriminating power of a subset of compounds is shown (blue bar graph). Also shown is the abundance distribution (heat map) of the individual compound in the training set.
A
B
C
groups can easily be separated on the PCA plot. At the next step, the number of features was further reduced through statistical analysis (p <0.05) and fold change analysis (F >2). The resulting set of compounds was used to create a class prediction model. Figure 5 displays parameter settings for the model validation as well as a selected output of the SIMCA model training algorithm.
The SIMCA classification model for yerba mate was exported from MPP directly to the Classifier software and further validated using both positive and negative controls, prepared from pure and mixed brands of yerba samples, respectively.

6
Results of differential analysis, identification of aroma volatiles and contaminantsThe results of the fold change combined with statistical analysis for any pair of sample groups can be visualized on the volcano plot. An example of such visualization, comparing the yerba extracts of brand A and C, is shown on Figure 6. The characteristic volatile compounds that prevail in one of the yerba brands compared to the other are labeled.
Further details for these potential compounds of interest, predominantly those associated with flavor and aroma are provided in Table 2. The compound 3-hydroxy-5,6-epoxy-β-ionone displayed one of the most significant fold change values among the identified aroma compounds (with high p-value) between the two groups. It could therefore potentially contribute to a significant difference in flavor between these brands of yerba mate. Interestingly, furanones (important flavor compounds) were found at higher levels in yerba A, while a few aldehydes, often found in adulterating species5 such as 4-heptenal and 2,4-heptadienal predominated in yerba C (Table 2).
Several PAHs and other environmental contaminants have also been identified in yerba mate extracts, and typically prevailed in one brand versus another (Figure 7). The presence of these contaminants is likely the result of the yerba processing steps such as blanching and smoke drying rather than soil and atmospheric contamination.8 Typically, environmental contaminants are not included in the classification model, but in this particular case, PAHs may be considered to be part of the model, since processing of yerba mate samples could differ depending on the brand.
Figure 6. Volcano plot and fold change analysis. Comparison of brands A and C. Compounds highlighted in blue are those that are present in significantly higher levels in C as compared to A, and those labeled in red were accumulated in yerba sample A versus C.

7
Table 2. Results of fold change analysis for selected volatile compounds. Some of these compounds were not necessarily included in the final classification model.
RT CompoundMass Error* p Regulation Log FC Alias Flavor
4.96 2(3H)-Furanone, 5-methyl- 0.8 6.5E-03 Up 14.0 α-Angelica lactone Sweet, solvent-like, oily, coconut, nutty with coumarin, tobacco nuances1
5.51 4-Heptenal, (Z)- 1.0 1.3E-02 Down -13.7 Oily, dairy, creamy1
6.25 2(5H)-Furanone, 5,5-dimethyl- 0.5 2.6E-10 Up 2.4 4,4-Dimethyl-2-buten-4-olide Aroma component of hop extract, and of lavender, sage brush, narcissus and salmon oils2
6.29 2(3H)-Furanone, dihydro-5-methyl- 0.4 5.8E-19 Up 19.7 γ-Valerolactone Milky, fatty1
6.64 2(5H)-Furanone, 3-methyl- 0.4 9.5E-03 Up 13.1 α-Methyl-γ-crotonolactone Sweet, tobacco-like odor3
7.22 1-Propanone, 1-(2-furanyl)- 0.5 6.7E-03 Up 13.5 2-Furyl ethyl ketone Fruity taste, sweet and caramel odor4
7.30 2,4-Heptadienal, (E,E)- 0.3 3.5E-10 Down -1.9 Fatty, oily, cinnamon1
10.23 L-α-Terpineol 0.6 1.7E-02 Up 14.4 Citrus, tropical fruits, apple, tomato, and coffee flavors1
10.69 1H-Pyrrole-2,5-dione, 3-ethyl-4-methyl- 0.3 3.4E-11 Up 1.1 Ethylmethylmaleimide Sweet, adds body, flue-cured note5
14.12 trans-β-Ionone 1.1 7.0E-06 Down -1.0 Cedar woods, violets2
14.63 2-Propanone, 1-(4-hydroxy-3-methoxyphenyl)- 0.4 3.9E-07 Down -1.3 Guaiacylacetone Vanilla, wood origin6
16.48 3-Hydroxy-5,6-epoxy-β-ionone 0.6 5.1E-20 Up 24.3 Fruity, sweet, berry, woody, violet, orris (iris root), powdery1
16.72 3-Oxo-7,8-dihydro-α-ionone 0.9 4.5E-04 Down -18.9 Unknown
21.23 Abscisic acid 0.6 8.4E-03 Down -1.4 Plant hormone
* Mass error shown for quant ion1 The Good Scents Company2 PubChem3 Perfume and Flavor Chemicals (Aroma Chemicals) Vol.1, By Steffen Arctander, Lulu.com, May 10, 20194 Coffee Flavor Chemistry. Ivon Flament. 20025 Tobacco Flavoring for Smoking Products. John C. Leffingwell, Harvey J. Young & Edward Bernasek. 19726 Red Wine Technology. Antonio Morata. 2019
Figure 7. PAH and other environmental contaminants identified in yerba mate extracts.
0
20
40
60
80
(%)
100
CBA
8
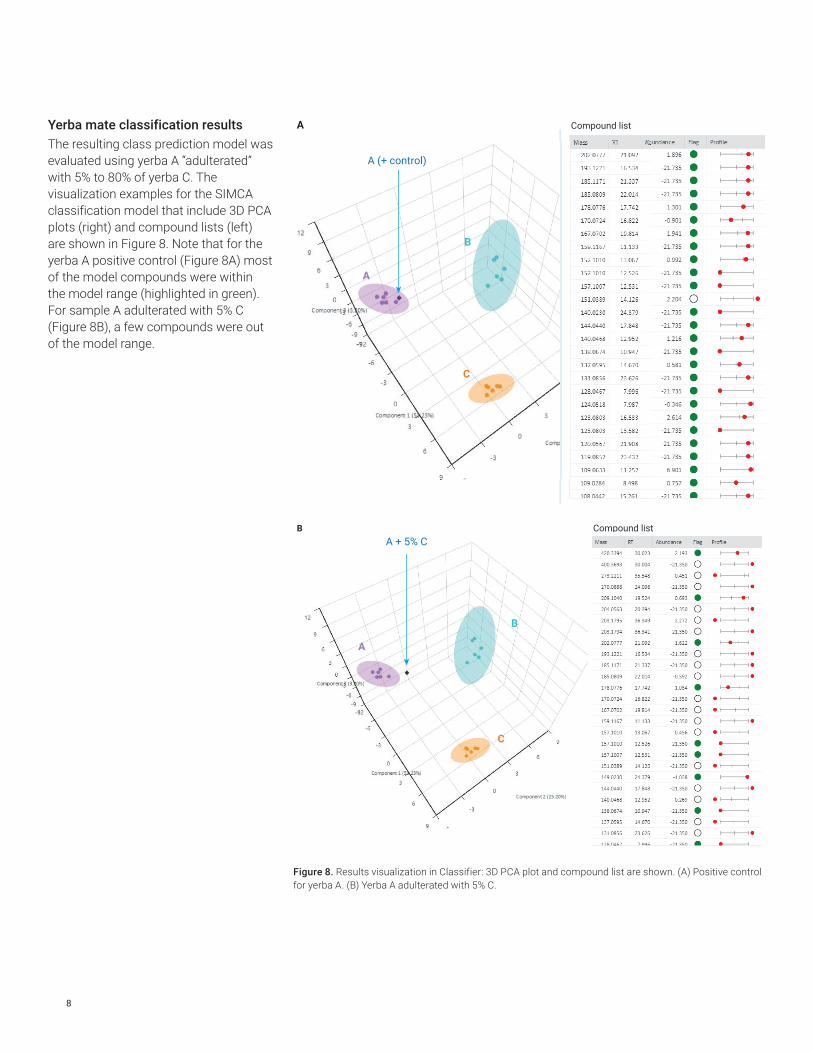
Yerba mate classification resultsThe resulting class prediction model was evaluated using yerba A “adulterated” with 5% to 80% of yerba C. The visualization examples for the SIMCA classification model that include 3D PCA plots (right) and compound lists (left) are shown in Figure 8. Note that for the yerba A positive control (Figure 8A) most of the model compounds were within the model range (highlighted in green). For sample A adulterated with 5% C (Figure 8B), a few compounds were out of the model range.
Figure 8. Results visualization in Classifier: 3D PCA plot and compound list are shown. (A) Positive control for yerba A. (B) Yerba A adulterated with 5% C.
A (+ control)
C
B
A
C
B
A
Compound list
Compound list
A
BA + 5% C

9
The results summary of the yerba mate authentication model is displayed in Figure 9. Since the SIMCA algorithm was used to create the model, the results of classification were reported as a distance, in this case from sample A. The model was able to successfully distinguish pure samples of A from other brands, including D, which was not part of the class prediction model. The model was also able to distinguish between pure and adulterated samples.
ConclusionThis application note provides an example of a workflow for food authenticity using yerba mate. A workflow that employs high-resolution GC/Q-TOF and Classifier software can be used for routine authenticity analysis beyond food applications.
The class prediction model that included various aroma volatiles as well as PAH contaminants identified in yerba mate extracts, was able to successfully differentiate between four brands of yerba mate (including the one not considered in the model) as well as adulterated yerba mate samples at a level of only 5% adulteration.
Figure 9. Authentication results for yerba mate samples A, B, C, and D (not included in the model), as well as A adulterated with C. The distance from sample A is reported.
0
500
1,000
1,500
2,000
2,500
A B C D A + 5% C
A + 10% C
A + 20% C
A + 50% C
A + 80% C
A + 50% D
Dis
tan
ce
fro
m A

www.agilent.com/chem
DE.6819097222
This information is subject to change without notice.
© Agilent Technologies, Inc. 2020 Printed in the USA, August 25, 2020 5994-2280EN
References1. Reily, A. Food Fraud. Understanding
the Impact of Food Fraud in Asia. Food Industry Asia (FIA) Report 2018.
2. Tola A. Global Food Fraud Trends and Their Mitigation Strategies: The Case of Some Dairy Products: A Review. Food Science and Quality Management 2018, 77.
3. Hong, E. et al. Modern Analytical Methods for the Detection of Food Fraud and Adulteration by Food Category. J. Sci. Food Agric. 2017, 97, 3877–3896.
4. Yannell, K. E.; Cuthbertson, D. Food Authenticity Testing with the Agilent 6546 LC/Q-TOF and MassHunter Classifier. Agilent Technologies application note, publication number 5994-0694EN, 2019.
5. Dallago, R. M. et al. Analysis of Volatile Compounds of Ilex paraguariensis A. St. – Hil. and Its Main Adulterating Species Ilex theizans Mart. Ex Reissek and Ilex dumosa Reissek. Ciênc. Agrotec. 2011, 35(6), 1166–71.
6. Heck, C. I.; de Meija, E. G. Yerba Mate Tea (Ilex papaguariensis): a Comprehensive Review on Chemistry, Health Implications, and Technological Considerations. Journal of Food Science 2007, 72(9), 138–151.
7. Preedy, V. Processing and Impact on Antioxidants in Beverages. Academic Press 2014.
8. Oranuba, E. et al. Polycyclic Aromatic Hydrocarbons as a Potential Source of Carcinogenicity of Mate. J. Environ. Sci. Health C Environ. Carcinog. Ecotoxicol. Rev. 2019, 37(1), 26–41.