Workability of Cement Pastes - claisse.info papers/Paper 16.pdf · 2 . INTRODUCTION . Cement grouts...
28
1 Workability of Cement Pastes P A Claisse J P Lorimer and M H Omari School of The Built Environment Coventry University Priory Street Coventry CV1 5FB UK email: [email protected] ABSTRACT This paper reports an investigation into problems which have occurred when superplasticisers have been used with different cements. The literature survey showed that previous work had indicated that the problems were caused by the specific surface area, sulphate morphology and aluminate content of the cements. The experimental work involved a comprehensive analysis of 14 different cements. A full statistical analysis of the results indicated that the sulphates were not a significant factor when superplasticisers were used but the chromate content of the cement is significant. keywords: workability, rheology, chromate, sulphate.
Transcript of Workability of Cement Pastes - claisse.info papers/Paper 16.pdf · 2 . INTRODUCTION . Cement grouts...
1
Workability of Cement Pastes
P A Claisse
J P Lorimer
and
M H Omari
School of The Built Environment
Coventry University
Priory Street
Coventry
CV1 5FB UK
email: [email protected]
ABSTRACT
This paper reports an investigation into problems which have occurred when
superplasticisers have been used with different cements. The literature survey showed
that previous work had indicated that the problems were caused by the specific surface
area, sulphate morphology and aluminate content of the cements. The experimental work
involved a comprehensive analysis of 14 different cements. A full statistical analysis of
the results indicated that the sulphates were not a significant factor when superplasticisers
were used but the chromate content of the cement is significant.
keywords: workability, rheology, chromate, sulphate.
cbx054
Text Box
For citation information on this paper please see http://www.claisse.info/Publish.htm
2
INTRODUCTION
Cement grouts are used for a wide range of applications in the construction
industry. These grouts require a high workability and superplasticising admixtures are
used to achieve this.
It had been found that some cement pastes perform better (i.e. flow faster and are
workable for longer times without bleed and segregation) in some countries than in others
These problems may be solved on an empirical basis when they arise. However this
project investigated the basic mechanisms involved in order that the performance of the
cement pastes might be predicted more effectively.
To do this, a relationship between the rheological properties of the cement paste
and the chemical components, especially the different kinds of sulphates, of the Portland
cement was established. First, a relationship between the simple industrial tests such as
the flow cone and the rheological properties obtained by a rheometer was established.
This has been reported elsewhere (1,2). Subsequently, more tests were performed such as
X-ray Fluorescence (XRF) spectroscopy to determine the chemical composition of
cement, Thermo Gravimetric Analysis (TGA) to determine the different types of
sulphates, Particle Size Distribution (PSD) and Specific Surface Area (SSA) tests. In
order to relate the chemical composition to the rheological properties 14 different
cements from various countries were analysed.
The TGA system used was unable to differentiate between the amount of gypsum
or hemihydrate present. In order to estimate the amounts of gypsum and hemihydrate it
was necessary to use X-Ray Diffraction (XRD) and then calculate the mass of water in
that amount (that represented the water content in hemihydrate). It was then subtracted

3
from the results obtained from the TGA system to obtain the mass of water that
represented gypsum.
LITERATURE SURVEY
Properties affecting paste rheology
Numerous studies of the rheological properties of cement pastes have proved
these properties depend on many factors. The following have been frequently cited: the
water / cement ratio (w/c) [3,4], specific surface area, mineral composition [3,5,6],
conditions during measurements and their duration [3,7] (i.e., time dependency, mixing
time and mixing intensity) and temperature [5,8]. Previous researchers found that the
cement paste had better workability when using high w/c ratio, low SSA cement and high
mixing speed. It has been shown that the most important of these are the w/c ratio and
specific surface area [3]. Studies performed on cement pastes of different chemical
composition indicated this factor has less effect on the rheology than the w/c ratio and/or
the fineness of the cement [9,10] (this is already optimised in commercial cements). The
most significant reported influence of chemical composition is in the retardation of the
aluminate hydration by calcium sulphate [11]. Due to the considerable reaction rates of
these processes they are very important when determining rheological features of cement
pastes at early hydration stages and also affect the development of rheological properties
[3].
The effect of cement chemistry on paste rheology
4
The most relevant study to this study was performed by Greszczyk and Kucharska
[3]. Their experiments were carried out using 21 industrial clinkers and cements. All
cements contained an equal amount of gypsum (5% wt). Both clinkers and cements were
ground to the specific surface area of 300 20 m2/kg. The chemical composition of the
clinkers were recorded (%wt.) stating the four main phases (see 1.3.1) C3S, C2S, C3A and
C4AF and Na2O, K2O, SO3 and free CaO. The rheology measurements were obtained
using a rotary viscometer Rheotest RV-2. Measurements were performed at a constant
temperature of 21 C and the w/c for clinker and cement pastes were 0.50 and 0.40
respectively. The preparation of the pastes included manual mixing for 3 minutes
immediately after the clinker and/or cement contacted water. The paste was left to stand
for 5 minutes before it was fed into the viscometer. Then 1 minute of mixing was
performed at a shear rate 146 s-1
after which it was left for a further 1 minute at rest
before the start of measurements. Thus, measurements were started after 10 minutes of
the contact of cement with water. The rheological behaviour of the tested clinker and
cement pastes were determined based on the obtained flow curves and results on stress
change measurements taken within a one hour period at a constant shear rate (146 s-1
).
The plastic viscosity and shear stress values for cement and clinker were measured at 30
and 60 minutes. Greszczyk and Kucharska found that the shear stress at 30 and 60
minutes increased with the increase of C3A content. The increase in the alkali content
increased the shear stress at 30 and 60 minutes. The efficiency of gypsum as a setting
control agent was reduced when using a highly reactive clinker (i.e. clinker with an
orthorhombic morphology of tricalcium aluminate (C3A) and a high content of alkalies)
due to the increased reactivity of C3A caused by alkalis (potassium).
5
However in the author’s opinion, the sample preparation techniques were not
adequate. For example a manual mixing procedure of 3 minutes produces an inadequate
mixed cement paste. Banfill [12] and Hakansson, Hassler and Stille [8] showed that a
mixing time of about five minutes is the required minimum to obtain constant properties
for both the yield stress and the plastic viscosity [8]. Inadequate mixing will result in non-
reproducible properties [8]; this effect was tested in this project. Low shear mixing
(manual mixing in case of Greszczyk and Kucharska) and a mixing time below 4 minutes
is inadequate. Greszczyk and Kucharska's study was limited since the gypsum content
and the specific surface area were controlled to a very limited range of values. Testing the
rheological properties of a clinker with no added sulphates is unrealistic due to the false
set of the clinker paste. The study should have used commercial clinker with controlled
addition of sulphates.
The effect of sulphate compounds on paste rheology
The second important study in this area was performed by Mork and Gjoerv [13].
During the grinding of cement clinker and gypsum in cement production, relatively high
temperatures occur which may reduce the gypsum to hemihydrate or soluble anhydrite.
The amount of this reduction may also depend on the quality of the gypsum and the
conditions used later during storage and transportation of the cement. Since the solubility
of hemihydrate and soluble anhydrite is approximately three times higher than gypsum,
an uncontrolled variation in the gypsum-hemihydrate ratio may cause an uncontrolled
variation in the chemical reactivity of the system and hence on the workability properties
of the fresh cement pastes. An uncontrolled variation in the gypsum-hemihydrate ratio

6
may also cause an incompatibility between the cement and certain types of admixtures
such as superplasticisers. Such incompatibility may cause false set or quick set of the
fresh cement pastes [13,14]. Mork and Gjoerv used three different gypsum-hemihydrate
ratios, namely 80/20, 50/50 and 20/80. Their testing program was further based on two
different types of clinker, one more reactive (i.e. with an orthorhombic morphology of
C3A and a high content of alkalies) than the other. The “reactive” clinker was ground to
two different levels of fineness, namely 300 and 400 m2/kg and 3% of sulphates were
added with different gypsum-hemihydrate ratios. The less reactive clinker was ground to
a fineness of 300 m2/kg and 1,2 and 3% of sulphates were added with different gypsum-
hemihydrate ratios. The mixtures which contained sulphonated melamine formaldehyde
were mixed using a water-cement ratio of 0.45. The mixtures which did not contain
superplasticiser were mixed using a water-cement ratio of 0.61. The mixtures were tested
After 1, 20, 30, 50 and 70 minutes of mixing using a coaxial viscometer of type BML-
Viscometer. Mork and Gjoerv [13] concluded the following:
1. For the most reactive type of clinker with a high content of both C3A and alkalis, a
reduced gypsum-hemihydrate ratio from 80/20 to 20/80 reduced the yield stress,
while plastic viscosity was not much affected. The initial yield stress and the
increased yield stress over time were reduced by the reduction of gypsum-
hemihydrate ratio.
2. For the less reactive type of clinker, the effect of the gypsum-hemihydrate ratio was
not so pronounced. A tendency to false set was observed only for the lowest ratio of
20/80. For this type of clinker, the change over time in rheological properties was also

7
smaller. However, a reduced total sulphate content from 3% to 1% reduced both yield
stress and plastic viscosity.
3. In the presence of a melamine-based superplasticiser, a more pronounced effect of the
gypsum-hemihydrate ratio on the rheological properties of fresh cement pastes was
observed. However, for the most reactive type of clinker, a reduced gypsum-
hemihydrate ratio increased the yield stress, while for the less reactive type of clinker
the effect was still less pronounced. An increased fineness of the cement increased the
effect of gypsum-hemihydrate ratio, while a reduced total sulphate content reduced
the observed yield stress.
It’s the author’s belief that most commercial cements have a much lower content
of hemihydrate than those explained in Mork and Gjoerv’s study. A cement manufacturer
attempts, where possible, to produce 0% of hemihydrate in the final product since it
“kills” the workability of cement pastes. Some companies add Anhydrite instead of
gypsum to ensure that the hemihydrate content is zero. Temperature controlled grinding
may be used to convert the hemihydrate where the cost of Anhydrite is too high. The
author believes that Mork and Gjoerv’s study would have been more useful if the
gypsum-anhydrite and the anhydrite-hemihydrate ratios had also been investigated.
However the study of Mork and Gjoerv gave the author the idea for the tests which are
described in this paper. These tests include 12 different mixes with different ratios
between gypsum, hemihydrate, and anhydrite.
An initial trial from this programme has been reported (1,2). In this experiment
cement clinker without added sulphate was ground and mixed with pure gypsum and pure

8
anhydrite. The results are shown in table 1, and indicate a substantially higher
workability with Gypsum.
TABLE 1 Effect of Sulphates [1,2]
Plasticiser Property Gypsum Anhydrite
SMF Viscosity
Pa s 10-7
12.7 105.5
SMF Yield
Pa 10-7
575.2 2524.2
SNF Viscosity
Pa s 10-7
6 68
SNF Yield
Pa 10-7
102.6 1611
EXPERIMENTAL METHODS
Materials
Cements were obtained from different commercial suppliers. Three different
superplasticising admixtures were used:
Sulphonated Melamine Formaldehyde (SMF)
Sulphonated Napthalene Formaldehyde (SNF)
Lignosulphonate (LS)
Rheological Tests
The Rheometer: This test measures the viscosity and the shear stress of a cement paste. A
Rheology International Series 2 viscometer Model RI:2:M was used. The viscometer was

9
chosen with a medium spring to be able to obtain more accurate data at low speeds. The
Bingham model was used to determine the plastic viscosity and the yield value.
It should be noted that the rheology of Bingham plastics is not very sensitive to
temperature, but the rate of change of rheology with time in a chemically reacting system
containing cement is affected by temperature. It is preferable to standardise both the test
temperature and the time after mixing at which the test is performed [Banfill 1994]. All
the tests reported here were performed at 20 1º C. The test materials were stored at this
temperature for at least 48 hours before use.
A four-bladed vane spindle (Figure 1) was used for this work. The vane had four
rectangular blades of radius, Rv, 9.5 mm and height, h, 38 mm and was placed in a cup of
radius 27.5 mm centrally mounted on the lower plate. Because of the restricted torsion of
the spring which moves the spindle, these actual dimensions do not comply with those
recommended the ASTM [ASTM D2573] (Rv=19.05 mm and h=76.2 mm). However, the
actual rheometer used was capable of producing comparative data on which decisions
regarding mix could be made.
The shear stress, , was calculated from the torque (T) using the following
conversion formulae:
= 3T/(2 (Rv3+3 Rv
3h)) [15]
The Testing Cycle
The testing cycle (Fig. 2) was chosen in order to keep within the restrictions of the
apparatus and reduce the anti-thixotropic behaviour that the material might have. It was
noticed that reducing the readings on the down-curve from 20 data points to 10 did not
10
affect the accuracy in obtaining the yield value and the viscosity. However, reducing the
number of points on the down curve helped obtain a positive value of the slope
(viscosity). This was because shortening the cycle reduced the effect of shear-thickening
(anti-thixotropy) which some cement pastes have. The up-curve utilised 20 data points to
ensure that the break point could be determined more accurately
The testing cycle was checked by performing a series of "single point" tests at
fixed speeds and comparing the results with a test using the normal testing cycle. The
results were very similar which indicated that they were not a product of the particular
testing cycle that was used.
Figure 2 also shows how the viscosity, yield point and break point are derived
from the results of the cycle. Relating these to practical applications, the break point
indicates how easily a mix may be moved from a static position (e.g. resting in a pipe).
The yield shows the resistance to flow (e.g. pumping pressure) at slow speeds and the
viscosity shows how the resistance to flow increases as the speed (e.g. the rate of
pumping) increases.
.
The effect of mixing speed and time on the rheological properties
It was noticed that the speed of mixing affected the initial flow of the cement
paste when mixed for 5 minutes. A standard mixing speed and mixing time had to be
chosen for the final testing. A series of tests on trial samples were carried out. Different
mixing speeds (900, 1100, 1300, 1500 and 1900 rpm) and mixing times (2, 3, 4 and 5
minutes) were tested. The samples were tested 3 minutes after finishing mixing
11
It was found that (Figure 3) mixing for longer times (4 & 5 minutes) gave a better
workability and stability for the cement pastes. Mixing for 2 or 3 minutes was inadequate,
and that caused the unexpected increase of break point value with the increase of speed.
Mixing at very high speeds (>1100 rpm) gave a high workability and made the cement
paste too thin for the rheometer (anti-thixotropic behaviour). Therefore the following
mixing method was used:
After pouring all the material into the mixing beaker, while the mixer’s spindle
was rotating at 1100 rpm, the timing was started. After 40 seconds the speed was raised
to 1900 rpm for 20 seconds to ensure that all the lumps were broken. The speed was
reduced to 1100 rpm for 2 minutes and 40 seconds (i.e. 160 seconds) and again raised to
1900 rpm for 20 seconds. Finally the speed was lowered to 1100 rpm for 1 final minute
of mixing. This made the total mixing time equal to 5 minutes. When not using any water
reducer or when using lignosulphonate plasticiser, the mixing speed was kept at 1900
rpm for the complete 5 minutes to ensure that the material would be workable enough for
the rheometer. This mixing method was used to ensure that no lumps would form and the
cement paste would be properly mixed.
Relating this mixing to the methods used in practice is difficult because no
shearing was used. In a commercial grout mixer the pumping action will shear the mix
and this will provide effective mixing at relatively low speeds. In concrete the aggregate
will shear the paste during mixing.
The standing time of the cement paste

12
The standing time of the cement paste before testing affected its rheological
properties. Three samples were tested at different standing times; 0.5, 1, 2, 3 and 4
minutes. Increasing the standing time increased the yield value (Figures 4a and 4b). A
standing time of 1 minute was chosen to give enough time to load the sample into the
rheometer and start testing.
Mix Designs
After studying all the initial tests the final mix designs were chosen as follows:
Blank sample without any plasticiser
Cement 100%
W/c 0.50
SNF/SMF sample
Cement 99.70%
SNF/SMF 0.30%
W/c 0.40
LS sample
Cement 99.70%
LS 0.30%
W/c 0.45
The amount of powder used in the samples was 300 g.
Measurement of Particle Size and Specific Surface Area
13
Testing of particle size was performed using the Malvern 2600 particle sizer with
dry-powder feeder. This semi-computerised particle sizer has three lenses to cover a
range from 0.5 m to 568 m. The analyses were in the range of 1.22 - 188 m. The
SSA was automatically calculated by the computer. The tests were performed in
triplicate, each time with approximately 150 g. If any drift in the results was observed,
the analysis was repeated. Six sieve sizes were used: 90.9 m, 73.1 m, 50.8 m, 30.6
m, 10.3 m, 3.46 m and < 3.46 m.
ThermoGravimetric Measurements
A Setaram TG system was used and it was able to detect the free water (<105º C)
and combined water (>105º C) present. The heating rate was 2º C/minute and the sample
size was 150mg.
X-Ray Fluorescence
Cement samples were analysed for the following oxides: SiO2, Al2O3, Fe2O3, CaO, MgO,
K2O, Na2O, Mn3O4, P2O5, SO3, TiO2, ZrO2, Cr2O3, BaO and SrO. The analysis was
carried out using a Philips PW2400 XRF spectrometer
X-Ray Diffraction
XRD was used to determine the quantity of hemihydrate (CaSO4.½H2O) in the
cement. In order to measure this, preliminary scans were performed on:
Anhydrite (CaSO4) to check that the peaks of calcium sulphates and help in
predicting the region where the distinctive peaks of hemihydrate might appear,
14
hemihydrate to determine the distinctive peaks of hemihydrate,
clinker with added gypsum to check that the peaks of gypsum do not overlap with the
distinctive peaks of hemihydrate.
clinker (with no added sulphates) to be able to compare it with the analysis graphs of
the tested samples.
After considering the XRD spectrum, it was decided to discard the first peak of
hemihydrate since it overlapped with the gypsum peaks. Calculating the amount of
hemihydrate was easy, the distinctive peak of hemihydrate height represented 100% of
hemihydrate content, while the same “region” in clinker represented 0% of hemihydrate.
The XRD analyses of 14 cements were compared with the clinker analysis to detect the
hemihydrate peak and calculate its content.
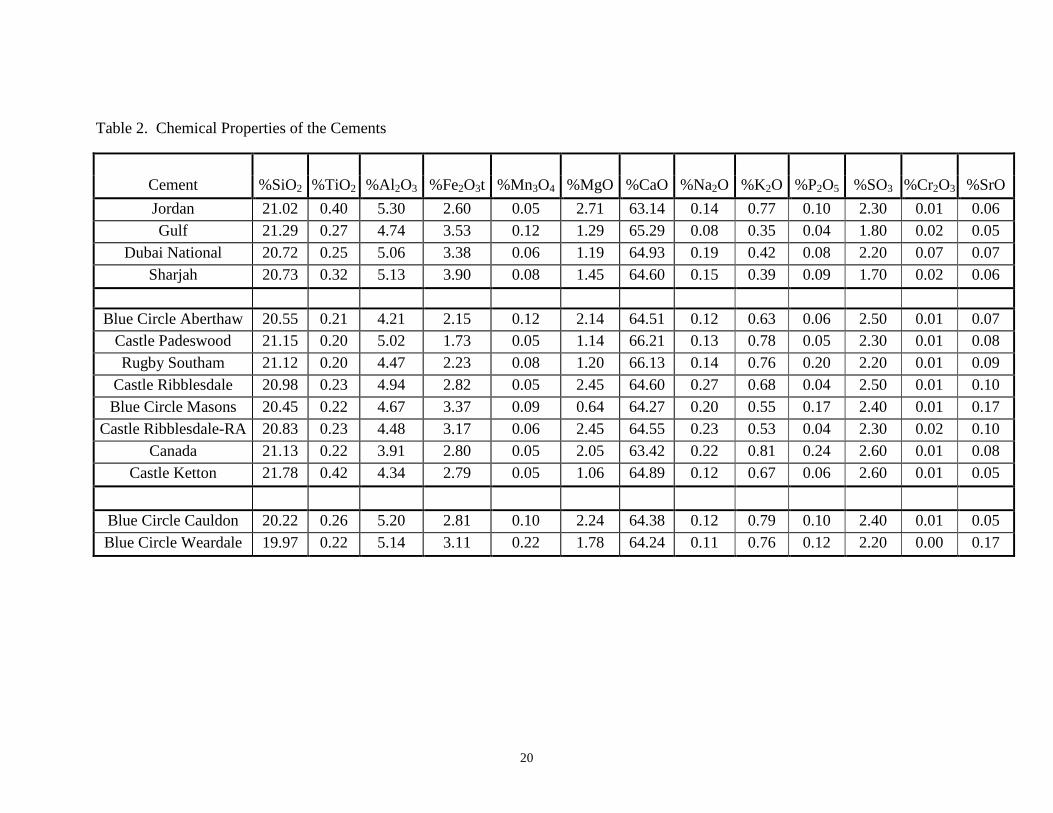
RESULTS
The results are shown in Tables 2 to 4. These results will not have been as
accurate as the resolution shown in the table but, in line with statistical practice, they
were not rounded before use in the calculations. The chemical and physical properties of
the cements were correlated to the rheological properties of cement pastes using
statistical computer programs. It was observed that the flow of cement paste is dependent
mainly on SSA and Particle Size Distribution which is correlated to SSA. The effect of
SSA was removed to reveal other factors which could affect the flow. The other main
factors were removed in turn. The most important factor to consider when building a
model is the level of significance (P-value) of each estimated coefficient. The lower the

15
P-value, the more significant the contribution of that variable to the model. A 0.05 P-
value indicates a 5% probability that the relationship between two variables could have
happened by chance. The highest acceptable level of significance in the present analysis
was 0.05.
It was noted that multiple regression can sometimes suggest spurious relationships
between variables, particularly where the independent variables are themselves highly
correlated. Care was taken to ensure that relationships can be supported by experimental
evidence. Precautions were also taken against the danger of building a theory on one or
two pieces of influential data which could be “rogue” values or “outliers”.
The final flow models for the Break Point were (Figure 6):
Break Point (Blank) [Pa] = –1171[Pa] + 1178 Hemihydrate%[Pa] + 6 SSA [Pa kg/m2]
Break Point (SMF) [Pa] = – 7205[Pa] – 22380 Cr2O3%[Pa] – 10890 Na2O%[Pa] +
1242 Al2O3%[Pa]+ 17 SSA [Pa kg/m2]
Break Point (SNF) [Pa] = – 20344[Pa] + 2343 Al2O3%[Pa] + 31 SSA [Pa kg/m2]
Break Point (LS) [Pa] = – 6244[Pa] –24468 Cr2O3%[Pa] + 1128 Al2O3%[Pa] + 7 SSA
[Pa kg/m2]
The final flow models for the Yield value were (Figure 7):
Yield (Blank) [Pa] = –1259[Pa] + 1352 Hemihydrate%[Pa] + 6 SSA[Pa kg/m2]
Yield (SMF) [Pa] = – 8999[Pa] – 26012 Cr2O3%[Pa] + 1228 Al2O3%[Pa] + 17 SSA
[Pa kg/m2]
Yield (SNF) [Pa] = – 17278[Pa] + 1965 Al2O3%[Pa] + 28 SSA[Pa kg/m2]
Yield (LS) [Pa] = – 10504[Pa] + 1138 Al2O3%[Pa] + 19 SSA [Pa kg/m2]

16
The final flow model for the Plastic Viscosity was (Figure 8):
Plastic Viscosity (blank) [Pa s] = 77[Pa s] + 50 Hemihydrate% [Pa s] – 14 Al2O3%[Pa
s]
No models for plastic viscosity for the superplasticised samples could be developed.
DISCUSSION
The main observations from these results are:
The present results do not indicate that there is no effect of any given factor- they
only indicate that it is not an effect which is statistically significant at the 5% level
It is not indicated that the effect of sulphate morphology (i.e the relative amounts of
gypsum, hemihydrate and anhydrite) is very significant. The hemihydrate is only
significant where no admixtures are used. This partially contradicts the findings
which were indicated in the literature and the preliminary work however these results
refer to total amounts present rather than the amounts in solution. Another factor
(e.g. the chromate discussed below) could be controlling solubility and thus be more
significant.
The significance of the Aluminate phases. This was expected from the literature.
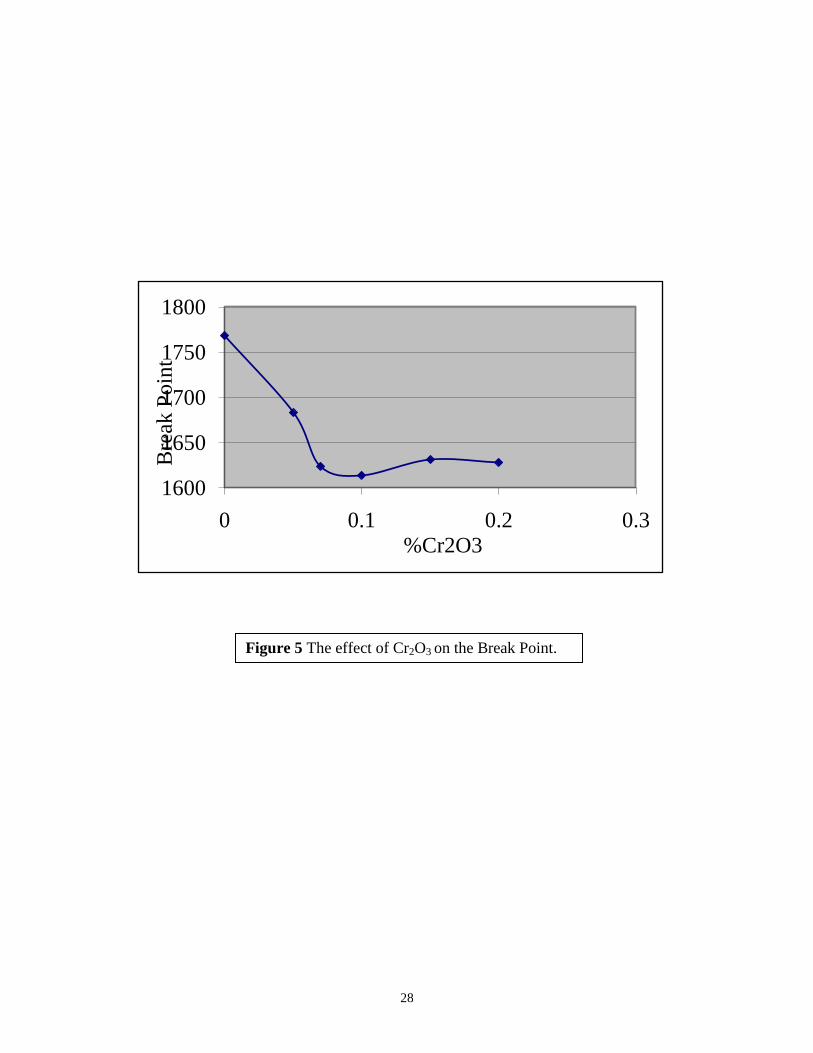
An unexpected effect of the Chromate phases was observed. A brief additional
experimental programme was carried out to investigate this observation.
Blue Circle Wardale (BCW) cement was chosen to study the effect of various
levels of Cr2O3 (0, 0.05, 0.07, 0.10, 0.15 and 0.20%) on the flow. This particular cement
was chosen since it contains no Cr2O3. All mixes were performed using the standard
mixing method used for Blank mix. Figure 5 illustrates the effect of Cr2O3. These

17
experimental results suggest that the significant relationship between Break Point and
Cr2O3 found by statistical analysis is genuine. Chromates are known to be retarders and
in some cements special measures are taken to reduce the adverse effects of CrVI
by
reducing it to CrIII
. Further investigation would be required to determine how this would
affect the models for their workability when superplasticised. In particular the effect of
chromates on sulphate solubility may be significant.
CONCLUSIONS
For all cementitious mixtures the Specific Surface Area of the cement has the greatest
influence on workability.
For cementitious paste mixtures without admixtures the hemihydrate content has a
significant effect on workability.
For cementitious mixtures with SMF, SNF or LS admixtures the workability
generally increases with decreasing aluminate content.
For mixes with SMF and LS admixtures the workability generally increases with
increasing chromate content.
ACKNOWLEDGEMENT
The authors would like to acknowledge the support of Fosroc International in this work.
REFERENCES
1. Claisse P A and Al Omari M 1999, The Effect of Changes in Cement on the Properties
of Cement Grouts with Superplasticising Admixtures, Proc. "The Role of Admixtures in
18
High Performance Concrete", RILEM International Symposium, Monterrey, Mexico,
March 21-26
2. Omari M A, 1999, Workability of Cement Pastes, PhD Thesis, Coventry University.
3. Greszczyk S. and Kucharska L., 1991, “The Influence of Chemical Composition of
Cement on the Rheological Properties”, Rheology of Fresh Cement and Concrete, Edit by
Banfill PFG, pp 27-36.
4. Collepardi M., 1971, “The Rheological Behaviour of Cement Pastes”, Il Cemento, Vol
68, pp 99-106.
5. Von Berg W, 1979, “Influence of Specific Surface and Concentration of Solid upon
the Flow Behaviour of cement pastes”, Magazine of Concrete Research, Vol 31, pp211-
216.
6. Oaler I., Becker I. and Weiss B., 1978, “Rheological Properties of Cement Pastes”, Il
Cemento, Vol 3, pp 303-310.
7. Banfill P.F.G., 1981, “On the Viscometric Examination of Cement Pastes”, Cement
and Concrete Research, Vol11, pp 363-370.
8. Hakansson U., Hassler L. and Stille H., 1997, “Rheological Properties of Microfine
Cement Grouts”, Tunnelling and Underground Space Technology, Vol 7, No 4, pp 453-
458.
9. Older I., Duckstein U. and Becker T., 1978, Cement and Concrete Research, Vol 8, pp
469.
10. Banfill P.F.G., 1981 b, “A viscometric examination of cement pastes containing
superplasticisers with a note on experimental techniques”, Magazine of Concrete
Research, pp 33, 37-47.

19
11. Bombled J.P., 1980, “Influence of sulphates on the rheological behaviour of cement
pastes and their evolution”, Proceedings of the 7th
Int. Congress on the Chemistry of
Cement, Vol 3, pp 164-169.
12. Banfill P.F.G., 1983, “A Viscometric Study of Cement Pastes Containing
Superplastesizers with a Note on Experimental Techniques”, Magazine of Concrete
Research, Vol 33, pp 37-47.
13. Mork J.H. and Gjoerv O.E., March-April 1997, “Effect of Gypsum-Hemihydrate
Ratio in Cement on Rheological Properties of Fresh Concrete”, ACI Materials Journal, pp
142-146.
14. Dodson V.H. and Hyden T.D., 1990, “Another Look at the Portland
Cement/Chemical Admixture Incompatibility Problem: How Effectively Use the Newest
Admixtures”, SCM 23-90, American Concrete Institute, Detroit.
15. Banfill P.F.G. and Kitching D.R., 1990, “Use of a Controlled Stress Rheometer to
Study the Yield Stress of Oilwell Cement Slurries”, pp 125-135.
20
Table 2. Chemical Properties of the Cements
Cement %SiO2 %TiO2 %Al2O3 %Fe2O3t %Mn3O4 %MgO %CaO %Na2O %K2O %P2O5 %SO3 %Cr2O3 %SrO
Jordan 21.02 0.40 5.30 2.60 0.05 2.71 63.14 0.14 0.77 0.10 2.30 0.01 0.06
Gulf 21.29 0.27 4.74 3.53 0.12 1.29 65.29 0.08 0.35 0.04 1.80 0.02 0.05
Dubai National 20.72 0.25 5.06 3.38 0.06 1.19 64.93 0.19 0.42 0.08 2.20 0.07 0.07
Sharjah 20.73 0.32 5.13 3.90 0.08 1.45 64.60 0.15 0.39 0.09 1.70 0.02 0.06
Blue Circle Aberthaw 20.55 0.21 4.21 2.15 0.12 2.14 64.51 0.12 0.63 0.06 2.50 0.01 0.07
Castle Padeswood 21.15 0.20 5.02 1.73 0.05 1.14 66.21 0.13 0.78 0.05 2.30 0.01 0.08
Rugby Southam 21.12 0.20 4.47 2.23 0.08 1.20 66.13 0.14 0.76 0.20 2.20 0.01 0.09
Castle Ribblesdale 20.98 0.23 4.94 2.82 0.05 2.45 64.60 0.27 0.68 0.04 2.50 0.01 0.10
Blue Circle Masons 20.45 0.22 4.67 3.37 0.09 0.64 64.27 0.20 0.55 0.17 2.40 0.01 0.17
Castle Ribblesdale-RA 20.83 0.23 4.48 3.17 0.06 2.45 64.55 0.23 0.53 0.04 2.30 0.02 0.10
Canada 21.13 0.22 3.91 2.80 0.05 2.05 63.42 0.22 0.81 0.24 2.60 0.01 0.08
Castle Ketton 21.78 0.42 4.34 2.79 0.05 1.06 64.89 0.12 0.67 0.06 2.60 0.01 0.05
Blue Circle Cauldon 20.22 0.26 5.20 2.81 0.10 2.24 64.38 0.12 0.79 0.10 2.40 0.01 0.05
Blue Circle Weardale 19.97 0.22 5.14 3.11 0.22 1.78 64.24 0.11 0.76 0.12 2.20 0.00 0.17

21
Table 2 continued
Cement %ZrO2 %BaO LOI Total% C4AF C3A C2S C3S %Anhydrite %Gypsum Hemihydrate
Jordan 0.01 0.01 1.23 99.85 7.90 9.65 16.61 57.89 1.35 0.75 0.30
Gulf 0.00 0.01 1.08 99.96 10.73 6.60 10.50 67.03 0.90 0.60 0.30
Dubai National 0.01 0.01 1.32 99.96 10.28 7.70 8.16 67.96 1.10 0.78 0.32
Sharjah 0.01 0.02 1.57 100.22 11.86 7.00 10.18 65.32 0.40 1.11 0.19
Blue Circle Aberthaw 0.01 0.04 2.57 99.90 6.54 7.52 2.35 75.01 0.95 1.40 0.15
Castle Padeswood 0.01 0.02 1.15 100.03 5.26 10.38 5.95 72.53 1.27 0.83 0.20
Rugby Southam 0.01 0.01 1.20 100.05 6.78 8.08 3.68 75.41 1.25 0.70 0.25
Castle Ribblesdale 0.01 0.02 0.68 100.38 8.57 8.33 10.20 66.24 1.62 0.67 0.21
Blue Circle Masons 0.01 0.02 2.66 99.90 10.24 6.68 5.88 69.96 1.45 0.50 0.45
Castle Ribblesdale-RA 0.01 0.02 0.79 99.81 9.64 6.51 7.11 69.77 1.60 0.34 0.36
Canada 0.02 0.03 2.24 99.83 8.51 5.63 9.87 67.25 1.80 0.20 0.60
Castle Ketton 0.02 0.02 1.07 99.95 8.48 6.79 13.11 65.42 1.91 0.54 0.15
Blue Circle Cauldon 0.01 0.02 1.09 99.80 8.54 9.03 5.64 69.39 1.70 0.50 0.20
Blue Circle Weardale 0.01 0.02 2.02 100.09 9.45 8.37 3.94 70.70 1.20 0.70 0.30
The cements were separated into three groups according to their SSA.
The Bouge equations were used to calculate the amount of phases.

22
Table 3. Physical Properties of the Cements
SSA PSD PSD PSD PSD PSD PSD PSD
Cement m2/kg 90.9 m 73.1 m 50.8 m 30.6 m 10.3 m 3.46 m <3.46 m
Jordan 290.20 5.20 3.10 12.40 21.30 29.90 20.20 7.90
Gulf 305.40 5.20 2.80 5.50 15.20 38.70 24.80 7.80
Dubai National 306.70 5.90 3.90 9.10 17.40 33.40 21.70 8.60
Sharjah 323.70 3.40 2.70 6.50 18.60 36.60 23.20 9.00
Blue Circle Aberthaw 358.80 1.40 1.20 5.00 18.30 39.00 24.90 10.20
Castle Padeswood 361.00 2.80 2.20 8.10 17.80 32.00 26.50 10.60
Rugby Southam 364.00 2.80 2.70 8.30 17.60 32.10 25.40 11.10
Castle Ribblesdale 375.40 0.70 0.70 3.90 15.50 41.30 27.30 10.60
Blue Circle Masons 376.40 3.40 0.20 2.40 12.40 42.80 28.00 10.80
Castle Ribblesdale-RA 377.80 1.50 1.30 4.20 14.40 39.80 27.80 11.00
Canada 379.40 1.00 1.10 6.00 17.90 36.60 26.10 11.30
Castle Ketton 381.20 1.30 1.00 4.40 14.90 40.00 27.30 11.10
Blue Circle Cauldon 397.80 1.70 1.60 6.00 18.10 34.90 25.30 12.40
Blue Circle Weardale 434.30 2.20 1.60 5.90 17.20 32.00 27.00 14.10
Table 4. Results from the Rheological Tests

23
Blank Blank Blank SMF SMF SMF SNF SNF SNF LS LS LS
Cement Break Point Viscosity Yield Break Point Viscosity Yield Break
Point
Viscosity Yield Break
Point
Viscosity Yield
Jordan 1043.20 18.42 1041.20 2061.30 36.99 1574.30 811.80 13.26 721.66 1923.60 39.46 1352.00
Gulf 885.50 21.46 957.52 2919.10 100.48 2015.00 1165.40 41.62 1415.50 487.00 15.75 709.90
Dubai National 870.00 10.84 986.88 401.10 3.98 521.12 129.00 6.86 166.98 159.40 5.10 136.37
Sharjah 1263.30 22.63 1248.30 3203.20 77.22 2891.60 2189.50 29.56 2431.50 1781.50 26.23 1902.70
Blue Circle Aberthaw 1008.30 21.02 1122.10 2725.00 57.66 2759.4 1371.60 9.81 1703.70 953.10 17.90 1353.90
Castle Padeswood 1192.30 18.32 1151.30 3050.80 54.55 3047.50 1938.30 21.53 2261.40 1490.30 21.16 1712.20
Rugby Southam 1312.30 35.02 1229.90 2452.30 61.46 2317.60 1536.80 18.10 1985.00 865.00 7.69 1293.10
Castle Ribblesdale 1237.30 25.14 1251.50 2172.20 100.91 3317.20 4007.40 91.31 3833.50 1960.00 43.10 2367.60
Blue Circle Masons 1514.90 33.54 1570.90 2394.00 60.33 3078.7 1182.70 8.66 1791.00 1549.30 20.47 2497.20
Castle Ribblesdale-RA 1417.70 33.45 1347.20 1983.30 39.00 2510.30 768.50 10.05 1132.30 587.50 9.58 1064.60
Canada 1926.73 57.50 2079.70 1411.52 27.87 1278.40 473.41 13.18 284.59 1404.60 66.15 941.33
Castle Ketton 1282.40 21.28 1340.50 2674.80 62.22 2865.00 1544.90 14.28 2175.70 1273.70 14.95 1903.30
Blue Circle Cauldon 1582.20 20.88 1664.40 4445.90 89.02 3920.3 4123.50 59.90 4048.90 2407.10 28.34 2773.40
Blue Circle Weardale 1772.60 19.15 1874.90 5428.40 Stiff Stiff 5542.80 Stiff Stiff 2927.00 40.50 3587.40

24
Figure 1 Schematic diagram showing the dimensions of the four-bladed
vane spindle and the beaker during testing.
19 mm
38 mm
19 mm
19 mm
10 mm
55 mm
13 mm Side View
Top View
In the beaker with grout
Bre
ak P
oin
t (N
m-2
x 1
0-7
)

25
0.0
1000.0
2000.0
3000.0
4000.0
5000.0
6000.0
700 900 1100 1300 1500 1700 1900 2100
Bre
ak P
oin
t
Mixing Speed (rpm)
2 Minutes 3 Minutes
4 Minutes 5 Minutes
Figure 3 The effect of mixing speed and mixing time on the rheology of
cement pastes.

26
0500
1000150020002500300035004000
0 1 2 3 4 5 6 7 8 9 10
Sh
ear
Str
ess
Shear Rate
Shea
r S
tres
s (N
m-2
x 1
0-7
) Y
ield
Str
ess
(Nm
-2 x
10
-7)
Figure 2 The testing cycle.
Shear Rate (s-1
)
Break point measured on "up" curve
viscosity is gradient of "down" curve
Yield is intercept of "down" curve

27
0500
100015002000250030003500
0 2 4 6
Yie
ld S
tres
s
Standing Time (minutes)
0
1000
2000
3000
4000
5000
6000
0 2 4 6
Yie
ld S
tres
s
Standing Time (minutes)
Figure 4a Standing time determination using SMF.
Figure 4b Standing time determination using SNF.
Yie
ld S
tres
s (N
m-2
x 1
0-7
)
28
1600
1650
1700
1750
1800
0 0.1 0.2 0.3
Bre
ak P
oin
t
%Cr2O3
Figure 5 The effect of Cr2O3 on the Break Point.