Work Term Report
144
Dalhousie University Pratt & Whitney Canada Report of Fall Work Term Project: An Evaluation and Analysis of Plant 41’s Water Consumption Tracking System ENVE 8891: Work Term I. August 31 st – December 18 th , 2015 Role of the Environment, Health & Safety Department at Pratt & Whitney Canada Performed at: Computer Integrated Manufacturing (Plant 41) 189 Pratt & Whitney Drive, Aerotech Business Park Enfield, N.S. Written by: Benjamin Corkum (B00547185) Dalhousie University Environmental Engineering C-op Student Supervisors: Michel Raymond and Mary Miles (P.Eng) Environment, Health & Safety Specialists
-
Upload
benjamin-corkum -
Category
Documents
-
view
150 -
download
6
Transcript of Work Term Report

Dalhousie University Pratt & Whitney Canada
Report of Fall Work Term Project:
An Evaluation and Analysis of Plant 41’s Water Consumption Tracking System
ENVE 8891: Work Term I.August 31st – December 18th, 2015
Role of the Environment, Health & Safety Department at Pratt & Whitney Canada
Performed at:Computer Integrated Manufacturing (Plant 41)
189 Pratt & Whitney Drive, Aerotech Business ParkEnfield, N.S.
Written by:Benjamin Corkum (B00547185)
Dalhousie University Environmental Engineering C-op Student
Supervisors:Michel Raymond and Mary Miles (P.Eng)Environment, Health & Safety Specialists
In partial fulfillment of the requirements of the Dalhousie Engineering Co-operative Education Program
Date: January 5, 2015

P&WC Proprietary Information Data Export Classification [No Technical Data]
TABLE OF CONTENTS
LIST OF TABLES..................................................................................................iiLIST OF FIGURES............................................................................................... iiiABSTRACT.......................................................................................................... ivACKNOWLEDGEMENTS.....................................................................................v1. INTRODUCTION...............................................................................................1
1.1 – Pratt & Whitney Canada and The Plant 41 Facility..........................................11.2 - Environmental Sustainability Goals: Water Consumption..............................11.3 –Past Work and Recommendations.....................................................................31.4 –Water Consumption Tracking System Project..................................................4
2. PLANT 41 WATER CONSUMPTION & TRACKING ANALYSIS.....................62.1 – Current Situation.................................................................................................6
2.1.1 - Current Water Meter Tracking System............................................................62.1.2 – Plant 41’s Total Annual Water Consumption from 2012-2015.......................82.1.3 – Weekly and Annual Water Consumption for Each Industrial Water User......9
2.2 – The Daily Water Investigation..........................................................................132.2.1 – Daily Investigation Results...........................................................................142.2.2 – Problems with current water tracking system...............................................19
2.3 – The Proposed Solution.....................................................................................202.3.1 – Additional Tracking.......................................................................................212.3.2 – The New Tracking System...........................................................................22
2.4– Project Timeline..................................................................................................292.5 – Investment.........................................................................................................302.6 – Savings...............................................................................................................332.7 – Alternative Solutions Considered....................................................................34
3. CONCLUSION AND RECOMMENDATIONS..................................................363.1 – Justification for Pursuing this Project............................................................363.2 – Recommendations and Future Work...............................................................38
4. REFERENCE MATERIAL...............................................................................394.1 – References.........................................................................................................394.2 – Project Contact Information.............................................................................394.3 – Appendices........................................................................................................40
4.3.1 – Appendix A: Previous Weekly Consumption and Total Consumption..........404.2.2 – Appendix B: Monthly Water Bill Data...........................................................574.2.3 – Appendix C: Current Water Balance Method...............................................604.2.4 – Appendix D: Daily Water Investigation Results............................................614.2.5 – Appendix E: Additional Quotes.....................................................................744.2.6 – Appendix F: Monthly Experience Records...................................................77
i

P&WC Proprietary Information Data Export Classification [No Technical Data]
LIST OF TABLES
TABLE 2.1.1A – THE CLASSIFICATIONS FOR ALL OF THE EXISTING WATER METERS WITHIN PLANT 41. 7
TABLE 2.1.2A - ANNUAL WATER CONSUMPTION DATA (2012-2015). 8
TABLE 2.1.2B - ANNUAL INCREASES FOR WATER CONSUMPTION DATA (2012-2015). 9
TABLE 2.1.3A - 2014-2015 INDUSTRIAL ANNUAL WATER CONSUMPTION FOR OVER-USERS 12
TABLE 2.3.1A – THE ADDITIONAL TRACKING LOCATIONS 22
TABLE 2.3.2A – THE OPERATING SPECIFICATIONS FOR THE OMNI T2 METERS 23
TABLE 2.3.2C – THE TECHNICAL DATA FOR THE CARLON JLP METERS 25
TABLE 2.3.2D – A SUMMARIZATION OF THE SIGNAL STRENGTH AT EACH TESTED LOCATION 28
TABLE 2.5A - THE QUOTATION ISSUED TO PLANT 41 FROM SCOTIA TECH FLUID SERVICES 31
TABLE 2.5B - THE QUOTATION ISSUED TO PLANT 41 FROM TRIHEDRAL ENGINEERING LTD. 31
TABLE 2.5C - THE QUOTATION ISSUED TO PLANT 41 FROM RAE INDUSTRIAL ELECTRONICS LTD. 32
TABLE 2.5D - THE TOTAL INVESTMENT FOR THIS WATER TRACKING PROJECT 32
TABLE 2.6A - THE ANNUAL COST FOR WATER IN PLANT 41 FROM 2012-2015. 34
TABLE 2.6B -THE INCREASE IN ANNUAL COST FOR WATER CONSUMPTION FOR PLANT 41 34
ii

P&WC Proprietary Information Data Export Classification [No Technical Data]
LIST OF FIGURES
FIGURE 2.1.3A - THE WEEKLY WATER CONSUMPTION FOR THE BAKER
BROTHERS 10
FIGURE 2.1.3B. THE TOTAL CONSUMPTION FOR THE BAKER BROTHERS 11
FIGURE 2.2.1A – THE DAILY WATER METER READINGS FOR PLANT 41 15
FIGURE 2.2.1B – THE DAILY WATER CONSUMPTION FOR THE
ENTIRE PLANT 15
FIGURE 2.2.1C - A THREE WEEK MONDAY TO FRIDAY DAILY WATER
ANALYSIS FOR PLANT 41 17
FIGURE 2.2.1D – A PIE CHART ILLUSTRATING THE AVERAGE
PERCENTAGE OF WATER 18
FIGURE 2.3.2A – THE OMNI T2 WATER METER. 24
FIGURE 2.3.2B – A CROSS-SECTIONAL DIAGRAM OF THE OMNI T2
WATER METER 24
FIGURE 2.3.2C – THE CARLON JLP SERIES OF PLASTIC NYLON WATER
METERS. 25
FIGURE 2.3.2D – A MAP OF PLANT 41 SHOWING ALL OF THE SINGAL
TEST SIGHTS 27
iii

P&WC Proprietary Information Data Export Classification [No Technical Data]
ABSTRACT
This report deals with the evaluation of the current water consumption and water meter tracking system in Pratt & Whitney Canada’s Plant 41, proposing effective solutions to all identified issues. Included is a system analysis, project proposal, and tentative Business plan.
By analysing past water consumption trends for the plant, it was discovered that water was being consumed at an increasing rate from year to year, creating problems regarding corporate environmental consumption targets. The facility had spent an additional $12,000 on water by surpassing the 2015 target by 4,670 m3. With no visible specific cause to this problem, a three-week daily water balance was conducted for each water user to determine the current consumption, and any problems associated with the system.
From this daily balance, it was discovered that the current water tracking system lacked efficiency and viability by not implementing an automated computer management system in place of a manual paper system. The system recognized consumption trends after they had occurred, without preventing them from occurring in the first place. The system also lacked accuracy by not having tracked the majority of the domestic water, which was found to make up approximately 75% of the plant’s consumption.
It was concluded that the current system should be replaced by electronic water meters and a SCADA system in order to automate the management of water consumption within the facility. This technology would reduce time spent on monitoring water consumption, and would provide real-time data collection with automated email alerts to prevent over-consumption at each water user. By placing additional water meters on the domestic users, this would increase the accuracy of the system and improve water accountability. By introducing this SCADA software into the facility, more of the other manufacturing projects and processes could eventually become automated, creating an increased level of efficiency.
Ultimately, it was recommended that this project be pursued in order to meet sustainability targets for Plant 41, save company money, and increase plant efficiency through the introduction of the SCADA system.
iv

P&WC Proprietary Information Data Export Classification [No Technical Data]
ACKNOWLEDGEMENTS
This project was conducted at Pratt & Whitney Canada’s Computer Integrated Manufacturing Plant 41 in Enfield, Nova Scotia. It was performed under the direction of Environment, Health & Safety (EH&S) specialists Mary Miles and Michel Raymond. There was also lots of help and support from Plant 41’s Plant Technical Services (PTS) department, and the IT department.
The EH&S co-op student conducted this investigation with joint support from the EH&S and PTS departments; the accumulation of these efforts forming the basis of this report. All of the data from previous years was obtained from employees of Pratt & Whitney Canada’s Plant 41 and former EH&S co-op students.
v

1. INTRODUCTION
1.1 – Pratt & Whitney Canada and The Plant 41 Facility
Pratt & Whitney Canada (P&WC) is a gas turbine engine manufacturer for the
aerospace industry. They manufacture turbofan, turboprop, and turbo shaft aircraft
engines for commercial airlines and military aviation. P&WC is a division of the larger
US-based Pratt & Whitney (P&W), and both are subsidiaries of the United Technologies
Corporation (UTC). Pratt & Whitney is one of the leading aviation engine manufacturers
in the world, competing with companies General Electric and Rolls-Royce. Pratt &
Whitney Canada has been given a world mandate to manufacture smaller aircraft engines,
while Pratt & Whitney (US) manufacture larger engines. All of the information in the
above paragraph was acquired from the Pratt & Whitney Canada corporate website (Pratt
& Whitney Canada Web, 2015).
The Computer Integrated Manufacturing facility (Plant 41) in Enfield, Nova Scotia is
a manufacturing plant that possesses three main Production & Assembly lines: the case
line, blade line, and sub-assembly line (Pratt & Whitney Canada, 2015). As the names
suggest, the case line machines and paints transmission boxes and engine cases, and the
blade line machines nickel alloy turbine blades (Pratt & Whitney Canada, 2015). The sub-
assembly line consists of small engine assembly; consisting of fuel control units, starter
control twin-valves, prop reverse, oil filter twin-valves, T-5 assembly, accessory
gearboxes, and turbine disks (Pratt & Whitney Canada, 2015). For reference purposes, the
chemical line within the Case line is called the Baker Brothers line, and the chemical line
within the Blade line is called the Napco Line.
1.2 - Environmental Sustainability Goals: Water Consumption
The Environmental Health & Safety department (EH&S) is responsible for controlling
interactions with the environment by minimizing harmful emissions, regulating water

P&WC Proprietary Information Data Export Classification [No Technical Data]
consumption, and managing pollution prevention (Pratt & Whitney Canada Web, 2015).
They’re also responsible for the health and safety of the public and their employees, by
minimizing hazards, accidents, and occupational illness (Pratt & Whitney Canada Web,
2015).
Large companies and businesses (like P&WC) consume enormous quantities of water
and produce an increasing amount of wastewater. This means that there is an increased
necessity for environmentally responsible water monitoring, water treatment, and closed
loop implementation. By wasting water, it depletes energy reserves, compromises
ecosystem health, and yields sustainability issues. In an attempt to aggressively reduce
their environmental footprint, Pratt & Whitney Canada has implemented aggressive
sustainability goals for the year 2028 (McGowan, 2015). These goals involve reduction
emissions, zero waste discharged, carbon neutrality, and the creation of sustainable
products (McGowan, 2015). When addressing water consumption, the concept of zero
waste can be illustrated by considering the use of closed loop systems (McGowan, 2015).
In a closed loop system, a process waste stream is treated and then fed back into the
system for re-use, in an attempt to completely stop all water use for that process
(McGowan, 2015). When considering these aggressive environmental goals, it is
important to look for new ways to work towards them.
As part of UTC’s water pollution prevention and control, as well as their standard
environmental, health and safety practice, an annual water balance for each facility is a
requirement (MacDonell, 2000). This task aims to account for all of the water that enters
the plant, and balance it with the water being used in each industrial process and the water
leaving the plant via sewer. This means that the facility needs to have an effective method
of accurately measuring the water that it uses.
In an attempt to aggressively limit their impact on the environment, UTC uses the
Environmental Metrics Process (McGowan, 2015). This process involves setting
environmental goals for the entire corporation, and then breaking it down by assigning
goals to the various business units, such as Pratt & Whitney Canada (McGowan, 2015).
2

P&WC Proprietary Information Data Export Classification [No Technical Data]
Pratt & Whitney Canada will then give each of their facilities a set of five annual
environmental targets to meet based on five environmental metrics (McGowan, 2015).
These metrics include: greenhouse gas emissions, non-greenhouse gas emissions, total
industrial process waste, non-recycled industrial process waste, and water consumption
(McGowan, 2015). Using these targets, the individual facilities (i.e. Plant 41) fulfill an
annual requirement of recording their environmental waste data and reporting it to UTC
for analysis (McGowan, 2015). If they have not met all of their targets by the end of the
reporting year, they must submit a business case requesting environmental relief. This
process allows each facility to become aware of their specific waste streams, and directs
them to implement reduction tactics and projects in order to meet the annual targets.
1.3 –Past Work and Recommendations
In the past, there has been work done by other co-op students within Plant 41
involving the performance of a water balance and analysis of the water management
system. In May of 2000, a water balance report was created by Rianne MacDonell from
the DalTech University Chemical Engineering Department which analyzes the industrial
water usage within the plant (MacDonell, 2000). MacDonell concluded that
approximately 84% of the water entering the plant was accounted for, with only 16%
being unknown (MacDonell, 2000). Ultimately, she recommended that meters should be
installed at various locations around the plant (chemical lines, cafeteria, washrooms,
waste treatment, sanitary sewer), with water conservation techniques also being practised
(MacDonell, 2000). She believed that this would make the water balance more accurate
and straightforward in the future (MacDonell, 2000).
Looking at the water management system in 2015, fifteen years later, many of
MacDonell’s suggestions have been implemented. Twenty-two cumulative water flow
meters have been installed for the industrial water users, including the chemical lines. The
plant uses a computer program known as TightVNC to monitor the amount of water
discharged to the sewer from the wastewater treatment plant. However, the cafeteria,
washrooms, and most of the other domestic water users within the plant remain
3

P&WC Proprietary Information Data Export Classification [No Technical Data]
untracked. The ability to perform an accurate water balance remains hindered without
having to make vast assumptions while calculating the domestic water consumption. The
implementation of conservation techniques has been attempted. However, an accurate
water balance to locate all of the over-users should be conducted before these techniques
are implemented, in order to avoid limiting water usage at a location that does not need it.
MacDonell stated that approximately 84% of the water entering the plant in 2000 was
accounted for. The results that were gathered from this current investigation (discussed
later) indicated that a large majority of the water entering the plant now is not being
accounted for (Figure 2.2.1C, Figure 2.2.1D). This problem of an inaccurate water
management system has been partially addressed from 2000-2015 with the installation of
these meters; however, for the reasons mentioned above, it remains unsolved.
Before this current investigation involving the 2015 water tracking system had
started, it was made aware that the plant’s water consumption over the past year had
increased approximately 17%, and was on its way to surpassing the assigned
environmental metric target. Due to the lack of water tracking on the domestic water, it is
impossible to pinpoint where the water is being over-consumed in the plant without
making large assumptions and inaccurate calculations.
1.4 –Water Consumption Tracking System Project
The primary objective of this present investigation was to analyze the current water
consumption tracking system in Plant 41 to determine why the plant was consuming more
and more water each year. Using the results of this analysis, the secondary objective was
to find and implement a solution(s) at the specific location(s) where the overconsumption
was taking place, in an overall goal to lower the water consumption within the plant. This
would allow the plant to conduct accurate water balances in order to achieve future
environmental targets and cut down on water bill expenses.
To determine why the plant was consuming more water each year, the water meter
readings, water bill data, and water balance data were analyzed for the past 3 years since
4

P&WC Proprietary Information Data Export Classification [No Technical Data]
2012. Overall trends were examined and plotted over time. The current method for water
data collection was analyzed, and then a three-week daily water data collection was
conducted for all of the meters in the plant to provide a more accurate measurement of the
water consumption. The data from this daily collection yielded many issues concerning
the current method of water data collection, as well as the water tracking system. As a
result, a solution was proposed involving the implementation of a new water consumption
tracking system to collect more accurate data and provide a more thorough investigation
of how and where Plant 41 consumes its water.
5

P&WC Proprietary Information Data Export Classification [No Technical Data]
2. PLANT 41 WATER CONSUMPTION & TRACKING ANALYSIS
2.1 – Current Situation
2.1.1 - Current Water Meter Tracking System
After walking around the Plant 41 facility a number of times, it was deduced that the
facility currently has 22 manually-read Sensus and Neptune water meters that display a
cumulative water flow reading to the viewer. They located on most of the industrial water
users on the case line, blade line, and the sub-assembly line. There is one water flow rate
indicator on the case line chemical line scrubber to set the flow to a desired value
(currently set at 0.6 gallons/minute), and there is one real-time computer program called
‘TightVNC’ that measures the outflow of industrial wastewater from the treatment
facility to the sewer. There are also two meters recording the total water coming into the
plant from Halifax Regional Municipality. A summary of Plant 41’s current meters can be
found on the next page in Table 2.1.1A.
6

P&WC Proprietary Information Data Export Classification [No Technical Data]
Table 2.1.1A – The classifications for all of the existing water meters within Plant 41.Meter # Meter Location Make/Model Pipe Size
1 Baker Brothers Sensus SR 2''2 Case Line UCL Sensus SR 3/4'' copper3 Boiler Room Sensus SR 2'' copper4 Hydroflow #1 Sensus SR 1/2''5 Hydroflow #2 Sensus SR 1/2''6 Hydroflow #3 Sensus SR 1/2''8 Coolant Room 3/5 Cell Septune T-10 1/2''8a Next to meter 8 Neptunr T-10 1/2''9 Coolant Room 1/2 Cell Sensus SR 1/2''10 Blade Line FPI Sensus 76287475 1''
10.5 Below meter 10 Sensus 75893061 1''11 Napco Line Scrubber Sensus SR 1/2''12 Napco Line Sensus SR 1''13 Blade Line UCL Sensus SR 1'' copper14 Shot Peen SWP 1/2''15 Case Line FPI Sensus SR 3/4'' copper16 Chemical Lab Sensus IPERL 1''17 Beside 10 & 10.5 Sensus SRII 3/4''
Mop Water Case line Across from Devlieg Sensus IPERL 3/4''Mop Water Blade line Enclosure beside PTS Sensus IPERL 3/4''
HRM Meter 1 Basement Neptune E-coder 3'' copperHRM Meter 2 Basement Neptune E-coder 3'' copper
These water meters are read once a week by an employee who walks around the plant
and records the cumulative flows on a sheet before inputting them into an excel document
(Appendix A). The only meters not a part of the weekly collection are the mop water
meters, the HRM meters, mater #17, and TightVNC). The cumulative flows are plotted
for each meter, and over a considerable amount of time, a trend for water consumption
can be obtained for each industrial water user (Appendix A). From this trend, it can be
observed at which points in time that there was increased water consumption from week
to week (Appendix A). Once these points in time are noted, it is up to the Environmental,
Health & Safety department and the Plant Technical Services department to figure out
why there was an increased consumption of water for those times, and to implement a
solution to prevent future overconsumption. Every year, a water balance is completed for
the plant using the water coming in from the municipality, the water consumed at each
7

P&WC Proprietary Information Data Export Classification [No Technical Data]
industrial water user, and the water released by the wastewater treatment facility
(Appendix C).
2.1.2 – Plant 41’s Total Annual Water Consumption from 2012-2015
There were various excel documents made available detailing the water management
data for the past few years. There were documents showing the 2014 and 2015 graphs of
weekly water flows for each industrial water user plotted against time (Appendix A);
there were documents detailing the monthly water bill data and usage for the entire plant
(Appendix B); there were documents showing water balances for previous years
(Appendix C); and a document showing the plant’s environmental metric target data
(Table 2.1.2A).
The first step in the investigation involved analyzing Plant 41’s total water
consumption to get an idea of how much the consumption was increasing from year to
year. By looking at the annual water consumption for the entire plant (Appendix B), it
was evident that Campus 41’s water consumption has increased significantly over the past
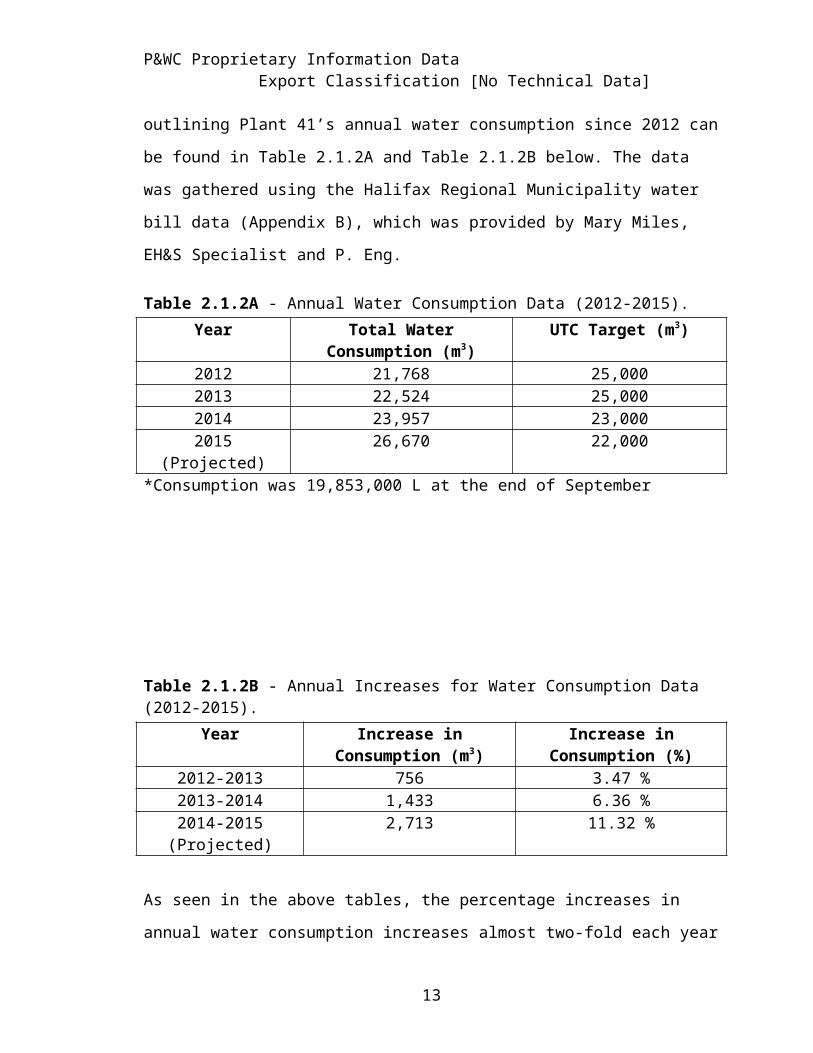
few years (from 2012 -2015) at a faster rate each year. The data outlining Plant 41’s
annual water consumption since 2012 can be found in Table 2.1.2A and Table 2.1.2B
below. The data was gathered using the Halifax Regional Municipality water bill data
(Appendix B), which was provided by Mary Miles, EH&S Specialist and P. Eng.
Table 2.1.2A - Annual Water Consumption Data (2012-2015). Year Total Water Consumption
(m3)UTC Target (m3)
2012 21,768 25,0002013 22,524 25,0002014 23,957 23,000
2015 (Projected) 26,670 22,000*Consumption was 19,853,000 L at the end of September
8
P&WC Proprietary Information Data Export Classification [No Technical Data]
Table 2.1.2B - Annual Increases for Water Consumption Data (2012-2015).Year Increase in Consumption
(m3)Increase in Consumption
(%)2012-2013 756 3.47 %2013-2014 1,433 6.36 %
2014-2015 (Projected) 2,713 11.32 %
As seen in the above tables, the percentage increases in annual water consumption
increases almost two-fold each year (Table 2.1.1B). The UTC environmental target was
also exceeded in 2014 by 957 m3 and it is anticipated (based on extrapolation) to exceed
the 2015 target by a whopping 4,670 m3 (Table 2.1.1B). These are both alarming issues
for Plant 41 not only on an environmental level (missed environmental metric targets,
enormous waste of water), but also on an economic level (more expensive water bills,
water pipe repair and leakage cleanup).
2.1.3 – Weekly and Annual Water Consumption for Each Industrial Water User
The next step in this investigation was to analyze Plant 41’s water consumption on a
specific meter basis to determine if any specific water users were responsible for the
plant’s increase in water consumption. Upon analyzing the 2014 and 2015 graphs of
weekly water consumption and annual water consumption for each industrial water user
from 2012-2015 (Appendix A), it was deduced that the weekly data was not sufficient
enough to draw any concrete conclusions. There was no raw evidence to indicate which
industrial water user was solely responsible for an increase in the plant’s water
consumption. This is partly due to the fact that out of the 17 meters that are read, a large
portion of them experience increased water consumption from year to year. Also, the
weekly collection of water consumption is not frequent enough to determine when the
consumption specifically increases or decreases from day to day. When there is a high
recorded flow for a particular user, it is narrowed down to the week it occurred as
opposed to the day or hour it occurred. This process creates a lot of confusion, as it
involves locating the operators working in the desired areas during that particular week,
and inquiring why the consumption might have been too high during that time. The
9
P&WC Proprietary Information Data Export Classification [No Technical Data]
majority of the time that the consumption was higher than normal for any water user, it
was due to an operator raising the water flow to accommodate a particular chemical or
mechanical process. The flow would then revert back to normal the following week. A
typical example of this observation (which can be seen in many of the water users) can be
seen below in the 2014-2015 weekly consumption graph for the Baker Brothers chemical
line from weeks 24-36 in 2015 (Figure 2.1.3A).
1 4 7 10 13 16 19 22 25 28 31 34 37 40 43 46 490
100
200
300
400
500
2014-2015 Baker Brothers Weekly Consump-tion
20142015
Weeks
Wat
er (I
mpe
rial G
allo
ns ÷
100
)
Figure 2.1.3A - The weekly water consumption for the Baker Brothers chemical line (case line) in 2014 and 2015. There is a multiplication factor of 100 on the measured values from the meter.*Listed below are the weeks on the figure which correspond to the beginning of each month:Week 1 - JanuaryWeek 6 - FebruaryWeek 10 - MarchWeek 14 - AprilWeek 19 - MayWeek 23 - JuneWeek 27 - JulyWeek 32 - AugustWeek 36 – SeptemberWeek 40 - October
10

P&WC Proprietary Information Data Export Classification [No Technical Data]
Week 45 - NovemberWeek 49 – DecemberThe above weekly data in Figure 2.1.3A, although providing a view as to when the
consumption was at its highest, does not provide information to deduce whether this
contributes towards the plant’s increased annual water consumption. Unless the 2015
scatter plot is significantly higher up on the graph than the 2014 scatter plot (which is not
the case above), this data is not as clear as one would like when comparing 2014
consumption to 2015 consumption (Figure 2.1.3B). If provided at a frequent rate, this
data would be more useful for a preventative action method, when attempting to see how
the consumption changes on a frequent basis (indicated by slopes on the graph) in order
to limit water use at that location immediately. This preventative action would occur after
a spike in consumption occurs (as seen by an example spike in mid-June 2015). However,
since this is an investigation involving plant-wide long term over-consumption, this data
does not offer as much information regarding meter contribution as the annual
consumption data as seen below for the Baker Brothers chemical line in Figure 2.1.3B.
0
100000
200000
300000
400000
500000
600000
700000
800000
900000
705000 739200803000 818200
Baker Brothers Total Water Consumption (January-September)
2012201320142015
Wat
er (I
mpe
rial G
allon
s)
Figure 2.1.3B. The total consumption for the Baker Brothers (Case Line) chemical line from January to September for 2012-2015.
11

P&WC Proprietary Information Data Export Classification [No Technical Data]
The above graph yields a lot of more information regarding how the water user is
contributing to the plant’s overconsumption. It can be seen that from 2014-2015, this user
contributed 15,200 Imperial gallons to the plant’s overall over-consumption (Figure
2.1.3B). It is also evident that this user has been increasing in water consumption from
year to year. This water user would be one to focus on when attempting to close in on
solutions to plant-wide water over-consumption.
The above two graphs were generated for each meter that gets recorded every week,
and by looking at all of the annual water bar graphs, it was found that 10 out of the 17
users had an increase in annual water consumption from 2014-2015, while 7 of them had
a decrease (Appendix A). The users that had an increase in water from 2014-2015 include
the Baker Brothers chemical line, the case line ultrasonic cleaning line (UCL), the boiler
room, the coolant room meters #8 and #9, the blade line UCL, the shot peen, and the case
line FPI (Fluorescent penetrant inspection). A summarization of these 2014-2015
increases can be seen in Table 2.1.3A below.
Table 2.1.3A - 2014-2015 Industrial Annual Water Consumption for Over-users
Water User2014 Annual Consumption
(Imp. gal)
2015 Annual Consumption
(Imp. gal)
Annual Increase from 2014-2015
(Imp. gal)
Percentage Increase from
2014-2015Case Line
Chemical Line (Baker Brothers)
803000 818200 15,200 1.89%
Case Line UCL 9310 13920 4,610 49.5%
Boiler Room 1320500 1342300 21,800 1.65%
Coolant Room Meter 8
16570 19730 3,160 19.1%
Coolant Room Meter 9
6340 9710 3,370 53.2%
Blade Line UCL 15390 17980 2,590 16.8%Shot Peen 2600 2800 200 7.69%
Case Line FPI 33240 38800 5,560 16.7%
As seen above in Table 2.1.3A, the largest increases in average weekly water flow from
2014-2015 are located in the boiler room and the Baker Brothers chemical line. The case
12

P&WC Proprietary Information Data Export Classification [No Technical Data]
line FPI situation has been recently solved due to the fact that this process now uses a
closed loop nano-filtration unit, nearly eliminating the bulk of its water consumption. The
largest percentage increases include the case line UCL and the coolant room meter #9.
This indicates that something was done to those water users to drastically increase their
consumption from 2014-2015. Moreover, the main benefit of the above weekly water
readings in Figure 2.1.3A is not to determine how or why the plant is using too much
water, but to provide a way to recognize when a specific user goes over its limit so that
overconsumption can be prevented as opposed to being fixed after it has occurred for a
long period of time. Of course, that data would need to be provided in real-time.
The results seen above in section 2.1 (seen in greater detail in Appendix A) conclude
that annual data is more useful when determining overall contribution to plant over-
consumption, and the weekly data is more useful when identifying frequent changes in
water consumption when attempting to address consumption issues as they occur
(prevention method). By looking at the annual data, it is apparent that the increase in
annual water consumption for the plant is not due to one or two users, but due to a
combination of over-consuming users, and perhaps other domestic water users that are
not being tracked. Due to this uncertainty, the current water meter tracking system needs
to be altered in order to provide additional tracking and more frequent measurements to
identify and focus in on specific over-consumption incidents as they occur. This would
provide a more preventative method to stop over-consumption as its occurring as opposed
to attempting to solve the issue after it has occurred. Furthermore, without a new,
accurate system of daily or real-time collection for the entire plant (not just industrial
water users), it makes it impossible to prevent and reduce water consumption.
2.2 – The Daily Water Investigation
Due to the inconclusive results in section 2.1, a more accurate data collection was
conducted by the co-op student on Monday September 28, 2015 in a further attempt to
determine when and why some of the industrial water users were using an increased
amount of water. This new data collection method was also performed to gain an
13

P&WC Proprietary Information Data Export Classification [No Technical Data]
understanding of the current system, and to identify problems with this system in an
attempt to create desired traits for a new system. The new data collection procedure
involved a three-week Monday to Friday daily meter reading for all of the water meters in
the plant. As opposed to the normal weekly readings, these daily readings offered a more
accurate representation of the current water consumption for each water user because if
allowed the co-op student to view the exact day that a user consumed a higher amount of
water.
2.2.1 – Daily Investigation Results
There were many conclusions drawn from conducting this daily water investigation
for all of the meters in the plant. As expected, this data collection method offered a more
accurate representation regarding when a specific user used an increased amount of water.
As opposed to narrowing increased water consumption down to the week that it occurred,
we were able to narrow it down to the exact day that it occurred. However, there are
many issues associated with this method of investigation (discussed later in this section).
An example of the collected data can be observed below in Figure 2.2.1A and 2.2.1B for
the HRM meter #1, while the rest of the data for specific water users can be found in
Appendix D. HRM meter #2 is currently out of order, meaning that all of the plant’s
water is coming in through HRM meter #1.
Figure 2.2.1A – The daily water meter readings for Plant 41 read from HRM meter #1.*Day 1 was Monday September 28, 2015. *No Data collected on Saturdays, Sundays, and Thanksgiving Monday (Day 15).
14

P&WC Proprietary Information Data Export Classification [No Technical Data]
Figure 2.2.1B – The daily water consumption for the entire plant (HRM meter #1) over the course of a three week Monday-Friday data collection period.*Ex. Day 1 measures the consumption from Monday morning to Tuesday morning. No data collected on Weekends and Thanksgiving Monday (Day 15).
As seen in Figure 2.2.1A, then consumption for Plant 41 appears to be roughly constant
with a few inconsistencies. Figure 2.2.1B makes these inconsistencies easier to see. From
Day 3 to Day 4, the consumption decreases from approximately 140 m3 to 60 m3, but
shoots back up to 105 m3 the following Monday on Day 8 before falling down to 80 m3
on the following two days (Days 8-10). This data suggests that there is a pattern for the
consumption; that the consumption is higher at the beginning of the week before
decreasing towards the end of the week. Furthermore, this data indicates that Plant 41 is
not experiencing an increasing consumption, which is known not to be true. Although this
daily investigation provides a more accurate analysis of when an increase in consumption
occurs, it still does not paint a vivid picture to show where and why the plant is
consuming more and more water every year.
It is still very difficult to determine what is responsible for Plant 41’s high water
consumption. This is partly due to the fact that we are only considering the industrial
water users and not the domestic water users. Another problem is that the daily collection
1 2 3 4 5 6 7 8 9 10 11 12 13 14 15 16 17 18 19 20 210
20406080
100120140160
Plant 41 Daily Water Consumption
Days
Wat
er (m
3)
1 2 3 4 5 6 7 8 9 10 11 12 13 14 15 16 17 18 19 20 2147.5
48
48.5
49
49.5
50
50.5f(x) = 0.0834664945691528 x + 48.6464470166546
HRM Daily Water Meter Reading
Days
Wat
er (m
3)
15
P&WC Proprietary Information Data Export Classification [No Technical Data]
is still not frequent enough to allow for the prevention of overconsumption, because it
takes a full day to process when a water user is over-consuming. Therefore, it is suspected
that a real-time collection method would be much more beneficial.
There are a few sources of error associated with this investigation. One source of error
includes the fact that this is a small test period of only three weeks, compromising its
reliability. Another source of error is the fact that the consumption for Fridays, Saturdays
and Sundays could not be obtained. The co-op student worked only from Monday to
Friday. In order to measure the consumption for Friday, the co-op student would need to
be at the plant on Saturday to measure the entire day’s consumption. Consequently, as
seen in Figures 2.2.1A and 2.2.1B, these days are missing from the collection. This
creates massive holes in the analysis and allows for overconsumption to occur on the
weekends when the co-op student is not working. Thus, the system is not feasible because
a person would need to be working seven days a week in order to gather accurate water
consumption data for every day.
The daily investigation also involved comparing the water flowing into Plant 41 from
Halifax Regional Municipality to the water leaving the industrial wastewater facility.
Considering that all of the meters are only located on the industrial water users, this data
gave the co-op student an idea of how much water was not being tracked in the plant. By
subtracting the water leaving the industrial wastewater facility from the water coming into
the plant, it was possible to obtain the amount of water not being tracked. This can be
seen below in Figure 2.2.1C and Figure 2.2.1D.
16

P&WC Proprietary Information Data Export Classification [No Technical Data]
1 2 3 4 5 6 7 8 9 10 110
20000
40000
60000
80000
100000
120000
140000
160000
Industrial Wastewater Output
Water Input to Plant
Days of the Week (Mon-Fri)
Wat
er (L
)
Figure 2.2.1C - A three week Monday to Friday daily water analysis for Plant 41, comparing the water coming into the plant from HRM (red) to the water leaving the industrial wastewater plant (blue).*Fridays could not be measured due to the fact that the co-op student does not work on weekends.**Day 11 was Thanksgiving.
As seen in Figure 2.2.1C above, there is a large margin between the water that is being
measured leaving the industrial wastewater facility (blue) and the water coming into the
plant from HRM (red). This margin is the amount of water that is not being tracked by the
current water meter system in the plant. On average, the amount of water not being
tracked is 68,108 L out of a possible 90,421 L coming into the plant. In other words,
74.5% of the water coming into the plant is not being tracked or monitored. This stunning
fact can be pictorially viewed in Figure 2.2.1D below:
17

P&WC Proprietary Information Data Export Classification [No Technical Data]
74.5%
25.5%
Average Untracked
Average Tracked (Industrial)
Figure 2.2.1D – A pie chart illustrating the average percentage of water coming into the plant that is actually tracked leaving the plant through the industrial wastewater sewer line (red).*Average data is based off of the three-week Monday to Friday daily collection data.
Back in 2000, Rianne MacDonell concluded in her findings that approximately 84% of
the water entering the plant was accounted for, with only 16% being unknown
(MacDonell, 2000). This has changed quite significantly over the past 15 years; most
likely due to the introduction of additional untracked water users, or altered chemical and
mechanical processes. Ultimately, MacDonell recommended that meters should be
installed at various locations around the plant (chemical lines, cafeteria, washrooms,
waste treatment, sanitary sewer), with water conservation techniques also being practised
(MacDonell, 2000). Currently, there are no meters installed in the cafeteria, washrooms,
or any of the domestic water users, falling short of MacDonell’s initial recommendation.
This discovery is perhaps the most alarming problem with the current water meter system,
and suggests that additional tracking is going to be needed on the domestic water users
and other possible industrial users that are not being tracked.
2.2.2 – Problems with current water tracking system
18

P&WC Proprietary Information Data Export Classification [No Technical Data]
The daily water investigation provided a lot of insight into the problems associated
with Plant 41’s current water tracking system. These problems contribute to the large
increase in water consumption detailed previously in section 2.1.2. The problems are:
(a) The meters are all manually-read. Currently, for a proper analysis of water
consumption, it would be required that an employee walks around to all 21 water
meters to read and record the totalized flows on a daily basis. This system is
inefficient and time consuming for the employee(s) involved. Thus, a more
automated electronic system is needed to simplify this process, make it more
efficient, and allow for more frequent data collection.
(b) Over time, these collected totalized flows are mapped onto excel graphs and each
trend is obtained. Once accurate trends are obtained from the excel graphs, any
issues that have been noticed regarding over-consumption have already been
occurring for an extended period of time. So essentially, it takes a while to notice
an issue with over-consumption, and once it’s noticed, it requires cleanup, repair,
or aggressive remediation. Thus, this system functions to fix, repair and clean up
any problem that has already occurred regarding water consumption as opposed to
preventing over-consumption from occurring in the first place. An electronic
system would involve specifically viewing all of the real-time data to all water
users, and the transfer of messages or alerts to the employee to notify them of any
irregular or high flows. This would then prompt the user to immediately
implement methods to limit water overuse at that location.
(c) The units of measurement among the meters are inconsistent, making it very
difficult for accurate water balances and flow comparisons among water users
(Appendix C). The introduction of a new system would eliminate this issue by
issuing a common unit of measurement.
(d) Arguably the most alarming issue is that on average, 75% of the water that comes
into the plant is not being tracked (Figure 2.2.1D). The water coming into the
plant was compared to the water being released by the industrial wastewater
19

P&WC Proprietary Information Data Export Classification [No Technical Data]
system. On average, the water being released by the industrial wastewater facility
only accounted for 25% of the total water consumed. Upon further analysis, it was
discovered that none of the domestic water users were being tracked. These users
include change-rooms, washrooms, fountains, and the cafeteria kitchen. Thus,
additional tracking for Plant 41 is needed to eliminate any gaps in the water
balance.
All four of these issues have contributed to a large increase in annual water consumption
at a faster rate each year. Plant 41 needs to implement a new, accurate water tracking
system for the entire facility that acts to prevent over consumption, as opposed to fixing
problems that have already occurred.
2.3 – The Proposed Solution
Campus 41 is a ‘Computer Integrated Manufacturing Facility’, and thus, it should
implement an automated electronic water tracking system that utilizes computer
integration to solve these issues. This system will aim to reduce the plant’s annual water
consumption by providing a more effective method of viewing and managing the water
consumption in real-time.
As a rough description, the desired tracking system will start by using the electronic
water meters to track the water flow through the pipes, converting this flow to an
electronic pulse output signal. The pulse output signal will then be picked up by a 900
MHz Phoenix radio located at the water meter, and this pulse output signal from the meter
will then be converted to a 900 MHz radio signal that will be propagated throughout the
plant until it is picked up by a central receiver. The central receiver (after receiving the
radio signal) will then relay this information to a central receiver, which will
communicate with industrial management software to display the desired information to
the end-user’s computer monitor. In this case, the industrial management software is a
SCADA system (supervisory control and data acquisition). The desired information
(totalized flow, flow rate, etc.) will be presented to the end user in real-time to allow for
20

P&WC Proprietary Information Data Export Classification [No Technical Data]
management, maintenance, or operators to see the issues as they occur as opposed to
seeing them after they occur. Another preventative feature of the SCADA system is that it
offers an alarm system that will send emails or phone calls to the desired person to notify
them of any issues (abnormal flow, high consumption, etc.) as they occur. A logged
history of consumption data can be viewed if a particular piece of consumption data needs
to be narrowed down to the time and location that it was measured.
The implementation of this system will involve the installation of 22 electronic water
meters to replace the current manual meters, and 4 electronic meters for additional
tracking. This additional tracking will attempt to account for the remaining 75% of water
that is not currently being tracked. The chemical line scrubber and the water entering
wastewater treatment from the boiler room are two additional industrial water sources that
will be tracked. The domestic water tracking will start by tracking the dishwasher (hot
and cold water pipes), and then move up to more domestic water tracking sites once this
system is tested for feasibility. The additional tracking sites are proposed below in section
2.3.1.
2.3.1 – Additional Tracking
After meeting with Ronald Noonan; one of Plant 41’s PTS specialists, it was
determined that the locations for additional tracking should be placed on four important
locations. The Case line Baker Brothers chemical line scrubber consumes a lot of water,
and there is currently no way of tracking consumption other than reading a pre-set flow
rate meter on the scrubber hose, and calculating the consumption from the rate. This
method is inaccurate, so it is proposed that a meter be placed on that location. Ronald
believed that it would be a good idea to place a meter on the water entering the industrial
waste treatment plant from the boiler room because it offered an improved accountability
for the water being used by the plant, and the water being released by the industrial
wastewater facility.
21

P&WC Proprietary Information Data Export Classification [No Technical Data]
There were a few unexpected issues when attempting to gather information regarding
the placement of additional tracking on the domestic water users. The piping system in
Plant 41 was constructed in two separate installments during two different time periods,
creating a complex network of interweaving pipes. Consequently, the act of tracking the
piping to account for where the water is travelling within the plant can become chaotic.
Due to the limited timeline of this project, it was proposed to start off small by tracking
one large domestic water user: the dishwasher in the cafeteria. The feasibility and
effectiveness of this system would be tested out on the existing water meter network and
these additional locations before adding in more additional domestic water locations.
Also, the dishwasher is a machine that implements a few water processes which cannot be
easily viewed by a passing employee, allowing for easy over-consumption. Most of the
other domestic water users (showers, sinks, toilets, fountains, etc.) can easily be seen if
they are left on or if there is a leak (with the exception of internal pipe leakage). Hence,
the priority should be placed on the dishwasher, which cannot be easily seen. Below,
Table 2.3.1A shows the relevant information regarding additional tracking locations.
Table 2.3.1A – The additional tracking locations, including the pipe size and the required quantities.
Meter # Meter Location Pipe Size Quantity18 BB scrubber 1'' hose 1
19, 20 Cafeteria dishwasher 3/4'' 221 Entering Waste treatment 2'' copper 1
2.3.2 – The New Tracking System: The Water Meters, Radio Equipment, and SCADA Software Services
The new proposed tracking system involves replacing all of the meters in the building
with Sensus and Carlon meters that would give an electronic pulse output. Phoenix radio
equipment would accept the pulse signals and relay the signals to a central receiver that
would then transfer the information to the SCADA system (which it is connected to). The
SCADA system would then provide the information that we will have programmed it to
monitor and retrieve in real time.
22

P&WC Proprietary Information Data Export Classification [No Technical Data]
Scotia Tech Fluid Services Ltd. is the Sensus metering representative for Atlantic Canada.
They can supply meters and Sensus radio frequency metering equipment for wireless
transmission of data. They are located in Dartmouth, Nova Scotia, which is ideal for
PWC’s Plant 41 in Halifax, Nova Scotia. They provided Plant 41 with a quotation
containing a new set of meters to install; all of which are Sensus OMNI T2 meters and
Carlon JLP meters. The total cost for the meters is $16,239.50, which can be viewed in
Scotia Tech Fluid Services’ quote in Table 2.3.4A in section 2.3.4.
The OMNI T2 meters are battery powered meters that use advanced Floating Ball
Technology (FBT), which employs an impeller with a ball design, making the impeller
weightless in the water line. Hence, this enables the impeller to begin moving with very
little water flow through the meter, resulting in better low flow sensitivity as well as
extended high flow rates. An example of these operating ranges can be seen below in
Table 2.3.2A. For example, the 3” meter has an operating range of 1.5 GPM (.34 m3/hr)
@ 95% min. to 650 GPM (148 m3/hr) @ 100% +/- 1.5% registration of actual throughput.
The meter is also rated for continuous flows up to 500 GPM (114 m3/hr).
Table 2.3.2A – The operating specifications for the OMNI T2 meters offered in the Scotia Tech Fluid Services quote (Table 2.5A).Meter Size
Lay Length
Low Flow (95% Min.)
Operating Range (98.5-101.5%)
Intermittent Flows (98.5-
101.5%)
Pressure Loss (Not to Exceed)
2” 17” 1.0 gpm 1.5 to 200 gpm 250 gpm 7.0 psi at 200 gpm3” 19” 1.5 gpm 2.5 to 500 gpm 650 gpm 5.1 psi at 500 gpm
The fully electronic sealed register provides water utilities with two electronic data
outputs, enabling a link from the meter to both an AMR/AMI (Automatic Meter
Reading/Advanced Metering Infrastructure) and SCADA systems simultaneously. The
registers possess a large, programmable LCD display which shows various register
operation modes, different units of measurement, and includes low battery indicators and
forwards and reverse flow indicators. Data logging and resettable accuracy testing
features are provided in addition to a programmable electronic pulse output signal. A
picture of these meters can be seen in Figure 2.3.2A, and a cross-sectional diagram of its
components can be seen in Figure 2.3.2B.
23

P&WC Proprietary Information Data Export Classification [No Technical Data]
Figure 2.3.2A – The OMNI T2 water meter.
Figure 2.3.2B – A cross-sectional diagram of the OMNI T2 water meter, showing all of the mechanical components.
In terms of maintenance and reliability, the T2 meters offer an impressive design. If any
maintenance is ever required, the measuring chamber and strainer cover can be removed
independently. Parts and a replacement measuring chamber may be used in the event that
repairs are needed. The register also boasts a 10 year guaranteed battery life.
The Carlon JLP meters are plastic nylon totalizing or pulse out water meters designed
for long life, low maintenance, and high accuracy. They come in four sizes, ½”, ¾”, 1”
and 1½” and they operate at flow rates from ¼ GPM to 50 GPM and pressure up to 100
24

P&WC Proprietary Information Data Export Classification [No Technical Data]
psi. An optional pulse output option is available for use with signaling controllers or
remote readers. A picture of these meters can be viewed below in Figure 2.3.2C.
Figure 2.3.2C – The Carlon JLP series of plastic nylon water meters.
The majority of the new meters will be Carlon meters, with the majority of the pipes
being ½”, 3/4”, and 1” in diameter. The technical data for these meters, with models, flow
data, and dimensions can be seen in Table 2.3.2C below.
Table 2.3.2C – The technical data for the Carlon JLP meters from the Scotia Tech Fluid Services quote (Table 2.5A).
Meter/Pipe Size
Model Continuous Flow
Flow Range
Length Height Width Connection Length
[X2]5/8” X ½” 062JLP/
JLPRS7 GPM ¼ - 13
GPM6½” 4¼” 3¾” 1¾”
5/8” X ¾” 750JLP/JLPRS
12 GPM ¼ - 22 GPM
7½” 4¼” 3¾” 2”
3/4” X 1” 150JLP/JLPRS
25 GPM ¾ - 50 GPM
10¾” 5” 4” 2¼”
The Phoenix radio equipment will be supplied by RAE Industrial Electronics located
in Dartmouth, Nova Scotia, which is in close proximity to Plant 41. Due to the large
amount of concrete present within the walls of Plant 41, a test needed to be performed to
assess whether or not a radio signal can be propagated throughout the entire facility from
25

P&WC Proprietary Information Data Export Classification [No Technical Data]
each water user. Ultimately, this test would assess whether the system is feasible in Plant
41. For this test, with the assistance of the IT department, the 900 MHz radio test unit was
placed at a central location on the 1st floor of the facility, next to the medical centre. The
central receiver test unit was carried around to various locations throughout the facility,
and the signal at those locations determined the feasibility of signal propagation. The
results from this signal test can be seen n the next page in Figure 2.3.2D and Table 2.3.2D
26

P&WC Proprietary Information Data Export Classification [No Technical Data]
Figure 2.3.2D - A map of Plant 41 showing all of the signal test sites. Figure notes on next page
27

P&WC Proprietary Information Data Export Classification [No Technical Data]
Figure 2.3.2D notes: The distance between each pillar (i.e. M8-M7) is approx. 60 feet.
The 900 MHz radio was placed at the red dot. The receiver was carried to the 7 green
dots.
Table 2.3.2D – A summarization of the signal strength at each tested location in Figure 2.3.2D.Tested Location RF Link SignalL-M ; 10-11 2.52 VL-M ; 7-8 3.07 VG-H ; 1-2 (1 floor below point shown) 1.87 VD7-D8 3.58 VB9-C9 3.13 VD9-D10 3.15 VD11-E11(1 floor above point shown) 2.84 V
Note that these locations did not represent every meter location, but only a select few that
were the furthest from the centralized unit. The biggest concerns for signal strength are in
the basement (G-H; 1-2) where the signal is 1.87 V, in the boiler room (D11-E11) where
the signal strength is 2.84 V, and in the Coolant room (L-M; 10-11) where the signal
strength is 2.52 V). The basement (especially) has a lot of concrete separating the signal
location from the central receiver. On the test receiver, it indicated that a good RF link
signal should be above 1.60 V, indicating that all of these signals are feasible enough to
be propagated throughout the facility. However, most of the meter locations did not have
an electric power source available nearby, presenting some issues with how these units
are going to be powered. If the radios are battery powered, it would need to be a battery
that could last a significant amount of time before being changed out (for feasibility
purposes). Currently, RAE Industrial Electronics is looking into an alternative method to
power the radio units.
The SCADA system services are being provided by a Trihedral Engineering Ltd.,
which is a local company in Bedford, Nova Scotia. They are a great choice because they
have a history of working with Scotia Tech Fluid Services in providing integrated
SCADA to monitor water consumption from electronic water meters. For this project, in
addition to working with Scotia Tech Fluid Services, they are working with RAE
28

P&WC Proprietary Information Data Export Classification [No Technical Data]
Industrial Electronic Ltd. to acquire the necessary wireless Phoenix radio equipment
responsible for receiving and transmitting the pulse output signals generated from the
meters. The SCADA system will create a detailed view into the plant’s water
consumption by tracking all of the individual water users in real time. With the additional
tracking on the dishwasher and with future installation of meters, the system will assist in
shedding some light on the remaining 75% of water that is not currently being tracked by
domestic water users. The system will send email and phone call messages (or alerts) to
plant employees whenever a water user surpasses a programmed consumption limit. This
will create a pro-active, preventative solution to stop or limit over-consumption as it
occurs as opposed to after it occurs. The system also offers stored history of past water
consumption info with specific time stamps, so that past consumption issues can be
narrowed down to the very location and instant in which they occurred. The data can be
viewed in a trend-like format ranging from real-time, to hourly, daily, and monthly.
2.4– Project Timeline
The four key Phases of this project can be seen below. Steps 1- 6 were completed by the
co-op student during his work term from August 31st – December 18th, 2015.
Problem Identification and Solution Acquisition:
1) Analysis of current and past water consumption data.
2) Analysis of current water meter system.
3) Identification of tracking system issues and water consumption issues.
4) Suggest multiple solutions to the issues.
5) Contact suppliers and receive quotations for their products.
Was completed by December 15, 2015
Initiate and Plan:
6) Creation of Business Plan.
7) Submit and Approval of ECAR (Capital Appropriation Request).
8) Purchase Order (PO) Creation.
29

P&WC Proprietary Information Data Export Classification [No Technical Data]
To be completed by February 1st, 2016.
Execute, Monitor & Control:
9) Confirmation of Approved PO by supplier.
10) Pre-Acceptance of finalized project layout.
11) Shipment and arrival of project build material to Plant 41.
12) Installation of meters and programming of SCADA.
To be completed by April 1st, 2016.
Project Closure:
13) Final Acceptance.
14) Release to end user.
15) Monitor & test over a given duration to determine effectiveness.
To be completed by June 1st, 2016.
All spending to the Capital budgets will occur in 2016. Upon approvals, the project
execution is projected to begin in February 2016 with an objective to have it fully
installed by April 2016 and have it successfully operational by June 1st 2016.
2.5 – Investment
Scotia Tech Fluid Services have sent a proposal saying that they will provide 26 new
water meters to track all of the locations. The Phoenix radio equipment will be supplied
by RAE Industrial electronics, and the SCADA services will be provided by Trihedral
Engineering. All of these companies are local to Halifax’s Plant 41, providing many
benefits regarding maintenance and troubleshooting. The quote issued to Campus 41 from
Scotia Tech Fluid Services for the meters can be seen on the next page in Table 2.5A.
30

P&WC Proprietary Information Data Export Classification [No Technical Data]
Table 2.5A - The quotation issued to Plant 41 from Scotia Tech Fluid Services for all of the meters (not including installation costs).Description Quantity Price each Total3 inch Sensus OMNI T2 meter w/ pulse output 2 $1759.00 $3518.002 inch Sensus OMNI T2 meter w/ pulse output 3 $1411.00 $4233.001 inch Carlon water meter w/ pulse output 6 $392.25 $2353.50**5/8X3/4 Carlon water meter w/ pulse output 7.5 inch lay length
5 $306.50 $1532.50
**5/8X3/4 Carlon water meter w/ pulse output and adaptor 9 inch lay length
5 $320.50 $1602.50
5/8X1/2 Carlon water meter W/ pulse output 10 $300.00 $3000.00TOTAL $16,239.50
The quote issued to Campus 41 from Trihedral Engineering Ltd. for the SCADA services
can be seen below in Table 2.5B
Table 2.5B - The quotation issued to Plant 41 from Trihedral Engineering Ltd. for the SCADA services.Quantity Product Unit Price Total Price1 VTScada 200 – Development Runtime –
New – Includes Three Months of SupportPlus
$2,895.00 $2,895.00
1 VTScada 200 – Alarm Notification – New – Includes Three Months of SupportPlus
$1,195.00 $1,195.00
1 VTScada 200 – Thin Client – 5 Pack – New – Includes Three Months of SupportPlus
$4,695.00 $4,695.00
1 SupportPlus – Additional Nine Months $988.38 $988.38Subtotal $9,773.38TOTAL $9,773.38
The quote issued to Campus 41 from RAE Industrial Electronics Ltd. for the Phoenix
radio equipment can be seen on the next page in Table 2.5C.
31

P&WC Proprietary Information Data Export Classification [No Technical Data]
Table 2.5C - The quotation issued to Plant 41 from RAE Industrial Electronics Ltd. for the Phoenix radio equipment (900 Mhz RF signal option; not including installation cost).Part # Type Description Qty Unit
PriceTotal
2901540 RAD-900-IFS Wireless Module 900 Mhz Transceiver, used for the 900Mhz RF signal
8 $856.24 $6,849.92
2901539 RAD-DI8-IFS Digital/pulse input module, 8 inputs 10Vdc-30.5Vdc < 10Hz. 2 Pulse inputs 0Vdc-30.5Vdc < 100Hz (Pulse counter mode), >5ms (Pulse/ratio 1:1)
7 $387.92 $2,715.44
2867199 RAD-ISM-900-ANT-OMNI-5
5dB Omnidirectional Antenna for 900Mhz Technology
8 $266.00 $2,128.00
5606124 RAD-CAB-LMR240-10
LMR240 CABLE – 10F Low Loss Cable
8 $66.53 $532.24
5606145 RAD-CON-RPSMA-N-SB
RPSMA(M) to N(F) adapter (1”)
8 $23.75 $190.00
Additional Items2313452 FL
COMSERVER UNI 232/422/485
FL COMSERVER for converting serial interfaces to Ethernet
1 $684.99 $684.99
2903447 RAD-CABLE-USB
USB Cable for diagnostics and extended wireless configuration
1 $112.73 $112.73
2799474 PSM-KA9SUB9/BB/2METER
RS232 cable, 9Pos, D-SUB socket on 9Pos D-SUB spclet, 9 wires, 1:1
1 $41.64 $41.64
TOTAL $23,652.56
The total investment for the project, including the 3 quotes above from Tables 5-7, can be
seen below in Table 2.5D.
Table 2.5D - The total investment for this water tracking project (not including installation or maintenance costs). Company InvestmentScotia Tech Fluid Services $16,239.50Trihedral Engineering Ltd. $9,773.38RAE Industrial Electronics Ltd. $23,652.56
32

P&WC Proprietary Information Data Export Classification [No Technical Data]
TOTAL $49,665.44It is important to note that the quote in Table 2.5C includes the radio equipment that
needs to be powered by an electrical power source. Once a battery powered option is
found, this quote, and the final total investment in Table 2.5D will need to be altered.
Also, the managed costs (installation, maintenance, etc.) will need to be calculated and
factored into the final project cost.
2.6 – Savings
The following information is based on current Halifax Regional Municipality water bill
data:
Base charge for water: $264.00
Base charge for wastewater: $317.00
Water consumption rate: $0.8450/m3
Wastewater discharge rate: $1.6380/m3
By taking the 2015 annual consumption thus far (September, 2015), averaging it over
all of the months that it has been measured for (January-September, 2015), and adding
this average consumption as the October, November, and December total consumptions,
an annual consumption for 2015 has been projected to be 26,670 m3, which is over the
UTC water target by 4,670 m3. Based on the current water bill rates above and by
reducing the consumption to meet the current 2015 UTC sustainability target, it would
save $12,176.61 to reach the current target.
If it is assumed that the water bill rates do not change, and if the UTC targets stay the
same from year to year, and if Plant 41 stays 4,670 m3 over the target every year, it will
take approximately 4 years for this project to pay itself off before money is saved. Of
course, this is conditional upon the successful implementation of this system. This
estimate is an overestimate because the targets will always get smaller from year to year,
and (based on the direction we are headed in), the water consumption will always
33

P&WC Proprietary Information Data Export Classification [No Technical Data]
increase from year to year. This will create more money being lost each year, and
consequently, a faster project payoff if this system is successfully implemented.
The financial water information for Plant 41 can be seen below in Tables 2.6A and 2.6B.
Table 2.6A - The annual cost for water in Plant 41 from 2012-2015.Year Annual Cost (CAN $)2012 $ 85,078.692013 $ 103,562.242014 $ 121,012.21
2015 (Projected) $ 87,510.90*For 2015, the projection was found by averaging the monthly cost since HRM meter 1 was shut down, and counting this average as the costs for October, November, and December. The annual total was then added up using the new projected Oct.-Dec. costs.
Table 2.6B -The increase in annual cost for water consumption for Plant 41 from year to year.
Year Change In Cost For Water (CAN $)2012-2013 $ 18,483.552013-2014 $ 17,449.972014-2015 $ -33,501.30
*2015 – One of the two meters measuring water coming from the municipality (HRM meter 1) was shut down, temporarily reducing the costs (also seen in Table 9).
2.7 – Alternative Solutions Considered
(a) Sansom Equipment Ltd.
Sansom is the Neptune meter supplier for Atlantic Canada and is located in Truro, NS, an
hour away from Plant 41. They offered to install 26 Neptune meters to replace the
existing meters and add to 4 new locations. They also offered to fit each meter with a
Tricon E 4/20 mA signal transmitter to the register of each water meter to relay the pulse
signal. However, Trihedral Engineering Ltd. was more inclined to work with Scotia Tech
Fluid Services, and so this alternative was dropped. The quotation from this company
added up to a total of $16,830.00.
34

P&WC Proprietary Information Data Export Classification [No Technical Data]
(b) EKM Metering Inc.
EKM Metering Inc. is a metering company located in California. They offered a full
package including 26 meters, radio equipment, and the relevant software to read the data
from their meters, all for a price of $10,579.00 US. However, due to the fact that this
option required lots of wiring and the fact that the company was located across the
continent (making troubleshooting and installation difficult), this option was dropped.
Also, the potential opportunities from using a SCADA system (end of Section 3.1) greatly
outweigh the specificity of EKM’s software.
The quotations for these alternative solutions can be viewed in Appendix E.
35

P&WC Proprietary Information Data Export Classification [No Technical Data]
3. CONCLUSION AND RECOMMENDATIONS
3.1 – Justification for Pursuing this Project
United Technologies Corporation’s (UTC) sustainability targets for the reduction of
Water Consumption requires that Plant 41 must reduce its total consumption to a
maximum of 22,000 m3 for the 2015 year. The 2014 result exceeded the given target by
1,321 m3, giving a total annual consumption of 23,321 m3. It is projected that the annual
target will be exceeded again in 2015 by 4,670 m3. The implementation of this project
aims to reduce the impact on water consumption by an estimated 4,670 m3 down to the
current water consumption target, and then further down to meet future consumption
targets. In order to meet aggressive environmental emission targets, cut down on
increasing overconsumption, and reduce unnecessary spending on water, more aggressive
preventative measures are required. The solution calls for an improvement of the
technology in the plant from a paper recording system to an automated electronic system.
In a facility that uses advanced intelligent robotic technology, it should have advanced
technological systems to monitor its energy and water consumption.
This problem will be addressed by replacing the current water tracking system with a
new system that is efficient and accurate. The old system requires too much time to track
each water user, and once the data has been tracked, the problem will have been ongoing
for quite some time. Based on the three-week daily water investigation, the the current
system only tracks 25% of the water that is consumed by the plant. The new system
would gather the data from the all of the users in real-time, and display them to
management, maintenance or operators. There would also be alarms to alert the employee
of any potential over-consumption issues, eliminating the need for constant monitoring.
The project would require additional tracking on much of the domestic water users and
some industrial users to account for the large amount of water that is not being tracked.
Each meter within the SCADA system would be programmed to a desired daily totalized
water flow target. If any of the meters record over their daily targets, the employee will be
notified exactly when and where the system recorded the over-consumption. Solutions
36

P&WC Proprietary Information Data Export Classification [No Technical Data]
will then be put in place at those specific locations to ensure that the daily targets are met.
The overall effect will aim to decrease Plant 41’s total water consumption output by
21.23%, bringing Plant 41 within UTC’s requirements. Ultimately, this project aims to
make the process of tracking water consumption more efficient, and more accurate in
order to provide a clearer insight into potential over-consumption issues.
Pratt and Whitney Canada has specific sustainable development goals set in motion
for the year 2028. As stated on the corporate EH&S website in regards to achieving 0%
waste emissions: “Our manufacturing operations will integrate a whole system approach
to the flow of resources and waste by minimizing waste to land, air and water” (Pratt &
Whitney Canada, 2015). This new system’s approach will influence future initiatives such
as water source reduction, process change/elimination, water re-use/close looping and
elimination of all water use inefficiencies, including leaks (all of which are stated on the
same webpage as the quote above).
In addition to being an enormous help to tracking water consumption, this project has
the potential to be a pilot project for the use of a SCADA system in the plant. The
applications of this technology are endless; it can be applied to many other areas of the
plant to monitor and log data real-time for immediate problem identification and analysis
(energy consumption, waste generation, but also in improvement of manufacturing
processes – in particular condition monitoring). This would involve using SCADA to
acquire data from the shop floor devices in real time, and notify management,
maintenance, and other workers of a quality or process problem (similar to an ANDON
system). SCADA systems can monitor machine health, overall equipment effectiveness,
predictive maintenance, and anything else involving the use of data. Its implementation
would be an important step towards achieving plant-wide automation, and an Industry 4.0
standard.
37

P&WC Proprietary Information Data Export Classification [No Technical Data]
3.2 – Recommendations and Future Work
It is recommended that this project should be continued in order to achieve UTC
sustainability targets for Plant 41. This project’s key contribution will strive towards a
large reduction in Plant 41’s water consumption to meet the current 2015 UTC
sustainability target. If successfully implemented, this project would also save Plant 41 a
lot of money by reducing the water consumption and potential over-consumption at the
problem locations. By adhering to the project timeline in section 2.4, the project should
be successfully implemented by June 1st, 2016. The largest problem currently being
addressed by RAE Industrial Electronics is finding a battery-powered option to power the
Phoenix radios at each water user location. Perhaps with some additional analysis,
another solution for using these radios can be found.
Once this system is successfully implemented, it is recommended that more of the
untracked water users have electronic meters placed on them so that they can be
monitored by the SCADA system. This would close the gap on the amount of water that
is currently not being tracked within the plant, and would continue the additional tracking
plan that Dalhousie student Rianne MacDonell had proposed in 2000 (MacDonell, 2000).
Keeping UTC’s 2028 sustainability goals in mind, Plant 41 should be pursuing a
closed loop water system on all future projects (such as the new IBF project), and should
be thinking about beginning the implementation of these systems on their existing water
users to reduce emitted wastewater to the environment. By bringing back and enforcing
quarterly pollution prevention committee meetings, the progress of these UTC
environmental emission targets can be effectively monitored, and new projects and
preventative methods can be implemented to effectively control the consumption of non-
renewable resources, such as clean water.
38
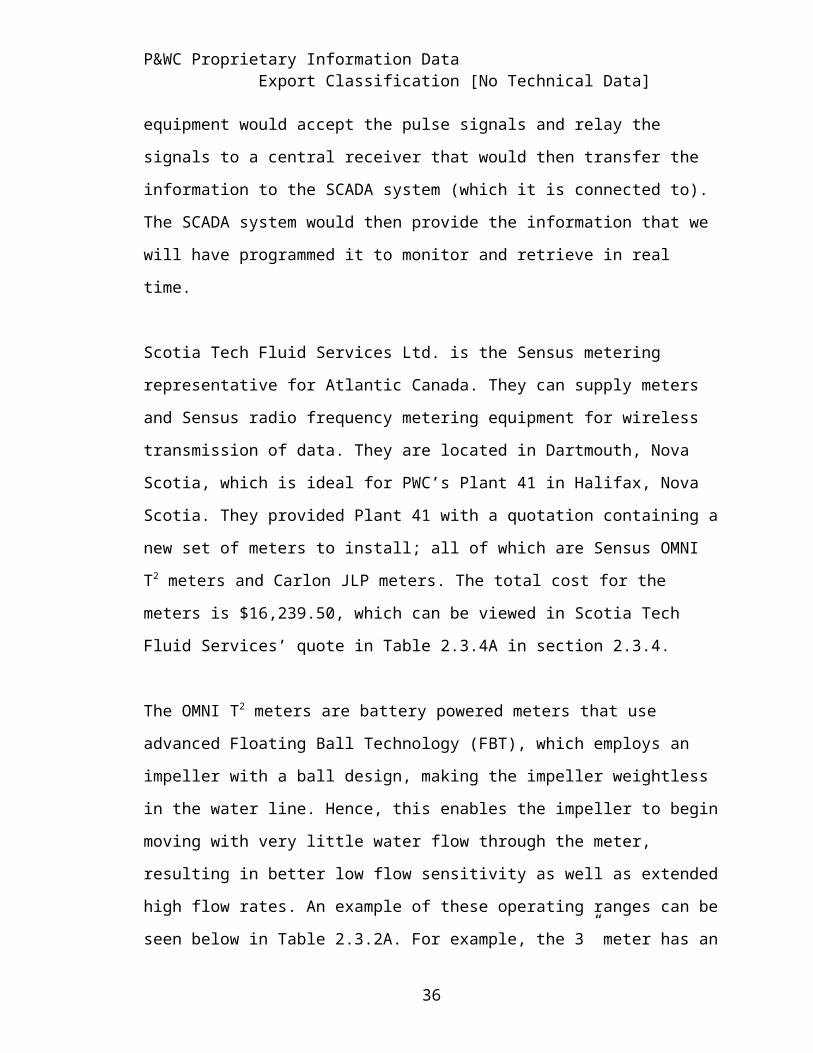
P&WC Proprietary Information Data Export Classification [No Technical Data]
4. REFERENCE MATERIAL
4.1 – References
MacDonell, R. 2000. “SP–009 Water Pollution Prevention and Control: Water Balance – Plant 41” (Work Term Report, Pratt & Whitney Canada - Dalhousie University).
McGowan, N. (Creator). Environment, Health & Safety Intranet Website: Environment & Sustainable Development, 2015, http://www4.pwc.ca/pc/cmn/Details/0,1445,CLI1_DIS7_DIV25_ETI14189,00.html
Pratt & Whitney Canada. 2015. Halifax Operations: Orientation Handbook (Halifax, NS: Pratt & Whitney Canada Plant 41), 23-25.
Pratt & Whitney Canada Website: About P&WC (Social Responsibility, A Global Leader), 2015, http://www.pwc.ca/en/about/about-pwc/.
4.2 – Project Contact Information
In the event that any future co-op students or employees take this project to the next step, they can contact the appropriate individuals by referring to the list of contacts below.
Pratt & Whitney Canada Plant 41 EH&S Project Supervisors:Mary Miles – (902) 873-7228 – [email protected] Raymond – (902) 873-7074 – [email protected]
Scotia Tech Fluid Services (Water Meters):
Paul Saulnier – (902) 468-2777 – [email protected]
Trihedral Engineering Ltd. (SCADA Services):
Ray Davies – (902) 835-1575 ext. 237 - [email protected]
RAE Industrial Electronics Ltd. (Radio Equipment):
Brad Turnbull – (902) 468-1238 - [email protected]
Pratt & Whitney Canada Plant 41 IT Representatves:
Robert Francis - (902) 873-7236 – [email protected]
39

P&WC Proprietary Information Data Export Classification [No Technical Data]
Travis Roberts – (902) 873-7361 – [email protected]
4.3 – Appendices
4.3.1 – Appendix A: Previous Weekly Consumption and Total Consumption Graphs Acquired from and compiled by Mary Miles, EH&S Specialist and P. Eng. (2015)
1 4 7 10 13 16 19 22 25 28 31 34 37 40 43 46 490
100
200
300
400
500
2014-2015 Baker Brothers Weekly Consump-tion
20142015
Weeks
Wat
er (I
mpe
rial
Gal
lons
÷ 1
00)
Figure A1. The weekly water consumption for the Baker Brothers chemical line in 2014 and 2015. There is a multiplication factor of 100 on the measured values from the meter.
40

P&WC Proprietary Information Data Export Classification [No Technical Data]
0
100000
200000
300000
400000
500000
600000
700000
800000
900000
705000 739200803000 818200
Baker Brothers Total Water Consumption (January-September)
2012201320142015
Wat
er (i
mp.
gal
lons
)
Figure A2. The total consumption for the Baker Brothers (Case Line) chemical line from January to September for 2012-2015.
1 4 7 10 13 16 19 22 25 28 31 34 37 40 43 46 490
50
100
150
200
250
300
2014-2015 Case Line UCL Weekly Consump-tion
20142015
Weeks
Wat
er (I
mpe
rial
Gal
lons
÷ 1
0)
Figure A3. The weekly water consumption for the case line UCL in 2014 and 2015. There is a multiplication factor of 10 on the measured values from the meter.
41

P&WC Proprietary Information Data Export Classification [No Technical Data]
0
2000
4000
6000
8000
10000
12000
14000
16000
8600
107809310
13920
Case Line UCL Total Water Consumption (January to Septemer)
2012201320142015
Wat
er (i
mp.
gal
lons
)
Figure A4. The total consumption for the case line UCL from January to September for 2012-2015.
1 4 7 10 13 16 19 22 25 28 31 34 37 40 43 46 490
100
200
300
400
500
600
700
2014-2015 Boiler Room Weekly Consumption
20142015
Weeks
Wat
er (I
mpe
rial G
allon
s ÷ 10
0)
42

P&WC Proprietary Information Data Export Classification [No Technical Data]
Figure A5. The weekly water consumption for the boiler room in 2014 and 2015. There is a multiplication factor of 100 on the measured values from the meter.
0
200000
400000
600000
800000
1000000
1200000
1400000
1600000
1233600 1286200 1320500 1342300
Boiler Room Total Water Consumption (January - September)
2012201320142015
Wat
er (i
mp.
gal
lons
)
Figure A6. The total consumption for the boiler room from January to September for 2012-2015.
1 4 7 10 13 16 19 22 25 28 31 34 37 40 43 46 490
102030405060708090
2014-2015 Hydroflow #1 Weekly Consump-tion
20142015
Weeks
Wat
er (I
mpe
rial G
allo
ns ÷
10)
43

P&WC Proprietary Information Data Export Classification [No Technical Data]
Figure A7. The weekly water consumption for Hydroflow #1 in 2014 and 2015. There is a multiplication factor of 10 on the measured values from the meter.
0
2000
4000
6000
8000
10000
12000
14000
10380 10160
12610 12410
Hydroflow #1 Total Water Consumption (January - September)
2012201320142015
Wat
er (i
mp.
gal
lons
)
Figure A8. The total consumption for Hydroflow #1 from January to September for 2012-2015.
1 4 7 10 13 16 19 22 25 28 31 34 37 40 43 46 490
20
40
60
80
100
120
2014-2015 Hydroflow #2 Weekly Consump-tion
20142015
Weeks
Wat
er (I
mpe
rial G
allo
ns ÷
10)
44

P&WC Proprietary Information Data Export Classification [No Technical Data]
Figure A9. The weekly water consumption for Hydroflow #2 in 2014 and 2015. There is a multiplication factor of 10 on the measured values from the meter.
0
2000
4000
6000
8000
10000
1200014000
16000
1800015560 16110 16400
13890
Hydroflow #2 Total Water Consumption (January - September)
2012201320142015
Wat
er (i
mp.
gal
lons
)
Figure A10. The total consumption for Hydroflow #2 from January to September for 2012-2015.
1 4 7 10 13 16 19 22 25 28 31 34 37 40 43 46 490
20
40
60
80
100
2014-2015 Hydroflow #3 Weekly Consump-tion
20142015
Weeks
Wat
er (I
mpe
rial
Gal
lons
÷ 1
0)
45

P&WC Proprietary Information Data Export Classification [No Technical Data]
Figure A11. The weekly water consumption for Hydroflow #3 in 2014 and 2015. There is a multiplication factor of 10 on the measured values from the meter.
0
2000
4000
6000
8000
10000
12000
14000
110609680
12430
8920
Hydroflow #3 Total Water Consumption (January - September)
2012201320142015
Wat
er (i
mp.
gal
lons
)
Figure A12. The total consumption for Hydroflow #3 from January to September for 2012-2015.
46

P&WC Proprietary Information Data Export Classification [No Technical Data]
1 4 7 10 13 16 19 22 25 28 31 34 37 40 43 460
20
40
60
80
100
1202014-2015 Coolant Room Meter #8 Weekly
Consumption
20142015
Weeks
Wat
er (U
S Ga
llons
÷ 10
)
Figure A13. The weekly water consumption for coolant room meter #8 in 2014 and 2015. There is a multiplication factor of 10 on the measured values from the meter.
0
20000
40000
60000
80000
100000
120000108120
15950 16570 19730
Coolant Room Meter #8 Total Water Consumption (January - September)
2012201320142015
Wat
er (U
S ga
llons
)
Figure A14. The total consumption for coolant room meter #8 from January to September for 2012-2015.
47

P&WC Proprietary Information Data Export Classification [No Technical Data]
1 4 7 10 13 16 19 22 25 28 31 34 37 40 43 46 490
20
40
60
80
100
1202014-2015 Coolant Room 8a Weekly
Consumption
20142015
Weeks
Wat
er (U
S G
allo
ns ÷
10)
Figure A15. The weekly water consumption for coolant room meter #8a in 2014 and 2015. There is a multiplication factor of 10 on the measured values from the meter.
02000400060008000
100001200014000160001800020000
17000 17880 18240
15500
Coolant Room Meter #8a Total Water Consumption (January - September)
2012201320142015
Wat
er (U
S ga
llons
)
Figure A16. The total consumption for coolant room meter #8a from January to September for 2012-2015.
48

P&WC Proprietary Information Data Export Classification [No Technical Data]
1 4 7 10 13 16 19 22 25 28 31 34 37 40 43 46 490
10
20
30
40
50
60
70
802014-2015 Coolant Room 9 Weekly Consump-
tion
20142015
Weeks
Wat
er (I
mpe
rial G
allon
s ÷ 10
)
Figure A17. The weekly water consumption for coolant room meter #9 in 2014 and 2015. There is a multiplication factor of 10 on the measured values from the meter.
0
2000
4000
6000
8000
10000
12000
8980
5910 6340
9710
Coolant Room Meter #9 Total Water Consumption (January - September)
2012201320142015
Wat
er (i
mp.
gal
lons
)
Figure A18. The total consumption for coolant room meter #9 from January to September for 2012-2015.
49

P&WC Proprietary Information Data Export Classification [No Technical Data]
1 4 7 10 13 16 19 22 25 28 31 34 37 40 43 46 490
2000
4000
6000
8000
10000
12000
2014-2015 Blade Line FPI Meter #10 Weekly Consumption
2014
Weeks
Wat
er (U
S Ga
llons
)
Figure A19. The weekly water consumption for the blade line FPI meter #10 in 2014 and 2015.
0
200000
400000
600000
800000
1000000
12000001050353
693563
94026 44054.4
Blade Line FPI Meter 10 Total Water Consumption (January - Sepetmber)
2012201320142015
Wat
er (i
mp.
gal
lons
)
Figure A20. The total consumption for the blade line FPI meter #10 from January to September for 2012-2015.
50

P&WC Proprietary Information Data Export Classification [No Technical Data]
1 4 7 10 13 16 19 22 25 28 31 34 37 40 43 46 490
50
100
150
200
250
300
350
400
4502014-2015 Blade Line FPI Meter #10.5
Weekly Consumption
20142015
Weeks
Wat
er (I
mpe
rial G
allon
s)
Figure A21. The weekly water consumption for the blade line FPI meter #10.5 in 2014 and 2015.
0
500
1000
1500
2000
2500
3000
3500
4000
4500
1190.2
4151.9
Blade Line FPI Meter #10.5 Total Water Consumption (January - September)
20142015
Wat
er (i
mp.
gal
lons
)
Figure A22. The total consumption for the blade line FPI meter #10.5 from January to September for 2014-2015. This data is extremely inaccurate (no data from January-July 2014).
51

P&WC Proprietary Information Data Export Classification [No Technical Data]
1 4 7 10 13 16 19 22 25 28 31 34 37 40 43 46 490
200
400
600
800
1000
1200
14002014-2015 Napco Scrubber Weekly Consump-
tion
20142015
Weeks
Wat
er (I
mpe
rial G
allo
ns ÷
10)
Figure A23. The weekly water consumption for the Napco chemical line scrubber (blade line) in 2014 and 2015. There is a multiplication factor of 10 on the measured values from the meter.
0
50000
100000
150000
200000
250000
159920133630
214920
169110
Napco Scrubber Total Water Consumption (January - September)
2012201320142015
Wat
er (i
mp.
gal
lons
)
Figure A24. The total consumption for the Napco chemical line scrubber (blade line) from January to September for 2012-2015.
52

P&WC Proprietary Information Data Export Classification [No Technical Data]
1 4 7 10 13 16 19 22 25 28 31 34 37 40 43 46 490
500
1000
1500
2000
25002014-2015 Napco Line Weekly Consumption
20142015
Weeks
Wat
er (I
mpe
rial G
allon
s ÷ 10
)
Figure A25. The weekly water consumption for the Napco chemical line (blade line) in 2014 and 2015. There is a multiplication factor of 10 on the measured values from the meter.
0
100000
200000
300000
400000
500000
600000
478600508040
440760 423550
Napco Line Total Water Consumption (January - September)
2012201320142015
Wat
er (i
mp.
gal
lons
)
53

P&WC Proprietary Information Data Export Classification [No Technical Data]
Figure A26. The total consumption for the Napco chemical line (blade line) from January to September for 2012-2015.
1 4 7 10 13 16 19 22 25 28 31 34 37 40 43 46 490
20
40
60
80
100
120
140
1602014-2015 Blade Line UCL Weekly Consump-
tion
20142015
Weeks
Wat
er (I
mpe
rial G
allon
s ÷ 10
)
Figure A27. The weekly water consumption for the blade line UCL in 2014 and 2015. There is a multiplication factor of 10 on the measured values from the meter.
0
5000
10000
15000
20000
25000 22720
15790 1539017980
Blade Line UCL Total Water Consumption (January - September)
2012201320142015
Wat
er (i
mp.
gal
lons
)
54

P&WC Proprietary Information Data Export Classification [No Technical Data]
Figure A28. The total consumption for the blade line UCL from January to September for 2012-2015.
1 4 7 10 13 16 19 22 25 28 31 34 37 40 43 46 490
1
2
3
4
5
62014-2015 Shot Peen Weekly Consumption
20142015
Weeks
Wat
er (I
mpe
rial G
allon
s ÷ 10
0)
Figure A29. The weekly water consumption for the shot peen in 2014 and 2015. There is a multiplication factor of 100 on the measured values from the meter.
0
500
1000
1500
2000
2500
3000
3500
2600
3100
26002800
Shot Peen Total Water Consumption (January - September)
2012201320142015
Wat
er (i
mp.
gal
lons
)
55

P&WC Proprietary Information Data Export Classification [No Technical Data]
Figure A30. The total consumption for the shot peen from January to September for 2012-2015.
1 4 7 10 13 16 19 22 25 28 31 34 37 40 43 46 490
50
100
150
200
2502014-2015 Case Line FPI Weekly Consump-
tion
20142015
Weeks
Wat
er (I
mpe
rial G
allo
ns ÷
10)
Figure A31. The total consumption for the case line FPI from January to September for 2012-2015. There is a multiplication factor of 10 on the measured values from the meter.
05000
1000015000200002500030000350004000045000
30510 31790 33240
38800
Case Line FPI Total Water Consumption (January - September)
2012201320142015
Wat
er (i
mp.
gal
lons
)
56

P&WC Proprietary Information Data Export Classification [No Technical Data]
Figure A32. The total consumption for the case line FPI from January to September for 2012-2015.
1 4 7 10 13 16 19 22 25 28 31 34 37 40 43 46 490
5
10
15
20
252014-2015 Chemical Lab Weekly Consump-
tion
20142015
Weeks
Wat
er (m
3)
Figure A33. The total consumption for the chemical lab from January to September for 2014-2015.
0
50
100
150
200
250
300
350307
86
Chemical Lab Total Water Consumption (January - September)
20142015
Wat
er (m
3)
57
P&WC Proprietary Information Data Export Classification [No Technical Data]
Figure A34. The total consumption for the chemical lab from January to September for 2014-2015.
4.2.2 – Appendix B: Monthly Water Bill Data Acquired from and compiled by Mary Miles, EH&S Specialist and P. Eng. (2015)
Figure B2. Second page of a typical Halifax Regional Municipality monthly water bill for Plant 41. Important information seen on this page are the measured consumption values for all previous months, the measured average rate of consumption per day for each month, and the current rates for charging water consumption ($0.8450 and $1.6380).
58

P&WC Proprietary Information Data Export Classification [No Technical Data]
Figure B3. The excel version of the entered data from the water bill for 2012. Seen here is the data for both HRM meters, including the average daily consumption for the year, the total annual consumption for the plant, and the total annual cost of water for the plant.
Figure B4. The excel version of the entered data from the water bill for 2013. Seen here is the data for both HRM meters, including the average daily consumption for the year, the total annual consumption for the plant, and the total annual cost of water for the plant.
59

P&WC Proprietary Information Data Export Classification [No Technical Data]
Figure B5. The excel version of the entered data from the water bill for 2014. Seen here is the data for both HRM meters, including the average daily consumption for the year, the total annual consumption for the plant, and the total annual cost of water for the plant.
Figure B6. The excel version of the entered data from the water bill for 2015. Seen here is the data for both HRM meters, including the average daily consumption for the year, the total annual consumption for the plant, and the total annual cost of water for the plant.
60

P&WC Proprietary Information Data Export Classification [No Technical Data]
4.2.3 – Appendix C: Current Water Balance Method Acquired from and compiled by Sheila Diamond, PTS Specialist and P. Eng. (2015)
1,095 Reagent Make-Up
8020 Liters Scrubber Inlet ScrubberEvaporation
Baker Bros/Napco Cleaning LineEvaporation 13,722 16,775(yearly tank changes)
54,124 Counter flow 40,402 Waste Treatment44,451
Caseline UCL Evaporation 1,519 Meter reports2,123 (tank changes 1/week) 41,982
Tank Changes 604 Missing2,469
2,726 FPI Caseline Evaporation 377(yearly tank changes)
Counterflow 2,349
300 Chemical Lab 300
241 FPI Bladeline Evaporation 241(yearly tank changes)
3,404 Vaneline UCL Evaporation 796(tank changes 2/week)
Counterflow 1,448
Tank Changes 1,160
120 Paint Booth Evaporation 120
777 Coolants Evaporator(biyearly tank changes) 277 TreatmentEvaporation 500
110,684
289 Mop Water 262Evaporation (10%)26
2,461 Cafeteria 2,461
16,073 Washrooms 16,073
9,868 Boiler Room 9,868
17,082 Other 17,082(cooling Jackets, eyewash
stations, cooling tower, tap
water, tank changes, etc.)16,775 44,451 48,093
Scrubber Evaporation
External Treatment
Waste Treatment Sanitary Sewer
Mass Balance Total 109,318
* Measured in L/day 92,543 Total Water Leaving Plant Water In Calculated Other % other
Average 110,684 93,601 17,082 15+ error 110,684 102,356 8,328 8- error 110,684 84,847 25,837 23
ErrorEvaporation 3,048 0.18 18% error because the error would be +/- 0.25 inches on the height readingsCafeteria 348 0.14 14% error because of the estimates between the amount of meal/person and # hours defrostingWashrooms 5,358 0.33 33% error because of the estimation of the toilet use per personTotal 8,754
Figure C1. A screenshot of an excel document detailing the current method of water balance for Plant 41. The calculations regarding washroom, cafeteria, and change room
61

P&WC Proprietary Information Data Export Classification [No Technical Data]
water consumption involve a multitude of approximations and estimations; a method that we are looking to eliminate to acquire more accurate data.
4.2.4 – Appendix D: Daily Water Investigation Results
Table D1. A table detailing the meters that are numbered, and their corresponding locations on the shop floor. This can be used for reference in Table D2 and Table D3.
Meter # Location1 Baker Brothers Line2 Case Line UCL3 Boiler Room4 Hydroflow #15 Hydroflow #26 Hydroflow #37 Cooling Tower8 Coolant Room
8a Coolant Room9 Coolant Room
10 Blade Line FPI10.5 Blade Line FPI11 Napco Scrubber12 Napco Line13 Blade Line UCL14 Shot Peen15 Case Line FPI16 Chemical Lab
62

P&WC Proprietary Information Data Export Classification [No Technical Data]
Table D2. A long excel table broken into three sections detailing the meter readings for each corresponding water user over the course of a 3 week period. Each reading was taken in the morning at 10:00 am. The associated units and multiplication factors for each meter can be seen in Table D3. Day of the week 1 2 3 4 5 6Monday Sept. 28 114670 177289 216923 34787 27521 15849Tuesday Sept. 29 114700 177338 216977 34791 27529 15851Wednesday Sept. 30 114729 177348 217031 34795 27534 15856Thursday Oct. 1 114768 177348 217083 34800 27540 15864Friday Oct. 2 114791 177351 217134 34806 27542 15867Monday Oct. 5 114879 177354 217280 34815 27558 15881Tuesday Oct. 6 114917 177356 217338 34830 27562 15884Wednesday Oct. 7 114948 177358 217389 34834 27565 15884Thursday Oct. 8 114978 177359.5 217439.5 34838.5 27572.5 15888.5Friday Oct. 9 115008 177361 217490 34843 27580 15893Monday Oct. 12Tuesday Oct. 13 115085 177369 217645 34861 27601 15901Wednesday Oct. 14 115106 177371 217685 34861 27608 15907Thursday Oct. 15 115123 177372 217726 34861 27616 15915Friday Oct. 16 115143 177374 217761 34871 27626 15918
8 8a 9 10 10.5 11 12 13 14 1553143 44121 16116 128501.7 7142.9 286432 897668 110405 246 4623553154 44141 16116 128675.6 7148.6 286529 897841 110408 246 4626753154 44141 16116 128807.7 7153.9 286624 898006 110456 246 4628253160 44141 16116 129021 7158.5 286729 898191 110459 246 4628253160 44141 16116 129056.5 7165.7 286808 898333 110460 246 4628253178 44150 16135 129355.8 7171 287079 898786 110466 246 4628253193 44158 16163 129599.4 7176 287176 898901 110467 246 4635853194 44168 16163 129784.3 7181.5 287268 899058 110504 246 4638253194 44173 16163 715344.2 7186.75 287358 899215.5 110506 246 46382.553194 44178 16163 1300904 7192 287448 899373 110508 246 46383
53217 44178 16189 130821.8 7369.4 287847 900066 110517 246 4638353223 44178 16196 131031.2 7419.1 287930 900220 110553 246 4638353240 44198 16196 131216.9 7425.1 288032 900410 110555 246 4638353246 44198 16196 131309.8 7435.7 288120 900535 110561 246 46384
63

P&WC Proprietary Information Data Export Classification [No Technical Data]
16 Mop C.L. Mop B.L. BB scrub. Water in Water out1661.427 343.9462 66.2548 0.8 48695.6 25037.081662.179 345.0329 66.3882 0.8 48788.41 22100.471662.616 345.3563 66.3994 0.8 48877.34 27344.581662.87 345.6763 66.5784 0.8 49016.1 22510.331663.08 345.9755 66.5787 0.8 49076.531664.978 346.799 66.8147 0.8 49308.2 21504.721665.212 347.1883 66.986 0.8 49412.79 22148.921665.497 347.6361 67.0416 0.8 49510.71 23174.241665.571 347.8954 67.09565 0.8 49591.4 23795.431665.644 348.1547 67.1497 0.8 49672.09
1666.027 348.7705 67.2556 0.8 49967.8 20067.161666.377 349.1141 67.4642 0.8 50042.44 18787.571666.73 349.606 67.6821 0.8 50141.24 18973.661667.45 350.0879 67.9231 0.8 50217.6
Table D3. A long excel table broken into three sections detailing the multiplication factor and units for each water meter.
1 2 3 4 5 6Factor x100 x10 x100 x10 x10 x10Units imp Gallonsimp Gallonsimp Gallonsimp Gallonsimp Gallonsimp Gallons
8 8a 9 10 10.5 11 12 13 14x10 x10 x10 x10 x10 x10 x100
US gallon US gallon imp Gallonsimp Gallonsimp Gallonsimp Gallonsimp Gallons imp Gallonsimp Gallon
15 16 Mop C.L. Mop B.L. BB scrub. Water in Water outx10
imp Gallons m 3̂ m 3̂ m 3̂ US gal/min m 3̂ L
64

P&WC Proprietary Information Data Export Classification [No Technical Data]
1 2 3 4 5 6 7 8 9 10 11 12 13 14 15 16 17 18 19 20 210
50010001500200025003000350040004500
Baker Brothers Daily Water Consumption
Days
Wat
er (i
mpe
rial g
allon
s)
Figure D1. The daily water consumption for the Baker Brothers chemical line (Case Line) over the course of a three week Monday-Friday data collection period.*Ex. Day 1 measures the consumption from Monday morning to Tuesday morning. *No data collected for Fridays, Saturdays, Sundays, and Thanksgiving Monday (Day 15).
65

P&WC Proprietary Information Data Export Classification [No Technical Data]
1 2 3 4 5 6 7 8 9 10 11 12 13 14 15 16 17 18 19 20 210
100
200
300
400
500
600
Case Line UCL Daily Water Consumption
Days
Wat
er (i
mpe
rial
gal
lons
)
Figure D2. The daily water consumption for the case line UCL over the course of a three week Monday-Friday data collection period.*Ex. Day 1 measures the consumption from Monday morning to Tuesday morning. *No data collected for Fridays, Saturdays, Sundays, and Thanksgiving Monday (Day 15).
1 2 3 4 5 6 7 8 9 10 11 12 13 14 15 16 17 18 19 20 210
10002000300040005000600070008000
Boiler Room Daily Water Consumption
Days
Wat
er (i
mpe
rial
gal
lons
)
Figure D3. The daily water consumption for the boiler room over the course of a three week Monday-Friday data collection period.*Ex. Day 1 measures the consumption from Monday morning to Tuesday morning. *No data collected for Fridays, Saturdays, Sundays, and Thanksgiving Monday (Day 15).
66

P&WC Proprietary Information Data Export Classification [No Technical Data]
1 2 3 4 5 6 7 8 9 10 11 12 13 14 15 16 17 18 19 20 210
20406080
100120140160
Hydroflow #1 Daily Water Consumption
Days
Wat
er (i
mpe
rial
gal
lons
)
Figure D4. The daily water consumption for Hydroflow #1 over the course of a three week Monday-Friday data collection period.*Ex. Day 1 measures the consumption from Monday morning to Tuesday morning. *No data collected for Fridays, Saturdays, Sundays, and Thanksgiving Monday (Day 15).
1 2 3 4 5 6 7 8 9 10 11 12 13 14 15 16 17 18 19 20 210
20
40
60
80
100
120
Hydroflow #2 Daily Water Consumption
Days
Wat
er (i
mpe
rial
gal
lons
)
Figure D5. The daily water consumption for Hydroflow #2 over the course of a three week Monday-Friday data collection period.*Ex. Day 1 measures the consumption from Monday morning to Tuesday morning. *No data collected for Fridays, Saturdays, Sundays, and Thanksgiving Monday (Day 15).
67

P&WC Proprietary Information Data Export Classification [No Technical Data]
1 2 3 4 5 6 7 8 9 10 11 12 13 14 15 16 17 18 19 20 210
102030405060708090
Hydroflow #3 Daily Water Consumption
Days
Wat
er (i
mpe
rial g
allo
ns)
Figure D6. The daily water consumption for Hydroflow #3 over the course of a three week Monday-Friday data collection period.*Ex. Day 1 measures the consumption from Monday morning to Tuesday morning. *No data collected for Fridays, Saturdays, Sundays, and Thanksgiving Monday (Day 15).
1 2 3 4 5 6 7 8 9 10 11 12 13 14 15 16 17 18 19 20 210
20406080
100120140160180
Coolant Room Meter #8 Daily Water Consumption
Days
Wat
er (U
S ga
llons
)
Figure D7. The daily water consumption for coolant room meter #8 over the course of a three week Monday-Friday data collection period.*Ex. Day 1 measures the consumption from Monday morning to Tuesday morning. *No data collected for Fridays, Saturdays, Sundays, and Thanksgiving Monday (Day 15).
68

P&WC Proprietary Information Data Export Classification [No Technical Data]
1 2 3 4 5 6 7 8 9 10 11 12 13 14 15 16 17 18 19 20 210
50
100
150
200
250
Coolant Room Meter #8a Daily Water Consumption
Days
Wat
er (U
S ga
llons
)
Figure D8. The daily water consumption for coolant room meter #8 over the course of a three week Monday-Friday data collection period.*Ex. Day 1 measures the consumption from Monday morning to Tuesday morning. *No data collected for Fridays, Saturdays, Sundays, and Thanksgiving Monday (Day 15).
1 2 3 4 5 6 7 8 9 10 11 12 13 14 15 16 17 18 19 20 210
50
100
150
200
250
300
Coolant Room Meter #9 Daily Water Consumption
Days
Wat
er (U
S ga
llons
)
Figure D9. The daily water consumption for coolant room meter #9 over the course of a three week Monday-Friday data collection period.*Ex. Day 1 measures the consumption from Monday morning to Tuesday morning. *No data collected for Fridays, Saturdays, Sundays, and Thanksgiving Monday (Day 15).
69

P&WC Proprietary Information Data Export Classification [No Technical Data]
1 2 3 4 5 6 7 8 9 10 110
100000200000300000400000500000600000700000
Blade Line Meter #10 Daily Water Consump-tion
Days
Wat
er (i
mpe
rial
gal
lons
)
Figure D10. The daily water consumption for blade line meter #10 over the course of a three week Monday-Friday data collection period.*Ex. Day 1 measures the consumption from Monday morning to Tuesday morning. *No data collected for Fridays, Saturdays, Sundays, and Thanksgiving Monday (Day 15).
1 2 3 4 5 6 7 8 9 10 11 12 13 14 15 16 17 18 19 20 210
10
20
30
40
50
60
Blade Line FPI Meter #10.5 Daily Water Consumption
Days
Wat
er (i
mpe
rial
gal
lons
)
Figure D11. The daily water consumption for the blade line FPI (meter #10.5) over the course of a three week Monday-Friday data collection period.*Ex. Day 1 measures the consumption from Monday morning to Tuesday morning. *No data collected for Fridays, Saturdays, Sundays, and Thanksgiving Monday (Day 15).
70

P&WC Proprietary Information Data Export Classification [No Technical Data]
1 2 3 4 5 6 7 8 9 10 11 12 13 14 15 16 17 18 19 20 210
200
400
600
800
1000
1200
Napco Scrubber Daily Water Consumption
Days
Wat
er (i
mpe
rial
gal
lons
)
Figure D12. The daily water consumption for the Napco chemical line scrubber (blade line) over the course of a three week Monday-Friday data collection period.*Ex. Day 1 measures the consumption from Monday morning to Tuesday morning. *No data collected for Fridays, Saturdays, Sundays, and Thanksgiving Monday (Day 15).
1 2 3 4 5 6 7 8 9 10 11 12 13 14 15 16 17 18 19 20 210
200400600800
100012001400160018002000
Napco Line Daily Water Consumption
Days
Wat
er (i
mpe
rial
gal
lons
)
Figure D13. The daily water consumption for the Napco chemical line over the course of a three week Monday-Friday data collection period.*Ex. Day 1 measures the consumption from Monday morning to Tuesday morning. *No data collected for Fridays, Saturdays, Sundays, and Thanksgiving Monday (Day 15).
71

P&WC Proprietary Information Data Export Classification [No Technical Data]
1 2 3 4 5 6 7 8 9 10 11 12 13 14 15 16 17 18 19 20 210
100
200
300
400
500
600
Blade Line UCL Daily Water Consumption
Days
Wat
er (i
mpe
rial
wat
er)
Figure D14. The daily water consumption for the blade line UCL over the course of a three week Monday-Friday data collection period.*Ex. Day 1 measures the consumption from Monday morning to Tuesday morning. *No data collected for Fridays, Saturdays, Sundays, and Thanksgiving Monday (Day 15).
1 2 3 4 5 6 7 8 9 10 11 12 13 14 15 16 17 18 19 20 210
0.10.20.30.40.50.60.70.80.9
1
Shot Peen Daily Water Consumption
Days
Wat
er (i
mpe
rial
gal
lons
)
Figure D15. The daily water consumption for the shot peen over the course of a three week Monday-Friday data collection period.*Ex. Day 1 measures the consumption from Monday morning to Tuesday morning. *No data collected for Fridays, Saturdays, Sundays, and Thanksgiving Monday (Day 15).
72

P&WC Proprietary Information Data Export Classification [No Technical Data]
1 2 3 4 5 6 7 8 9 10 11 12 13 14 15 16 17 18 19 20 210
100200300400500600700800
Case Line FPI Daily Water Consumption
Days
Wat
er (i
mpe
rial
gal
lons
)
Figure D16. The daily water consumption for the case line FPI over the course of a three week Monday-Friday data collection period.*Ex. Day 1 measures the consumption from Monday morning to Tuesday morning. *No data collected for Fridays, Saturdays, Sundays, and Thanksgiving Monday (Day 15).
1 2 3 4 5 6 7 8 9 10 11 12 13 14 15 16 17 18 19 20 210
0.10.20.30.40.50.60.70.8
Chemical Lab Daily Water Consumption
Days
Wat
er (m
^3)
Figure D17. The daily water consumption for the chemical lab over the course of a three week Monday-Friday data collection period.*Ex. Day 1 measures the consumption from Monday morning to Tuesday morning.
73

P&WC Proprietary Information Data Export Classification [No Technical Data]
*No data collected for Fridays, Saturdays, Sundays, and Thanksgiving Monday (Day 15).
1 2 3 4 5 6 7 8 9 10 11 12 13 14 15 16 17 18 19 20 210
0.2
0.4
0.6
0.8
1
1.2
Case Line Mop Daily Water Consumption
Days
Wat
er (m
^3)
Figure D18. The daily water consumption for the case line mop water over the course of a three week Monday-Friday data collection period.*Ex. Day 1 measures the consumption from Monday morning to Tuesday morning. *No data collected for Fridays, Saturdays, Sundays, and Thanksgiving Monday (Day 15).
1 2 3 4 5 6 7 8 9 10 11 12 13 14 15 16 17 18 19 20 210
0.05
0.1
0.15
0.2
0.25
0.3
Blade Line Mop Daily Water Consumption
Days
Wat
er (m
^3)
Figure D19. The daily water consumption for the blade line mop water over the course of a three week Monday-Friday data collection period.*Ex. Day 1 measures the consumption from Monday morning to Tuesday morning.
74

P&WC Proprietary Information Data Export Classification [No Technical Data]
*No data collected for Fridays, Saturdays, Sundays, and Thanksgiving Monday (Day 15).
1 2 3 4 5 6 7 8 9 10 11 12 13 14 15 16 17 18 19 20 210
20406080
100120140160
Plant 41 Daily Water Consumption
Days
Wat
er (m
^3)
Figure D20. The daily water consumption for the entire plant (HRM meters) over the course of a three week Monday-Friday data collection period.*Ex. Day 1 measures the consumption from Monday morning to Tuesday morning. *No data collected for Fridays, Saturdays, Sundays, and Thanksgiving Monday (Day 15).
75

P&WC Proprietary Information Data Export Classification [No Technical Data]
4.2.5 – Appendix E: Additional Quotes
76

P&WC Proprietary Information Data Export Classification [No Technical Data]
Figure E1 – The quotation issued to Plant 41 from Sansom meter providers (Neptune) in Truro, NS. The quote adds up to a total of $16,830.00.
77

P&WC Proprietary Information Data Export Classification [No Technical Data]
Figure E2 – The first page of the quotation issued to Plant 41 from EKM Metering Inc. in California, USA.
78

P&WC Proprietary Information Data Export Classification [No Technical Data]
Figure E3 – The second page of the quotation issued to Plant 41 from EKM Metering Inc. in California, USA. The quote adds up to a total of $10,579.00.
79

P&WC Proprietary Information Data Export Classification [No Technical Data]
4.2.6 – Appendix F: Monthly Experience Records
Figure F1 – September 2015 Experience Record, Page 1.
80

P&WC Proprietary Information Data Export Classification [No Technical Data]
Figure F2 – September 2015 Experience Record, Page 2.
81

P&WC Proprietary Information Data Export Classification [No Technical Data]
82

P&WC Proprietary Information Data Export Classification [No Technical Data]
Figure F3 – September 2015 Experience Record, Page 3.
83

P&WC Proprietary Information Data Export Classification [No Technical Data]
84

P&WC Proprietary Information Data Export Classification [No Technical Data]
Figure F4 – October 2015 Experience Record, Page 1.
85

P&WC Proprietary Information Data Export Classification [No Technical Data]
86

P&WC Proprietary Information Data Export Classification [No Technical Data]
Figure F5 – October 2015 Experience Record, Page 2.
87

P&WC Proprietary Information Data Export Classification [No Technical Data]
88

P&WC Proprietary Information Data Export Classification [No Technical Data]
Figure F6 – October 2015 Experience Record, Page 3.
89

P&WC Proprietary Information Data Export Classification [No Technical Data]
90

P&WC Proprietary Information Data Export Classification [No Technical Data]
Figure F7 – November 2015 Experience Record, Page 1.
91

P&WC Proprietary Information Data Export Classification [No Technical Data]
92

P&WC Proprietary Information Data Export Classification [No Technical Data]
Figure F8 – November 2015 Experience Record, Page 2.
93

P&WC Proprietary Information Data Export Classification [No Technical Data]
94

P&WC Proprietary Information Data Export Classification [No Technical Data]
Figure F9 – November 2015 Experience Record, Page 3.
95
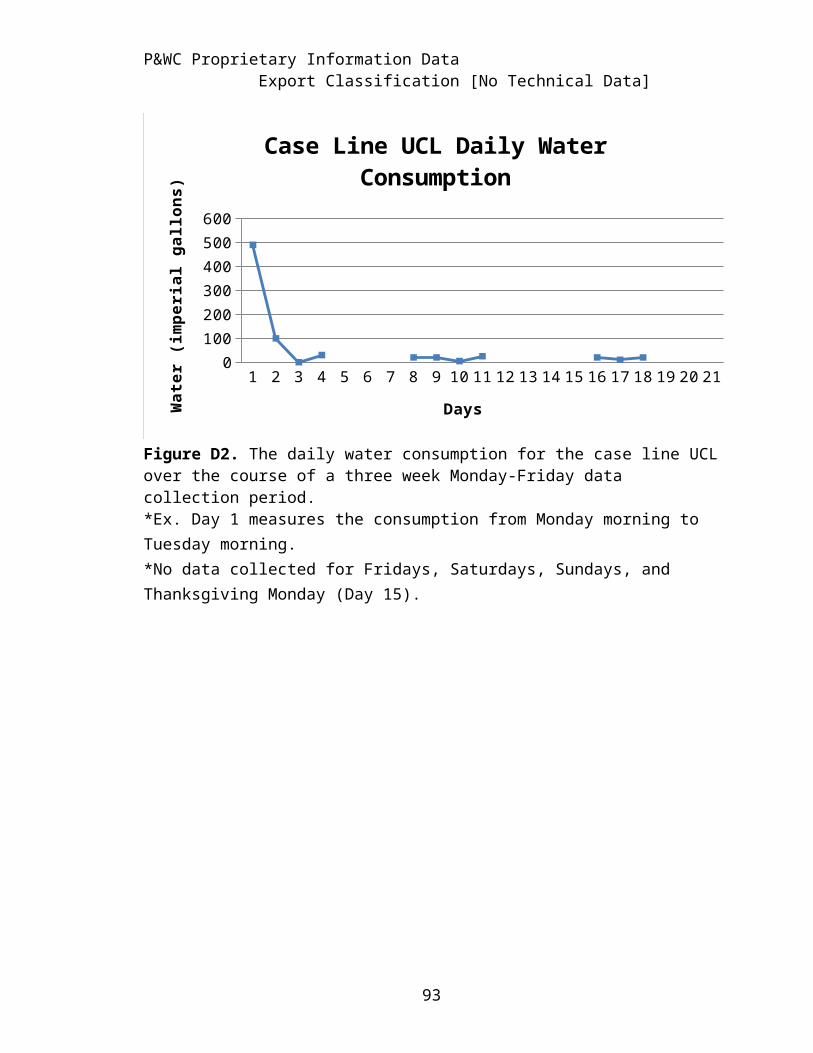
P&WC Proprietary Information Data Export Classification [No Technical Data]
96

P&WC Proprietary Information Data Export Classification [No Technical Data]
Figure F10– December 2015 Experience Record, Page 1.
97

P&WC Proprietary Information Data Export Classification [No Technical Data]
98

P&WC Proprietary Information Data Export Classification [No Technical Data]
Figure F11 – December 2015 Experience Record, Page 2.
99

P&WC Proprietary Information Data Export Classification [No Technical Data]
100

P&WC Proprietary Information Data Export Classification [No Technical Data]
Figure F12 – December 2015 Experience Record, Page 3.
101