Work-Site Nutrition Intervention and Employees' Dietary Habits: The ...
4
6. US Bureau of the Census. State and Met- ropofitan Area Data Book 1986. Washing- ton, DC: US Govt Printing Office; 1986. 7. Waller PF, Barty PZ. Seat belts: a compar- ison of observed and reported use. Chapel Hill, NC: University of North Carolina Highway Safety Research Center; 1969. 8. Market Opinion Research, General Motors PubLic Health Bres Corporation.AnAnasis ofthe FactorsAf- fecting Seat Belt Use. Detroit, Mich: Mar- ket Opinion Research, General Motors Cor- poration; 1977. Work-Site Nutrition Intervention and Employees' Dietary Habits: The Treatwell Program Glonan Sorensen, PhD, MPH, Diane M. Moms, PhD, RD, Mary K Hunt, MPH, RD, James R Hebert, ScD, Donald R Hamsr, PhD, Anne Stoddard, ScD, and Judith K Ockene, PhD ...... ... .......................... ... .............. ............................ Intmdudion This paper presents the results of a randomized study testing the efficacy ol Treatwell, a work-site nutrition interven- tion program designed to promote dietaiy changes associated with the reduction oi cancer risk. This program focuses on two dietary goals of the National Cancer In- stitute: reducing consumption of fat to 30% of total calories and increasing con- sumption of dietary fiber to 20 to 30 g per day.1 The studytested the hypotheses that there would be a significant decrease in calories from fat and increase in grams of fiber consumed by employees of the in- tervention work sites compared with em- ployees of control work sites. Methods Sixteen work sites from central Mas- sachusetts and Rhode Island were re- cruited to participate in the study, de- scribed elsewhere.2 Work sites ranged in size from 300 to 1400 employees, and each had a cafeteria with a kitchen. The work sites, stratified by size and distribution of employees by gender, were randomly as- signed to an intervention or control condi- tion. At intervention work sites, programs such as classes and food demonstrations were targeted to individuals, and cafeteria point-of-choice labeling programs provided environmental support. In addition, pro- grams were tailored to each work site through an employee advisory board, and eating pattern guidelines provided consis- tent messages across intervention activities (Appendix 1). No intervention was pro- vided at the control work sites. A questionnaire was distributed prior to the intervention in summer 1988 (time 1) to 275 employees randomly selected from each work site. Respondents were surveyed a second time at the end of the intervention period (time 2). This survey included a 67-item semiquantitative food frequency questionnaire (FFQ) developed and validated by Willett and colleagues.3 Employee characteristics, including sex, age, education, ethnicity, occupation, and body mass index (BMI), were also as- sessed. One work site assigned to the inter- vention group elected not to participate in the intervention. Nevertheless, dietary changes of employees of all eight compa- nies assigned to the intervention were compared with those of employees at the control sites. This approach permitted es- timation of the overall effectiveness of this program in work sites that agreed to par- ticipate, regardless of their "compliance" with the program. Analyses of the major outcomes were based on repeated measures analysis of variance using the SPSS-X software pro- gram.4 In analyses, employee effects were Glorian Sorensen and Mary K Hunt are with the Division of Cancer Epidemiology and Con- trol, Dana-Farber Cancer Institute, Boston, Mass. Diane Morris is with Mainstream Nutri- tion, Winnipeg, Manitoba. James R. Hebert and Judith K. Ockene are with the Division of Preventive and Behavioral Medicine of the University of Massachusetts Medical School in Worcester. Donald R. Harris and Anne Stod- dard are with the University of Massachusetts' School of Public Health in Amherst. Requests for reprints should be sent to Dr. Glorian Sorensen, Division of Cancer Epide- miology and Control, Dana-Farber Cancer In- stitute, 44 Binney Street, Boston, MA 02115. This paper was submitted to the Journal February 20, 1991, and accepted with revisions August 22, 1991. American Journal of Public Health 877
Transcript of Work-Site Nutrition Intervention and Employees' Dietary Habits: The ...

6. US Bureau of the Census. State and Met-ropofitan Area Data Book 1986. Washing-ton, DC: US Govt Printing Office; 1986.
7. Waller PF, Barty PZ. Seat belts: a compar-
ison ofobserved and reported use. ChapelHill, NC: University of North CarolinaHighway Safety Research Center; 1969.
8. Market Opinion Research, General Motors
PubLic Health Bres
Corporation.AnAnasis ofthe FactorsAf-fecting Seat Belt Use. Detroit, Mich: Mar-ket Opinion Research, General Motors Cor-poration; 1977.
Work-Site Nutrition Intervention andEmployees' Dietary Habits: TheTreatwell ProgramGlonan Sorensen, PhD, MPH, Diane M. Moms, PhD, RD, MaryK Hunt,MPH, RD, JamesR Hebert, ScD, DonaldR Hamsr, PhD, Anne Stoddard,ScD, and Judith K Ockene, PhD
......
...
..........................
... ..............
............................
IntmdudionThis paper presents the results of a
randomized study testing the efficacy olTreatwell, a work-site nutrition interven-tion program designed to promote dietaiychanges associated with the reduction oicancer risk. This program focuses on twodietary goals of the National Cancer In-stitute: reducing consumption of fat to30% of total calories and increasing con-sumption of dietary fiber to 20 to 30 g perday.1 The studytested the hypotheses thatthere would be a significant decrease incalories from fat and increase in grams offiber consumed by employees of the in-tervention work sites compared with em-ployees of control work sites.
MethodsSixteen work sites from central Mas-
sachusetts and Rhode Island were re-cruited to participate in the study, de-scribed elsewhere.2 Work sites ranged insize from 300 to 1400 employees, and eachhad a cafeteria with a kitchen. The worksites, stratified by size and distribution ofemployees by gender, were randomly as-signed to an intervention or control condi-tion. At intervention work sites, programssuch as classes and food demonstrationswere targeted to individuals, and cafeteriapoint-of-choice labelingprogramsprovidedenvironmental support. In addition, pro-grams were tailored to each work sitethrough an employee advisory board, andeating pattern guidelines provided consis-tent messages across intervention activities(Appendix 1). No intervention was pro-vided at the control work sites.
A questionnaire was distributed priorto the intervention in summer 1988 (time
1) to 275 employees randomly selectedfrom each work site. Respondents weresurveyed a second time at the end of theintervention period (time 2). This surveyincluded a 67-item semiquantitative foodfrequency questionnaire (FFQ) developedand validated by Willett and colleagues.3Employee characteristics, including sex,age, education, ethnicity, occupation, andbody mass index (BMI), were also as-sessed.
One work site assigned to the inter-vention group elected not to participate inthe intervention. Nevertheless, dietarychanges of employees of all eight compa-nies assigned to the intervention werecompared with those of employees at thecontrol sites. This approach permitted es-timation ofthe overall effectiveness ofthisprogram in work sites that agreed to par-ticipate, regardless of their "compliance"with the program.
Analyses ofthe major outcomeswerebased on repeated measures analysis ofvariance using the SPSS-X software pro-gram.4 In analyses, employee effectswere
Glorian Sorensen and Mary K Hunt are withthe Division of Cancer Epidemiology and Con-trol, Dana-Farber Cancer Institute, Boston,Mass. Diane Morris is with Mainstream Nutri-tion, Winnipeg, Manitoba. James R. Hebertand Judith K. Ockene are with the Division ofPreventive and Behavioral Medicine of theUniversity ofMassachusetts Medical School inWorcester. Donald R. Harris and Anne Stod-dard are with the University of Massachusetts'School of Public Health in Amherst.
Requests for reprints should be sent to Dr.Glorian Sorensen, Division of Cancer Epide-miology and Control, Dana-Farber Cancer In-stitute, 44 Binney Street, Boston, MA 02115.
This paper was submitted to the JournalFebruary 20, 1991, and accepted with revisionsAugust 22, 1991.
American Journal of Public Health 877

Public Health Briefs
Fat was expressed as a percentage of1~~~b1Ba*~~~~~~tota caois bcuesuc a measure pro-
vides an intrinsic adjustment for caloricintake and directly addresses the public
C., I....: ...: ~ health message related to percent of cal-~~~~~~~~~~~~~~oriesas fat. It is a conservative measure in
.............(P that the inflation of the numerator (i.e., fat~~~calories) inflates the denom inator by a nu-
...................merically equivalent amount. Fibervalues254 217...... were transformed by the natural logarithm
------------------(In) to comply with the assumptions of...............normality and homoscedasticity. Where
~~~i a111 summary mean scores are presented, we.. ...2...........present the geometric mean.5
...<
201Respodns owomaeuaedt
linfatand ofie consuemption,ae,s or7sexwranefoun btw3 eenptosdedwhorhespondevyat time1;hOweerthose,25with mrened-43%to~~~~~~~~~~~onsurve (etabled1). ure aie2
Anlsignificanltlymoraitervcndution thn61 45 16 cont~011resolnsienemployee reportaedqtate dthe
x ~~~~~~~~~wereawarlbe fofmnutrition program atd
.............1 tie20uvys*Ndifferences inbaselnemoyecac-
etary fat and ditrfiber(osmtin ge,ometri
fier varied sigwenifcatlysbyoage,sex,ondemea cohangreysinftand fibseresonsump-nlattionae s;hownvein table5. h oed
uctho erewasaoreatmkenyt-by-timteefect262 0*1 20* 0.41 f~~~~ordtotlrdetayfTat,e an hedceaei
~~~~ ~ ~ ~ ~ ~ ~ thivp~~~~~~~~...... igiicnlmorethn1ln epnseres nthenFF0ao~~c~'r.~ndimc *vglgjiblg tuI~~~~*~m'~ bcautolseitheremplortesal caloricdithaketwas
less tand60hkat ormoey thadatnd400 kclasue-nested within work-site effects. Mean~~.val-...menvles.hrb.gvn.qulwih getiwogpossiblerepotiong erorsSeigtmiarly,g12
nested within work-site effects. Mean val- mean values, thereby giving equal weight repodswrenticueigerrrs Siilrn2aaly, sesrecordswere not included in the timne 2 analywseues presented for each treatment condi- to eachwork site, which served as the unit for these reasons. Further information abouttion represent the mean of the work-site of randomization and intervention. the analywsesis available upon request.
878 American Journal of Public Health Lin.. 100AV 1Y^1 QO XJunIY177, VOl. 01, fNO.0

Public Health Briefs
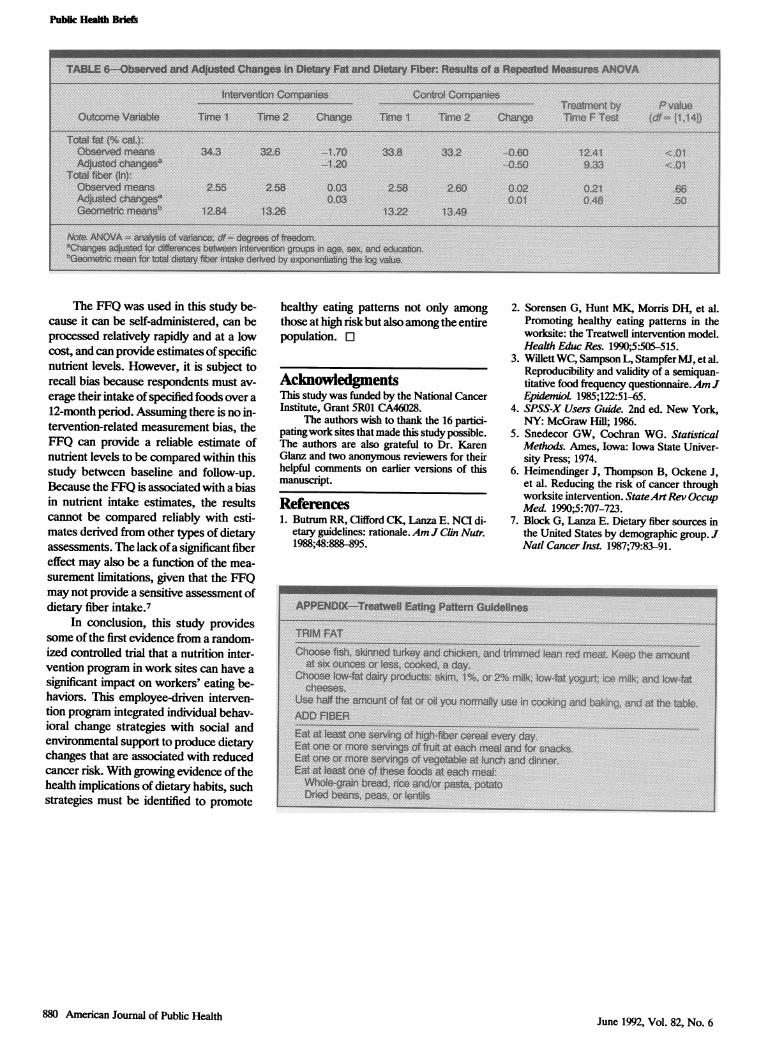
mean dietary fat was greater in interven-tion than in control work sites (Table 6).The decrease in total dietary fat was notaffected by age, education, sex, BMI, orethnicity (not shown in table). There wassuggestion of a larger increase in meandietary fiber among intervention thanamong control work sites. However, dif-ferences in total dietary fiber (In) remainednonsignificant despite the inclusion ofage, sex, education, BMI, and ethnicity inthe model. Table 6 also presents the meanchanges in fat and fiber after controllingsimultaneously for age, sex, and educa-tion-the variables most likely to influ-ence the effect of the intervention.
DiwussionThis study is one of the first random-
ized controlled studies of a comprehen-sive work-site intervention promoting di-etary change to reduce cancer risk.6 Theeducational messages emphasized twochanges: eat less fat and more fiber. Theresults indicate that the program was ef-ficacious in reducing fat intake amongemployees of the interventionwork sites.
There are many challenges inherent inwork-site-based intervention research. Inthis study, three intervention sites experi-enced labor stikes and one moved to an-other location; siniilarchanges did not occurin any of the control sites. One work site
randomized to the inteivention withdrewfrom the program although it did permit ad-ministration ofthe second survey. Thus, theprogram's overall effectwas dilutedby sitesnot fully implementing the program. Fi-
nally, the aim of30%3 or less ofcaloriesfromfat was not achieved. Nonetheless, we didobserve an intervention effect for fat intakedespite fluctuations in the degree to whichthe intervention was implemented.
American Journal of Public Health 879June 1992, Vol. 82, No. 6
Pubik Health Briefs
........ .........................
.:-
...........
..........................
............................
......................
........................................
no
........
.. .......................... X :2.. :1 X
......................
.................e ........
............................. ..............
No
.. ......... ..........
The FFQ was used in this study be-cause it can be self-administered, can beprocessed relatively rapidly and at a lowcost, and can provide estimates of specificnutrient levels. However, it is subject torecall bias because respondents must av-erage their intake of specified foods over a12-month period. Assuming there is no in-tervention-related measurement bias, theFFQ can provide a reliable estimate ofnutrient levels to be compared within thisstudy between baseline and follow-up.Because the FFQ is associated with a biasin nutrient intake estimates, the resultscannot be compared reliably with esti-mates derived from other tpes of dietaryassessments. The lack ofa significant fibereffect may also be a function of the mea-surement limitations, given that the FFQmay not provide a sensitive assessment ofdietary fiber intake.7
In conclusion, this study providessome of the first evidence from a random-ized controlled trial that a nutrition inter-vention program in work sites can have asignificant impact on workers' eating be-haviors. This employee-driven interven-tion program integrated individual behav-ioral change strategies with social andenvironmental support to produce dietarychanges that are associated with reducedcancer risk. With growing evidence of thehealth implications of dietary habits, suchstrategies must be identified to promote
healthy eating pattems not only amongthose at high riskbut also among the entirepopulation. l
AcknowledgmentsThis study was funded by the National CancerInstitute, Grant 5R01 CA46028.
The authors wish to thank the 16 partici-patingwork sites that made this study possible.The authors are also grateful to Dr. KarenGlanz and two anonymous reviewers for theirhelpful comments on earlier versions of thismanuscript.
References1. Butrum RR, Clifford CK, Lanza E. NCI di-
etary guidelines: rationale.AmJ Cln Nutr.1988;48:888-895.
2. Sorensen G, Hunt MK, Morris DH, et al.Promoting healthy eating patterns in theworksite: the Treatwell intervention model.Health Educ Res. 1990;5:505-515.
3. Willett WC, Sampson L, Stampfer MJ, et al.Reproducibility and validity of a semiquan-titative food frequency questionnaire.AmJEpidemioL 1985;122:51-65.
4. SPSS-X Users Guide. 2nd ed. New York,NY: McGraw Hill; 1986.
5. Snedecor GW, Cochran WG. StatisticalMethods. Ames, Iowa: Iowa State Univer-sity Press; 1974.
6. Heimendinger J, Thompson B, Ockene J,et al. Reducing the risk of cancer throughworksite intervention. StateArtRev OccupMedL 1990;5:707-723.
7. Block G, Lanza E. Dietary fiber sources inthe United States by demographic group. JNatl CancerInst. 1987;79:83-91.
QtmaspIg,tdudry 'aidm.eI% ,r 2% oik k~4tygw c i hK
.~~~~~~~~~~~~~X X
S''-,S--------- --- - 3 33~~~~~~~~~~~~~~~~~~~~~~~~~~~~~~~~~~~~~~~~~~~~~~~~~~~~~~~~~~~~~~~~-----,~~~~~~~~~~~~~~~~~~~~~~~~~~~~~.S.L...... ... ..S,,,,,,,,Snormor~~~~~~~~~~~~~~~~~~~~~....
.E.guWdiawk~satmhw-il
880 American Joumal of Public Health June 1992, Vol. 82, No. 6