Work Design Presented by VARO Healthcare™ 4.18.2014.
15
Work Design Presented by VARO Healthcare™ 4.18.201 4
-
Upload
bruce-watson -
Category
Documents
-
view
226 -
download
0
Transcript of Work Design Presented by VARO Healthcare™ 4.18.2014.

Work Design
Presented by VARO Healthcare™
4.18.2014

RAYMOND (Ray) STEINPartner and SVP of Operations at VARO Healthcare™Joined the company in 2005 after serving over 15 years with First Union and Wachovia Bank.
A little about your presenters.
Fun Fact: Having a wife and 3 daughters has taught me a lot about admitting when I’m wrong … (even when I’m right).“ ”

ALYSSA DiSALVATOREAccount Executive at VARO Healthcare™Joined the company in 2012.
A little about your presenters.
Fun Fact: Prior to developing healthcare relationships, I sold cemetery plots and tombstones – (door-to-door).“ ”

Let’s get started with
Okay, enough about us. Work Design
Work DesignWhy do you care?
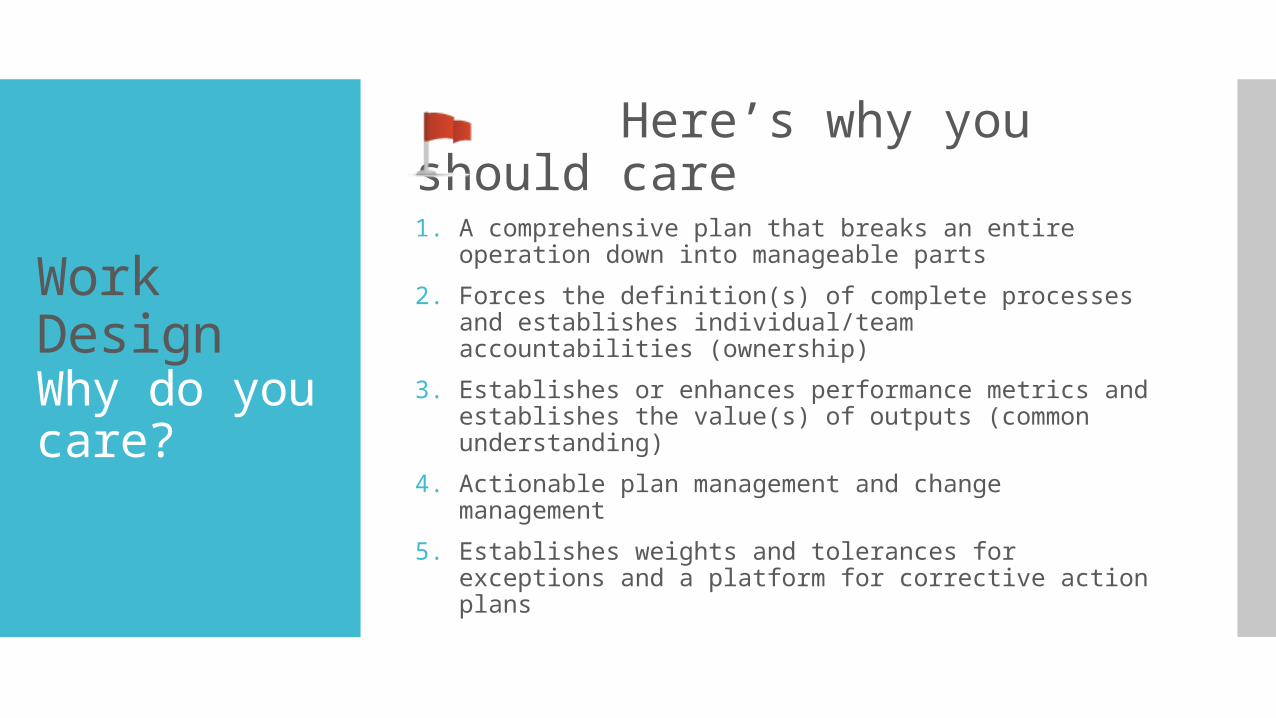
Here’s why you should care1. A comprehensive plan that breaks an entire
operation down into manageable parts
2. Forces the definition(s) of complete processes and establishes individual/team accountabilities (ownership)
3. Establishes or enhances performance metrics and establishes the value(s) of outputs (common understanding)
4. Actionable plan management and change management
5. Establishes weights and tolerances for exceptions and a platform for corrective action plans

Work DesignCore Concepts
The Core Concepts Breaks a whole operation down into logical and
functional working parts Roll up/drill down
“Cradle to grave” work plans cover all bases and lay out methodologies for driving all work to a logical conclusion
Design encompasses capacity and sizing, the value and weight of outputs/numbers, tolerances, and calls to action
Self directed work teams continuously: execute work plans, troubleshoot work plans, modify work plans, and enhance work plans
Design works to optimize the connectivity between functional teams (optimizing the hand-off and downstream/upstream troubleshooting)

Work DesignThe Mechanics
The Mechanics Work is planned in advance of a start date
Work within plan is broken down into logical parts
Plan follows action/next action format to completion
Plan is documented and readily accessible
Revisions/changes are captured, documented, and communicated
Plan utilizes simple metrics to measure production and performance
New work is routed to the most logical part (lanes)

Are we losing you yet?Don’t worry, we’re about to get to the good stuff…the people side!

Work DesignThe People Side
The People Side Everyone involved in the plan knows the plan
Everyone doing the work has clear role assignments
Everyone doing the work is properly trained
Everyone involved in the plan knows their respective accountabilities
The sum of people accountabilities adds up to a whole functional part or team (map it out and roll up/drill down)
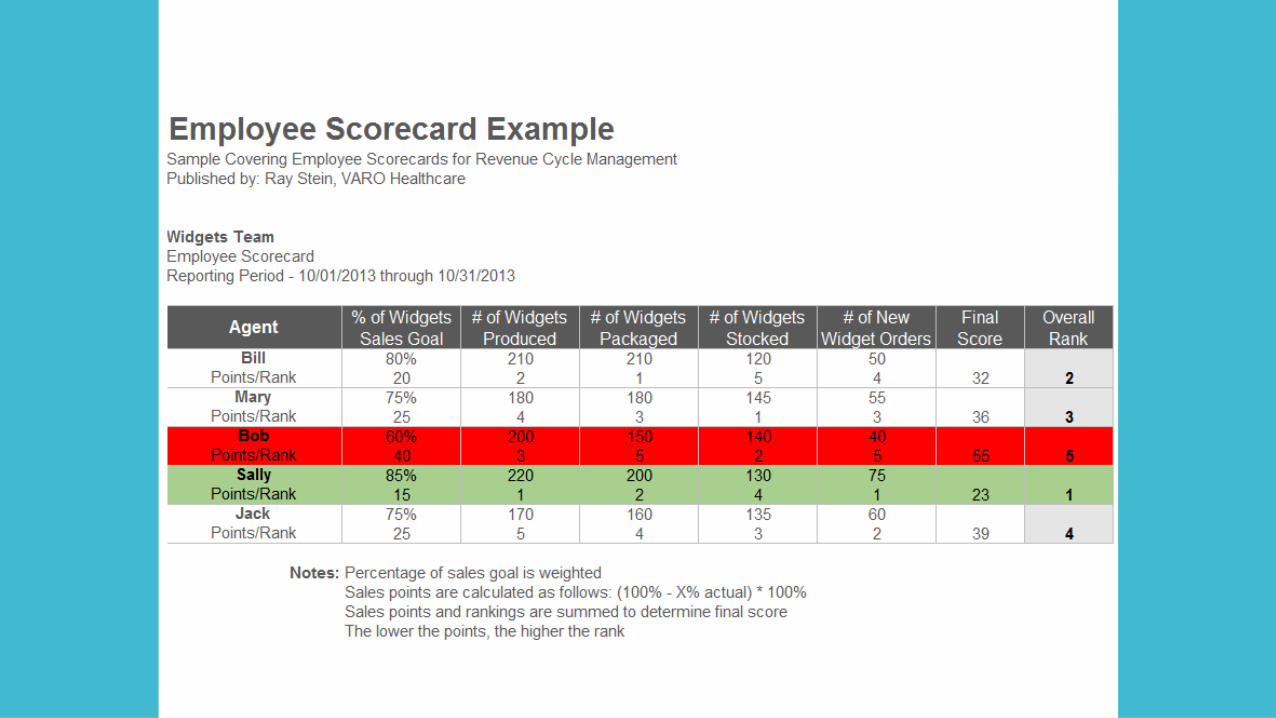
Individual performance is captured and evaluated with regular reporting (+/- values, employee scorecards)
Managers continuously troubleshoot people performance
Work Design Things to Know (and do…)
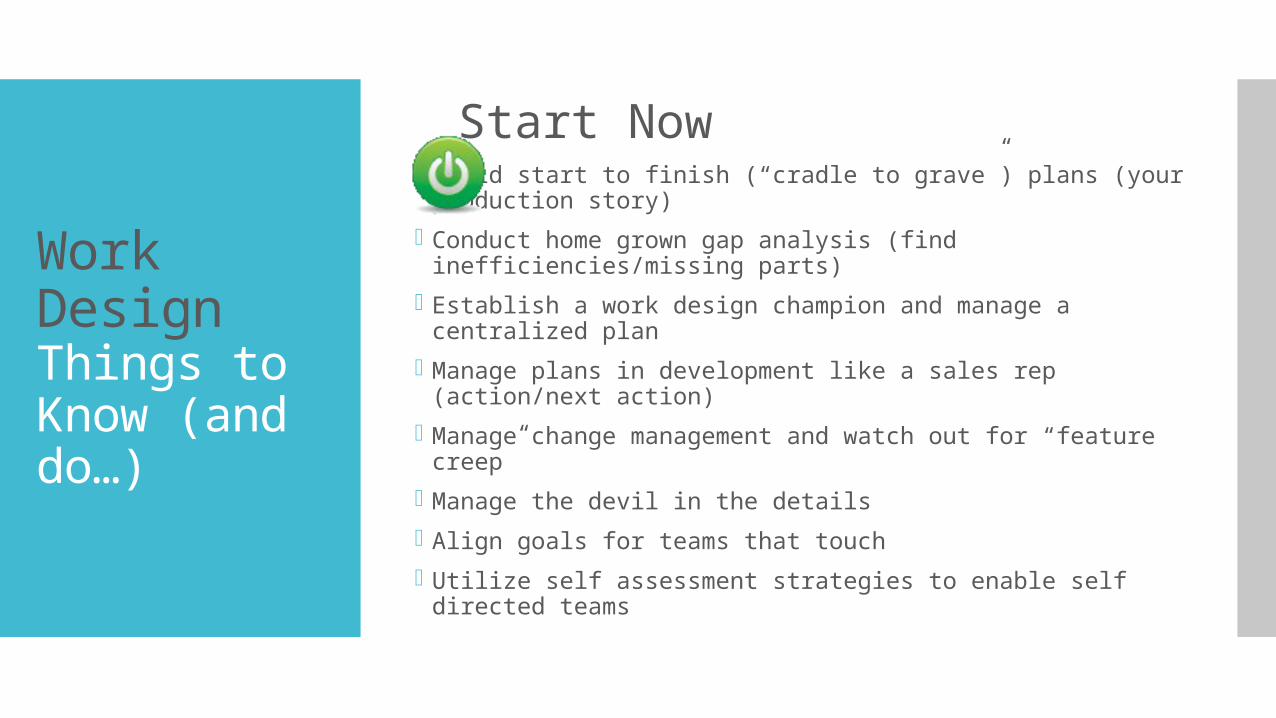
Start Now Build start to finish (“cradle to grave”) plans (your production
story)
Conduct home grown gap analysis (find inefficiencies/missing parts)
Establish a work design champion and manage a centralized plan
Manage plans in development like a sales rep (action/next action)
Manage change management and watch out for “feature creep”
Manage the devil in the details
Align goals for teams that touch
Utilize self assessment strategies to enable self directed teams
Work Design Business Self Assessment
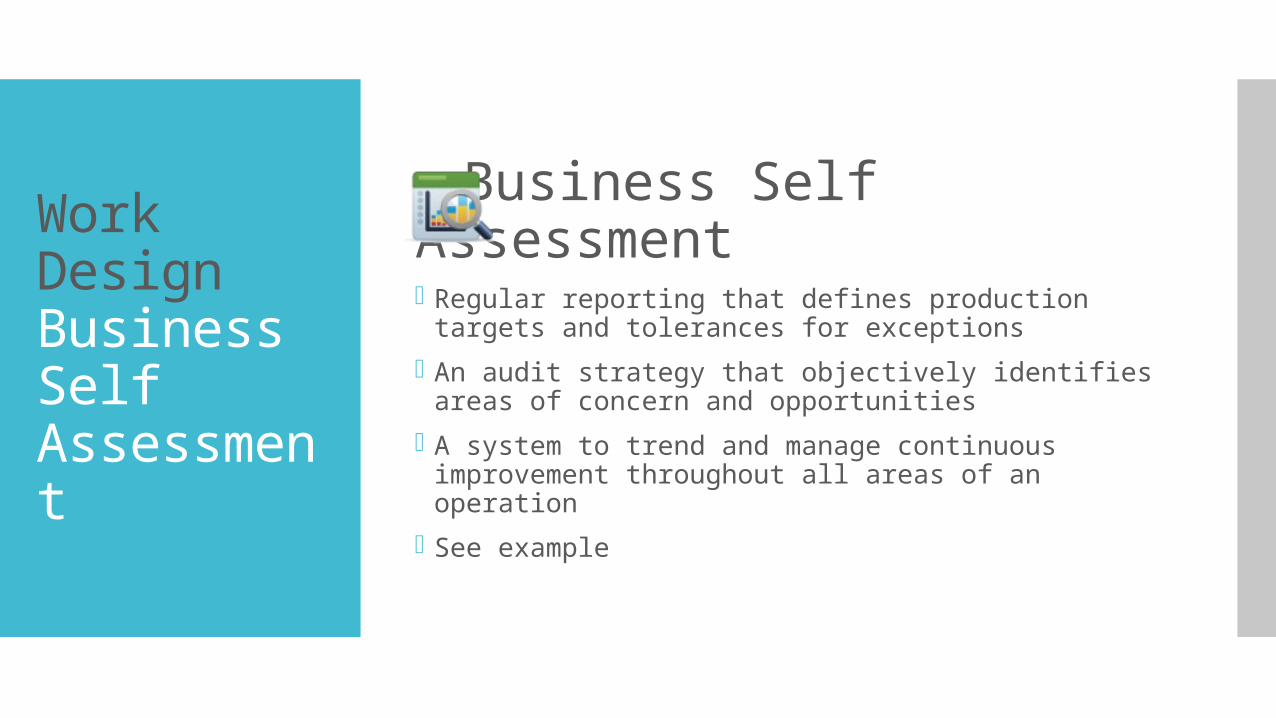
Business Self Assessment Regular reporting that defines production targets and
tolerances for exceptions
An audit strategy that objectively identifies areas of concern and opportunities
A system to trend and manage continuous improvement throughout all areas of an operation
See example

Sample Worksheet: Business Self Assessment (BSA) Functional Area of Responsibility (AOR): (Name of AOR)AOR Manager: (Name of Manager)Month Reviewed: February 2013
#Work Standard
ExpectationExpectations & Tolerances Testing Methodology Actual
Variance to Tolerance
1Produce widgets ordered within 3 business days of order date
Widget defect rate does not exceed 1% Defect count divided by order count
0.50% 0.50%
Backlogged production dates (order dates greater than 3 business days) do not exceed 2%
Total count of orders with a production date greater than 3 days divided by total production
3.50% -1.50%
Backlogged production dates (order dates greater than 3 business days) carry an order date greater than 5 business days
Total count of orders with a production date greater than 5 business days divided by total widgets produced
0.00% 0.00%
2
Ship produced Widgets to consumers within 2 business days of Widget production date
Backlogged shipped dates (ship dates greater than 2 business days) do not exceed 1%
Total shipped dates greater than 2 business days from production date divided by total shipped
1.20% -0.20%
Backlogged shipped dates (ship dates greater than 2 business days) do not carry a ship date greater than 3 business days
Total shipped dates greater than 3 business days from production date divided by total shipped
0.00% 0.00%
Mail returns and invalid addresses are less than 0.25%
Total mail returns and invalid addresses divided by total shipped
0.10% 0.15%
1
2

Q&A

THANK YOU