Work Assignment No · 2020-02-16 · Work Assignment No: Final Danny T Adit Treatability Study Year...
590
Final Danny T Adit Treatability Study Year 1 Technical Memorandum Barker-Hughesville Mining District Superfund Site Cascade and Judith Basin Counties, Montana March 5, 2014 EPA Contract No. EP-W-05-049 Work Assignment No: 325-RICO-085N Prepared by CDM Smith
Transcript of Work Assignment No · 2020-02-16 · Work Assignment No: Final Danny T Adit Treatability Study Year...

Final Danny T Adit Treatability Study Year 1 Technical Memorandum
Barker-Hughesville Mining District
Superfund Site Cascade and Judith Basin Counties, Montana
March 5, 2014
EPA Contract No. EP-W-05-049 Work Assignment No: 325-RICO-085N
Prepared by CDM Smith
Lhallaue
Text Box
1817984 - R8 SDMS

REMEDIAL ACTION CONTRACT FOR REMEDIAL, ENFORCEMENT OVERSIGHT, AND NON-TIME
CRITICAL REMOVAL ACTIVITIES AT SITES OF RELEASE OR THREATENED RELEASE OF HAZARDOUS SUBSTANCES
IN EPA REGION VIII
U. S. EPA CONTRACT NO. EP-W-05-049
FINAL DANNY T ADIT TREATABILITY STUDY YEAR 1 TECHNICAL MEMORANDUM
BARKER-HUGHESVILLE MINING DISTRICT SUPERFUND SITE CASCADE AND JUDITH BASIN COUNTIES, MONTANA
Work Assignment No.: 325-RICO-085N
March 5, 2014
Prepared for: U. S. ENVIRONMENTAL PROTECTION AGENCY
Region VIII, Montana Office Federal Building, Suite 3200
10 West 15th Street Helena, Montana 59626
Prepared by: CDM FEDERAL PROGRAMS CORPORATION
50 West 14th Street, Suite 200 Helena, Montana 59601
Barker Hughesville Danny T Treatability Study Technical Memorandum

Barker Hughesville Danny T Treatability Study Technical Memorandum iv

Table of Contents
Section 1 Introduction ................................................................................................................................................ 1-1 1.1 Site Description and Background ........................................................................................................................ 1-1 1.2 Treatment Technology Description .................................................................................................................... 1-2 1.3 Study Objectives and Evaluation Criteria ........................................................................................................ 1-3
1.3.1 Analytic Approach and Evaluation Criteria ........................................................................................ 1-4 1.3.2 Bench-Scale Principal Study Questions and Information Inputs .............................................. 1-5 1.3.3 Pilot-Scale Treatability Study Principal Study Questions and Information Inputs ........... 1-6
Section 2 Study Methods and Sampling ................................................................................................................ 2-1 2.1 Bench-Scale Treatability Study............................................................................................................................. 2-1
2.1.1 Step 1 - Test the Effects of Oxidation ..................................................................................................... 2-2 2.1.2 Step 2 – Test the Effects of Increased pH ............................................................................................. 2-3
2.1.2.1 Pre-Treatment Alkaline Addition Via Titration ................................................................. 2-3 2.1.2.2 Conventional Alkaline Addition via Titration ..................................................................... 2-4
2.1.3 Step 3 - Conduct Hydraulic Testing of Substrates ............................................................................ 2-4 2.1.4 Step 4 – Test Pre-treatment Options Prior to Treatment in the BCR ...................................... 2-5
2.1.4.1 Liquid Alkaline Addition Pre-treatment ................................................................................ 2-5 2.1.4.2 SAPS and Chitorem Column Setup ........................................................................................... 2-5 2.1.4.3 SAPS and Chitorem Substrates .................................................................................................. 2-6 2.1.4.4 Column Operation and Sampling .............................................................................................. 2-7
2.1.5 Biochemical Reactor Testing (Step 5) ................................................................................................... 2-9 2.2 Pilot-Scale Treatability Study ............................................................................................................................. 2-10
2.2.1 Collection and Routing of MIW .............................................................................................................. 2-10 2.2.2 Pilot-Scale Treatment Description and Process Flow Design .................................................. 2-11
2.2.2.1 Scaffold and Platform Construction ..................................................................................... 2-12 2.2.2.2 Head Tanks ...................................................................................................................................... 2-13 2.2.2.3 Pre-treatment Barrels ................................................................................................................ 2-14 2.2.2.4 BCR Barrels ..................................................................................................................................... 2-18 2.2.2.5 Solar Power System ..................................................................................................................... 2-21 2.2.2.6 Post-Treatment ............................................................................................................................. 2-22
2.2.3 System Startup and Shutdown .............................................................................................................. 2-23 2.2.4 Sampling and Maintenance Activities ................................................................................................ 2-24
2.2.4.1 Sampling Activities ...................................................................................................................... 2-24 2.2.4.2 Operations and Maintenance .................................................................................................. 2-25
Section 3 Quality Assurance Summary ................................................................................................................. 3-1 3.1 Bench-Scale Treatability Study............................................................................................................................. 3-1
3.1.1 Deviations and Data Quality Objectives ............................................................................................... 3-1 3.1.2 Field Quality Control Summary ................................................................................................................ 3-1 3.1.3 Data Evaluation ............................................................................................................................................... 3-2
3.2 Pilot-Scale Treatability Study ................................................................................................................................ 3-2 3.2.1 Deviations and Data Quality Objectives ............................................................................................... 3-2 3.2.2 Field Quality Control Summary ................................................................................................................ 3-4 3.2.3 Data Evaluation ............................................................................................................................................... 3-4
Section 4 Results, Analysis, and Discussion ........................................................................................................ 4-1 4.1 Bench-Scale Treatability Study............................................................................................................................. 4-1
4.1.1 Danny T Adit MIW Characteristics.......................................................................................................... 4-1
Barker Hughesville Danny T Treatability Study Technical Memorandum i

Table of Contents
4.1.2 Effects of Oxidation ....................................................................................................................................... 4-2 CDM Smith Laboratory Parameters ....................................................................................................... 4-2 Metals .................................................................................................................................................................. 4-2 Wet Chemistry Parameters ....................................................................................................................... 4-3 Summary ............................................................................................................................................................ 4-3
4.1.3 Effects of Increased pH ................................................................................................................................ 4-4 4.1.3.1 Pre-Treatment Alkaline Addition Via Titration ................................................................. 4-4 4.1.3.2 Conventional Alkaline Addition Via Titration .................................................................... 4-7
4.1.4 Hydraulic Testing of Substrates .............................................................................................................. 4-8 4.1.5 Results of Alkaline Addition and SAPS Pre-Treatment ............................................................... 4-10
CDM Smith Laboratory Parameters ..................................................................................................... 4-10 Metals ................................................................................................................................................................ 4-11 Wet Chemistry Parameters ..................................................................................................................... 4-12 Summary .......................................................................................................................................................... 4-12
4.1.6 Results of Biochemical Reactor Testing ............................................................................................. 4-13 CDM Smith Laboratory Parameters ..................................................................................................... 4-13 Metals ................................................................................................................................................................ 4-13 Wet Chemistry Parameters ..................................................................................................................... 4-15 Summary .......................................................................................................................................................... 4-15
4.2 Pilot-Scale Treatability Study ............................................................................................................................. 4-15 4.2.1 Danny T Adit MIW Influent ...................................................................................................................... 4-16
Field Parameters .......................................................................................................................................... 4-16 Metals ................................................................................................................................................................ 4-16 Wet Chemistry Parameters ..................................................................................................................... 4-17 Summary .......................................................................................................................................................... 4-18
4.2.2 BCR1................................................................................................................................................................... 4-18 Field parameters .......................................................................................................................................... 4-18 Metals ................................................................................................................................................................ 4-18 Wet Chemistry Parameters ..................................................................................................................... 4-20 Summary .......................................................................................................................................................... 4-20
4.2.3 SAPS Pre-treatment and BCR2 ............................................................................................................... 4-21 Field Parameters .......................................................................................................................................... 4-21 Metals ................................................................................................................................................................ 4-21 Wet Chemistry Parameters ..................................................................................................................... 4-24 Summary .......................................................................................................................................................... 4-25
4.2.4 Chitorem Pre-treatment and BCR3 ...................................................................................................... 4-25 Field Parameters .......................................................................................................................................... 4-25 Metals ................................................................................................................................................................ 4-26 Wet Chemistry Parameters ..................................................................................................................... 4-28 Summary .......................................................................................................................................................... 4-28
4.2.5 Alkaline Addition Pre-treatment and BCR4 ..................................................................................... 4-29 Field Parameters .......................................................................................................................................... 4-29 Metals ................................................................................................................................................................ 4-30 Wet Chemistry Parameters ..................................................................................................................... 4-32 Summary .......................................................................................................................................................... 4-32
4.2.6 Post-Treatment Oxidation Tests ........................................................................................................... 4-33 4.2.7 Substrate Leach Tests ................................................................................................................................ 4-33
Section 5 Conclusions and Recommendations ................................................................................................... 5-1 5.1 Bench-Scale Treatability Study Conclusions .................................................................................................. 5-1
Barker Hughesville Danny T Treatability Study Technical Memorandum ii

Table of Contents
5.2 Pilot-Scale Treatability Study Conclusions...................................................................................................... 5-2 5.3 Recommendations for Year 2 Pilot-Study ....................................................................................................... 5-4
5.3.1 Study Time Length ......................................................................................................................................... 5-4 5.3.2 BCR Modifications .......................................................................................................................................... 5-5 5.3.3 Pre-Treatment Modifications .................................................................................................................... 5-6 5.3.4 Post-Treatment Oxidation Testing ......................................................................................................... 5-7
Section 6 References .................................................................................................................................................... 6-1
List of Figures Figure 2.2-1 As-Built Process Flow Diagram Figure 4.1-1 Titration Curve of Sodium Hydroxide to pH 4.5 Figure 4.1-2 Titration Curve of Calcium Hydroxide to pH 4.5 Figure 4.1-3 Titration Curve of Chitorem to pH 4.5 Figure 4.1-4 Titration Curve of Sodium Hydroxide to pH 9.5 Figure 4.1-5 Titration Curve of Calcium Hydroxide to pH 9.5 Figure 4.1-6a Column 1 - NaOH Pre-Treatment and SAPS, Page 1 Figure 4.1-6b Column 1 - NaOH Pre-Treatment and SAPS, Page 2 Figure 4.1-7a Column 2 - Ca(OH)2 Pre-Treatment and SAPS, Page 1 Figure 4.1-7b Column 2 - Ca(OH)2 Pre-Treatment and SAPS, Page 2 Figure 4.1-8a Column 3 - No Pre-Treatment and SAPS, Page 1 Figure 4.1-8b Column 3 - No Pre-Treatment and SAPS, Page 2 Figure 4.1-9a Column 4 - Chitorem Pre-Treatment, Page 1 Figure 4.1-9b Column 4 - Chitorem Pre-Treatment, Page 2 Figure 4.2-1 pH Measurements Figure 4.2-2 Oxidation Reduction Potential Measurements Figure 4.2-3 Dissolved Oxygen Measurements Figure 4.2-4 Dissolved Aluminum Concentrations Figure 4.2-5 Dissolved Arsenic Concentrations Figure 4.2-6 Dissolved Barium Concentrations Figure 4.2-7 Dissolved Cadmium Concentrations Figure 4.2-8 Dissolved Cobalt Concentrations Figure 4.2-9 Dissolved Copper Concentrations Figure 4.2-10 Dissolved Iron Concentrations Figure 4.2-11 Dissolved Lead Concentrations Figure 4.2-12 Dissolved Manganese Concentrations Figure 4.2-13 Dissolved Nickel Concentrations Figure 4.2-14 Dissolved Thallium Concentrations Figure 4.2-15 Dissolved Zinc Concentrations Figure 4.2-16 Sulfate Concentrations Figure 4.2-17 Sulfide Concentrations Figure 4.2-18 Acidity Concentrations Figure 4.2-19 Alkalinity Concentrations Figure 4.2-20 Trends in pH, Alkalinity and Acidity in BCR1 Figure 4.2-21 Trends in pH, Alkalinity and Acidity in BCR2 Figure 4.2-22 Trends in pH, Alkalinity and Acidity in BCR3 Figure 4.2-23 Trends in pH, Alkalinity and Acidity in BCR4
Barker Hughesville Danny T Treatability Study Technical Memorandum iii

Table of Contents
List of Tables Table 4.1-1 Bench-Scale Analytical Results Table 4.1-2 Bench-Scale Removal Efficiency Table 4.1-3 Bench-Scale Comparison to Water Quality Standards Table 4.2-1 Pilot-Scale Laboratory Data Table 4.2-2 Pilot-Scale Field Data Table 4.2-3 Pilot-Scale Removal Efficiency Table 4.2-4 Pilot-Scale Comparison to Water Quality Standards Table 4.2-5 Post-Oxidation Test Data Table 4.2-6 SPLP Data for Substrate Materials
Appendices Appendix A Data Evaluation Checklists
Appendix B Laboratry Data Packages
Barker Hughesville Danny T Treatability Study Technical Memorandum iv
Table of Contents
List of Acronyms and Abbreviations °C degrees Celsius °F degrees Fahrenheit AC alternating current Ag silver Al aluminum APC aerobic polishing cell As arsenic Ba barium BCR biochemical reactor Be beryllium BOD biological oxygen demand Ca calcium Ca(OH)2 calcium hydroxide Cd cadmium CDM Smith CDM Federal Programs Corporation Chitorem Chitorem SC-20® CLP Contract Laboratory Program Co cobalt Cr chromium DEQ Montana Department of Environmental Quality DC direct current DO dissolved oxygen DQO data quality objective ESAT Environmental Services Assistance Team EPA U. S. Environmental Protection Agency Fe Iron FS feasibility study ft3 cubic feet gal/day gallons per day gpm gallons per minute HDPE high density polyethylene in3 cubic inches L liter MIW mining influenced water Mg magnesium MG(OH)2 magnesium hydroxide mg/L milligrams per liter MIW mining influenced water ml/min milliliters per minute Mn manganese MRE metal removal efficiency mS/cm milliSiemens per centimeter mV millivolts NaOH sodium hydroxide Ni nickel NPL National Priorities List ORP oxidation-reduction potential
Barker Hughesville Danny T Treatability Study Technical Memorandum v
Table of Contents
PARCCS precision, accuracy, representativeness, comparability, completeness, and sensitivity Pb lead PRP potentially responsible party PVC polyvinyl chloride QAPP quality assurance project plan QA quality assurance QC quality control RAC remedial action contract RI remedial investigation SAP sampling and analysis plan SAPS successive alkalinity producing system Sb antimony Se selenium Site Barker Hughesville Mining District Superfund Site SPLP synthetic precipitation leaching procedure SRB sulfite reducing bacteria SOPs standard operating procedures su standard units TBD to be determined TDS total dissolved solids TCLP toxicity characteristic leaching procedure Tl thallium µg/L micrograms per liter µS/cm microSiemens per centimeter USFS United States Forest Service V vanadium Zn zinc
Barker Hughesville Danny T Treatability Study Technical Memorandum vi

Section 1 Introduction CDM Federal Programs Corporation (CDM Smith) has been tasked by the United States Environmental Protection Agency (EPA) Region 8 to conduct bench-scale and pilot-scale treatability studies for the Danny T adit water drainage at the Barker-Hughesville Mining District Superfund Site (the site). This document is a final technical memorandum prepared by CDM Smith to present the results of the studies conducted in accordance with the sampling and analysis plan (SAP) specific for the bench-scale treatability study work (CDM Smith 2013a) and SAP addendum focused on the pilot-scale treatability study work (CDM Smith 2013b). The bench-scale treatability study was conducted from February through April 2013. The pilot-scale treatability was conducted from June through September 2013. These activities are being conducted under CDM Smith’s EPA Remedial Action Contract (RAC) for Region VIII (EPA Contract No. EP-W-05-049).
The treatability study activities are intended to evaluate potential passive treatment alternatives for mining influenced water (MIW) emanating from the Danny T adit. The initial phase of the treatability study included bench-scale testing in the laboratory for determination of the most promising alternatives. Following these tests and preliminary assessment of results, the pilot-scale treatability testing was planned, installed, and operated. Results from the treatability studies will be utilized for remedial alternative development and evaluations in the feasibility study (FS). Since the Danny T adit is one of many similar acidic MIW discharges at the site, the passive treatment treatability studies conducted at the Danny T adit can be used as a surrogate for other MIW discharges for the purposes of FS evaluations.
This technical memorandum summarizes the project background, treatment technology, and study objectives (Section 1), the treatability study methods and sampling (Section 2), results, analysis, and discussion (Section 3), and conclusions and recommendations (Section 4) for both the bench-scale and pilot-scale treatability studies.
1.1 Site Description and Background The Barker-Hughesville Mining District Superfund Site (site) is located in central Montana, southeast of Great Falls (Exhibit 1-1). It consists of approximately 9,600 acres in Cascade and Judith Basin Counties. There are no full-time residents at the site, but up to a dozen properties have structures that may be inhabitable during the winter months while other property owners use campers or trailers during the summer. There are 11 drainages on the site and 45 mine sites scattered across those drainages. The two major creeks within these drainages are Galena Creek and Lower Dry Fork Belt Creek. Most of the other tributaries on site feed into those two creeks. The exception is Otter Creek which flows north out of the site. Several smaller
Exhibit 1-1. Site Location Map
0
Barker Hughesville Danny T Treatability Study Technical Memorandum 1-1

Section 1 • Introduction
mines operated under the name of the Block “P” Mine, are located near the top of Galena Creek. This portion of the site (Block P Mine and Block P Tailings) is currently undergoing removal actions under an EPA order by Doe Run Resources, a potentially responsible party (PRP).
Various sampling events were undertaken by the State of Montana, the US Forest Service (USFS), and Cascade County since 1972. In 2004, EPA directed CDM Smith to summarize the data obtained to date and identify data gaps. That work was presented in the Final Technical Memorandum, Site Investigation Summary Report for Barker Hughesville Mining District NPL Site (CDM Smith 2005a). The technical memorandum also established a three-tier ranking system for mine sites which considered their potential threat based on several factors: mass wasting, waste material in contact with surface water, volume of waste material, acid mine drainage discharge to surface water, visual impacts to surface water, and severity of environmental impacts. Tier I sites had the most impacts, and Tier III had the least.
Remedial investigation (RI) and FS sampling activities were initiated by CDM Smith in 2009 and continue to present. Further information on site description, background, sampling activities, and other aspects can be found in the SAP (CDM Smith 2013a).
1.2 Treatment Technology Description Biochemical reactor (BCR) treatment methods involve a biologically-mediated process in which a carbon source (substrate) is provided as an electron donor for sulfate-reducing bacteria (SRB) to reduce sulfate present in the mining influenced water (MIW) to various aqueous sulfide species. Subsequently, the metals present in MIW react with the sulfide species to form metal sulfide precipitates such as iron, copper, nickel, and zinc sulfides. Formation of metal sulfide precipitates is the dominant mechanism by which metals are removed in the BCR over the long term. The sulfate reduction reaction can be simplified as follows:
SO4-2 + 2 CH2O HS- + 2 HCO3
- + H+
Sulfate reduction produces both reduced sulfide (S-2 and HS-) and alkalinity (HCO3-, resulting in net increase in pH on the MIW during the reaction. The formation of metal sulfides proceeds generally as follows (where Me = divalent metal species):
S2- + Me2+ MeS(s) and HS- + Me2+ MeS(s) + H+
CH2O in the sulfate reduction reaction is a generic representation of an organic substrate. The actual form of organic compound utilized by SRB to reduce sulfate can be complex and can vary for each substrate or combination of substrates. The availability of a readily usable carbon source by SRB is the limiting factor for the overall sulfide generation, and subsequent metal removal rate. Solid substrates must proceed through an anaerobic fermentation process to produce a soluble form of carbon, and a microbial consortium is involved in this process. Common cellulosic-based solid substrates utilized in BCRs include wood chips, sawdust, hay, compost, and manure. Anaerobic fermentation of cellulosic materials converts sugars into volatile fatty acids (VFAs) such as lactic acid that are used by the SRB.
Ex-situ BCR treatment can be implemented at full-scale utilizing a gravity-fed cell filled with substrate material that treats the MIW. Substrate within the BCR cell is most commonly a solid substrate mix of woody materials (e.g., wood chips, shredded wood, sawdust, hay, straw, or yard waste), compost, manure, limestone gravel, and/or inert gravel. A number of other solid materials may be used in the
Barker Hughesville Danny T Treatability Study Technical Memorandum 1-2

Section 1 • Introduction
BCR, such as crab and oyster shells, rice hulls, walnut shells, biosolids, other food waste materials, and inert sand and gravel. Some of this material provides surface area for the microbial biofilm to form and to attach.
As part of an overall passive treatment system, a BCR cell is commonly followed by aeration processes, which may include cascades and an aerobic polishing cell (APC). Aeration provides oxidation to the BCR effluent to decrease sulfides, increases dissolved oxygen (DO), and reduces biological oxygen demand (BOD) and ammonia formed from the BCR organic substrates prior to discharge to the receiving water. A common APC application includes an open settling pond and an oxidative constructed wetland. The pond provides settling capacity for residual suspended solids from the BCR effluent and aeration processes. The wetland component provides additional metals polishing treatment from vegetation as well as additional oxidation and residual solids removal.
In addition to post-treatment methods, a BCR may also be preceded by pre-treatment methods depending on site conditions. Pre-treatment methods may include increasing pH with alkaline reagents or limestone and treatments that reduce the oxidation state of the water prior to the BCR or remove excess iron and aluminum. Some of these pre-treatment aspects were emphasized during the Danny T Adit treatability study as discussed in the sections below.
1.3 Study Objectives and Evaluation Criteria Completion of bench-scale and pilot-scale treatability studies provides data for evaluating potential MIW treatment technologies at the site. The overall goal of the treatability studies was to determine if a particular method and/or amendment provides more desirable results with regard to reduction of metal concentrations, neutralization of acidic MIW, and practical considerations for full-scale field implementation. The primary goals of the treatability studies were to test the effectiveness of MIW treatment using conventional alkaline addition, pre-treatment methods, and BCR substrates. Treatability study data can be utilized for evaluation of MIW treatment technologies in the FS and utilized for design of full-scale treatment of MIW, should these technologies be selected as part of the site remedy. Post-treatment aeration processes described above are not part of the current study; however, these processes will be considered a necessary component of an overall passive treatment system in FS evaluations.
The pilot-scale treatability study approach was developed based on the results of the bench-scale treatability study, knowledge from tests at other mine sites, and site-specific application for the Danny T adit. While the same type of passive biochemical treatment technology has been effective at removing metals from MIW at other mine sites, site-specific conditions create specialized treatment scenarios. For the Danny T adit, the acidic water chemistry prompted the need to evaluate pre-treatment technologies prior to a passive BCR treatment. The basis for pre-treatment is discussed further in the following section.
The approaches and criteria used to evaluate treatment effectiveness during the treatability studies are presented in the following sections. Important considerations that can impact treatment effectiveness are presented which provide the basis for the treatability study test design. Specific objectives for the bench-and pilot-scale treatability studies were presented as principle study questions in the SAPs (CDM Smith 2013a and b). These study questions and information inputs are presented in the sections below to provide the framework for data assessment in Section 4 of this
Barker Hughesville Danny T Treatability Study Technical Memorandum 1-3

Section 1 • Introduction
memorandum. Information inputs provide greater detail on the rationale for the treatability test design during the bench- and pilot-scale phases.
1.3.1 Analytic Approach and Evaluation Criteria An effective treatment is one where toxic metals are removed from the water efficiently, and the water quality meets federal and state criteria and/or guidelines for ambient water quality. The primary measure of treatment of effectiveness for the study is the metal removal efficiency (MRE). MRE is the percent by which metals are removed between the influent and effluent of the treatment system (or raw untreated water versus treated water) and is calculated as the difference between the influent and effluent concentrations divided by the influent concentration. Where applicable, the MRE calculation was applied to all samples collected in the treatability study to evaluate effectiveness. In addition, metals concentrations measured at the end of the tests (treated water) were compared to Montana Department of Environmental Quality Water Quality Bureau Bulletin 7 (DEQ-7) acute and chronic ambient water quality standards and human health standards.
Several factors are present at the site with the Danny T adit water and other similar MIW sources that can have an effect on the MRE. The first important factor is the MIW pH. Activity of SRB may be limited by low pH, and the Danny T adit water and other similar site MIW discharges are in the acidic range (i.e., 2.0 to 3.5 su). Therefore, pre-treatment of water used in passive biochemical treatment methods may be required to provide suitable chemistry for sulfate reduction to occur effectively.
Other factors affecting the treatment process are the oxidation state of the MIW and the presence of iron and aluminum in the MIW at significant concentrations. In acidic MIW such as the Danny T adit, high iron and aluminum in an oxygen atmosphere can result in formation of aluminum (Al) and iron (Fe) oxy-hydroxide precipitates. Under oxidizing conditions (high DO and positive oxidation-reduction potential [ORP]), the rate of precipitation can be increased. These precipitates can lead to build up of scale and potential plugging in the BCR piping and substrate layers and possible premature failure of the treatment system. The Danny T adit water quality is known to contain high concentrations of Al and Fe, and in addition evidence of oxy-hydroxide precipitates are widespread at the site in association with MIW discharges to surface water. Therefore, pre-treatment of the MIW to reduce iron and aluminum concentrations prior to the BCR may be beneficial to provide protection of the BCR cell from plugging and provide enhancement of efficiency and longevity of the substrate.
Similar to low pH MIW, oxygenated MIW can also reduce the activity of the anaerobic SRB. In the presence of high oxygen concentrations, SRB can die and/or form spores, whereas aerobic microbes will thrive. Therefore, pre-treatment processes that can reduce the oxidation state of the MIW may be beneficial to enhance the efficiency of the SRB and hence MRE.
In addition to metals removal, BCR treatment effectiveness is measured by several metrics that indicate the extent of the sulfate reduction process and the type of metal removal mechanism(s) that are occurring. The extent of sulfate reduction can be correlated with MRE in order to verify that metal removal was predominantly occurring via a sulfate reduction mechanism, rather than by other removal processes such adsorption to substrates or precipitation of metal oxy-hydroxides or carbonates. The metrics for identifying the extent of sulfate reduction include the following:
Decrease in sulfate concentrations from the untreated raw water to the final treated water
Barker Hughesville Danny T Treatability Study Technical Memorandum 1-4

Section 1 • Introduction
Increased alkalinity as a byproduct of the sulfate reduction process and from limestone and other alkaline materials used in the substrate
Generation of sulfide from the sulfate reduction and formation of metal sulfide
Circumneutral or alkaline pH, low DO, and negative ORP
1.3.2 Bench-Scale Principal Study Questions and Information Inputs As presented in the bench-scale treatability study SAP (CDM Smith 2013a), the principal study questions and information inputs for the bench-scale study included the following:
1. What is the water quality of the Danny T adit water used in the bench test?
This requires collection of a raw water sample for total and dissolved metals, anions, acidity, and field parameters prior to testing.
2. What dosages of alkaline reagents are required to raise the pH to 4.5 su for pretreatment?
This requires titration of the untreated water to the target pH endpoint using reagents with known concentrations and collection of samples for metals, anions, alkalinity, and field meter measurements (pH, oxidation/ ORP, ferrous iron, DO, conductivity, and temperature) at the end.
3. What dosages of alkaline reagents would be required to raise the pH to 9.5 su to simulate treatment in a conventional water treatment plant?
This requires titration of the untreated water to 9.5 su with alkaline reagents with known concentrations, with collection of samples for metals, anions, alkalinity, and field meter measurements at the end.
4. How much sludge is generated during alkaline addition treatment?
This requires measurement of the settled volumes of sludge generated from a known volume of raw water, as well as measurement of the settling rate.
5. Does further oxidation of the raw water promote precipitation of solids?
This requires oxidation of the raw water (stirring, bubbling air through the water), measurement of DO, and sample collection if precipitation is observed.
6. What pre-treatment steps are necessary to condition the water for the BCR?
Two tiers of pre-treatment are planned. The first entails pretreatment with an alkaline reagent to pH 4.5 su, followed by an ORP reducing step prior to the BCR. The second tier entails addition of water directly to a successive alkalinity producing system (SAPS). This type of treatment will reduce the oxidation state and add alkalinity, without metering in a reagent. The substrate will consist of an organic layer of compost, manure, and wood chips to reduce the oxidation state, followed by a bed of limestone. This test will evaluate a passive pre-treatment approach that does not require electrical power for alkaline addition. Samples and field meter readings will be collected after the pre-treatment steps ahead of introduction of the water into the BCR.
Barker Hughesville Danny T Treatability Study Technical Memorandum 1-5

Section 1 • Introduction
7. Are the pre-treatment methods implementable in the field?
This requires research into equipment available to meter alkaline reagents into the MIW without power (e.g., water wheel, solar power), equipment costs, reliability and experience with such equipment, settleability of the solids, and ease of maintenance of the system
8. What is the MRE achieved for various elements and the extent of sulfate reduction in the BCR?
This requires sample collection for dissolved metals, alkalinity, anions, sulfide, and water quality measurements at the end of testing, then comparison to metal concentrations entering the reactor.
9. For design of the pilot scale test, what are the pore volumes of the various media?
This requires packing various media into columns of known volume, and determining the quantity of water required to fill the void spaced. Retention time can then be estimated for various flow rates.
1.3.3 Pilot-Scale Treatability Study Principal Study Questions and Information Inputs As presented in the pilot-scale treatability study SAP addendum (CDM Smith 2013b), the principal study questions and information inputs for the pilot-scale study included the following:
1. What is the water quality of the Danny T adit water used in the pilot-scale test?
Influent MIW collected from the Danny T adit will be characterized based upon analytical results of samples collected during the study. Influent MIW samples will be collected from the treatability study system feed tank and analyzed as specified in the SAP addendum. Variability in the influent MIW water quality through the course of the study will be evaluated against the treatment effectiveness metrics described in the objectives below.
2. What pre-treatment steps are necessary to condition the water for the BCR treatment?
Due to the very low pH and high metals concentrations in the Danny T adit water, pre-treatment is expected to be a necessary component of any passive treatment process. The study will evaluate three types of pre-treatment for effectiveness and implementability, very similar to the bench-scale study. A fourth BCR without a pre-treatment step will also be tested. The pre-treatment steps to be investigated are:
Pre-treatment with an alkaline reagent (magnesium hydroxide) to approximately pH 4.5 to 5.5. This is similar to the pre-treatment conducted during the bench-scale testing, but with a different alkaline reagent. Operation of the alkaline addition pre-treatment will require a small chemical metering pump, battery, and solar panel. Magnesium hydroxide (Mg(OH)2) may have the following advantages in implementability as compared to sodium hydroxide or lime (Barnes and Gold 2008):
- Mg(OH)2 buffers to a maximum pH of about 9.0 standard units (su) in solution, so an overdose in the treatment train or spill in the environment does not result in high pH excursions such that could occur with lime or sodium hydroxide
Barker Hughesville Danny T Treatability Study Technical Memorandum 1-6

Section 1 • Introduction
- Mg(OH)2 is safer and easier to handle than lime or sodium hydroxide because of the lower maximum pH
- Mg(OH)2 does not cause scaling potential scaling issues like lime (i.e., formation of calcium sulfate or gypsum scale)
- High concentration solutions of sodium hydroxide can freeze at moderate temperatures
Addition of water directly to a SAPS, similar to the test conducted during the bench-scale study.
Addition of water directly to a ChitoRem SC-20® (Chitorem) barrel. Similar to the SAPS pre-treatment, this treatment will reduce the oxidation state and add alkalinity, without metering in a reagent. Chitorem is a proprietary product designed for passive treatment.
3. What pre-treatment dosage of magnesium hydroxide reagent is required to achieve the optimal pH range?
The optimal pH range targeted in the pretreatment step for the study is 4.5 to 5.5 su. Mg(OH)2 was not tested during the bench-scale study, but research indicates it may be advantageous for a passive or very low energy application. Analytical results from the bench testing will be utilized to estimate a dosage and chemical quantities required. A titration test will be conducted in the field to the target pH endpoint to better determine the dosage required. This dosage rate will then be scaled up to the design flow rate for implementation of the alkaline addition pre-treatment barrel test.
4. What is the nature of the sludge and the sludge volume generated during alkaline addition pre- treatment?
The settled volumes of sludge generated from a known volume of raw water will be measured during the study. An initial estimate of sludge volume generated per liter of MIW will be made based upon the titration test described in Study Question 3. In addition, sludge depth/volume will be measured in the alkaline addition pre-treatment barrel periodically during the treatability study and at the end of the study.
5. What is the effectiveness of the alkaline addition pre-treatment?
The alkaline addition pre-treatment efficiency will be based upon analytical results of samples collected from the effluent of the alkaline addition pre-treatment barrel and influent raw water quality per Study Question 1. Pre-treatment efficiency is based upon removal of a subset of metals, and on improvement of effluent pH and alkalinity. MRE will be measured by calculating the percent difference of concentrations in the effluent versus the influent.
6. What is the effectiveness of the SAPS pre-treatment?
The SAPS pre-treatment efficiency will be based upon analytical results of samples collected from the effluent of the SAPS pre-treatment barrel and influent water quality per Study Question 1. Pre-treatment efficiency is based upon removal of a subset of metals, improvement
Barker Hughesville Danny T Treatability Study Technical Memorandum 1-7

Section 1 • Introduction
of effluent pH and alkalinity, and decrease in ORP and DO. MRE will be measured by calculating the percent difference of concentrations in the effluent versus the influent.
7. What is the effectiveness of the Chitorem pre-treatment?
The Chitorem pre-treatment efficiency will be based upon analytical results of samples collected from the effluent of the Chitorem pre-treatment barrel and influent water quality per Study Question 1. Pre-treatment efficiency is based upon the same metrics as defined in Study Question 6. MRE will be measured by calculating the percent difference of concentrations in the effluent versus the influent.
8. What is the MRE achieved for various elements in the BCR treatment barrels?
MRE is the primary metric to determine treatment effectiveness. Consistently high MRE of target metals (i.e., focusing on cadmium, copper, lead, and zinc) is quantified as a specific goal of the treatability study. The targeted MRE for the BCR barrels is a value equal to or greater than 90 percent. The actual target MRE for some metals will vary based on the chemical-specific endpoint values as provided in Study Question 10 below and variable influent concentrations throughout the study. Samples will be collected from the effluent sampling ports for each BCR treatment barrel. Analytical results will be used to calculate MRE by comparison of the metals concentrations in BCR barrel effluent versus the influent MIW concentrations collected from the system feed tank. MRE for BCR barrels that first receive a pre-treatment step will be calculated by comparison to the pre-treatment barrel effluent concentrations, rather than the treatment system influent MIW.
9. What is the extent of sulfate reduction in the BCRs?
Sulfate reduction and metal sulfide formation are the main biochemical reactions used for removal of metals by the BCR treatment process. Therefore, measurement end points are established to understand the extent of sulfate reduction as part of overall treatment effectiveness evaluation. The extent of sulfate reduction in the BCR treatment barrels will be assessed using the following metrics:
Sulfate concentration changes between MIW influent and BCR effluent directly quantifies the extent of sulfate reduction. Generally, a decrease on the order of 100 milligrams per liter (mg/L) sulfate or greater is desired, but the value is site-specific to the influent water sulfate concentration. The sulfate reduction rate will be empirically calculated over time as the average decrease in sulfate concentration measured during each sampling event times the system flow rate per substrate volume BCR barrels. Reported literature values vary, but generally a sulfate reduction rate of 100 to 800 millimoles sulfate/meter3/day have been reported for solid substrate BCRs (Gusek and Figueroa 2009; Younger et. al., 2002). The sulfate reduction rate measured during the pilot-scale study is a parameter for evaluating costs and design of future, larger scale systems.
Alkalinity concentration changes between MIW influent, pre-treatment effluents, and the BCR effluents will be measured and quantified as an indicator of SRB activity. Alkalinity is produced as a byproduct of the sulfate reduction process by SRB, and should increase from the influent MIW concentrations. In addition, alkalinity can increase from the limestone
Barker Hughesville Danny T Treatability Study Technical Memorandum 1-8

Section 1 • Introduction
present in the BCR and pre-treatment substrate materials (i.e., limestone or Chitorem). The contribution of alkalinity increases by either limestone dissolution or microbial activity can be difficult to decipher, although typically contributions by limestone are constant or slowly decreasing over time, whereas sudden increases in alkalinity can be interpreted as a result of biological activity, in correlation with other metrics (i.e., good sulfate reduction and excess sulfide generation). Generally, the range of targeted BCR effluent alkalinity should be at 50 mg/L or greater.
Sulfide is generated during sulfate reduction and soluble sulfide will be quantified by analyses of BCR effluent. The values will be used as an indicator of successful sulfate reduction resulting in metals removal by formation of metal sulfides. Generally, excess sulfide measured on the order of 5 mg/L is desired. Excess sulfide can be metabolized by SRB and generate hydrogen sulfide gas. The presence of hydrogen sulfide odor at the BCRs (rotten egg odor) is empirical evidence of sulfate reduction.
Field parameters, including pH, conductivity, temperature, DO, and ORP will be documented as indicators of effective treatment. A target pH at 6.5 to 9 su is desired for effective treatment. Observations of ORP less than approximately -150 millivolts (mV) and falling and DO less than 2 mg/L in the treated effluent is indicative of the appropriate reducing environment necessary for sulfate reduction to occur. The optimum influent water temperature for incubation and system startup is generally desired to be within 5 to 15 degrees Celsius.
10. What are the chemical-specific endpoint values to evaluate test effectiveness?
As one measure of test effectiveness, the treated effluent will be compared to the DEQ-7 human health and chronic aquatic life criteria. However, filtered effluent concentrations will be compared to the standards, not the total fraction. Table 1-1 provides the site-specific values to be used as comparison criteria for metals. Criteria for additional metals and analytes will be researched and utilized for data analysis as applicable. Study Questions 8 and 9 identify the metrics to evaluate effectiveness of the BCR treatment tests. MRE equal to or greater than 90 percent is a treatment goal; however, the test-specific MRE that correlates closest to the endpoint values will vary for each metal and each sampling event because the concentrations of metals in the influent may change over time.
Table 1-1. Targeted Endpoint Values Contaminant DEQ-7 Chronic Aquatic Life Criteria
(micrograms per liter [µg/L])* DEQ-7 Human Health Standards
(µg/L) Arsenic (As) 150 10
Cadmium (Cd) 0.27 5
Copper (Cu) 9.3 1,300
Lead (Pb) 3.2 15
Nickel (Ni) 52 100
Zinc (Zn) 120 2,000 * DEQ-7 standards (October 2012). Hardness-based standards for Cd, Cu, Pb, Ni, and Zn are shown at 100 mg/L hardness for illustration; standards will be calculated at the hardness of the sample.
11. What is the effect of seasonal weather changes on treatment effectiveness?
Barker Hughesville Danny T Treatability Study Technical Memorandum 1-9

Section 1 • Introduction
The pilot-scale treatability study is planned to be started in early summer and continue through October or early November 2013. Weather effects to metrics identified in Study Questions 7 through 9 including precipitation, colder ambient air, and colder influent MIW, will be evaluated by documenting site-specific weather conditions using data from the temporary weather station installed at the nearby Moulton mine (less than 1 mile away). The system will be constructed to prevent any percolation of precipitation water into the process flow; however, precipitation may result in percolation into the underground mine and may have an effect on the influent MIW chemistry to the treatment system, as described in Study Question 12 below.
12. How does treatment effectiveness vary in responses to potential changes in the Danny T adit MIW chemistry?
Through the course of the study, MIW influent will be sampled and the analytical results compared to the analytical results of treated effluent. This comparison will allow observation of changes to influent MIW chemistry if they occur and assessment of changes in treatment effectiveness. Measurement of changes in influent MIW chemistry as a result of precipitation or other affects are limited to the bi-weekly sampling frequency of the study. Changes in chemistry between these periods cannot be evaluated.
13. What effect does pre-treatment of MIW have on the BCR treatment efficiency?
To evaluate the possible benefits of the three pre-treatment methods, raw influent MIW will also be fed to a BCR barrel. The substrates tested in the BCR barrels will be the same for either the pre-treated tests or the non pre-treated test. Therefore, a direct comparison of BCR substrate treatment effectiveness can be conducted for each of the different scenarios.
14. What is the BCR residence time for contact between BCR substrate and MIW flow?
An initial design flow rate was defined in the SAP addendum (CDM Smith 2013b) and is presented in Section 2.2. The treatability study will begin at this flow rate. The initial flow is considered the minimum rate for targeted effectiveness goals. If the treatments are effective based on study questions above as evaluated from study data, then system flow rates may be increased. If implemented, the timing of increasing flow rates will be specific to observations during the study. Increasing flow rate is desired to maximize treatment efficiency for the substrate volume utilized.
15. What constituents are leached by the BCR materials themselves?
The substrate materials used in BCRs can sometimes leach arsenic or metals or other constituents into the water during treatment. A modified synthetic precipitation leaching procedure (SPLP) will be conducted on all substrate materials to identify constituents that may leach and be measured in the effluents. In addition, all substrate combinations will be analyzed for total metals using the standard EPA digestion methods for soils.
16. Is aeration of the BCR effluent sufficient to oxidize BOD, residual sulfide, and ammonia?
As part of the anaerobic processes in the BCR that facilitate the formation of sulfides, constituents such as ammonia and BOD are generated that are themselves toxic to aquatic life.
Barker Hughesville Danny T Treatability Study Technical Memorandum 1-10

Section 1 • Introduction
Thus, aeration of the BCR effluent is required prior to discharge. Simulation of this process in the field has been difficult to conduct at low flow rates (water may pond or not cascade, or may freeze in the open air). Thus, aeration will be tested by collection of a separate aliquot of the BCR effluent, which will be aerated through stirring, pouring the sample back and forth between two containers, or air sparging to quantify the removal of these other constituents.
Barker Hughesville Danny T Treatability Study Technical Memorandum 1-11

Section 1 • Introduction
This page intentionally blank.
Barker Hughesville Danny T Treatability Study Technical Memorandum 1-12

Section 2 Study Methods and Sampling
2.1 Bench-Scale Treatability Study The bench-scale treatability study was conducted from late February through April 2013 in CDM Smith’s Denver, Colorado treatability laboratory. The bench-scale treatability study included titrations, comparative container tests, and column tests utilizing various amendments and methods. MIW from the Danny T adit was collected from the Site in December 2012 and was utilized in the bench-scale treatability study. MIW was collected using 5-gallon cubitainers (total of 15 gallons collected) and shipped to the Denver laboratory for refrigerated storage until use in the study. In addition, a MIW sample was collected for laboratory analysis using appropriate containers and preservatives as described in the SAP (2013a) and shipped to the EPA Region 8 laboratory and Energy Laboratories in Helena, Montana for analysis. This sample documented the initial water chemistry at the start of the testing.
Because of the important factors listed in Section 1.3.1, pre-treatment of the MIW was a key focus of the bench-scale treatability study. The testing strategy included pre-treatment of the Danny T adit water by a combination of methods, followed by BCR treatment. Flow-through packed columns were utilized to test the pre-treatment methods, while the subsequent BCR treatments were tested using static containers. For the bench-scale treatability study, the MIW was tested as follows:
Step 1. Test the Effects of Oxidization: Determine the effect of oxidation on the MIW metals concentrations prior to other treatment methods.
Step 2. Test the Effects of Increased pH: Test pre-treatment by pH increase to 4.5 standard units (su) and conventional treatment by pH increase to 9.5 su with different alkaline materials using titrations.
Step 3. Conduct Hydraulic Testing of Substrates: Test to determine the approximate porosity of materials utilized in the pre-treatment columns.
Step 4. Test Pre-treatment Options of Oxidized Water Prior to Treatment in the Biochemical Reactor: Compare four variations of pre-treatments that included either alkaline addition to pH 4.5 su and/or reduction in oxidation state using flow-through columns.
Step 5. Test the Effectiveness of the BCR: Test the effectiveness of BCR treatment in static container tests using the effluent from the four pre-treatment flow-through columns. The BCR substrate is identical for all four pre-treatments.
A schematic of the bench-test protocol is provided in Exhibit 2-1. Details of each testing step are provided in the following sections.
0
Barker Hughesville Danny T Treatability Study Technical Memorandum 2-1

Section 2 • Study Methods and Sampling
2.1.1 Step 1 - Test the Effects of Oxidation The first step of the bench test is oxidation of Danny T adit water (Exhibit 2-1). Danny T adit water pH was measured during startup of bench-scale work at 2.75 su. Although this pH is below the 3.0 su threshold for iron to significantly precipitate, an oxidation test was still conducted. Oxidation was completed by adding the water to an open-topped 1 liter (L) beaker placed on a magnetic stir plate. A magnetic stir bar was used to stir the solution. An aquarium pump was also used to bubble ambient air into the water. The stirring and air bubbling was conducted for approximately 2 hours. Temperature, specific conductivity pH, DO, and ORP were measured prior to and at the end of the oxidation test.
Following oxidation, the MIW was allowed to stabilize in the beaker without agitation to settle any iron precipitates that may have formed during oxidation. After settling, the water was filled directly
Exhibit 2-1. Schematic of Bench-Scale Protocol
Step 2 Alkaline Titrations
Pre-treat with caustic to pH 4.5
BCR test with woody substrate
Flow through SAPS Column for ORP reduction
Test different SAPS sizes with distilled water to determine retention time vs. size
Raw Danny T Adit Water
Step 3 Hydraulic Test
Step 4 Pre-treatment Columns
Oxidize raw water if necessary, and settle solids
Step 1 Oxidation
Pre-treat with lime to pH 4.5
Flow through SAPS Column for ORP reduction
BCR test with woody substrate
BCR test with woody substrate
BCR test with woody substrate
Pre-treat with flow through Chitorem column for alkaline addition and ORP reduction
Titrate to pH 9.5 with lime
Titrate to pH 9.5 with caustic
Titrate to pH 4.5 with lime
Titrate to pH 4.5 with caustic
Titrate to pH 4.5 with Chitorem
Pre-treat with flow through SAPS column for ORP reduction and alkaline addition
Step 5 BCR Treatment
0
Barker Hughesville Danny T Treatability Study Technical Memorandum 2-2
Section 2 • Study Methods and Sampling
into the sample containers using a peristaltic pump and submitted for laboratory analysis of total and dissolved metals, acidity, alkalinity, and anions. The sample for dissolved metals was filtered through a 0.45 micron in-line filter using a peristaltic pump. Metals, alkalinity, and anions were measured at the Region 8 EPA Environmental Services Assistance Team (ESAT) laboratory in Denver, Colorado. Acidity was measured by Energy Laboratories in Helena, Montana.
2.1.2 Step 2 – Test the Effects of Increased pH Titration tests were performed on the oxidized MIW to increase pH to approximately 4.5 su Using sodium hydroxide (NaOH), calcium hydroxide (Ca(OH)2), and Chitorem. Tests were also performed raising the pH to 9.5 su using NaOH and Ca(OH)2 (lime). The objective was to reduce iron and aluminum concentrations and raise pH prior to BCR testing.
2.1.2.1 Pre-Treatment Alkaline Addition Via Titration Pre-treatment with alkaline titrations was conducted as shown in Step 2 on Exhibit 2-1. Three different alkaline materials were used; a 25 percent by weight NaOH solution, 10 percent by weight Ca(OH)2 solution, and Chitorem solid flakes.
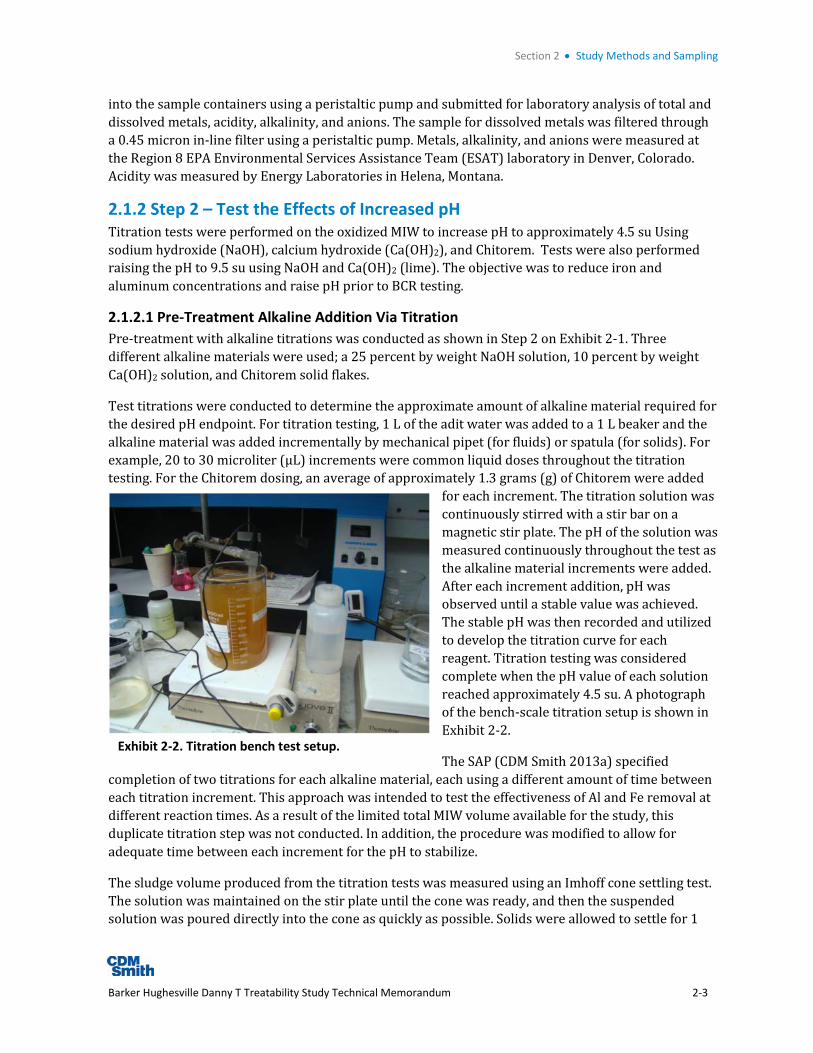
Test titrations were conducted to determine the approximate amount of alkaline material required for the desired pH endpoint. For titration testing, 1 L of the adit water was added to a 1 L beaker and the alkaline material was added incrementally by mechanical pipet (for fluids) or spatula (for solids). For example, 20 to 30 microliter (µL) increments were common liquid doses throughout the titration testing. For the Chitorem dosing, an average of approximately 1.3 grams (g) of Chitorem were added
for each increment. The titration solution was continuously stirred with a stir bar on a magnetic stir plate. The pH of the solution was measured continuously throughout the test as the alkaline material increments were added. After each increment addition, pH was observed until a stable value was achieved. The stable pH was then recorded and utilized to develop the titration curve for each reagent. Titration testing was considered complete when the pH value of each solution reached approximately 4.5 su. A photograph of the bench-scale titration setup is shown in Exhibit 2-2.
The SAP (CDM Smith 2013a) specified completion of two titrations for each alkaline material, each using a different amount of time between each titration increment. This approach was intended to test the effectiveness of Al and Fe removal at different reaction times. As a result of the limited total MIW volume available for the study, this duplicate titration step was not conducted. In addition, the procedure was modified to allow for adequate time between each increment for the pH to stabilize.
The sludge volume produced from the titration tests was measured using an Imhoff cone settling test. The solution was maintained on the stir plate until the cone was ready, and then the suspended solution was poured directly into the cone as quickly as possible. Solids were allowed to settle for 1
Exhibit 2-2. Titration bench test setup.
0
Barker Hughesville Danny T Treatability Study Technical Memorandum 2-3
Section 2 • Study Methods and Sampling
hour and then the sludge volume was recorded. After measurement of sludge, the settled water was pumped from the cone into appropriate sample bottles for laboratory analysis. Each of the three titration solution test samples were analyzed for total and dissolved metals, acidity, alkalinity, and anions. After sample collection the remaining settled sludge and water volume was allowed to remain in the cone for several hours to days to observe the compaction of sludge within the cone. Additional volume measurements were recorded periodically. Metals, alkalinity, and anions were measured at the Region 8 EPA ESAT laboratory in Denver, Colorado. Acidity was measured by Energy Laboratories in Helena, Montana.
The SAP (CDM Smith 2013a) indicated that the total suspended solids (TSS) sample would be collected from the titration test solution; however, due to limited sample volume this sample was not be collected. Therefore, TSS samples for the pre-treatment methods to pH 4.5 su by NaOH and Ca(OH)2 were later collected from the larger 8 L pre-treatment batches that were created as part of Step 4 (see Exhibit 2-1).
2.1.2.2 Conventional Alkaline Addition via Titration Identical titration tests were performed on the oxygenated adit water using a 25 percent NaOH solution and a 10 percent Ca(OH)2 solution and a target endpoint pH of 9.5 su. This titration was intended to simulate the metal removal that could be obtained through a conventional treatment process for an acidic MIW. Sludge production was recorded and the settled water was sent for the same laboratory analysis as for pre-treated samples.
2.1.3 Step 3 - Conduct Hydraulic Testing of Substrates The approximate porosity of the SAPS substrate to be tested as a pre-treatment, was measured. Columns were constructed and filled with a known volume of substrate material and then a measured volume of water was added to the columns until the material was completely saturated within minimal air voids. Two columns were tested with different volumes of substrate material (one twice as much volume as the other) to test the effect of the volume change on the porosity measurement. The SAPS substrate composition is presented in Section 2.1.4.3.
Columns to measure approximate porosity were constructed of 1.5 inch diameter clear plastic tubes with steel top and bottom plates, rubber gaskets to provide a water tight seal against the steel plates, and a threaded rod secured with nuts and washers to the top and bottom plates. Two tube lengths were used, approximately 10 inches and 15 inches in length. After filling the tubes with equivalent percentage volumes of SAPS substrate materials, the columns were sealed by tightening the nuts on each threaded rod (total of four rods used). The bottom steel plate was also fitted with a small ball valve and tubing. The top layer of the SAPS substrate was marked with a sharpie marker in anticipation of floating of the substrate after water addition and to determine the total volume of water to add.
Initially attempts were made to saturate the columns using only gravity fed water; however, the suction pressure created by the small diameter column tubes prevented saturation. A peristaltic pump was used to pump water into the columns. After connection of appropriate tubing to the columns, the effluent valve (on the column bottom) was opened, and the pump was turned on to force water through the column. Effluent water was collected in a beaker and recycled with the pump until saturated conditions were observed (limited visible air pockets) at a water level up to the original
0
Barker Hughesville Danny T Treatability Study Technical Memorandum 2-4

Section 2 • Study Methods and Sampling
marked substrate layer. The total water used to saturate the column was measured to provide a total volume balance and calculate approximate porosity.
The SAP (CDM Smith 2013a) indicated that a hydraulic drain test would also be conducted to record the amount of time required to drain the columns by gravity. Upon completion of the porosity test the effluent valve was opened; however, likely due to the suction pressure of the columns water would not drain by gravity.
2.1.4 Step 4 – Test Pre-treatment Options Prior to Treatment in the BCR Pre-treatment of the Danny T water was conducted prior to the BCR tests using a combination of alkaline pre-treatment and/or SAPS columns as follows:
Pre-treatment first with NaOH solution to pH 4.5 su, followed by flow through a SAPS column (Column #1)
Pre-treatment first with Ca(OH)2 solution to pH 4.5, followed by flow through a SAPS column (Column #2)
Flow though the SAPS column with raw oxidized Danny T adit water (Column #3)
Flow through a Chitorem column (Column #4)
2.1.4.1 Liquid Alkaline Addition Pre-treatment Prior to SAPS columns #1 and #2, raw oxidized Danny T adit water was pre-treated with both the NaOH and Ca(OH)2 reagents. The liquid alkaline reagent dosages determined for the 1 liter (L) titrations in Step 2 were applied to large 8 L batches mixed in 5 gallon buckets with a mechanical stirrer. Eight-liter batches pre-treated to approximately pH 4.5 su were created for both liquid reagents. pH was recorded after sufficient reaction time had occurred. A photograph of the large batch neutralization process is shown in Exhibit 2-3.
As discussed in Section 2.1.2.1, samples for TSS were collected from these large batch pre-treatments. The TSS samples were collected at the end of the titration after pH had stabilized and while the mechanical mixer was still in operation to suspend solids.
2.1.4.2 SAPS and Chitorem Column Setup SAPS and Chitorem columns for the bench-scale treatability study were constructed with 5.5-inch inner diameter (ID) by 12-inch tall clear plastic columns. Columns consist of a central clear plastic cylinder and a sealed top and bottom plate. The top and bottom sealed plate (with a rubber gasket) both contain a central 3/8-inch female pipe threaded inlet and a radial distribution plate to distribute
Exhibit 2-3. Large batch neutralization pre-treatment test setup.
0
Barker Hughesville Danny T Treatability Study Technical Memorandum 2-5

Section 2 • Study Methods and Sampling
Exhibit 2-4. Pre-saturated SAPS column.
influent flow and collect effluent flow. The top and bottom plates are the same design, to allow operation of upflow or downflow columns as desired. For the bench-scale study, columns were operation as upflow. A photograph of a pre-saturated SAPS column is shown in Exhibit 2-4 (prior to addition of MIW).
Influent MIW was stored in 5-gallon buckets and pumped into the columns using a cartridge pump. The cartridge pump was capable of a wide range of flow rates and was capable of operating 8 separate flow lines at the same time. Silcone microtubing was used to operate the pump MIW flow. The microtubing was converted to 1/4-inch poly tubing using poly adapters to the feed buckets and to the column inlets. The column inlet and outlet consisted of 3/8-inch male pipe thread to barbed fittings. All threaded connections were sealed with teflon tape and all tubing connections were secured with hose clamps.
The effluent line (at the top of the columns) was fed into a 2 L plastic wide mouth sample collection bottle as shown in Exhibit 2-5. The bottles were modified to allow flow to passively move through the bottle or fill up to 2 L of sample during the column operation, while maintaining an inert atmosphere above the sample with argon gas. Inlet and outlet holes were drilled through the top cap and bottom of the bottle and 3/8-inch male pipe thread to barb fittings were installed. The male pipe thread end of the fittings were inserted into the holes and secured on all sides with waterproof silicone sealant. The outlet fittings (on the bottom) were connected to a ball valve to allow the sample container to fill as necessary. An additional hole was drilled through the top of the bottle and a ¼-inch tubing line was inserted that was connected to an argon gas tank. A gas line manifold was connected to the argon tank which allowed the argon flow to feed four lines simultaneously into each bottle throughout the duration of the column operation.
2.1.4.3 SAPS and Chitorem Substrates SAPS substrate consisted of a compost and dairy cow
manure mixture followed by a limestone layer as shown in Exhibit 2-4. The limestone utilized was screen reject product from a limestone quarry in Townsend, Montana, thus it contained mostly ¼-inch minus fragments and a large quantity of crusher fines. To reduce the over-reactivity of the columns from the crusher fines, the limestone material was further sieved through a 10 mesh (2 millimeter) sieve to remove fines. The larger particles were retained and utilized for the study. The manure was obtained from a small private dairy near Helena, Montana. The compost utilized was EKO Compost Original obtained from a local hardware store in Denver, Colorado. A compost product from the Helena area was intended for the project; however, the supplier did not ship the materials to the Denver laboratory in time for the study.
0
Barker Hughesville Danny T Treatability Study Technical Memorandum 2-6
Section 2 • Study Methods and Sampling
Prior to loading materials into the columns, material densities were measured. A quantity of each substrate material was added to an open top tared beaker and the weight was recorded. Because of variable densities, variable volumes were added to beakers ranging from 125 ml up to 1 L. Densities of materials used in the SAPS columns and Chitorem column are provided in Exhibit 2-6.
The ratio of organic materials (compost and manure) to limestone was designed to be approximately 15 percent to 85 percent by weight or 25 percent to 75 percent by volume. Columns #1, #2, and #3 were each filled with a mixture of 450 grams (g) each of compost and manure. The compost and manure were added to a bowl and mixed thoroughly and then packed into the column. Following the compost and manure, 5,011 g of limestone was added to each column. The total height of the materials within the column was approximately 10.0 inches. The compost/manure mixture height in the 3 columns was approximately 2.5 inches and the limestone layer was approximately 7.5 inches.
Chitorem substrate consisted of a mixture of Chitorem and an inert construction sand. Construction sand was obtained from a local hardware store in Denver, Colorado. The ratio of Chitorem to sand was designed to be approximately 20 percent to 80 percent by weight based on
recommendations by the manufacturer. For Column #4, 1,236 g Chitorem and 4,944 g construction sand were mixed together in a bowl and added to the Column. However, out of the total 6,180 g mixture, only 4,920 g were added to the column. The height of the dry Chitorem/sand mixture within the column was 8.25 inches.
2.1.4.4 Column Operation and Sampling A photograph of the completed and operational column test setup is provided in Exhibit 2-7. After addition of the substrate materials, the top plates were securely installed into the gaskets and the threaded rods were tightened. Columns could not be saturated using the cartridge pump due to the back pressure within the sealed columns; therefore, a peristaltic pump was utilized. The peristaltic
Exhibit 2-6. Calculated Densities for Column Substrate Materials
Substrate Calculated Density (g/ml or kg/L) Compost 0.68 Dairy Manure 1.12 10-mesh plus limestone 1.54 Chitorem 0.80 Construction sand 1.88
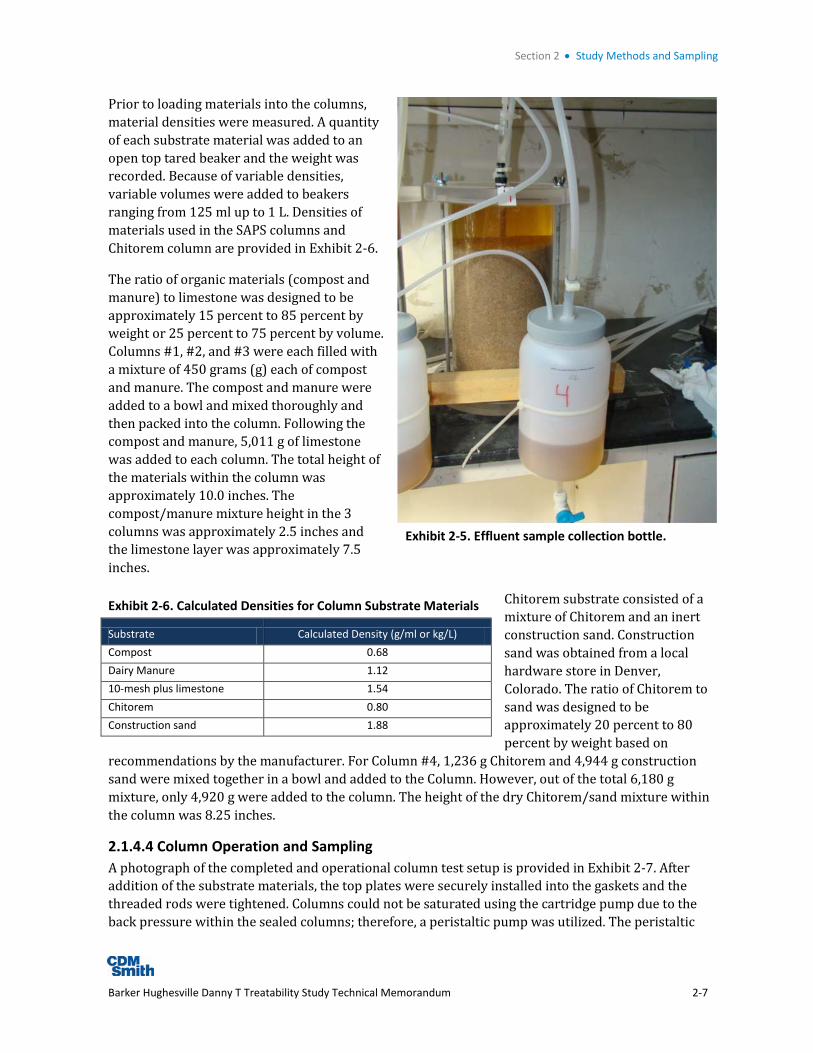
Exhibit 2-5. Effluent sample collection bottle.
0
Barker Hughesville Danny T Treatability Study Technical Memorandum 2-7

Section 2 • Study Methods and Sampling
pump was operated on high flow initially to overcome the pressure and then at a slower flow rate to saturate the columns. Effluent was discharged for a few minutes once the columns were initially full and then the cartridge pump inlet lines were reconnected.
The columns were operated for a total of approximately 20 hours at a steady state flow rate with the cartridge pump. Given the short duration schedule of operation and volume of water to pump through each column, the columns were operated at the highest possible flow rate attainable with the cartridge pump. Prior to connection to the columns, a flow rate test indicated the micro tubing size and type of cartridge pump provided a maximum flow rate of 9 millimeters/minute (ml/min).
At approximately 12 hours after flow through with the cartridge pump, a flow rate test was conducted on each effluent line. The flow rate test indicated a flow rate range of 7.0 to 8.0 ml/min between the different columns. Three flow rate tests were conducted for each column to obtain an average value as shown in Exhibit 2-8 below.
After approximately 17 to 18 hours after flow through, samples were collected from each column. CDM Smith laboratory measurements were collected first which included pH, specific conductivity, temperature, ORP, and DO. Samples for offsite laboratory analysis were then collected for total and dissolved metals, acidity, alkalinity, and anions. Metals, alkalinity, and anions were measured at the Region 8 EPA ESAT laboratory in Denver, Colorado. Acidity was measured by Energy Laboratories in Helena, Montana.
Exhibit 2-8. Column Effluent Flow Rate Test Column # Flow 1 (ml/min) Flow 2 (ml/min) Flow 3 (ml/min) Average (ml/min) 1 7.4 7.2 7.4 7.33 2 7.0 7.4 7.4 7.27 3 7.8 8.0 7.8 7.87 4 7.2 7.6 7.6 7.47
After 20 hours of flow through, approximately 2.5 L of pre-treated water was drained from the sample collection bottles into each of the four BCR test containers.
Based on the column dimensions and measured height of SAPS substrate materials, the total volume of materials placed in the SAPS columns #1, #2, and #3 was approximately 238 cubic inches (in3). For the Chitorem Column #4 the volume was 196 in3. Using these volumes, the column flow rate, and porosities, the retention time of water moving through the columns was calculated. As indicated in the hydraulic test results, the SAPS substrate effective porosity was measured at approximately 53
Exhibit 2-7. Completed and operational column test setup.
0
Barker Hughesville Danny T Treatability Study Technical Memorandum 2-8
Section 2 • Study Methods and Sampling
percent. A hydraulic test on the Chitorem/sand mixture was not conducted. However, a recent study by EPA’s Office of Research and Development (ORD) performed a bromide tracer porosity test on the standard 20/80 Chitorem/sand mixture. This study indicated an effective porosity of 29 percent (Al Abed 2013). Variability between the types of sand utilized and Chitorem lot batches are expected; however, this measured effective porosity is a reasonable estimate in lieu of other available data.
For the SAPS columns #1, #2, and #3 the hydraulic retention time was calculated to be approximately 4.6 hours. This calculation utilized an average flow rate of 7.5 ml/min, the 238 in3 substrate volume, and 53 percent porosity. For the Chitorem Column #4 the hydraulic retention time was calculated to be approximately 2.1 hours. This calculation utilized the same flow rate, the 196 in3 substrate volume, and 29 percent porosity.
2.1.5 Biochemical Reactor Testing (Step 5) The last step in the MIW treatment process was static BCR container tests. A total of 4 tests were completed for BCR treatment, one for each of the pre-treatment approaches described in step 4. Each BCR container test contained the same type and quantity of substrates. These substrates were selected based on literature research and CDM Smith’s experience with testing at other sites. The following BCR substrate mixture was implemented (on a weight basis):
10 percent sawdust
20 percent wood chips
10 percent well-decomposed organic compost
20 percent hay
30 percent ¼-inch limestone chips (screened out less than 10 mesh fines)
10 percent fresh dairy manure
The same compost, manure, and limestone sources were utilized for the BCR substrate as described above the SAPS. Sawdust and wood chips materials were obtained from a lumber company in Clancy, Montana. Hay was obtained from a local farm and ranch supplier in Denver, Colorado.
Static BCR tests were conducted using 1 gallon plastic carboys with spigot caps. The substrate components were mixed thoroughly in large bowls and placed into the carboys. Approximately 2.5 L of pre-treated water was added to each container. Following introduction of the pre-treated water, argon gas was bubbled into each container to minimize oxygen presence. The containers were then collapsed to minimize air space and sealed.
After 1 week of incubation, significant gas development was observed within the carboy containers. To prevent further expansion of the containers, gas was vented by opening the spigots and recompressing the containers. The containers were not opened again until sample collection. Samples for analysis of CDM Smith laboratory parameters were collected after exactly 5 weeks of incubation. Samples were analyzed for pH, specific conductivity, temperature, ORP, DO and HACH sulfide.
One week later (after 6 weeks of incubation), the same laboratory parameters were collected along with HACH alkalinity. At this time, offsite laboratory samples were also collected for dissolved metals,
0
Barker Hughesville Danny T Treatability Study Technical Memorandum 2-9

Section 2 • Study Methods and Sampling
acidity, alkalinity, anions, sulfide, biological oxygen demand (BOD), and TSS. Samples were submitted to Energy Laboratories in Helena, Montana, for analysis.
2.2 Pilot-Scale Treatability Study This section addresses the pilot-scale construction and operations, including collection and routing of MIW, pilot-scale treatment description and process flow design, system startup and shutdown, and sampling and maintenance activities. The pilot-scale treatability study was conducted from June through September 2013. The treatment system was constructed in mid-June 2013 and system startup completed in mid-July. The treatment system operated through the end of September 2013 but the final sample collection occurred on September 16, 2013. A final sample collection scheduled for the first week of October was canceled due to the partial government shutdown.
2.2.1 Collection and Routing of MIW MIW was collected from the Danny T adit for use in the pilot-scale treatability study. A small collection basin approximately one to two feet deep was constructed by creating an earthen and rock berm just down gradient of the adit portal. As shown in Exhibit 2-9, a 2-inch diameter by 10-foot long polyvinyl chloride (PVC) pipe was installed through the earthen berm to collect the ponded MIW. Additional 2-inch PVC overflow pipes were installed through the berm to provide a pathway for water in the case of higher flow or stormwater event. Overflow pipes were installed at approximately 3 inches (middle) and 6 inches (upper) above the treatment system inlet pipe. A small spillway was constructed in the earthen berm at an elevation above the two overflow pipes. At the time of installation in June, all of the collected adit flow was entering the treatment system collection pipe.
The berm was constructed of local fill materials adjacent to the adit portal. Powdered bentonite was incorporated around each of the pipe penetrations to provide added water detention and minimize leakage. The earthen berm was lined with boulders and cobbles on the outside for structural support.
A 2-inch PVC ball valve was installed on the end of the 2-inch PVC pipe to control flow to the treatment system. Approximately 80 feet of 2-inch high density polyethylene (HDPE) pipe was connected to the ball valve to route MIW to the feed tank. All piping up to the feed tank followed the natural downslope topography which was more than adequate to ensure gravity flow.
The 2-inch HDPE pipe was connected to the feed tank using a bulkhead fitting, short pipe nipple, and a threaded coupling as shown in Exhibit 2-10. The feed tank supplied MIW to the treatment system, settled some of the iron precipitates in the raw water, and overflowed excess water not used in the treatability study. The MIW tank outlet to the treatment system was a 1-inch HDPE pipe connected to a bulkhead fitting, short nipple and threaded
Exhibit 2-9. MIW collection basin at Danny T Adit.
2-inch PVC collection pipe to treatment system
Middle overflow
pipe MIW
collection basin
Upper overflow
pipe
Control valve
0
Barker Hughesville Danny T Treatability Study Technical Memorandum 2-10
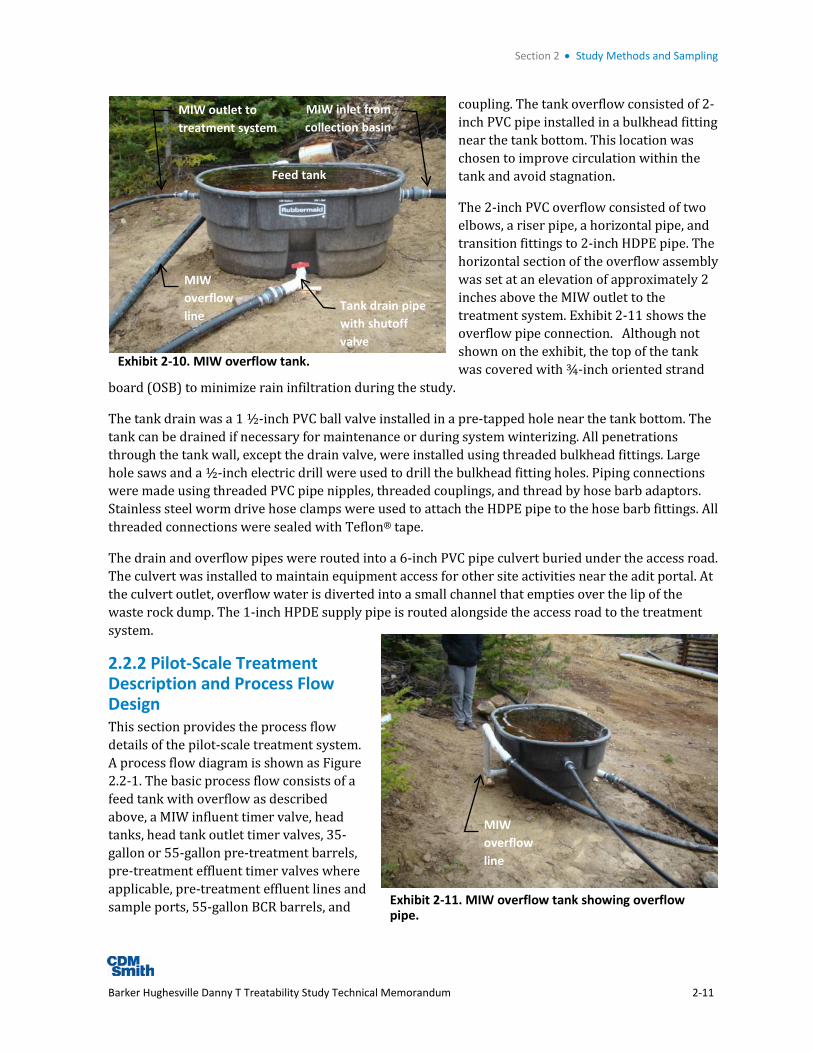
Section 2 • Study Methods and Sampling
coupling. The tank overflow consisted of 2-inch PVC pipe installed in a bulkhead fitting near the tank bottom. This location was chosen to improve circulation within the tank and avoid stagnation.
The 2-inch PVC overflow consisted of two elbows, a riser pipe, a horizontal pipe, and transition fittings to 2-inch HDPE pipe. The horizontal section of the overflow assembly was set at an elevation of approximately 2 inches above the MIW outlet to the treatment system. Exhibit 2-11 shows the overflow pipe connection. Although not shown on the exhibit, the top of the tank was covered with ¾-inch oriented strand
board (OSB) to minimize rain infiltration during the study.
The tank drain was a 1 ½-inch PVC ball valve installed in a pre-tapped hole near the tank bottom. The tank can be drained if necessary for maintenance or during system winterizing. All penetrations through the tank wall, except the drain valve, were installed using threaded bulkhead fittings. Large hole saws and a ½-inch electric drill were used to drill the bulkhead fitting holes. Piping connections were made using threaded PVC pipe nipples, threaded couplings, and thread by hose barb adaptors. Stainless steel worm drive hose clamps were used to attach the HDPE pipe to the hose barb fittings. All threaded connections were sealed with Teflon® tape.
The drain and overflow pipes were routed into a 6-inch PVC pipe culvert buried under the access road. The culvert was installed to maintain equipment access for other site activities near the adit portal. At the culvert outlet, overflow water is diverted into a small channel that empties over the lip of the waste rock dump. The 1-inch HPDE supply pipe is routed alongside the access road to the treatment system.
2.2.2 Pilot-Scale Treatment Description and Process Flow Design This section provides the process flow details of the pilot-scale treatment system. A process flow diagram is shown as Figure 2.2-1. The basic process flow consists of a feed tank with overflow as described above, a MIW influent timer valve, head tanks, head tank outlet timer valves, 35-gallon or 55-gallon pre-treatment barrels, pre-treatment effluent timer valves where applicable, pre-treatment effluent lines and sample ports, 55-gallon BCR barrels, and
Exhibit 2-10. MIW overflow tank.
Tank drain pipe with shutoff valve
MIW inlet from collection basin
Feed tank
MIW outlet to treatment system
MIW overflow line
Exhibit 2-11. MIW overflow tank showing overflow pipe.
MIW overflow line
0
Barker Hughesville Danny T Treatability Study Technical Memorandum 2-11

Section 2 • Study Methods and Sampling
BCR effluent lines and sample ports. To achieve gravity operation, head tanks and pre-treatment barrels were constructed on raised scaffold planks. The BCR barrels were installed on a wood platform at ground level. Timer valves on the main feed tank and head tanks opened at regular intervals throughout the day to provide a batch of MIW to each pre-treatment or BCR barrel.
As described in the SAP Addendum (CDM Smith 2013b), the design for the pilot study was based on a 24-hour hydraulic retention time for the BCRs. The Darcy’s Law equation was utilized to calculate the target flow rate using the assumed retention time, assumed substrate porosity, and designed volume of substrate to be utilized in each barrel. The batch volume contained in each head tank was originally set at approximately 9 L and the timer valves were set to open on 4 hour intervals. This equates to an average MIW flow rate of 54 L per day (9 L per batch times 6 batches per day) or 37.5 ml/min. As the study progressed, batch volume modifications were made. These modifications and other activities and system changes are described in Section 2.2.4.2 Operations and Maintenance.
2.2.2.1 Scaffold and Platform Construction A steel scaffold assembly, 5-foot wide by 7-foot long by 5-foot tall, was field installed to support the treatment system. A photograph of the constructed scaffold and platforms is shown in Exhibit 2-12. A suitably sized area adjacent to the existing road was cleared and leveled using a track excavator in conjunction with other site work. The scaffold was placed on two 2-inch by 8-inch wood planks to reduce potential settling. Approximately 2-inch deep trenches were hand dug and leveled with pea gravel before setting the wood planks. The scaffold was installed on the wood planks and further leveled by adjusting the threaded rods on each baseplate.
Two standard scaffold planks were installed on the lowest cross bar, one to support the pre-treatment barrels, and one to provide personnel access for construction, sampling, and maintenance. To support
the pre-treatment barrels (potentially over 1,000 pounds), one scaffold plank was reinforced with a truss structure. The truss structure consisted of a 2-inch by 4-inch wood box frame and vertical supports placed on 8-inch centers across the length of the scaffold plank. The truss structure was built on 4-inch by 4-inch wood footers set and leveled on bare ground. Construction was completed with 3-inch framing nails.
To install a roof over the scaffolding, four 2-inch by 6-inch boards were bolted to each of the scaffold frame corners. Two of the vertical boards were 6-inches taller to provide a sloped roof. Two horizontal boards were screwed to the vertical boards to support the roof rafters. Cleats were screwed to the vertical boards as added support for the horizontal boards. The roof was pre-assembled on the ground
Exhibit 2-12. Completed scaffolding and platforms during treatment system construction.
BCR barrels
Pre-treatment barrels
Head tanks
0
Barker Hughesville Danny T Treatability Study Technical Memorandum 2-12
Section 2 • Study Methods and Sampling
from 8-foot long 2-inch by 4-inch rafters. The roof panel was sheeted with two 4-foot by 8-foot sheets of 1/2-inch OSB. The center seam was sealed with silicone caulking on the upper surface.
The roof frame was manually hoisted into place and attached to the horizontal boards using galvanized “hurricane” clips, nails, and screws. Diagonal 2-inch by 4-inch bracing was added on each end for support. For wind protection, the roof was secured at all four corners with ratchet tie-down straps. The straps attached to either adjacent trees or were secured with 2-foot long rebar stakes driven into the ground.
On the upper scaffold cross bar, a head tank support platform was constructed using 2-inch by 4-inch boards nailed to two 8-foot long 4-inch by 4-inch beams. The platform frame provides spaces between supports for pipe connection into the bottom of the head tanks. Timer valves were installed below the head tank supports.
A platform of wood 4X4’s was constructed outside the scaffold to support the BCR barrels. After hand excavating a shallow trench, pea gravel was added as necessary, and the two 4x4 footers were installed and leveled. The BCR barrels were placed directly on the footers.
2.2.2.2 Head Tanks Exhibit 2-13 shows the installed head tanks and associated piping, valves, and fittings. The 1-inch HDPE feed line supplies flow to the treatment system. The feed line between the feed tank and pilot equipment was routed along the ground surface. Near the scaffold, 90 degree elbows route the feed line to the upper scaffold platform. On the platform, the feed line connects to a 1-inch PVC ball valve for manual shutoff and flow control. Downstream of the valve, the feed line converts to 1/2-inch schedule 40 PVC pipe, which tees for a raw water sample tap. The sample tap consists of a 1/2-inch PVC ball valve. Downstream of the sample tap tee, transition fittings connect the PVC pipe to a 3/4-inch hose thread adaptor and the inlet timer valve, a battery powered Rainbird® garden irrigation valve. To control treatment system flow in batches, this timer valve was set to open automatically every 4 hours. It remained open for 15 minutes, long enough to fill the head tanks to overflowing.
The timer valve outlet is an adaptor that converts back to 1/2-inch PVC pipe to form a supply header. The inlet pipe header spans the length of the platform and supplies all four head tanks. PVC ball valves and slip unions were installed prior to each head tank to provide manual shutoff should it be necessary to disconnect a head tank.
The overflow line for each head tank was located 10-inches from the bottom, approximately 1 inch higher than the inlet, to maintain a flooded inlet condition. The overflow consists of 1-inch PVC pipe connected to a male thread adaptor. The male adaptor was inserted through a hole in the tank wall and secured with a plastic jam nut. A female threaded adaptor was glued to the overflow pipe stub and a thread by hose barb adaptor was installed to transition to the 1-inch HDPE pipe. To keep the area around the pilot dry and uncontaminated, the overflow tubing was routed down the side of the scaffold and into a 4-inch corrugated HDPE carrier pipe. The carrier pipe parallels the road for approximately 100 feet and discharges bypassed water down the steep hillside at the same location where the MIW was previously discharging. This configuration allows each head tank to fill completely and overflow each time the inlet timer valve opens. Once the feed tanks are full, additional water overflows out of the head tanks until the timer valve closes.
0
Barker Hughesville Danny T Treatability Study Technical Memorandum 2-13

Section 2 • Study Methods and Sampling
Head tank effluent piping was connected to 1/2-inch bulkhead fittings installed in the bucket bottoms. Short lengths of 1/2-inch PVC pipe and hose thread adaptors provide the transition to the head tank outlet timer valves. To provide the correct batch volume, 3.75-inch long riser pipes were threaded into the bulkhead fittings inside the buckets. The riser length was adjusted so each head tank contained 9 L of water between the overflow elevation and the riser outlet elevation. The head tank outlet timer valves were programmed to open 15 minutes after the feed inlet timer valve closed to make sure the head tanks were completely full prior to discharging the 9 L batch of MIW into each pre-treatment or BCR barrel. The head tank outlet timer valves were set to remain open for 15 minutes on four hour intervals which provides an average flow rate of 37.5 ml/min.
The head tanks were made from 5-gallon plastic buckets fitted with plastic lids. All penetrations through the buckets were made by drilling with an appropriate size hole saw. Side penetrations for the MIW inlet and overflow were secured with threaded PVC conduit jam nuts. All threaded connections were sealed with Teflon® tape. Bucket penetrations were sealed with silicone waterproof sealant.
2.2.2.3 Pre-treatment Barrels Pre-treatment components and system implementation are described in the following sections. Pre-treatment was provided for three of the four treatment trains. As shown on Figure 2.2-1, alkaline addition pre-treatment was installed downstream of head tank 4 (flow line 4), Chitorem pre-treatment was installed downstream of head tank 3 (flow line 3), and SAPS pre-treatment was
Exhibit 2-13. Head tanks and appurtenances.
Head tank
MIW feed timer valve MIW feed
sample valve
1 2 3 4
MIW feed control valve
Slip coupling and shutoff valve
Overflow line
Head tank effluent timer valve to pre-treatment
Mg(OH)2 feed line
0
Barker Hughesville Danny T Treatability Study Technical Memorandum 2-14
Section 2 • Study Methods and Sampling
installed downstream of head tank 2 (flow line 2). Flow from head tank 1 (flow line 1) was fed directly into BCR1 without pre-treatment. The head tank locations and numbers are shown in Exhibit 2-13. The pre-treatment test design generally mirrors the bench-scale test design but at a larger scale and using the continuously draining water from the mine adit. Based on the bench-scale results, it was determined that alkaline pre-treatment prior to a SAPS was not a necessary step, and therefore not tested in the pilot study. Line 1 with no pre-treatment provides a control to compare each of the pre-treatments trains.
Alkaline Addition Pre-Treatment Alkaline addition was conducted using a magnesium hydroxide (Mg(OH)2) solution. The complete pre-treatment system required the use of a solar charger and battery-powered dosing pump, timer switch, slurry mixer, a Mg(OH)2 stock tank, and associated piping and tubing. This section focuses on the alkaline addition system. Further details on the solar power system are provided in Section 2.2.2.5. The process operated sequentially with a batch of Mg(OH)2 solution fed into the 55-gallon pre-treatment barrel, followed by a batch flow of influent MIW at timed intervals, a set reaction time inside the reactor (static flow condition), and an effluent timer valve that drained the treated water into a subsequent BCR barrel.
A 60 percent concentration by weight Mg(OH)2 solution was purchased in liquid form, diluted in batches at a rate of 1 part solution to 15 parts distilled water, and placed in the stock tank. This dilution equates to approximately 6.2 percent by weight solution. The stock tank was made from a 5-gallon plastic bucket. The metering pump was a Masterflex C/L® variable speed peristaltic pump. A short length of suction tubing was connected to the metering pump and secured near the bottom of the stock tank inside a length of 1/2-inch PVC pipe. The pipe was secured to the tank wall using a male threaded adaptor and conduit jam nut. The metering pump fed the Mg(OH)2 solution through 2.79 millimeter Tygon® tubing to the 55-gallon pre-treatment barrel.
Because Mg(OH)2 solution is a slurry, the solution must be mixed to keep the solids in suspension. The mixer was purchased from Cole Parmer (item number T-50402-10). The mixer was equipped with a 12-inch long 316 stainless steel shaft and two blade propeller-type impeller. Initially, the mixer was operated continuously 24 hours per day at a speed setting of 4 on a scale of 1 to 10 to maintain the solution in suspension. This approach was later modified to save power consumption as described in Section 2.2.4.2.
The target feed rate of Mg(OH)2 was designed to achieve a pre-treatment pH of approximately 4.5 to 5.5 su. During startup, 2 L of the influent MIW was titrated with the Mg(OH)2 solution to the target pH (approximately 5.5 su). The titration was conducted in the field using a 2 liter bottle and mechanical pipet. Increments of the Mg(OH)2 solution were added slowly over time, the solution stirred, and pH recorded until the target pH is reached. Following the titration, the solution was suspended and immediately poured into a 1 L Imhoff cone to measure the sludge volume production. The volume of sludge produced after a 1-hour settling was recorded, and the volume was scaled up to determine the approximate sludge volume that may be generated in the Mg(OH)2 pre-treatment during the course of the pilot-scale treatability study.
The metering pump, controlled by the timer switch, operated every 4 hours, starting 5 minutes before the head tank outlet timer provided the MIW batch to the pretreatment barrel. The titration test indicated that a target dose of 120 ml of Mg(OH)2 15:1 diluted stock solution was needed for every 9 L
0
Barker Hughesville Danny T Treatability Study Technical Memorandum 2-15

Section 2 • Study Methods and Sampling
batch of MIW. Since the minimum timer interval was one minute, the timer switch was initially set to operate the metering pump for 2 minutes at a flow rate of 60 ml/min. This set up delivered an approximate dose of 120 milliliters of solution for each 9 L batch of MIW. Changes to the Mg(OH)2 mixing and dosing operation were implemented later and are summarized in Section 2.2.4.2.
The influent MIW enters the pre-treatment barrel through a 1/2-inch bulkhead fitting installed in the center of the 55-gallon barrel lid. The Mg(OH)2 solution was fed into the barrel using 2.79 millimeter Tygon® tubing dripping into the 2-inch threaded opening in the barrel lid. Mixing of influent MIW and the Mg(OH)2 solution was implemented passively, using a cascading effect from the batch of MIW entering the barrel. An upward-facing 2-inch PVC pipe and elbow were suspended near the top of the tank to collect the Mg(OH)2 solution pumped prior to each MIW batch. The influent MIW was directed into the open-topped elbow causing a cascade of water to contact the Mg(OH)2 solution, creating a passive mixing process. The purpose of the open-topped 2-inch PVC pipe and elbow is to isolate the dose of Mg(OH)2 solution from contacting the remaining static water/sludge remaining in the tank in between each batch interval of MIW flow.
The pre-treatment barrel effluent assembly is shown in Exhibit 2-14. A 1/2-inch bulkhead fitting, piping, and timer valve were installed in the side of the barrel as the system effluent control. The bulkhead was 14 inches from the drum bottom to provide a sludge accumulation zone. PVC piping was attached to the bulkhead fitting, followed by a tee and sampling port, and then the outlet timer valve. The sampling port consists of a PVC tee and ball valve. The effluent timer valve was set to open 1 hour after the influent MIW entered the barrel to provide reaction and sludge settling time prior to discharge of the treated water to BCR 4. When the 9 liter batch of influent MIW enters the pre- treatment barrel, the water level in the barrel would rise and fall by this volume with each batch through the system. This maximum water elevation (with the 9 liter batch) was set in the field to be above the elevation of the BCR influent but high enough in the barrel to allow settling capacity of sludge. Following the timer valve, sufficient 1/2-inch braided PVC tubing was installed to reach the BCR barrel.
During operation, maintenance of the alkaline addition pre-treatment system was conducted. Maintenance activities and observations are provided in Section 2.2.4.2 below.
Chitorem Pre-Treatment A Chitorem pre-treatment system was installed in a 30-gallon barrel. The barrel was filled with approximately 17.5 gallons of substrate material. Chitorem is a proprietary material from JRW Bioremediation, LLC which contains 30 percent by weight calcium carbonate, 40 percent protein, and 20 percent chitin (processed crab shell). The Chitorem also contains its own bacteria and over time the material disintegrates into tiny particles that produce carbonates (adds alkalinity).
Exhibit 2-14. Mg(OH)2 pre-treatment effluent assembly.
Mg (OH)2
Barrel
Effluent sample port
Timer valve
Backup shutoff valve
Flow to BCR barrel
0
Barker Hughesville Danny T Treatability Study Technical Memorandum 2-16

Section 2 • Study Methods and Sampling
The Chitorem media was mixed with standard construction sand and pea gravel at a ratio of approximately 30 percent sand, 30 percent pea gravel, and 40 percent Chitorem by volume. The construction sand and pea gravel were purchased from a local hardware store. In addition, approximately 3.75 gallons of inert gravel was placed in the bottom of the barrel as the drainage layer. The mixture ratios are based on volume percent rather than mass percent during the bench-scale study. The volume percentages presented for the pilot-study are the same as the bench-scale mass percentages when converting using as-measured densities, except that gravel was substituted for one-half of the sand quantity to provide a greater porosity for the substrate. Percentages and volumes for the Chitorem pre-treatment are presented in Exhibit 2-16 below.
Standard dimensions for a plastic 30-gallon barrel used in the study are 18.6-inch inner diameter (ID) by 29.5 inches tall, with a total volume capacity of 32 gallons. However, the barrels have a beveled top and bottom, making the diameter slightly smaller at the top and bottom. Therefore, a direct correlation of barrel height to volume cannot be calculated across the entire barrel. Based on the ID along the center of the barrel, 17.5 gallons is equivalent to approximately 15 inches of substrate within the barrel. Including the bottom 3.75 gallons of inert gravel (approximately 3.4 inches), approximately 10.6 inches (10.8 gallons) remained available at the top of the barrel to provide a free water surface and headspace. Adequate headspace is necessary to allow room for the influent distribution gallery piping described below and to allow for additional free board for each batch of influent MIW.
MIW enters through a 1/2-inch bulkhead fitting installed in the barrel lid. The MIW influent flows through a pipe gallery to distribute flow across the substrate surface to limit preferential pathway formation and short-circuiting. The gallery consists of perforated 1/2-inch PVC pipe connected with a four-way cross in an X shape, with 3/32-inch to 1/4-inch holes drilled in the PVC pipe. Smaller holes were drilled closer to the inlet while larger holes were drilled near the outer ends of the pipe. No holes were drilled within the last 2 inches from the barrel wall. The intent of this method is to distribute MIW as evenly as possible across the barrel surface area.
The effluent pipe was installed through the side wall near the bottom of the Chitorem barrel. The effluent assembly is illustrated in Exhibit 2-15. An effluent pipe gallery similar to the influent pipe gallery was installed inside the barrel and embedded in the inert gravel drainage layer. The pipe gallery was connected to a 1/2-inch bulkhead fitting through the barrel side wall and connected to 1/2-inch PVC pipe and fittings. The effluent pipe array consists of a short run of PVC pipe, followed by an elbow, a backup shutoff ball valve (flow control valve for maintenance), Exhibit 2-15. Pre-treatment effluent assembly.
Effluent sample port
Backup shutoff valve
Flow to BCR barrel
Anti-siphon valve
Operational water
surface
0
Barker Hughesville Danny T Treatability Study Technical Memorandum 2-17

Section 2 • Study Methods and Sampling
and a vertical riser pipe that reaches the top of the operational water surface. This elevation was set at approximately 22 inches, which provides 7 inches of space for the influent MIW batch and space for the influent distribution gallery. This design provides a constant water surface elevation of about 3-4 inches above the substrate layer (at approximately 18 to 19 inches), ensuring that anaerobic and saturated conditions remain throughout the treatability study. At the 22 inch height, the vertical riser pipe has an elbow to route flow horizontally, followed by a sampling port (PVC tee and ball valve), an anti-siphon port (PVC tee and ball valve), and then converts to braided PVC hose connected to the BCR barrel influent. The anti-siphon valve remains open during treatment system operation. Without the anti-siphon valve, each barrel would drain itself through a siphon effect.
SAPS Pre-Treatment The SAPS pre-treatment system was the same as the Chitorem pre-treatment system, except the Chitorem substrate was replaced with the SAPS substrate mixture. The SAPS substrate consists of 0.75-inch to 1.5-inch size limestone gravel, overlain by a manure and compost layer. By volume percent, the manure/compost layer consists of approximately 25 percent of the volume (5.4 gallons), and the limestone consists of approximately 75 percent of the volume (13.1 gallons). The compost and manure mixture was split evenly based on volume (2.2 gallons for each material). In addition, approximately 3.75 gallons of inert gravel was placed on the bottom of the SAP reactor as the drainage layer. Percentages and volumes for the SAPS pre-treatment are presented in Exhibit 2-16 below.
2.2.2.4 BCR Barrels This section presents the substrate composition and BCR barrel construction.
Substrate Composition The BCR substrate percentages and the SAPS and Chitorem pre-treatment substrate percentages are provided in Exhibit 2-16. Based on the bench-scale study results, it was decided to utilize a similar BCR substrate composition, but without the use of hay. Previous research by Hiibel et al., 2008 and Reisman (personal communication 2013) have shown that hay is not as readily degradable as once thought, and may not be an effective component of the BCR woody substrate mixture. Based on this research and designer preference, hay was removed from the BCR mixture and replaced with increased limestone, manure, and wood chip/sawdust percentages.
Based on experience at other sites, it was decided to implement the design and mixing of the substrates using a volume percentage basis. Calculations performed for bench-scale studies relied on laboratory-measured density of materials, percent calculations by weight, and conversion to a volume. Because densities and porosities of different materials are widely variable, a weight basis design can lead to uncertainties in the planning and purchasing of required materials. Planning and implementing the BCR treatment on a volume basis allows for more accurate prediction of the actual material volumes required, and makes subsequent scaling to a larger treatment system much easier.
The key component of the BCR treatment is the substrate utilized as an electron donor for the SRB. Additionally, a suitable source of SRB must be present; often the bacteria are contained within the organic material to be used as a partial substrate (such as manure), but other sources (such as soils from the mine site) may provide SRB plus additional bacteria necessary for breakdown of organic materials (e.g., cellulosic degradation). A common mixture of substrates was selected based on literature research and CDM Smith’s experience with testing at other sites.
0
Barker Hughesville Danny T Treatability Study Technical Memorandum 2-18
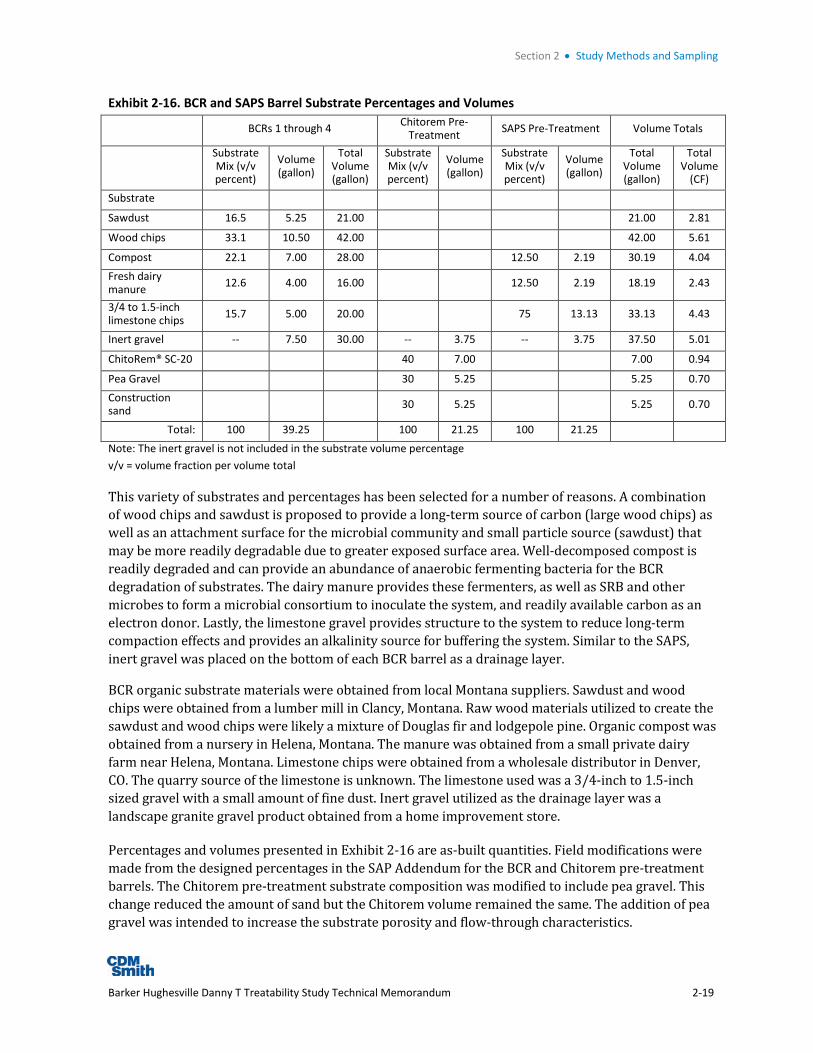
Section 2 • Study Methods and Sampling
Exhibit 2-16. BCR and SAPS Barrel Substrate Percentages and Volumes
BCRs 1 through 4 Chitorem Pre-
Treatment SAPS Pre-Treatment Volume Totals
Substrate Mix (v/v percent)
Volume (gallon)
Total Volume (gallon)
Substrate Mix (v/v percent)
Volume (gallon)
Substrate Mix (v/v percent)
Volume (gallon)
Total Volume (gallon)
Total Volume
(CF) Substrate
Sawdust 16.5 5.25 21.00
21.00 2.81
Wood chips 33.1 10.50 42.00
42.00 5.61
Compost 22.1 7.00 28.00
12.50 2.19 30.19 4.04 Fresh dairy manure 12.6 4.00 16.00
12.50 2.19 18.19 2.43
3/4 to 1.5-inch limestone chips 15.7 5.00 20.00
75 13.13 33.13 4.43
Inert gravel -- 7.50 30.00 -- 3.75 -- 3.75 37.50 5.01
ChitoRem® SC-20
40 7.00
7.00 0.94
Pea Gravel 30 5.25 5.25 0.70 Construction sand
30 5.25
5.25 0.70
Total: 100 39.25
100 21.25 100 21.25
Note: The inert gravel is not included in the substrate volume percentage v/v = volume fraction per volume total
This variety of substrates and percentages has been selected for a number of reasons. A combination of wood chips and sawdust is proposed to provide a long-term source of carbon (large wood chips) as well as an attachment surface for the microbial community and small particle source (sawdust) that may be more readily degradable due to greater exposed surface area. Well-decomposed compost is readily degraded and can provide an abundance of anaerobic fermenting bacteria for the BCR degradation of substrates. The dairy manure provides these fermenters, as well as SRB and other microbes to form a microbial consortium to inoculate the system, and readily available carbon as an electron donor. Lastly, the limestone gravel provides structure to the system to reduce long-term compaction effects and provides an alkalinity source for buffering the system. Similar to the SAPS, inert gravel was placed on the bottom of each BCR barrel as a drainage layer.
BCR organic substrate materials were obtained from local Montana suppliers. Sawdust and wood chips were obtained from a lumber mill in Clancy, Montana. Raw wood materials utilized to create the sawdust and wood chips were likely a mixture of Douglas fir and lodgepole pine. Organic compost was obtained from a nursery in Helena, Montana. The manure was obtained from a small private dairy farm near Helena, Montana. Limestone chips were obtained from a wholesale distributor in Denver, CO. The quarry source of the limestone is unknown. The limestone used was a 3/4-inch to 1.5-inch sized gravel with a small amount of fine dust. Inert gravel utilized as the drainage layer was a landscape granite gravel product obtained from a home improvement store.
Percentages and volumes presented in Exhibit 2-16 are as-built quantities. Field modifications were made from the designed percentages in the SAP Addendum for the BCR and Chitorem pre-treatment barrels. The Chitorem pre-treatment substrate composition was modified to include pea gravel. This change reduced the amount of sand but the Chitorem volume remained the same. The addition of pea gravel was intended to increase the substrate porosity and flow-through characteristics.
0
Barker Hughesville Danny T Treatability Study Technical Memorandum 2-19

Section 2 • Study Methods and Sampling
For the BCRs, a shortage of manure and limestone materials were available onsite for construction to meet the designed quantities in the SAP Addendum. Only 4 gallons of manure and 5 gallons of limestone were utilized for each BCR, rather than 7 gallons of each as originally designed. Due to the lack of manure, the compost quantity was increased from 5.25 gallons as designed to 7 gallons for each BCR. Wood chips and sawdust volumes remained the same. As a result, the total volume of reactive substrate was reduced from the 35 gallon design volume to 31.75 gallons.
Barrel Construction A photograph of the BCR barrels and effluent piping is shown in Exhibit 2-17. Nominal 55-gallon open top plastic barrels were utilized for the testing (57 gallon capacity). The BCR influent pipes were installed through the side of the barrels near the top using 1/2-inch bulkhead fittings. For BCR 1, a threaded fitting was installed on the outside of the bulkhead fitting and connected to the head tank timer valve (flow line 1). For BCR 2, 3 and 4, the influent pipes were connected to the pre-treatment barrel effluent assemblies using 1/2-inch braided PVC tubing. A threaded fitting was also installed on the inside of the bulkhead and connected to an influent pipe gallery. The galleries were constructed similar to the pre-treatment Chitorem and SAPS pipe galleries, except for being slightly larger to fit the larger barrels. A second difference was the BCR pipe gallery inlets entered through the side of the barrel rather than the through the lid. Although the BCR barrels are not likely completely airtight once closed, the threaded bung caps in the barrel lids were left slightly loose to provide venting of biogenic gases during operation of the treatment system.
The effluent opening is located at the bottom sidewall of each BCR barrel and was constructed using a 1/2-inch bulkhead fitting. An effluent water collection pipe gallery was installed similar to the influent
Exhibit 2-17. BCR barrels and effluent assemblies.
BCR barrel influent
Backup shutoff
valve
Anti-siphon valve
Upper effluent
sample port
Lower effluent
sample port
BCR barrel discharge
BCR 1 BCR 2 BCR 3 BCR 4 Operational
water surface
0
Barker Hughesville Danny T Treatability Study Technical Memorandum 2-20

Section 2 • Study Methods and Sampling
pipe gallery. The collection pipe gallery was connected to the bulkhead fitting via a threaded connection. The 55-gallon BCR barrels were filled with approximately 7.5 gallons of inert drainage gravel on the barrel bottom around the collection gallery piping, followed by approximately 31.75 gallons of reactive substrate.
The barrel effluent was routed through an effluent assembly constructed of PVC piping, fittings, and valves. The effluent assembly is illustrated in Exhibit 2-17 and consisted of a lower effluent sample port, a backup shutoff valve, an upper effluent sample port, an anti-siphon valve, and effluent discharge line. The lower effluent sample port was located at the bottom of the effluent assembly to collect samples that were sensitive to oxygen influence such as DO and ORP field parameters. Effluent water collected from this area of the barrel was always submerged and not affected by oxygen influx from the anti-siphon valve. Laboratory samples were also collected from the lower effluent sample port. Similar to the pre-treatment barrels, the top elevation of the vertical riser pipe determines the operational water surface. This elevation was set at approximately 27-inches, which provides 9-inches of space for the influent MIW batch and space for the influent distribution gallery.
The effluent discharge line converted to 1-inch HDPE pipe. Each of the four BCRs had the same effluent assemblies and all four discharge lines drain by gravity into a 4-inch corrugated HDPE pipe for discharge downgradient of the treatment system area.
2.2.2.5 Solar Power System The metering pump, slurry mixer, and timer switch were operated on low voltage using a solar power system to recharge the batteries. A photograph of the power equipment is shown in Exhibit 2-18. The pump, timer, clock and inverter were secured to a plywood board and placed in a plastic tool box. The toolbox was in turn screwed to a scaffold plank. Holes were drilled into the toolbox sides for ventilation, but the toolbox lid was left intact to keep precipitation out.
Two group 31 90 amp-hour 12-volt deep-cycle marine batteries in covered plastic battery boxes were located on the ground under the scaffold. The batteries were connected in parallel and charged from two 60 watt Dasol model DS-A18-60 solar panels. The solar panels were originally mounted on the scaffold platform roof. As discussed later in Section 2.2.4.2, Operation and Maintenance, the panels were later moved to a location that received more sun. The panels were wired to a Morningstar Sunsaver SS charge controller to regulate battery charging, and prevent overcharging. The charge controller was located in a water tight plastic storage bin on the ground next to the batteries to minimize system wiring. Besides regulating battery charging, the charge controller also had a dedicated circuit used to control the load relay, which in turn controlled the inverter, pump, mixer and timer. The load relay was purchased from an automotive supply store and was a general replacement single pole double throw 12-volt relay. Charge rate with full sun on the panels was measured at 6 amps using a clamp-on digital ammeter.
The metering pump operated on 12-volt direct current (DC) from the batteries. The pump was initially set at the maximum 300 revolutions per minute (rpm) to deliver 60 milliliters per minute of solution. The 12-volt DC Brazix waterproof timer switch was set to activate the metering pump every 4 hours for a period of 2 minutes to inject 120 milliliters of Mg(OH)2 solution into the alkaline pre-treatment barrel. Changes made to the pump setting and tubing type during pilot operation are described in Section 2.2.4.2, Operation and Maintenance.
0
Barker Hughesville Danny T Treatability Study Technical Memorandum 2-21

Section 2 • Study Methods and Sampling
The 0 to 2000 rpm motor on the Mg(OH)2 solution stock tank mixer required 120-volt 60 hertz alternating current (AC). The 12 volt DC battery voltage was converted to 120 volt AC using a 300 watt Morningstar Sure Sine 300 sine wave inverter. The AC inverter output was wired to a 120-volt cube tap where the mixer was plugged in. A digital alarm clock was also plugged into the cube tap. The digital clock was synchronized with the 12-volt DC timer switch readout and functioned as an elapsed time meter, which provided an inexpensive way to monitor the solar system performance.
As described above, the load relay was wired to the charge controller. If battery voltage dropped below 11.4 volts, the charge controller would open the load relay to disconnect the AC inverter, timer switch, and metering pump to protect the battery from damage. Draining a deep cycle battery below 50% capacity shortens the useful battery life. When the load relay opened, power to the clock would be disconnected, and the clock would no longer be in sync with the timer readout.
For example, if the panels did not receive enough sunshine during the day to replace the energy used during the night, battery voltage would gradually decrease, the load relay would open, and the pump and mixer system shut down. Once the sun came back up, the panels might recharge the batteries to normal operating voltage, the load relay would close, and the pump and mixer system would start again. Without the elapsed time meter there would be no way for the operator to know the system had been offline during the night.
2.2.2.6 Post-Treatment A post-treatment oxidation test was implemented during the study to evaluate if oxidation could reduce concentrations of BOD, ammonia, and sulfide. The test was conducted on BCR barrel effluent water during the last five sampling events. Only one of the four BCR effluents was selected for the test
Exhibit 2-18. Electrical power system.
Peristaltic pump
Timer switch
Alarm clock
AC converter
AC plug
0
Barker Hughesville Danny T Treatability Study Technical Memorandum 2-22

Section 2 • Study Methods and Sampling
for each sampling event. Additional sample volume was collected from the selected BCR barrel effluent on each event and the volume was split. One split of the sample volume was submitted for the standard laboratory analysis for effluent samples prescribed in the SAP addendum (CDM Smith 2013b). The other sample volume split was oxidized to test removal effectiveness for BOD, ammonia, and sulfide. Various methods were utilized to conduct the oxidation testing. For the first two sampling events, a more passive approach was implemented by bubbling air into the sample water for approximately two hours. For the third sampling event, the sample was added to a clean gallon jug and vigorously shaken for several minutes. For the last two sampling events, the sample was poured back and forth between two clean buckets at least 10 times. For the latter two methods, the sample was allowed to remain idle for at least an hour to provide settling of solids if present and then a laboratory sample was collected. In some cases, interim DO measurements were taken from the sample as the oxidation process was being implemented.
2.2.3 System Startup and Shutdown The manure provided was a mixture both wet and dry. In order to rewet and acclimate the manure, it was incubated overnight prior to mixing with other materials and loading into the barrels. The incubation consisted of first placing approximately 1/2-gallon of limestone fines each into two 5-gallon buckets and filling the buckets with approximately 4 to 5 gallons of Danny T adit water. The water was stirred several times and allowed to react for at least 2 hours. The pH of the water was tested and confirmed at approximately 5 to 6 su. Then the manure was split evenly into several 5-gallon buckets, and each bucket was filled with the partially neutralized adit water. This process was intended to condition the manure with consistent moisture and adapt the bacteria to the metals present in the mine water.
After the incubation period, the organic substrate and limestone materials were mixed using hand tools on a plastic tarp. Similar textured materials such as a manure and compost were mixed first, followed by mixing in sawdust, then wood chips, and lastly limestone. A rake and shovel were used to mix the materials. The tarp was also used to tumble the materials together with two people positioned on either side of the tarp. Each BCR mixture or pre-treatment mixture was completed in batches and the materials were loaded into the barrels. A photograph of mixing a BCR substrate batch is shown in Exhibit 2-19.
The sequence of loading the barrels consisted of the SAPS and Chitorem pre-treatments first, followed by the BCRs. When loading the material into the pre-treatment SAPS, Chitorem, and BCR barrel 1 (no pre-treatment), influent MIW was added as the material was placed in the barrels to aid in saturating the substrate. The substrate was mixed using a stick of PVC pipe during filling of MIW and substrate material. The substrate was added to BCR barrels 2 through 4 without saturating since these barrels were to receive pre-treated water only. MIW was added manually up to near the top of the pre-
Exhibit 2-19. Mixing of a batch of BCR substrate.
0
Barker Hughesville Danny T Treatability Study Technical Memorandum 2-23

Section 2 • Study Methods and Sampling
treatment SAPS and Chitorem barrels and the effluent valves to the BCR barrels were opened. This process allowed the MIW to drain through the pre-treatment barrels and into the BCR barrels. MIW was periodically added to the pre-treatment barrels to keep them near full and the substrate saturated. Both pre-treatment barrels were slow to drain at first, and the barrels were left full overnight. The following day, the sequential process of adding MIW into the pre-treatment barrels was continued until sufficient water was added to the BCR barrels up to the operational water surface.
For the alkaline addition pre-treatment, MIW was added to the pre-treatment barrel up to the operational water level at the effluent, followed by an additional volume adequate to fill BCR barrel 4. The additional volume was estimated based on the approximate porosity of the BCR substrate, plus additional water above the substrate surface. Based on the volume of water added to the barrel above the effluent level, the MIW was batch treated with the volume of Mg(OH)2 solution scaled up from titration testing. The barrel was periodically mixed with a piece of PVC pipe and tested with a pH meter to allow time for reaction and to ensure the target pH range was reached. The final pH of the pre-treatment batch was confirmed to be 5.5 su and then the effluent valve was opened to drain the water into BCR 4 after a period of settling.
Once the operational water surface was reached in all BCR barrels, approximately 8 ounces of soured whole milk was added to each BCR. The milk was added to provide a readily available liquid carbon source for SRB during incubation. Utilizing milk was not originally in the SAP addendum, but was later added based on past research.
The initial construction was completed on June 14, 2013. The first sample was collected on July 11 from each of the barrels and the influent, after four weeks of incubation. At this time, the system was not running with flow through due to malfunction of the timer valves. Therefore, the samples collected were representative of incubation water. The following week on July 16, timer valves were replaced and flow through operation commenced. Full operation of the alkaline addition system also commenced at this time. Sampling was conducted the following week on July 23 and continued bi-weekly (every other week) until September 16.
Shut down was delayed by the federal government budget issues and closure that began on October 1, 2013. Pilot shut down finally occurred on October 22nd. Pilot equipment was partially disassembled, the roof removed, and the treatment tanks winterized by draining until the water level just covered the media. Most of the connecting piping was removed to avoid freeze damage during the winter. The solar system was removed and placed in secure storage. Surprisingly, no freeze damage was observed despite several weeks of freezing weather prior to shut down.
2.2.4 Sampling and Maintenance Activities This section discusses the field sampling schedule, procedures, and locations, and system maintenance activities during operation.
2.2.4.1 Sampling Activities Water samples were collected from the Chitorem and SAPS pre-treatment barrel lower effluent sampling ports, from the alkaline addition drain valve, from the four BCR barrel lower effluent sampling ports, and from the influent MIW sampling port. Each of these 8 samples was collected bi-weekly throughout the testing period. A total of 6 sampling events were conducted from July 11 through September 16 consisting of 8 samples each, for a total of 48 normal samples. As noted above,
0
Barker Hughesville Danny T Treatability Study Technical Memorandum 2-24

Section 2 • Study Methods and Sampling
the July 11 sampling event was representative of incubation water inside the barrels, rather than flow through treatment water.
In addition to the BCR effluent sampling, the post-treatment oxidation test was conducted during five of the six sampling events (7/23, 8/7, 8/19, 9/4, and 9/16), as described in Section 2.2.2.6. Only one BCR effluent was subjected to the test during each sampling event. BCR2 was tested on 7/23, 8/19 and 9/16 while BCR3 was tested on 8/7 and 9/4. Post-treatment oxidation samples were submitted for laboratory analysis of BOD, ammonia, and sulfide.
During each sampling event, the system was inspected and maintenance conducted as necessary. Field parameters (pH, specific conductivity, temperature, ORP, and DO) were collected using a multi-parameter YSI meter. Laboratory samples for each of the 8 locations were analyzed for dissolved metals, acidity, alkalinity (total, bicarbonate, carbonate, and hydroxide), orthophosphate, anions (chloride, fluoride, and sulfate), and TDS. Due to funding limitations for analysis, total metals were only analyzed for the first and fifth sampling events. Filtration for dissolved metals analysis was conducted in the field using a 0.45 micron filter and peristaltic pump. Each BCR barrel effluent sample was also analyzed for sulfide, along with the post-treatment oxidation samples. BOD and ammonia were also analyzed for the post-treatment oxidation tests.
All laboratory analysis of pilot study water samples was conducted by Energy Laboratories in Helena, Montana. All samples were securely packaged and hand-delivered to the laboratory for analysis, following the procedures outlined in the SAP addendum (CDM Smith 2013b). Sample volumes were minimized to the extent possible because of the low treatment flow rates of the system. The minimal sample volumes required for analysis were as recommended by Energy Laboratories.
In addition to treatability study water samples, samples of the organic substrates and Chitorem material used in the barrels were collected and submitted for modified SPLP testing. Samples were submitted to Energy Laboratories. A total of four samples were submitted for SPLP analysis: wood chips, sawdust, compost, and Chitorem. Rock materials were not submitted for SPLP analysis.
2.2.4.2 Operations and Maintenance Pilot system operation was routinely checked every two weeks during each sample collection site visit. Routine operation checks included the following:
The elapsed time meter (digital alarm clock) readout was checked against the 12-volt timer readout to make sure the system had been in continuous operation since the last sampling event.
The charge controller indicator lights were observed to check for low battery voltage.
Solar panel output amperage was measured using a clamp-on digital ammeter.
Timer valve operation was observed to make sure the timing sequence had not changed.
Timer valve indicator lights were observed to check for low timer battery voltage.
The amount of Mg(OH)2 solution in the stock tank was observed as a measure of whether the dosing system had functioned properly.
0
Barker Hughesville Danny T Treatability Study Technical Memorandum 2-25

Section 2 • Study Methods and Sampling
The stock tank mixer was observed to check for proper mixing. The metering pump was started manually to test the Mg(OH)2 dosing system.
The metering pump tubing was replaced with new tubing and the flow calibrated.
During the August 7 site visit, the timer valve batteries were replaced. The removed batteries were checked with a volt-ohm meter and voltages were all at or above 1.5 volts.
Operational problems occurred during pilot operation that required non-routine procedures. These procedures included any action necessary to remedy the malfunctions. Non-routine procedures and general observations included the following:
A large amount of Mg(OH)2 solution was observed remaining in the stock tank during most routine biweekly site visits and the pump tubing was plugged. The amount remaining in the stock tank varied, but was clear evidence that the dosing system had not functioned correctly over the prior two weeks. Based on these observations, a bulk dose of solution was added during each site visit and some non-routine site visits as described below. This was typically accomplished by manually operating the metering pump for 22 minutes at 60 milliliters per minute, for a total dose of 1,320 ml. This dose was added to pre-treat the volume present in the barrel for each batch. This volume was estimated at 26 gallons based on the 22-inch barrel diameter and a water height of 16 inches.
On August 7, the 3.75-inch riser in head tank 3 was replaced with a 6-inch long riser. This reduced the head tank batch volume from 9 liters to 6 liters every 4 hours in an attempt to prevent the Chitorem pre-treatment barrel from overflowing. Flow was reduced to 25 ml/min on average. On previous routine site visits, it was evident that flow through the Chitorem pre-treatment barrel was restricted.
On August 7, the 12-volt batteries were showing low charge. Recent cloudy weather had reduced the available solar radiation. In addition, the solar panels were now being shaded by several large nearby trees for part of each day, reducing the charging capacity. After unsuccessfully attempting to recharge the batteries using a portable generator and two small battery chargers, the specific gravity of the electrolyte, measured with a hydrometer, was still very low. The solar power system was shut down, and both batteries removed and taken back to town for recharging.
On August 8, a non-routine site visit was made to re-install the batteries, decrease the Mg(OH)2 solution metering pump flow rate, and increase the dosing time. This change was made to reduce electrical power consumption. The system was put back in full operation and plans were made to move the solar panels to a new location to increase output. The inverter and mixer were wired to the 12-volt timer to operate only when the metering pump operated. The metering pump speed was reduced and the pump flow calibrated to 25 ml/min. The timer interval was increased to 5 minutes to obtain a 125 milliliter dose every 4 hours. Mixer speed was also increased to the maximum setting of 10 (2000 rpm). Field tests confirmed that at this higher speed, the mixer would quickly and fully re-suspend the settled Mg(OH)2 solution. The mixer change was done to reduce battery drain.
0
Barker Hughesville Danny T Treatability Study Technical Memorandum 2-26

Section 2 • Study Methods and Sampling
On August 14, a non-routine site visit was made. The solar panels were moved from the pilot scaffold roof to the historic load-out area on the mine waste dump, 200 feet uphill and closer to the adit. The batteries were left in place under the pilot scaffold, and 200 feet of 4/0 aluminum electrical cable was installed along the road edge to connect the panels to the pilot batteries. Charge rate was measured at 6 amps using a clamp-on digital ammeter.
In addition, on August 14, inert gas was bubbled backward through the Chitorem tank in an attempt to improve flow-through. The gas was a mix of 75% argon and 25% CO2. Gas was injected at a pressure of less than 10 pounds per square inch. When the gas hose was removed from the drain valve, no measureable flow was observed out of the barrel effluent.
In addition, on August 14, the peristaltic pump tubing was replaced. The peristaltic pump tubing was often plugged with solid Mg(OH)2 and the tubing section within the pump rollers collapsed. Potential causes included excessive pump speed, improper tubing selection, or the tendency of Mg(OH)2 to settle if not continuously mixed. The Tygon® tubing was replaced with 0.1-inch diameter PharMed®, a more robust tubing.
On August 19, the water level in the Chitorem pretreatment tank appeared normal.
On August 19, the head tank water levels were observed to be full prior to the inlet timer valve scheduled opening. This condition indicated that the timer valve was leaking and filling the head tanks continuously and ahead of schedule. The leakage rate was not determined, but if large enough, could potentially increase the head tank batch volume. The inlet timer valve was replaced with a spare.
During the September 4th routine site visit, the water level in the Chitorem pre-treatment tank was at the tank lip. Inert gas (75% argon and 25% CO2) at low pressure was bubbled backwards through tank while stirring the media with a short length of 1/2-inch PVC pipe. No improvement in flow was noted.
On September 4, the 3.75-inch risers in head tanks 1, 2 and 4 were all replaced with 6-inch risers to make all batch volumes equal at 6 liters every 4 hours.
On September 11, the field team travelled to the site to troubleshoot the lack of flow through the Chitorem media barrel. First, a small amount of the Chitorem substrate (Chitorem, sand, and gravel mixture) was removed and samples used to conduct a quick column test in a clear tapered plastic cone. For the first test, 1 part of substrate was mixed with 1 part fresh pea gravel, and the mixture was placed in the cone. The cone was filled with water but no flow was observed after five
Exhibit 2-20. Mixing of pea gravel with the original Chitorem substrate.
0
Barker Hughesville Danny T Treatability Study Technical Memorandum 2-27

Section 2 • Study Methods and Sampling
minutes. For the second test, 1 part substrate was mixed with 2 parts pea gravel, placed in the cone, and the cone was filled with water. Flow through the column was immediate. A mix of 1 part original substrate to 1.5 parts pea gravel was chosen as the replacement substrate for the pre-treatment Chitorem barrel. Seven gallons of original substrate were mixed with 10.5 gallons of pea gravel in a 40-gallon stock tank. The tank was flooded with inert gas (75% argon and 25% CO2) during mixing to reduce oxidation. The argon is heavier than air and would settle on the media in the tank. After placing the media back in the pretreatment barrel, the barrel was filled to operating level with MIW. When dosed from the head tank, flow was observed at the effluent sampling valve nearly immediately.
In addition September 11, tubing was replaced and a batch dose of Mg(OH)2 solution was added to the Mg(OH)2 barrel.
September 16 was the last routine site visit for sample collection.
During the week of September 30, a site visit was not possible due to early winter-like weather.
Due to the federal government shutdown beginning October 1, the final site visit was delayed until October 22.
October 22, the pilot was partially disassembled and winterized. Surprisingly, no freeze damage was observed despite several weeks of freezing weather.
0
Barker Hughesville Danny T Treatability Study Technical Memorandum 2-28

Section 3 Quality Assurance Summary This section describes the quality assurance and quality control aspects of the bench-scale and pilot-scale treatability study data. Deviations are presented and how or if they affected the achievement of the DQOs, a summary of field QC activities is presented, and a summary of the data evaluation is presented.
3.1 Bench-Scale Treatability Study 3.1.1 Deviations and Data Quality Objectives The bench-scale treatability study was conducted in accordance with the quality control (QC) requirements detailed in the SAP (CDM Smith 2013a). In addition, laboratory procedures conducted at the Denver Laboratory were conducted in accordance with the QA protocols outlined in the Laboratory Quality Assurance Plan for the CDM Smith Denver Treatability Laboratory (CDM Smith 2007). Laboratory and sampling procedures did not deviate from the requirements of these plans during the bench-scale treatability study, with the following exceptions:
As indicated in Section 2.1.2.1, TSS samples from the alkaline addition pre-treatment were not collected from the titration batches, rather, samples were collected from the larger pre-treatment batches using the same reagents and same endpoint pH.
As indicated in Section 2.1.3, an estimate of the time to free-drain the hydraulic columns could not be conducted due to restriction by the suction pressure in the columns.
A bottle blank of deionized water from the laboratory Milipore water system was not collected and analyzed. The water filtration system produces a deionized water with a resistivity of greater than 1 megaohm-centimeter. The filter is changed regularly in accordance with the manufacturers’ recommendations to assure high resistivity purified water.
Samples collected for offsite laboratory analysis for Steps 1 through 4 were analyzed by the Region 8 EPA ESAT laboratory in Denver, Colorado and by Energy Laboratories in Helena, Montana (for acidity only). All analytes for Step 5 (treated BCR effluent) samples were analyzed by Energy Laboratories. Only acidity, BOD, and sulfide were originally planned to be analyzed by Energy Laboratories; however, because of the need for a faster turnaround time to plan the pilot-scale treatability study, metals, alkalinity, and anions samples were also submitted to Energy Laboratories instead of Region 8 EPA ESAT.
These deviations listed above did not have an effect on the overall data quality or usability of the data generated. All DQOs developed for the investigation were met.
3.1.2 Field Quality Control Summary CDM Smith Denver Laboratory QC procedures were followed. The laboratory uses a Milli-DI® water filtration system to create high resistivity purified water. This laboratory grade water was utilized for making alkaline solutions for titrations, cleaning measurement probes (pH, conductivity, ORP, etc.), and cleaning and rinsing glassware, buckets, columns, and other instruments and containers.
Barker Hughesville Danny T Treatability Study Technical Memorandum 3-1

Section 3 • Quality Assurance Summary
Laboratory glassware and other miscellaneous items were cleaned after each use with tap water and Alconox® powdered detergent, and rinsed with the deionized water.
Titrations were conducted with a mechanical pipet and disposable pipet tips. All pipet tips were disposed after use. Alkaline solutions were made on a weight basis using a laboratory balance measureable up to one-thousandth of a gram. Liquid solutions were measured using volumetric flasks. All measurement probes were calibrated daily and notes were recorded in a laboratory log book. All samples were collected in certified clean containers obtained from the laboratory or from a supplier.
Field QC samples (i.e., field or matrix spike duplicates) were not collected during the bench-scale treatability study due to the lack of additional volume for each step in the treatability study process. Only limited test volumes were utilized and collected for analysis. This was done in accordance with the SAP (2013a)
3.1.3 Data Evaluation A data evaluation review was conducted on the bench-scale and the pilot study data. Data were evaluated on the precision, accuracy, representativeness, comparability, completeness, and sensitivity (PARCCS) criteria. Field duplicates were not collected during the bench scale testing because of limited sample volume. However, the laboratories performed matrix duplicate and matrix spike and spike duplicate analyses as required by the methods. A level 2A data evaluation was performed on all data as defined in the Guidance for Labeling Externally Validated Laboratory Analytical Data for Superfund Use, EPA January 13, 2009 (EPA 2009). Data were evaluated by checklist format provided in Attachment A. Based on the data evaluation review, all data are considered usable for their intended purpose. Laboratory data packages are provided in Appendix B.
3.2 Pilot-Scale Treatability Study 3.2.1 Deviations and Data Quality Objectives The pilot-scale treatability study was conducted in accordance with the QC requirements detailed in the SAP and SAP addendum (CDM Smith 2013a and b). Field and sampling procedures did not deviate from the requirements of these plans during the pilot-scale treatability study, with the following exceptions:
The Chitorem substrate composition was modified by adding pea gravel to the mixture to increase the permeability and flow-through characteristics of the substrate. This modification was made during construction of the treatment system based on work conducted at a concurrent treatability study at a different site.
The BCR substrate composition was modified due to a shortage of available manure and limestone onsite. Less limestone and manure were utilized in each BCR than designed. The compost quantity was increased to attempt to compensate for the lower manure quantities. The overall volume of reactive substrate also decreased slightly as a result of this deviation. In addition to the manure and limestone modification, soured whole milk was added to all BCRs to provide a readily available liquid carbon source for SRB during incubation.
Substrate composition was again modified near the end of the study for the Chitorem pre-treatment barrel due to the lack of flow through the barrel. Even though gravel was present in the mixture, the original composition was suspected to contain too high a fraction of sand and
Barker Hughesville Danny T Treatability Study Technical Memorandum 3-2

Section 3 • Quality Assurance Summary
Chitorem. Along with biofouling of the media, very low substrate permeability resulted in limited flow through the barrel. Substrate media was removed from the barrel and a fraction of the media mixture was re-mixed with fresh pea gravel to reduce the overall percentage of sand and Chitorem. Further description of the substrate change out was described in Section 2.3.4.3.
Minor modifications were made to the process flow design regarding head tanks, valve locations, and tubing/piping to accommodate field conditions and utilize materials that could be purchased at local hardware stores. These changes were implemented during system construction.
All effluent samples from the pre-treatment and BCR barrels were collected from the lower sampling ports rather than upper sampling ports as specified in the SAP. The lower sampling port was intended for sampling of redox sensitive field parameters, DO and ORP. The lower sampling port was utilized for all samples due to the slow flow rate and short amount of time that the team was onsite to collect samples.
On August 7, the head tank volume in treatment process 3 was decreased from 9 liters to 6 liters by replacing the 3.75-inch risers with 6-inch risers to attempt to keep the Chitorem pretreatment barrel from overflowing. On September 4, the 3.75-inch risers in head tanks 1, 2 and 4 were all replaced with 6-inch risers to make all batch volumes equal at 6 liters every four hours.
On September 4, the head tank volume in treatment processes 1, 2, and 4 were also decreased from 9 liters to 6 liters. This change was done to allow consistency with the Chitorem treatment process 3, and because there were signs of overloading to the BCRs in these systems, so flow rate was decreased.
The number of sampling events was changed from 9 to only 6, due to a later startup date, site inaccessibility from a snow storm event during September, and the federal government shutdown in October.
Total metals analysis were only conducted for samples collected during the first (7/11/13) and last (9/14/13) sampling events due to funding limitations for the project. Total metals sample frequency was reduced because the total metal fraction can be influenced by the presence particulates in the sample (e.g., metal precipitates, metals adsorbed to organic matter, etc.). The dissolved fraction is used to determine if the biogeochemical processes in the BCR are effective.
These deviations listed above did not have an effect on the overall data quality or usability of the data generated. DQOs developed for this investigation were met, with the exceptions described in the following paragraphs.
The overall lack of consistent flow through the Chitorem pre-treatment had an effect on achieving the study objectives related to pre-treatment effectiveness (Study Questions 2, 7, and 13) and evaluation of retention time (Study Question 14). Because flow through the Chitorem pre-treatment and subsequent BCR barrel (treatment process 3) was on average much less than the other treatment processes, a direct comparison of treatment effectiveness was difficult to discern. The average hydraulic retention time would be much higher for the treatment process 3 and could have resulted in better treatment effectiveness as a result of the increased contact time with the media.
Barker Hughesville Danny T Treatability Study Technical Memorandum 3-3

Section 3 • Quality Assurance Summary
Regarding the reduced number of sampling events and system operation schedule, this has some effect on achieving the study objectives related to seasonal weather and water quality influent changes (Study Questions 11 and 12) as these changes may not be evident in such a short season. In addition, the shorter operation schedule and smaller data set results in less information to develop conclusions regarding long-term treatment effectiveness.
Regarding changes to the BCR substrate mixture, the shortage of manure and limestone may have had a negative impact on treatment effectiveness in the BCRs. Sufficient limestone is needed to buffer the influent MIW acidity and sufficient manure is needed to provide SRB and soluble organics to initiate and sustain the sulfate reduction process. Additional compost was substituted to provide more soluble organic matter to replace the manure component. In addition, the overall decrease in reactive substrate volume has an effect on the planned hydraulic retention time. Since the flow rate initially implemented was as designed in the SAP Addendum but the substrate volume slightly decreased, the overall average retention time would have theoretically slightly decreased.
3.2.2 Field Quality Control Summary The YSI meter was calibrated during each sampling event. All field notes, field measurements, and other sampling observations were recorded in field log books. All samples were collected in certified clean containers obtained from the laboratory or from a supplier. Titrations for the Mg(OH)2 solution were completed using a mechanical pipet and disposable tip. Titrations were completed in certified clean containers or containers cleaned with Alconox® powdered detergent and grocery distilled water. Mg(OH)2 solutions were created using a graduated cylinder for measurements and with grocery distilled water.
Field QC samples consisted of field duplicates. One field duplicate was collected for each sampling event, for a total of six field duplicates. A field duplicate was collected from the influent MIW during the first sampling event, followed by duplicate collection from the various BCR effluents during the later sampling events. This meets the minimum 10 percent requirement for collection of field duplicates specified SAP.
3.2.3 Data Evaluation The same data evaluation approach was implemented for the pilot-scale study data as conducted for the bench-scale study data. A data evaluation checklist was prepared and is included in Appendix A. The only difference from the bench-scale data is that evaluation of PARCCS parameters was completed with respect to field duplicates. Based on the data evaluation review, all data are considered usable for its intended purpose. Laboratory data packages are provided in Appendix B.
Barker Hughesville Danny T Treatability Study Technical Memorandum 3-4

Section 4 Results, Analysis, and Discussion This section describes the results, analysis, and discussion of the treatability study data.
4.1 Bench-Scale Treatability Study Bench-scale treatability results are presented in the following sections. Table 4.1-1 presents all analytical laboratory and CDM Smith treatability laboratory measurement data (field data). Table 4.1-2 presents the MRE for all dissolved metals and percent removal for select wet chemistry parameters. Finally, Table 4.1-3 presents a comparison of metal treatability study results to state of Montana DEQ-7 acute and chronic ambient water quality standards and human health standards.
The removal efficiency calculations in Tables 4.1-2 were completed by carefully reviewing analytical results (either influent or effluent) near or at laboratory reporting limits. MRE for an analyte (see Tables 4.1-2) was not calculated if the raw water and treated water effluent analytical results were both less than 5 times their respective reporting limits, as comparing percentage results at levels that approach the reporting limit does not produce realistic comparisons. This is consistent with the EPA National Functional Guidelines for Inorganic Superfund Data Review, January 2010 (NFGs) description of duplicate comparisons. In addition, MRE for an analyte was not calculated when both results were below their detection limits (non-detect U flagged data) and/or reported at a concentration less than the reporting limit (J flagged data). Similarly, comparison of water quality to screening criteria (Tables 4.1-3) was not conducted if the sample results were flagged as non-detect (U qualifiers) and the criteria was lower than the detection limit.
Removal efficiency was also qualified with a greater than or less than sign where applicable. If the raw water was non-detect and the treated water effluent was detected at a concentration greater than the raw water reporting limit, then the removal efficiency was flagged as less than the value shown. If the treated water was non-detect and the raw water was detected at a concentration greater than the treated water reporting limit, then the removal efficiency was flagged as greater than the value shown.
4.1.1 Danny T Adit MIW Characteristics Water quality of the MIW prior to treatment in the bench-scale study is important to understand for the purpose of comparison to the final, treated water quality. This section describes the raw water quality of the MIW from the Danny T adit.
The comparison of the untreated adit water (sample 13BH-DT-BENCH-RAW) metals data to Montana DEQ-7 standards is included in Table 4.1-3. Using the hardness of the sample (324 mg/L as CaCO3), the following dissolved and total metals exceeded the acute aquatic life standard: Cd, Cu, and Zn. The following dissolved and total metals exceeded the chronic aquatic life standard: Cd, Cu, Fe, Pb, and Zn. Dissolved Al exceeded the acute and chronic aquatic life standards. The following dissolved and total metals exceeded the human health standard: Cd, Pb, and Zn. Total concentrations of As and thallium (Tl) exceeded the human health standard and total selenium (Se) exceeded the chronic aquatic standard.
Barker Hughesville Danny T Treatability Study Technical Memorandum 4-1

Section 4 • Results, Analysis, and Discussion
4.1.2 Effects of Oxidation The following subsections summarize the effects of oxidation on the MIW metals concentrations prior to other treatment methods.
CDM Smith Laboratory Parameters Oxidation had little to no effect on the pH as the value was 2.75 su pre-oxidation and 2.76 post-oxidation. Also, there was minimal effect on conductivity as it started at 1.722 mS/cm pre-oxidation and 1.697 mS/cm post-oxidation. At the start of the oxidation test, temperature was measured to be 7.67 °C. At the end of the two hours of oxidation, the temperature rose to 16.55 °C as a result of being allowed to sit outside of refrigeration.
Oxidation had an increasing effect on ORP as it started at 563 mV pre-oxidation and 601 mV post-oxidation. DO ranged from 10.77 mg/L pre-oxidation to 7.75 mg/L post-oxidation, resulting in a decrease of DO after oxidation. The decrease in DO concentration in mg/L observed may be a result of the increased temperature and percent saturation of DO should be accounted for. Based on tabulated values of saturation concentrations of DO in water at different temperatures, it is estimated that the DO saturation percentage at the initial and final temperatures was over 95 percent (Lindeburg 2003). Due to uncertainties to correct for temperature, salinity, and barometric pressure, as well as potential inaccuracies in the DO instrument itself, it appears that the adit water started at and remained at DO saturation for the duration of the test.
Metals Observations of dissolved and total metal trends (Table 4.1-1), MRE ranges (Table 4.1-2), and comparison to water quality standards (Table 4.1-3) of the oxidized MIW are presented below. Overall, limited metals were decreased as a result of oxidation. Some of the MRE ranges presented below are likely within the analytical accuracy and precision of the instruments used to analyze the samples.
Dissolved and total Al were minimally removed by oxidation with an efficiency of 1.9 and 0.8 percent, respectively. Dissolved Al concentrations exceeded the acute and chronic aquatic life standards. The human health standard was not exceeded.
Dissolved and total As concentrations did not exceed any standards. As was removed at an efficiency of 7.3 percent for dissolved concentrations and 43.4 percent for total concentrations. Total metal concentrations were greater than dissolved.
Dissolved Cd concentrations were removed with an efficiency of 2.1 percent; however total Cd concentrations increased by 1.5 percent. Both dissolved and total concentrations exceeded the acute and chronic aquatic life standards and the human health standard.
Dissolved cobalt (Co) concentrations increased after oxidation by 4.5 percent. The removal of total concentrations was very minimal at 0.4 percent. A standard for Co does not exist in Montana; however, this metal is included in the tables because concentrations are significant enough that removal trends can be observed in later portions of the bench-scale study.
Barker Hughesville Danny T Treatability Study Technical Memorandum 4-2

Section 4 • Results, Analysis, and Discussion
Dissolved and total Cu concentrations were removed by oxidation with an efficiency of 1.2 and 6.3 percent, respectively. Both dissolved and total concentrations exceeded the acute and chronic aquatic life standards.
Dissolved Fe concentrations increased after oxidation by 1.5 percent. The removal of total concentrations was minimal at 5.5 percent. Dissolved and total Fe concentrations exceeded the chronic aquatic life standard.
Dissolved and total Pb concentrations were removed by oxidation with an efficiency of 5.2 and 7.0 percent, respectively. Both dissolved and total concentrations exceeded the chronic aquatic life standard and the human health standard.
Dissolved manganese (Mn) concentrations increased after oxidation by 1.1 percent. The removal of total concentrations was very minimal at 0.3 percent. Mn does not have a DEQ-7 standard for comparison; however, Mn is a major metal contributing to influent acidity loading along with Al and Fe. Concentrations are significant enough that removal trends can be observed in some of the other portions of the bench-scale study.
Dissolved and total Ni increased after oxidation by 21.1 and 31.5 percent, respectively. No standards were exceeded.
Dissolved Tl was not detected in the effluent or the influent MIW. Total Tl concentrations decreased by 80.1 percent after oxidation; however, this concentration was still in exceedance of the low human health standard.
Dissolved Zn concentrations increased after oxidation by 2.3 percent. The removal of total concentrations was very minimal at 1.0 percent. Both dissolved and total concentrations significantly exceeded the acute and chronic aquatic life standards and the human health standard.
Other metals that were analyzed include antimony (Sb), barium (Ba), beryllium (Be), chromium (Cr), selenium (Se), silver (Ag), and vanadium (V). Concentrations for all of these were trace to non-detect, with the exception of selenium which exceeded the chronic aquatic life standard for both the dissolved and total concentration.
Wet Chemistry Parameters Acidity concentration of the oxidized MIW was 340 mg/L, a 10.5 percent decrease from the raw MIW. Sulfate concentration of the oxidized MIW was 841 mg/L, a 0.7 percent increase from the raw MIW. Alkalinity was not detected in the both the raw MIW and oxidized MIW. This is as expected for this type of acidic MIW.
Summary Post-oxidation, the oxidized sample actually showed a decrease in DO as measured in units of mg/L. However, by correcting for percent DO saturation at the different temperatures, DO actually remained at saturation for the duration of the test. Most metals resulted in low, single-digit percentages of removal efficiency that were likely within the analytical accuracy and precision of the analytical method. Only As had notable removal efficiencies (7.3 and 43.4 percent for dissolved and total, respectively). Some dissolved metals concentrations were higher than total concentrations, which
Barker Hughesville Danny T Treatability Study Technical Memorandum 4-3

Section 4 • Results, Analysis, and Discussion
again may be due to the accuracy/precision of the analytical method. Although under oxidizing conditions (high DO and positive ORP), the rate of iron precipitation may be increased, there were no visible precipitates that formed in the water after oxidation.
4.1.3 Effects of Increased pH The following subsections summarize the effects of pH on the MIW metals concentrations prior to other treatment methods.
4.1.3.1 Pre-Treatment Alkaline Addition Via Titration As discussed in Section 2.1.2.1, pre-treatment of raw MIW to a pH of 4.5 su was completed using three different alkaline materials. These materials consisted of a 25 percent by weight NaOH solution, a 10 percent by weight Ca(OH)2 solution, and Chitorem. It required 0.730 mL of NaOH to increase 1 L of raw MIW to reach an approximate pH of 4.5 su, and Figure 4.1-1 shows the titration curve used to determine the dosage. It required 2.125 mL of Ca(OH)2 to increase 1 L of raw MIW to an approximate pH of 4.5 su, and Figure 4.1-2 shows the titration curve used to determine the dosage. It required 1.8 g of Chitorem to increase 1 L of raw MIW to an approximate pH of 4.5 su, and Figure 4.1-3 shows the titration curve used to determine the dosage.
CDM Smith Laboratory Parameters The raw MIW was titrated to a pH of approximately 4.5 su for all three additives. The remaining laboratory parameters were not recorded for the titration test water samples. However, all laboratory parameters were measured for the alkaline addition NaOH and Ca(OH)2 pre-treatment batches created for use in the SAPS columns. These parameters are discussed in the paragraph below in comparison to the raw MIW. Laboratory parameters other than pH were not measured for Chitorem.
Conductivity increased from 1.722 mS/cm raw MIW to 2.557 mS/cm and 2.374 mS/cm for NaOH and Ca(OH)2 pre-treated water, respectively. Differences in temperature are the result of varying periods of refrigeration. Pre-treatment with alkaline addition had a decreasing effect on ORP as it started at 563 mV raw MIW and was reduced to 418 mV and 382 mV for NaOH and Ca(OH)2 pre-treated water, respectively. DO decreased from 10.77 mg/L raw MIW to 9.50 mg/L and 9.80 mg/L for NaOH and Ca(OH)2 pre-treated water, respectively.
Metals Observations of dissolved and total metal trends (Table 4.1-1), MRE ranges (Table 4.1-2), and comparison to water quality standards (Table 4.1-3) of the three pre-treated MIW samples with alkaline materials are as follows:
Dissolved Al was removed at an efficiency of between 13.3 and 40.2 percent for the three materials. The Chitorem removed the most dissolved Al. Total Al was removed with a range between 11.6 and 21.9 percent. Dissolved Al concentrations in all cases exceeded the acute and chronic aquatic life standards.
Dissolved and total As concentrations did not exceed any standards with the exception of the total As for the Chitorem sample, which exceeded the human health standard. Dissolved As was removed at an efficiency of 43.0 and 51.8 percent for NaOH and Ca(OH)2, respectively; however the Chitorem only removed dissolved As at a removal efficiency of 2.5 percent. Total As was removed at an efficiency of 78.3 and 78.7 percent for NaOH and Ca(OH)2, respectively; however
Barker Hughesville Danny T Treatability Study Technical Memorandum 4-4

Section 4 • Results, Analysis, and Discussion
the Chitorem only removed total As at a removal efficiency of 29.4 percent. This result may be skewed due to the natural presence of As in Chitorem, which would likely be removed from a system after a period of time.
Cd removal efficiencies were low or showed small increases. Dissolved Cd concentrations ranged from removal efficiencies of 8.5 percent to gains of 5.0 percent between the materials. Total Cd concentrations ranged from removal efficiencies of 3.0 percent to increases of 3.0 percent between the materials. Both dissolved and total concentrations in all cases exceeded the acute and chronic aquatic life standards and the human health standard.
Co removal efficiencies were low or showed small increases. Dissolved Co concentrations ranged from 7.9 percent to gains of 3.0 percent. Total Co concentrations ranged from removal efficiencies of 3.5 percent to gains of 2.7 percent.
Dissolved Cu was removed at an efficiency of between 4.7 and 6.8 percent for NaOH and Ca(OH)2, respectively; however the Chitorem removed dissolved Cu at an efficiency of 27.9 percent. Total Cu was removed at an efficiency of 5.6 and 6.1 percent for NaOH and Ca(OH)2, respectively; however the Chitorem removed total Cu at a removal efficiency of 22.3 percent. Both dissolved and total concentrations in all cases exceeded the acute and chronic aquatic life standards.
Dissolved Fe concentrations were non-detect and did not exceed any standards and were removed with an efficiency of greater than 99 percent. The removal of total Fe concentrations was 85.6 percent for NaOH, 74.6 percent for Ca(OH)2, and 50.5 percent for Chitorem.
The removal of dissolved Pb concentrations was 91.4 percent for NaOH, 78.8 percent for Ca(OH)2, and 98.3 percent for Chitorem. Total Pb was removed with efficiencies between 55.4 and 76.1 percent for the three materials. Total concentrations exceeded the chronic aquatic life standard and the human health standard for all three materials. Dissolved concentrations exceeded the human health standard for Ca(OH)2.
The dissolved Mn concentrations were removed at efficiencies between 1.2 and 3.4 percent Total Mn concentrations were removed at efficiencies between 1.6 and 2.1 percent for the three additive types.
The dissolved Ni concentrations showed gains of 20.2 percent for NaOH, 15.6 percent for Ca(OH)2, and 0.5 percent for Chitorem. Total Ni concentrations showed gains of between 11.2 and 37.6 percent for the three materials. No standards were exceeded in any case.
Dissolved Tl was not detected in the effluent or the influent. However, the detection level of Tl was 2.5 µg/L which is greater than the low human health standard. Total Tl concentrations were detected and exceeded the human health standard.
Zn removal efficiencies were low or showed small increases. Dissolved Zn concentrations ranged from removal efficiencies of 6.3 percent to gains of 0.5 percent between the three materials. Total Zn concentrations ranged from removal efficiencies of 5.1 percent to increases of 0.3 percent between the materials. Both dissolved and total concentrations significantly exceeded the acute and chronic aquatic life standards and the human health standard.
Barker Hughesville Danny T Treatability Study Technical Memorandum 4-5

Section 4 • Results, Analysis, and Discussion
Other metals that were analyzed include Sb, Ba, Be, Cr, Se, Ag, and V. Concentrations for all of these were trace to non-detect, with the exception of Se which exceeded the chronic aquatic life standard for the total concentrations of the three materials and the dissolved concentration of the NaOH sample.
Wet Chemistry Parameters Acidity concentrations were reduced by 31.6 percent for NaOH, 71.1 percent for Ca(OH)2, and 36.8 percent for Chitorem. Sulfate concentrations were reduced by 4.3 percent for NaOH, 3.8 percent for Ca(OH)2, and 0.7 percent for Chitorem. Alkalinity in the both the raw MIW and pre-treated MIW was non-detect.
Sludge Volume After addition of the alkaline solutions, the sludge volume produced was measured using an Imhoff cone settling test. After one hour, the NaOH treated MIW to pH 4.5 su produced 31 mL of sludge, the Ca(OH)2 treated MIW to pH 4.5 su produced 11.5 mL of sludge, and the Chitorem treated MIW to pH 4.5 su produced 5 mL of sludge. Based on this time, the settling rates were 0.52 mL/min for NaOH treated MIW to pH 4.5 su, 0.19 mL/min for Ca(OH)2 treated MIW to pH 4.5 su, and 0.08 mL/min for Chitorem treated MIW to pH 4.5 su.
After one hour, a considerable amount of larger precipitate flocs were still floating in the Ca(OH)2 test, compared to the NaOH test which had mostly visibly settled after 1 hour. Additional measurements were collected from the cone for the NaOH and Ca(OH)2 tests after additional settling time. After approximately 2.75 hours, the NaOH sludge had compacted to 25 ml and after 16.5 hours, the sludge had compacted to 18 ml. For the Ca(OH)2 test the sludge had compacted to 7 ml after 15 hours. Additional measurements for the Chitorem settling tests were not collected.
Summary For the samples with laboratory parameters other than just pH (NaOH and Ca(OH)2 pre-treated water), conductivity increased between 0.5 and 1.0 mS/cm. Because this has not passed through the any substrates yet, the increase in conductivity is most likely due to the increase in Na or Ca introduced into the samples from the pre-treatment solutions. As shown on Table 4.1-2, dissolved Na increased by approximately 1,400 percent and total Na increased by 2,000 percent in the NaOH pre-treated sample. Dissolved Ca increased by 97.7 percent and total Ca increased by 95.6 percent in the Ca(OH)2 pre-treated sample.
Pre-treatment of MIW to pH of 4.5 su worked effectively at removing concentrations of Fe and Pb. Dissolved Fe was non-detect for all three materials. Even with effective metal removals, total Pb concentrations still exceeded the chronic aquatic life standard as did the dissolved concentration from the Ca(OH)2 test. Al and As also had notable removal efficiencies, but Al still exceeded the acute and chronic aquatic life standards. Chitorem was more effective at removing Al than the other two pre-treatment options, but was less effective at removing As with the total concentration remaining above the human health standard. This is due to the natural occurrence of As in Chitorem. The remaining metals had low removal efficiencies or even some small increases metal concentrations. Chitorem typically performed the best of the three pre-treatment additives at removing metals.
Barker Hughesville Danny T Treatability Study Technical Memorandum 4-6

Section 4 • Results, Analysis, and Discussion
4.1.3.2 Conventional Alkaline Addition Via Titration Conventional treatment of raw MIW to a pH of 9.5 su was completed using a NaOH solution and Ca(OH)2 solution. It required 1.865 mL of NaOH to increase 1 L of raw MIW to reach an approximate pH of 9.5 su, and Figure 4.1-4 shows the titration curve used to determine the dosage. It required 3.650 mL of Ca(OH)2 to increase 1 L of raw MIW to reach an approximate pH of 9.5 su, and Figure 4.1-5 shows the titration curve used to determine the dosage.
CDM Smith Laboratory Parameters The raw MIW was titrated to a pH of approximately 9.5 su with the two alkaline materials before being sampled. The remaining laboratory parameters were not recorded on the titrated water samples.
Metals Observations of dissolved and total metal trends (Table 4.1-1), MRE ranges (Table 4.1-2), and comparison to water quality standards (Table 4.1-3) of the two conventionally treated MIW samples with alkaline materials are as follows:
Dissolved Al was removed at an efficiency of greater than 98 percent for both materials. Total Al was removed at an efficiency rate of 95.1 percent for NaOH and 98.1 percent for Ca(OH)2. Dissolved concentrations in the NaOH sample exceeded the chronic aquatic life standard. Note that the detection limit for Al (100 µg/L) is greater than the chronic aquatic life standard of 87 µg/L.
Dissolved and total As concentrations were non-detect in both cases (less than 2.5 µg/L). Dissolved As was removed at an efficiency of greater than 51.8 percent for both materials, and total As was removed at an efficiency of greater than 82.5 percent for both materials.
Dissolved Cd removal efficiencies were greater than 99 percent for both materials. Total Cd removal efficiencies were 96.6 percent for NaOH and 98.9 percent for Ca(OH)2. Total concentrations in both cases exceeded the chronic aquatic life standards. Note that the detection limit for Cd (0.5 µg/L) is greater than the acute and chronic aquatic life standards.
Dissolved and total Co was treated to below the detection limit of 0.5 µg/L in both cases. Removal efficiencies were greater than 98 percent in both cases for dissolved and total.
Dissolved Cu was removed at an efficiency of greater than 97.7 percent for NaOH and Ca(OH)2. Total Cu was removed at an efficiency of 95.0 and 97.6 percent for NaOH and Ca(OH)2, respectively. No standards were exceeded.
Dissolved Fe concentrations were non-detect and were removed with an efficiency of greater than 99.4 percent. Total Fe concentrations were non-detect for the Ca(OH)2 treated sample, but were 2,180 µg/L for the NaOH treated sample which exceeded the chronic aquatic life standard. The removal of total Fe concentrations was 97.4 percent for NaOH and greater than 99.4 percent for Ca(OH)2.
Dissolved Pb concentrations were non-detect and were removed with an efficiency of greater than 99.4 percent. No standards were exceeded. The removal of total Pb concentrations was 97.0 percent for NaOH and 99.3 percent for Ca(OH)2.
Barker Hughesville Danny T Treatability Study Technical Memorandum 4-7
Section 4 • Results, Analysis, and Discussion
The dissolved Mn concentrations were removed at an efficiency of 97.0 percent for NaOH and 96.6 percent for Ca(OH)2. Total Mn concentrations were removed at efficiencies of 93.7 percent for NaOH and 95.8 percent for Ca(OH)2.
The dissolved Ni concentrations were removed at an efficiency of greater than 88.5 percent for NaOH and 83.7 percent for Ca(OH)2. Total Ni concentrations were removed at efficiencies of greater than 83.7 percent.
Dissolved and total Tl concentrations were non-detect. However, the detection level of Tl was 2.5 µg/L, which is greater than the low human health standard.
Dissolved Zn concentrations were removed with an efficiency of greater than 99 percent. The removal of total Zn concentrations was 96.8 percent for NaOH and 99.3 percent for Ca(OH)2. No standards were exceeded for the Ca(OH)2 treated water. For the NaOH treated water, the dissolved concentration was non-detect, but the total concentration exceeded the acute and chronic aquatic life standards.
Other metals that were analyzed include Sb, Ba, Be, Cr, Se, Ag, and V. Concentrations for all of these were trace to non-detect.
Wet Chemistry Parameters Acidity concentrations were reduced by 97.9 percent for NaOH and 98.9 percent for Ca(OH)2. Sulfate concentrations were reduced by 0.7 percent for NaOH and 2.2 percent for Ca(OH)2. Alkalinity was non-detect in the raw MIW, but increased by 266 percent in the NaOH treated sample and 182 percent in the Ca(OH)2 sample.
Sludge Volume After addition of the alkaline solutions, the sludge volume produced was measured using an Imhoff cone settling test. After one hour, the NaOH treated MIW to pH 9.5 produced 95 mL of sludge and the Ca(OH)2 treated MIW to pH 9.5 produced 35 mL of sludge. Based on this time, the settling rates were 1.58 mL/min for NaOH treated MIW to pH 9.5 su and 0.58 mL/min for Ca(OH)2 treated MIW to pH 9.5 su.
Summary Conventional treatment of MIW to pH of 9.5 su sufficiently removed (greater than 90 percent) concentrations of Al, Cd, Co, Cu, Fe, Pb, Mn, and Zn. Ni was removed at efficiencies above 80 percent. The only dissolved metal which exceeded a standard was Al in the NaOH treated water which exceeded the chronic aquatic life standard. The Al and Tl reporting limits were above the some or all of the standards.
4.1.4 Hydraulic Testing of Substrates The approximate porosity of the SAPS substrate was measured utilizing columns filled with two different volumes of substrate materials. The columns each had a diameter of 1.5 inches. Column A was 10 inches long and Column B was 15 inches long. They were then filled with known quantities of substrate material which are shown in Exhibit 4-2. The Chitorem substrate was not tested.
After the columns were prepared, the columns were saturated at first using gravity feed, but as discussed in Section 2.1.3, there was too much suction pressure within the columns. Raw MIW was
Barker Hughesville Danny T Treatability Study Technical Memorandum 4-8

Section 4 • Results, Analysis, and Discussion
Exhibit 4-2. Substrate Quantities
Parameter Column A Column B
Limestone (kg) 0.19 0.39
Manure (g) 17.5 17.5
Compost (g) 29.0 29.0
Limestone Thickness (in) 4.6 9.4
Manure/Compost Mix Thickness (in) 1.6 2.5
Total Thickness (in) 6.2 11.9 Note: Limestone was measured on a scale which read to the nearest hundredth of a kilogram. Manure and compost were measured on a more precise scale.
then pumped into the columns using a peristaltic pump and water was recirculated until the column became fully saturated. The amount of water was measured in a beaker before adding to the column and then the effluent was measured after saturation. From this, the volume of the void (VV) can be measured as shown in Exhibit 4-3.
Exhibit 4-3. Volume of the Void
Parameter Column A Column B
Initial Volume (mL) 250 500
Final Volume (mL) 162 340
Volume of the Void (mL) 88 160
During water addition, the finer compost and manure fractions had migrated into the limestone voids. This led to an overall loss in fines of the compost/manure layer. The limestone also further compacted during water addition. The volume of the void represents the volume after compaction of the materials from the addition of the water. The saturated thicknesses of each column were re-measured after compaction, and the results were total thicknesses for Column A of 5.625 in and Column B of 10.75 in. The total volume (VT) of the columns can be calculated using the following equation:
𝑉𝑇 = 𝜋𝑟2 ∗ 𝐿 ∗ 16.39
Where: r = radius of the column, in L = total thickness of column, in 16.39 = conversion factor from in3 to mL
The porosity of the columns can then be determined using the following equation:
𝑛 =𝑉𝑉𝑉𝑇∗ 100
Where: n = porosity, percent VV = volume of void, mL VT = total volume, mL
Barker Hughesville Danny T Treatability Study Technical Memorandum 4-9
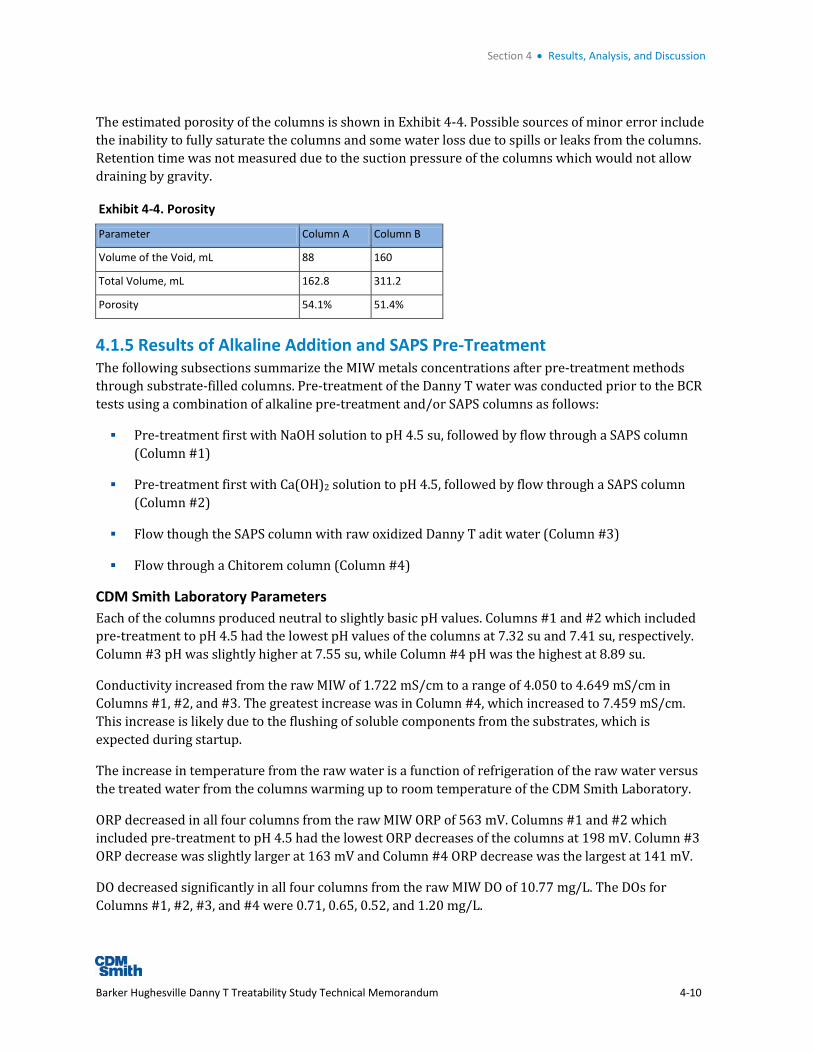
Section 4 • Results, Analysis, and Discussion
The estimated porosity of the columns is shown in Exhibit 4-4. Possible sources of minor error include the inability to fully saturate the columns and some water loss due to spills or leaks from the columns. Retention time was not measured due to the suction pressure of the columns which would not allow draining by gravity.
Exhibit 4-4. Porosity
Parameter Column A Column B
Volume of the Void, mL 88 160
Total Volume, mL 162.8 311.2
Porosity 54.1% 51.4%
4.1.5 Results of Alkaline Addition and SAPS Pre-Treatment The following subsections summarize the MIW metals concentrations after pre-treatment methods through substrate-filled columns. Pre-treatment of the Danny T water was conducted prior to the BCR tests using a combination of alkaline pre-treatment and/or SAPS columns as follows:
Pre-treatment first with NaOH solution to pH 4.5 su, followed by flow through a SAPS column (Column #1)
Pre-treatment first with Ca(OH)2 solution to pH 4.5, followed by flow through a SAPS column (Column #2)
Flow though the SAPS column with raw oxidized Danny T adit water (Column #3)
Flow through a Chitorem column (Column #4)
CDM Smith Laboratory Parameters Each of the columns produced neutral to slightly basic pH values. Columns #1 and #2 which included pre-treatment to pH 4.5 had the lowest pH values of the columns at 7.32 su and 7.41 su, respectively. Column #3 pH was slightly higher at 7.55 su, while Column #4 pH was the highest at 8.89 su.
Conductivity increased from the raw MIW of 1.722 mS/cm to a range of 4.050 to 4.649 mS/cm in Columns #1, #2, and #3. The greatest increase was in Column #4, which increased to 7.459 mS/cm. This increase is likely due to the flushing of soluble components from the substrates, which is expected during startup.
The increase in temperature from the raw water is a function of refrigeration of the raw water versus the treated water from the columns warming up to room temperature of the CDM Smith Laboratory.
ORP decreased in all four columns from the raw MIW ORP of 563 mV. Columns #1 and #2 which included pre-treatment to pH 4.5 had the lowest ORP decreases of the columns at 198 mV. Column #3 ORP decrease was slightly larger at 163 mV and Column #4 ORP decrease was the largest at 141 mV.
DO decreased significantly in all four columns from the raw MIW DO of 10.77 mg/L. The DOs for Columns #1, #2, #3, and #4 were 0.71, 0.65, 0.52, and 1.20 mg/L.
Barker Hughesville Danny T Treatability Study Technical Memorandum 4-10

Section 4 • Results, Analysis, and Discussion
Metals Observations of dissolved and total metal trends (Table 4.1-1), MRE ranges (Table 4.1-2), and comparison to water quality standards (Table 4.1-3) of the four pre-treatment column effluents are as follows:
Dissolved Al was removed at an efficiency of greater than 96.9 percent in all four columns to non-detect concentrations (200 µg/L). Total Al was removed at an efficiency rate between 92.5 and 93.6 percent for Columns #1, #2, and #3, and Column #4 removal efficiency was greater than 96.9 percent (to non-detect). Note that the laboratory Al detection limit (200 µg/L) was greater than the chronic aquatic life standard (87 µg/L).
As concentrations increased from the raw MIW concentrations of 5.19 J µg/L for dissolved and 14.3 µg/L for total. Columns #1, #2, and #3 had dissolved and total concentrations between 23.8 and 35 µg/L, but Column #4 had a dissolved concentration of 127 µg/L and a total concentration of 104 µg/L. Dissolved and total As concentrations were in exceedance of the human health standard in all four columns. Removal efficiencies were not calculated for Columns #1, #2, and #3 because both the raw water and treated water effluent had results that were less than 5 times their respective reporting limits. In Column #4, dissolved As increased by 2,347 percent and total As increased by 627.3 percent. As described previously, these high As values are a result of leaching from the Chitorem substrate.
Dissolved and total Cd removal efficiencies were greater than 99 percent for Columns #1, #2, and #3. Dissolved and total Cd removal efficiencies in Column #4 were 98.3 and 98.2 percent, respectively. Both dissolved and total concentrations in Column #4 exceeded the chronic aquatic life standard. Columns #1, #2, and #3 were non-detect, but the detection limit of 1.0 µg/L is greater than chronic aquatic life standard.
Dissolved Co decreased to concentrations between 5.4 µg/L and non-detect (less than 1.0 µg/L) and removal efficiencies from 79.6 to greater than 96.2 percent. Total Co decreased to concentrations between 5.72 µg/L and non-detect and removal efficiencies from 77.6 to greater than 96.1 percent. The removal effectiveness of Co followed the column numbers (i.e., Column #1 was least effective and Column #4 was the most effective).
Dissolved Cu was removed at an efficiency of 91.8, 93.8, 91.6, and 81.3 percent for Columns #1, #2, #3, and #4, respectively. Total Cu was removed at an efficiency of 88.1, 88.8, 84.8, and 88.3 percent for Columns #1, #2, #3, and #4, respectively. Concentrations exceeded the chronic aquatic life standard except for the dissolved concentration in Column #2. The total concentration in Column #3 and the dissolved concentration in Column #4 also exceeded the acute aquatic life standard.
Dissolved and total Fe concentrations were non-detect (1,000 µg/L) and were removed with an efficiency of greater than 98.0 percent. Note that the Fe detection limit is equal to the chronic aquatic life standard (1,000 µg/L).
Dissolved and total Pb concentrations were trace to non-detect (less than 1.0 µg/L) and did not exceed any standards. Dissolved and total Pb concentrations were removed with an efficiency of greater than 95.0 percent.
Barker Hughesville Danny T Treatability Study Technical Memorandum 4-11

Section 4 • Results, Analysis, and Discussion
Dissolved Mn was removed at an efficiency of 91.9, 80.2, 85.3, and 99.98 percent for Columns #1, #2, #3, and #4, respectively. Total Cu was removed at an efficiency of 91.8, 80.0, 85.5, and greater than 99.9 percent for Columns #1, #2, #3, and #4, respectively. Column #4 was reduced to non-detect (less than 20 µg/L) for both the total and dissolved concentrations.
Dissolved and total Ni concentrations did not exceed any standards. Removal efficiencies were not calculated because both the raw water and treated water effluent had results that were less than 5 times their respective reporting limits.
Dissolved Tl was not detected in the effluent or the influent. Total Tl was also not detected, however, the RL of 5.0 µg/L is greater than the low human health standard.
Dissolved and total Zn concentrations were removed with an efficiency of greater than 99.0 percent. No standards were exceeded.
Other metals that were analyzed include Sb, Ba, Be, Cr, Se, Ag, and V. Concentrations for all of these were trace to non-detect.
Wet Chemistry Parameters Acidity concentrations were reduced by greater than 98.9 percent for all four columns to non-detect concentrations (less than 4 mg/L). Sulfate concentrations were reduced by 3.2, 5.0, 4.1, and 6.9 percent for Columns #1, #2, #3, and #4, respectively. Alkalinity was non-detect in the raw MIW, but increased by 4,180, 3,820, 4,600, and 11,380 percent for Columns #1, #2, #3, and #4, respectively.
Summary The pH values of the columns were neutral to slightly basic. The effluent conductivity of the columns increased between two and three times the raw MIW due to flushing of soluble components of the substrates. DO decreased to approximately 1 mg/L or below in the column effluents.
Results of MRE using the four pre-treatment columns sufficiently removed (greater than 90 percent) concentrations of Al, Fe, Pb, and Zn. Of these metals, only Al had concentrations which exceeded a standard, the chronic aquatic life standard. Overall, there was no apparent improvement in metal removal between the SAPS with alkaline addition pre-treatments (Columns #1 and #2) and the SAPS alone (Column #3). Column #4 had some improvement in metal removal such as Al and Zn, but less efficient at removal of Cd and Cu. Columns #1, #2, and #3 removed dissolved Cd to non-detect concentrations, however Column #4 had detected concentrations that exceeded the chronic standard. Columns #1, #2, and #3 sufficiently removed dissolved Cu concentrations but total concentrations were just below 90 percent. Column #4 dissolved and total Cu concentrations MREs were in the 80 percent range. As concentrations in each of the column effluents increased from the raw MIW sample and exceeded the human health standard, with the greatest increase in the Column #4 (Chitorem). These results indicate that the As was naturally occurring in the various substrate materials. For Column #4, the Chitorem was produced from benthic marine animals most likely exposed to arsenic-laden waters and sediment. Other metals were removed to concentrations below water quality standards or at detection levels.
The acidity was sufficiently removed, and slight increases in sulfate were detected. Because sulfate reduction has not occurred in this short period, it is likely that removal of metals occurred as a result of sorption and oxy-hydroxide and/or carbonate precipitation reactions within the substrate media.
Barker Hughesville Danny T Treatability Study Technical Memorandum 4-12

Section 4 • Results, Analysis, and Discussion
Had the study been continued for a longer period, removal of these metals is not suspected to be maintained because the organic substrate sorption sites become saturated. Each column had an increase in alkalinity, with the greatest from Column #4. Since the alkaline addition pre-treatment steps did not produce alkalinity, all of the measured alkalinity in these samples resulted from the column substrates.
4.1.6 Results of Biochemical Reactor Testing The following subsections summarize the MIW metals concentrations after 6 weeks of incubation in the BCRs for each of the columns.
CDM Smith Laboratory Parameters The pH of the MIW in the BCRs decreased to around 5.0 su from the pre-treatment columns. Specifically, the pH values were 4.95, 4.93, 4.99, and 5.13 su for BCR #1, #2, #3, and #4, respectively.
The conductivity increased from the pre-treatment columns to between 5.62 and 6.23 mS/cm for BCRs #1, #2, and #3 and to 7.63 mS/cm in Column #4. The increases are likely due to the increase of soluble components from the substrates within the BCRs.
The increase in temperature from the raw water is a function of refrigeration and room temperature in the CDM Smith Laboratory.
ORP was negative in all four BCRs. The ORPs were -13.8, -35.9, -35.0, and -55.1 mV for BCRs #1, #2, #3, and #4, respectively.
The lower detectable DO test kits were not used, but from the upper range test kits, it is known that all four BCRs had DO less than 1.0 mg/L.
Alkalinity and sulfide kits were also utilized during the BCR sample collections. The alkalinity was 4,250, 4,250, 4,080, and 5,610 mg/L for BCRs #1, #2, #3, and #4, respectively. The sulfide was 0.26, 0.32, 0.26, and 0.28 mg/L for BCRs #1, #2, #3, and #4, respectively.
Metals Figures 4.1-6a and -6b, 4.1-7a and -7b, 4.1-8a and -8b, and 4.1-9a and -9b show the dissolved metals concentrations progression from the raw MIW through incubation within the BCR. Total metals were not analyzed from the BCRs. The “a” series of figures show results for As, Cd, Co, Cu, Pb, Ni, and Tl. The “b” series of figures show results for Al, Fe, Mn, and Zn. The raw water (RAW) sample was discussed in Section 4.1.1, the pre-treated to pH 4.5 samples (PH45) were discussed in Section 4.1.3, and the pre-treatment/SAPS column (SPS/CHI) samples were discussed in Section 4.1.5. The BCR (BCR) sample observations of dissolved and total metal trends (Table 4.1-1), MRE ranges (Table 4.1-2), and comparison to water quality standards (Table 4.1-3) of the four Columns’ BCR effluent are as follows:
There was either a slight increase or no change in the dissolved Al concentrations from the pre-treatments to the BCRs, although the pre-treatment columns were all non-detect so the full increase is unknown. This conclusion is shown on the “b” series of Figures 4.1-6 through 4.1-9. Dissolved concentrations in all four columns exceeded the chronic aquatic life standard. Some leaching of Al from the substrates could have occurred.
Barker Hughesville Danny T Treatability Study Technical Memorandum 4-13
Section 4 • Results, Analysis, and Discussion
As concentrations decreased from the pre-treatment column samples but still show an increase from the raw MIW as shown on the “a” series of Figures 4.1-6 through 4.1-9. The dissolved As concentrations were in exceedance of the human health standard for BCRs #1 and #4, and only 1 µg/L below that standard in BCRs #2 and #3.
Dissolved Cd remained non-detect (less than 1.0 µg/L) for BCRs #1, #2, and #3. For BCR #4, the Cd concentration from Column #3 was removed to non-detect for BCR #4.
Dissolved Co concentrations increased to between 16.0 and 19.0 µg/L. Since very little suspended Co was measured in the effluent from the columns, the increase in Co is a result of substrate leaching.
Dissolved Cu concentrations decreased to between 15.0 and 23.0 µg/L. No standards were exceeded.
Dissolved Fe concentrations increased in the BCRs by at least an order of magnitude to between 12,600 and 14,400 µg/L, although the pre-treatment/SAPS columns were all non-detect so the full increase is unknown. All four BCR samples exceeded the chronic aquatic life standard for dissolved Fe. Given dissolved and total Fe were removed to non-detect in the pre-treatment columns, the observed increase in Fe is a result of substrate leaching.
Dissolved Pb concentrations were trace (2.0 and 3.0 µg/L) and did not exceed any standards. These results are similar to the pre-treatment columns, which indicate that the BCRs did not polish the remaining dissolved Pb concentrations remaining after leaving the columns. The slight differences between the pre-treatment effluent and BCRs are most likely within the analytical accuracy and precision of the instruments used to analyze the samples.
Dissolved Mn concentrations increased to between 4,940 and 19,200 µg/L. The largest increase was in BCR #4 which went from non-detect to 4,490 µg/L. Given the dissolved and total concentrations were nearly identical in the pre-treatment/SAPS columns (very little suspended solids), the observed increase in Mn is a result of substrate leaching.
Dissolved Ni concentrations increased to between 67 and 78 µg/L but did not exceed any standards. Given the dissolved and total concentrations were nearly identical in the pre-treatment/SAPS columns (very little suspended solids), the observed increase in Ni is a result of substrate leaching.
Dissolved Tl concentrations were non-detect, as in the raw MIW. However, the Tl detection level of 5.0 µg/L is greater than the low human health standard.
Dissolved Zn concentrations increased to between 450 and 470 µg/L. All results exceeded the acute and chronic aquatic life standards. Given that dissolved Zn was removed with an efficiency of greater than 99.0 percent and both total and dissolved concentrations were similar, the observed increase in Zn is a result of substrate leaching.
Other metals that were analyzed include Ba, Be, Cr, Se, and Ag. Concentrations for all of these were trace to non-detect, with the exception of Ba which exceeded the human health standard for the dissolved concentration. Because Ba was non-detect in all previous steps, the observed increase in Ba is a result of substrate leaching.
Barker Hughesville Danny T Treatability Study Technical Memorandum 4-14

Section 4 • Results, Analysis, and Discussion
Wet Chemistry Parameters Acidity concentrations greatly increased from below the detection limit of 4.0 mg/L in the pre-treatment column effluents to within the range of 550 and 1,200 mg/L in the BCR containers. The increase in acidity may be due to acidity released from the substrates. Sulfate concentrations increased in each of the four BCRs to within the range of 950 to 1,000 mg/L. This is an approximate increase of between 150 to 250 mg/L sulfate from the pre-treatment column effluents. Alkalinity increased by an order of magnitude in each of the BCRs from the pre-treatments. Sulfide was measured for the BCRs at Energy Laboratories at concentrations of 13, 3, 11, and 8 mg/L for BCRs #1, #2, #3, and #4, respectively. The increase in alkalinity and detectable sulfide indicate that some small amount of sulfate reduction may have occurred at some point in the BCR containers.
Summary The pH of the MIW in the BCRs decreased to around a pH of 5.0 su which is below the target pH of 6.5 to 9.0 su for effective treatment. Although ORP was negative in all four BCRs, ORPs low enough to have sustained sulfate reduction were not measured. The target DO of less than 2 mg/L was achieved as DO decreased to around 1 mg/L and below in the BCRs.
Al, Cd, Pb, and Tl saw little to no change in the dissolved concentrations from the pre-treatment columns to the BCRs because they were already removed in the columns. As, Ba Co, Fe, Mn, Ni, and Zn dissolved concentrations increased from the column effluents, which suggests leaching from the substrates. Only Cu saw additional polishing of metal concentrations as a result of the BCRs. Both Al and Fe exceeded the chronic aquatic life standard in each BCR. Zn exceeded both the acute and chronic aquatic life standards in all four BCRs, and As exceeded the human health standard in BCR #1 and #4.
Sulfate and acidity concentrations increased after treatment within the BCRs. These observations suggest that both sulfate and acidity were leached from the BCR substrates. Some sulfate reduction may have occurred because of the increase in total alkalinity and detected sulfide; however, any decrease in sulfate as a result of sulfate reduction was not observed as a result of the leaching from the substrates.
4.2 Pilot-Scale Treatability Study Pilot-scale treatability results are presented in the following sections. Table 4.2-1 presents all analytical laboratory results for the pilot-scale study, including field duplicate samples. Table 4.2-2 presents all field measurement data. Table 4.2-3 presents the MRE for all dissolved metals and percent removal for select wet chemistry parameters. Finally, Table 4.2-4 presents a comparison of results to DEQ-7 aquatic water quality criteria. Tables 4.2-5 and 4.2-6 present the oxidation test data and SPLP data, respectively.
The MRE calculations in Table 4.2-3 considered analytical results (either influent or effluent) near or at laboratory reporting limits. MRE for a metal was not calculated if the raw water and treated water effluent results were both non-detect (U flagged data). Similarly, comparison of water quality to screening criteria in Table 4.2-4 was not conducted if the sample results were non-detect (U flagged). Reporting limits provided by Energy for the pilot-scale data set were consistently the same throughout the study period and estimated data (J flagged) below the reporting limits were not provided. As a result, MRE calculations were not subject to same limitations as with the bench-scale data set (see introduction to Section 4.1). As shown on Table 4.2-4 MRE calculations are qualified by a
Barker Hughesville Danny T Treatability Study Technical Memorandum 4-15
Section 4 • Results, Analysis, and Discussion
less than or greater than sign if applicable. If the raw water is non-detect and the treated water effluent is greater than the reporting limit, then the MRE is less than the percent shown. In contrast, if the treated water effluent is non-detect and the raw water is greater than the reporting limit, then the MRE is greater than the percent shown.
Pilot-scale data from the system influent, pre-treatment effluents, and BCR barrel effluents are also presented in a series of figures to aid in data analysis and discussion. Figures 4.2-1 through 4.2-3 present time-based charts of pH, ORP, and DO results, respectively. Figures 4.2-4 through 4.2-15 present time-based charts of dissolved Al, As, Ba, Cd, Co, Cu, Fe, Pb, Mn, Ni, Tl, and Zn, respectively. Figures 4.2-16 through 4.2-19 present time-based charts of sulfate, sulfide, acidity, and total alkalinity, respectively.
4.2.1 Danny T Adit MIW Influent The following subsections summarize the MIW influent water quality.
Field Parameters As shown in Table 4.2-2 and Figure 4.2-1, influent MIW water remained relatively consistent even into the later summer in September. The pH ranged from 2.72 to 2.94 su throughout the pilot-scale study period. Conductivity of the influent MIW ranged from 1,332 to 3,394 µS/cm, with no obvious trend over the range observed. Temperature ranged from 15.19 OC to 25.14 OC. ORP (Figure 4.2-2) ranged from 382.6 to 492.7 mV. DO (Figure 4.2-3) ranged from 2.19 to 6.48 mg/L. The lowest DO values were recorded at the end of the study; however, ORP remained relatively constant through the study.
Metals Observations of dissolved metal trends (Table 4.2-1 and Figures 4.2-4 through 4.2-15), MRE ranges (Table 4.2-3), and comparison to water quality standards (Table 4.2-4) of the MIW influent are as follows:
Dissolved Al concentrations ranged from 15,600 µg/L at the beginning of the study to 8,710 µg/L at the end of the study. Concentrations were significantly in exceedance of the chronic and acute water quality standards throughout the study. Al steadily decreased through the study period, with a concentration measured during the last sampling event at nearly half of the initial concentration.
Dissolved As concentrations ranged from 311 µg/L at the beginning of the study to 93 µg/L at the end of the study. Concentrations always exceeded the human health standard and exceeded the chronic aquatic standard during the beginning of the study. A large decrease in As was observed by the end of the study.
Dissolved Be concentrations were low (6 to 8 µg/L); however, these concentrations were still in exceedance of the low human health standard of 4 µg/L.
Dissolved Cd concentrations ranged from 316 µg/L at the beginning of the study to 154 µg/L at the end of the study, again steadily decreasing throughout the study similar to Al and As. Concentrations were significantly in exceedance of the human health, chronic, and acute water quality standards throughout the study.
Barker Hughesville Danny T Treatability Study Technical Memorandum 4-16

Section 4 • Results, Analysis, and Discussion
Dissolved Co concentrations ranged from 58 µg/L at the beginning of the study to 36 µg/L at the end of the study. A standard for Co does not exist in Montana; however, this metal is included in the time charts because concentrations are significant enough that removal trends can be observed in the BCR effluent data.
Dissolved Cu concentrations ranged from 2,160 µg/L at the beginning of the study to 924 µg/L at the end of the study, again steadily decreasing throughout the study similar to Al, As, and Cd. Concentrations were significantly in exceedance of the chronic and acute aquatic water quality standards throughout the study and in exceedance of the human health standard at the beginning of the study.
Dissolved Fe concentrations ranged from 180,000 µg/L at the beginning of the study to 112,000 µg/L at the end of the study, again steadily decreasing throughout the study similar to the other metals above. Concentrations exceeded the chronic aquatic water quality standard throughout the study.
Dissolved Pb concentrations ranged from 252 µg/L at the beginning of the study to 122 µg/L at the end of the study, again steadily decreasing throughout the study similar to the other metals above. Concentrations always exceeded the human health and the chronic aquatic standard during the throughout the study.
Dissolved Mn concentrations ranged from 128,000 to 98,400 µg/L, again showing a similar decreasing trend throughout the study. Mn does not have a DEQ-7 standard for comparison; however, Mn is a major metal contributing to influent acidity loading along with Al and Fe.
Dissolved Ni concentrations ranged from 28 to 39 µg/L, again showing a similar decreasing trend throughout the study. No exceedances of standards were observed.
Dissolved Tl concentrations were low (1.8 to 2.3 µg/L); however, these concentrations were still in exceedance of the low human health standard (0.24 µg/L).
Dissolved Zn concentrations ranged from 69,100 µg/L at the beginning of the study to 44,500 µg/L at the end of the study, again steadily decreasing throughout the study similar to the other metals above. Concentrations were significantly in exceedance of the human health, chronic, and acute water quality standards throughout the study.
Other metals that were analyzed include barium, chromium, and silver. Concentrations for all of these were trace to non-detect throughout the study period.
A comparison of dissolved metals to total metals in the influent generally shows a good correlation between the two, indicating the metals are largely in the dissolved phase. Some dissolved metals concentrations were greater than total concentrations, where the differences may be within the analytical accuracy and precision of the instruments used to analyze the samples.
Wet Chemistry Parameters Sulfate (Figure 4.2-16) concentrations in the influent MIW ranged from 1,600 to 2,500 mg/L. Acidity (Figure 4.2-18) concentrations in the influent MIW ranged from 460 to 820 mg/L. Alkalinity (Figure 4.2-19) concentrations in the influent MIW was non-detect throughout the study as expected for this type of acidic MIW.
Barker Hughesville Danny T Treatability Study Technical Memorandum 4-17

Section 4 • Results, Analysis, and Discussion
Summary Steadily decreasing metals concentrations were observed through the end of the study along with decreasing DO. These data illustrate the relationship of the adit discharge to seasonal weather. During the drier summer less precipitation infiltrates into the underground workings resulting in contact with the mineralized workings and evidence of a larger bedrock groundwater source for the adit discharge. Decreases in DO also illustrate that the adit discharge may be more related a bedrock groundwater source during the summer season rather than infiltration recharge of high DO precipitation recharge.
4.2.2 BCR1 BCR1 had no pre-treatment. The following subsections summarize the BCR1 effluent water quality.
Field parameters The field parameters of pH, conductivity, ORP, temperature, and DO are broad indicators of the BCR performance. BCR 1 raised the pH to between 5.60 and 6.14 su, however, the discharge pH was not within the range of 6.5 to 9.0 su set forth by DEQ1.
Conductivity ranged from 1,992 to 3,505 µS/cm. Effluent conductivity was greater than the influent initially due to the flushing of soluble components from the substrates, which is expected in BCRs during startup. After startup, conductivity was similar to the influent.
ORP ranged from -163.0 mV initially to 57.6 mV at the end of the study. ORP varied between negative and positive values throughout the study but never reached reducing conditions sufficient to promote the sulfate reduction reaction process (i.e., consistently -150 mV or less).
DO ranged from 0.02 mg/L initially to 2.31 mg/L at the end of the study. DO values at the end of the study were essentially the same as the influent MIW.
Metals The following includes observations of dissolved metal trends (Table 4.2-1 and Figures 4.2-4 through 4.2-15), MRE ranges (Table 4.2-3), and comparison to water quality standards (Table 4.2-4). Dissolved metals are the focus of the discussion since the total metals data set is limited to only two sampling events. Total metals data are presented and discussed where relevant.
Dissolved Al was removed by BCR1 with an efficiency of greater than 92 percent consistently; however, concentrations (90 to 840 µg/L) remained in exceedance of the chronic aquatic standards. The acute aquatic standard was also exceeded during one sampling event (840 µg/L). Total metals concentrations where measured were greater than dissolved and also had an MRE of greater than 92 percent.
Dissolved As was removed by BCR1 with an efficiency of greater than 92 percent consistently. Total metal MRE was only 71.0 percent during the first sampling event and 92.3 percent near
1 Administrative Rules of Montana, Title 17, Chapter 30 – Water Quality, Sub-Chapter 6 – Surface Water Quality Standards, Section 17.30.628 Classification Standards.
Barker Hughesville Danny T Treatability Study Technical Memorandum 4-18

Section 4 • Results, Analysis, and Discussion
the end of the study. Dissolved As concentrations ranged from 6.0 to 15.0 µg/L and were occasionally in exceedance of the human health standard.
Dissolved Ba concentrations were elevated in the incubation sample (550 µg/L) and gradually declined to non-detect during the last sampling event. Ba is non-detect in the influent MIW; therefore, the detected concentrations are attributed to leaching from the substrates. This phenomenon has been observed in other studies during the initial startup phase with BCRs that contain woody substrate materials; however, the concentrations quickly decline.
Dissolved Be was removed by BCR1 with an efficiency of greater than 83 percent consistently, with concentrations non-detect or at the reporting limit (1 µg/L).
Dissolved Cd was removed by BCR1 with an efficiency of greater than 99 percent consistently, with concentrations non-detect or at the reporting limit (1 µg/L). However, note that the reporting limit was not low enough for direct comparison against the chronic standard (typically 0.75 µg/L at the hardness of the samples). The one detected concentration of 1 µg/L exceeded the chronic aquatic standard. In the incubation sample, total Cd was much greater than dissolved at 21 µg/L. The later measurement of total Cd was the same as the dissolved concentration (non-detect).
Dissolved Co was removed by BCR1 in the incubation sample by 91.4 percent, followed by a decline in MRE through the remainder of the study. The last three sampling events had a negative or zero MRE with concentrations essentially the same as the influent MIW. This type of response is indicative of initial removal through adsorption followed by breakthrough (e.g., adsorption capacity of the sorbent material has been exceeded). These results indicate Co is not likely removed via a chemical reaction to precipitate Co as a carbonate, oxy-hydroxide, or sulfide. Co is discussed because of the potential adsorption removal mechanism, although it does not have a water quality standard for comparison.
Dissolved Cu was removed by BCR1 with an efficiency of greater than 99 percent consistently. Cu was detected in the incubation sample at 6 µg/L, followed by non-detect concentrations for the remainder of the study (less than 5 µg/L). In the incubation sample, total Cu was much greater than dissolved at 191 µg/L. The later measurement of total Cd was the same as the dissolved concentration (non-detect).
Dissolved Fe was removed by BCR1 in the incubation sample by 97.2 percent, followed by a decline in MRE through the remainder of the study. The last three sampling events ranged from 23.4 to 33.7 percent MRE. Dissolved Fe concentrations exceeded the chronic aquatic standard throughout the study. The decline in Fe removal is likely due to the lack of sulfate reduction in the substrate, as discussed below.
Dissolved Pb was removed by BCR1 with an efficiency of greater than 96 percent consistently, with all concentrations non-detect (less than 1 µg/L). In the incubation sample, total Pb was much greater than dissolved at 60 µg/L. The later measurement of total Pb was at 9 µg/L.
Dissolved Mn was removed by BCR1 in the incubation sample by 82.5 percent, followed by a decline in MRE through the remainder of the study. The last four sampling events had a slightly negative MRE, indicating that Mn was leaching from the substrate or re-dissolving from
Barker Hughesville Danny T Treatability Study Technical Memorandum 4-19

Section 4 • Results, Analysis, and Discussion
precipitates. Removal of Mn is not expected in a BCR since Mn does not form a stable sulfide precipitate. Mn is typically removed by carbonate precipitate formation or adsorption.
Dissolved Ni MRE ranged from 78.4 to -13.8 percent. Ni removal followed a similar breakthrough curve as Co. Generally Ni removal was poor in BCR1 and effluent concentrations were similar to influent MIW concentrations for all August and September sampling events; however, effluent concentrations did not exceed any of the standards.
Dissolved Tl was removed by BCR1 with an efficiency of greater than 72 percent consistently, with all results non-detect (less than 0.5 µg/L). However, note that the reporting limit was not low enough for direct comparison against the lower human health standard (0.24 µg/L).
Dissolved Zn was removed by BCR1in the first two samples by greater than 99.9 percent, followed by a decline in MRE through the remainder of the study. After the first two sampling events, dissolved Zn concentrations greatly exceeded the chronic and acute aquatic standards and human health standard. Zn concentrations in BCR 1 show a typical adsorption breakthrough curve similar Ni, with initial removal due to adsorption, then effluent Zn concentrations approaching influent concentrations.
Wet Chemistry Parameters Figure 4.2-20 illustrates the acidity and alkalinity relationship for BCR1. This relationship is important because it shows whether or not the net acidic influent MIW was treated to the desired net alkaline condition. Acidity concentrations in BCR1 ranged from non-detect (less than 4 mg/L) in the incubation sample to a high of 450 mg/L. The incubation sample had greater alkalinity (1,400 mg/L), followed by a decrease to less than 100 mg/L for the remainder of the study. Ideally, a neutral treated effluent from a BCR should have no acidity; however, BCR 1 did not generate enough alkalinity to neutralize the acidity in the influent MIW.
Sulfate concentrations ranged from 240 mg/L in the incubation sample to a high of 1,400 mg/L. Sulfate removal efficiency ranged from 85 percent (incubation sample) to a low of 36.4 percent. Some sulfide generation occurred during the beginning of the study (4 mg/L in the incubation sample), followed by non-detect concentrations during the last 3 sampling events.
All of these data together suggest that some sulfide reduction was occurring during the incubation period. Alkalinity and sulfide are generated by the sulfate reduction reaction while sulfate is consumed and acidity is neutralized. The pH observed above 6.0 and the negative ORP observed also correlate with this conclusion. After this period however, the sulfate reduction could not be maintained for any number of reasons such as acidity overloading, low retention time, or lack of the correct substrate nutrients to sustain sulfate reduction.
Summary At the beginning of the study, BCR1 MREs for all metals were very good. However, conditions in BCR 1 changed quickly after incubation resulting in a lack of sulfate reduction, lack of buffering of acidity/pH with alkalinity production, and insufficient removal of Fe, Mn, Ni, and Zn. Other metals were removed to concentrations at or near water quality standards or below detection levels consistently. These observations indicate that BCR1 was overloaded with influent acidity. After decreasing the average flow rate on 9/4, no significant change in metal removal was observed in the sample collected on
Barker Hughesville Danny T Treatability Study Technical Memorandum 4-20

Section 4 • Results, Analysis, and Discussion
9/16. Insufficient time remained in the study to evaluate the treatment effectiveness of this modification.
Since sulfate reduction did not occur after the incubation period, removal of these other metals such as Cd, Cu, and Pb were likely by sorption and oxy-hydroxide/carbonate precipitation reactions within the substrate media. Had the study been continued for a longer period, removal of these metals is not expected to be maintained because the organic substrate sorption sites become saturated with these metals. This phenomenon has been observed recently at other similar pilot tests when sulfate reduction is not the dominant removal mechanism. These results also support the need for pre-treatment of this high acidity MIW ahead of the BCR.
4.2.3 SAPS Pre-treatment and BCR2 The SAPS pre-treatment was followed by BCR2. The following subsections summarize the SAPS and BCR2 effluent water quality.
Field Parameters The SAPS raised pH to a range between 5.11 and 6.38 su, while BCR2 further increased pH to a range between 5.91 to 6.32. With exception to the incubation sample, BCR2 further increased pH by 0.7 to 0.9 su from the SAPS effluent. However, effluent pH from BCR2 was not within the DEQ standard range (6.5 to 9.0 su).
Conductivity ranged from 1,996 to 2,434 µS/cm in the SAPS and from 2,019 to 4,954 µS/cm in BCR2. Effluent conductivity was greater than the influent initially in both barrels due to the flushing of soluble components from the substrates, which is expected during startup. After startup, conductivity was similar to the influent.
ORP ranged from -157.6 mV initially to a high of 178.30 mV in the SAPS and from -153.8 mV initially to a high of 19.4 mV in BCR2. ORP in the SAPS remained positive after the incubation sample, while ORP in BCR2 varied between negative and positive values throughout the study. Sufficiently negative ORP values were never reached to promote the sulfate reduction reaction process.
The SAPS DO ranged from 0.09 mg/L initially to 4.14 mg/L at the end of the study, while the BCR2 DO ranged from 0.05 mg/L initially to 8.52 mg/L at the end of the study. DO values for both barrels at the end of the study were greater than the influent MIW. The reason for the increased DO is unknown, but may be due to instrument error, sampler error, or some unknown chemical or biological reaction.
Metals The following includes observations of dissolved metal trends (Table 4.2-1 and Figures 4.2-4 through 4.2-15), MRE ranges (Table 4.2-3), and comparison to water quality standards (Table 4.2-4). Dissolved metals are the focus of the discussion since the total metals data set is limited to only two sampling events. Total metals data are presented and discussed where relevant.
Dissolved Al concentrations in the SAPS ranged from 40 µg/L in the incubation sample to a high of 2,550 µg/L, while the MRE ranged from 99.7 initially to a low of 80.1 percent. For BCR2, dissolved Al concentrations ranged from non-detect (less than 30 µg/L) to 140 µg/L, while the overall MRE was consistently greater than 90 percent. The overall MRE was calculated by comparing the BCR2 effluent to the SAPS MIW influent (influent adit MIW). The chronic aquatic
Barker Hughesville Danny T Treatability Study Technical Memorandum 4-21

Section 4 • Results, Analysis, and Discussion
standard was exceeded in the first sampling event (140 µg/L) for BCR2. For all remaining samples, results indicate that BCR2 effectively polished additional Al not removed in the SAPS.
Total Al concentrations were greater than dissolved for both barrels. During the first sampling event, the SAPS removed 98.8 percent of total Al (220 µg/L concentration). In contrast, a significant total Al concentration of 154,000 µg/L was observed in the 9/4 SAPS sample, compared to the 680 µg/L dissolved concentration in the same sample. This SAPS effluent Al concentration was 12 times the influent MIW concentration for this event. These data indicate that a significant amount of suspended Al was being discharged from the SAPS during the latter part of the study. Despite this very high total Al concentration, BCR 2 maintained a 99.0 percent total Al MRE on 9/4.
Dissolved As concentrations in the SAPS ranged from 3 to 52 µg/L at the end of the study, while the MRE ranged from 98.1 percent to only 44.1 percent at the end of the study. Arsenic removal was greater than 97 percent except for the last sample. For BCR2, dissolved As concentrations ranged from 2 to 20 µg/L, while the overall MRE ranged from 93.6 to 99.3 percent. The human health standard was exceeded only in the incubation sample (20 µg/L) for BCR2. Arsenic was either completely removed by the SAPS or slightly polished by BCR2. Similar to Al, a significant total As concentration was observed in the SAPS effluent on 9/4 (746 µg/L) that was greater than the influent MIW As. Again, this spike in As can be explained potentially as leaching or physical transport of sorbed As from the SAPS during the latter part of the study. Despite this very high total As concentration, BCR 2 maintained a 98.0 percent total As MRE on 9/4.
Dissolved Ba concentrations were elevated in the incubation samples (300 µg/L in the SAPS and 570 µg/L in BCR2) and then gradually declined. For the SAPS, dissolved Ba was non-detect for the last four sampling events, while in BCR2 dissolved Ba had decreased to 70 µg/L by the last sampling event. Concentrations in BCR2 were similar to those observed in BCR1 as a result of substrate leaching.
Dissolved Be was removed by the SAPS to low levels (1.0 to 3.0 µg/L) except for the last sampling event (7.0 µg/L). For BCR2, dissolved Be was effectively polished to below the reporting limit (1 µg/L) for all samples. A total Be concentration of 63.0 µg/L was discharged from the SAPS on 9/4; however, this high concentration was polished by BCR2.
Dissolved Cd concentrations in the SAPS ranged from non-detect (less than 1 µg/L) in the incubation sample to a high of 100 µg/L at the end of the study, while the MRE ranged from 99.7 to 35.1 percent. For BCR2, dissolved Cd concentrations were consistently non-detect (less than 1 µg/L), while the overall MRE was consistently greater than 99 percent. Dissolved Cd was effectively polished by BCR2. Similar to other metals above, a high total Cd (584 µg/L) that was greater than the influent MIW was measured on 9/4 in the SAPS. Despite the high loading, BCR2 still removed this Cd concentration to below the reporting limit.
Dissolved Co was removed by the SAPS in the incubation sample by 91.4 percent, followed by no removal for the remainder of the study. BCR2 removed Co by 81.0 and 85.4 percent during the first two sampling events, followed by minimal removal for the remainder of the study. The results for BCR2 are similar to BCR1 with a relatively fast adsorption breakthrough for Co.
Barker Hughesville Danny T Treatability Study Technical Memorandum 4-22

Section 4 • Results, Analysis, and Discussion
Dissolved Cu concentrations in the SAPS ranged from non-detect (less than 5 µg/L) to 780.0 µg/L in the last sample, while the MRE ranged from 99.8 to 15.6 percent in the last sample. For BCR2, dissolved Cu concentrations were either non-detect or at the reporting limit of 5 µg/L, while the overall MRE was consistently greater than 98 percent. Dissolved Cu was effectively polished by BCR2. In the incubation samples for both the SAPS and BCR2, total Cu concentrations were much greater than dissolved. Similar to other metals above, a high total Cu (10,100 µg/L) that was greater than the influent MIW was measured on 9/4 in the SAPS. Despite the high loading, BCR2 still removed this Cu concentration to below the reporting limit for the same sample. The high dissolved Cu concentration detected in the last sample could be related to the large release of total Cu detected in the previous sample. Cu removal by sorption may have reached breakthrough by the time of this last sample event.
Dissolved Fe concentrations in the SAPS ranged from 2,630 µg/L in the incubation sample to a high of 111,000 µg/L, while the MRE ranged from 98.5 percent initially to 4.5 percent at the end of the study. For BCR2, dissolved Fe concentrations ranged from 5,080 µg/L in the incubation sample to a high of to 77,000 µg/L, while the overall MRE ranged from 97.2 percent initially to a low of 52.2 percent. The chronic aquatic standard was exceeded in all BCR2 samples. BCR2 did provide some additional removal after the SAPS although effluent concentrations were still very high. The decline in Fe removal is likely due to the lack of sulfate reduction in the substrate, as discussed below. Similar to other metals above, a high total Fe (669,000 µg/L) that was greater than the influent MIW was measured on 9/4 in the SAPS. This concentration was reduced by 93 percent in BCR2 (to 45,000 µg/L).
Dissolved Pb concentrations in the SAPS were non-detect (less than 1 µg/L) to 2 µg/L for the first five sampling events, followed by a high of 184 µg/L during the last sampling event. MRE in the SAPS ranged from 99.6 percent to -50.8 percent at the end of the study. The negative MRE indicates that Pb precipitates or adsorbed species were being re-dissolved from the substrate. For BCR2, dissolved Pb concentrations were all non-detect (less than 1 µg/L), while the overall MRE was consistently greater than 99 percent. Dissolved Pb was effectively polished by BCR2. In the incubation samples for both the SAPS and BCR2, total Pb concentrations were greater than dissolved. Similar to other metals above, a high total Pb (1,950 µg/L) that was greater than the influent MIW was measured on 9/4 in the SAPS. Despite the high loading, BCR2 still removed this Pb concentration to the reporting limit. Similar to Cu, the higher dissolved Pb concentration at the end of the study could be due to breakthrough.
Dissolved Mn concentrations in the SAPS ranged from 42,400 µg/L in the incubation sample to a high of 135,000 µg/L, while the MRE ranged from 65.8 percent initially to slightly negative at the end of study. For BCR2, dissolved Mn concentrations ranged from 7,260 µg/L in the incubation sample to a high of to 127,000 µg/L, while the overall MRE ranged from 94.1 percent initially to -9.5 percent. Overall Mn was removed only in the incubation sample, followed by either no removal or possibly a small amount of leaching from the substrate.
Dissolved Ni concentrations in the SAPS ranged from 5.0 µg/L in the incubation sample to a high of 42.0 µg/L, while the MRE ranged from 87.2 percent initially to -23.5 percent. The negative MRE indicates that Ni precipitates or adsorbed species may be re-dissolving from the substrate. Alternatively the values detected may just be within the range of accuracy and precision of the instruments used to analyze the samples for the analysis. For BCR2, dissolved
Barker Hughesville Danny T Treatability Study Technical Memorandum 4-23

Section 4 • Results, Analysis, and Discussion
Ni concentrations ranged from non-detect (less than 5 µg/L) to 35 µg/L, while the overall MRE ranged from 86.5 percent to -10.3 percent. Neither the SAPS nor BCR2 significantly or consistently removed Ni from the influent MIW, although no standards were exceeded due to the low influent concentrations.
Dissolved Tl concentrations in the SAPS ranged from non-detect (less than 0.5 µg/L) to 2.4 µg/L, while MRE ranged from 78.3 to -33.3 percent. The SAPS removed Tl initially but concentrations increased as the study progressed. For BCR2 dissolved Tl concentrations were all non-detect (less than 0.5 µg/L).
Dissolved Zn concentrations in the SAPS ranged from 70 µg/L in the incubation sample to a high of 63,200 µg/L, while the MRE ranged from 99.9 percent initially to -19.6 percent at the end of the study. For BCR2, dissolved Zn concentrations ranged from 20 µg/L to 13,700 µg/L, while the overall MRE ranged from 99.9 percent to 69.2 percent. Zn was intended to be treated in the BCR and not the SAPS. Initially, treatment of Zn was good; however, conditions in BCR2 were not reducing enough to sustain sulfate reduction to remove zinc as a sulfide precipitate. BCR2 effluent concentrations exceeded the chronic and acute aquatic standards during the last four sampling events. The human health standard was also exceeded during the last three sampling events. For both the SAPS and BCR2 total metals were much greater than dissolved metals. Similar to some of the other metals mentioned above, a high total Zn (69,800 µg/L) that was greater than the influent MIW was measured on 9/4.
Wet Chemistry Parameters Figure 4.2-21 illustrates the acidity and alkalinity relationship for the SAPS and BCR2. Acidity concentrations in the SAPS ranged from non-detect (less than 4 mg/L) in the incubation sample to a high of 450 mg/L. Alkalinity concentrations ranged from 750 mg/L in the incubation sample to non-detect (less than less than 1.0 mg/L). These data indicate that the SAPS was overloaded with acidity from the influent MIW and the limestone present in the SAPS was not sufficient to buffer that acidity. In other words the SAPS effluent was net acidic through most of the study, even with the pH increase by 2 to 3 su. Similarly, in BCR2, acidity concentrations ranged from non-detect (less than 4 mg/L) in the incubation sample to a high of 270 mg/L. Alkalinity concentrations ranged from 1,700 mg/L in the incubation sample to 100 mg/L. The BCR2 effluent was net alkaline during the first two samples, followed by net acidic for three samples, and then net alkaline again for the last sample.
The SAPS generally did not reduce sulfate concentrations by much from the influent MIW with percent removal ranging from 62.5 percent in the incubation sample to a low of 22.7 percent. Removal of sulfate by sulfate reduction was not intended in the SAPS, although some sulfate can be removed by precipitation of Al and Fe oxy-hydroxide sulfate precipitates and as calcium sulfate (gypsum). For BCR2 sulfate concentrations ranged from 480 mg/L in the incubation sample to 1,300 mg/L, while overall removal efficiency ranged from 70.0 to 40.0 percent. Removal of sulfate in BCR2 was consistently much greater than in the SAPS.
Some sulfide generation occurred in BCR2; with the greatest concentrations in the incubation sample (11 mg/L) and 7/23 sample (2.4 mg/L). After July, sulfide concentrations ranged from non-detect (less than 0.04 or 0.2 mg/L) to 0.7 mg/L. On 9/4, a 0.15 mg/L concentration was measured compared to the non-detect result from the previous sampling event in August. On the same date, ORP had also decreased to below zero compared to measurement in August. This concentration is low but may have
Barker Hughesville Danny T Treatability Study Technical Memorandum 4-24

Section 4 • Results, Analysis, and Discussion
been evidence that the BCR was rebounding from previous overloading. Unfortunately for the last sampling event, sulfide was again non-detect and ORP had again increased greater than zero.
Summary Overall, in comparison to BCR1 with no pre-treatment, the SAPS and BCR2 combination performed similarly for removal of metals. BCR2 did not sufficiently remove Fe, Mn, Ni, and Zn. Removal of Fe and Zn was much better than for BCR1 alone, although BCR2 effluent still did not meet standards. All other dissolved metals were removed in BCR1 to concentrations below standards or below detection levels. The SAPS/BCR2 consistently removed As to concentrations below the human health standard whereas BCR1 did not. No major improvement in MRE was observed for the 9/11 sample after the average flow rate was decreased on 9/4. Fe MRE slightly increased from 64.3 to 69.9 percent, although this increase may be within the range of accuracy/precision of the measuring instrument.
Despite these positive results for many metals, conditions in BCR2 were not sufficient to sustain sulfate reduction to remove difficult metals such as Fe and Zn and it appears the system was overloaded with acidity. Sulfide was detected and sulfate was reduced; however, BCR2 could not maintain a positive alkalinity balance or consistent reducing conditions. Similar to BCR1, removal of many of the metals appears to have been dominated by adsorption and oxy-hydroxide/carbonate precipitation reactions and removal of metals is not expected to be maintained for an extended period of time without adequate sulfate reducing conditions.
4.2.4 Chitorem Pre-treatment and BCR3 The Chitorem pre-treatment was followed by BCR3. The following subsections summarize the Chitorem and BCR3 effluent water quality.
Field Parameters The Chitorem barrel raised pH to a range between 6.07 and 6.83 su, while BCR3 effluent pH ranged from 6.17 to 6.81. BCR3 did not always lead to a further increase in pH, with some cases pH slightly decreasing after BCR3. Effluent pH from BCR3 was within the DEQ standard range (6.5 to 9.0 su) for some of the samples.
Conductivity ranged from 2,941 to 60,571 µS/cm in the Chitorem barrel and from 5,154 to 8,162 µS/cm in BCR3. Effluent conductivity was greater than the influent initially in both barrels due to the flushing of soluble components from the substrates, which is expected during startup. Effluent conductivity from the Chitorem barrel was extremely high. This magnitude of concentrations has been observed in other studies performed by CDM Smith with Chitorem, although the concentration in this case may have been above the detectable range of the conductivity instrument. Conductivity values quickly dropped in the Chitorem barrel after the incubation period but remained greater than the influent for the entire study.
ORP ranged from -206.8 mV initially to a high of -57.3 mV at the end of the study in the Chitorem barrel and from -152.5 mV initially to -325.7 in BCR3. ORP in the Chitorem barrel increased after the incubation sample, while ORP in BCR3 decreased to its lowest point (-325.7 mV) on 8/7 followed by an increase to -247.5 mV at the end of the study. Sufficiently negative ORP values were attained in BCR3 to promote the sulfate reduction reaction process. The increase in the Chitorem barrel ORP to -57.3 at the end of the study was likely due to the substrate modification activities conducted on 9/11, just 5 days prior to the final effluent sample. All of the Chitorem, sand, and gravel substrate was
Barker Hughesville Danny T Treatability Study Technical Memorandum 4-25

Section 4 • Results, Analysis, and Discussion
removed from the pre-treatment barrel and a portion was mixed with additional gravel to increase permeability. Although care was taken to minimize oxygen exposure by mixing the substrate under a blanket of argon gas, this process likely exposed anaerobic bacteria to oxygen. This can cause SRB spore formation where the bacteria become dormant until conditions become more reducing again. The time needed for SRB to recover from event like this may require a month or more based on research by Perrault et. al. (2009). The barrel may have rebounded somewhat after this maintenance activity given ORP was still slightly negative; however, no further samples were collected due to the onset of winter conditions.
The Chitorem barrel DO ranged from 0.05 mg/L initially to 3.94 mg/L, while the BCR3 DO ranged from 0.04 mg/L initially to 4.34 mg/L.
Metals The following includes observations of dissolved metal trends (Table 4.2-1 and Figures 4.2-4 through 4.2-15), MRE ranges (Table 4.2-3), and comparison to water quality standards (Table 4.2-4). Dissolved metals are the focus of the discussion since the total metals data set is limited to only two sampling events. Total metals data are presented and discussed where relevant.
Dissolved Al concentrations in the Chitorem barrel ranged from 300 µg/L in the incubation sample to non-detect (less than 30 µg/L), while the MRE was consistently greater than 98 percent. For BCR3, dissolved Al concentrations ranged from 170 µg/L in the incubation sample to non-detect (less than 30 µg/L), while the overall MRE was consistently greater than 98 percent (comparison of BCR3 effluent to the Chitorem barrel MIW influent). The chronic aquatic standard was exceeded in the first sampling event (170 µg/L) for BCR3. For all remaining samples, Al concentrations were non-detect. Total metals concentrations were greater than dissolved for both barrels. Overall, total metals concentrations were much lower than the SAPS/BCR2 treatment.
Dissolved As concentrations in the Chitorem barrel ranged from 4,180 in the in the incubation sample to between 24 and 58 µg/L for the rest of the study. After the incubation sample, dissolved As MRE ranged from 91.4 to 63.4 percent. Significant leaching of As was observed in the incubation sample as observed in previous studies with Chitorem; however, the concentration from the barrel quickly diminished for the second sampling event. For BCR3, dissolved As concentrations ranged from 75 to 15 µg/L, while the overall MRE ranged from 86.2 to 75.9 percent. The human health standard was exceeded in all samples for BCR3. For some sampling events As concentrations slightly increased in the BCR3 effluent compared to the Chitorem barrel effluent.
Dissolved Ba concentrations were elevated in the incubation samples (280 µg/L in the Chitorem barrel and 790 µg/L in BCR3) and then gradually declined. For the Chitorem barrel, dissolved Ba was non-detect for the last two sampling events, while in BCR3 dissolved Ba had decreased to 90 µg/L by the last sampling event. Concentrations in BCR3 were similar to those observed in BCR1 and BCR2 as a result of substrate leaching.
Dissolved Be was removed by the Chitorem barrel consistently to non-detect (less than 1.0 µg/L). BCR3 maintained this removal to all non-detect concentrations.
Barker Hughesville Danny T Treatability Study Technical Memorandum 4-26

Section 4 • Results, Analysis, and Discussion
Dissolved Cd concentrations in the Chitorem barrel ranged from 44 µg/L in the incubation sample to non-detect (less than 1 µg/L) for the remainder of the study, while the MRE ranged from 86.1 percent to greater than 99 percent for the remainder of the study. For BCR3, dissolved Cd concentrations were consistently non-detect (less than 1 µg/L), while the overall MRE was consistently greater than 99 percent. A greater total Cd concentration was detected in the incubation sample for BCR3 (7 µg/L); however, the later total Cd sample result was non-detect (less than 1 µg/L).
Dissolved Co concentrations in the Chitorem barrel ranged from 183 µg/L in the incubation sample to 5 µg/L, while the MRE ranged from -215.5 percent to greater than 87.5 percent. For BCR3, dissolved Co concentrations ranged from 24 µg/L in the incubation sample to non-detect (less than 5 µg/L), while the overall MRE ranged from 58.6 to 90.9 percent. Based on the incubation sample data dissolved Co leached from the Chitorem, although concentrations quickly dissipated. BCR3 effectively polished the remaining Co not removed by the Chitorem barrel to non-detect concentrations.
Dissolved Cu concentrations in the Chitorem barrel ranged from 430 µg/L in the incubation sample to non-detect (less than 5 µg/L) for the remainder of the study, while the MRE ranged from 80.1 percent to greater than 99 percent for the remainder of the study. For BCR3, dissolved Cu concentrations ranged from 8 µg/L in the incubation sample to non-detect (less than 5 µg/L) for the remainder of the study, while the overall MRE was consistently greater than 99 percent. A greater total Cu concentration was detected in the incubation sample for BCR3 (169 µg/L); however, the later total Cu sample result was non-detect (less than 5 µg/L).
Dissolved Fe concentrations in the Chitorem barrel ranged from 820 to 39,400 µg/L, while the MRE ranged from 99.5 to 64.8 percent. For BCR3, dissolved Fe concentrations ranged from 8,710 µg/L in the incubation sample to non-detect (less than 30 µg/L), while the overall MRE ranged from 95.2 percent initially to greater than 99 percent for the remainder of the study. The chronic aquatic standard was exceeded only in the incubation sample from BCR3. BCR3 effectively removed a significant amount of Fe that was discharged from the Chitorem barrel.
Dissolved Pb concentrations in the Chitorem barrel ranged from 7 µg/L in the incubation sample to non-detect (less than 1 µg/L) for the remainder of the study, while the MRE ranged from 97.2 percent to greater than 99 percent for the remainder of the study. For BCR3, dissolved Pb concentrations ranged from 1 µg/L in the incubation sample to non-detect (less than 1 µg/L) for the remainder of the study, while the overall MRE was consistently greater than 99 percent. A greater total Pb concentration was detected in the incubation sample for BCR3 (74 µg/L); however, the later total Pb sample result on 9/4 was 3 µg/L.
Dissolved Mn concentrations in the Chitorem barrel ranged from 3,110 µg/L in the incubation sample to a high of 113,000 µg/L, while the MRE ranged from 97.5 percent initially to -9.7 percent. For BCR3, dissolved Mn concentrations ranged from 1,720 µg/L in the incubation sample to a high of to 61,300 µg/L, while the overall MRE ranged from 98.7 to 37.7 percent. Overall Mn was removed efficiently only in the July samples, followed by gradual decrease in efficiency.
Dissolved Ni concentrations in the Chitorem barrel ranged from 1,060 µg/L in the incubation sample to a low of 5 µg/L, while the MRE ranged from -2,618 percent initially to 82.1 percent.
Barker Hughesville Danny T Treatability Study Technical Memorandum 4-27
Section 4 • Results, Analysis, and Discussion
For BCR3, dissolved Ni concentrations ranged from 66 µg/L in the incubation sample to non-detect for the last three sampling events, while the MRE ranged from -69.2 percent to greater than 83 percent. Based on the incubation sample data, dissolved Ni leached from the Chitorem, although concentrations quickly decreased. BCR3 effectively polished the remaining Ni not removed by the Chitorem barrel.
Dissolved Tl concentrations in the Chitorem barrel and BCR3 were consistently non-detect (less than 0.5 µg/L).
Dissolved Zn concentrations in the Chitorem barrel ranged from 1,040 µg/L in the incubation sample to a range of 20 to 60 µg/L for the remainder of the study, while the MRE was consistently greater than 98 percent. For BCR3, dissolved Zn concentrations ranged from non-detect (less than 10 µg/L) to 40 µg/L, while the overall MRE was consistently greater than 99 percent. A greater total Zn concentration was detected in the incubation sample for BCR3 (620 µg/L); however, the later total Zn sample result was 30 µg/L.
Wet Chemistry Parameters Figure 4.2-22 illustrates the acidity and alkalinity relationship for the Chitorem barrel and BCR3. Acidity concentrations in the Chitorem barrel and BCR3 were consistently non-detect (less than 4 mg/L). Alkalinity concentrations in the Chitorem barrel ranged from 23,000 mg/L in the incubation sample to 620 mg/L at the end of the study. Alkalinity concentrations gradually decreased throughout the study. In BCR3 alkalinity concentrations ranged from 1,300 mg/L to 2,600 mg/L. The BCR3 effluent was net alkaline throughout the course of the study as a result of the alkalinity generated by the Chitorem barrel. Even as the Chitorem barrel alkalinity continued to decrease, BCR3 was generating additional alkalinity greater than the Chitorem barrel effluent, some of which may have been created by the sulfate reduction processes.
The most significant reduction in sulfate concentration occurred in the Chitorem barrel compared to BCR3. Sulfate increased in the incubation sample compared to the influent, followed by a percent removal ranging from 45.0 to 79.2 percent (concentrations ranged from 520 to 1,100 mg/L). For BCR3 sulfate concentrations continued to decrease by 130 to 430 mg/L compared to the Chitorem barrel effluent. Sulfate reduction continued to occur in BCR3, although the magnitude of the concentration decrease was less than with the Chitorem barrel.
The effluent from the Chitorem barrel was analyzed once for sulfide in the incubation sample with a result of 29 mg/L. This data indicate that the Chitorem substrate was generating sulfide as a result of sulfate reduction and most likely contributing sulfide to BCR3. The reason for the increase in sulfate in the incubation sample may be due to initial leaching from the Chitorem substrate. For BCR3 sulfide concentrations ranged from 1.3 to 112 mg/L. The high of 112 mg/L sulfide on 8/7 corresponded with the most significant reducing conditions measured in the barrel (-325.7 ORP). These data together indicate that the combination of the Chitorem barrel and BCR3 promoted sulfate reducing conditions necessary to sustain metal removal by precipitation.
Summary Overall, in comparison to BCR1 alone and the SAPS/BCR2 treatment, the Chitorem/BCR3 treatment performed the best for metal removal and sulfate reducing conditions. MRE of Al, Be, Cd, Cu, Pb, and Tl was similar for both the SAPS/BCR2 and Chitorem/BCR3. Fe and Zn MRE in the Chitorem/BCR3 had
Barker Hughesville Danny T Treatability Study Technical Memorandum 4-28

Section 4 • Results, Analysis, and Discussion
greatly improved, while As MRE was not as good compared to the SAPS/BCR2. This MRE reduction may have been due to the As leaching from the Chitorem substrate. Conditions suitable for sulfate reduction were present in both the Chitorem barrel and BCR3 as shown by the consistently net alkaline condition, pH greater than 6.0 su, low DO and increasing negative ORP, sulfate reduction, and sulfide generation. As a result of these conditions, Fe and Zn removal was sustained throughout the study. These two metals are predominant in the influent MIW and are particularly sensitive to removal by the sulfate reduction process unless adequate conditions exist. After the decrease in average flow rate on 8/7, no significant change in MRE was observed in the Chitorem/BCR3 treatment train. Sulfide and alkalinity generation also did not change. The magnitude of sulfate reduction in BCR3 varied after this flow change, with no clear improving trend.
Despite the positive analytical results with the Chitorem/BCR3 combination, significant hydraulic problems occurred during the study in the Chitorem barrel. Because of the low permeability of the media and biofouling, draining the batch MIW by gravity through the Chitorem barrel became increasingly difficult as the study progressed. Influent MIW was often overflowing out of the Chitorem barrel or not all of the MIW was draining from the head tank in the allotted time that the head tank timer valve was open. One benefit may have been that the hydraulic retention time (contact time with the substrate) would be much greater and flow rate through the treatment train would much lower than other treatments. Therefore when comparing the data to the other barrel test data, one must use some caution. Collection of adequate sample volumes was difficult and sometimes took several hours for sample collection from the Chitorem barrel. Several remedies were attempted to improve hydraulic performance. These steps included reduction of flow rate to one-third of the original flow on 8/7, re-programming the head tank timer valve to remain open longer, tightly sealing the Chitorem barrel lid and installing a pressure relief riser pipe, and bubbling of inert gas through the barrel substrate (i.e., back-flushing). None of these remedies provided much improvement to the hydraulic condition and ultimately the substrate had to be removed and augmented with more pea gravel to improve permeability on 9/11. The substrate modification improved hydraulic performance; however, this work was conducted only one week prior to the last sampling event. Insufficient time followed to evaluate treatment performance after the substrate modification.
These challenges make direct comparison of performance to other barrels difficult. The SAPS was adequately draining and BCRs 1 and 2 drained their batch of flow quite quickly. Based on these observations and lack of key metal removal (i.e., Fe and Zn), a conclusion could be made that these systems treated more MIW, had less hydraulic retention time, were overloaded with acidity and could not maintain sulfate reduction. It appeared that the hydraulic retention time was insufficient, coupled with too high of a flow rate. On the other hand, the Chitorem/BCR3 treatment train had too much retention time and too little flow for a direct comparison to the other treatments.
4.2.5 Alkaline Addition Pre-treatment and BCR4 The alkaline addition pre-treatment (Mg(OH)2 barrel) was followed by BCR4. The following subsections summarize the Mg(OH)2 barrel and BCR4 effluent water quality.
Field Parameters The Mg(OH)2 barrel raised pH to a range between 3.05 and 5.94 su, while BCR4 increased pH to a range between 6.25 and 7.02. As discussed in Section 2.2.4.2, significant problems occurred with the Mg(OH)2 solution dosing. The peristaltic pump tubing was collapsing as a result of the suspended Mg(OH)2 particles which resulted in inconsistent dosing and pH adjustment. For most of the sampling
Barker Hughesville Danny T Treatability Study Technical Memorandum 4-29
Section 4 • Results, Analysis, and Discussion
events, batch doses of pre-treated water were created in the barrel and added to BCR4 and tubing was replaced. Despite the low influent pH on some of the sampling events, effluent pH from BCR4 was consistently the highest of any other barrel. BCR4 effluent was greater than 6.5 su standard for 3 of the 6 sampling events.
Conductivity ranged from 1,930 to 3,022 µS/cm in the Mg(OH)2 barrel and from 1,101 to 4,001 µS/cm in BCR4. Effluent conductivity was greater than the influent initially in both barrels due to the flushing of soluble components from the substrates, which is expected during startup. After startup, conductivity was similar to the influent.
ORP ranged from -15.6 to 425.0 mV in the Mg(OH)2 barrel and from -30.2 to -171.3 mV in BCR4. ORP values in BCR4 remained negative throughout the study but were not as reducing as BCR3. The consistently negative values in the range of -140 to -170 mV could be an indicator that sulfate reduction was occurring to some degree.
The Mg(OH)2 barrel DO ranged from 2.48 to 7.22 mg/L, while the BCR4 DO ranged from 0.02 mg/L initially to 4.35 mg/L at the end of the study. DO values for both barrels at the end of the study were greater than the influent MIW. The reason for the increased DO is unknown, but may be due to instrument error, sampler error, or some unknown chemical or biological reaction.
Metals The following includes observations of dissolved metal trends (Table 4.2-1 and Figures 4.2-4 through 4.2-15), MRE ranges (Table 4.2-3), and comparison to water quality standards (Table 4.2-4). Dissolved metals are the focus of the discussion since the total metals data set is limited to only two sampling events. Total metals data are presented and discussed where relevant.
Dissolved Al concentrations in the Mg(OH)2 barrel ranged from 180 to 12,800 µg/L, while the MRE ranged from 98.1 to zero percent. For BCR4 dissolved Al concentrations ranged from non-detect (less than 30 µg/L) to 130 µg/L, while the overall MRE was consistently greater than 99 percent (comparison of BCR4 effluent to the Mg(OH)2 barrel MIW influent). The chronic aquatic standard was exceeded in the first sampling event (130 µg/L) and on 9/4 (90 µg/L) for BCR4. Results indicate that BCR4 effectively polished additional Al not removed in the Mg(OH)2 barrel. Total metals concentrations were greater than dissolved for both barrels.
Dissolved As concentrations in the Mg(OH)2 barrel ranged from non-detect (less than 1 µg/L) to 152 µg/L, while the MRE ranged from greater than 99.1 percent to only 27.6 percent. For BCR4 dissolved As concentrations ranged from 2 to 20 µg/L, while the overall MRE ranged from 93.6 to 99.3 percent. The human health standard was exceeded only in the incubation sample (20 µg/L) for BCR4. As was either completely removed by the Mg(OH)2 barrel or slightly polished by BCR4.
Dissolved Ba was elevated in the BCR4 incubation sample (550 µg/L) and then gradually declined similar to all other BCRs. Ba was not detected in the Mg(OH)2 barrel as expected.
Dissolved Be concentrations in the Mg(OH)2 barrel ranged from non-detect (less than 1 µg/L) to 7 µg/L, while the MRE ranged from greater than 87.5 to -16.7 percent. For BCR4 dissolved Be was effectively polished to below the reporting limit (1 µg/L) for all samples.
Barker Hughesville Danny T Treatability Study Technical Memorandum 4-30

Section 4 • Results, Analysis, and Discussion
Dissolved Cd concentrations in the Mg(OH)2 barrel ranged from 140 to 280 µg/L, while the MRE ranged from 21.2 to -13.5 percent. For BCR4, dissolved Cd concentrations were consistently non-detect (less than 1 µg/L), while the overall MRE was consistently greater than 99 percent. Dissolved Cd was effectively polished by BCR4 with very little Cd removal occurring in the Mg(OH)2 barrel. A greater total Cd concentration was detected in the incubation sample for BCR4 (27 µg/L); however, the later total Cd sample result was non-detect (less than 1 µg/L).
Dissolved Co MRE in the Mg(OH)2 barrel ranged from 24.1 to zero percent. BCR4 MRE ranged from greater than 89.7 percent to -13.2 percent. The results for BCR4 are similar to BCRs 1 and 2 with a relatively fast adsorption breakthrough for Co.
Dissolved Cu concentrations in the Mg(OH)2 barrel ranged from 79 to 1,570 µg/L, while the MRE ranged from 92.9 to -12.1 percent. For BCR4, dissolved Cu concentrations were consistently non-detect (less than 5 µg/L), while the overall MRE was consistently greater than 99 percent. Dissolved Cu was effectively polished by BCR4. A greater total Cu concentration was detected in the incubation sample for BCR4 (172 µg/L); however, the later total Cu sample result was non-detect (less than 5 µg/L).
Dissolved Fe concentrations in the Mg(OH)2 barrel ranged from 470 to 140,000 µg/L, while the MRE ranged from 99.7 to 13.6 percent. For BCR4 dissolved Fe concentrations ranged from 1,500 to 65,400 µg/L, while the overall MRE ranged from 99.2 to 59.6 percent. The chronic aquatic standard was exceeded in all BCR4 samples. BCR4 did provide some additional removal after the Mg(OH)2 barrel although effluent concentrations were still very high. The decline in Fe removal is likely due to the lack of sulfate reduction in the substrate, as discussed below.
Dissolved Pb concentrations in the Mg(OH)2 barrel ranged from non-detect (less than 1 µg/L) to 165 µg/L, while MRE ranged from greater than 99.6 percent to only 4.6 percent. For BCR4 dissolved Pb concentrations were all non-detect (less than 1 µg/L), while the overall MRE was consistently greater than 99 percent. Dissolved Pb was effectively polished by BCR4. A greater total Pb concentration was detected in the incubation sample for BCR4 (84 µg/L); however, the later total Pb sample result was non-detect (less than 1 µg/L).
Dissolved Mn concentrations in the Mg(OH)2 barrel ranged from 92,100 µg/L at the end of the study to a high of 122,000 µg/L, while the MRE ranged from 19.4 percent initially to -2.8 percent. For BCR4, dissolved Mn concentrations ranged from 11,000 µg/L in the incubation sample to a high of to 146,000 µg/L, while the overall MRE ranged from 91.1 percent initially to -25.9 percent. Overall Mn was removed only in the incubation sample, followed by either no removal or possibly a small amount of leaching from the substrate.
Dissolved Ni concentrations in the Mg(OH)2 barrel ranged from 26 to 36 µg/L, while the MRE ranged from 23.1 percent initially to a low of zero percent. For BCR4, dissolved Ni concentrations ranged from non-detect (less than 5 µg/L) to 29 µg/L, while the MRE ranged from greater than 86.5 percent to -3.6 percent. Neither the Mg(OH)2 barrel or BCR significantly or consistently removed Ni from the influent MIW, although no standards were exceeded due to the low influent concentrations.
Tl was not removed by the Mg(OH)2 pre-treatment. However, dissolved Tl concentrations were all non-detect (less than 0.5 µg/L in BCR4 as observed for the other BCRs.
Barker Hughesville Danny T Treatability Study Technical Memorandum 4-31

Section 4 • Results, Analysis, and Discussion
Dissolved Zn concentrations in the Mg(OH)2 barrel ranged from 36,200 to 53,100 µg/L, while the MRE ranged from 31.3 percent initially to 0.4 percent. For BCR4, dissolved Zn concentrations ranged from 20 µg/L to 10,400 µg/L, while the MRE ranged from greater than 99 percent to 68.1 percent. Overall, results were similar to BCR2 with slightly better Zn removal than BCR2. Initially, treatment of Zn was good; however, conditions in BCR4 were not reducing enough to sustain sulfate reduction to remove zinc as a sulfide precipitate. BCR4 effluent concentrations exceeded the chronic and acute aquatic standards during the last four sampling events. The human health standard was also exceeded in three of the last four sampling events.
Wet Chemistry Parameters Figure 4.2-23 illustrates the acidity and alkalinity relationship for the Mg(OH)2 barrel and BCR4. In the Mg(OH)2 barrel acidity concentrations ranged from non-detect (less than 4 mg/L) to 700 mg/L. Alkalinity concentrations were non-detect (less than 1 mg/L) for the first four sampling events, followed by detections of 8 and 13 mg/L in the last two sampling events. Acidity concentrations in BCR4 ranged from non-detect for the first two sampling events (4 mg/L) to a high of 260 mg/L. Alkalinity concentrations in BCR4 ranged from 1,500 mg/L in the incubation sample to 93 mg/L at the end of the study. Alkalinity concentrations in BCR4 gradually decreased throughout the study. Overall, because of the operational issues with the Mg(OH)2 barrel, alkalinity was not generated to buffer the influent MIW acidity. As a result, a net alkaline effluent was difficult to maintain.
The Mg(OH)2 barrel generally did not reduce sulfate concentrations from the influent MIW with percent removal ranging from 60 to -4.5 percent. For BCR4 sulfate ranged from 280 mg/L in the incubation sample to 1,300 mg/L, while overall percent removal ranged from 82.5 percent in the incubation sample to 40.9 percent. Additional decrease in sulfate in BCR4 from the Mg(OH)2 barrel effluent did occur based on the first four sampling events; however, no decrease in sulfate was observed in the last two sampling events.
For BCR4 sulfide concentrations ranged from 6.6 mg/L to non-detect (less than 0.02 mg/L) at the end of the study. The greatest sulfide concentrations (0.7 to 6.6 mg/L) were detected in the first three sampling events. Sulfide was also detected in the fourth and fifth sampling events at low concentrations. The greater sulfide concentrations detected during the first half of the study correlate with the greatest decrease in sulfate concentrations. These data together along with ORP around -150 mV indicates that some sulfate reduction was occurring.
Summary Overall, the Mg(OH)2/BCR4 treatment performed similarly to the SAPS/BCR2 treatment but not as good as the Chitorem/BCR3 treatment with respect to sulfate reducing conditions and Fe and Zn removal. The Mg(OH)2/BCR4 treatment had slightly better overall removal efficiency for Fe and Zn compared to the SAPS/BCR2 treatment, but was still unable to reliably remove these metals to meet standards. Removal efficiency of Al, Be, Cd, Cu, Pb, and Tl in the Mg(OH)2/BCR4 treatment was similar to both the SAPS/BCR2 and Chitorem/BCR3. Based on the sulfate, sulfide, and ORP data, some sulfate reduction appeared to have occurred in BCR4 in the first half of the study. Although there were numerous operational issues with the Mg(OH)2 barrel, dosing of BCR4 with a soluble alkaline material appears to have resulted in the greatest pH increase. The greater pH may have helped promote the sulfate reduction process; however, the high mineral acidity from Fe and Mn could not be buffered by the treatment system to sustain the process.
Barker Hughesville Danny T Treatability Study Technical Memorandum 4-32

Section 4 • Results, Analysis, and Discussion
After the average flow rate change on 9/4, the 9/16 sample showed some moderate improvement in Fe, Ni, and Zn MRE. This improvement was coupled with going from net acidic to net alkaline conditions in both the Mg(OH)2 and BCR4 barrel. A non-routine site visit was conducted on 9/11 to complete the Chitorem substrate modification activity. The Mg(OH)2 dosing system was observed to be plugged and a batch Mg(OH)2 dose was added at this time. The moderate improvement in MRE and alkalinity balance could be due to the additional maintenance activity and/or the decrease in average flow rate. Insufficient time remained in the season to evaluate treatment effectiveness further after the flow modification.
4.2.6 Post-Treatment Oxidation Tests Post-treatment oxidation tests were conducted on one of the BCR effluents during the last five sample events. Samples were aerated by a variety of methods. The post-treatment oxidation data are shown in Table 4.2-5 including the field parameters and BOD, ammonia, and sulfide. Interim DO measurements were taken to track the oxidation test progress for some of the sampling events. As discussed in Section 2.2.2.6, various methods were utilized to provide oxidation of the samples. Overall of the methods provided moderate increases in DO concentrations, with variable results. On 7/23 DO was increased by 3 mg/L, while on 8/19 DO was increased by 2.11 mg/L, and on 9/16 DO was increased by 1.92 mg/L. Each of these larger increases observed were for BCR2 samples. The remaining two tests were for BCR3 samples, which resulted in a decrease in DO or a small increase less than 1 mg/L.
With exception to the 9/16 test that had all non-detect BOD results, BOD slightly increased from the original split sample to the oxidized sample. The opposite result was anticipated since oxidation can result in a decrease in BOD; however, the small BOD increases could be within the relative accuracy/precision of the analytical method. Ammonia concentrations also increased for all samples with exception to the 9/16 test. In contrast, sulfide concentrations decreased in the 7/23, 8/7, and 9/4 tests while the 8/19 and 9/16 tests had non-detect concentrations. The oxidation of sulfide can occur by biotic and abiotic mechanisms with breakdown products to elemental sulfur or to sulfate or off-gassing of hydrogen sulfide if present.
These results show that aeration alone without establishing an aerobic biological consortium is not sufficient to reduce these secondary contaminants in the BCR effluents. After the initial oxidation, more time is necessary for settling and development of aerobic heterotopic communities to consume the BOD. Post-treatment using an aerobic wetland would improve removal of BOD and the other contaminants, and also reduce any higher pH values. Passive aeration by cascading, followed by an aerobic wetland can be implemented. The wetland would contain a variety of riparian native plant species and the associated aerobic microorganisms that can consume the ammonia through conversion to nitrate, degrade the BOD into cellular material and minerals, aid in the oxidation of sulfide, and increase oxygen concentrations through plant respiration. The plant communities would also help consume phosphorous present in the BCR effluent and may remove and/or filter trace dissolved and suspended metals.
4.2.7 Substrate Leach Tests Modified SPLP data for the organic compost, wood chips, sawdust, and Chitorem materials are provided in Table 4.2-6. The SPLP test was modified to provide a greater amount of solid to synthetic precipitation water (3:1 ratio) versus the standard 20:1 ratio of solid to water. This approach provides
Barker Hughesville Danny T Treatability Study Technical Memorandum 4-33
Section 4 • Results, Analysis, and Discussion
a more realistic approach of what metals would leach immediately upon contact with a slightly acidic water. The SPLP method does not simulate the reaction mechanisms in a BCR, but it does provide a surrogate test to determine which metals are immediately soluble.
Review of the SPLP data illustrates a correlation with some of the effluent metal results observed from the pre-treatment and BCR barrels. In particular, the incubation samples showed that the all of the BCR barrels and the SAPS barrel had elevated Ba concentrations, presumably from the organic substrates. The Chitorem barrel also had elevated Ba initially. The SPLP data shows that Ba leached from all of the substrates tested with the most significant concentrations in the Chitorem (2,000 µg/L) and compost (500 µg/L). Based on these data, the greater incubation sample concentrations of Ba in the BCR and SAPS barrels can be linked to the compost used in the substrate mixture.
For the Chitorem barrel, leaching of As, Co, and Ni were also observed in the incubation samples followed by decreases in concentrations. For SPLP As was 1,600 µg/L, Co was 72 µg/L, and Ni was 680 µg/L. These were the highest concentrations detected compared to the other substrates and are likely the reason for the elevated concentrations detected in both the Chitorem and subsequent BCR3 barrel at the beginning of the study. Elevated Cd (190 µg/L), Cu (840 µg/L), and Zn (1,900 µg/L) SPLP concentrations were also detected in the Chitorem. In the Chitorem and BCR3 barrels, the greatest dissolved and total concentrations for these metals were detected in the incubation samples followed by decreases for the remainder of the study. The high concentrations in the incubation samples could be linked to the initial leaching from the Chitorem substrate.
Overall, although there appears to be a leaching issue associated with the Chitorem material initially, this leaching is limited to the initial incubation and concentrations are adequately removed to low concentrations for the remainder of the study. The only exception to this trend is for As. Compared to the other BCRs, BCR3 that followed the Chitorem barrel never successfully reduced As concentrations below the human health standard.
Barker Hughesville Danny T Treatability Study Technical Memorandum 4-34

Section 5 Conclusions and Recommendations This section summarizes the conclusions of the bench-scale and pilot-scale treatability studies and presents recommendations for modifications to the pilot-scale setup and operation for year 2 in summer 2014.
5.1 Bench-Scale Treatability Study Conclusions The bench-scale treatability study consisted of five steps: 1) oxidation; 2) alkaline titrations; 3) hydraulic tests; 4) pre-treatment columns; and 5) BCR treatment. The DO in the MIW remained near saturation and there was no visual change in the sample (i.e. no Fe precipitation) during the oxidation test. The results of this step suggest that further oxidation of the raw water does not promote precipitation of solids under the laboratory conditions and for the water tested. However, these results do not eliminate the possibility that some Fe precipitation could be promoted by oxidation, particularly with a MIW that contains much higher and unstable Fe concentrations at the tested pH values.
Treatment of MIW was tested using three different alkaline materials at two different pH values (pre-treatment at 4.5 su and conventional treatment at 9.5 su). Of the three pre-treatment materials, Chitorem provided the best overall treatment performance for metal removal. Each pre-treatment material effectively removed Fe and Pb (greater than 90 percent for dissolved and between 50 and 90 percent for total), but total concentrations of these metals exceeded standards. Al and As also had moderate removal efficiencies. Most metals which previously exceeded standards in the raw MIW still exceeded some or all of the same standards. However, Fe and Pb concentrations decreased significantly and likely accounted for much of the sludge measured in the Imhoff cone tests. As a result, much of the Fe was removed prior to entering the SAPS columns which would reduce clogging of the substrate material.
Of the two conventional treatment materials, the NaOH solution removed metals slightly more effectively than the Ca(OH)2 solution. Most dissolved concentrations of metals decreased to trace or non-detect levels. Most exceedances were for total metals. In a conventional alkaline addition process, neutralized water would be clarified or filtered prior to discharge which would remove the total metal load.
The next step of the column study involved passing water through pre-treatment columns. Many metals concentrations were reduced below water quality standards or at detection limits, some of which were above the water quality standards. Al, Fe, Pb, and Zn concentrations were removed at greater than 90 percent efficiency. However, some of the Fe and Pb was removed previously by the alkaline pre-treatment. Co and Cu were removed in the upper 70 to upper 80 percent range. Because sulfate reduction has not occurred, removal of metals occurred as a result of sorption and oxy-hydroxide and/or carbonate precipitation reactions within the substrate media. If allowed to run longer, removal of Al, Co, Cu, Zn, and other metals is not suspected to be maintained as the organic substrate sorption sites would eventually become saturated with metals, substrate-armoring would occur, and the available buffering capacity of the substrate would be diminished. As concentrations actually increased suggesting the element is naturally occurring in some of the various substrate
Barker Hughesville Danny T Treatability Study Technical Memorandum 5-1

Section 5 • Conclusions and Recommendations
materials. The column effluent pH increased to neutral, alkalinity increased, and the DO decreased to less than 1 mg/L. Overall, of the three SAPS pre-treatment columns there was no apparent difference in MRE or other parameter changes between the SAPS with alkaline addition pre-treatments (Columns #1 and #2) and the SAPS alone (Column #3). Column #4 had some improvement in metal removal such as Al and Zn compared to the SAPS columns, but less efficient at removal of Cd and Cu and also leached more As.
The final step of the study was to treat the column effluents in the BCR containers. As a result of the majority of metals being removed in the columns, most metals either saw 1) little to no change in dissolved concentrations suggesting that they sorbed to substrate media or reacted to form precipitates, or 2) showed increased concentrations suggesting the metals leached from the BCR substrates. Only Cu saw additional polishing of metal concentrations as a result of the BCRs. The parameters for sulfate reduction were either not maintained after six weeks of incubation at the time of sampling or not achieved at all. Reasons for why sulfate reduction could not be maintained in the BCRs may have been due to acidity overloading from the substrate, lack of sufficient metals (reactants) to sustain the reaction, or lack of other conditions amenable to SRB.
Overall, almost all metals were completely removed in the pre-treatment columns. The pre-treatments by alkaline addition, SAPS, and Chitorem columns were intended to primarily reduce concentrations of major metals such as Al and Fe, co-precipitate other metals in small amounts with the Al and Fe, raise pH, and reduce DO. The BCR would then remove the remainder of trace metals through the sulfate reduction process. The pre-treatment columns contained a large amount of very soluble alkalinity in the form of calcium carbonate, which quickly neutralized the MIW and removed most metals. In time, the quickly soluble fraction would reduce and the pre-treatment would only be able to remove a small fraction of metals rather than as the predominant treatment.
Lower detection limits of some metals, including Al, Cd, Fe, and Tl would be required to determine if exceedances actually occurred on some samples throughout the bench-scale treatability study as the detection limits were greater than the standards. This was mostly an issue for the pre-treatment column effluent samples. The pre-treatment columns removed a much greater amount of metals than expected or desired; therefore, not reporting data at low detection levels does not necessarily have a great effect on conclusions of the study as a whole.
The approximate porosity of the SAPS columns was measured in Step 3, hydraulic testing. This testing determined the overall porosity of the limestone, manure, and compost as one unit. Porosity of each substrate by itself was not tested and neither was the porosity of the Chitorem and sand mixture. These data are being collected by others in related experiments. The porosity of the limestone, manure, and compost ranged from 51.4 to 54.1 percent between the two tests. The retention time could not be estimated within the columns because they would not flow freely by gravity.
5.2 Pilot-Scale Treatability Study Conclusions Although the Chitorem barrel had hydraulic flow issues, the Chitorem/BCR3 treatment provided the best overall treatment performance for both metal removal and sustaining sulfate reducing conditions. The Chitorem/BCR3 treatment had the lowest sustained negative ORP, some of highest pH values (second to BCR4), the highest sulfide and alkalinity concentrations, and the greatest sulfate concentration reduction. A net alkaline condition was maintained throughout the study which is one of the key elements to sustaining sulfate reducing conditions in a BCR.
Barker Hughesville Danny T Treatability Study Technical Memorandum 5-2

Section 5 • Conclusions and Recommendations
Most important for water treatment concerns, the Chitorem/BCR3 treatment removed all of the major metals to below water quality standards or to non-detect concentrations after the initial incubation sample. The only exception is As. Arsenic was treated to lower concentrations than in the influent; however, treatment to concentrations below the human health standard was not attained. In comparison, BCRs 2 and 4 in combination with their pre-treatments both removed As to concentrations below the human health standard after the incubation sample. BCR1 treated As to concentrations below the human health standard for some of the sampling events. The difference in As treatment in BCR3 is due to the observed leaching from the Chitorem substrate, and may vary within tests due to the benthic environment of the original marine animals from which the Chitorem is produced.
BCRs 1, 2, and 4 successfully removed Be, Cd, Cu, Pb, and Tl to below water quality standards or to non-detect concentrations. BCR1 did not sustain sulfate reducing conditions, did not effectively remove Fe, Ni, and Zn, and had the lowest overall pH values compared to other BCRs. BCR1 removed a significant amount of Al although not to concentrations below the aquatic standards. In contrast, the Chitorem/BCR3 treatment was successful at removing all of these metals as described above.
The SAPS/BCR2 treatment performed slightly better than BCR1 in terms of sulfate reduction parameters and metal removal. BCR2 had occasional negative ORP values after the incubation sample, generated more sulfide and alkalinity, and had a greater pH than BCR1. The SAPS/BCR2 also had greater removal of Al, As, Co, Fe, Ni, and Zn than BCR1 alone. However, MRE for Co and Ni in BCR2 toward the latter half of the study was very low or negative and Fe and Zn removal was not sufficient enough to meet water quality standards. Overall, the SAPS/BCR2 treatment did not sustain sulfate reducing conditions and net alkaline conditions to drive the reaction were difficult to maintain.
The Mg(OH)2 solution dosing system had repeated issues with peristaltic pump tubing collapse/clogging. This issue resulted in inconsistent dosing of the pre-treatment barrel throughout the study. Despite this limitation, the Mg(OH)2/BCR4 treatment performed similarly to the SAPS/BCR2 treatment, with some differences. BCR 4 had the highest pH in the latter half of the study compared to all other barrels. This condition may have been a result of overloading of residual Mg(OH)2 at times into BCR4, providing extra buffering capacity. The Mg(OH)2 barrel/BCR4 treatment did result in some sulfide production and sulfate concentration reduction similar to BCR2, although BCR4 produced consistently negative ORP values unlike BCR2. However, a net alkaline condition was difficult to maintain in BCR4 and keep ORP values low enough to provide conditions that promoted sulfate reduction. Most of the major metals (i.e., Al, Be, Cd, Cu, Pb, and Tl) were removed to similar concentrations in BCR4 compared to BCR2. The Mg(OH)2/BCR4 treatment had slightly better overall removal efficiency for Fe and Zn compared to the SAPS/BCR2 treatment, but was still unable to reliably remove these metals to meet standards.
Since sulfate reduction generally did not occur after the incubation period for BCRs 1, 2, and 4, the significant removal of metals such as Cd, Cu, and Pb and partial removal of Fe and Zn were likely dominated by sorption and oxy-hydroxide and/or carbonate precipitation reactions within the substrate media, rather than by sulfate reduction. Had the study been continued for a longer period and sulfate reducing conditions had still not rebounded, removal of these metals is not suspected to be maintained as the organic substrate sorption sites become saturated with metals and/or the available buffering capacity of the substrate is diminished. Reasons for why sulfate reduction could not be maintained in these BCRs may have been due to acidity overloading, low retention time, or lack of the
Barker Hughesville Danny T Treatability Study Technical Memorandum 5-3
Section 5 • Conclusions and Recommendations
correct substrate nutrients to sustain sulfate reduction. Although the average flow rate for these treatments was reduced to two-thirds of the original flow rate on 9/4/13 (25 ml/min), insufficient time remained in the season to evaluate treatment effectiveness after this modification.
Overall, hydraulic performance in the Chitorem/BCR3 performance was poor and the average treatment flow rate was probably much less than the timer valve settings indicated. Despite several attempted maintenance remedies as described in Sections 2.2.4.2 and 4.2.4, flow through the Chitorem barrel remained slower than other barrels and samples were difficult to collect. BCRs 1, 2, and 4 and the SAPS were flowing more freely than the Chitorem/BCR3 treatment even after reducing the average flow rate by two-thirds of the original flow rate on 8/7/13 for the Chitorem/BCR3 treatment (the original average flow rate was 37.5 ml/min). This reduction in flow rate for the Chitorem/BCR3 treatment was implemented approximately one month prior to the same change in all other treatment trains.
The challenges with hydraulic flow through the Chitorem barrel make direct comparison to other barrels difficult. Based on maintenance observations and chemistry data trends, the BCR1, SAPS/BCR2, and Mg(OH)2/BCR4 treatments appear to have been overloaded and the hydraulic retention time too low, while the Chitorem/BCR3 treatment hydraulic retention time was too high. This slower flow in the Chitorem barrel presents some bias because it likely resulted in greater treatment performance for the Chitorem/BCR3 combination. The slower flow also limits the ability to understand what the ideal hydraulic retention should be to achieve this performance and to scale-up the design of the treatment system.
5.3 Recommendations for Year 2 Pilot-Study Changes in the treatability design are needed and recommended for the year 2 pilot study. These modifications are intended to provide information with regard to some inconclusive results for the year 1 study, improve system performance of the BCRs and pre-treatments, and provide design parameters for a potential full-scale treatment system. The year 1 study resulted in some BCRs that had inadequate sulfate reduction, potentially due to overloading or other factors. The study also had hydraulic issues related to the Chitorem barrel and a number of operational issues with the Mg(OH)2 dosing system. The following provides recommendations for changes to the pilot-study design.
5.3.1 Study Time Length Overall, the ability to evaluate year 1 pilot-study performance was limited by the late startup and early shutdown. Modifications to the treatment are recommended to be implemented as early as possible in the spring when the site can be accessed safely. A shorter incubation period is recommended (approximately 1 week) and the system should be started with recycle followed by low flow through operation as soon as possible. It is recommended that the system operation be checked once per week (i.e., collecting field parameters along with checking valves, pumps, mixers, reagents, etc.) to ensure study period time is not lost due to equipment-related issues. Bi-weekly analytical sample collection is still recommended, although the operation and sampling activities should be conducted until weather conditions prevent access to the site or cause freezing conditions. Ideally, a minimum of 3 months of testing operation are recommended.
Barker Hughesville Danny T Treatability Study Technical Memorandum 5-4

Section 5 • Conclusions and Recommendations
5.3.2 BCR Modifications Revisions to the substrates and treatment trains are recommended for year 2. As summarized above, BCRs 1, 2, and 4 and the SAPS appear to have been overloaded with acidity and could not maintain sulfate reduction. In addition, less manure and limestone was utilized than originally designed in the BCRs, and the Chitorem barrel and the alkaline addition system had clogging or permeability issues. Because of these variables, all substrates should be replaced to correct these issues and to also collect a non-biased set of data. This approach will allow all treatments to start at an equal level with changes implemented designed to improve performance.
As detailed in the SAP Addendum Appendix D, calculations were performed for the BCR barrel substrate sizing, flow rate, and hydraulic retention time using Darcy’s Law. Hydraulic retention time was assumed and porosity values were assumed based on bench-scale testing and data from others. For all BCRs, a retention time of 24 hours was assumed to be adequate and a porosity of 40 percent was utilized. The overall average flow rate initially was 37.5 ml/min, based on the batch volume and time intervals. The actual substrate volume utilized was 31.75 gallons based on the raw materials. However, a shrinkage factor should probably be applied to the actual volume once all of these materials are mixed. Assuming 10 percent shrinkage, the volume within each barrel is assumed to be only 28.6 gallons. Using the assumed 40 percent porosity, the reduced substrate volume, and average flow rate, the actual calculated retention time is approximately 19.2 hours. This retention time, on average, was probably somewhat achieved in BCRs 1, 2, and 4. Based on the data presented in this memorandum, this retention time was probably insufficient to maintain treatment. For BCR3, the average retention time was probably much greater than this number, although there is no way to estimate such a value since raw water frequently overflowed out of the vent in the lid of the Chitorem barrel.
Sizing of a BCR treatment system using this basic calculation approach can present risks because the sizing is solely based on an assumed retention time. An alternative sizing approach is recommended based on the approach originally presented in Wildeman et. al. (1993), the recently published Interstate Technology Regulatory Council (ITRC) guidance Biochemical Reactors for Treating Mining-Influenced Water (ITRC 2013), Gusek and Figueroa (2009), and several other references. Overall, approach suggests calculating the BCR substrate volume needed for treatment based on the acidity loading of the MIW influent. The stoichiometric metal acidity load (expressed in units of millimoles acidity/day) is balanced with the rate at which sulfate is reduced and alkalinity is generated by SRB, according to the equations presented in Section 1.2. Published literature sulfate reduction rates expressed in units of millimoles sulfate per cubic meter per day can be used for the calculation. The acidity load is divided by the sulfate reduction rate to obtain the necessary volume.
An important limitation to this sizing approach is that it assumes all alkalinity production needed to balance acidity is generated biotically from the sulfate reduction process. Since limestone is utilized in the substrate, it will contribute alkalinity through dissolution. Therefore, some correction factor could be applied to account for limestone dissolution. Since pre-treatments also neutralize some of the acidity, a correction factor could be applied to BCR sizing based on the assumed acidity reduction achieved by the pre-treatment.
Based on the above discussion and conclusions presented in Section 5.2, the following are recommended for year 2:
Barker Hughesville Danny T Treatability Study Technical Memorandum 5-5

Section 5 • Conclusions and Recommendations
A non-pretreated BCR is not recommended to be implemented for year 2.
For all BCRs utilized in year 2 of this study, substrate composition should be modified to include the originally designed manure volume (20 percent) and to increase the limestone quantity to 30 percent compared to the originally designed quantity. The greater alkalinity content is recommended to provide more buffering of the highly acidic Danny T adit water. The wood chip percentage is recommended to be decreased by 10 percent.
Acidity loading to the BCRs should be decreased. This can be achieved by decreasing the average influent MIW flow rate, which reduces the amount of substrate volume needed for treatment. The flow rate should be decreased so that the acidity load is balanced by the alkalinity generation from sulfate reduction and from limestone dissolution. The flow decrease should also account for acidity loading that is assumed to be removed by the pre-treatment utilized. Data will be generated such as sulfate reduction rate, flow rate, hydraulic retention time, and other parameters that are specific and applicable for each treatment. These data will be utilized for the feasibility study evaluations to scale-up treatment design and estimate treatment costs.
5.3.3 Pre-Treatment Modifications
The SAPS pre-treatment removed a moderate amount of acidity from the influent MIW. Not counting the incubation sample, a range of 30 to 46 percent of the acidity was removed from the SAPS, which would theoretically decrease the volume of BCR substrate needed by a similar amount. In the long-term, the degree of acidity reduction may vary and decrease once the substrate becomes depleted or armored with precipitates. Knowing that the overall SAPS/BCR2 treatment train was undersized with respect to the flow rate, the following are recommended for year 2:
The smaller 30 gallon SAPS pre-treatment barrel should be replaced with a 55-gallon barrel to increase the SAPS substrate volume. The volume increase will provide more surface area for contact with the MIW, more organic matter to reduce oxidation state, and more limestone to provide alkalinity.
As described above, the overall flow rate through the SAPS/BCR2 treatment train should be decreased so that the reactions in BCR2 decrease the acidity load from the influent, while accounting for an assumed reduction in acidity load by the SAPS pre-treatment.
The Chitorem pre-treatment removed almost all of the acidity and most metals while the BCR3 provided only a polishing treatment for some of the metals. Given hydraulic problems encountered, these data do not provide a realistic picture of treatment efficiency by this combined system. Had flow rate been higher on average, the Chitorem barrel may not have been nearly as efficient at decreasing acidity and treating metals. The following changes are recommended for year 2:
The substrate mixture should be modified to reduce the percentage of Chitorem and sand and increase the percentage of inert gravel to increase permeability. The substrate replacement activities in September 2013 indicated that when the original substrate was mixed with 1 part new pea gravel to original substrate, the mixture was not free-draining through a cone. When 2 parts new pea gravel to 1 part original mixture was tested, the mixture was immediately free-draining. In-lieu of additional field testing, a mixture of 1.5 parts new pea gravel to 1 part
Barker Hughesville Danny T Treatability Study Technical Memorandum 5-6

Section 5 • Conclusions and Recommendations
original mixture was implemented assuming this mixture would be free draining enough for the study. A comparison of the original to revised material percentages is provided in Exhibit 5-1.
Exhibit 5-1. Original versus Revised Chitorem Barrel Substrate Percentages Material Original Percent Revised Percent Chitorem 40.0 16.0 Pea Gravel 30.0 72.0 Sand 30.0 12.0 sum 100.0 100.0
The inability for the original substrate mixture to be free draining is a result of the low permeability of the mixture, but also because of the apparent slimy biomass layer that formed during the study. While this material is most likely formed from the protein and leftover animal tissue in the shells, it also assists in microbial consortium development in the early stages of the testing. The main concern with using the revised mixture for the year 2 study is the smaller fraction of Chitorem used than originally recommended by the manufacturer. Since the year 1 study ended too early to verify the effectiveness of this mixture, some basic laboratory tests are recommended to determine if other mixtures with slightly higher Chitorem content will also be free draining. A range of mixtures can be created and tested in a similar cone apparatus to determine the optimum mixture for use in the year 2 study.
Similar to the SAPS recommendation, the larger 55-gallon barrel should be utilized for the Chiotrem pre-treatment. This change will provide the same substrate volume as the SAPS/BCR2 to allow direct comparison of data and development of full-scale design parameters.
When functioning, the alkaline addition pre-treatment removed some of the influent acidity. Results were sporadic and not reliable to draw conclusions about the effectiveness. However, it is well known that alkaline addition using Mg(OH)2 or other bases such as NaOH to pH values around 5.0 su will remove a significant quantity of the iron and aluminum acidity. The following are recommended for year 2:
Consideration should be given to use of NaOH rather than Mg(OH)2. NaOH has disadvantages because of its highly caustic nature and high freezing point; however, these disadvantages may be less severe than the issues encountered with Mg(OH)2. Since Mg(OH)2 is a suspension, more energy and infrastructure may be required to dose the system, and more maintenance/operator presence may be required compared to a NaOH system. Issues with the collapsed tubing should be researched, and possibly a different pump and larger tubing may correct the issue.
5.3.4 Post-Treatment Oxidation Testing As discussed in Section 4.2.6, post-treatment is a necessary component of a complete passive treatment system. Testing a gravity fed aeration system at the low flow rates used in a pilot study can be difficult as flow can stagnate between batch flow intervals and result in more sulfate reduction rather than oxidation. Use of a wetland oxidation pond with live plants may improve this limitation by providing a plant filter and the microbial communities needed to oxidize the secondary contaminants.
Implementation of a combined cascade aeration system with a small wetland pond is recommended for year 2. Effluent water from each of the treatment trains can be combined into a single pipe and
Barker Hughesville Danny T Treatability Study Technical Memorandum 5-7

Section 5 • Conclusions and Recommendations
treated in the system. Since the goal is to remove nutrient and sulfide load, a single combined influent and effluent will test this hypothesis. This approach will also save costs by limiting the required infrastructure and laboratory analyses.
Effluent water can be combined into a 4-inch corrugated pipe, drained downslope by approximately 20 to 50 feet, and cascaded into an open pond. The oxidation pond(s) can be constructed out of small plastic wading pools. Local wetland plants and soil can be excavated from an area selected along Galena Creek (or other optimum location) and transplanted into the downgradient end of the tank. Influent can be sampled prior to the cascade and effluent can be sampled through a bulkhead installed in the side of the tank.
Barker Hughesville Danny T Treatability Study Technical Memorandum 5-8

Section 6 References Al Abed, S. 2013. Personal Communication.
Barnes, H. L. and D.P. Gold. 2008. Pilot Tests of Slurries for In Situ Remediation of Pyrite Weathering Products. Environmental and Engineering Geoscience, Vol. XIV, No.1, pages 31-41. February 2008.
Butler, B.A., M.E. Smith, D.J. Reisman, and J.M. Lazorchak. 2010. Metal Removal Efficiency and Ecotoxoicological Assessment of Field-Scale Passive Treatment Biochemical Reactors. Environmental Toxicology and Chemistry 30:1-8. 2010.
CDM Smith 2007. Laboratory Quality Assurance Plan for the CDM Smith Denver Treatability Laboratory. August.
CDM Smith 2012. Work Plan for Barker Hughesville 2013 Remedial Investigation/Feasibility Study, Amendment 3. Prepared for EPA by CDM Smith. December 2012.
CDM Smith 2013a. Sampling and Analysis Plan, Bench-Scale Test of Passive Treatment of Danny T Adit Discharge. Prepared for EPA by CDM Smith. February 22, 2013.
CDM Smith 2013b. Addendum #1 to Sampling and Analysis Plan, Bench-Scale Test of Passive Treatment of Danny T Adit Discharge. Prepared for EPA by CDM Smith. June 7, 2013.
EPA. 2009. Guidance for Labeling Externally Validated Laboratory Analytical Data for Superfund Use. OSWER No. 9200.1-85. EPA 540-R-08-005. January.
DEQ 2012. DEQ7 Montana Numeric Water Quality Standards. Planning Prevention and Assistance Division, Water Quality Planning Bureau, Water Quality Standards Section. Helena, MT: Montana Department of Environmental Quality. October 2012.
Gusek, J.J., and Figueroa, L.A. 2009. Mitigation of Metal Mining Influenced Water. Society for Mining Metallurgy and Exploration, Lakewood, Colorado.
Hiibel, S.R., Pereyra, L.P., Inman, L.Y., Tischer, A., Reisman, D.J., Reardon, K.F., and Pruden, A. 2008. Microbial community analysis of two field-scale sulfate-reducing bioreactors treating mine drainage. Environ. Microbiol. 10(8):2087-2097.
ITRC 2013. Biochemical Reactors for Treating Mining- Influenced Water. BCR-1. Washington, D.C.: Interstate Technology & Regulatory Council, Biochemical Reactors for Mining-Influenced Waste Team. www.itrcweb.org.
Lindeburg, Michael. 2003. Environmental Engineering Reference Manual, Second Edition. Professional Publications Inc. 2003.
Perrault, E.M., Pereyra, L.P., Hiibel, S., Pruden, A., Reardon, K.F., and Reisman, D.J. 2009. Response and Recovery of Sulfate-Reducing Biochemical Reactors from Aerobic Stress Events. Presented at the 2009
Barker Hughesville Danny T Treatability Study Technical Memorandum 6-1
Revision 0, 2/14/2014

Section 6 • References
National Meeting of the American Society of Mining and Reclamation, Billings, MT New Opportunities to Apply Our Science June 14-19, 2009. R.I. Barnhisel (Ed.) Published by ASMR, 3134 Montavesta Rd., Lexington, KY 40502.
Wildeman, T.R., G.A. Brodie, and J.J. Gusek. 1993. Wetland Design for Mining Operations. Vancouver, B.C.: BiTech Publishing Co.
Reisman, D.J., 2013. Personal Communication.
Younger P.L., Banwart, S.A., Hedin, R.S. 2002. Mine Water, Hydrology, Pollution, Remediation. Kluer Academic Publishers, Dordrecht.
Barker Hughesville Danny T Treatability Study Technical Memorandum 6-2
Revision 0, 2/14/2014

Tables
Barker Hughesville Danny T Treatability Study Technical Memorandum

This page intentionally blank.
Barker Hughesville Danny T Treatability Study Technical Memorandum

Table 4.1‐1Bench‐Scale Analytical Results
Danny T Adit Treatability Study Year 1
Dissolved Q Total Q Dissolved Q Total Q Dissolved Q Total Q Dissolved Q Total Q Dissolved Q Total Q Dissolved Q Total Q Dissolved Q Total QMetals UnitsAluminum ug/L 6,370 6,490 6,250 6,440 5,190 5,240 5,520 5,740 3,810 5,070 121 J 321 100 U 123 JAntimony ug/L 2.5 U 2.5 U 2.5 U 2.5 U 2.5 U 2.5 U 2.5 U 2.5 U 2.5 U 2.5 U 2.5 U 2.5 U 2.5 U 2.5 UArsenic ug/L 5.19 J 14.3 4.81 J 8.1 J 2.96 J 3.1 J 2.5 U 3.04 J 5.06 J 10.1 2.5 U 2.5 U 2.5 U 2.5 UBarium ug/L 25.0 U 25.0 U 25.0 U 25.0 U 25.0 U 25.0 U 25.0 U 25.0 U 25.0 U 25.0 U 25.0 U 25.0 U 25.0 U 25.0 UBeryllium ug/L 10.0 U 10.0 U 10.0 U 10.0 U 10.0 U 10.0 U 10.0 U 10.0 U 10.0 U 10.0 U 10.0 U 10.0 U 10.0 U 10.0 UCadmium ug/L 141 134 138 136 148 138 137 138 129 130 0.5 U 4.49 0.708 J 1.44Calcium ug/L 95,600 94,600 95,900 94,100 95,400 93,200 189,000 185,000 186,000 188,000 90,200 89,700 303,000 296,000Chromium ug/L 5.0 U 5.0 U 5.0 U 5.0 U 5.0 U 5.0 U 5.0 U 5.0 U 5.0 U 5.0 U 5.0 U 5.0 U 5.0 U 5.0 UCobalt ug/L 26.5 25.5 27.7 25.4 27.3 26.2 26.5 25.3 24.4 24.6 0.5 U 0.5 U 0.5 U 0.5 UCopper ug/L 426 J 426 J 421 399 406 402 397 400 307 331 10.0 U 21.2 10.0 U 10.2Iron ug/L 78,000 82,400 79,200 77,900 500 U 11,900 500 U 20,900 500 U 40,800 500 U 2,180 500 U 500 ULead ug/L 87.1 80.3 82.6 74.7 7.52 19.2 18.5 35.8 1.51 28.2 0.5 U 2.41 0.5 U 0.575 JMagnesium ug/L 20,700 20,500 20,900 20,400 20,900 20,300 21,900 21,100 27,900 27,200 17,400 17,100 20,600 19,700Manganese ug/L 90,200 89,700 91,200 89,400 87,100 87,800 89,100 88,300 87,400 88,000 2,690 5,690 3,030 3,770Nickel ug/L 21.8 19.7 26.4 25.9 26.2 23.8 25.2 27.1 21.9 21.9 2.5 U 2.5 U 3.56 J 2.5 UPotassium ug/L 1,250 U 1,250 U 2,110 J 1,630 J 1,440 J 1,250 U 1,320 J 1,250 U 5,190 4,270 J 1,500 J 1,250 U 1,600 J 1,250 USelenium ug/L 4.18 J 8.16 5.14 7.59 8.73 7.23 4.83 J 10.5 4.85 J 7.46 2.5 U 3.22 J 3.56 J 2.5 USilver ug/L 2.5 U 2.5 U 2.5 U 2.5 U 2.5 U 2.5 U 2.5 U 2.5 U 2.5 U 2.5 U 2.5 U 2.5 U 2.5 U 2.5 USodium ug/L 7,930 5,780 8,310 5,980 121,000 123,000 8,260 5,860 22,500 19,000 269,000 266,000 8,260 5,710Thallium ug/L 2.5 U 34.6 2.5 U 6.89 2.5 U 2.83 J 2.5 U 3.33 J 2.5 U 3.46 J 2.5 U 2.5 U 2.5 U 2.5 UVanadium ug/L 10.0 U 10.0 U 10.0 U 10.0 U 10.0 U 10.0 U 10.0 U 10.0 U 10.0 U 10.0 U 10.0 U 10.0 U 10.0 U 10.0 UZinc ug/L 39,800 39,100 40,700 38,700 39,700 39,200 40,000 38,700 37,300 37,100 50.0 U 1,240 57.7 J 268General Chemistry UnitsChloride mg/L 10.0 U 10.0 U 10.0 U 10.0 U 19.4 J 10.0 U 10.0 USulfate as SO4 mg/L 835 841 799 803 829 829 817Fluoride mg/L 1.9 J 1.9 J 1.8 J 2.0 2.4 1.7 J 1.5 JAcidity mg/L 380 340 260 110 240 8.0 4.0 UTotal Alkalinity mg CaCO3 / L 5.0 U 5.0 U 5.0 U 5.0 U 5.0 U 18.3 14.1Bicarbonate Alkalinity mg HCO3 / L 325 297 842Carbonate Alkalinity mg CO3 / LHydroxide Alkalinity mg OH / L 601 418 382Hardness mg/L 324 325 324 562 579 297 842TSS mg/L 1,697 156 248 2.557 2.374Sulfide mg/L 7.75 9.5 9.8BOD mg/L 16.55 7.38 6.37CDM Smith Laboratory UnitsSulfide mg/LAlkalinity mg/LORP mV 563 601 418 382pH su 2.75 2.76 4.5 4.5 4.5 9.5 9.5Conductivity mS/cm 1.722 1.697 2.557 2.374DO mg/L 10.77 7.75 9.5 9.8Temperature oC 7.67 16.55 7.38 6.37Notes:
Blank cell indicates that sample was not measured for that parameter Q = Laboratory qualifier > = Above detection limit (reporting limit shown)
NM ‐ not measured J = Estimated value mg/L = milligrams per literoC = degrees Celcius ORP = oxygen reduction potential DO = dissolved oxygen
U = Below detection limit (detection limit shown) R = Rejected value ug/L = micrograms per liter su = standard units mV = millivolts mS/cm = milliSiemens per centimeter
13BH‐DT‐BENCH‐PH95‐NAOH
Treated to pH 9.5 w/ NaOH Treated to pH 9.5 w/ Lime
13BH‐DT‐BENCH‐PH95‐LIME
DescriptionFraction
Sample NameDate
Treated to pH 4.5 w/ Lime
2/25/2013 2/25/201313BH‐DT‐BENCH‐PH45‐NAOH
Treated to pH 4.5 w/ NaOH
13BH‐DT‐BENCH‐RAW
Raw Water
2/25/201313BH‐BENCH‐OXD
2/25/2013
Oxidized Water
13BH‐DT‐BENCH‐PH45‐LIME 13BH‐DT‐BENCH‐PH45‐CHIT2/26/2013
Treated to pH 4.5 w/ Chitorem
2/26/2013 2/27/2013
1 of 2

Table 4.1‐1Bench‐Scale Analytical Results
Danny T Adit Treatability Study Year 1
Dissolved Q Total Q Dissolved Q Total Q Dissolved Q Total Q Dissolved Q Total Q Dissolved Q Total Q Dissolved Q Total Q Dissolved Q Total Q Dissolved Q Total QMetals UnitsAluminum ug/L 200 U 414 J 200 U 485 J 200 U 414 J 200 U 200 U 240 NM 220 NM 240 NM 200 NMAntimony ug/L 5.0 U 5.0 U 5.0 U 5.0 U 5.0 U 5.0 U 5.0 U 5.0 U NM NM NM NM NM NM NM NMArsenic ug/L 29.3 35.0 27.5 26.7 23.8 27.5 127 104 10.0 NM 9.0 NM 9.0 NM 67.0 NMBarium ug/L 60.4 J 63.3 J 59.3 J 65.7 J 61.0 J 63.4 J 50.0 U 50.0 U 1,690 NM 1,740 NM 1,600 NM 1,750 NMBeryllium ug/L 20.0 U 20.0 U 20.0 U 20.0 U 20.0 U 20.0 U 20.0 U 20.0 U 1.0 U NM 1.0 U NM 1.0 U NM 1.0 U NMCadmium ug/L 1.0 U 1.0 U 1.0 U 1.0 U 1.0 U 1.0 U 2.41 2.38 1.0 U NM 1.0 U NM 1.0 U NM 1.0 U NMCalcium ug/L 99,200 97,200 172,000 169,000 160,000 154,000 198,000 194,000 1,120,000 NM 1,020,000 NM 1,180,000 NM 1,100,000 NMChromium ug/L 10.0 U 10.0 U 10.0 U 10.0 U 10.0 U 10.0 U 24.8 20.4 5.0 U NM 5.0 U NM 5.0 U NM 5.0 NMCobalt ug/L 5.4 5.72 4.35 4.63 3.52 3.65 1.0 U 1.0 U 16.0 NM 18.0 NM 19.0 NM 16.0 NMCopper ug/L 34.9 50.6 26.6 47.7 35.8 64.8 79.8 49.8 22.0 NM 16.0 NM 15.0 NM 23.0 NMIron ug/L 1,000 U 1,000 U 1,000 U 1,000 U 1,000 U 1,000 U 1,000 U 1,000 U 13,700 NM 12,600 NM 14,400 NM 13,600 NMLead ug/L 1.9 J 3.13 1.13 J 2.35 1.0 U 3.79 1.0 U 1.0 U 3.0 NM 2.0 NM 3.0 NM 3.0 NMMagnesium ug/L 65,600 63,200 73,000 71,900 81,800 77,400 103,000 100,000 157,000 NM 158,000 NM 169,000 NM 205,000 NMManganese ug/L 7,270 7,320 17,900 17,900 13,300 13,000 20.0 U 20.0 U 9,900 NM 19,200 NM 16,500 NM 4,940 NMNickel ug/L 16.7 15.0 13.4 15.8 11.7 12.2 26.5 22.8 71.0 NM 67.0 NM 74.0 NM 78.0 NMPotassium ug/L 253,000 239,000 221,000 219,000 231,000 221,000 138,000 128,000 1,090,000 NM 981,000 NM 1,020,000 NM 977,000 NMSelenium ug/L 5.0 U 10.9 11.4 5.0 U 5.0 U 10.7 49.6 34.9 NM NM NM NM NM NM NM NMSilver ug/L 5.0 U 5.0 U 5.0 U 5.0 U 5.0 U 5.0 U 5.0 U 5.0 U 1.0 U NM 1.0 U NM 1.0 U NM 1.0 U NMSodium ug/L 156,000 153,000 52,500 49,300 49,400 43,300 424,000 379,000 162,000 NM 65,000 NM 64,000 NM 271,000 NMThallium ug/L 5.0 U 5.0 U 5.0 U 5.0 U 5.0 U 5.0 U 5.0 U 5.0 U 0.5 U NM 0.5 U NM 0.5 U NM 0.5 U NMVanadium ug/L 48.4 44.4 39.0 29.8 J 37.8 20.5 J 28.3 J 20.0 U NM NM NM NM NM NM NMZinc ug/L 189 J 192 J 301 376 214 242 100 U 100 U 470 NM 450 NM 450 NM 460 NMGeneral Chemistry UnitsChloride mg/L 89.8 90.2 70.3 519 410 260 340 450Sulfate as SO4 mg/L 808 793 801 777 1,000 950 1,000 960Fluoride mg/L 1.3 J 1.2 J 1.0 U 2.3 0.3 0.3 0.2 0.1 UAcidity mg/L 4.0 U 4.0 U 4.0 U 4.0 U 1,200 950 550 640Total Alkalinity mg CaCO3 / L 214 196 235 574 3,100 2,700 3,100 3,500Bicarbonate Alkalinity mg HCO3 / L 3,800 3,300 3,700 4,300Carbonate Alkalinity mg CO3 / L 1.0 U 1.0 U 1.0 U 1.0 UHydroxide Alkalinity mg OH / L 1.0 U 1.0 U 1.0 U 1.0 UHardness mg/L 518 730 737 918 3,444 3,198 3,643 3,591TSS mg/L 1,020 550 1,830 1,400Sulfide mg/L 13.0 3.0 11.0 8.0BOD mg/L 1,788 > 1,782 > 1,785 > 1,791 >CDM Smith Laboratory UnitsSulfide mg/L 0.264 0.318 0.255 0.284Alkalinity mg/L 4,250 4,250 4,080 5,610ORP mV 198 198 163 141 ‐13.8 ‐35.9 ‐35.0 ‐55.1pH su 7.32 7.41 7.55 8.89 4.954 4.934 4.999 5.129Conductivity mS/cm 4.649 4.259 4.05 7.459 6.0 5.62 6.23 7.63DO mg/L 0.71 0.65 0.52 1.2 1.0 U 1.0 U 1.0 U 1.0 UTemperature oC 24.66 25.77 25.16 24.7 16.95 17.1 16.8 16.45Notes:
Blank cell indicates that sample was not measured for that parameter Q = Laboratory qualifier > = Above detection limit (reporting limit shown)
NM ‐ not measured J = Estimated value mg/L = milligrams per literoC = degrees Celcius ORP = oxygen reduction potential DO = dissolved oxygen
U = Below detection limit (detection limit shown) R = Rejected value ug/L = micrograms per liter su = standard units mV = millivolts mS/cm = milliSiemens per centimeter
Pretreated pH 4.5 (NaOH) after SAPS column Post BCR Treatment
Date
Description
13BH‐DT‐BENCH‐SPS‐C1
Pretreated pH 4.5 (lime) after SAPS column
Raw water (no pretreatment) after SAPS column
13BH‐DT‐BENCH‐SPS‐C22/27/2013 2/27/2013 2/27/2013
13BH‐DT‐BENCH‐SPS‐C3
Fraction
Sample Name
Post BCR Treatment
13H‐DT‐Bench‐BCR‐C313BH‐DT‐BENCH‐CHI‐C44/15/20132/27/2013
Post BCR TreatmentRaw water after Chitorem column
13H‐DT‐Bench‐BCR‐C44/15/2013
13H‐DT‐Bench‐BCR‐C14/15/2013 4/15/2013
Post BCR Treatment
13H‐DT‐Bench‐BCR‐C2
2 of 2
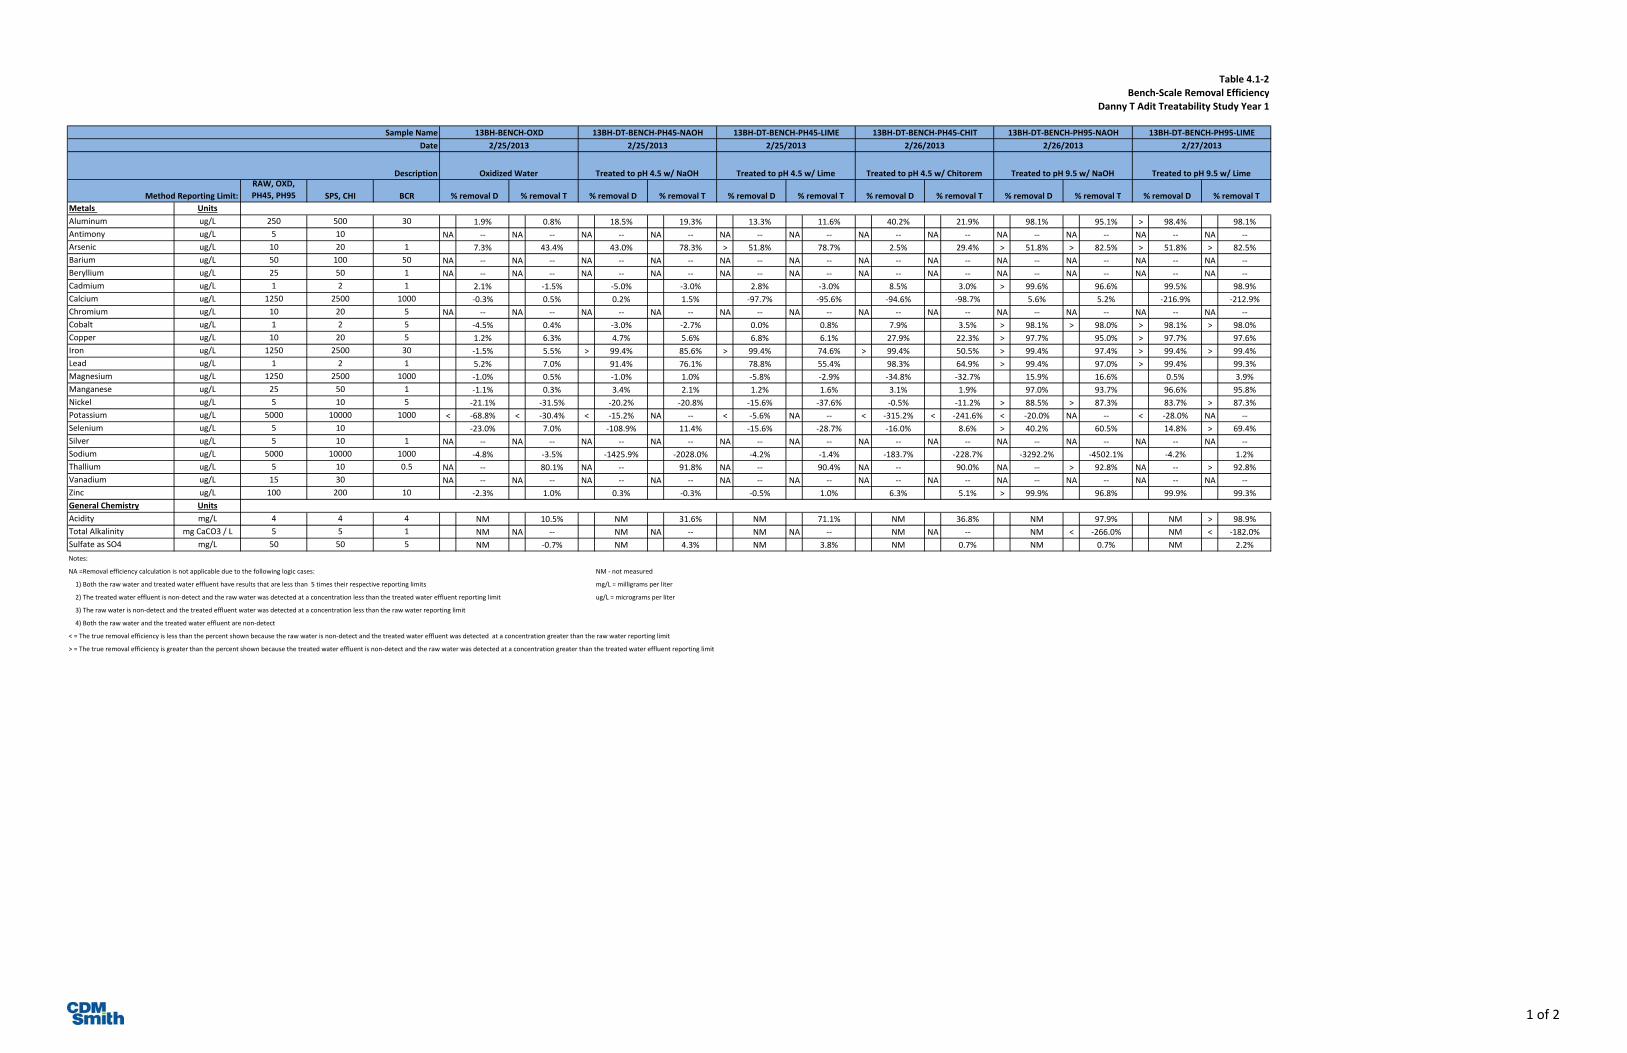
Table 4.1‐2Bench‐Scale Removal Efficiency
Danny T Adit Treatability Study Year 1
RAW, OXD, PH45, PH95 SPS, CHI BCR
Metals UnitsAluminum ug/L 250 500 30 1.9% 0.8% 18.5% 19.3% 13.3% 11.6% 40.2% 21.9% 98.1% 95.1% > 98.4% 98.1%Antimony ug/L 5 10 NA ‐‐ NA ‐‐ NA ‐‐ NA ‐‐ NA ‐‐ NA ‐‐ NA ‐‐ NA ‐‐ NA ‐‐ NA ‐‐ NA ‐‐ NA ‐‐Arsenic ug/L 10 20 1 7.3% 43.4% 43.0% 78.3% > 51.8% 78.7% 2.5% 29.4% > 51.8% > 82.5% > 51.8% > 82.5%Barium ug/L 50 100 50 NA ‐‐ NA ‐‐ NA ‐‐ NA ‐‐ NA ‐‐ NA ‐‐ NA ‐‐ NA ‐‐ NA ‐‐ NA ‐‐ NA ‐‐ NA ‐‐Beryllium ug/L 25 50 1 NA ‐‐ NA ‐‐ NA ‐‐ NA ‐‐ NA ‐‐ NA ‐‐ NA ‐‐ NA ‐‐ NA ‐‐ NA ‐‐ NA ‐‐ NA ‐‐Cadmium ug/L 1 2 1 2.1% ‐1.5% ‐5.0% ‐3.0% 2.8% ‐3.0% 8.5% 3.0% > 99.6% 96.6% 99.5% 98.9%Calcium ug/L 1250 2500 1000 ‐0.3% 0.5% 0.2% 1.5% ‐97.7% ‐95.6% ‐94.6% ‐98.7% 5.6% 5.2% ‐216.9% ‐212.9%Chromium ug/L 10 20 5 NA ‐‐ NA ‐‐ NA ‐‐ NA ‐‐ NA ‐‐ NA ‐‐ NA ‐‐ NA ‐‐ NA ‐‐ NA ‐‐ NA ‐‐ NA ‐‐Cobalt ug/L 1 2 5 ‐4.5% 0.4% ‐3.0% ‐2.7% 0.0% 0.8% 7.9% 3.5% > 98.1% > 98.0% > 98.1% > 98.0%Copper ug/L 10 20 5 1.2% 6.3% 4.7% 5.6% 6.8% 6.1% 27.9% 22.3% > 97.7% 95.0% > 97.7% 97.6%Iron ug/L 1250 2500 30 ‐1.5% 5.5% > 99.4% 85.6% > 99.4% 74.6% > 99.4% 50.5% > 99.4% 97.4% > 99.4% > 99.4%Lead ug/L 1 2 1 5.2% 7.0% 91.4% 76.1% 78.8% 55.4% 98.3% 64.9% > 99.4% 97.0% > 99.4% 99.3%Magnesium ug/L 1250 2500 1000 ‐1.0% 0.5% ‐1.0% 1.0% ‐5.8% ‐2.9% ‐34.8% ‐32.7% 15.9% 16.6% 0.5% 3.9%Manganese ug/L 25 50 1 ‐1.1% 0.3% 3.4% 2.1% 1.2% 1.6% 3.1% 1.9% 97.0% 93.7% 96.6% 95.8%Nickel ug/L 5 10 5 ‐21.1% ‐31.5% ‐20.2% ‐20.8% ‐15.6% ‐37.6% ‐0.5% ‐11.2% > 88.5% > 87.3% 83.7% > 87.3%Potassium ug/L 5000 10000 1000 < ‐68.8% < ‐30.4% < ‐15.2% NA ‐‐ < ‐5.6% NA ‐‐ < ‐315.2% < ‐241.6% < ‐20.0% NA ‐‐ < ‐28.0% NA ‐‐Selenium ug/L 5 10 ‐23.0% 7.0% ‐108.9% 11.4% ‐15.6% ‐28.7% ‐16.0% 8.6% > 40.2% 60.5% 14.8% > 69.4%Silver ug/L 5 10 1 NA ‐‐ NA ‐‐ NA ‐‐ NA ‐‐ NA ‐‐ NA ‐‐ NA ‐‐ NA ‐‐ NA ‐‐ NA ‐‐ NA ‐‐ NA ‐‐Sodium ug/L 5000 10000 1000 ‐4.8% ‐3.5% ‐1425.9% ‐2028.0% ‐4.2% ‐1.4% ‐183.7% ‐228.7% ‐3292.2% ‐4502.1% ‐4.2% 1.2%Thallium ug/L 5 10 0.5 NA ‐‐ 80.1% NA ‐‐ 91.8% NA ‐‐ 90.4% NA ‐‐ 90.0% NA ‐‐ > 92.8% NA ‐‐ > 92.8%Vanadium ug/L 15 30 NA ‐‐ NA ‐‐ NA ‐‐ NA ‐‐ NA ‐‐ NA ‐‐ NA ‐‐ NA ‐‐ NA ‐‐ NA ‐‐ NA ‐‐ NA ‐‐Zinc ug/L 100 200 10 ‐2.3% 1.0% 0.3% ‐0.3% ‐0.5% 1.0% 6.3% 5.1% > 99.9% 96.8% 99.9% 99.3%General Chemistry UnitsAcidity mg/L 4 4 4 NM 10.5% NM 31.6% NM 71.1% NM 36.8% NM 97.9% NM > 98.9%Total Alkalinity mg CaCO3 / L 5 5 1 NM NA ‐‐ NM NA ‐‐ NM NA ‐‐ NM NA ‐‐ NM < ‐266.0% NM < ‐182.0%Sulfate as SO4 mg/L 50 50 5 NM ‐0.7% NM 4.3% NM 3.8% NM 0.7% NM 0.7% NM 2.2%Notes:
NA =Removal efficiency calculation is not applicable due to the following logic cases: NM ‐ not measured
1) Both the raw water and treated water effluent have results that are less than 5 times their respective reporting limits mg/L = milligrams per liter
2) The treated water effluent is non‐detect and the raw water was detected at a concentration less than the treated water effluent reporting limit ug/L = micrograms per liter
3) The raw water is non‐detect and the treated effluent water was detected at a concentration less than the raw water reporting limit
4) Both the raw water and the treated water effluent are non‐detect
< = The true removal efficiency is less than the percent shown because the raw water is non‐detect and the treated water effluent was detected at a concentration greater than the raw water reporting limit
> = The true removal efficiency is greater than the percent shown because the treated water effluent is non‐detect and the raw water was detected at a concentration greater than the treated water effluent reporting limit
Sample Name
Description Oxidized Water
Date 2/25/201313BH‐BENCH‐OXD 13BH‐DT‐BENCH‐PH95‐NAOH
2/26/2013
Treated to pH 9.5 w/ NaOH
13BH‐DT‐BENCH‐PH95‐LIME2/27/2013
Treated to pH 9.5 w/ Lime
13BH‐DT‐BENCH‐PH45‐NAOH
% removal D % removal D% removal T % removal D % removal TMethod Reporting Limit: % removal D % removal T % removal D % removal T% removal D % removal T % removal T
2/25/2013
Treated to pH 4.5 w/ NaOH
13BH‐DT‐BENCH‐PH45‐LIME2/25/2013
Treated to pH 4.5 w/ Lime
13BH‐DT‐BENCH‐PH45‐CHIT2/26/2013
Treated to pH 4.5 w/ Chitorem
1 of 2

Table 4.1‐2Bench‐Scale Removal Efficiency
Danny T Adit Treatability Study Year 1
RAW, OXD, PH45, PH95 SPS, CHI BCR
Metals UnitsAluminum ug/L 250 500 30 > 96.9% 93.6% > 96.9% 92.5% > 96.9% 93.6% > 96.9% > 96.9% 96.2% NM 96.5% NM 96.2% NM 96.9% NMAntimony ug/L 5 10 NA ‐‐ NA ‐‐ NA ‐‐ NA ‐‐ NA ‐‐ NA ‐‐ NA ‐‐ NA ‐‐ < NM < NM < NM < NM < NM < NM < NM < NMArsenic ug/L 10 20 1 NA ‐‐ NA ‐‐ NA ‐‐ NA ‐‐ NA ‐‐ NA ‐‐ ‐2347.0% ‐627.3% ‐92.7% NM ‐73.4% NM ‐73.4% NM ‐1190.9% NMBarium ug/L 50 100 50 NA ‐‐ NA ‐‐ NA ‐‐ NA ‐‐ NA ‐‐ NA ‐‐ NA ‐‐ NA ‐‐ < ‐6660.0% < NM < ‐6860.0% < NM < ‐6300.0% < NM < ‐6900.0% < NMBeryllium ug/L 25 50 1 NA ‐‐ NA ‐‐ NA ‐‐ NA ‐‐ NA ‐‐ NA ‐‐ NA ‐‐ NA ‐‐ NA ‐‐ < NM NA ‐‐ < NM NA ‐‐ < NM NA ‐‐ < NMCadmium ug/L 1 2 1 > 99.3% > 99.3% > 99.3% > 99.3% > 99.3% > 99.3% 98.3% 98.2% > 99.3% NM > 99.3% NM > 99.3% NM > 99.3% NMCalcium ug/L 1250 2500 1000 ‐3.8% ‐2.7% ‐79.9% ‐78.6% ‐67.4% ‐62.8% ‐107.1% ‐105.1% ‐1071.5% NM ‐966.9% NM ‐1134.3% NM ‐1050.6% NMChromium ug/L 10 20 5 NA ‐‐ NA ‐‐ NA ‐‐ NA ‐‐ NA ‐‐ NA ‐‐ NA ‐‐ NA ‐‐ NA ‐‐ < NM NA ‐‐ < NM NA ‐‐ < NM NA ‐‐ < NMCobalt ug/L 1 2 5 79.6% 77.6% 83.6% 81.8% 86.7% 85.7% > 96.2% > 96.1% 39.6% NM 32.1% NM 28.3% NM 39.6% NMCopper ug/L 10 20 5 91.8% 88.1% 93.8% 88.8% 91.6% 84.8% 81.3% 88.3% 94.8% NM 96.2% NM 96.5% NM 94.6% NMIron ug/L 1250 2500 30 > 98.7% > 98.8% > 98.7% > 98.8% > 98.7% > 98.8% > 98.7% > 98.8% 82.4% NM 83.8% NM 81.5% NM 82.6% NMLead ug/L 1 2 1 97.8% 96.1% 98.7% 97.1% > 98.9% 95.3% > 98.9% > 98.8% 96.6% NM 97.7% NM 96.6% NM 96.6% NMMagnesium ug/L 1250 2500 1000 ‐216.9% ‐208.3% ‐252.7% ‐250.7% ‐295.2% ‐277.6% ‐397.6% ‐387.8% ‐658.5% NM ‐663.3% NM ‐716.4% NM ‐890.3% NMManganese ug/L 25 50 1 91.9% 91.8% 80.2% 80.0% 85.3% 85.5% > 99.98% > 99.98% 89.0% NM 78.7% NM 81.7% NM 94.5% NMNickel ug/L 5 10 5 NA ‐‐ NA ‐‐ NA ‐‐ NA ‐‐ NA ‐‐ NA ‐‐ NA ‐‐ NA ‐‐ ‐225.7% NM ‐207.3% NM ‐239.4% NM ‐257.8% NMPotassium ug/L 5000 10000 1000 < ‐20140.0% < ‐19020.0% < ‐17580.0% < ‐17420.0% < ‐18380.0% < ‐17580.0% < ‐10940.0% < ‐10140.0% < ‐87100.0% < NM < ‐78380.0% < NM < ‐81500.0% < NM < ‐78060.0% < NMSelenium ug/L 5 10 NA ‐‐ NA ‐‐ NA ‐‐ NA ‐‐ NA ‐‐ NA ‐‐ NA ‐‐ NA ‐‐ NM NM NM NM NM NM NM NMSilver ug/L 5 10 1 NA ‐‐ NA ‐‐ NA ‐‐ NA ‐‐ NA ‐‐ NA ‐‐ NA ‐‐ NA ‐‐ NA ‐‐ < NM NA ‐‐ < NM NA ‐‐ < NM NA ‐‐ < NMSodium ug/L 5000 10000 1000 ‐1867.2% ‐2547.1% ‐562.0% NA ‐‐ NA ‐‐ NA ‐‐ ‐5246.8% ‐6457.1% ‐1942.9% NM ‐719.7% NM ‐707.1% NM ‐3317.4% NMThallium ug/L 5 10 0.5 NA ‐‐ > 85.5% NA ‐‐ > 85.5% NA ‐‐ > 85.5% NA ‐‐ > 85.5% NA ‐‐ NM NA ‐‐ NM NA ‐‐ NM NA ‐‐ NMVanadium ug/L 15 30 NA ‐‐ NA ‐‐ NA ‐‐ NA ‐‐ NA ‐‐ NA ‐‐ NA ‐‐ NA ‐‐ < NM < NM < NM < NM < NM < NM < NM < NMZinc ug/L 100 200 10 99.5% 99.5% 99.2% 99.0% 99.5% 99.4% > 99.7% > 99.7% 98.8% NM 98.9% NM 98.9% NM 98.8% NMGeneral Chemistry UnitsAcidity mg/L 4 4 4 NM > 98.9% NM > 98.9% NM > 98.9% NM > 98.9% NM ‐215.8% NM ‐150.0% NM ‐44.7% NM ‐68.4%Total Alkalinity mg CaCO3 / L 5 5 1 NM < ‐4180.0% NM < ‐3820.0% NM < ‐4600.0% NM < ‐11380.0% NM < ‐61900.0% NM < ‐53900.0% NM < ‐61900.0% NM < ‐69900.0%Sulfate as SO4 mg/L 50 50 5 NM 3.2% NM 5.0% NM 4.1% NM 6.9% NM ‐19.8% NM ‐13.8% NM ‐19.8% NM ‐15.0%Notes:
NA =Removal efficiency calculation is not applicable due to the following logic cases: NM ‐ not measured
1) Both the raw water and treated water effluent have results that are less than 5 times their respective reporting limits mg/L = milligrams per liter
2) The treated water effluent is non‐detect and the raw water was detected at a concentration less than the treated water effluent reporting limit ug/L = micrograms per liter
3) The raw water is non‐detect and the treated effluent water was detected at a concentration less than the raw water reporting limit
4) Both the raw water and the treated water effluent are non‐detect
< = The true removal efficiency is less than the percent shown because the raw water is non‐detect and the treated water effluent was detected at a concentration greater than the raw water reporting limit
> = The true removal efficiency is greater than the percent shown because the treated water effluent is non‐detect and the raw water was detected at a concentration greater than the treated water effluent reporting limit
13BH‐DT‐BENCH‐SPS‐C3 13H‐DT‐Bench‐BCR‐C44/15/2013
% removal D % removal T % removal D % removal T % removal T% removal D % removal T % removal D % removal T% removal D % removal T % removal D % removal T% removal D % removal T % removal D
13BH‐DT‐BENCH‐SPS‐C12/27/2013
Pretreated pH 4.5 (NaOH) after SAPS column
13H‐DT‐Bench‐BCR‐C24/15/2013
Post BCR Treatment
13H‐DT‐Bench‐BCR‐C14/15/2013
Post BCR Treatment Post BCR Treatment
Sample NameDate
Description
Method Reporting Limit:
2/27/2013
Raw water (no pretreatment) after SAPS column
13H‐DT‐Bench‐BCR‐C34/15/2013
Post BCR Treatment
13BH‐DT‐BENCH‐CHI‐C42/27/2013
Raw water after Chitorem column
13BH‐DT‐BENCH‐SPS‐C22/27/2013
Pretreated pH 4.5 (lime) after SAPS column
2 of 2

Table 4.1‐3Bench‐Scale Comparison to Water Quality Standards
Danny T Adit Treatability Study Year 1
Dissolved Q Total Q Dissolved Q Total Q Dissolved Q Total Q Dissolved Q Total Q Dissolved Q Total Q Dissolved Q Total Q Dissolved Q Total QMetals UnitsAluminum ug/L 6,370 6,490 6,250 6,440 5,190 5,240 5,520 5,740 3,810 5,070 121 J 321 100 U 123 JAntimony ug/L 2.5 U 2.5 U 2.5 U 2.5 U 2.5 U 2.5 U 2.5 U 2.5 U 2.5 U 2.5 U 2.5 U 2.5 U 2.5 U 2.5 UArsenic ug/L 5.19 J 14.3 4.81 J 8.1 J 2.96 J 3.1 J 2.5 U 3.04 J 5.06 J 10.1 2.5 U 2.5 U 2.5 U 2.5 UBarium ug/L 25.0 U 25.0 U 25.0 U 25.0 U 25.0 U 25.0 U 25.0 U 25.0 U 25.0 U 25.0 U 25.0 U 25.0 U 25.0 U 25.0 UBeryllium ug/L 10.0 U 10.0 U 10.0 U 10.0 U 10.0 U 10.0 U 10.0 U 10.0 U 10.0 U 10.0 U 10.0 U 10.0 U 10.0 U 10.0 UCadmium ug/L 141 134 138 136 148 138 137 138 129 130 0.5 U 4.49 0.708 J 1.44Chromium ug/L 5.0 U 5.0 U 5.0 U 5.0 U 5.0 U 5.0 U 5.0 U 5.0 U 5.0 U 5.0 U 5.0 U 5.0 U 5.0 U 5.0 UCopper ug/L 426 J 426 J 421 399 406 402 397 400 307 331 10.0 U 21.2 10.0 U 10.2Iron ug/L 78,000 82,400 79,200 77,900 500 U 11,900 500 U 20,900 500 U 40,800 500 U 2,180 500 U 500 ULead ug/L 87.1 80.3 82.6 74.7 7.52 19.2 18.5 35.8 1.51 28.2 0.5 U 2.41 0.5 U 0.575 JNickel ug/L 21.8 19.7 26.4 25.9 26.2 23.8 25.2 27.1 21.9 21.9 2.5 U 2.5 U 3.56 J 2.5 USelenium ug/L 4.18 J 8.16 5.14 7.59 8.73 7.23 4.83 J 10.5 4.85 J 7.46 2.5 U 3.22 J 3.56 J 2.5 USilver ug/L 2.5 U 2.5 U 2.5 U 2.5 U 2.5 U 2.5 U 2.5 U 2.5 U 2.5 U 2.5 U 2.5 U 2.5 U 2.5 U 2.5 UThallium ug/L 2.5 U 34.6 2.5 U 6.89 2.5 U 2.83 J 2.5 U 3.33 J 2.5 U 3.46 J 2.5 U 2.5 U 2.5 U 2.5 UZinc ug/L 39,800 39,100 40,700 38,700 39,700 39,200 40,000 38,700 37,300 37,100 50.0 U 1,240 57.7 J 268Notes:
Blank cell indicates that sample was not measured for that parameter Q = Laboratory qualifier Flags:
NM ‐ not measured J = Estimated value Text ‐ Exceeds Human Health standard.
U = Below detection limit (reporting limit shown) R = Rejected value Text ‐ Exceeds Chronic Aquatic Life standard.
> = Above detection limit (reporting limit shown) ug/L = micrograms per liter Text ‐ Exceeds Acute Aquatic Life standard.
Sample Name 13BH‐DT‐BENCH‐RAW 13BH‐BENCH‐OXD 13BH‐DT‐BENCH‐PH95‐NAOH 13BH‐DT‐BENCH‐PH95‐LIME13BH‐DT‐BENCH‐PH45‐NAOH 13BH‐DT‐BENCH‐PH45‐CHITDate 2/25/2013 2/25/2013 2/26/2013 2/27/20132/25/2013
13BH‐DT‐BENCH‐PH45‐LIME2/26/2013
Treated to pH 4.5 w/ NaOH Treated to pH 4.5 w/ Chitorem
2/25/2013
Description Raw WaterFraction
Treated to pH 4.5 w/ LimeOxidized Water Treated to pH 9.5 w/ NaOH Treated to pH 9.5 w/ Lime
1 of 2

Table 4.1‐3Bench‐Scale Comparison to Water Quality Standards
Danny T Adit Treatability Study Year 1
Dissolved Q Total Q Dissolved Q Total Q Dissolved Q Total Q Dissolved Q Total Q Dissolved Q Total Q Dissolved Q Total Q Dissolved Q Total Q Dissolved Q Total QMetals UnitsAluminum ug/L 200 U 414 J 200 U 485 J 200 U 414 J 200 U 200 U 240 NM 220 NM 240 NM 200 NMAntimony ug/L 5.0 U 5.0 U 5.0 U 5.0 U 5.0 U 5.0 U 5.0 U 5.0 U NM NM NM NM NM NM NM NMArsenic ug/L 29.3 35.0 27.5 26.7 23.8 27.5 127 104 10.0 NM 9.0 NM 9.0 NM 67.0 NMBarium ug/L 60.4 J 63.3 J 59.3 J 65.7 J 61.0 J 63.4 J 50.0 U 50.0 U 1,690 NM 1,740 NM 1,600 NM 1,750 NMBeryllium ug/L 20.0 U 20.0 U 20.0 U 20.0 U 20.0 U 20.0 U 20.0 U 20.0 U 1.0 U NM 1.0 U NM 1.0 U NM 1.0 U NMCadmium ug/L 1.0 U 1.0 U 1.0 U 1.0 U 1.0 U 1.0 U 2.41 2.38 1.0 U NM 1.0 U NM 1.0 U NM 1.0 U NMChromium ug/L 10.0 U 10.0 U 10.0 U 10.0 U 10.0 U 10.0 U 24.8 20.4 5.0 U NM 5.0 U NM 5.0 U NM 5.0 NMCopper ug/L 34.9 50.6 26.6 47.7 35.8 64.8 79.8 49.8 22.0 NM 16.0 NM 15.0 NM 23.0 NMIron ug/L 1,000 U 1,000 U 1,000 U 1,000 U 1,000 U 1,000 U 1,000 U 1,000 U 13,700 NM 12,600 NM 14,400 NM 13,600 NMLead ug/L 1.9 J 3.13 1.13 J 2.35 1.0 U 3.79 1.0 U 1.0 U 3.0 NM 2.0 NM 3.0 NM 3.0 NMNickel ug/L 16.7 15.0 13.4 15.8 11.7 12.2 26.5 22.8 71.0 NM 67.0 NM 74.0 NM 78.0 NMSelenium ug/L 5.0 U 10.9 11.4 5.0 U 5.0 U 10.7 49.6 34.9 NM NM NM NM NM NM NM NMSilver ug/L 5.0 U 5.0 U 5.0 U 5.0 U 5.0 U 5.0 U 5.0 U 5.0 U 1.0 U NM 1.0 U NM 1.0 U NM 1.0 U NMThallium ug/L 5.0 U 5.0 U 5.0 U 5.0 U 5.0 U 5.0 U 5.0 U 5.0 U 0.5 U NM 0.5 U NM 0.5 U NM 0.5 U NMZinc ug/L 189 J 192 J 301 376 214 242 100 U 100 U 470 NM 450 NM 450 NM 460 NMNotes:
Blank cell indicates that sample was not measured for that parameter Q = Laboratory qualifier Flags:
NM ‐ not measured J = Estimated value Text ‐ Exceeds Human Health standard.
U = Below detection limit (reporting limit shown) R = Rejected value Text ‐ Exceeds Chronic Aquatic Life standard.
> = Above detection limit (reporting limit shown) ug/L = micrograms per liter Text ‐ Exceeds Acute Aquatic Life standard.
13BH‐DT‐BENCH‐SPS‐C3Sample Name 13H‐DT‐Bench‐BCR‐C313BH‐DT‐BENCH‐CHI‐C42/27/2013
13H‐DT‐Bench‐BCR‐C42/27/2013
13BH‐DT‐BENCH‐SPS‐C1 13H‐DT‐Bench‐BCR‐C113BH‐DT‐BENCH‐SPS‐C2 13H‐DT‐Bench‐BCR‐C24/15/20132/27/2013 4/15/2013Date
Pretreated pH 4.5 (NaOH) after SAPS column Post BCR Treatment
4/15/20132/27/2013 4/15/2013
Post BCR TreatmentDescriptionFraction
Pretreated pH 4.5 (lime) after SAPS column Post BCR Treatment
Raw water (no pretreatment) after SAPS column Post BCR TreatmentRaw water after Chitorem column
2 of 2
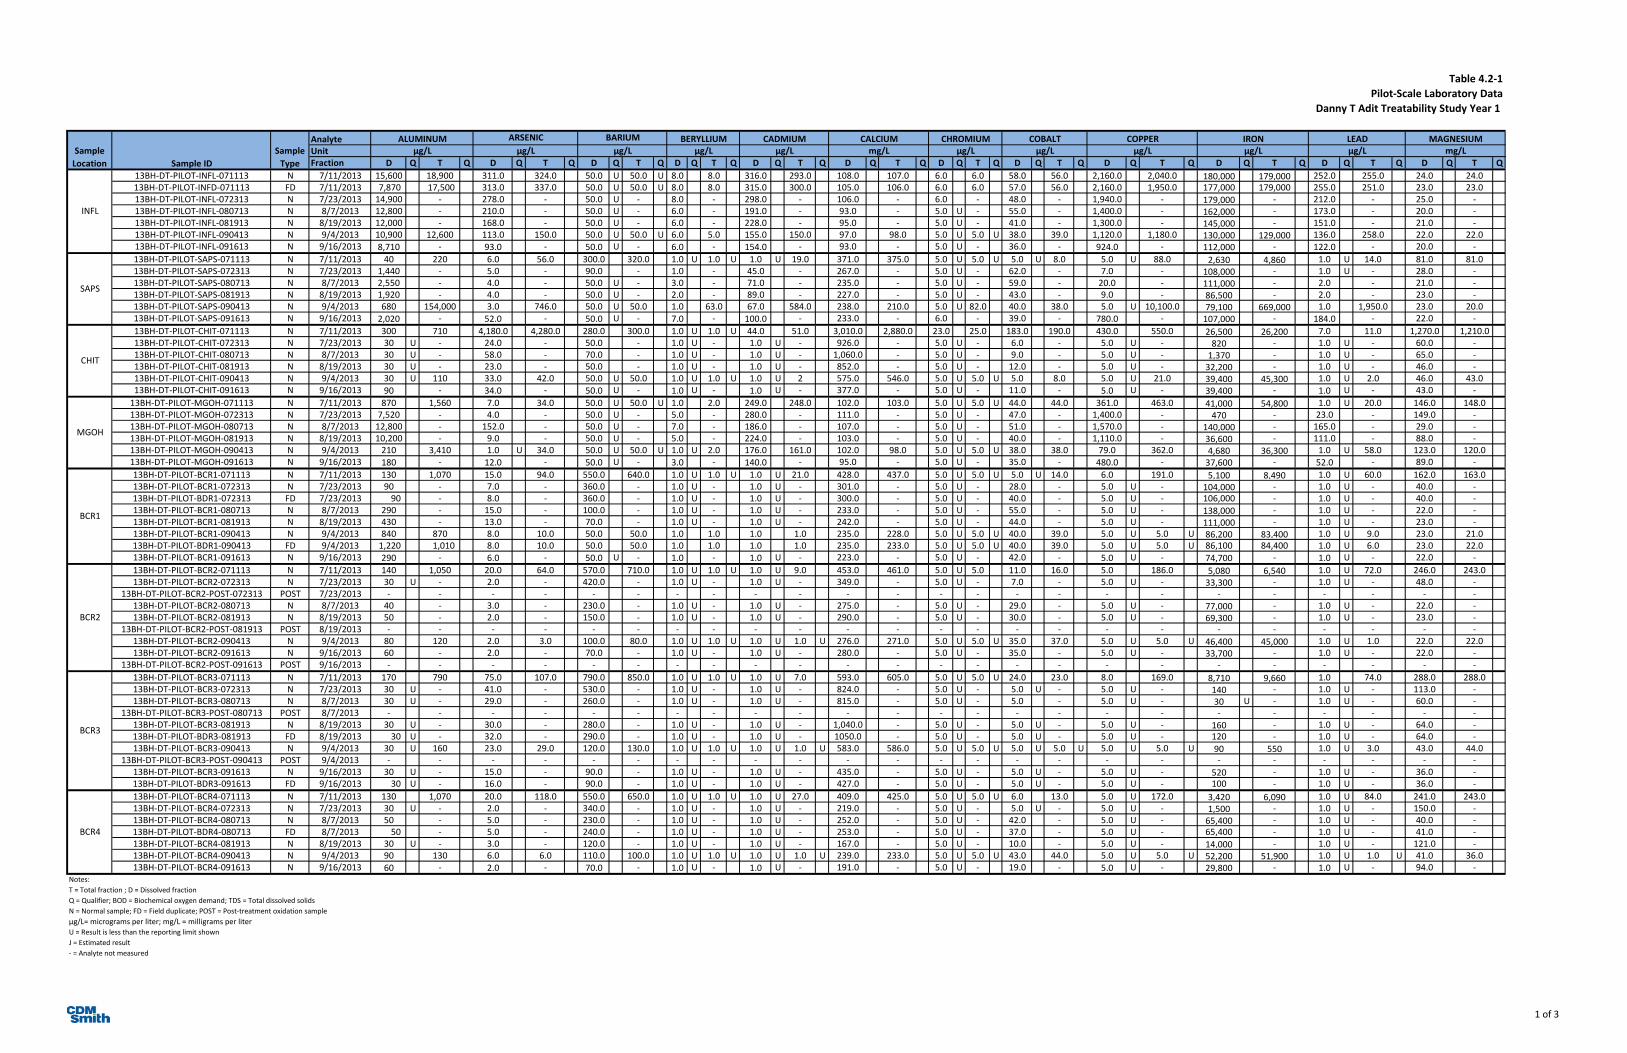
1 of 3
Table 4.2-1Pilot-Scale Laboratory Data
Danny T Adit Treatability Study Year 1
AnalyteUnitFraction D Q T Q D Q T Q D Q T Q D Q T Q D Q T Q D Q T Q D Q T Q D Q T Q D Q T Q D Q T Q D Q T Q D Q T Q
13BH-DT-PILOT-INFL-071113 N 7/11/2013 15,600 18,900 311.0 324.0 50.0 U 50.0 U 8.0 8.0 316.0 293.0 108.0 107.0 6.0 6.0 58.0 56.0 2,160.0 2,040.0 180,000 179,000 252.0 255.0 24.0 24.013BH-DT-PILOT-INFD-071113 FD 7/11/2013 7,870 17,500 313.0 337.0 50.0 U 50.0 U 8.0 8.0 315.0 300.0 105.0 106.0 6.0 6.0 57.0 56.0 2,160.0 1,950.0 177,000 179,000 255.0 251.0 23.0 23.013BH-DT-PILOT-INFL-072313 N 7/23/2013 14,900 - 278.0 - 50.0 U - 8.0 - 298.0 - 106.0 - 6.0 - 48.0 - 1,940.0 - 179,000 - 212.0 - 25.0 -13BH-DT-PILOT-INFL-080713 N 8/7/2013 12,800 - 210.0 - 50.0 U - 6.0 - 191.0 - 93.0 - 5.0 U - 55.0 - 1,400.0 - 162,000 - 173.0 - 20.0 -13BH-DT-PILOT-INFL-081913 N 8/19/2013 12,000 - 168.0 - 50.0 U - 6.0 - 228.0 - 95.0 - 5.0 U - 41.0 - 1,300.0 - 145,000 - 151.0 - 21.0 -13BH-DT-PILOT-INFL-090413 N 9/4/2013 10,900 12,600 113.0 150.0 50.0 U 50.0 U 6.0 5.0 155.0 150.0 97.0 98.0 5.0 U 5.0 U 38.0 39.0 1,120.0 1,180.0 130,000 129,000 136.0 258.0 22.0 22.013BH-DT-PILOT-INFL-091613 N 9/16/2013 8,710 - 93.0 - 50.0 U - 6.0 - 154.0 - 93.0 - 5.0 U - 36.0 - 924.0 - 112,000 - 122.0 - 20.0 -13BH-DT-PILOT-SAPS-071113 N 7/11/2013 40 220 6.0 56.0 300.0 320.0 1.0 U 1.0 U 1.0 U 19.0 371.0 375.0 5.0 U 5.0 U 5.0 U 8.0 5.0 U 88.0 2,630 4,860 1.0 U 14.0 81.0 81.013BH-DT-PILOT-SAPS-072313 N 7/23/2013 1,440 - 5.0 - 90.0 - 1.0 - 45.0 - 267.0 - 5.0 U - 62.0 - 7.0 - 108,000 - 1.0 U - 28.0 -13BH-DT-PILOT-SAPS-080713 N 8/7/2013 2,550 - 4.0 - 50.0 U - 3.0 - 71.0 - 235.0 - 5.0 U - 59.0 - 20.0 - 111,000 - 2.0 - 21.0 -13BH-DT-PILOT-SAPS-081913 N 8/19/2013 1,920 - 4.0 - 50.0 U - 2.0 - 89.0 - 227.0 - 5.0 U - 43.0 - 9.0 - 86,500 - 2.0 - 23.0 -13BH-DT-PILOT-SAPS-090413 N 9/4/2013 680 154,000 3.0 746.0 50.0 U 50.0 1.0 63.0 67.0 584.0 238.0 210.0 5.0 U 82.0 40.0 38.0 5.0 U 10,100.0 79,100 669,000 1.0 1,950.0 23.0 20.013BH-DT-PILOT-SAPS-091613 N 9/16/2013 2,020 - 52.0 - 50.0 U - 7.0 - 100.0 - 233.0 - 6.0 - 39.0 - 780.0 - 107,000 - 184.0 - 22.0 -13BH-DT-PILOT-CHIT-071113 N 7/11/2013 300 710 4,180.0 4,280.0 280.0 300.0 1.0 U 1.0 U 44.0 51.0 3,010.0 2,880.0 23.0 25.0 183.0 190.0 430.0 550.0 26,500 26,200 7.0 11.0 1,270.0 1,210.013BH-DT-PILOT-CHIT-072313 N 7/23/2013 30 U - 24.0 - 50.0 - 1.0 U - 1.0 U - 926.0 - 5.0 U - 6.0 - 5.0 U - 820 - 1.0 U - 60.0 -13BH-DT-PILOT-CHIT-080713 N 8/7/2013 30 U - 58.0 - 70.0 - 1.0 U - 1.0 U - 1,060.0 - 5.0 U - 9.0 - 5.0 U - 1,370 - 1.0 U - 65.0 -13BH-DT-PILOT-CHIT-081913 N 8/19/2013 30 U - 23.0 - 50.0 - 1.0 U - 1.0 U - 852.0 - 5.0 U - 12.0 - 5.0 U - 32,200 - 1.0 U - 46.0 -13BH-DT-PILOT-CHIT-090413 N 9/4/2013 30 U 110 33.0 42.0 50.0 U 50.0 1.0 U 1.0 U 1.0 U 2 575.0 546.0 5.0 U 5.0 U 5.0 8.0 5.0 U 21.0 39,400 45,300 1.0 U 2.0 46.0 43.013BH-DT-PILOT-CHIT-091613 N 9/16/2013 90 - 34.0 - 50.0 U - 1.0 U - 1.0 U - 377.0 - 5.0 U - 11.0 - 5.0 U - 39,400 - 1.0 U - 43.0 -
13BH-DT-PILOT-MGOH-071113 N 7/11/2013 870 1,560 7.0 34.0 50.0 U 50.0 U 1.0 2.0 249.0 248.0 102.0 103.0 5.0 U 5.0 U 44.0 44.0 361.0 463.0 41,000 54,800 1.0 U 20.0 146.0 148.013BH-DT-PILOT-MGOH-072313 N 7/23/2013 7,520 - 4.0 - 50.0 U - 5.0 - 280.0 - 111.0 - 5.0 U - 47.0 - 1,400.0 - 470 - 23.0 - 149.0 -13BH-DT-PILOT-MGOH-080713 N 8/7/2013 12,800 - 152.0 - 50.0 U - 7.0 - 186.0 - 107.0 - 5.0 U - 51.0 - 1,570.0 - 140,000 - 165.0 - 29.0 -13BH-DT-PILOT-MGOH-081913 N 8/19/2013 10,200 - 9.0 - 50.0 U - 5.0 - 224.0 - 103.0 - 5.0 U - 40.0 - 1,110.0 - 36,600 - 111.0 - 88.0 -13BH-DT-PILOT-MGOH-090413 N 9/4/2013 210 3,410 1.0 U 34.0 50.0 U 50.0 U 1.0 U 2.0 176.0 161.0 102.0 98.0 5.0 U 5.0 U 38.0 38.0 79.0 362.0 4,680 36,300 1.0 U 58.0 123.0 120.013BH-DT-PILOT-MGOH-091613 N 9/16/2013 180 - 12.0 - 50.0 U - 3.0 - 140.0 - 95.0 - 5.0 U - 35.0 - 480.0 - 37,600 - 52.0 - 89.0 -13BH-DT-PILOT-BCR1-071113 N 7/11/2013 130 1,070 15.0 94.0 550.0 640.0 1.0 U 1.0 U 1.0 U 21.0 428.0 437.0 5.0 U 5.0 U 5.0 U 14.0 6.0 191.0 5,100 8,490 1.0 U 60.0 162.0 163.013BH-DT-PILOT-BCR1-072313 N 7/23/2013 90 - 7.0 - 360.0 - 1.0 U - 1.0 U - 301.0 - 5.0 U - 28.0 - 5.0 U - 104,000 - 1.0 U - 40.0 -13BH-DT-PILOT-BDR1-072313 FD 7/23/2013 90 - 8.0 - 360.0 - 1.0 U - 1.0 U - 300.0 - 5.0 U - 40.0 - 5.0 U - 106,000 - 1.0 U - 40.0 -13BH-DT-PILOT-BCR1-080713 N 8/7/2013 290 - 15.0 - 100.0 - 1.0 U - 1.0 U - 233.0 - 5.0 U - 55.0 - 5.0 U - 138,000 - 1.0 U - 22.0 -13BH-DT-PILOT-BCR1-081913 N 8/19/2013 430 - 13.0 - 70.0 - 1.0 U - 1.0 U - 242.0 - 5.0 U - 44.0 - 5.0 U - 111,000 - 1.0 U - 23.0 -13BH-DT-PILOT-BCR1-090413 N 9/4/2013 840 870 8.0 10.0 50.0 50.0 1.0 1.0 1.0 1.0 235.0 228.0 5.0 U 5.0 U 40.0 39.0 5.0 U 5.0 U 86,200 83,400 1.0 U 9.0 23.0 21.013BH-DT-PILOT-BDR1-090413 FD 9/4/2013 1,220 1,010 8.0 10.0 50.0 50.0 1.0 1.0 1.0 1.0 235.0 233.0 5.0 U 5.0 U 40.0 39.0 5.0 U 5.0 U 86,100 84,400 1.0 U 6.0 23.0 22.013BH-DT-PILOT-BCR1-091613 N 9/16/2013 290 - 6.0 - 50.0 U - 1.0 - 1.0 U - 223.0 - 5.0 U - 42.0 - 5.0 U - 74,700 - 1.0 U - 22.0 -13BH-DT-PILOT-BCR2-071113 N 7/11/2013 140 1,050 20.0 64.0 570.0 710.0 1.0 U 1.0 U 1.0 U 9.0 453.0 461.0 5.0 U 5.0 11.0 16.0 5.0 186.0 5,080 6,540 1.0 U 72.0 246.0 243.013BH-DT-PILOT-BCR2-072313 N 7/23/2013 30 U - 2.0 - 420.0 - 1.0 U - 1.0 U - 349.0 - 5.0 U - 7.0 - 5.0 U - 33,300 - 1.0 U - 48.0 -
13BH-DT-PILOT-BCR2-POST-072313 POST 7/23/2013 - - - - - - - - - - - - - - - - - - - - - - - -13BH-DT-PILOT-BCR2-080713 N 8/7/2013 40 - 3.0 - 230.0 - 1.0 U - 1.0 U - 275.0 - 5.0 U - 29.0 - 5.0 U - 77,000 - 1.0 U - 22.0 -13BH-DT-PILOT-BCR2-081913 N 8/19/2013 50 - 2.0 - 150.0 - 1.0 U - 1.0 U - 290.0 - 5.0 U - 30.0 - 5.0 U - 69,300 - 1.0 U - 23.0 -
13BH-DT-PILOT-BCR2-POST-081913 POST 8/19/2013 - - - - - - - - - - - - - - - - - - - - - - - -13BH-DT-PILOT-BCR2-090413 N 9/4/2013 80 120 2.0 3.0 100.0 80.0 1.0 U 1.0 U 1.0 U 1.0 U 276.0 271.0 5.0 U 5.0 U 35.0 37.0 5.0 U 5.0 U 46,400 45,000 1.0 U 1.0 22.0 22.013BH-DT-PILOT-BCR2-091613 N 9/16/2013 60 - 2.0 - 70.0 - 1.0 U - 1.0 U - 280.0 - 5.0 U - 35.0 - 5.0 U - 33,700 - 1.0 U - 22.0 -
13BH-DT-PILOT-BCR2-POST-091613 POST 9/16/2013 - - - - - - - - - - - - - - - - - - - - - - - -13BH-DT-PILOT-BCR3-071113 N 7/11/2013 170 790 75.0 107.0 790.0 850.0 1.0 U 1.0 U 1.0 U 7.0 593.0 605.0 5.0 U 5.0 U 24.0 23.0 8.0 169.0 8,710 9,660 1.0 74.0 288.0 288.013BH-DT-PILOT-BCR3-072313 N 7/23/2013 30 U - 41.0 - 530.0 - 1.0 U - 1.0 U - 824.0 - 5.0 U - 5.0 U - 5.0 U - 140 - 1.0 U - 113.0 -13BH-DT-PILOT-BCR3-080713 N 8/7/2013 30 U - 29.0 - 260.0 - 1.0 U - 1.0 U - 815.0 - 5.0 U - 5.0 - 5.0 U - 30 U - 1.0 U - 60.0 -
13BH-DT-PILOT-BCR3-POST-080713 POST 8/7/2013 - - - - - - - - - - - - - - - - - - - - - - - -13BH-DT-PILOT-BCR3-081913 N 8/19/2013 30 U - 30.0 - 280.0 - 1.0 U - 1.0 U - 1,040.0 - 5.0 U - 5.0 U - 5.0 U - 160 - 1.0 U - 64.0 -13BH-DT-PILOT-BDR3-081913 FD 8/19/2013 30 U - 32.0 - 290.0 - 1.0 U - 1.0 U - 1050.0 - 5.0 U - 5.0 U - 5.0 U - 120 - 1.0 U - 64.0 -13BH-DT-PILOT-BCR3-090413 N 9/4/2013 30 U 160 23.0 29.0 120.0 130.0 1.0 U 1.0 U 1.0 U 1.0 U 583.0 586.0 5.0 U 5.0 U 5.0 U 5.0 U 5.0 U 5.0 U 90 550 1.0 U 3.0 43.0 44.0
13BH-DT-PILOT-BCR3-POST-090413 POST 9/4/2013 - - - - - - - - - - - - - - - - - - - - - - - -13BH-DT-PILOT-BCR3-091613 N 9/16/2013 30 U - 15.0 - 90.0 - 1.0 U - 1.0 U - 435.0 - 5.0 U - 5.0 U - 5.0 U - 520 - 1.0 U - 36.0 -13BH-DT-PILOT-BDR3-091613 FD 9/16/2013 30 U - 16.0 - 90.0 - 1.0 U - 1.0 U - 427.0 - 5.0 U - 5.0 U - 5.0 U - 100 - 1.0 U - 36.0 -13BH-DT-PILOT-BCR4-071113 N 7/11/2013 130 1,070 20.0 118.0 550.0 650.0 1.0 U 1.0 U 1.0 U 27.0 409.0 425.0 5.0 U 5.0 U 6.0 13.0 5.0 U 172.0 3,420 6,090 1.0 U 84.0 241.0 243.013BH-DT-PILOT-BCR4-072313 N 7/23/2013 30 U - 2.0 - 340.0 - 1.0 U - 1.0 U - 219.0 - 5.0 U - 5.0 U - 5.0 U - 1,500 - 1.0 U - 150.0 -13BH-DT-PILOT-BCR4-080713 N 8/7/2013 50 - 5.0 - 230.0 - 1.0 U - 1.0 U - 252.0 - 5.0 U - 42.0 - 5.0 U - 65,400 - 1.0 U - 40.0 -13BH-DT-PILOT-BDR4-080713 FD 8/7/2013 50 - 5.0 - 240.0 - 1.0 U - 1.0 U - 253.0 - 5.0 U - 37.0 - 5.0 U - 65,400 - 1.0 U - 41.0 -13BH-DT-PILOT-BCR4-081913 N 8/19/2013 30 U - 3.0 - 120.0 - 1.0 U - 1.0 U - 167.0 - 5.0 U - 10.0 - 5.0 U - 14,000 - 1.0 U - 121.0 -13BH-DT-PILOT-BCR4-090413 N 9/4/2013 90 130 6.0 6.0 110.0 100.0 1.0 U 1.0 U 1.0 U 1.0 U 239.0 233.0 5.0 U 5.0 U 43.0 44.0 5.0 U 5.0 U 52,200 51,900 1.0 U 1.0 U 41.0 36.013BH-DT-PILOT-BCR4-091613 N 9/16/2013 60 - 2.0 - 70.0 - 1.0 U - 1.0 U - 191.0 - 5.0 U - 19.0 - 5.0 U - 29,800 - 1.0 U - 94.0 -
Notes:T = Total fraction ; D = Dissolved fractionQ = Qualifier; BOD = Biochemical oxygen demand; TDS = Total dissolved solidsN = Normal sample; FD = Field duplicate; POST = Post-treatment oxidation sampleµg/L= micrograms per liter; mg/L = milligrams per literU = Result is less than the reporting limit shownJ = Estimated result- = Analyte not measured
COBALT COPPER IRON LEADSample
Location Sample ID
CHROMIUM
MGOH
INFL
SAPS
CHIT
BCR4
CADMIUMBERYLLIUMBARIUMALUMINUM ARSENICµg/L µg/L µg/L µg/L µg/L µg/L µg/L µg/LSample
Type
BCR1
BCR2
BCR3
MAGNESIUMCALCIUMmg/L mg/Lµg/L µg/L

2 of 3
AnalyteUnitFraction
13BH-DT-PILOT-INFL-071113 N 7/11/201313BH-DT-PILOT-INFD-071113 FD 7/11/201313BH-DT-PILOT-INFL-072313 N 7/23/201313BH-DT-PILOT-INFL-080713 N 8/7/201313BH-DT-PILOT-INFL-081913 N 8/19/201313BH-DT-PILOT-INFL-090413 N 9/4/201313BH-DT-PILOT-INFL-091613 N 9/16/201313BH-DT-PILOT-SAPS-071113 N 7/11/201313BH-DT-PILOT-SAPS-072313 N 7/23/201313BH-DT-PILOT-SAPS-080713 N 8/7/201313BH-DT-PILOT-SAPS-081913 N 8/19/201313BH-DT-PILOT-SAPS-090413 N 9/4/201313BH-DT-PILOT-SAPS-091613 N 9/16/201313BH-DT-PILOT-CHIT-071113 N 7/11/201313BH-DT-PILOT-CHIT-072313 N 7/23/201313BH-DT-PILOT-CHIT-080713 N 8/7/201313BH-DT-PILOT-CHIT-081913 N 8/19/201313BH-DT-PILOT-CHIT-090413 N 9/4/201313BH-DT-PILOT-CHIT-091613 N 9/16/2013
13BH-DT-PILOT-MGOH-071113 N 7/11/201313BH-DT-PILOT-MGOH-072313 N 7/23/201313BH-DT-PILOT-MGOH-080713 N 8/7/201313BH-DT-PILOT-MGOH-081913 N 8/19/201313BH-DT-PILOT-MGOH-090413 N 9/4/201313BH-DT-PILOT-MGOH-091613 N 9/16/201313BH-DT-PILOT-BCR1-071113 N 7/11/201313BH-DT-PILOT-BCR1-072313 N 7/23/201313BH-DT-PILOT-BDR1-072313 FD 7/23/201313BH-DT-PILOT-BCR1-080713 N 8/7/201313BH-DT-PILOT-BCR1-081913 N 8/19/201313BH-DT-PILOT-BCR1-090413 N 9/4/201313BH-DT-PILOT-BDR1-090413 FD 9/4/201313BH-DT-PILOT-BCR1-091613 N 9/16/201313BH-DT-PILOT-BCR2-071113 N 7/11/201313BH-DT-PILOT-BCR2-072313 N 7/23/2013
13BH-DT-PILOT-BCR2-POST-072313 POST 7/23/201313BH-DT-PILOT-BCR2-080713 N 8/7/201313BH-DT-PILOT-BCR2-081913 N 8/19/2013
13BH-DT-PILOT-BCR2-POST-081913 POST 8/19/201313BH-DT-PILOT-BCR2-090413 N 9/4/201313BH-DT-PILOT-BCR2-091613 N 9/16/2013
13BH-DT-PILOT-BCR2-POST-091613 POST 9/16/201313BH-DT-PILOT-BCR3-071113 N 7/11/201313BH-DT-PILOT-BCR3-072313 N 7/23/201313BH-DT-PILOT-BCR3-080713 N 8/7/2013
13BH-DT-PILOT-BCR3-POST-080713 POST 8/7/201313BH-DT-PILOT-BCR3-081913 N 8/19/201313BH-DT-PILOT-BDR3-081913 FD 8/19/201313BH-DT-PILOT-BCR3-090413 N 9/4/2013
13BH-DT-PILOT-BCR3-POST-090413 POST 9/4/201313BH-DT-PILOT-BCR3-091613 N 9/16/201313BH-DT-PILOT-BDR3-091613 FD 9/16/201313BH-DT-PILOT-BCR4-071113 N 7/11/201313BH-DT-PILOT-BCR4-072313 N 7/23/201313BH-DT-PILOT-BCR4-080713 N 8/7/201313BH-DT-PILOT-BDR4-080713 FD 8/7/201313BH-DT-PILOT-BCR4-081913 N 8/19/201313BH-DT-PILOT-BCR4-090413 N 9/4/201313BH-DT-PILOT-BCR4-091613 N 9/16/2013
Notes:T = Total fraction ; D = Dissolved fractionQ = Qualifier; BOD = Biochemical oxygen demand; TDS = Total dissolved solidsN = Normal sample; FD = Field duplicate; POST = Post-treatment oxidation sampleµg/L= micrograms per liter; mg/L = milligrams per literU = Result is less than the reporting limit shownJ = Estimated result- = Analyte not measured
Sample Location Sample ID
MGOH
INFL
SAPS
CHIT
BCR4
Sample Type
BCR1
BCR2
BCR3
Table 4.2-1 Pilot-Scale Laboratory Data
Danny T Adit Treatability Study Year 1
D Q T Q D Q T Q D Q T Q D Q T Q D Q T Q D Q T Q D Q T Q T Q T Q T Q T Q T Q T Q T Q124,000 129,000 39.0 39.0 1.0 1.0 U 1.0 U 1.0 U 6.0 5.0 2.3 2.5 69,100.0 71,000.0 660 1 U 1 U 1 U 1 U 2 0.563,700 131,000 37.0 39.0 1.0 U 1.0 U 1.0 U 1.0 U 4.0 4.0 3.2 2.6 34,800.0 71,300.0 - - - - - - -128,000 - 37.0 - 1.0 - 1.0 U - 7.0 - 2.2 - 57,400.0 - 820 1 U 1 U 1 U 1 U 1 0.2116,000 - 34.0 - 1.0 - 1.0 U - 7.0 - 2.1 - 53,300.0 - 700 1 U 1 U 1 U 1 U 1 U 0.7 J106,000 - 29.0 - 1.0 - 1.0 U - 7.0 - 1.8 - 51,300.0 - 670 1 U 1 U 1 U 1 U 1 U 0.7103,000 101,000 28.0 29.0 1.0 U 1.0 1.0 U 1.0 U 7.0 5.0 2.2 2.5 47,800.0 45,700.0 510 1 U 1 U 1 U 1 U 2 0.8
98,400 - 30.0 - 1.0 U - 1.0 U - 5.0 - 1.8 - 44,500.0 - 460 1 U 1 U 1 U 1 U 1 U 0.842,400 42,600 5.0 10.0 38.0 38.0 1.0 U 1.0 U 13.0 11.0 0.5 U 0.5 U 70.0 6,050.0 4 U 750 910 1 U 1 U 27 0.8
135,000 - 37.0 - 2.0 - 1.0 U - 7.0 - 0.5 U - 42,900.0 - 440 10 12 1 U 1 U 1 U 1.4120,000 - 42.0 - 1.0 - 1.0 U - 7.0 - 0.8 - 63,200.0 - 450 1 U 1 1 U 1 U 1 U 1.9 J113,000 - 31.0 - 1.0 - 1.0 U - 7.0 - 1.1 - 50,800.0 - 420 42 51 1 U 1 U 1 U 1.6105,000 96,300 29.0 30 1.0 U 1.0 U 1.0 U 1.0 7.0 5.0 2.3 6.7 50,100.0 69,800.0 320 51 62 1 U 1 U 2 1.5
99,000 - 26.0 - 1.0 U - 1.0 U - 5.0 - 2.4 - 53,200.0 - 320 40 49 1 U 1 U 1 U 1.83,110 3,290 1,060.0 1,110.0 1,490.0 1,430.0 1.0 U 1.0 U 6,850.0 6,520.0 0.5 U 0.5 U 1,040.0 1,460.0 4 U 23000 28000 1 U 1 U 12000 0.1 U8,880 - 9.0 - 10.0 - 1.0 U - 42.0 - 0.5 U - 20.0 - 4 U 1800 2200 1 U 1 U 37 0.1
64,300 - 19.0 - 16.0 - 1.0 U - 82.0 - 0.5 U - 50.0 - 4 U 3200 3900 1 U 1 U 190 0.2 J75,000 - 8.0 - 6.0 - 1.0 U - 30.0 - 0.5 U - 20.0 - 4 U 1700 2100 1 U 1 U 31 0.6
113,000 109,000 5.0 8 6.0 6.0 1.0 U 1.0 U 34.0 31.0 0.5 U 0.5 U 60.0 660.0 4 U 1500 1800 1 U 1 U 14 0.694,100 - 15.0 - 5.0 - 1.0 U - 30.0 - 0.5 U - 20.0 - 4 U 620 750 1 U 1 U 16 0.6
100,000 101,000 30.0 31.0 1.0 1.0 U 1.0 U 1.0 U 9.0 8.0 2.1 2.2 47,500.0 47,600.0 330 1 U 1 U 1 U 1 U 4 0.5 U122,000 - 36.0 - 1.0 - 1.0 U - 9.0 - 2.2 - 52,800.0 - 390 1 U 1 U 1 U 1 U 4 1.5117,000 - 34.0 - 1.0 - 1.0 U - 7.0 - 2.0 - 53,100.0 - 700 1 U 1 U 1 U 1 U 1 U 0.8 J109,000 - 28.0 - 1.0 U - 1.0 U - 8.0 - 1.8 - 51,000.0 - 410 1 U 1 U 1 U 1 U 2 1.3102,000 98,800 28.0 27.0 1.0 U 1.0 U 1.0 U 1.0 U 8.0 6.0 2.1 2.2 42,000.0 44,400.0 220 8 9 1 U 1 U 2 1
92,100 - 26.0 - 1.0 U - 1.0 U - 6.0 - 1.7 - 36,200.0 - 4 U 13 16 1 U 1 U 2 U 1.921,700 21,900 22.0 24.0 166.0 169.0 1.0 U 1.0 U 23.0 22.0 0.5 U 0.5 U 50.0 3,690.0 4 U 1400 1700 1 U 1 U 100 0.3
122,000 - 8.0 - 7.0 - 1.0 U - 5.0 - 0.5 U - 60.0 - 270 93 110 1 U 1 U 2 1.3122,000 - 7.0 - 8.0 - 1.0 U - 7.0 - 0.5 U - 90.0 - - - - - - - -122,000 - 36.0 - 2.0 - 1.0 U - 6.0 - 0.5 U - 20,700.0 - 450 76 92 1 U 1 U 1 U 2 J111,000 - 33.0 - 1.0 - 1.0 U - 7.0 - 0.5 U - 36,800.0 - 350 74 91 1 U 1 U 1 U 1.5105,000 102,000 29.0 29.0 1.0 1.0 U 1.0 U 1.0 U 7.0 5.0 0.5 U 0.5 U 35,500.0 34,300.0 230 76 93 1 U 1 U 1 1.3105,000 103,000 30.0 29.0 1.0 U 1.0 U 1.0 U 1.0 U 5.0 5.0 0.5 U 0.5 U 35,900.0 35,200.0 - - - - - - -
98,600 - 30.0 - 1.0 U - 1.0 U - 5.0 - 0.5 U - 39,400.0 - 130 70 85 1 U 1 U 2 U 1.47,260 7,590 35.0 39.0 421.0 424.0 1.0 U 1.0 U 37.0 35.0 0.5 U 0.5 U 40.0 1,580.0 4 U 1700 2000 1 U 1 U 210 0.2
102,000 - 5.0 U - 13.0 - 1.0 U - 7.0 - 0.5 U - 20.0 - 16 200 250 1 U 1 U 3 0.8- - - - - - - - - - - - - - - - - - - - -
127,000 - 14.0 - 2.0 - 1.0 U - 7.0 - 0.5 U - 1,580.0 - 270 110 130 1 U 1 U 1 U 1.9 J113,000 - 16.0 - 1.0 - 1.0 U - 7.0 - 0.5 U - 5,850.0 - 200 110 140 1 U 1 U 1 U 1.6
- - - - - - - - - - - - - - - - - - - - -104,000 102,000 24.0 27.0 1.0 1.0 U 1.0 U 1.0 U 7.0 5.0 0.5 U 0.5 U 12,200.0 15,500.0 120 100 120 1 U 1 U 1 1.4
99,900 - 24.0 - 1.0 U - 1.0 U - 5.0 - 0.5 U - 13,700.0 - 80 110 140 1 U 1 U 2 U 1.5- - - - - - - - - - - - - - - - - - - - -
6,360 6,510 66.0 68.0 379.0 379.0 1.0 U 1.0 U 350.0 346.0 0.5 U 0.5 U 40.0 620.0 4 U 2600 3100 1 U 1 U 450 0.11,720 - 11.0 - 39.0 - 1.0 U - 60.0 - 0.5 U - 20.0 - 4 U 2600 3200 1 U 1 U 96 0.1
13,100 - 8.0 - 17.0 - 1.0 U - 39.0 - 0.5 U - 20.0 - 4 U 2200 2700 1 U 1 U 61 0.1 J- - - - - - - - - - - - - - - - - - - - -
48,600 - 5.0 U - 14.0 - 1.0 U - 49.0 - 0.5 U - 20.0 - 4 U 2600 3200 1 U 1 U 63 0.248,300 - 5.0 U - 14.0 - 1.0 U - 48.0 - 0.5 U - 10.0 U - - - - - - - -60,000 61,200 5.0 U 5.0 U 8.0 8.0 1.0 U 1.0 U 26.0 25.0 0.5 U 0.5 10.0 U 30.0 4 U 1700 2100 1 U 1 U 31 0.4
- - - - - - - - - - - - - - - - - - - - -61,300 - 5.0 U - 6.0 - 1.0 U - 24.0 - 0.5 U - 40.0 - 4 U 1300 1600 1 U 1 U 8 0.5
61,900 - 5.0 U - 4.0 - 1.0 U - 23.0 - 0.5 U - 10.0 U - - - - - - - -11,000 11,600 29.0 32.0 227.0 231.0 1.0 U 1.0 U 31.0 29.0 0.5 U 0.5 U 40.0 3,270.0 4 U 1500 1900 1 U 1 U 140 0.261,100 - 5.0 U - 9.0 - 1.0 U - 9.0 - 0.5 U - 20.0 - 4 U 200 240 1 U 1 U 4 1.2
146,000 - 18.0 - 1.0 - 1.0 U - 5.0 - 0.5 U - 7,360.0 - 260 100 120 1 U 1 U 1 U 1.9 J147,000 - 18.0 - 2.0 - 1.0 U - 7.0 - 0.5 U - 7,080.0 - - - - - - - -
98,100 - 5.0 U - 2.0 - 1.0 U - 8.0 - 0.5 U - 900.0 - 120 96 120 1 U 1 U 1 U 1.4116,000 113,000 29.0 31.0 1.0 1.0 U 1.0 U 1.0 U 7.0 5.0 0.5 U 0.5 U 10,400.0 14,600.0 170 100 120 1 U 1 U 2 1.8
86,400 - 13.0 - 1.0 U - 1.0 U - 6.0 - 0.5 U - 3,290.0 - 68 93 110 1 U 1 U 2 U 1.4
µg/LZINC
µg/L µg/L µg/L µg/LMANGANESE NICKEL SILVER THALLIUM ACIDITY
mg/L as CaCO3SODIUM
mg/Lmg/LPOTASSIUM ALKALINITY
mg/L as CaCO3BICARBONATEmg/L as HCO3
CARBONATEmg/L as CO3
HYDROXIDEmg/L as OH
CHLORIDEmg/L mg/L
FLUORIDE

3 of 3
AnalyteUnitFraction
13BH-DT-PILOT-INFL-071113 N 7/11/201313BH-DT-PILOT-INFD-071113 FD 7/11/201313BH-DT-PILOT-INFL-072313 N 7/23/201313BH-DT-PILOT-INFL-080713 N 8/7/201313BH-DT-PILOT-INFL-081913 N 8/19/201313BH-DT-PILOT-INFL-090413 N 9/4/201313BH-DT-PILOT-INFL-091613 N 9/16/201313BH-DT-PILOT-SAPS-071113 N 7/11/201313BH-DT-PILOT-SAPS-072313 N 7/23/201313BH-DT-PILOT-SAPS-080713 N 8/7/201313BH-DT-PILOT-SAPS-081913 N 8/19/201313BH-DT-PILOT-SAPS-090413 N 9/4/201313BH-DT-PILOT-SAPS-091613 N 9/16/201313BH-DT-PILOT-CHIT-071113 N 7/11/201313BH-DT-PILOT-CHIT-072313 N 7/23/201313BH-DT-PILOT-CHIT-080713 N 8/7/201313BH-DT-PILOT-CHIT-081913 N 8/19/201313BH-DT-PILOT-CHIT-090413 N 9/4/201313BH-DT-PILOT-CHIT-091613 N 9/16/2013
13BH-DT-PILOT-MGOH-071113 N 7/11/201313BH-DT-PILOT-MGOH-072313 N 7/23/201313BH-DT-PILOT-MGOH-080713 N 8/7/201313BH-DT-PILOT-MGOH-081913 N 8/19/201313BH-DT-PILOT-MGOH-090413 N 9/4/201313BH-DT-PILOT-MGOH-091613 N 9/16/201313BH-DT-PILOT-BCR1-071113 N 7/11/201313BH-DT-PILOT-BCR1-072313 N 7/23/201313BH-DT-PILOT-BDR1-072313 FD 7/23/201313BH-DT-PILOT-BCR1-080713 N 8/7/201313BH-DT-PILOT-BCR1-081913 N 8/19/201313BH-DT-PILOT-BCR1-090413 N 9/4/201313BH-DT-PILOT-BDR1-090413 FD 9/4/201313BH-DT-PILOT-BCR1-091613 N 9/16/201313BH-DT-PILOT-BCR2-071113 N 7/11/201313BH-DT-PILOT-BCR2-072313 N 7/23/2013
13BH-DT-PILOT-BCR2-POST-072313 POST 7/23/201313BH-DT-PILOT-BCR2-080713 N 8/7/201313BH-DT-PILOT-BCR2-081913 N 8/19/2013
13BH-DT-PILOT-BCR2-POST-081913 POST 8/19/201313BH-DT-PILOT-BCR2-090413 N 9/4/201313BH-DT-PILOT-BCR2-091613 N 9/16/2013
13BH-DT-PILOT-BCR2-POST-091613 POST 9/16/201313BH-DT-PILOT-BCR3-071113 N 7/11/201313BH-DT-PILOT-BCR3-072313 N 7/23/201313BH-DT-PILOT-BCR3-080713 N 8/7/2013
13BH-DT-PILOT-BCR3-POST-080713 POST 8/7/201313BH-DT-PILOT-BCR3-081913 N 8/19/201313BH-DT-PILOT-BDR3-081913 FD 8/19/201313BH-DT-PILOT-BCR3-090413 N 9/4/2013
13BH-DT-PILOT-BCR3-POST-090413 POST 9/4/201313BH-DT-PILOT-BCR3-091613 N 9/16/201313BH-DT-PILOT-BDR3-091613 FD 9/16/201313BH-DT-PILOT-BCR4-071113 N 7/11/201313BH-DT-PILOT-BCR4-072313 N 7/23/201313BH-DT-PILOT-BCR4-080713 N 8/7/201313BH-DT-PILOT-BDR4-080713 FD 8/7/201313BH-DT-PILOT-BCR4-081913 N 8/19/201313BH-DT-PILOT-BCR4-090413 N 9/4/201313BH-DT-PILOT-BCR4-091613 N 9/16/2013
Notes:T = Total fraction ; D = Dissolved fractionQ = Qualifier; BOD = Biochemical oxygen demand; TDS = Total dissolved solidsN = Normal sample; FD = Field duplicate; POST = Post-treatment oxidation sampleµg/L= micrograms per liter; mg/L = milligrams per literU = Result is less than the reporting limit shownJ = Estimated result- = Analyte not measured
Sample Location Sample ID
MGOH
INFL
SAPS
CHIT
BCR4
Sample Type
BCR1
BCR2
BCR3
Table 4.2-1 Pilot-Scale Laboratory Data
Danny T Adit Treatability Study Year 1
T Q T Q T Q T Q T Q T Q- - 0.1 U 1600 - 1840- - - - - -- - 0.28 2000 - 1860- - 0.478 2200 - 1750- - 0.218 J 1900 - 1600- - 0.225 2500 - 1420- - 0.13 1700 - 1300- - 10.4 600 - 2140- - 0.07 1500 - 1950- - 0.11 1700 - 1870- - 0.125 J 1300 - 1750- - 0.151 1300 - 1580- - 0.05 1200 - 1490- - 47.7 2300 29 51300- - 12.5 1100 - 3980- - 40.2 780 - 6320- - 45.2 J 1100 - 3830- - 65.8 520 - 2770- - 14 730 - 1660- - 0.1 U 1200 - 1800- - 0.1 1600 - 1810- - 0.343 2300 - 1800- - 0.182 J 1400 - 1440- - 0.185 1000 - 1460- - 0.02 990 - 1320- - 43.8 240 4 3730- - 0.81 1200 0.94 1870- - - - - -- - 0.083 1400 0.12 1890- - 0.027 J 1200 0.04 U 1730- - 0.029 1100 0.04 U 1580- - - - - -- - 0.04 1000 0.2 U 1500- - 57.8 480 11 5180
75 3.2 4.77 1200 2.4 189094 5 - 0.47 -- - 0.355 1300 0.7 1800
39 U 0.05 0.196 J 1100 0.04 U 163056 0.08 - - 0.04 U -- - 0.05 1000 0.15 1510
35 U 0.05 U 0.02 980 0.2 U 146035 U 0.05 U - - 0.2 U -- - 72.3 750 11 7300- - 15.3 970 23 4490
1400 166 22 640 112 39701700 237 - - 1.7 -
- - 30.2 J 670 62 4310- - - - - -
1500 179 62.1 350 78 26301600 229 - - 1.3 -
- - 26 600 56 2050- - - - - -- - 46.8 280 4 4590- - 5.66 1100 6.6 1860- - 0.085 1300 0.7 1840- - - - - -
0.04 U - 0.211 J 1000 0.11 1490- - 0.048 1000 0.34 1510- - 0.04 990 0.2 U 1460
BODmg/L
NITROGENmg/L, Ammonia as N
TDSmg/L
PHOSPHORUSmg/L, Orthophosphate as P
SULFATEmg/L
SULFIDEmg/L

1 of 1
Table 4.2-2Pilot-Scale Field Data
Danny T Adit Treatability Study Year 1
Location Date Time Temp (oC) DO (mg/L) DO (%) pH (su) ORP (mV) Conductivity (uS/cm)
Raw Influent (INFL) 7/11/2013 16:20 25.00 6.48 2.81 490.9 2,267Raw Influent (INFL) 7/23/2013 10:30 15.19 3.87 NM 2.93 476.4 1,332Raw Influent (INFL) 8/7/2013 10:25 16.34 NM 42.40 2.94 477.4 2,610Raw Influent (INFL) 8/19/2013 11:30 19.47 3.92 43.7 2.72 482.2 2,218Raw Influent (INFL) 9/4/2013 11:20 21.72 2.41 27.1 2.85 382.6 2,404Raw Influent (INFL) 9/16/2013 12:40 25.14 2.19 26 2.80 492.7 3,394SAPS Pre-treatment (SAPS) 7/11/2013 17:55 21.97 0.09 6.38 -157.6 2,434SAPS Pre-treatment (SAPS) 7/23/2013 11:15 16.76 1.20 NM 5.51 114.3 2,232SAPS Pre-treatment (SAPS) 8/7/2013 10:45 13.38 2.36 22.90 5.11 178.3 2,347SAPS Pre-treatment (SAPS) 8/19/2013 12:25 18.68 2.73 30 5.22 125.7 1,996SAPS Pre-treatment (SAPS) 9/4/2013 11:35 17.74 1.58 15.8 5.22 132.8 2,091SAPS Pre-treatment (SAPS) 9/16/2013 12:50 17.27 4.14 42.6 5.54 135.2 3,011Chitorem Pre-treatment (CHIT) 7/11/2013 18:10 21.52 0.05 6.65 -206.8 60,571Chitorem Pre-treatment (CHIT) 7/23/2013 11:30 19.10 0.25 NM 6.83 -142.0 5,133Chitorem Pre-treatment (CHIT) 8/7/2013 11:00 13.52 3.31 32.9 6.52 -249.8 8,956Chitorem Pre-treatment (CHIT) 8/19/2013 12:45 21.12 3.94 46.4 6.14 -125.1 6,475Chitorem Pre-treatment (CHIT) 9/4/2013 9:53 16.95 3.08 31.9 6.07 -184.7 2,941Chitorem Pre-treatment (CHIT) 9/16/2013 13:00 17.53 1.57 17.1 6.13 -57.3 5,450MGOH Pre-treatment (MGOH) 7/11/2013 18:30 19.28 3.95 NM 5.94 -15.6 1,995MGOH Pre-treatment (MGOH) 7/23/2013 10:00 14.54 2.48 NM 4.63 306.5 2,186MGOH Pre-treatment (MGOH) 8/7/2013 11:15 13.16 2.85 28 3.05 425.0 2,404MGOH Pre-treatment (MGOH) 8/19/2013 13:05 20.33 3.08 34.9 3.68 243.8 1,930MGOH Pre-treatment (MGOH) 9/4/2013 11:45 17.66 3.17 33.9 5.54 114.1 2,058MGOH Pre-treatment (MGOH) 9/16/2013 13:30 16.50 7.22 74 3.69 103.5 3,022BCR1 7/11/2013 16:50 20.60 0.02 NM 6.07 -163.0 3,505BCR1 7/23/2013 12:00 20.07 0.57 NM 6.14 -76.8 2,388BCR1 8/7/2013 11:40 14.95 1.33 13.6 5.70 77.2 2,424BCR1 8/19/2013 13:20 20.25 1.09 12 5.60 35.3 1,992BCR1 9/4/2013 10:25 17.95 1.50 15.9 5.91 -46.6 2,190BCR1 9/16/2013 13:40 19.52 2.31 23 5.67 57.6 3,034BCR2 7/11/2013 17:05 20.20 0.05 NM 6.29 -153.8 4,954BCR2 7/23/2013 12:50 21.15 0.56 NM 6.32 -67.7 2,552BCR2 8/7/2013 11:55 14.75 1.62 16.4 6.02 18.7 2,397BCR2 8/19/2013 13:35 20.45 1.00 1.14 5.91 0.6 2,019BCR2 9/4/2013 10:55 17.67 1.67 17.8 6.16 -28.0 2,187BCR2 9/16/2013 12:15 18.40 8.52 92.1 6.26 19.4 3,224BCR3 7/11/2013 17:20 19.65 0.04 NM 6.17 -152.5 8,162BCR3 7/23/2013 13:45 20.21 0.10 NM 6.81 -267.5 6,424BCR3 8/7/2013 12:15 14.50 2.38 23.5 6.75 -325.7 5,866BCR3 8/19/2013 13:55 21.09 1.95 22.5 6.40 -303.4 7,172BCR3 9/4/2013 9:40 17.84 4.34 46.4 6.17 -274.4 5,154BCR3 9/16/2013 13:50 16.81 2.79 28.3 6.55 -247.5 6,207BCR4 7/11/2013 17:35 20.16 0.02 NM 6.25 -144.8 4,001BCR4 7/23/2013 14:15 19.96 0.21 NM 6.41 -169.1 2,437BCR4 8/7/2013 12:45 16.20 1.64 17.2 6.87 -154.2 2,473BCR4 8/19/2013 14:30 20.33 1.65 18.5 7.02 -171.3 2,018BCR4 9/4/2013 11:10 17.95 2.47 26.3 6.36 -30.2 1,101BCR4 9/16/2013 14:05 16.88 4.35 45.8 6.97 -117.7 3,247

1 of 4
Table 4.2-3Pilot-Scale Removal Efficiency
Danny T Adit Treatability Study Year 1
Location Sample Date
FractionAnalyteMetalsAluminum 99.2% 94.3% 99.4% 97.7% 96.4% 92.3% 93.1% 96.7%Arsenic 95.2% 71.0% 97.5% 92.9% 92.3% 92.9% 93.3% 93.5%Barium < -1000.0% < -1180.0% < -620.0% < -100.0% < -40.0% 0.0% 0.0% NA --Beryllium > 87.5% > 87.5% > 87.5% > 83.3% > 83.3% 83.3% 80.0% 83.3%Cadmium > 99.7% 92.8% > 99.7% > 99.5% > 99.6% 99.4% 99.3% > 99.4%Calcium -296.3% -308.4% -184.0% -150.5% -154.7% -142.3% -132.7% -139.8%Chromium > 16.7% > 16.7% > 16.7% NA -- NA -- NA -- NA -- NA --Cobalt > 91.4% 75.0% 41.7% 0.0% -7.3% -5.3% 0.0% -16.7%Copper 99.7% 90.6% > 99.7% > 99.6% > 99.6% > 99.6% > 99.6% > 99.5%Iron 97.2% 95.3% 41.9% 14.8% 23.4% 33.7% 35.3% 33.3%Lead > 99.6% 76.5% > 99.5% > 99.4% > 99.3% > 99.3% 96.5% > 99.2%Magnesium -575.0% -579.2% -60.0% -10.0% -9.5% -4.5% 4.5% -10.0%Manganese 82.5% 83.0% 4.7% -5.2% -4.7% -1.9% -1.0% -0.2%Nickel 43.6% 38.5% 78.4% -5.9% -13.8% -3.6% 0.0% 0.0%Potassium -16500% < -16800% -600.0% -100.0% 0.0% 0.0% 0.0% NA --Silver NA -- NA -- NA -- NA -- NA -- NA -- NA -- NA --Sodium -283.3% -340.0% 28.6% 14.3% 0.0% 0.0% 0.0% 0.0%Thallium > 78.3% > 80.0% > 77.3% > 76.2% > 72.2% > 77.3% > 80.0% > 72.2%Zinc 99.9% 94.8% 99.9% 61.2% 28.3% 25.7% 24.9% 11.5%Wet ChemistryAcidity > 99.4% 67.1% 35.7% 47.8% 54.9% 71.7%Alkalinity, Total < -139900% < -9200% < -7500% < -7300% < -7500% < -6900%Sulfate 85.0% 40.0% 36.4% 36.8% 56.0% 41.2%
Notes:*Wet chemistry data are the total fractionQ = Laboratory qualifierU = Below detection limit (reporting limit shown)J = Estimated value-- = Parameter not analyzedNA = MRE Calculation is not applicable because both the raw water and the treated water effluent are non-detect.< = The true MRE is less than the percent shown because the raw water is non-detect and the treated water effluent is greater than the reporting limit> = The true MRE is greater than the percent shown because the treated water effluent is non-detect and the raw water is greater than the reporting limit
7/11/2013 8/19/20138/7/2013 9/4/2013
% Removal% Removal % Removal% Removal % Removal % removal% Removal
BCR1 BCR19/4/2013
BCR17/11/2013
BCR19/16/20137/23/2013
BCR1BCR1 BCR1BCR1
Dissolved Dissolved DissolvedTotalTotal% removal
Dissolved Dissolved Dissolved

2 of 4
Table 4.2-3 Pilot-Scale Removal Efficiency
Danny T Adit Treatability Study Year 1
Location Sample Date
FractionAnalyteMetalsAluminum 99.7% 98.8% 90.3% 80.1% 84.0% 93.8% -1122.2% 76.8% 99.1% 94.4% > 99.8% 99.7% 99.6% 99.3% 99.0% 99.3%Arsenic 98.1% 82.7% 98.2% 98.1% 97.6% 97.3% -397.3% 44.1% 93.6% 80.2% 99.3% 98.6% 98.8% 98.2% 98.0% 97.8%Barium < -500.0% < -540.0% < -80.0% NA -- NA -- NA -- 0.0% NA -- < -1040.0% < -1320.0% < -740.0% < -360.0% < -200.0% < -100.0% < -60.0% < -40.0%Beryllium > 87.5% > 87.5% 87.5% 50.0% 66.7% 83.3% -1160.0% -16.7% > 87.5% > 87.5% > 87.5% > 83.3% > 83.3% > 83.3% > 80.0% > 83.3%Cadmium > 99.7% 93.5% 84.9% 62.8% 61.0% 56.8% -289.3% 35.1% > 99.7% 96.9% > 99.7% > 99.5% > 99.6% > 99.4% > 99.3% > 99.4%Calcium -243.5% -250.5% -151.9% -152.7% -138.9% -145.4% -114.3% -150.5% -319.4% -330.8% -229.2% -195.7% -205.3% -184.5% -176.5% -201.1%Chromium > 16.7% > 16.7% > 16.7% NA -- NA -- NA -- < -1540.0% < -20.0% > 16.7% 16.7% > 16.7% NA -- NA -- NA -- NA -- NA --Cobalt > 91.4% 85.7% -29.2% -7.3% -4.9% -5.3% 2.6% -8.3% 81.0% 71.4% 85.4% 47.3% 26.8% 7.9% 5.1% 2.8%Copper > 99.8% 95.7% 99.6% 98.6% 99.3% > 99.6% -755.9% 15.6% 99.8% 90.9% > 99.7% > 99.6% > 99.6% > 99.6% > 99.6% > 99.5%Iron 98.5% 97.3% 39.7% 31.5% 40.3% 39.2% -418.6% 4.5% 97.2% 96.3% 81.4% 52.5% 52.2% 64.3% 65.1% 69.9%Lead > 99.6% 94.5% > 99.5% 98.8% 98.7% 99.3% -655.8% -50.8% > 99.6% 71.8% > 99.5% > 99.4% > 99.3% > 99.3% 99.6% > 99.2%Magnesium -237.5% -237.5% -12.0% -5.0% -9.5% -4.5% 9.1% -10.0% -925.0% -912.5% -92.0% -10.0% -9.5% 0.0% 0.0% -10.0%Manganese 65.8% 67.0% -5.5% -3.4% -6.6% -1.9% 4.7% -0.6% 94.1% 94.1% 20.3% -9.5% -6.6% -1.0% -1.0% -1.5%Nickel 87.2% 74.4% 0.0% -23.5% -6.9% -3.6% -3.4% 13.3% 10.3% 0.0% > 86.5% 58.8% 44.8% 14.3% 6.9% 20.0%Potassium -3700% < -3700% -100.0% 0.0% 0.0% NA -- 0.0% NA -- -42000% < -42300% -1200.0% -100.0% 0.0% 0.0% 0.0% NA --Silver NA -- NA -- NA -- NA -- NA -- NA -- 0.0% NA -- NA -- NA -- NA -- NA -- NA -- NA -- NA -- NA --Sodium -116.7% -120.0% 0.0% 0.0% 0.0% 0.0% 0.0% 0.0% -516.7% -600.0% 0.0% 0.0% 0.0% 0.0% 0.0% 0.0%Thallium > 78.3% > 80.0% > 77.3% 61.9% 38.9% -4.5% -168.0% -33.3% > 78.3% > 80.0% > 77.3% > 76.2% > 72.2% > 77.3% > 80.0% > 72.2%Zinc 99.9% 91.5% 25.3% -18.6% 1.0% -4.8% -52.7% -19.6% 99.9% 97.8% 100.0% 97.0% 88.6% 74.5% 66.1% 69.2%Wet ChemistryAcidity > 99.4% 46.3% 35.7% 37.3% 37.3% 30.4% > 99.4% 98.0% 61.4% 70.1% 76.5% 82.6%Alkalinity, Total < -74900% < -900% NA -- < -4100% < -50 < -3900% < -169900% < -19900% < -10900% < -10900% < -9900% < -10900%Sulfate 62.5% 25.0% 22.7% 31.6% 48.0% 29.4% 70.0% 40.0% 40.9% 42.1% 60.0% 42.4%
Notes:*Wet chemistry data are the total fractionQ = Laboratory qualifierU = Below detection limit (reporting limit shown)J = Estimated value-- = Parameter not analyzedNA = MRE Calculation is not applicable because both the raw water and the treated water effluent are non-detect.< = The true MRE is less than the percent shown because the raw water is non-detect and the treated water effluent is greater than the reporting limit> = The true MRE is greater than the percent shown because the treated water effluent is non-detect and the raw water is greater than the reporting limit
7/11/20138/7/2013SAPS SAPSSAPS SAPS BCR2
9/4/20139/16/20137/11/2013
% Removal% Removal % Removal% Removal% Removal % Removal % removal % Removal % Removal% removal % Removal% removal % Removal % removal% Removal% Removal
BCR29/4/2013 9/16/20138/19/2013
SAPS7/23/2013 8/7/2013
SAPS7/11/2013
SAPS BCR2 BCR29/4/2013
SAPS BCR2BCR27/11/2013
BCR29/4/20137/23/2013
BCR2
Dissolved Dissolved Dissolved Dissolved Dissolved DissolvedTotalTotal Total Total8/19/2013
Dissolved Dissolved Dissolved Dissolved Dissolved Dissolved

3 of 4
Table 4.2-3 Pilot-Scale Removal Efficiency
Danny T Adit Treatability Study Year 1
Location Sample Date
FractionAnalyteMetalsAluminum 98.1% 96.2% > 99.8% > 99.8% > 99.8% > 99.7% 99.1% 99.0% 98.9% 95.8% > 99.8% > 99.8% > 99.8% > 99.7% 98.7% > 99.7%Arsenic -1244.1% -1221.0% 91.4% 72.4% 86.3% 70.8% 72.0% 63.4% 75.9% 67.0% 85.3% 86.2% 82.1% 79.6% 80.7% 83.9%Barium < -460.0% < -500.0% 0.0% < -40.0% 0.0% NA -- 0.0% NA -- < -1480.0% < -1600.0% < -960.0% < -420.0% < -460.0% < -140.0% < -160.0% < -80.0%Beryllium > 87.5% 87.5% > 87.5% > 83.3% > 83.3% > 83.3% > 80.0% > 83.3% > 87.5% > 87.5% > 87.5% > 83.3% > 83.3% > 83.3% > 80.0% > 83.3%Cadmium 86.1% 82.6% > 99.7% > 99.5% > 99.6% > 99.4% 98.7% > 99.4% > 99.7% 97.6% > 99.7% > 99.5% > 99.6% > 99.4% > 99.3% > 99.4%Calcium -2687.0% -2591.6% -773.6% -1039.8% -796.8% -492.8% -457.1% -305.4% -449.1% -465.4% -677.4% -776.3% -994.7% -501.0% -498.0% -367.7%Chromium -283.3% -316.7% > 16.7% NA -- NA -- NA -- NA -- NA -- > 16.7% > 16.7% > 16.7% NA -- NA -- NA -- NA -- NA --Cobalt -215.5% -239.3% 87.5% 83.6% 70.7% 86.8% 79.5% 69.4% 58.6% 58.9% > 89.6% 90.9% > 87.8% > 86.8% > 87.2% > 86.1%Copper 80.1% 73.0% > 99.7% > 99.6% > 99.6% > 99.6% 98.2% > 99.5% 99.6% 91.7% > 99.7% > 99.6% > 99.6% > 99.6% > 99.6% > 99.5%Iron 85.3% 85.4% 99.5% 99.2% 77.8% 69.7% 64.9% 64.8% 95.2% 94.6% 99.9% > 100.0% 99.9% 99.9% 99.6% 99.5%Lead 97.2% 95.7% > 99.5% > 99.4% > 99.3% > 99.3% 99.2% > 99.2% 99.6% 71.0% > 99.5% > 99.4% > 99.3% > 99.3% 98.8% > 99.2%Magnesium -5191.7% -4941.7% -140.0% -225.0% -119.0% -109.1% -95.5% -115.0% -1100.0% -1100.0% -352.0% -200.0% -204.8% -95.5% -100.0% -80.0%Manganese 97.5% 97.4% 93.1% 44.6% 29.2% -9.7% -7.9% 4.4% 94.9% 95.0% 98.7% 88.7% 54.2% 41.7% 39.4% 37.7%Nickel -2617.9% -2746.2% 75.7% 44.1% 72.4% 82.1% 72.4% 50.0% -69.2% -74.4% 70.3% 76.5% > 82.8% > 82.1% > 82.8% > 83.3%Potassium -148900% < -142900% -900.0% -1500.0% -500.0% < -500.0% -500.0% < -400.0% -37800% < -37800% -3800.0% -1600.0% -1300.0% < -700.0% -700.0% < -500.0%Silver NA -- NA -- NA -- NA -- NA -- NA -- NA -- NA -- NA -- NA -- NA -- NA -- NA -- NA -- NA -- NA --Sodium -114067% -130300% -500.0% -1071.4% -328.6% -385.7% -520.0% -500.0% -5733.3% -6820.0% -757.1% -457.1% -600.0% -271.4% -400.0% -380.0%Thallium > 78.3% > 80.0% > 77.3% > 76.2% > 72.2% > 77.3% > 80.0% > 72.2% > 78.3% > 80.0% > 77.3% > 76.2% > 72.2% > 77.3% 80.0% > 72.2%Zinc 98.5% 97.9% 100.0% 99.9% 100.0% 99.9% 98.6% 100.0% 99.9% 99.1% 100.0% 100.0% 100.0% > 100.0% 99.9% 99.9%Wet Chemistry*Acidity > 99.4% > 99.5% > 99.4% > 99.4% > 99.2% > 99.1% > 99.4% > 99.5% > 99.4% > 99.4% > 99.2% > 99.1%Alkalinity, Total < -2299900% < -179900% < -319900% < -169900% < -149900% < -61900% < -259900% < -259900% < -219900% < -259900% < -169900% < -129900%Sulfate -43.8% 45.0% 64.5% 42.1% 79.2% 57.1% 53.1% 51.5% 70.9% 64.7% 86.0% 64.7%
Notes:*Wet chemistry data are the total fractionQ = Laboratory qualifierU = Below detection limit (reporting limit shown)J = Estimated value-- = Parameter not analyzedNA = MRE Calculation is not applicable because both the raw water and the treated water effluent are non-detect.< = The true MRE is less than the percent shown because the raw water is non-detect and the treated water effluent is greater than the reporting limit> = The true MRE is greater than the percent shown because the treated water effluent is non-detect and the raw water is greater than the reporting limit
7/23/2013 9/4/20137/11/2013
% Removal % Removal % Removal % Removal% Removal% Removal % Removal% removal % Removal% removal % Removal% removal % Removal% Removal% Removal
9/16/20137/11/2013CHIT
9/4/2013 9/16/2013 7/11/2013BCR3CHIT
8/19/2013BCR3
8/7/2013CHIT
7/11/2013CHITCHIT BCR3 BCR3CHIT BCR3
9/4/2013BCR3
8/19/20138/7/2013CHITCHIT BCR3
Dissolved Dissolved TotalDissolved Total Dissolved Dissolved Dissolved Dissolved Dissolved DissolvedTotal
BCR39/4/2013
Total% removal
Dissolved Dissolved7/23/2013
Dissolved

4 of 4
Table 4.2-3 Pilot-Scale Removal Efficiency
Danny T Adit Treatability Study Year 1
Location Sample Date
FractionAnalyteMetalsAluminum 94.4% 91.7% 49.5% 0.0% 15.0% 98.1% 72.9% 97.9% 99.2% 94.3% > 99.8% 99.6% > 99.8% 99.2% 99.0% 99.3%Arsenic 97.7% 89.5% 98.6% 27.6% 94.6% > 99.1% 77.3% 87.1% 93.6% 63.6% 99.3% 97.6% 98.2% 94.7% 96.0% 97.8%Barium NA -- NA -- NA -- NA -- NA -- NA -- NA -- NA -- < -1000.0% < -1200.0% < -580.0% < -360.0% < -140.0% < -120.0% < -100.0% < -40.0%Beryllium 87.5% 75.0% 37.5% -16.7% 16.7% > 83.3% 60.0% 50.0% > 87.5% > 87.5% > 87.5% > 83.3% > 83.3% > 83.3% > 80.0% > 83.3%Cadmium 21.2% 15.4% 6.0% 2.6% 1.8% -13.5% -7.3% 9.1% > 99.7% 90.8% > 99.7% > 99.5% > 99.6% > 99.4% > 99.3% > 99.4%Calcium 5.6% 3.7% -4.7% -15.1% -8.4% -5.2% 0.0% -2.2% -278.7% -297.2% -106.6% -171.0% -75.8% -146.4% -137.8% -105.4%Chromium > 16.7% > 16.7% > 16.7% NA -- NA -- NA -- NA -- NA -- > 16.7% > 16.7% > 16.7% NA -- NA -- NA -- NA -- NA --Cobalt 24.1% 21.4% 2.1% 7.3% 2.4% 0.0% 2.6% 2.8% 89.7% 76.8% > 89.6% 23.6% 75.6% -13.2% -12.8% 47.2%Copper 83.3% 77.3% 27.8% -12.1% 14.6% 92.9% 69.3% 48.1% > 99.8% 91.6% > 99.7% > 99.6% > 99.6% > 99.6% > 99.6% > 99.5%Iron 77.2% 69.4% 99.7% 13.6% 74.8% 96.4% 71.9% 66.4% 98.1% 96.6% 99.2% 59.6% 90.3% 59.8% 59.8% 73.4%Lead > 99.6% 92.2% 89.2% 4.6% 26.5% > 99.3% 77.5% 57.4% > 99.6% 67.1% > 99.5% > 99.4% > 99.3% > 99.3% > 99.6% > 99.2%Magnesium -508.3% -516.7% -496.0% -45.0% -319.0% -459.1% -445.5% -345.0% -904.2% -912.5% -500.0% -100.0% -476.2% -86.4% -63.6% -370.0%Manganese 19.4% 21.7% 4.7% -0.9% -2.8% 1.0% 2.2% 6.4% 91.1% 91.0% 52.3% -25.9% 7.5% -12.6% -11.9% 12.2%Nickel 23.1% 20.5% 2.7% 0.0% 3.4% 0.0% 6.9% 13.3% 25.6% 17.9% > 86.5% 47.1% > 82.8% -3.6% -6.9% 56.7%Potassium 0.0% NA -- 0.0% 0.0% 0.0% NA -- 0.0% NA -- -22600.0% < -23000.0% -800.0% 0.0% -100.0% 0.0% 0.0% NA --Silver NA -- NA -- NA -- NA -- NA -- NA -- NA -- NA -- NA -- NA -- NA -- NA -- NA -- NA -- NA -- NA --Sodium -50.0% -60.0% -28.6% 0.0% -14.3% -14.3% -20.0% -20.0% -416.7% -480.0% -28.6% 28.6% -14.3% 0.0% 0.0% -20.0%Thallium 8.7% 12.0% 0.0% 4.8% 0.0% 4.5% 12.0% 5.6% > 78.3% > 80.0% > 77.3% > 76.2% > 72.2% > 77.3% > 80.0% > 72.2%Zinc 31.3% 33.0% 8.0% 0.4% 0.6% 12.1% 2.8% 18.7% 99.9% 95.4% 100.0% 86.2% 98.2% 78.2% 68.1% 92.6%Wet Chemistry*Acidity 50.0% 52.4% 0.0% 38.8% 56.9% > 99.1% > 99.4% > 99.5% 62.9% 82.1% 66.7% 85.2%Alkalinity, Total NA -- NA -- NA -- NA -- < -700% < -1200% < -149900% < -19900% < -9900% < -9500% < -9900% < -9200%Sulfate 25.0% 20.0% -4.5% 26.3% 60.0% 41.8% 82.5% 45.0% 40.9% 47.4% 60.0% 41.8%
Notes:*Wet chemistry data are the total fractionQ = Laboratory qualifierU = Below detection limit (reporting limit shown)J = Estimated value-- = Parameter not analyzedNA = MRE Calculation is not applicable because both the raw water and the treated water effluent are non-detect.< = The true MRE is less than the percent shown because the raw water is non-detect and the treated water effluent is greater than the reporting limit> = The true MRE is greater than the percent shown because the treated water effluent is non-detect and the raw water is greater than the reporting limit
7/11/2013 7/23/20139/16/2013 7/11/2013BCR4BCR4
7/11/2013
% Removal % Removal % Removal% removal % Removal% Removal% Removal % Removal% removal% Removal % Removal% Removal% Removal % Removal
BCR48/19/20138/7/2013
BCR4MGOH BCR49/4/2013 9/16/2013
BCR4
Dissolved DissolvedDissolved Dissolved DissolvedTotal
MGOH9/4/2013
Total% removal
8/19/2013MGOH
7/11/2013MGOH
8/7/2013MGOH
7/23/2013BCR4
9/4/2013Total
% removalDissolved Dissolved Dissolved Dissolved DissolvedTotal
BCR4MGOHMGOHMGOH9/4/2013
Dissolved Dissolved

1 of 2
Table 4.2-4Pilot-Scale Comparison to Water Quality Standards
Danny T Adit Treatability Study Year 1
AnalyteUnitFraction D Q T Q D Q T Q D Q T Q D Q T Q D Q T Q D Q T Q D Q T Q D Q T Q
13BH-DT-PILOT-INFL-071113 7/11/2013 15,600.0 18,900.0 311.0 324.0 50.0 U 50.0 U 8.0 8.0 316.0 293.0 6 6 58 56 2,160.0 2,040.013BH-DT-PILOT-INFL-072313 7/23/2013 14,900.0 - 278.0 - 50.0 U - 8.0 - 298.0 - 6 - 48 - 1,940.0 -13BH-DT-PILOT-INFL-080713 8/7/2013 12,800.0 - 210.0 - 50.0 U - 6.0 - 191.0 - 5 U - 55 - 1,400.0 -13BH-DT-PILOT-INFL-081913 8/19/2013 12,000.0 - 168.0 - 50.0 U - 6.0 - 228.0 - 5 U - 41 - 1,300.0 -13BH-DT-PILOT-INFL-090413 9/4/2013 10,900.0 12,600.0 113.0 150.0 50.0 U 50.0 U 6.0 5.0 155.0 150.0 5 U 5 U 38 39 1,120.0 1,180.013BH-DT-PILOT-INFL-091613 9/16/2013 8,710.0 - 93.0 - 50.0 U - 6.0 - 154.0 - 5 U - 36 - 924.0 -13BH-DT-PILOT-SAPS-071113 7/11/2013 40.0 220.0 6.0 56.0 300.0 320.0 1.0 U 1.0 U 1.0 U 19.0 5 U 5 U 5 U 8 5.0 U 88.013BH-DT-PILOT-SAPS-072313 7/23/2013 1,440.0 - 5.0 - 90.0 - 1.0 - 45.0 - 5 U - 62 - 7.0 -13BH-DT-PILOT-SAPS-080713 8/7/2013 2,550.0 - 4.0 - 50.0 U - 3.0 - 71.0 - 5 U - 59 - 20.0 -13BH-DT-PILOT-SAPS-081913 8/19/2013 1,920.0 - 4.0 - 50.0 U - 2.0 - 89.0 - 5 U - 43 - 9.0 -13BH-DT-PILOT-SAPS-090413 9/4/2013 680.0 154,000.0 3.0 746.0 50.0 U 50.0 1.0 63.0 67.0 584.0 5 U 82 40 38 5.0 U 10,100.013BH-DT-PILOT-SAPS-091613 9/16/2013 2,020.0 - 52.0 - 50.0 U - 7.0 - 100.0 - 6 - 39 - 780.0 -13BH-DT-PILOT-CHIT-071113 7/11/2013 300.0 710.0 4,180.0 4,280.0 280.0 300.0 1.0 U 1.0 U 44.0 51.0 23 25 183 190 430.0 550.013BH-DT-PILOT-CHIT-072313 7/23/2013 30.0 U - 24.0 - 50.0 - 1.0 U - 1.0 U - 5 U - 6 - 5.0 U -13BH-DT-PILOT-CHIT-080713 8/7/2013 30.0 U - 58.0 - 70.0 - 1.0 U - 1.0 U - 5 U - 9 - 5.0 U -13BH-DT-PILOT-CHIT-081913 8/19/2013 30.0 U - 23.0 - 50.0 - 1.0 U - 1.0 U - 5 U - 12 - 5.0 U -13BH-DT-PILOT-CHIT-090413 9/4/2013 30.0 U 110.0 33.0 42.0 50.0 U 50.0 1.0 U 1.0 U 1.0 U 2 5 U 5 U 5 8 5.0 U 21.013BH-DT-PILOT-CHIT-091613 9/16/2013 90.0 - 34.0 - 50.0 U - 1.0 U - 1.0 U - 5 U - 11 - 5.0 U -
13BH-DT-PILOT-MGOH-071113 7/11/2013 870.0 1,560.0 7.0 34.0 50.0 U 50.0 U 1.0 2.0 249.0 248.0 5 U 5 U 44 44 361.0 463.013BH-DT-PILOT-MGOH-072313 7/23/2013 7,520.0 - 4.0 - 50.0 U - 5.0 - 280.0 - 5 U - 47 - 1,400.0 -13BH-DT-PILOT-MGOH-080713 8/7/2013 12,800.0 - 152.0 - 50.0 U - 7.0 - 186.0 - 5 U - 51 - 1,570.0 -13BH-DT-PILOT-MGOH-081913 8/19/2013 10,200.0 - 9.0 - 50.0 U - 5.0 - 224.0 - 5 U - 40 - 1,110.0 -13BH-DT-PILOT-MGOH-090413 9/4/2013 210.0 3,410.0 1.0 U 34.0 50.0 U 50.0 U 1.0 U 2.0 176.0 161.0 5 U 5 U 38 38 79.0 362.013BH-DT-PILOT-MGOH-091613 9/16/2013 180.0 - 12.0 - 50.0 U - 3.0 - 140.0 - 5 U - 35 - 480.0 -13BH-DT-PILOT-BCR1-071113 7/11/2013 130.0 1,070.0 15.0 94.0 550.0 640.0 1.0 U 1.0 U 1.0 U 21.0 5 U 5 U 5 U 14 6.0 191.013BH-DT-PILOT-BCR1-072313 7/23/2013 90.0 - 7.0 - 360.0 - 1.0 U - 1.0 U - 5 U - 28 - 5.0 U -13BH-DT-PILOT-BCR1-080713 8/7/2013 290.0 - 15.0 - 100.0 - 1.0 U - 1.0 U - 5 U - 55 - 5.0 U -13BH-DT-PILOT-BCR1-081913 8/19/2013 430.0 - 13.0 - 70.0 - 1.0 U - 1.0 U - 5 U - 44 - 5.0 U -13BH-DT-PILOT-BCR1-090413 9/4/2013 840.0 870.0 8.0 10.0 50.0 50.0 1.0 1.0 1.0 1.0 5 U 5 U 40 39 5.0 U 5.0 U13BH-DT-PILOT-BCR1-091613 9/16/2013 290.0 - 6.0 - 50.0 U - 1.0 - 1.0 U - 5 U - 42 - 5.0 U -13BH-DT-PILOT-BCR2-071113 7/11/2013 140.0 1,050.0 20.0 64.0 570.0 710.0 1.0 U 1.0 U 1.0 U 9.0 5 U 5 11 16 5.0 186.013BH-DT-PILOT-BCR2-072313 7/23/2013 30.0 U - 2.0 - 420.0 - 1.0 U - 1.0 U - 5 U - 7 - 5.0 U -13BH-DT-PILOT-BCR2-080713 8/7/2013 40.0 - 3.0 - 230.0 - 1.0 U - 1.0 U - 5 U - 29 - 5.0 U -13BH-DT-PILOT-BCR2-081913 8/19/2013 50.0 - 2.0 - 150.0 - 1.0 U - 1.0 U - 5 U - 30 - 5.0 U -13BH-DT-PILOT-BCR2-090413 9/4/2013 80.0 120.0 2.0 3.0 100.0 80.0 1.0 U 1.0 U 1.0 U 1.0 U 5 U 5 U 35 37 5.0 U 5.0 U13BH-DT-PILOT-BCR2-091613 9/16/2013 60.0 - 2.0 - 70.0 - 1.0 U - 1.0 U - 5 U - 35 - 5.0 U -13BH-DT-PILOT-BCR3-071113 7/11/2013 170.0 790.0 75.0 107.0 790.0 850.0 1.0 U 1.0 U 1.0 U 7.0 5 U 5 U 24 23 8.0 169.013BH-DT-PILOT-BCR3-072313 7/23/2013 30.0 U - 41.0 - 530.0 - 1.0 U - 1.0 U - 5 U - 5 U - 5.0 U -13BH-DT-PILOT-BCR3-080713 8/7/2013 30.0 U - 29.0 - 260.0 - 1.0 U - 1.0 U - 5 U - 5 - 5.0 U -13BH-DT-PILOT-BCR3-081913 8/19/2013 30.0 U - 30.0 - 280.0 - 1.0 U - 1.0 U - 5 U - 5 U - 5.0 U -13BH-DT-PILOT-BCR3-090413 9/4/2013 30.0 U 160.0 23.0 29.0 120.0 130.0 1.0 U 1.0 U 1.0 U 1.0 U 5 U 5 U 5 U 5 U 5.0 U 5.0 U13BH-DT-PILOT-BCR3-091613 9/16/2013 30.0 U - 15.0 - 90.0 - 1.0 U - 1.0 U - 5 U - 5 U - 5.0 U -13BH-DT-PILOT-BCR4-071113 7/11/2013 130.0 1,070.0 20.0 118.0 550.0 650.0 1.0 U 1.0 U 1.0 U 27.0 5 U 5 U 6 13 5.0 U 172.013BH-DT-PILOT-BCR4-072313 7/23/2013 30.0 U - 2.0 - 340.0 - 1.0 U - 1.0 U - 5 U - 5 U - 5.0 U -13BH-DT-PILOT-BCR4-080713 8/7/2013 50.0 - 5.0 - 230.0 - 1.0 U - 1.0 U - 5 U - 42 - 5.0 U -13BH-DT-PILOT-BCR4-081913 8/19/2013 30.0 U - 3.0 - 120.0 - 1.0 U - 1.0 U - 5 U - 10 - 5.0 U -13BH-DT-PILOT-BCR4-090413 9/4/2013 90.0 130.0 6.0 6.0 110.0 100.0 1.0 U 1.0 U 1.0 U 1.0 U 5 U 5 U 43 44 5.0 U 5.0 U13BH-DT-PILOT-BCR4-091613 9/16/2013 60.0 - 2.0 - 70.0 - 1.0 U - 1.0 U - 5 U - 19 - 5.0 U -
Notes:T = total fraction ; D = dissolved fraction Flags:Q = Qualifier Text - Exceeds Human Health standard.U = Result is less than the reporting limit shown Text - Exceeds Chronic Aquatic Life standard.- = Analyte not measured Text - Exceeds Acute Aquatic Life standard.
BCR3
BCR4
ALUMINUM ARSENIC
MGOH
BCR1
BCR2
INFL
SAPS
CHIT
µg/L µg/LSample Location Sample ID
BARIUM BERYLLIUMµg/L µg/L µg/L µg/L µg/L µg/L
CADMIUM CHROMIUM COBALT COPPER

2 of 2
Table 4.2-4 Pilot-Scale Comparison to Water Quality Standards
Danny T Adit Treatability Study Year 1
AnalyteUnitFraction D Q T Q D Q T Q D Q T Q D Q T Q D Q T Q D Q T Q D Q T Q
13BH-DT-PILOT-INFL-071113 7/11/2013 180,000 179,000 252.0 255.0 124000 129000 39.0 39.0 1.0 U 1.0 U 2.3 2.5 69,100.0 71,000.013BH-DT-PILOT-INFL-072313 7/23/2013 179,000 - 212.0 - 128000 - 37.0 - 1.0 U - 2.2 - 57,400.0 -13BH-DT-PILOT-INFL-080713 8/7/2013 162,000 - 173.0 - 116000 - 34.0 - 1.0 U - 2.1 - 53,300.0 -13BH-DT-PILOT-INFL-081913 8/19/2013 145,000 - 151.0 - 106000 - 29.0 - 1.0 U - 1.8 - 51,300.0 -13BH-DT-PILOT-INFL-090413 9/4/2013 130,000 129,000 136.0 258.0 103000 101000 28.0 29.0 1.0 U 1.0 U 2.2 2.5 47,800.0 45,700.013BH-DT-PILOT-INFL-091613 9/16/2013 112,000 - 122.0 - 98400 - 30.0 - 1.0 U - 1.8 - 44,500.0 -13BH-DT-PILOT-SAPS-071113 7/11/2013 2,630 4,860 1.0 U 14.0 42400 42600 5.0 10.0 1.0 U 1.0 U 0.5 U 0.5 U 70.0 6,050.013BH-DT-PILOT-SAPS-072313 7/23/2013 108,000 - 1.0 U - 135000 - 37.0 - 1.0 U - 0.5 U - 42,900.0 -13BH-DT-PILOT-SAPS-080713 8/7/2013 111,000 - 2.0 - 120000 - 42.0 - 1.0 U - 0.8 - 63,200.0 -13BH-DT-PILOT-SAPS-081913 8/19/2013 86,500 - 2.0 - 113000 - 31.0 - 1.0 U - 1.1 - 50,800.0 -13BH-DT-PILOT-SAPS-090413 9/4/2013 79,100 669,000 1.0 1,950.0 105000 96300 29.0 30 1.0 U 1.0 2.3 6.7 50,100.0 69,800.013BH-DT-PILOT-SAPS-091613 9/16/2013 107,000 - 184.0 - 99000 - 26.0 - 1.0 U - 2.4 - 53,200.0 -13BH-DT-PILOT-CHIT-071113 7/11/2013 26,500 26,200 7.0 11.0 3110 3290 1,060.0 1,110.0 1.0 U 1.0 U 0.5 U 0.5 U 1,040.0 1,460.013BH-DT-PILOT-CHIT-072313 7/23/2013 820 - 1.0 U - 8880 - 9.0 - 1.0 U - 0.5 U - 20.0 -13BH-DT-PILOT-CHIT-080713 8/7/2013 1,370 - 1.0 U - 64300 - 19.0 - 1.0 U - 0.5 U - 50.0 -13BH-DT-PILOT-CHIT-081913 8/19/2013 32,200 - 1.0 U - 75000 - 8.0 - 1.0 U - 0.5 U - 20.0 -13BH-DT-PILOT-CHIT-090413 9/4/2013 39,400 45,300 1.0 U 2.0 113000 109000 5.0 8 1.0 U 1.0 U 0.5 U 0.5 U 60.0 660.013BH-DT-PILOT-CHIT-091613 9/16/2013 39,400 - 1.0 U - 94100 - 15.0 - 1.0 U - 0.5 U - 20.0 -
13BH-DT-PILOT-MGOH-071113 7/11/2013 41,000 54,800 1.0 U 20.0 100000 101000 30.0 31.0 1.0 U 1.0 U 2.1 2.2 47,500.0 47,600.013BH-DT-PILOT-MGOH-072313 7/23/2013 470 - 23.0 - 122000 - 36.0 - 1.0 U - 2.2 - 52,800.0 -13BH-DT-PILOT-MGOH-080713 8/7/2013 140,000 - 165.0 - 117000 - 34.0 - 1.0 U - 2.0 - 53,100.0 -13BH-DT-PILOT-MGOH-081913 8/19/2013 36,600 - 111.0 - 109000 - 28.0 - 1.0 U - 1.8 - 51,000.0 -13BH-DT-PILOT-MGOH-090413 9/4/2013 4,680 36,300 1.0 U 58.0 102000 98800 28.0 27.0 1.0 U 1.0 U 2.1 2.2 42,000.0 44,400.013BH-DT-PILOT-MGOH-091613 9/16/2013 37,600 - 52.0 - 92100 - 26.0 - 1.0 U - 1.7 - 36,200.0 -13BH-DT-PILOT-BCR1-071113 7/11/2013 5,100 8,490 1.0 U 60.0 21700 21900 22.0 24.0 1.0 U 1.0 U 0.5 U 0.5 U 50.0 3,690.013BH-DT-PILOT-BCR1-072313 7/23/2013 104,000 - 1.0 U - 122000 - 8.0 - 1.0 U - 0.5 U - 60.0 -13BH-DT-PILOT-BCR1-080713 8/7/2013 138,000 - 1.0 U - 122000 - 36.0 - 1.0 U - 0.5 U - 20,700.0 -13BH-DT-PILOT-BCR1-081913 8/19/2013 111,000 - 1.0 U - 111000 - 33.0 - 1.0 U - 0.5 U - 36,800.0 -13BH-DT-PILOT-BCR1-090413 9/4/2013 86,200 83,400 1.0 U 9.0 105000 102000 29.0 29.0 1.0 U 1.0 U 0.5 U 0.5 U 35,500.0 34,300.013BH-DT-PILOT-BCR1-091613 9/16/2013 74,700 - 1.0 U - 98600 - 30.0 - 1.0 U - 0.5 U - 39,400.0 -13BH-DT-PILOT-BCR2-071113 7/11/2013 5,080 6,540 1.0 U 72.0 7260 7590 35.0 39.0 1.0 U 1.0 U 0.5 U 0.5 U 40.0 1,580.013BH-DT-PILOT-BCR2-072313 7/23/2013 33,300 - 1.0 U - 102000 - 5.0 U - 1.0 U - 0.5 U - 20.0 -13BH-DT-PILOT-BCR2-080713 8/7/2013 77,000 - 1.0 U - 127000 - 14.0 - 1.0 U - 0.5 U - 1,580.0 -13BH-DT-PILOT-BCR2-081913 8/19/2013 69,300 - 1.0 U - 113000 - 16.0 - 1.0 U - 0.5 U - 5,850.0 -13BH-DT-PILOT-BCR2-090413 9/4/2013 46,400 45,000 1.0 U 1.0 104000 102000 24.0 27.0 1.0 U 1.0 U 0.5 U 0.5 U 12,200.0 15,500.013BH-DT-PILOT-BCR2-091613 9/16/2013 33,700 - 1.0 U - 99900 - 24.0 - 1.0 U - 0.5 U - 13,700.0 -13BH-DT-PILOT-BCR3-071113 7/11/2013 8,710 9,660 1.0 74.0 6360 6510 66.0 68.0 1.0 U 1.0 U 0.5 U 0.5 U 40.0 620.013BH-DT-PILOT-BCR3-072313 7/23/2013 140 - 1.0 U - 1720 - 11.0 - 1.0 U - 0.5 U - 20.0 -13BH-DT-PILOT-BCR3-080713 8/7/2013 30 U - 1.0 U - 13100 - 8.0 - 1.0 U - 0.5 U - 20.0 -13BH-DT-PILOT-BCR3-081913 8/19/2013 160 - 1.0 U - 48600 - 5.0 U - 1.0 U - 0.5 U - 20.0 -13BH-DT-PILOT-BCR3-090413 9/4/2013 90 550 1.0 U 3.0 60000 61200 5.0 U 5.0 U 1.0 U 1.0 U 0.5 U 0.5 10.0 U 30.013BH-DT-PILOT-BCR3-091613 9/16/2013 520 - 1.0 U - 61300 - 5.0 U - 1.0 U - 0.5 U - 40.0 -13BH-DT-PILOT-BCR4-071113 7/11/2013 3,420 6,090 1.0 U 84.0 11000 11600 29.0 32.0 1.0 U 1.0 U 0.5 U 0.5 U 40.0 3,270.013BH-DT-PILOT-BCR4-072313 7/23/2013 1,500 - 1.0 U - 61100 - 5.0 U - 1.0 U - 0.5 U - 20.0 -13BH-DT-PILOT-BCR4-080713 8/7/2013 65,400 - 1.0 U - 146000 - 18.0 - 1.0 U - 0.5 U - 7,360.0 -13BH-DT-PILOT-BCR4-081913 8/19/2013 14,000 - 1.0 U - 98100 - 5.0 U - 1.0 U - 0.5 U - 900.0 -13BH-DT-PILOT-BCR4-090413 9/4/2013 52,200 51,900 1.0 U 1.0 U 116000 113000 29.0 31.0 1.0 U 1.0 U 0.5 U 0.5 U 10,400.0 14,600.013BH-DT-PILOT-BCR4-091613 9/16/2013 29,800 - 1.0 U - 86400 - 13.0 - 1.0 U - 0.5 U - 3,290.0 -
Notes:T = total fraction ; D = dissolved fraction Flags:Q = Qualifier Text - Exceeds Human Health standard.U = Result is less than the reporting limit shown Text - Exceeds Chronic Aquatic Life standard.- = Analyte not measured Text - Exceeds Acute Aquatic Life standard.
µg/LIRON LEAD MANGANESE NICKEL SILVERµg/L µg/L µg/L µg/L µg/L µg/L
ZINCTHALLIUM
Sample IDSample
Location
BCR2
BCR3
BCR4
INFL
SAPS
CHIT
MGOH
BCR1

1 of 1
Table 4.2-5Post-Oxidation Test Data
Danny T Adit Treatability Study Year 1
Sample ID/Name Date Time Temp (oC) DO (mg/L) DO (%) pH (su) ORP (mV)Conductivity
(uS/cm)Biochemical Oxygen
Demand (mg/L)Ammonia (mg/L
as N) Sulfide (mg/L)13BH-DT-PILOT-BCR2-072313 7/23/2013 12:50 21.15 0.56 NM 6.32 -67.70 2552.00 75 3.2 2.4BCR2 - Post Oxidation Interim Sample 7/23/2013 13:15 NM 0.58 NM NM NM NMBCR2 - Post Oxidation Interim Sample 7/23/2013 13:20 NM 1.20 NM NM NM NMBCR2 - Post Oxidation Interim Sample 7/23/2013 14:15 25.00 3.06 NM NM NM NM13BH-DT-PILOT-BCR2-POST-072313 7/23/2013 14:45 28.70 3.56 NM NM NM NM 94 5 0.4713BH-DT-PILOT-BCR3-080713 8/7/2013 12:15 14.5 2.38 23.5 6.75 -325.7 5866 1400 166 112BCR3 - Post Oxidation Interim Sample 8/7/2013 13:23 NM 1.74 18.2 NM NM NMBCR3 - Post Oxidation Interim Sample 8/7/2013 13:54 NM 1.9 21.7 NM NM NMBCR3 - Post Oxidation Interim Sample 8/7/2013 14:26 NM 2.96 34.8 NM NM NM13BH-DT-PILOT-BCR3-POST-080713 8/7/2013 14:35 25.07 2.92 34.7 7.92 176.1 6663 1700 237 1.713BH-DT-PILOT-BCR2-081913 8/19/2013 13:35 20.45 1 1.14 5.91 0.6 2019 <39 0.05 <0.0413BH-DT-PILOT-BCR2-POST-081913 8/19/2013 14:10 NM 3.11 37.7 NM NM NM 56 0.08 <0.0413BH-DT-PILOT-BCR3-090413 9/4/2013 9:40 17.84 4.34 46.4 6.17 -274.4 5154 1500 179 78BCR3 - Post Oxidation Interim Sample 9/4/2013 10:12 NM 3.72 39 NM NM NMBCR3 - Post Oxidation Interim Sample 9/4/2013 10:30 NM 3.8 NM NM NM NMBCR3 - Post Oxidation Interim Sample 9/4/2013 10:56 NM 4.09 42.2 NM NM NMBCR3 - Post Oxidation Interim Sample 9/4/2013 11:22 NM 3.89 40 NM NM NMBCR3 - Post Oxidation Interim Sample 9/4/2013 11:55 NM 3.55 38.8 NM NM NM13BH-DT-PILOT-BCR3-POST-090413 9/4/2013 12:02 NM 3.21 36.9 NM NM NM 1600 229 1.313BH-DT-PILOT-BCR2-091613 9/16/2013 12:15 18.4 8.52 92.1 6.26 19.4 3224 <35 <0.05 <0.213BH-DT-PILOT-BCR2-POST-091613 9/16/2013 14:15 NM 10.44 123.7 NM NM NM <35 <0.05 <0.2

1 of 1
Table 4.2-6SPLP Data for Substrate Materials
Danny T Adit Treatability Study Year 1
Analyte ALUMINUM ARSENIC BARIUM BERYLLIUM CADMIUM CALCIUM CHROMIUM COBALT COPPER IRONUnit µg/L µg/L µg/L µg/L µg/L µg/L µg/L µg/L µg/L µg/L
Compost 13BH-DT-PILOT-COMP-SPLP 9/24/2013 4500 27 500 <1 <1 16000 10 <5 18 3700Wood Chips 13BH-DT-PILOT-WOOD-SPLP 9/24/2013 230 6 170 <1 1 17000 8 <5 12 250Sawdust 13BH-DT-PILOT-SDST-SPLP 9/24/2013 980 3 180 <1 <1 6000 8 <5 9 930Chitorem 13BH-DT-PILOT-CHIT-SPLP 9/24/2013 290 1600 2000 <1 190 890000 54 72 840 2000
Analyte LEAD MAGNESIUM MANGANESE NICKEL POTASSIUM SILVER SODIUM THALLIUM ZINCUnit µg/L µg/L µg/L µg/L µg/L µg/L µg/L µg/L µg/L
Compost 13BH-DT-PILOT-COMP-SPLP 9/24/2013 11 5000 300 7 25000 <1 59000 <0.5 100Wood Chips 13BH-DT-PILOT-WOOD-SPLP 9/24/2013 8 5000 540 <5 32000 <1 53000 <0.5 80Sawdust 13BH-DT-PILOT-SDST-SPLP 9/24/2013 2 1000 21 <5 2000 <1 63000 <0.5 60Chitorem 13BH-DT-PILOT-CHIT-SPLP 9/24/2013 3 470000 92 680 870000 2 3700000 <0.5 1900
Material Sample ID
Material Sample ID

Figures
Barker Hughesville Danny T Treatability Study Technical Memorandum

This page intentionally blank.
Barker Hughesville Danny T Treatability Study Technical Memorandum

Barker-Hughesville Mining District Superfund Site
Figure 2.2-1Pilot-Scale Treatability Study
Year 1As-Built Process Flow Diagram
CDM Smith Inc.50 West 14th StreetSuite 200Helena, MT 59601
Feed Tank
Combined Head Tank Overflow
Head Tank
4
Mg(OH)2Solution
Stock Tank
Feed Tank Overflow
Adit Portal
No Pre-Treatment
SAPS Pre-Treatment
ChitoRem Pre-
Treatment
Mg(OH)2 Addition Pre-
Treatment
BCR 4BCR 3BCR 2BCR 1
Water level
Legend
Sampling port
Timer valve
Metering pump
Metering Pump and
Timer Switch
Head Tank
3
Head Tank
2
Head Tank
1
Ball valve
Head Tank Overflow
Head Tank Overflow
Head Tank Overflow
Head Tank Overflow
Solar Panels
AC BatteriesDC to AC Inverter
Stirrer and Motor
Combined BCR Effluent with Head
Tank Overflow
(not to scale)
Anti-Siphon Valve
Sludge

Figure 4.1‐1Titration Curve of Sodium Hydroxide to pH 4.5
0.0
0.5
1.0
1.5
2.0
2.5
3.0
3.5
4.0
4.5
5.0
0 100 200 300 400 500 600 700 800
pH (su)
25% NaOH solution (µL)
Figure 4.1‐2Titration Curve of Calcium Hydroxide to pH 4.5
0.0
0.5
1.0
1.5
2.0
2.5
3.0
3.5
4.0
4.5
5.0
0 500 1000 1500 2000 2500
pH (su)
10% Ca(OH)2 solution (µL)
Figure 4.1‐3Titration Curve of Chitorem to pH 4.5
0
0.5
1
1.5
2
2.5
3
3.5
4
4.5
5
0 0.2 0.4 0.6 0.8 1 1.2 1.4 1.6 1.8 2
pH (su)
Chitorem (g)

Figure 4.1‐4Titration Curve of Sodium Hydroxide to pH 9.5
0
1
2
3
4
5
6
7
8
9
10
0 200 400 600 800 1000 1200 1400 1600 1800 2000
pH (su)
25% NaOH solution (µL)

Figure 4.1‐5Titration Curve of Calcium Hydroxide to pH 9.5
0
1
2
3
4
5
6
7
8
9
10
0 500 1000 1500 2000 2500 3000 3500 4000
pH (su)
10% Ca(OH)2 solution (µL)

Figure 4.1‐6aColumn 1 ‐ NaOH Pre‐Treatment and SAPS, Page 1
0.1
1.0
10.0
100
1,000
As Cd Co Cu Pb Ni Tl
Dissolved
As, Cd, Co, Cu, Pb, Ni, an
d Tl Con
centratio
ns (µ
g/L)
RAW PH45 SPS BCR
Note: Non‐detect samples are shown at the method detection limit.

Figure 4.1‐6bColumn 1 ‐ NaOH Pre‐Treatment and SAPS, Page 2
1.0
10.0
100
1,000
10,000
100,000
Al Fe Mn Zn
Dissolved
Al, Fe, M
n, and
Zn Co
ncen
trations (µ
g/L)
RAW PH45 SPS BCR
Note: Non‐detect samples are shown at the method detection limit.

Figure 4.1‐7aColumn 2 ‐ Ca(OH)2 Pre‐Treatment and SAPS, Page 1
0.1
1.0
10.0
100
1,000
As Cd Co Cu Pb Ni Tl
Dissolved
As, Cd, Co, Cu, Pb, Ni, an
d Tl Con
centratio
ns (µ
g/L)
RAW PH45 SPS BCR
Note: Non‐detect samples are shown at the method detection limit.

Figure 4.1‐7bColumn 2 ‐ Ca(OH)2 Pre‐Treatment and SAPS, Page 2
1.0
10.0
100
1,000
10,000
100,000
Al Fe Mn Zn
Dissolved
Al, Fe, M
n, and
Zn Co
ncen
trations (µ
g/L)
RAW PH45 SPS BCR
Note: Non‐detect samples are shown at the method detection limit.

Figure 4.1‐8aColumn 3 ‐ No Pre‐Treatment and SAPS, Page 1
0.1
1.0
10.0
100
1,000
As Cd Co Cu Pb Ni Tl
Dissolved
As, Cd, Co, Cu, Pb, Ni, an
d Tl Con
centratio
ns (µ
g/L)
RAW SPS BCR
Note: Non‐detect samples are shown at the method detection limit.

Figure 4.1‐8bColumn 3 ‐ No Pre‐Treatment and SAPS, Page 2
1.0
10.0
100
1,000
10,000
100,000
Al Fe Mn Zn
Dissolved
Al, Fe, M
n, and
Zn Co
ncen
trations (µ
g/L)
RAW SPS BCR
Note: Non‐detect samples are shown at the method detection limit.
Figure 4.1‐9aColumn 4 ‐ Chitorem Pre‐Treatment, Page 1
0.1
1.0
10.0
100
1,000
As Cd Co Cu Pb Ni Tl
Dissolved
As, Cd, Co, Cu, Pb, Ni, an
d Tl Con
centratio
ns (µ
g/L)
RAW CHI BCR
Note: Non‐detect samples are shown at the method detection limit.

Figure 4.1‐9bColumn 4 ‐ Chitorem Pre‐Treatment, Page 2
1.0
10.0
100
1,000
10,000
100,000
Al Fe Mn Zn
Dissolved
Al, Fe, M
n, and
Zn Co
ncen
trations (µ
g/L)
RAW CHI BCR
Note: Non‐detect samples are shown at the method detection limit.

Figure 4.2-1pH Measurements
Danny T Adit Treatability Study Year 1
2.00
3.00
4.00
5.00
6.00
7.00
8.00
9.00
7/5/2013 7/15/2013 7/25/2013 8/4/2013 8/14/2013 8/24/2013 9/3/2013 9/13/2013 9/23/2013
pH, s
tand
ard
units
Date
Raw Influent (INFL) SAPS Pre-treatment (SAPS) Chitorem Pre-treatment (CHIT) MgOH Pre-treatment (MGOH)
BCR1 BCR2 BCR3 BCR4

Figure 4.2-2Oxidation Reduction Potential Measurements
Danny T Adit Treatability Study Year 1
-400.00
-300.00
-200.00
-100.00
0.00
100.00
200.00
300.00
400.00
500.00
7/5/2013 7/15/2013 7/25/2013 8/4/2013 8/14/2013 8/24/2013 9/3/2013 9/13/2013 9/23/2013
ORP
, mV
Date
Raw Influent (INFL) SAPS Pre-treatment (SAPS) Chitorem Pre-treatment (CHIT) MgOH Pre-treatment (MGOH)
BCR1 BCR2 BCR3 BCR4

Figure 4.2-3Dissolved Oxygen Measurements
Danny T Adit Treatability Study Year 1
0.01
0.10
1.00
10.00
7/5/2013 7/15/2013 7/25/2013 8/4/2013 8/14/2013 8/24/2013 9/3/2013 9/13/2013 9/23/2013
Diss
olve
d O
xyge
n, m
g/L
Date
Raw Influent (INFL) SAPS Pre-treatment (SAPS) Chitorem Pre-treatment (CHIT) MgOH Pre-treatment (MGOH)
BCR1 BCR2 BCR3 BCR4

Figure 4.2-4Dissolved Aluminum Concentrations
Danny T Adit Treatability Study Year 1
All U All U All U All U U
10
100
1,000
10,000
100,000
7/5/2013 7/15/2013 7/25/2013 8/4/2013 8/14/2013 8/24/2013 9/3/2013 9/13/2013 9/23/2013
Diss
olve
d Al
umin
um µ
g/L
Date
Raw Influent (INFL) SAPS Pre-treatment (SAPS) Chitorem Pre-treatment (CHIT) MgOH Pre-treatment (MGOH)
BCR1 BCR2 BCR3 BCR4
Reporting limit = 30 µg/L

Figure 4.2-5Dissolved Arsenic Concentrations
Danny T Adit Treatability Study Year 1
U 1.0
10.0
100.0
1,000.0
10,000.0
7/5/2013 7/15/2013 7/25/2013 8/4/2013 8/14/2013 8/24/2013 9/3/2013 9/13/2013 9/23/2013
Diss
olve
d Ar
seni
c, µ
g/L
Date
Raw Influent (INFL) SAPS Pre-treatment (SAPS) Chitorem Pre-treatment (CHIT) MgOH Pre-treatment (MGOH)
BCR1 BCR2 BCR3 BCR4
Reporting limit = 1 µg/L

Figure 4.2-6Dissolved Barium Concentrations
Danny T Adit Treatability Study Year 1
All U All U All U All U except CHIT All U except BCR1 All U
10.0
100.0
1,000.0
7/5/2013 7/15/2013 7/25/2013 8/4/2013 8/14/2013 8/24/2013 9/3/2013 9/13/2013 9/23/2013
Diss
olve
d Ba
rium
, µg/
L
Date
Raw Influent (INFL) SAPS Pre-treatment (SAPS) Chitorem Pre-treatment (CHIT) MgOH Pre-treatment (MGOH)
BCR1 BCR2 BCR3 BCR4
Reporting limit = 50 µg/L

Figure 4.2-7Dissolved Cadmium Concentrations
Danny T Adit Treatability Study Year 1
All U All U All U All U All U except BCR1 All U 1.0
10.0
100.0
1,000.0
7/5/2013 7/15/2013 7/25/2013 8/4/2013 8/14/2013 8/24/2013 9/3/2013 9/13/2013 9/23/2013
Diss
olve
d Ca
dmiu
m, µ
g/L
Date
Raw Influent (INFL) SAPS Pre-treatment (SAPS) Chitorem Pre-treatment (CHIT) MgOH Pre-treatment (MGOH)
BCR1 BCR2 BCR3 BCR4
Reporting limit = 1 µg/L

Figure 4.2-8Dissolved Cobalt Concentrations
Danny T Adit Treatability Study Year 1
All U All U U U All U except CHIT U
1.0
10.0
100.0
1000.0
7/5/2013 7/15/2013 7/25/2013 8/4/2013 8/14/2013 8/24/2013 9/3/2013 9/13/2013 9/23/2013
Diss
olve
d Co
balt,
µg/
L
Date
Raw Influent (INFL) SAPS Pre-treatment (SAPS) Chitorem Pre-treatment (CHIT) MgOH Pre-treatment (MGOH)
BCR1 BCR2 BCR3 BCR4
Reporting limit = 5 µg/L

Figure 4.2-9Dissolved Copper Concentrations
Danny T Adit Treatability Study Year 1
All U All U All U All U All U All U
1.0
10.0
100.0
1,000.0
10,000.0
7/5/2013 7/15/2013 7/25/2013 8/4/2013 8/14/2013 8/24/2013 9/3/2013 9/13/2013 9/23/2013
Diss
olve
d Co
pper
, µg/
L
Date
Raw Influent (INFL) SAPS Pre-treatment (SAPS) Chitorem Pre-treatment (CHIT) MgOH Pre-treatment (MGOH)
BCR1 BCR2 BCR3 BCR4
Reporting limit = 5 µg/L

Figure 4.2-10Dissolved Iron Concentrations
Danny T Adit Treatability Study Year 1
U
10
100
1,000
10,000
100,000
1,000,000
7/5/2013 7/15/2013 7/25/2013 8/4/2013 8/14/2013 8/24/2013 9/3/2013 9/13/2013 9/23/2013
Diss
olve
d Iro
n, µ
g/L
Date
Raw Influent (INFL) SAPS Pre-treatment (SAPS) Chitorem Pre-treatment (CHIT) MgOH Pre-treatment (MGOH)
BCR1 BCR2 BCR3 BCR4
Reporting limit = 30 µg/L

Figure 4.2-11Dissolved Lead Concentrations
Danny T Adit Treatability Study Year 1
All U except BCR3 All U All U All U All U except SAPS All U 1.0
10.0
100.0
1,000.0
7/5/2013 7/15/2013 7/25/2013 8/4/2013 8/14/2013 8/24/2013 9/3/2013 9/13/2013 9/23/2013
Diss
olve
d Le
ad,
µg/L
Date
Raw Influent (INFL) SAPS Pre-treatment (SAPS) Chitorem Pre-treatment (CHIT) MgOH Pre-treatment (MGOH)
BCR1 BCR2 BCR3 BCR4
Reporting limit = 1 µg/L

Figure 4.2-12Dissolved Manganese ConcentrationsDanny T Adit Treatability Study Year 1
1,000
10,000
100,000
1,000,000
7/5/2013 7/15/2013 7/25/2013 8/4/2013 8/14/2013 8/24/2013 9/3/2013 9/13/2013 9/23/2013
Diss
olve
d M
anga
nese
, µg/
L
Date
Raw Influent (INFL) SAPS Pre-treatment (SAPS) Chitorem Pre-treatment (CHIT) MgOH Pre-treatment (MGOH)
BCR1 BCR2 BCR3 BCR4

Figure 4.2-13Dissolved Nickel Concentrations
Danny T Adit Treatability Study Year 1
All U All U All U except CHIT U
1.0
10.0
100.0
1,000.0
10,000.0
7/5/2013 7/15/2013 7/25/2013 8/4/2013 8/14/2013 8/24/2013 9/3/2013 9/13/2013 9/23/2013
Diss
olve
d N
icke
l, µ
g/L
Date
Raw Influent (INFL) SAPS Pre-treatment (SAPS) Chitorem Pre-treatment (CHIT) MgOH Pre-treatment (MGOH)
BCR1 BCR2 BCR3 BCR4
Reporting limit = 5 µg/L

Figure 4.2-14Dissolved Thallium Concentrations
Danny T Adit Treatability Study Year 1
All U All U All U All U All U All U
0.1
1.0
10.0
7/5/2013 7/15/2013 7/25/2013 8/4/2013 8/14/2013 8/24/2013 9/3/2013 9/13/2013 9/23/2013
Diss
olve
d Th
alliu
m,
µg/L
Date
Raw Influent (INFL) SAPS Pre-treatment (SAPS) Chitorem Pre-treatment (CHIT) MgOH Pre-treatment (MGOH)
BCR1 BCR2 BCR3 BCR4
Reporting limit = 0.5 µg/L

Figure 4.2-15Dissolved Zinc Concentrations
Danny T Adit Treatability Study Year 1
U 10.0
100.0
1,000.0
10,000.0
100,000.0
7/5/2013 7/15/2013 7/25/2013 8/4/2013 8/14/2013 8/24/2013 9/3/2013 9/13/2013 9/23/2013
Diss
olve
d Zi
nc,
µg/L
Date
Raw Influent (INFL) SAPS Pre-treatment (SAPS) Chitorem Pre-treatment (CHIT) MgOH Pre-treatment (MGOH)
BCR1 BCR2 BCR3 BCR4
Reporting limit = 10 µg/L

Figure 4.2-16Sulfate Concentrations
Danny T Adit Treatability Study Year 1
100
1000
10000
7/5/2013 7/15/2013 7/25/2013 8/4/2013 8/14/2013 8/24/2013 9/3/2013 9/13/2013 9/23/2013
Sulfa
te,
mg/
L
Date
Raw Influent (INFL) SAPS Pre-treatment (SAPS) Chitorem Pre-treatment (CHIT) MgOH Pre-treatment (MGOH)
BCR1 BCR2 BCR3 BCR4

Figure 4.2-17Sulfide Concentrations
Danny T Adit Treatability Study Year 1
U All U
All U
0.01
0.1
1
10
100
1000
7/5/2013 7/15/2013 7/25/2013 8/4/2013 8/14/2013 8/24/2013 9/3/2013 9/13/2013 9/23/2013
Sulfi
de,
mg/
L
Date
Raw Influent (INFL) SAPS Pre-treatment (SAPS) Chitorem Pre-treatment (CHIT) MgOH Pre-treatment (MGOH)
BCR1 BCR2 BCR3 BCR4
Reporting limit = 0.04 mg/L up to 9/4
Reporting limit = 0.2 mg/L on 9/16

Figure 4.2-18Acidity Concentrations
Danny T Adit Treatability Study Year 1
All U All U All U All U All U All U
1
10
100
1000
7/5/2013 7/15/2013 7/25/2013 8/4/2013 8/14/2013 8/24/2013 9/3/2013 9/13/2013 9/23/2013
Acid
ity,
mg/
L as
CaC
O3
Date
Raw Influent (INFL) SAPS Pre-treatment (SAPS) Chitorem Pre-treatment (CHIT) MgOH Pre-treatment (MGOH)
BCR1 BCR2 BCR3 BCR4
Reporting limit = 4 mg/L
Figure 4.2-19Alkalinity Concentrations
Danny T Adit Treatability Study Year 1
All U All U All U All U U U
0.1
1
10
100
1000
10000
100000
7/5/2013 7/15/2013 7/25/2013 8/4/2013 8/14/2013 8/24/2013 9/3/2013 9/13/2013 9/23/2013
Tota
l Alk
alin
ity,
mg/
L as
CaC
O3
Date
Raw Influent (INFL) SAPS Pre-treatment (SAPS) Chitorem Pre-treatment (CHIT) MgOH Pre-treatment (MGOH)
BCR1 BCR2 BCR3 BCR4
Reporting limit = 1 mg/L

Figure 4.2-20Trends in pH, Alkalinity and Acidity in BCR1
Danny T Adit Treatability Study Year 1
1
10
100
1000
10000
7/5/2013 7/15/2013 7/25/2013 8/4/2013 8/14/2013 8/24/2013 9/3/2013 9/13/2013 9/23/2013
Conc
entr
atio
n, m
g/L
as C
aCO
3
Date
Acidity (INFL) Acidity (BCR1) Alkalinity (BCR1)
Net Alkalinity
Net Acidity
Net Alkalinity
Net Acidity
Note: Samples that were reported below the reporting limit of 4 mg/L were plotted at the reporting limit of 4 mg/L.
Net Alkalinity
Net Acidity
5.50
6.00
6.50
7.00
7.50
7/5/2013 7/15/2013 7/25/2013 8/4/2013 8/14/2013 8/24/2013 9/3/2013 9/13/2013 9/23/2013
pH, s
tand
ard
units
BCR1

Figure 4.2-21Trends in pH, Alkalinity and Acidity in BCR2
Danny T Adit Treatability Study Year 1
1
10
100
1000
10000
7/5/2013 7/15/2013 7/25/2013 8/4/2013 8/14/2013 8/24/2013 9/3/2013 9/13/2013 9/23/2013
Conc
entr
atio
n, m
g/L
as C
aCO
3
Date
Acidity (INFL) Acidity (BCR2) Alkalinity (BCR2) Acidity (SAPS) Alkalinity (SAPS)
Net Alkalinity Net Alkalinity
Note: Samples that were reported below the reporting limit of 4 mg/L for acidity or 1 mg/L for alkalinity, were plotted at the respective reporting limit.
Net Alkalinity
Net Acidity
5.50
6.00
6.50
7.00
7.50
7/5/2013 7/15/2013 7/25/2013 8/4/2013 8/14/2013 8/24/2013 9/3/2013 9/13/2013 9/23/2013
pH, s
tand
ard
units
BCR2

Figure 4.2-22Trends in pH, Alkalinity and Acidity in BCR3
Danny T Adit Treatability Study Year 1
1
10
100
1000
10000
100000
7/5/2013 7/15/2013 7/25/2013 8/4/2013 8/14/2013 8/24/2013 9/3/2013 9/13/2013 9/23/2013
Conc
entr
atio
n, m
g/L
as C
aCO
3
Date
Acidity (INFL) Acidity (BCR3) Alkalinity (BCR3) Acidity (CHIT) Alkalinity (CHIT)
Net Alkalinity Net Alkalinity
Note: Samples that were reported below the reporting limit of 4 mg/L for acidity or 1 mg/L for alkalinity, were plotted at the respective reporting limit.
Net Alkalinity
5.50
6.00
6.50
7.00
7.50
7/5/2013 7/15/2013 7/25/2013 8/4/2013 8/14/2013 8/24/2013 9/3/2013 9/13/2013 9/23/2013
pH, s
tand
ard
units
BCR3

Figure 4.2-23Trends in pH, Alkalinity and Acidity in BCR4
Danny T Adit Treatability Study Year 1
0.1
1
10
100
1000
10000
7/5/2013 7/15/2013 7/25/2013 8/4/2013 8/14/2013 8/24/2013 9/3/2013 9/13/2013 9/23/2013
Conc
entr
atio
n, m
g/L
as C
aCO
3
Date
Acidity (INFL) Acidity (BCR4) Alkalinity (BCR4) Acidity (MgOH) Alkalinity (MgOH)
Note: Samples that were reported below the reporting limit of 4 mg/L for acidity or 1 mg/L for alkalinity, were plotted at the respective reporting limit.
Net Alkalinity
5.50
6.00
6.50
7.00
7.50
7/5/2013 7/15/2013 7/25/2013 8/4/2013 8/14/2013 8/24/2013 9/3/2013 9/13/2013 9/23/2013
pH, s
tand
ard
units
BCR4
Net Acidity

Appendix A Data Evaluation Checklists
Barker Hughesville Danny T Treatability Study Technical Memorandum

This page intentionally blank.
Barker Hughesville Danny T Treatability Study Technical Memorandum

P:\3383-RAC_8_Option\325 - Barker Hughesville\Treatability Studies\Tech Memo\Appendices\validation summaries bench\C130301 dv summary.xlsx
Collection Date: 2/25-27/2013
Matrix: WaterAnalysis/Methods: Dissolved Metals EPA 200.7 and 200.8
Anions: Chloride, Fluoride and Sulfate EPA 300.0Total Suspended Solids EPA 160.2Alkalinity EPA 310.1
13BH-DT-BENCH-RAW 13BH-DT-BENCH-SPS-C113BH-DT-BENCH-OXD 13BH-DT-BENCH-SPS-C213BH-DT-BENCH-PH45-NAOH 13BH-DT-BENCH-SPS-C313BH-DT-BENCH-PH45-CHIT 13BH-DT-BENCH-CHI-C413BH-DT-BENCH-PH45-LIME13BH-DT-BENCH-PH95-NAOH13BH-DT-BENCH-PH95-CHIT13BH-DT-BENCH-PH95-LIMETSS only13BH-DT-BENCH-PH45-NAOH-TSS13BH-DT-BENCH-PH45-LIME-TSS
Sampling and Analysis Plan Bench Scale Test of Passive Treatment of Danny T Discharge
Precision: Yes No N/AAre the field duplicate relative percent differences (RPD) acceptable? NAAre the laboratory duplicate (matrix duplicates) RPDs within the reporting limit (RL) absolute difference criteria when within 5x the RL? Yes
Yes
Sample volume was limited and field duplicates were not collected, or required by the QAPPLaboratory duplicate results are summarized below
Accuracy: Yes No N/ANo
Were matrix spike criteria met (frequency 20% and % recovery 75-125%)? YesWas post digestion spike criteria met (if applicable)? Yes
Yes Yes Yes
Was a reporting limit standard analyzed? YesYes
Dissolved Method Blank 200.81303011-BLK1 RL
selenium 0.62 1
LCS, MS/MSD all compliant
1303011-DUP1 3/7 - 3/8 C130301-1 MDL 2.5 (DF x 5)Duplicate RPD
selenium 7.14 5.14 33RL = 1.0 x 5(DF), 20% does not apply
serial dilution1303023-SRD1 All <10% C130301-1
1303010-BLK1 OE 200.7all ND
LCS, Dup, MS/MSD all compliant 130310-DUP1 3/7 - 3/8
1303021-SRD1 Batch 1303021 - 1303010source 5x dilution RPD
Copper 420.8 377.5 11
Barker-HughesvilleBench ScaleTreatability Study
Data Validation Worksheet
USEPA Contract Laboratory Program National Functional Guidelines for Inorganic Superfund Data Review, January 2010 (NFGs)
Stage 2A validation
Reference Document Used in Data Validation:
C130301Environmental Services Assistance Team (ESAT) LaboratoryLaboratory:
Sample Delivery Group (SDG) Number:
Samples:
Comments (note deviations):
Was laboratory blank criteria met (within control limits)?
Were ICSA/ICSAB % recoveries acceptable or within CRQL criteria? Comments (note deviations):
Were ICV/CCV % recoveries within 90-110%?
Was laboratory control sample criteria met?
Were serial dilutions analyzed and within control limits of ±10% for waters (± for 15% for soils) or initial sample result less than 50x MDL?
Are the matrix spike duplicates RPD ≤ 20%?

P:\3383-RAC_8_Option\325 - Barker Hughesville\Treatability Studies\Tech Memo\Appendices\validation summaries bench\C130301 dv summary.xlsx
Total Method Blank1303008-blk1 200.2 TR metals 200.8
all ND
1303008-DUP2 130301-22Duplicate RL RPD
Selenium 8.165 5.187 5 45Thallium 34.63 9.886 5 111
RL = 1.0 x 5(DF), 20% does not apply
MS/MSD all compliant, post dig spike too all compliant
Serial Dilution130301-22 Prep 3/61303024-SRD1 source 5x dilution MDL RPD
Arsenic 14.31 24.28 2.5 52Selenium 8.165 18.05 2.5 75Thallium 34.63 38.98 2.5 12
No outliers are > 50x the MDL. All compliant
1303008-blk1 200.2 TR metals 200.7all ND
Lab dup see 1303008-DUP1 130301-22all <2
MS/MSD all compliant, post dig spike too all compliant
Serial Dilution130301-22 OE 3/6 - 3/81303022-SRD1 source 5x dilution MDL RPD
Copper 426.2 1469 10 110Sodium 5775 6864 1250 17
No outliers are > 50x the MDL. All compliant
Representativeness: Yes No N/A Yes
YesYes
Yes
Comparability: Yes No N/AWere analytical procedures and methods follows as defined in the QAPP or field change documentation? Yes
Completeness (90%): Yes No N/AAre all data in this SDG usable? Yes
Sensitivity: Yes No N/ADo the reporting limits meet project requirements? Yes
Data Validator: Date: 2/1/2014
Were sampling procedures and design criteria met? Were holding times met?
Kimberly Zilis
Was preservation criteria met? (4° C ± 2° C)?Were Chain-of-Custody records complete and provided in data package?
Comments (note deviations):
Comments (note deviations):
Comments (note deviations):
Comments (note deviations):

P:\3383-RAC_8_Option\325 - Barker Hughesville\Treatability Studies\Tech Memo\Appendices\validation summaries bench\Energy H13030003 dv summary.xlsx
Collection Date: 2/25-27/2013
Matrix: WaterAnalysis/Methods: Acidity SM 2310B
13BH-DT-BENCH-RAW 13BH-DT-BENCH-SPS-C113BH-DT-BENCH-OXD 13BH-DT-BENCH-SPS-C213BH-DT-BENCH-PH45-NAOH 13BH-DT-BENCH-SPS-C313BH-DT-BENCH-PH45-CHIT 13BH-DT-BENCH-CHI-C413BH-DT-BENCH-PH45-LIME13BH-DT-BENCH-PH95-NAOH13BH-DT-BENCH-PH95-LIME
Sampling and Analysis Plan Bench Scale Test of Passive Treatment of Danny T Discharge
Precision: Yes No N/AAre the field duplicate relative percent differences (RPD) acceptable? NAAre the laboratory duplicate (matrix duplicates) RPDs within the reporting limit (RL) absolute difference criteria when within 5x the RL? Yes
Yes
Sample volume was limited and field duplicates were not collected, or required by the QAPP
Accuracy: Yes No N/AYes
Yes
Representativeness: Yes No N/A Yes
YesYes
Yes
Comparability: Yes No N/AWere analytical procedures and methods follows as defined in the QAPP or field change documentation? Yes
Completeness (90%): Yes No N/AAre all data in this SDG usable? Yes
Sensitivity: Yes No N/ADo the reporting limits meet project requirements? Yes
Data Validator: Date: 2/1/2014
Barker-HughesvilleBench ScaleTreatability Study
Data Validation Worksheet
USEPA Contract Laboratory Program National Functional Guidelines for Inorganic Superfund Data Review, January 2010 (NFGs)
Comments (note deviations):
Was laboratory blank criteria met (within control limits)? Comments (note deviations):
Stage 2A validation
Reference Document Used in Data Validation:
Was laboratory control sample criteria met?
H13030003Energy LaboratoriesLaboratory:
Sample Delivery Group (SDG) Number:
Samples:
Are the matrix spike duplicates RPD ≤ 20%?
Were sampling procedures and design criteria met? Were holding times met?
Kimberly Zilis
Was preservation criteria met? (4° C ± 2° C)?Were Chain-of-Custody records complete and provided in data package?
Comments (note deviations):
Comments (note deviations):
Comments (note deviations):
Comments (note deviations):

P:\3383-RAC_8_Option\325 - Barker Hughesville\Treatability Studies\Tech Memo\Appendices\validation summaries bench\H13040227 Energy end of bench tests.xlsx
Stage 2A validation
Collection Date: 4/15/2013
Matrix: WaterAnalysis/Methods: Dissolved Metals EPA 200.7 and 200.8
Anions: Chloride and Sulfate EPA 300.0Fluoride SM 4500-F CSulfide SM 4500-S FTotal Suspended Solids SM 2540DAcidity SM 2310BAlkalinity SM 2320BBiological Oxygen Demand (BOD) SM 5210B
13BH-DT-BENCH-BCR-C113BH-DT-BENCH-BCR-C213BH-DT-BENCH-BCR-C313BH-DT-BENCH-BCR-C4
Sampling and Analysis Plan Bench Scale Test of Passive Treatment of Danny T Discharge
Precision: Yes No N/AAre the field duplicate relative percent differences (RPD) acceptable? NAAre the laboratory duplicate RPDs ≤ 20% for water ≤35% for soils or within the reporting limit (RL) absolute difference criteria when within 5x the RL? Yes
Yes
Laboratory DuplicatesLaboratory duplicates were available for alkalinity, TSS and BOD only, and compared within 20% RPD
H13040227Energy LaboratoriesLaboratory:
Sample Delivery Group (SDG) Number:
Samples:
Are the matrix spike duplicates RPD ≤ 20%?
Barker-HughesvilleTreatability Study
Data Validation Worksheet
End of Test Samples
USEPA Contract Laboratory Program National Functional Guidelines for Inorganic Superfund Data Review, January 2010 (NFGs)
Comments (note deviations):
Reference Document Used in Data Validation:

P:\3383-RAC_8_Option\325 - Barker Hughesville\Treatability Studies\Tech Memo\Appendices\validation summaries bench\H13040227 Energy end of bench tests.xlsx
Accuracy: Yes No N/ANo
Were matrix spike criteria met (frequency 20% and % recovery 75-125%)? YesWas post digestion spike criteria met (if applicable)? N/A
Yes Yes Yes
Was a reporting limit standard analyzed? NoYes
Serial DilutionThe laboratory did not report results for a serial dilution.
StandardsAs a level 2A validation, standards evaluation is not required. The laboratory did not report results for a reporting limit standard.
BlanksEnergy reports the method blank down to the MDL.
Reporting Limits and Analytical method
Matrix Spikes
MS % recovery MSD % recovery Limit QualifierCadmium 20 19 70-130 NoneSulfate 111 110 90-110
Neither of the above results were spike results from the bench scale samples. They are non-project samples.Representativeness: Yes No N/A
Yes YesYes
Yes
Comparability: Yes No N/AWere analytical procedures and methods follows as defined in the QAPP or field change documentation? Yes
Completeness (90%): Yes No N/AAre all data in this SDG usable? Yes
Sensitivity: Yes No N/ADo the reporting limits meet project requirements? Yes
Data Validator: Date: 1/20/2014
Metals matrix spike recoveries outside the laboratory defined limits are summarized below. The laboratory provides results for multiple spike analyses without clear distinction between batch association, dilutions, sample or spiked concentrations. The outliers are presented below. Qualifiers have not been applied because the data presentation is insufficient, and with the exception of rejected data, qualifiers would not affect the use of the data.
Were sampling procedures and design criteria met? Were holding times met?
Kimberly Zilis
Was preservation criteria met? (4° C ± 2° C)?Were Chain-of-Custody records complete and provided in data package?
Comments (note deviations):
Comments (note deviations):
Comments (note deviations):
Comments (note deviations):
Were serial dilutions analyzed and within control limits of ±10% for waters (± for 15% for soils) or initial sample result less than 50x MDL?
The method blank reporting limit is the MDL. The instrument reporting limit, or the practical reporting limit (PQL) is significantly higher than the MDL, and the same PQL is reported whether reported by ICP-MS or ICP-AES. The dilution factor was not reported. The PQL does not increase with the dilution until the MDL x the Dilution Factor (DF) is greater than the PQL. The lab does not provide "J" qualifiers. Therefore, when a dilution factor is not required (DF = 1) and an analyte is detected below the PQL, that analyte is not reported. However when a dilution is required, the diluted sample concentration can approach the MDL but will be reported without a "J" qualifier.
No analytes were reported in the method blank at a concentration greater than the RL, no sample values were within 5 times a reported blank value. No qualifiers have been applied
Calcium, Iron, Magnesium, Potassium and Sodium were reported from method 200.7, the rest of the analytes were reported from the ICP-MS method, 200.8
Was laboratory blank criteria met (within control limits)?
Were ICSA/ICSAB % recoveries acceptable or within CRQL criteria? Comments (note deviations):
Were ICV/CCV % recoveries within 90-110%?
Was laboratory control sample criteria met?

P:\3383-RAC_8_Option\325 - Barker Hughesville\Treatability Studies\Tech Memo\Appendices\validation summaries pilot\Event 1 H13070211.xlsx
Stage 2A validation
Collection Date: 7/11/2013
Matrix: WaterAnalysis/Methods: Total and Dissolved Metals EPA 200.7 and 200.8
Anions: Chloride and Sulfate EPA 300.0Fluoride SM 4500-F Cortho-Phosphate SM 2540CSulfide SM 4500-S DTotal Dissolved Solids SM 2540CAcidity SM 2310BAlkalinity SM 2320B
13BH-DT-PILOT-INFL-071113 13BH-DT-PILOT-BCR4-07111313BH-DT-PILOT-INFLD-071113 13BH-DT-PILOT-SAPS-07111313BH-DT-PILOT-BCR1-071113 13BH-DT-PILOT-CHIT-07111313BH-DT-PILOT-BCR2-071113 13BH-DT-PILOT-MGOH-07111313BH-DT-PILOT-BCR3-071113
Sampling and Analysis Plan Bench Scale Test of Passive Treatment of Danny T Discharge
Precision: Yes No N/AAre the field duplicate relative percent differences (RPD) acceptable? NoAre the laboratory duplicate RPDs ≤ 20% for water ≤35% for soils or within the reporting limit (RL) absolute difference criteria when within 5x the RL? Yes
Yes
Not all methods used the same laboratory QC measures for precision. The following summarizes laboratory QC precision and accuracy measures:sample dup/matrix spike matrix spike/matrix spike duplicate
alkalinity fluorideTDS sulfide
metalschloride and sulfateortho-phosphate
Field Duplicates
Sample 13BH-DT-PILOT-INFLD-071113 is a field duplicate of 13BH-DT-PILOT-INFL-071113All results are in mg/L
Sample Duplicate Reporting Limit (RL) Abs differenceDissolved Metals
aluminum 15.6 7.87 65.9manganese 124 63.7 64.3
sodium 6 4 40.0
thallium 0.0023 0.0032 32.7 0.0005 0.0009zinc 69.1 34.8 66.0
Total Metals, and other analyses all compared within 20% RPD
Laboratory DuplicatesLaboratory duplicates were available for alkalinity and TDS only, and compared within 20% RPD
Barker-HughesvilleTreatability Study
Data Validation Worksheet
Sampling Event 1
Field duplicate acceptance criteria is not defined in the SAP. The NFGs suggest ≤ 20% for water samples, but that may not be applicable to treatability samples. Results greater than 20% difference are summarized, but no qualifiers have been applied.
Reporting limit is 1.0. Absolute difference comparison applies because one result is within 5 times the RL. Outside ± the RL (1.0)
USEPA Contract Laboratory Program National Functional Guidelines for Inorganic Superfund Data Review, January 2010 (NFGs)
Comments (note deviations):
Metals
Reference Document Used in Data Validation:
H13070211Energy LaboratoriesLaboratory:
Sample Delivery Group (SDG) Number:
Samples:
Are the matrix spike duplicates RPD ≤ 20%?

P:\3383-RAC_8_Option\325 - Barker Hughesville\Treatability Studies\Tech Memo\Appendices\validation summaries pilot\Event 1 H13070211.xlsx
Accuracy: Yes No N/ANo
Were matrix spike criteria met (frequency 20% and % recovery 75-125%)? YesWas post digestion spike criteria met (if applicable)? N/A
Yes Yes Yes
Was a reporting limit standard analyzed? NoYes
Serial DilutionA serial dilution was not performed.
BlanksEnergy reports the method blank down to the MDL.
Result Reporting limit Sample ResultAlkalinity 2 1 23,000
No qualifiers were applied on the basis of blank results
Reporting Limits and Analytical method
Matrix Spikes
% Recovery LimitDissolved Silver 65/61 70-130
Sulfate 67/69 90-110ortho-Phosphate 115/119 90-110
Representativeness: Yes No N/A Yes
YesYes
Yes
Comparability: Yes No N/AWere analytical procedures and methods follows as defined in the QAPP or field change documentation? Yes
Completeness (90%): Yes No N/AAre all data in this SDG usable? Yes
Sensitivity: Yes No N/AAre MDLs present and reported? Yes Do the reporting limits meet project requirements? Yes
Data Validator: Date: 1/17/2014
The method blank reporting limit is the MDL. The instrument reporting limit, or the practical reporting limit (PQL) is significantly higher than the MDL, and the same PQL is reported whether the analysis was performed by ICP-MS or ICP-AES. The dilution factor was not reported and has been requested of the laboratory. The PQL does not increase with the dilution until the MDL x the Dilution Factor (DF) is greater than the PQL. The lab does not provide "J" qualifiers. Therefore, when a dilution factor is not required (DF = 1) and an analyte is detected below the PQL, that analyte is not reported. However when a dilution is required, the diluted sample concentration can approach the MDL but will be reported without a "J" qualifier.
Matrix spike recoveries outside the laboratory defined limits are summarized below. The laboratory provides results for multiple spike analyses without clear distinction between dissolved and total, batch association, dilutions, sample or spiked concentrations. The outliers are presented below. Qualifiers have not been applied because the data presentation is insufficient, and with the exception of rejected data, qualifiers would not affect the use of the data.
No analytes was reported in the method blank at a concentration greater than the RL with the exception of alkalinity on 7/17/2013, for the analysis of sample 13BH-DT-PILOT-MGOH-071113.
The laboratory uses Inductively Coupled Plasma-Mass Spectrometry (ICP-MS) and Inductively Coupled Plasma-Atomic Emission Spectrometry (ICP-AES) (methods 200.7 and 200.8) interchangeably. Zinc and manganese may be reported by one method for the total fraction and by the other for the dissolved fraction.
Was laboratory blank criteria met (within control limits)?
Were ICSA/ICSAB % recoveries acceptable or within CRQL criteria? Comments (note deviations):
Were ICV/CCV % recoveries within 90-110%?
Was laboratory control sample criteria met?
Were serial dilutions analyzed and within control limits of ±10% for waters (± for 15% for soils) or initial sample result less than 50x MDL?
Were sampling procedures and design criteria met? Were holding times met?
Kimberly Zilis
Was preservation criteria met? (4° C ± 2° C)?Were Chain-of-Custody records complete and provided in data package?
Comments (note deviations):
Comments (note deviations):
Comments (note deviations):
Comments (note deviations):
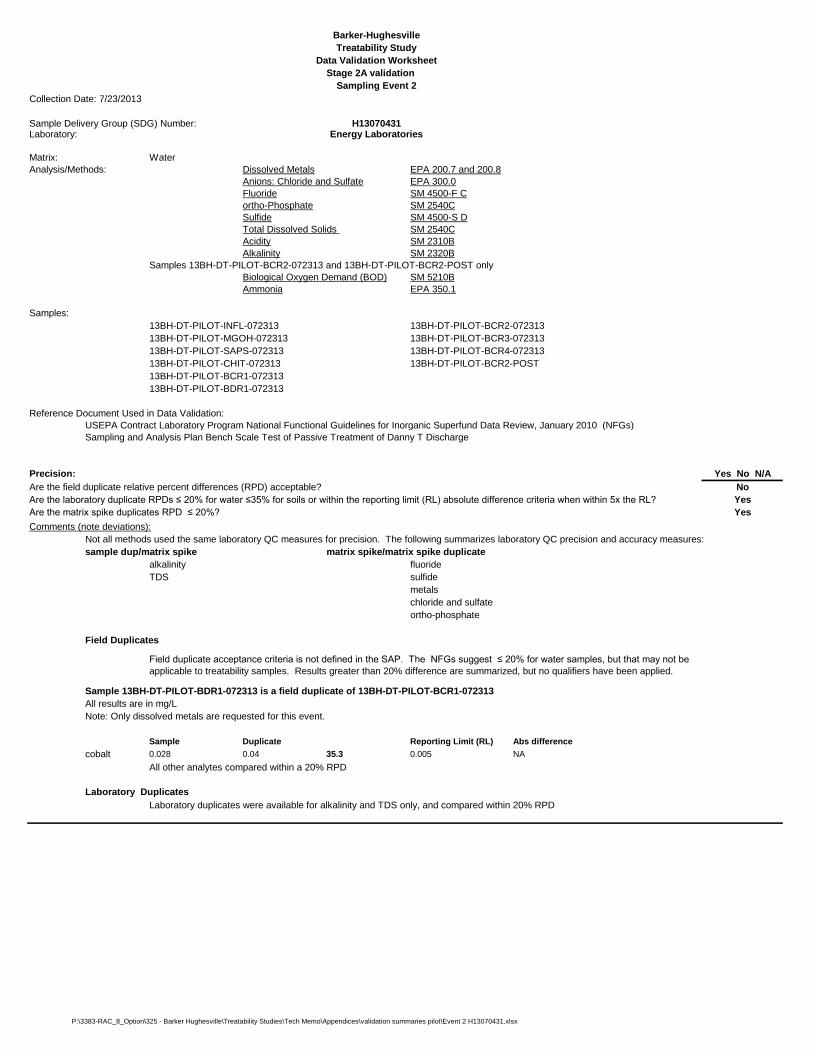
P:\3383-RAC_8_Option\325 - Barker Hughesville\Treatability Studies\Tech Memo\Appendices\validation summaries pilot\Event 2 H13070431.xlsx
Stage 2A validation
Collection Date: 7/23/2013
Matrix: WaterAnalysis/Methods: Dissolved Metals EPA 200.7 and 200.8
Anions: Chloride and Sulfate EPA 300.0Fluoride SM 4500-F Cortho-Phosphate SM 2540CSulfide SM 4500-S DTotal Dissolved Solids SM 2540CAcidity SM 2310BAlkalinity SM 2320B
Samples 13BH-DT-PILOT-BCR2-072313 and 13BH-DT-PILOT-BCR2-POST onlyBiological Oxygen Demand (BOD) SM 5210BAmmonia EPA 350.1
13BH-DT-PILOT-INFL-072313 13BH-DT-PILOT-BCR2-07231313BH-DT-PILOT-MGOH-072313 13BH-DT-PILOT-BCR3-07231313BH-DT-PILOT-SAPS-072313 13BH-DT-PILOT-BCR4-07231313BH-DT-PILOT-CHIT-072313 13BH-DT-PILOT-BCR2-POST13BH-DT-PILOT-BCR1-07231313BH-DT-PILOT-BDR1-072313
Sampling and Analysis Plan Bench Scale Test of Passive Treatment of Danny T Discharge
Precision: Yes No N/AAre the field duplicate relative percent differences (RPD) acceptable? NoAre the laboratory duplicate RPDs ≤ 20% for water ≤35% for soils or within the reporting limit (RL) absolute difference criteria when within 5x the RL? Yes
Yes
Not all methods used the same laboratory QC measures for precision. The following summarizes laboratory QC precision and accuracy measures:sample dup/matrix spike matrix spike/matrix spike duplicate
alkalinity fluorideTDS sulfide
metalschloride and sulfateortho-phosphate
Field Duplicates
Sample 13BH-DT-PILOT-BDR1-072313 is a field duplicate of 13BH-DT-PILOT-BCR1-072313All results are in mg/LNote: Only dissolved metals are requested for this event.
Sample Duplicate Reporting Limit (RL) Abs differencecobalt 0.028 0.04 35.3 0.005 NA
All other analytes compared within a 20% RPD
Laboratory DuplicatesLaboratory duplicates were available for alkalinity and TDS only, and compared within 20% RPD
Reference Document Used in Data Validation:
H13070431Energy LaboratoriesLaboratory:
Sample Delivery Group (SDG) Number:
Samples:
Are the matrix spike duplicates RPD ≤ 20%?
Barker-HughesvilleTreatability Study
Data Validation Worksheet
Sampling Event 2
Field duplicate acceptance criteria is not defined in the SAP. The NFGs suggest ≤ 20% for water samples, but that may not be applicable to treatability samples. Results greater than 20% difference are summarized, but no qualifiers have been applied.
USEPA Contract Laboratory Program National Functional Guidelines for Inorganic Superfund Data Review, January 2010 (NFGs)
Comments (note deviations):

P:\3383-RAC_8_Option\325 - Barker Hughesville\Treatability Studies\Tech Memo\Appendices\validation summaries pilot\Event 2 H13070431.xlsx
Accuracy: Yes No N/ANo
Were matrix spike criteria met (frequency 20% and % recovery 75-125%)? YesWas post digestion spike criteria met (if applicable)? N/A
Yes Yes Yes
Was a reporting limit standard analyzed? NoYes
Serial DilutionA serial dilution was not performed.
StandardsAs a level 2A validation, standard evaluation is not required. The laboratory did not report results for a reporting limit standard.
BlanksEnergy reports the method blank down to the MDL.
Reporting Limits and Analytical method
Matrix Spikes
Representativeness: Yes No N/A Yes
YesYes
Yes
Comparability: Yes No N/AWere analytical procedures and methods follows as defined in the QAPP or field change documentation? Yes
Completeness (90%): Yes No N/AAre all data in this SDG usable? Yes
Sensitivity: Yes No N/ADo the reporting limits meet project requirements? Yes
Data Validator: Date: 1/20/2014
Were sampling procedures and design criteria met? Were holding times met?
Kimberly Zilis
Was preservation criteria met? (4° C ± 2° C)?Were Chain-of-Custody records complete and provided in data package?
Comments (note deviations):
Comments (note deviations):
Comments (note deviations):
Comments (note deviations):
Was laboratory control sample criteria met?
Were serial dilutions analyzed and within control limits of ±10% for waters (± for 15% for soils) or initial sample result less than 50x MDL?
The method blank reporting limit is the MDL. The instrument reporting limit, or the practical reporting limit (PQL) is significantly higher than the MDL, and the same PQL is reported whether the analysis was performed by ICP-MS or ICP-AES. The dilution factor was not reported and has been requested of the laboratory. The PQL does not increase with the dilution until the MDL x the Dilution Factor (DF) is greater than the PQL. The lab does not provide "J" qualifiers. Therefore, when a dilution factor is not required (DF = 1) and an analyte is detected below the PQL, that analyte is not reported. However when a dilution is required, the diluted sample concentration can approach the MDL but will be reported without a "J" qualifier.
All matrix spike recoveries were within criteria.
No analytes was reported in the method blank at a concentration greater than the RL, no sample values were within 5 times a reported blank value. No qualifiers have been applied
The laboratory uses Inductively Coupled Plasma-Mass Spectrometry (ICP-MS) and Inductively Coupled Plasma-Atomic Emission Spectrometry (ICP-AES) (methods 200.7 and 200.8) interchangeably. Almost all data was reported from ICP-MS analysis except for Manganese which was reported entirely by ICP-AES, and aluminum and zinc for which the higher concentration samples were reported by ICP-AES.
Was laboratory blank criteria met (within control limits)?
Were ICSA/ICSAB % recoveries acceptable or within CRQL criteria? Comments (note deviations):
Were ICV/CCV % recoveries within 90-110%?

P:\3383-RAC_8_Option\325 - Barker Hughesville\Treatability Studies\Tech Memo\Appendices\validation summaries pilot\Event 3 H13080161.xlsx
Stage 2A validation
Collection Date: 8/07/2013
Matrix: WaterAnalysis/Methods: Dissolved Metals EPA 200.7 and 200.8
Anions: Chloride and Sulfate EPA 300.0Fluoride SM 4500-F Cortho-Phosphate SM 2540CSulfide SM 4500-S DTotal Dissolved Solids SM 2540CAcidity SM 2310BAlkalinity SM 2320B
Samples 13BH-DT-PILOT-BCR3-080713 and 13BH-DT-PILOT-BCR3-POST-080713 onlyBiological Oxygen Demand (BOD) SM 5210BAmmonia EPA 350.1
13BH-DT-PILOT-INFL-080713 13BH-DT-PILOT-BCR2-08071313BH-DT-PILOT-SAPS-080713 13BH-DT-PILOT-BCR3-08071313BH-DT-PILOT-CHIT-080713 13BH-DT-PILOT-BCR4-08071313BH-DT-PILOT-MGOH-080713 13BH-DT-PILOT-BDR4-08071313BH-DT-PILOT-BCR1-080713 13BH-DT-PILOT-BCR3-POST-080713
Sampling and Analysis Plan Bench Scale Test of Passive Treatment of Danny T Discharge
Precision: Yes No N/AAre the field duplicate relative percent differences (RPD) acceptable? NoAre the laboratory duplicate RPDs ≤ 20% for water ≤35% for soils or within the reporting limit (RL) absolute difference criteria when within 5x the RL? Yes
Yes
Not all methods used the same laboratory QC measures for precision. The following summarizes laboratory QC precision and accuracy measures:sample dup/matrix spike matrix spike/matrix spike duplicate
alkalinity fluorideTDS sulfide
metalschloride and sulfateortho-phosphate
Field Duplicates
Sample 13BH-DT-PILOT-BDR4-080713 is a field duplicate of 13BH-DT-PILOT-BCR4-080713All results are in mg/LNote: Only dissolved metals are requested for this event.
All analytes compared within a 20% RPD
Laboratory DuplicatesLaboratory duplicates were available for alkalinity and TDS only, and compared within 20% RPD
Barker-HughesvilleTreatability Study
Data Validation Worksheet
Sampling Event 3
Field duplicate acceptance criteria is not defined in the SAP. The NFGs suggest ≤ 20% for water samples, but that may not be applicable to treatability samples. Results greater than 20% difference are summarized, but no qualifiers have been applied.
USEPA Contract Laboratory Program National Functional Guidelines for Inorganic Superfund Data Review, January 2010 (NFGs)
Comments (note deviations):
Reference Document Used in Data Validation:
H13080161Energy LaboratoriesLaboratory:
Sample Delivery Group (SDG) Number:
Samples:
Are the matrix spike duplicates RPD ≤ 20%?

P:\3383-RAC_8_Option\325 - Barker Hughesville\Treatability Studies\Tech Memo\Appendices\validation summaries pilot\Event 3 H13080161.xlsx
Accuracy: Yes No N/ANo
Were matrix spike criteria met (frequency 20% and % recovery 75-125%)? YesWas post digestion spike criteria met (if applicable)? N/A
Yes Yes Yes
Was a reporting limit standard analyzed? NoYes
Serial DilutionThe laboratory did not report results for a serial dilution.
StandardsAs a level 2A validation, standards evaluation is not required. The laboratory did not report results for a reporting limit standard.
BlanksEnergy reports the method blank down to the MDL.
Reporting Limits and Analytical method
Matrix SpikesMS % recovery MSD % recovery Limit Qualifier
Fluoride 35 35 85-115 J
MS % recovery MSD % recovery Limit QualifierSilver 64 70 70-130 None
Representativeness: Yes No N/A Yes
YesYes
Yes
Comparability: Yes No N/AWere analytical procedures and methods follows as defined in the QAPP or field change documentation? Yes
Completeness (90%): Yes No N/AAre all data in this SDG usable? Yes
Sensitivity: Yes No N/ADo the reporting limits meet project requirements? Yes
Data Validator: Date: 1/20/2014
The method blank reporting limit is the MDL. The instrument reporting limit, or the practical reporting limit (PQL) is significantly higher than the MDL, and the same PQL is reported whether the analysis was performed by ICP-MS or ICP-AES. The dilution factor was not reported and has been requested of the laboratory. The PQL does not increase with the dilution until the MDL x the Dilution Factor (DF) is greater than the PQL. The lab does not provide "J" qualifiers. Therefore, when a dilution factor is not required (DF = 1) and an analyte is detected below the PQL, that analyte is not reported. However when a dilution is required, the diluted sample concentration can approach the MDL but will be reported without a "J" qualifier.
No analytes was reported in the method blank at a concentration greater than the RL, no sample values were within 5 times a reported blank value. No qualifiers have been applied
The laboratory uses Inductively Coupled Plasma-Mass Spectrometry (ICP-MS) and Inductively Coupled Plasma-Atomic Emission Spectrometry (ICP-AES) (methods 200.7 and 200.8) interchangeably. Almost all data was reported from ICP-MS analysis except for Manganese which was reported entirely by ICP-AES, and aluminum and zinc for which the higher concentration samples were reported by ICP-AES.
Was laboratory blank criteria met (within control limits)?
Were ICSA/ICSAB % recoveries acceptable or within CRQL criteria? Comments (note deviations):
Were ICV/CCV % recoveries within 90-110%?
Was laboratory control sample criteria met?
Were serial dilutions analyzed and within control limits of ±10% for waters (± for 15% for soils) or initial sample result less than 50x MDL?
Metals matrix spike recoveries outside the laboratory defined limits are summarized below. The laboratory provides results for multiple spike analyses without clear distinction between batch association, dilutions, sample or spiked concentrations. The outliers are presented below. Qualifiers have not been applied because the data presentation is insufficient, and with the exception of rejected data, qualifiers would not affect the use of the data.
Were sampling procedures and design criteria met? Were holding times met?
Kimberly Zilis
Was preservation criteria met? (4° C ± 2° C)?Were Chain-of-Custody records complete and provided in data package?
Comments (note deviations):
Comments (note deviations):
Comments (note deviations):
Comments (note deviations):

P:\3383-RAC_8_Option\325 - Barker Hughesville\Treatability Studies\Tech Memo\Appendices\validation summaries pilot\Event 4 H13080347.xlsx
Stage 2A validation
Collection Date: 8/19/2013
Matrix: WaterAnalysis/Methods: Dissolved Metals EPA 200.7 and 200.8
Anions: Chloride and Sulfate EPA 300.0Fluoride SM 4500-F Cortho-Phosphate SM 2540CSulfide SM 4500-S DTotal Dissolved Solids SM 2540CAcidity SM 2310BAlkalinity SM 2320B
Samples 13BH-DT-PILOT-BCR2-081913 and 13BH-DT-PILOT-BCR2-081913-POST onlyBiological Oxygen Demand (BOD) SM 5210BAmmonia EPA 350.1
13BH-DT-PILOT-INFL-081913 13BH-DT-PILOT-BCR2-08191313BH-DT-PILOT-SAPS-081913 13BH-DT-PILOT-BCR3-08191313BH-DT-PILOT-CHIT-081913 13BH-DT-PILOT-BDR3-08191313BH-DT-PILOT-MGOH-081913 13BH-DT-PILOT-BCR2-POST-08191313BH-DT-PILOT-BCR1-081913 13BH-DT-PILOT-BCR4-081913
Sampling and Analysis Plan Bench Scale Test of Passive Treatment of Danny T Discharge
Precision: Yes No N/AAre the field duplicate relative percent differences (RPD) acceptable? NoAre the laboratory duplicate RPDs ≤ 20% for water ≤35% for soils or within the reporting limit (RL) absolute difference criteria when within 5x the RL? Yes
Yes
Not all methods used the same laboratory QC measures for precision. The following summarizes laboratory QC precision and accuracy measures:sample dup/matrix spike matrix spike/matrix spike duplicate
alkalinity fluorideTDS sulfide
metalschloride and sulfateortho-phosphate
Field Duplicates
Sample 13BH-DT-PILOT-BDR3-081913 is a field duplicate of 13BH-DT-PILOT-BCR3-081913All results are in mg/LNote: Only dissolved metals are requested for this event.
Sample Duplicate Reporting Limit (RL) Abs differencezinc 0.02 <0.01 NA 0.01 NA
All other analytes compared within a 20% RPD
Laboratory DuplicatesLaboratory duplicates were available for alkalinity and TDS only, and compared within 20% RPD
Barker-HughesvilleTreatability Study
Data Validation Worksheet
Sampling Event 4
Field duplicate acceptance criteria is not defined in the SAP. The NFGs suggest ≤ 20% for water samples, but that may not be applicable to treatability samples. Results greater than 20% difference are summarized, but no qualifiers have been applied.
USEPA Contract Laboratory Program National Functional Guidelines for Inorganic Superfund Data Review, January 2010 (NFGs)
Comments (note deviations):
Reference Document Used in Data Validation:
H13080347Energy LaboratoriesLaboratory:
Sample Delivery Group (SDG) Number:
Samples:
Are the matrix spike duplicates RPD ≤ 20%?
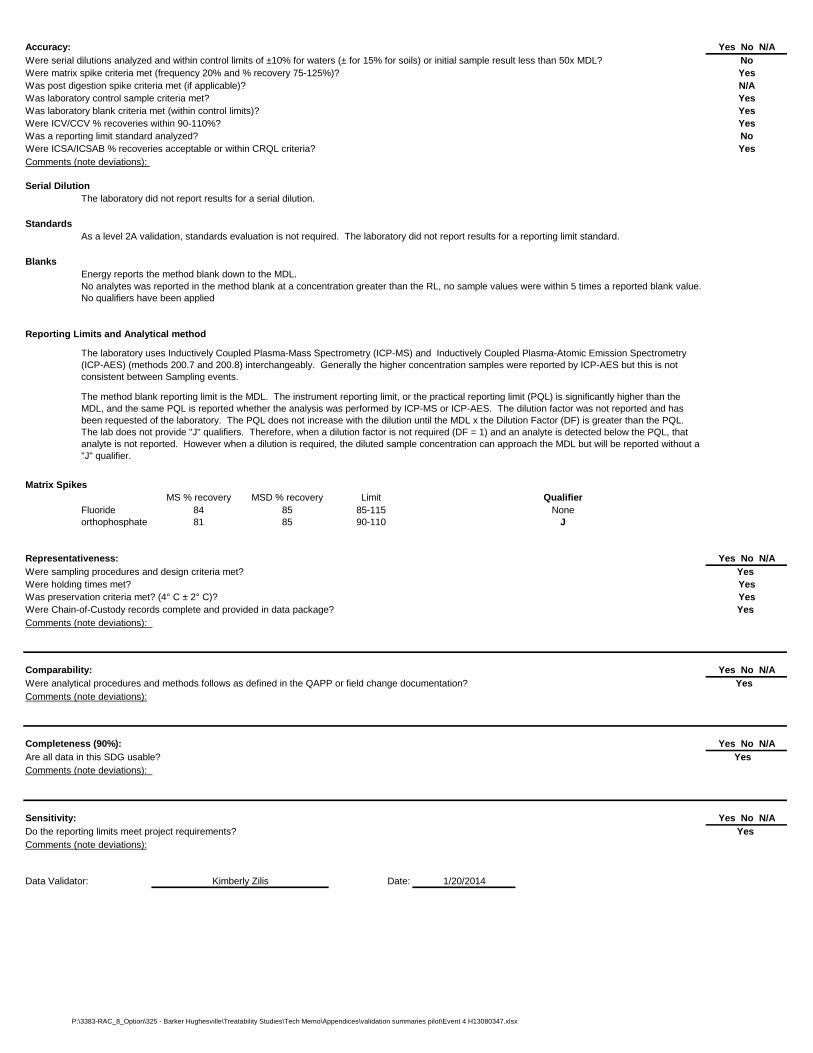
P:\3383-RAC_8_Option\325 - Barker Hughesville\Treatability Studies\Tech Memo\Appendices\validation summaries pilot\Event 4 H13080347.xlsx
Accuracy: Yes No N/ANo
Were matrix spike criteria met (frequency 20% and % recovery 75-125%)? YesWas post digestion spike criteria met (if applicable)? N/A
Yes Yes Yes
Was a reporting limit standard analyzed? NoYes
Serial DilutionThe laboratory did not report results for a serial dilution.
StandardsAs a level 2A validation, standards evaluation is not required. The laboratory did not report results for a reporting limit standard.
BlanksEnergy reports the method blank down to the MDL.
Reporting Limits and Analytical method
Matrix SpikesMS % recovery MSD % recovery Limit Qualifier
Fluoride 84 85 85-115 Noneorthophosphate 81 85 90-110 J
Representativeness: Yes No N/A Yes
YesYes
Yes
Comparability: Yes No N/AWere analytical procedures and methods follows as defined in the QAPP or field change documentation? Yes
Completeness (90%): Yes No N/AAre all data in this SDG usable? Yes
Sensitivity: Yes No N/ADo the reporting limits meet project requirements? Yes
Data Validator: Date: 1/20/2014
The method blank reporting limit is the MDL. The instrument reporting limit, or the practical reporting limit (PQL) is significantly higher than the MDL, and the same PQL is reported whether the analysis was performed by ICP-MS or ICP-AES. The dilution factor was not reported and has been requested of the laboratory. The PQL does not increase with the dilution until the MDL x the Dilution Factor (DF) is greater than the PQL. The lab does not provide "J" qualifiers. Therefore, when a dilution factor is not required (DF = 1) and an analyte is detected below the PQL, that analyte is not reported. However when a dilution is required, the diluted sample concentration can approach the MDL but will be reported without a "J" qualifier.
No analytes was reported in the method blank at a concentration greater than the RL, no sample values were within 5 times a reported blank value. No qualifiers have been applied
The laboratory uses Inductively Coupled Plasma-Mass Spectrometry (ICP-MS) and Inductively Coupled Plasma-Atomic Emission Spectrometry (ICP-AES) (methods 200.7 and 200.8) interchangeably. Generally the higher concentration samples were reported by ICP-AES but this is not consistent between Sampling events.
Was laboratory blank criteria met (within control limits)?
Were ICSA/ICSAB % recoveries acceptable or within CRQL criteria? Comments (note deviations):
Were ICV/CCV % recoveries within 90-110%?
Was laboratory control sample criteria met?
Were serial dilutions analyzed and within control limits of ±10% for waters (± for 15% for soils) or initial sample result less than 50x MDL?
Were sampling procedures and design criteria met? Were holding times met?
Kimberly Zilis
Was preservation criteria met? (4° C ± 2° C)?Were Chain-of-Custody records complete and provided in data package?
Comments (note deviations):
Comments (note deviations):
Comments (note deviations):
Comments (note deviations):
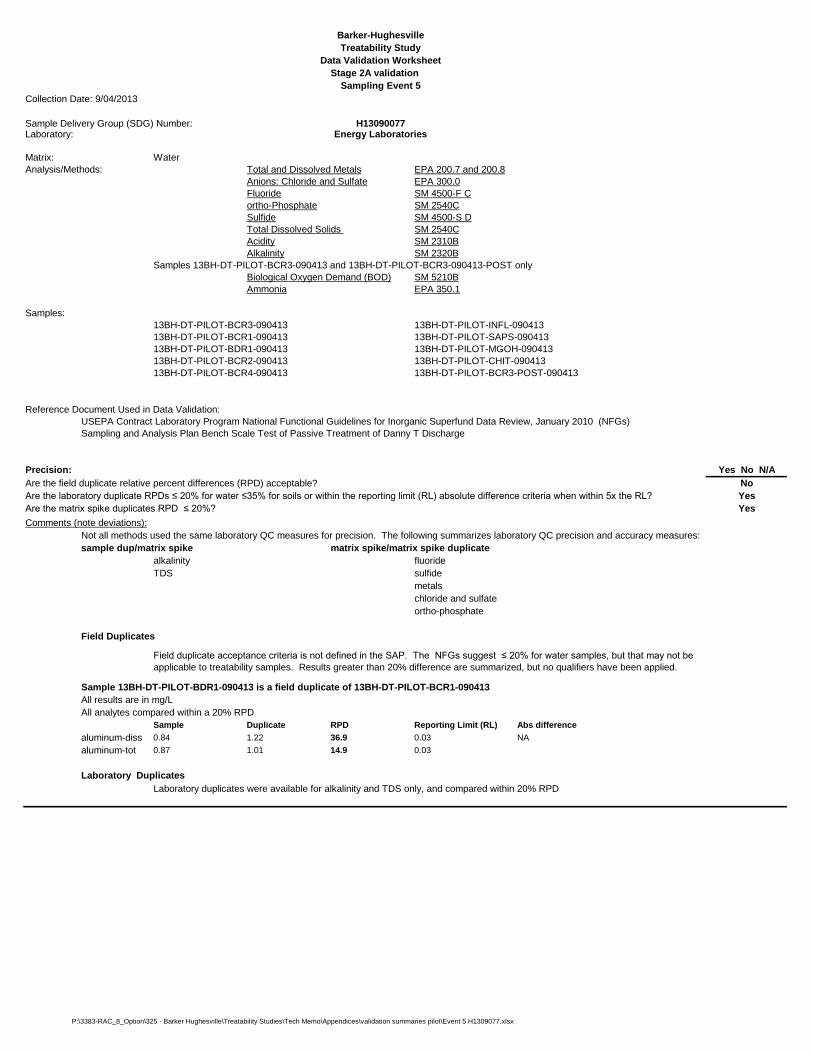
P:\3383-RAC_8_Option\325 - Barker Hughesville\Treatability Studies\Tech Memo\Appendices\validation summaries pilot\Event 5 H1309077.xlsx
Stage 2A validation
Collection Date: 9/04/2013
Matrix: WaterAnalysis/Methods: Total and Dissolved Metals EPA 200.7 and 200.8
Anions: Chloride and Sulfate EPA 300.0Fluoride SM 4500-F Cortho-Phosphate SM 2540CSulfide SM 4500-S DTotal Dissolved Solids SM 2540CAcidity SM 2310BAlkalinity SM 2320B
Samples 13BH-DT-PILOT-BCR3-090413 and 13BH-DT-PILOT-BCR3-090413-POST onlyBiological Oxygen Demand (BOD) SM 5210BAmmonia EPA 350.1
13BH-DT-PILOT-BCR3-090413 13BH-DT-PILOT-INFL-09041313BH-DT-PILOT-BCR1-090413 13BH-DT-PILOT-SAPS-09041313BH-DT-PILOT-BDR1-090413 13BH-DT-PILOT-MGOH-09041313BH-DT-PILOT-BCR2-090413 13BH-DT-PILOT-CHIT-09041313BH-DT-PILOT-BCR4-090413 13BH-DT-PILOT-BCR3-POST-090413
Sampling and Analysis Plan Bench Scale Test of Passive Treatment of Danny T Discharge
Precision: Yes No N/AAre the field duplicate relative percent differences (RPD) acceptable? NoAre the laboratory duplicate RPDs ≤ 20% for water ≤35% for soils or within the reporting limit (RL) absolute difference criteria when within 5x the RL? Yes
Yes
Not all methods used the same laboratory QC measures for precision. The following summarizes laboratory QC precision and accuracy measures:sample dup/matrix spike matrix spike/matrix spike duplicate
alkalinity fluorideTDS sulfide
metalschloride and sulfateortho-phosphate
Field Duplicates
Sample 13BH-DT-PILOT-BDR1-090413 is a field duplicate of 13BH-DT-PILOT-BCR1-090413All results are in mg/LAll analytes compared within a 20% RPD
Sample Duplicate RPD Reporting Limit (RL) Abs differencealuminum-diss 0.84 1.22 36.9 0.03 NAaluminum-tot 0.87 1.01 14.9 0.03
Laboratory DuplicatesLaboratory duplicates were available for alkalinity and TDS only, and compared within 20% RPD
H13090077Energy LaboratoriesLaboratory:
Sample Delivery Group (SDG) Number:
Samples:
Are the matrix spike duplicates RPD ≤ 20%?
Barker-HughesvilleTreatability Study
Data Validation Worksheet
Sampling Event 5
Field duplicate acceptance criteria is not defined in the SAP. The NFGs suggest ≤ 20% for water samples, but that may not be applicable to treatability samples. Results greater than 20% difference are summarized, but no qualifiers have been applied.
USEPA Contract Laboratory Program National Functional Guidelines for Inorganic Superfund Data Review, January 2010 (NFGs)
Comments (note deviations):
Reference Document Used in Data Validation:

P:\3383-RAC_8_Option\325 - Barker Hughesville\Treatability Studies\Tech Memo\Appendices\validation summaries pilot\Event 5 H1309077.xlsx
Accuracy: Yes No N/ANo
Were matrix spike criteria met (frequency 20% and % recovery 75-125%)? YesWas post digestion spike criteria met (if applicable)? N/A
Yes Yes Yes
Was a reporting limit standard analyzed? NoYes
Serial DilutionThe laboratory did not report results for a serial dilution.
StandardsAs a level 2A validation, standards evaluation is not required. The laboratory did not report results for a reporting limit standard.
BlanksEnergy reports the method blank down to the MDL.
Reporting Limits and Analytical method
Matrix SpikesMS % recovery MSD % recovery Limit Qualifier
Fluoride 84 85 85-115 Noneorthophosphate 81 85 90-110 J
MS % recovery MSD % recovery Limit QualifierLead 132 138 70-130 NoneThallium 129 135 70-130 NoneSilver 69 70 70-130
Representativeness: Yes No N/A Yes
YesYes
Yes
Comparability: Yes No N/AWere analytical procedures and methods follows as defined in the QAPP or field change documentation? Yes
Completeness (90%): Yes No N/AAre all data in this SDG usable? Yes
Sensitivity: Yes No N/ADo the reporting limits meet project requirements? Yes
Data Validator: Date: 1/20/2014
Metals matrix spike recoveries outside the laboratory defined limits are summarized below. The laboratory provides results for multiple spike analyses without clear distinction between batch association, dilutions, sample or spiked concentrations. The outliers are presented below. Qualifiers have not been applied because the data presentation is insufficient, and with the exception of rejected data, qualifiers would not affect the use of the data.
Were sampling procedures and design criteria met? Were holding times met?
Kimberly Zilis
Was preservation criteria met? (4° C ± 2° C)?Were Chain-of-Custody records complete and provided in data package?
Comments (note deviations):
Comments (note deviations):
Comments (note deviations):
Comments (note deviations):
Was laboratory control sample criteria met?
Were serial dilutions analyzed and within control limits of ±10% for waters (± for 15% for soils) or initial sample result less than 50x MDL?
The method blank reporting limit is the MDL. The instrument reporting limit, or the practical reporting limit (PQL) is significantly higher than the MDL, and the same PQL is reported whether the analysis was performed by ICP-MS or ICP-AES. The dilution factor was not reported and has been requested of the laboratory. The PQL does not increase with the dilution until the MDL x the Dilution Factor (DF) is greater than the PQL. The lab does not provide "J" qualifiers. Therefore, when a dilution factor is not required (DF = 1) and an analyte is detected below the PQL, that analyte is not reported. However when a dilution is required, the diluted sample concentration can approach the MDL but will be reported without a "J" qualifier.
No analytes was reported in the method blank at a concentration greater than the RL, no sample values were within 5 times a reported blank value. No qualifiers have been applied
The laboratory uses Inductively Coupled Plasma-Mass Spectrometry (ICP-MS) and Inductively Coupled Plasma-Atomic Emission Spectrometry (ICP-AES) (methods 200.7 and 200.8) interchangeably. Generally the higher concentration samples were reported by ICP-AES but this is not consistent between Sampling events.
Was laboratory blank criteria met (within control limits)?
Were ICSA/ICSAB % recoveries acceptable or within CRQL criteria? Comments (note deviations):
Were ICV/CCV % recoveries within 90-110%?

P:\3383-RAC_8_Option\325 - Barker Hughesville\Treatability Studies\Tech Memo\Appendices\validation summaries pilot\Event 6 H1309305.xlsx
Stage 2A validation
Collection Date: 9/16/2013
Matrix: WaterAnalysis/Methods: Total and Dissolved Metals EPA 200.7 and 200.8
Anions: Chloride and Sulfate EPA 300.0Fluoride SM 4500-F Cortho-Phosphate SM 2540CSulfide SM 4500-S DTotal Dissolved Solids SM 2540CAcidity SM 2310BAlkalinity SM 2320B
Samples 13BH-DT-PILOT-BCR3-090413 and 13BH-DT-PILOT-BCR3-090413-POST onlyBiological Oxygen Demand (BOD) SM 5210BAmmonia EPA 350.1
13BH-DT-PILOT-BCR2-091613 13BH-DT-PILOT-BCR1-09161313BH-DT-PILOT-INFL-091613 13BH-DT-PILOT-BCR3-09161313BH-DT-PILOT-SAPS-091613 13BH-DT-PILOT-BDR3-09161313BH-DT-PILOT-CHIT-091613 13BH-DT-PILOT-BCR4-09161313BH-DT-PILOT-MGOH-091613 13BH-DT-PILOT-BCR2-POST-091613
Sampling and Analysis Plan Bench Scale Test of Passive Treatment of Danny T Discharge
Precision: Yes No N/AAre the field duplicate relative percent differences (RPD) acceptable? NoAre the laboratory duplicate RPDs ≤ 20% for water ≤35% for soils or within the reporting limit (RL) absolute difference criteria when within 5x the RL? Yes
Yes
Not all methods used the same laboratory QC measures for precision. The following summarizes laboratory QC precision and accuracy measures:sample dup/matrix spike matrix spike/matrix spike duplicate
alkalinity fluorideTDS sulfide
metalschloride and sulfateortho-phosphate
Field Duplicates
Sample 13BH-DT-PILOT-BDR3-091613 is a field duplicate of 13BH-DT-PILOT-BCR3-091613All results are in mg/LAll analytes compared within a 20% RPD
Sample Duplicate RPD Reporting Limit (RL) Abs differencesulfate 600 450 28.6 1 NAortho phosphorus 26 36 32.3 1iron 0.52 0.1 135.5 0.03 0.42potassium 6 4 40.0 1 2
Laboratory DuplicatesLaboratory duplicates were available for alkalinity and TDS only, and compared within 20% RPD
Barker-HughesvilleTreatability Study
Data Validation Worksheet
Sampling Event 6
Field duplicate acceptance criteria is not defined in the SAP. The NFGs suggest ≤ 20% for water samples, but that may not be applicable to treatability samples. Results greater than 20% difference are summarized, but no qualifiers have been applied.
USEPA Contract Laboratory Program National Functional Guidelines for Inorganic Superfund Data Review, January 2010 (NFGs)
Comments (note deviations):
Reference Document Used in Data Validation:
H13090305Energy LaboratoriesLaboratory:
Sample Delivery Group (SDG) Number:
Samples:
Are the matrix spike duplicates RPD ≤ 20%?

P:\3383-RAC_8_Option\325 - Barker Hughesville\Treatability Studies\Tech Memo\Appendices\validation summaries pilot\Event 6 H1309305.xlsx
Accuracy: Yes No N/ANo
Were matrix spike criteria met (frequency 20% and % recovery 75-125%)? YesWas post digestion spike criteria met (if applicable)? N/A
Yes Yes Yes
Was a reporting limit standard analyzed? NoYes
Serial DilutionThe laboratory did not report results for a serial dilution.
StandardsAs a level 2A validation, standards evaluation is not required. The laboratory did not report results for a reporting limit standard.
BlanksEnergy reports the method blank down to the MDL.
Reporting Limits and Analytical method
Matrix SpikesMS % recovery MSD % recovery Limit Qualifier
Fluoride 84 85 85-115 Noneorthophosphate 81 85 90-110 J
MS % recovery MSD % recovery Limit QualifierLead 132 138 70-130 NoneThallium 129 135 70-130 NoneSilver 69 70 70-130
Representativeness: Yes No N/A Yes
NoYes
Yes
Comparability: Yes No N/AWere analytical procedures and methods follows as defined in the QAPP or field change documentation? Yes
Completeness (90%): Yes No N/AAre all data in this SDG usable? Yes
Sensitivity: Yes No N/ADo the reporting limits meet project requirements? Yes
Data Validator: Date: 1/20/2014
The method blank reporting limit is the MDL. The instrument reporting limit, or the practical reporting limit (PQL) is significantly higher than the MDL, and the same PQL is reported whether the analysis was performed by ICP-MS or ICP-AES. The dilution factor was not reported and has been requested of the laboratory. The PQL does not increase with the dilution until the MDL x the Dilution Factor (DF) is greater than the PQL. The lab does not provide "J" qualifiers. Therefore, when a dilution factor is not required (DF = 1) and an analyte is detected below the PQL, that analyte is not reported. However when a dilution is required, the diluted sample concentration can approach the MDL but will be reported without a "J" qualifier.
No analytes was reported in the method blank at a concentration greater than the RL, no sample values were within 5 times a reported blank value. No qualifiers have been applied
The laboratory uses Inductively Coupled Plasma-Mass Spectrometry (ICP-MS) and Inductively Coupled Plasma-Atomic Emission Spectrometry (ICP-AES) (methods 200.7 and 200.8) interchangeably. Generally the higher concentration samples were reported by ICP-AES but this is not consistent between Sampling events.
Was laboratory blank criteria met (within control limits)?
Were ICSA/ICSAB % recoveries acceptable or within CRQL criteria? Comments (note deviations):
Were ICV/CCV % recoveries within 90-110%?
Was laboratory control sample criteria met?
Were serial dilutions analyzed and within control limits of ±10% for waters (± for 15% for soils) or initial sample result less than 50x MDL?
Metals matrix spike recoveries outside the laboratory defined limits are summarized below. The laboratory provides results for multiple spike analyses without clear distinction between batch association, dilutions, sample or spiked concentrations. The outliers are presented below. Qualifiers have not been applied because the data presentation is insufficient, and with the exception of rejected data, qualifiers would not affect the use of the data.
Were sampling procedures and design criteria met? Were holding times met?
Kimberly Zilis
Was preservation criteria met? (4° C ± 2° C)?Were Chain-of-Custody records complete and provided in data package?
Comments (note deviations):
Comments (note deviations):
Comments (note deviations): BOD was analyzed on 9/18/13 at 15:19. Collection was 9/16 at 14:15. The holding time of 48 hours was exceeed by a little over an hour. No qualifiers have been applied.
Comments (note deviations):
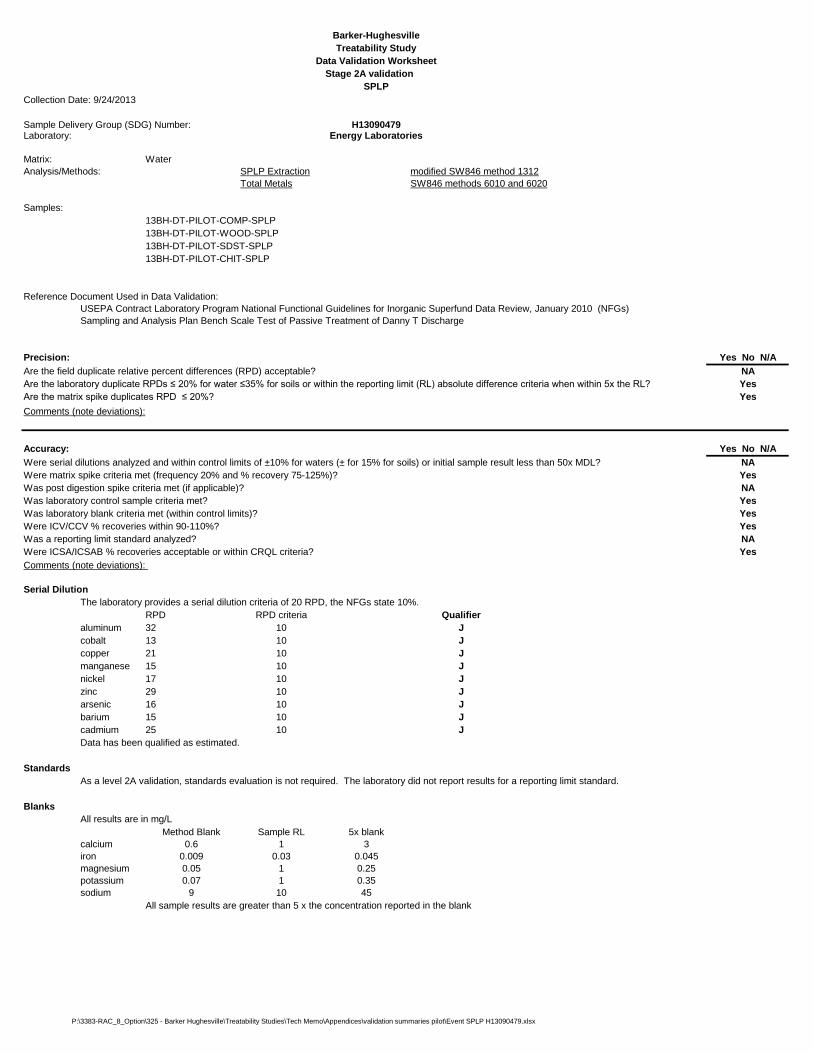
P:\3383-RAC_8_Option\325 - Barker Hughesville\Treatability Studies\Tech Memo\Appendices\validation summaries pilot\Event SPLP H13090479.xlsx
Stage 2A validation
Collection Date: 9/24/2013
Matrix: WaterAnalysis/Methods: SPLP Extraction modified SW846 method 1312
Total Metals SW846 methods 6010 and 6020
13BH-DT-PILOT-COMP-SPLP13BH-DT-PILOT-WOOD-SPLP13BH-DT-PILOT-SDST-SPLP13BH-DT-PILOT-CHIT-SPLP
Sampling and Analysis Plan Bench Scale Test of Passive Treatment of Danny T Discharge
Precision: Yes No N/AAre the field duplicate relative percent differences (RPD) acceptable? NAAre the laboratory duplicate RPDs ≤ 20% for water ≤35% for soils or within the reporting limit (RL) absolute difference criteria when within 5x the RL? Yes
Yes
Accuracy: Yes No N/ANA
Were matrix spike criteria met (frequency 20% and % recovery 75-125%)? YesWas post digestion spike criteria met (if applicable)? NA
Yes Yes Yes
Was a reporting limit standard analyzed? NAYes
Serial DilutionThe laboratory provides a serial dilution criteria of 20 RPD, the NFGs state 10%.
RPD RPD criteria Qualifieraluminum 32 10 Jcobalt 13 10 Jcopper 21 10 Jmanganese 15 10 Jnickel 17 10 Jzinc 29 10 Jarsenic 16 10 Jbarium 15 10 Jcadmium 25 10 JData has been qualified as estimated.
StandardsAs a level 2A validation, standards evaluation is not required. The laboratory did not report results for a reporting limit standard.
BlanksAll results are in mg/L
Method Blank Sample RL 5x blankcalcium 0.6 1 3iron 0.009 0.03 0.045magnesium 0.05 1 0.25potassium 0.07 1 0.35sodium 9 10 45
All sample results are greater than 5 x the concentration reported in the blank
Were serial dilutions analyzed and within control limits of ±10% for waters (± for 15% for soils) or initial sample result less than 50x MDL?
Laboratory: Sample Delivery Group (SDG) Number:
Samples:
Are the matrix spike duplicates RPD ≤ 20%?
Barker-HughesvilleTreatability Study
Data Validation Worksheet
SPLP
USEPA Contract Laboratory Program National Functional Guidelines for Inorganic Superfund Data Review, January 2010 (NFGs)
Comments (note deviations):
Was laboratory blank criteria met (within control limits)?
Were ICSA/ICSAB % recoveries acceptable or within CRQL criteria? Comments (note deviations):
Were ICV/CCV % recoveries within 90-110%?
Reference Document Used in Data Validation:
Was laboratory control sample criteria met?
H13090479Energy Laboratories
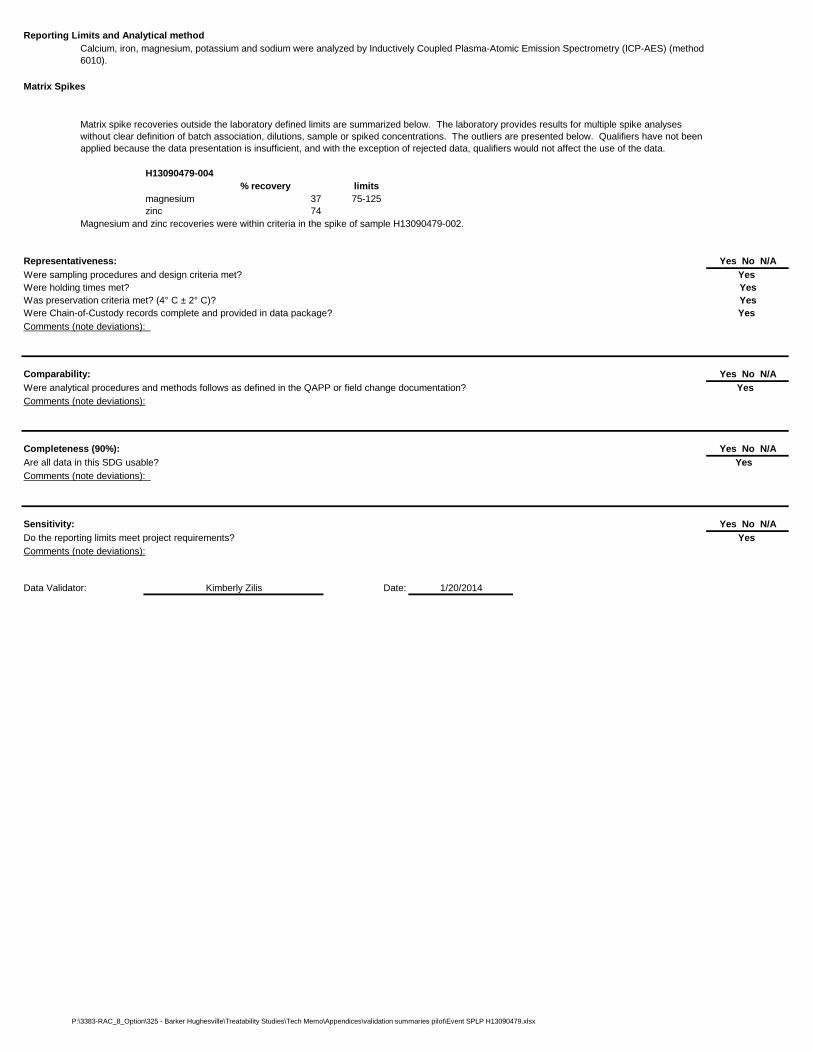
P:\3383-RAC_8_Option\325 - Barker Hughesville\Treatability Studies\Tech Memo\Appendices\validation summaries pilot\Event SPLP H13090479.xlsx
Reporting Limits and Analytical method
Matrix Spikes
H13090479-004% recovery limits
magnesium 37 75-125zinc 74
Magnesium and zinc recoveries were within criteria in the spike of sample H13090479-002.
Representativeness: Yes No N/A Yes
YesYes
Yes
Comparability: Yes No N/AWere analytical procedures and methods follows as defined in the QAPP or field change documentation? Yes
Completeness (90%): Yes No N/AAre all data in this SDG usable? Yes
Sensitivity: Yes No N/ADo the reporting limits meet project requirements? Yes
Data Validator: Date: 1/20/2014
Were sampling procedures and design criteria met? Were holding times met?
Kimberly Zilis
Was preservation criteria met? (4° C ± 2° C)?Were Chain-of-Custody records complete and provided in data package?
Comments (note deviations):
Comments (note deviations):
Comments (note deviations):
Comments (note deviations):
Matrix spike recoveries outside the laboratory defined limits are summarized below. The laboratory provides results for multiple spike analyses without clear definition of batch association, dilutions, sample or spiked concentrations. The outliers are presented below. Qualifiers have not been applied because the data presentation is insufficient, and with the exception of rejected data, qualifiers would not affect the use of the data.
Calcium, iron, magnesium, potassium and sodium were analyzed by Inductively Coupled Plasma-Atomic Emission Spectrometry (ICP-AES) (method 6010).

Appendix B Laboratory Data Packages
Barker Hughesville Danny T Treatability Study Technical Memorandum

This page intentionally blank.
Barker Hughesville Danny T Treatability Study Technical Memorandum

Appendix B.1 Bench-Scale Laboratory Data Packages
Barker Hughesville Danny T Treatability Study Technical Memorandum

This page intentionally blank.
Barker Hughesville Danny T Treatability Study Technical Memorandum

Attached are the analytical results for the samples received from the Barker-Hughesville_Pilot
Study_MAR 2013_D353 sampling event, according to TDF DG-353. All analyses were performed within
their method specified holding times unless otherwise noted in the following narrative.
These samples were prepared, analyzed, and verified by the Environmental Services Assistance Team
Laboratory (ESAT) according to the requirements of the Technical Direction Form (TDF).
Note: The laboratory herewith transmits this deliverable to the program/project partner for determination
of "final data usability" which may include data validation and data quality asessment per and in accordance
with EPA QA/G-8, Guidance on Environmental Data Verification and Data Validation, November 2002,
EPA/240/R-02/004. Laboratory data qualifiers are applied based on the USEPA Contract Laboratory
Program National Functional Guidelines for Inorganic Data Review, October 2004, referred to as "NFGI".
Laboratory policy is to dispose of any remaining sample 60 days after data analysis packages are
delivered to EPA. If you would like the laboratory to retain the samples for a period longer than 60 days,
please contact Don Goodrich within the 60 day period at (303) 312-6687.
U.S. Environmental Protection Agency
Region 8
Technical and Management Services
Laboratory Services Program Certificate of Analysis
Ref: 8TMS-L
MEMORANDUM
Subject: Analytical Results--- Barker-Hughesville_Pilot Study_MAR 2013_D353 / DG-353
From:
Received Sample Set(s), [Work Order : Date Received]:
Don Goodrich; EPA Region 8 Analytical Chemistry WAM
To: Roger Hoogerheide
Superfund
C130301 02/28/2013 ][ :
03/21/13 Date:
8 MO
Page 1 of 77

Certificate of AnalysisBarker-Hughesville_Pilot Study_MAR 2013_D353
DG-353
Project Name:
TDF #:
Case Narrative
C130301Quality Assessment: Unless indicated by exception, the QA/QC associated with this sample set
produced data within the TDF-specified criteria.
Holding Times: All samples were analyzed within their method-specified technical holding
time(s).
1. Initial and Continuing calibration blanks (ICBs and CCBs).
Exceptions: None.
2. Preparation (PB) / Method blanks (MB)
Exceptions: None.
3. Interference Checks (ICSA / ICSAB) for ICP-MS and ICP-OE analyses only.
Exceptions: None.
4. Initial and Continuing calibration verification analyses (ICVs and CCVs).
Exceptions: None.
5. Laboratory Control Sample (LCS) or second source analysis or SRM.
Exceptions: None.
6. Laboratory Fortified blank (LFB) / Blank spike (BS), same source as used for the matrix spikes.
PBS performed with analyses/methods requiring preparation or digestion prior to analysis.
Exceptions: None.
7. Contract Reporting Detection Limit Standard, labeled as CRA, CRDL or CRL.
Exceptions: None.
8. Laboratory Duplicate (DUP). "Source" identifies field sample duplicated in the laboratory. If either
the "source" or the duplicate result is <5X the reporting limit, the %D limit of 20% does not apply.
Exceptions: None.
9. Laboratory Matrix Spike (MS) and spike duplicate (MSD). "Source" defines original field sample
fortified prior to analysis. Percent recovery (%R) limits do not apply when sample concentration(s)
exceed the corresponding analyte spike level by a factor of 4 or greater.
Exceptions: None.
10. Serial Dilution sample analysis (SRD). "Source" is parent field sample diluted 1:5 in the laboratory.
Performed for ICP-OE and ICP-MS metals analyses. Percent difference (%D) limits do not apply
when analyte concentration(s) are below 50x the source sample's MDL (or 10x it's PQL).
Exceptions: None.
11. Internal standards, criteria specified for ICP-MS analyses only, monitored at the instrument.
Exceptions: None.
12. Any calibration using more than two-points produced a correlation coefficient equal to or greater than
0.995.
Exceptions: None.
Page 2 of 77

Certificate of AnalysisBarker-Hughesville_Pilot Study_MAR 2013_D353
DG-353
Project Name:
TDF #:
Acronyms and Definitions:
Relative Percent Difference (difference divided by the mean)RPD
Parts per million (millligrams per liter). Solids equivalent = mg/Kg.mg/L
J
MDL
PQL
Data Estimated qualifier (also applied to all data less than PQL, greater than or equal to MDL)
Method Detection Limit
Practical Quantitation Limit, also known as reporting limit.
Analyte NOT DETECTED at or above the Method Detection Limit (MDL)<
%R Percent recovery, analyzed (less sample contribution) divided by true value
%D Percent difference, serial dilution criteria unit, difference divided by the original result.
ug/L Parts per billion (micrograms per liter). Solids equivalent = ug/Kg.
ESAT Environmental Services Assistance Team
M eth o d( s) S u m m a ry: A s de fined in the T e chn ical D irec tio n Fo rm (T D F ), som e o r all o f the m etho d s lis ted b elo w w er e u sed fo r th e d eter m ina tion o f the rep o rted targ et a naly te s. F ro m E P A ’s M eth od s fo r th e D eterm in a tio n o f M e ta ls in E nv iron m e nta l S am p les , S up ple m en t I , M a y 19 9 4, diss olve d, to ta l, an d/o r to tal re co ver ab le m eta ls w er e d ete rm ine d b y:
• M etho d 2 00 .7 / 6 01 0B usin g a P E O ptim a IC P -O E (IC P ). • M etho d 2 00 .8 / 6 02 0 usin g a P er kin -E lm e r E lan 6 00 0 IC P -M S . • M etho d 2 00 .2 for tota l rec ov erab le m e tals ( on ly) d ige stion . • M etho d 2 45 .1 usin g a P e rkin -E lm er FIM S C V A A (a qu eo us m e rcur y o n ly).
F ro m S ta n da rd M etho ds for the E xa m in atio n o f W a ter an d W a stew a ter , 1 8 th E d itio n, 1 99 2, M etho d 2 34 0B w as use d fo r the ca lcula te d ha rdn ess de term in atio n. H a rdn ess is re po rted a s m g (m illigra m ) eq uiv alen t C a C O 3 p er liter (L) de term in ed a s follo w s: C alc ulate d har dn ess = 2 .4 97 * (C alciu m , m g/ L) + 4 .1 18 * (M a gn esiu m , m g /L ). F ro m E P A ’s T est M e tho ds for E va lua ting S olid W a ste, P hy sica l/C h em ic al M eth od s, SW -84 6 ,
• M etho d 3 01 5 A w as use d for m icro w a ve as sisted tota l m eta ls d iges tio n. • M etho d 7 47 3 w as use d fo r m erc ur y in so lid s .
F ro m E P A ’s D e term in a tio n o f In org an ic An ion s b y Ion C h ro m ato g rap hy , R e vision 2 .1 , 1 9 93 , M e tho d 3 0 0.0 w a s u sed to d eterm in e t he anio n s. F ro m E P A ’s M eth od s fo r C h em ica l A na lysis o f W ate r a nd W a ste s , M ar ch 19 8 3:
• M etho d 3 10 .1 w as follo w ed fo r th e a lkalin ity d ete rm ina tio n . • M etho d 1 60 .1 w as follo w ed fo r grav im etric to tal disso lve d so lid s ( T D S ) d eterm in ation . • M etho d 1 60 .2 w as us ed for gr avim etric to tal s usp en de d sol id s (T SS ) d eterm in atio n. • M etho d 4 15 .3 w as us ed for total org an ic ca rb on (T O C ) de term in ation u sing eith er an A p ollo 90 0 0 o r P h oe nix 80 00
N o n-D is pe rsive IR (N D IR ) s yste m . A lso k no w n as diss olve d o rga nic c arb o n (D O C ) w h en p erfo rm ed o n the d is solv ed sa m ple fra ction .
T h e q ua lity co ntro l p roc ed ure s lis ted in the T D F re qu est w ere utilized b y E S A T to ve rify a cc urac y o f th e r esu lts an d to eva lua te an y m atrix in te rfere nce s.
No Recovery (matrix spike) - Often seen for calcium/magnesium when their concentration exceeds the spike level by > 4x.NR
NFGI USEPA Contract Laboratory Program National Functional Guidelines for Inorganic Data Review, October 2004
Sample Re-analysis. Usually seen on raw data and sequences for required sample dilutions due to over-range analytes.REU
D
Analyte not detected at or above MDL qualifier
Diluted value qualifier.
Page 3 of 77

Certificate of AnalysisBarker-Hughesville_Pilot Study_MAR 2013_D353
DG-353
Project Name:
TDF #:
Parameter UnitsResults QualifierMDL Analyzed BatchMethod By
Dilution
Factor
13BH-BENCH-OXDStation ID: Date / Time Sampled:
Lab Number:
02/25/13 16:00
Matrix: Surface Water C130301-01EPA Tag No.:
C130301Workorder:
No Tag Prefix-A A
Metals (Dissolved) by EPA 200/7000 Series Methods
Aluminum SVug/L 1303010200.7 03/08/20136250 5100
SVug/L 1303010200.7 03/08/2013< 25.0 5Beryllium 10.0U
Calcium SVug/L 1303010200.7 03/08/201395900 5500
Copper SVug/L 1303010200.7 03/08/2013421 510.0
Iron SVug/L 1303010200.7 03/08/201379200 5500
Magnesium SVug/L 1303010200.7 03/08/201320900 5500
Manganese SVug/L 1303010200.7 03/08/201391200 510.0
Potassium SVug/L 1303010200.7 03/08/20132110 51250J
Sodium SVug/L 1303010200.7 03/08/20138310 51250
Zinc SVug/L 1303010200.7 03/08/201340700 550.0
SVug/L 1303011200.8 03/08/2013< 5.00 5Antimony 2.50U
Arsenic SVug/L 1303011200.8 03/08/20134.81 52.50J
SVug/L 1303011200.8 03/08/2013< 50.0 5Barium 25.0U
Cadmium SVug/L 1303011200.8 03/08/2013138 50.500
SVug/L 1303011200.8 03/08/2013< 10.0 5Chromium 5.00U
Cobalt SVug/L 1303011200.8 03/08/201327.7 50.500
Lead SVug/L 1303011200.8 03/08/201382.6 50.500
Nickel SVug/L 1303011200.8 03/08/201326.4 52.50
Selenium SVug/L 1303011200.8 03/08/20135.14 52.50
SVug/L 1303011200.8 03/08/2013< 5.00 5Silver 2.50U
SVug/L 1303011200.8 03/08/2013< 5.00 5Thallium 2.50U
SVug/L 1303011200.8 03/08/2013< 15.0 5Vanadium 10.0U
Hardness SVmg/L 13030102340B 03/08/2013325 58
Page 4 of 77

Certificate of AnalysisBarker-Hughesville_Pilot Study_MAR 2013_D353
DG-353
Project Name:
TDF #:
Parameter UnitsResults QualifierMDL Analyzed BatchMethod By
Dilution
Factor
13BH-DT-BENCH-PH45-CHITStation ID: Date / Time Sampled:
Lab Number:
02/26/13 12:00
Matrix: Surface Water C130301-04EPA Tag No.:
C130301Workorder:
No Tag Prefix-A A
Metals (Dissolved) by EPA 200/7000 Series Methods
Aluminum SVug/L 1303010200.7 03/08/20133810 5100
SVug/L 1303010200.7 03/08/2013< 25.0 5Beryllium 10.0U
Calcium SVug/L 1303010200.7 03/08/2013186000 5500
Copper SVug/L 1303010200.7 03/08/2013307 510.0
SVug/L 1303010200.7 03/08/2013< 1250 5Iron 500U
Magnesium SVug/L 1303010200.7 03/08/201327900 5500
Manganese SVug/L 1303010200.7 03/08/201387400 510.0
Potassium SVug/L 1303010200.7 03/08/20135190 51250
Sodium SVug/L 1303010200.7 03/08/201322500 51250
Zinc SVug/L 1303010200.7 03/08/201337300 550.0
SVug/L 1303011200.8 03/08/2013< 5.00 5Antimony 2.50U
Arsenic SVug/L 1303011200.8 03/08/20135.06 52.50J
SVug/L 1303011200.8 03/08/2013< 50.0 5Barium 25.0U
Cadmium SVug/L 1303011200.8 03/08/2013129 50.500
SVug/L 1303011200.8 03/08/2013< 10.0 5Chromium 5.00U
Cobalt SVug/L 1303011200.8 03/08/201324.4 50.500
Lead SVug/L 1303011200.8 03/08/20131.51 50.500
Nickel SVug/L 1303011200.8 03/08/201321.9 52.50
Selenium SVug/L 1303011200.8 03/08/20134.85 52.50J
SVug/L 1303011200.8 03/08/2013< 5.00 5Silver 2.50U
SVug/L 1303011200.8 03/08/2013< 5.00 5Thallium 2.50U
SVug/L 1303011200.8 03/08/2013< 15.0 5Vanadium 10.0U
Hardness SVmg/L 13030102340B 03/08/2013579 58
Page 5 of 77

Certificate of AnalysisBarker-Hughesville_Pilot Study_MAR 2013_D353
DG-353
Project Name:
TDF #:
Parameter UnitsResults QualifierMDL Analyzed BatchMethod By
Dilution
Factor
13BH-DT-BENCH-PH45-LIMEStation ID: Date / Time Sampled:
Lab Number:
02/25/13 18:30
Matrix: Surface Water C130301-07EPA Tag No.:
C130301Workorder:
No Tag Prefix-A A
Metals (Dissolved) by EPA 200/7000 Series Methods
Aluminum SVug/L 1303010200.7 03/08/20135520 5100
SVug/L 1303010200.7 03/08/2013< 25.0 5Beryllium 10.0U
Calcium SVug/L 1303010200.7 03/08/2013189000 5500
Copper SVug/L 1303010200.7 03/08/2013397 510.0
SVug/L 1303010200.7 03/08/2013< 1250 5Iron 500U
Magnesium SVug/L 1303010200.7 03/08/201321900 5500
Manganese SVug/L 1303010200.7 03/08/201389100 510.0
Potassium SVug/L 1303010200.7 03/08/20131320 51250J
Sodium SVug/L 1303010200.7 03/08/20138260 51250
Zinc SVug/L 1303010200.7 03/08/201340000 550.0
SVug/L 1303011200.8 03/08/2013< 5.00 5Antimony 2.50U
SVug/L 1303011200.8 03/08/2013< 10.0 5Arsenic 2.50U
SVug/L 1303011200.8 03/08/2013< 50.0 5Barium 25.0U
Cadmium SVug/L 1303011200.8 03/08/2013137 50.500
SVug/L 1303011200.8 03/08/2013< 10.0 5Chromium 5.00U
Cobalt SVug/L 1303011200.8 03/08/201326.5 50.500
Lead SVug/L 1303011200.8 03/08/201318.5 50.500
Nickel SVug/L 1303011200.8 03/08/201325.2 52.50
Selenium SVug/L 1303011200.8 03/08/20134.83 52.50J
SVug/L 1303011200.8 03/08/2013< 5.00 5Silver 2.50U
SVug/L 1303011200.8 03/08/2013< 5.00 5Thallium 2.50U
SVug/L 1303011200.8 03/08/2013< 15.0 5Vanadium 10.0U
Hardness SVmg/L 13030102340B 03/08/2013562 58
Page 6 of 77

Certificate of AnalysisBarker-Hughesville_Pilot Study_MAR 2013_D353
DG-353
Project Name:
TDF #:
Parameter UnitsResults QualifierMDL Analyzed BatchMethod By
Dilution
Factor
13BH-DT-BENCH-PH45-NAOHStation ID: Date / Time Sampled:
Lab Number:
02/25/13 16:45
Matrix: Surface Water C130301-11EPA Tag No.:
C130301Workorder:
No Tag Prefix-A A
Metals (Dissolved) by EPA 200/7000 Series Methods
Aluminum SVug/L 1303010200.7 03/08/20135190 5100
SVug/L 1303010200.7 03/08/2013< 25.0 5Beryllium 10.0U
Calcium SVug/L 1303010200.7 03/08/201395400 5500
Copper SVug/L 1303010200.7 03/08/2013406 510.0
SVug/L 1303010200.7 03/08/2013< 1250 5Iron 500U
Magnesium SVug/L 1303010200.7 03/08/201320900 5500
Manganese SVug/L 1303010200.7 03/08/201387100 510.0
Potassium SVug/L 1303010200.7 03/08/20131440 51250J
Sodium SVug/L 1303010200.7 03/08/2013121000 51250
Zinc SVug/L 1303010200.7 03/08/201339700 550.0
SVug/L 1303011200.8 03/08/2013< 5.00 5Antimony 2.50U
Arsenic SVug/L 1303011200.8 03/08/20132.96 52.50J
SVug/L 1303011200.8 03/08/2013< 50.0 5Barium 25.0U
Cadmium SVug/L 1303011200.8 03/08/2013148 50.500
SVug/L 1303011200.8 03/08/2013< 10.0 5Chromium 5.00U
Cobalt SVug/L 1303011200.8 03/08/201327.3 50.500
Lead SVug/L 1303011200.8 03/08/20137.52 50.500
Nickel SVug/L 1303011200.8 03/08/201326.2 52.50
Selenium SVug/L 1303011200.8 03/08/20138.73 52.50
SVug/L 1303011200.8 03/08/2013< 5.00 5Silver 2.50U
SVug/L 1303011200.8 03/08/2013< 5.00 5Thallium 2.50U
SVug/L 1303011200.8 03/08/2013< 15.0 5Vanadium 10.0U
Hardness SVmg/L 13030102340B 03/08/2013324 58
Page 7 of 77

Certificate of AnalysisBarker-Hughesville_Pilot Study_MAR 2013_D353
DG-353
Project Name:
TDF #:
Parameter UnitsResults QualifierMDL Analyzed BatchMethod By
Dilution
Factor
13BH-DT-BENCH-PH95-LIMEStation ID: Date / Time Sampled:
Lab Number:
02/27/13 10:30
Matrix: Surface Water C130301-15EPA Tag No.:
C130301Workorder:
No Tag Prefix-A A
Metals (Dissolved) by EPA 200/7000 Series Methods
SVug/L 1303010200.7 03/08/2013< 250 5Aluminum 100U
SVug/L 1303010200.7 03/08/2013< 25.0 5Beryllium 10.0U
Calcium SVug/L 1303010200.7 03/08/2013303000 5500
SVug/L 1303010200.7 03/08/2013< 10.0 5Copper 10.0U
SVug/L 1303010200.7 03/08/2013< 1250 5Iron 500U
Magnesium SVug/L 1303010200.7 03/08/201320600 5500
Manganese SVug/L 1303010200.7 03/08/20133030 510.0
Potassium SVug/L 1303010200.7 03/08/20131600 51250J
Sodium SVug/L 1303010200.7 03/08/20138260 51250
Zinc SVug/L 1303010200.7 03/08/201357.7 550.0J
SVug/L 1303011200.8 03/08/2013< 5.00 5Antimony 2.50U
SVug/L 1303011200.8 03/08/2013< 10.0 5Arsenic 2.50U
SVug/L 1303011200.8 03/08/2013< 50.0 5Barium 25.0U
Cadmium SVug/L 1303011200.8 03/08/20130.708 50.500J
SVug/L 1303011200.8 03/08/2013< 10.0 5Chromium 5.00U
SVug/L 1303011200.8 03/08/2013< 1.00 5Cobalt 0.500U
SVug/L 1303011200.8 03/08/2013< 1.00 5Lead 0.500U
Nickel SVug/L 1303011200.8 03/08/20133.56 52.50J
Selenium SVug/L 1303011200.8 03/08/20133.56 52.50J
SVug/L 1303011200.8 03/08/2013< 5.00 5Silver 2.50U
SVug/L 1303011200.8 03/08/2013< 5.00 5Thallium 2.50U
SVug/L 1303011200.8 03/08/2013< 15.0 5Vanadium 10.0U
Hardness SVmg/L 13030102340B 03/08/2013842 58
Page 8 of 77
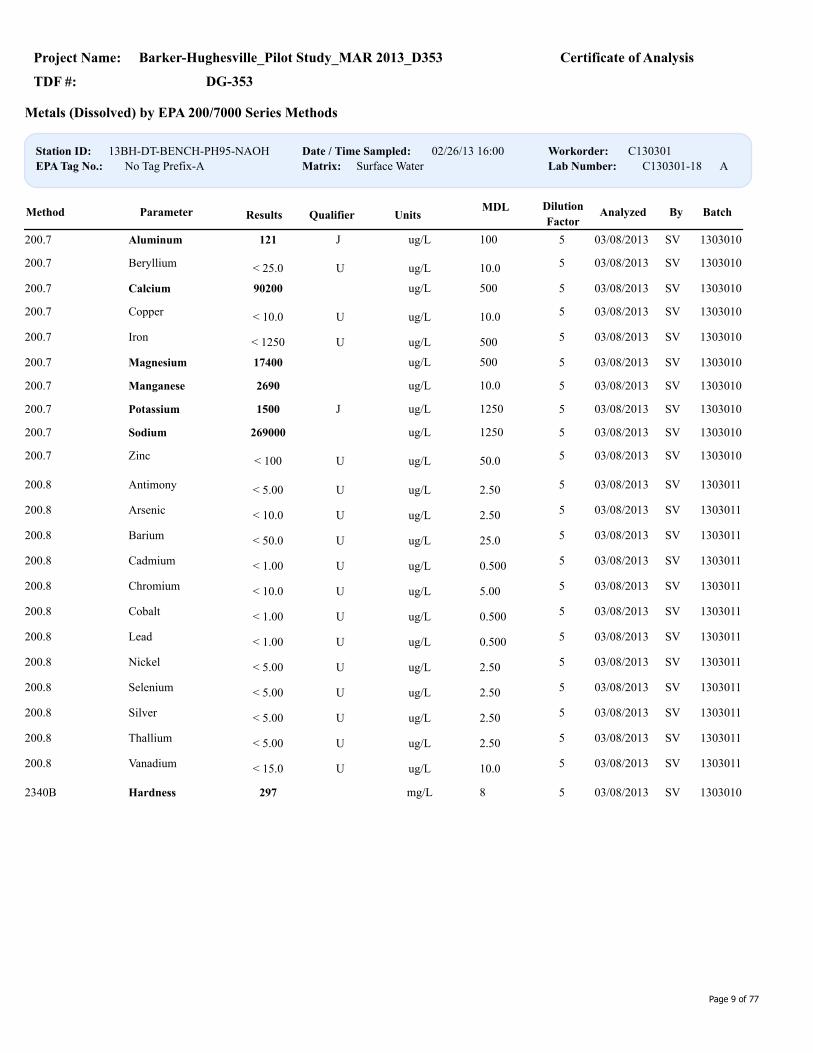
Certificate of AnalysisBarker-Hughesville_Pilot Study_MAR 2013_D353
DG-353
Project Name:
TDF #:
Parameter UnitsResults QualifierMDL Analyzed BatchMethod By
Dilution
Factor
13BH-DT-BENCH-PH95-NAOHStation ID: Date / Time Sampled:
Lab Number:
02/26/13 16:00
Matrix: Surface Water C130301-18EPA Tag No.:
C130301Workorder:
No Tag Prefix-A A
Metals (Dissolved) by EPA 200/7000 Series Methods
Aluminum SVug/L 1303010200.7 03/08/2013121 5100J
SVug/L 1303010200.7 03/08/2013< 25.0 5Beryllium 10.0U
Calcium SVug/L 1303010200.7 03/08/201390200 5500
SVug/L 1303010200.7 03/08/2013< 10.0 5Copper 10.0U
SVug/L 1303010200.7 03/08/2013< 1250 5Iron 500U
Magnesium SVug/L 1303010200.7 03/08/201317400 5500
Manganese SVug/L 1303010200.7 03/08/20132690 510.0
Potassium SVug/L 1303010200.7 03/08/20131500 51250J
Sodium SVug/L 1303010200.7 03/08/2013269000 51250
SVug/L 1303010200.7 03/08/2013< 100 5Zinc 50.0U
SVug/L 1303011200.8 03/08/2013< 5.00 5Antimony 2.50U
SVug/L 1303011200.8 03/08/2013< 10.0 5Arsenic 2.50U
SVug/L 1303011200.8 03/08/2013< 50.0 5Barium 25.0U
SVug/L 1303011200.8 03/08/2013< 1.00 5Cadmium 0.500U
SVug/L 1303011200.8 03/08/2013< 10.0 5Chromium 5.00U
SVug/L 1303011200.8 03/08/2013< 1.00 5Cobalt 0.500U
SVug/L 1303011200.8 03/08/2013< 1.00 5Lead 0.500U
SVug/L 1303011200.8 03/08/2013< 5.00 5Nickel 2.50U
SVug/L 1303011200.8 03/08/2013< 5.00 5Selenium 2.50U
SVug/L 1303011200.8 03/08/2013< 5.00 5Silver 2.50U
SVug/L 1303011200.8 03/08/2013< 5.00 5Thallium 2.50U
SVug/L 1303011200.8 03/08/2013< 15.0 5Vanadium 10.0U
Hardness SVmg/L 13030102340B 03/08/2013297 58
Page 9 of 77

Certificate of AnalysisBarker-Hughesville_Pilot Study_MAR 2013_D353
DG-353
Project Name:
TDF #:
Parameter UnitsResults QualifierMDL Analyzed BatchMethod By
Dilution
Factor
13BH-DT-BENCH-RAWStation ID: Date / Time Sampled:
Lab Number:
02/25/13 14:00
Matrix: Surface Water C130301-21EPA Tag No.:
C130301Workorder:
No Tag Prefix-A A
Metals (Dissolved) by EPA 200/7000 Series Methods
Aluminum SVug/L 1303010200.7 03/08/20136370 5100
SVug/L 1303010200.7 03/08/2013< 25.0 5Beryllium 10.0U
Calcium SVug/L 1303010200.7 03/08/201395600 5500
Copper SVug/L 1303010200.7 03/08/2013426 510.0
Iron SVug/L 1303010200.7 03/08/201378000 5500
Magnesium SVug/L 1303010200.7 03/08/201320700 5500
Manganese SVug/L 1303010200.7 03/08/201390200 510.0
SVug/L 1303010200.7 03/08/2013< 5000 5Potassium 1250U
Sodium SVug/L 1303010200.7 03/08/20137930 51250
Zinc SVug/L 1303010200.7 03/08/201339800 550.0
SVug/L 1303011200.8 03/08/2013< 5.00 5Antimony 2.50U
Arsenic SVug/L 1303011200.8 03/08/20135.19 52.50J
SVug/L 1303011200.8 03/08/2013< 50.0 5Barium 25.0U
Cadmium SVug/L 1303011200.8 03/08/2013141 50.500
SVug/L 1303011200.8 03/08/2013< 10.0 5Chromium 5.00U
Cobalt SVug/L 1303011200.8 03/08/201326.5 50.500
Lead SVug/L 1303011200.8 03/08/201387.1 50.500
Nickel SVug/L 1303011200.8 03/08/201321.8 52.50
Selenium SVug/L 1303011200.8 03/08/20134.18 52.50J
SVug/L 1303011200.8 03/08/2013< 5.00 5Silver 2.50U
SVug/L 1303011200.8 03/08/2013< 5.00 5Thallium 2.50U
SVug/L 1303011200.8 03/08/2013< 15.0 5Vanadium 10.0U
Hardness SVmg/L 13030102340B 03/08/2013324 58
Page 10 of 77

Certificate of AnalysisBarker-Hughesville_Pilot Study_MAR 2013_D353
DG-353
Project Name:
TDF #:
Parameter UnitsResults QualifierMDL Analyzed BatchMethod By
Dilution
Factor
13BH-DT-BENCH-SPS-C1Station ID: Date / Time Sampled:
Lab Number:
02/27/13 14:05
Matrix: Surface Water C130301-24EPA Tag No.:
C130301Workorder:
No Tag Prefix-A A
Metals (Dissolved) by EPA 200/7000 Series Methods
SVug/L 1303010200.7 03/08/2013< 500 10Aluminum 200U
SVug/L 1303010200.7 03/08/2013< 50.0 10Beryllium 20.0U
Calcium SVug/L 1303010200.7 03/08/201399200 101000
Copper SVug/L 1303010200.7 03/08/201334.9 1020.0
SVug/L 1303010200.7 03/08/2013< 2500 10Iron 1000U
Magnesium SVug/L 1303010200.7 03/08/201365600 101000
Manganese SVug/L 1303010200.7 03/08/20137270 1020.0
Potassium SVug/L 1303010200.7 03/08/2013253000 102500
Sodium SVug/L 1303010200.7 03/08/2013156000 102500
Zinc SVug/L 1303010200.7 03/08/2013189 10100J
SVug/L 1303011200.8 03/08/2013< 10.0 10Antimony 5.00U
Arsenic SVug/L 1303011200.8 03/08/201329.3 105.00
Barium SVug/L 1303011200.8 03/08/201360.4 1050.0J
SVug/L 1303011200.8 03/08/2013< 2.00 10Cadmium 1.00U
SVug/L 1303011200.8 03/08/2013< 20.0 10Chromium 10.0U
Cobalt SVug/L 1303011200.8 03/08/20135.40 101.00
Lead SVug/L 1303011200.8 03/08/20131.90 101.00J
Nickel SVug/L 1303011200.8 03/08/201316.7 105.00
SVug/L 1303011200.8 03/08/2013< 10.0 10Selenium 5.00U
SVug/L 1303011200.8 03/08/2013< 10.0 10Silver 5.00U
SVug/L 1303011200.8 03/08/2013< 10.0 10Thallium 5.00U
Vanadium SVug/L 1303011200.8 03/08/201348.4 1020.0
Hardness SVmg/L 13030102340B 03/08/2013518 1015
Page 11 of 77

Certificate of AnalysisBarker-Hughesville_Pilot Study_MAR 2013_D353
DG-353
Project Name:
TDF #:
Parameter UnitsResults QualifierMDL Analyzed BatchMethod By
Dilution
Factor
13BH-DT-BENCH-SPS-C2Station ID: Date / Time Sampled:
Lab Number:
02/27/13 14:15
Matrix: Surface Water C130301-27EPA Tag No.:
C130301Workorder:
No Tag Prefix-A A
Metals (Dissolved) by EPA 200/7000 Series Methods
SVug/L 1303010200.7 03/08/2013< 500 10Aluminum 200U
SVug/L 1303010200.7 03/08/2013< 50.0 10Beryllium 20.0U
Calcium SVug/L 1303010200.7 03/08/2013172000 101000
Copper SVug/L 1303010200.7 03/08/201326.6 1020.0
SVug/L 1303010200.7 03/08/2013< 2500 10Iron 1000U
Magnesium SVug/L 1303010200.7 03/08/201373000 101000
Manganese SVug/L 1303010200.7 03/08/201317900 1020.0
Potassium SVug/L 1303010200.7 03/08/2013221000 102500
Sodium SVug/L 1303010200.7 03/08/201352500 102500
Zinc SVug/L 1303010200.7 03/08/2013301 10100
SVug/L 1303011200.8 03/08/2013< 10.0 10Antimony 5.00U
Arsenic SVug/L 1303011200.8 03/08/201327.5 105.00
Barium SVug/L 1303011200.8 03/08/201359.3 1050.0J
SVug/L 1303011200.8 03/08/2013< 2.00 10Cadmium 1.00U
SVug/L 1303011200.8 03/08/2013< 20.0 10Chromium 10.0U
Cobalt SVug/L 1303011200.8 03/08/20134.35 101.00
Lead SVug/L 1303011200.8 03/08/20131.13 101.00J
Nickel SVug/L 1303011200.8 03/08/201313.4 105.00
Selenium SVug/L 1303011200.8 03/08/201311.4 105.00
SVug/L 1303011200.8 03/08/2013< 10.0 10Silver 5.00U
SVug/L 1303011200.8 03/08/2013< 10.0 10Thallium 5.00U
Vanadium SVug/L 1303011200.8 03/08/201339.0 1020.0
Hardness SVmg/L 13030102340B 03/08/2013730 1015
Page 12 of 77
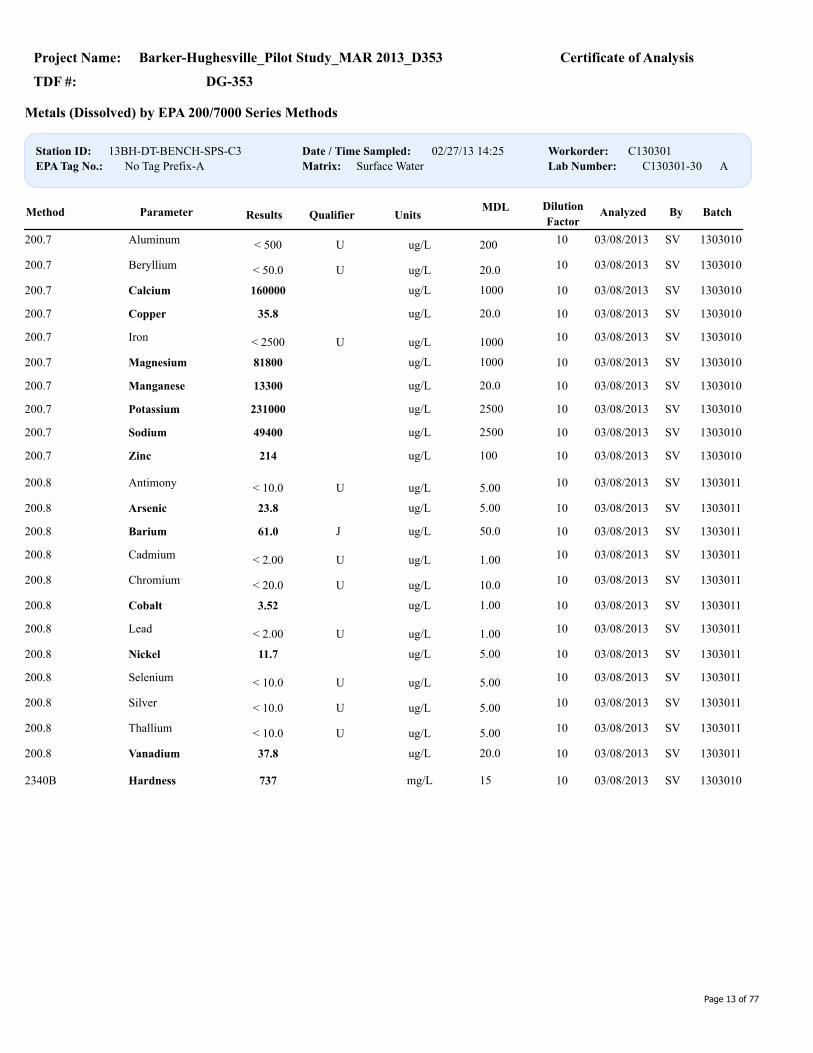
Certificate of AnalysisBarker-Hughesville_Pilot Study_MAR 2013_D353
DG-353
Project Name:
TDF #:
Parameter UnitsResults QualifierMDL Analyzed BatchMethod By
Dilution
Factor
13BH-DT-BENCH-SPS-C3Station ID: Date / Time Sampled:
Lab Number:
02/27/13 14:25
Matrix: Surface Water C130301-30EPA Tag No.:
C130301Workorder:
No Tag Prefix-A A
Metals (Dissolved) by EPA 200/7000 Series Methods
SVug/L 1303010200.7 03/08/2013< 500 10Aluminum 200U
SVug/L 1303010200.7 03/08/2013< 50.0 10Beryllium 20.0U
Calcium SVug/L 1303010200.7 03/08/2013160000 101000
Copper SVug/L 1303010200.7 03/08/201335.8 1020.0
SVug/L 1303010200.7 03/08/2013< 2500 10Iron 1000U
Magnesium SVug/L 1303010200.7 03/08/201381800 101000
Manganese SVug/L 1303010200.7 03/08/201313300 1020.0
Potassium SVug/L 1303010200.7 03/08/2013231000 102500
Sodium SVug/L 1303010200.7 03/08/201349400 102500
Zinc SVug/L 1303010200.7 03/08/2013214 10100
SVug/L 1303011200.8 03/08/2013< 10.0 10Antimony 5.00U
Arsenic SVug/L 1303011200.8 03/08/201323.8 105.00
Barium SVug/L 1303011200.8 03/08/201361.0 1050.0J
SVug/L 1303011200.8 03/08/2013< 2.00 10Cadmium 1.00U
SVug/L 1303011200.8 03/08/2013< 20.0 10Chromium 10.0U
Cobalt SVug/L 1303011200.8 03/08/20133.52 101.00
SVug/L 1303011200.8 03/08/2013< 2.00 10Lead 1.00U
Nickel SVug/L 1303011200.8 03/08/201311.7 105.00
SVug/L 1303011200.8 03/08/2013< 10.0 10Selenium 5.00U
SVug/L 1303011200.8 03/08/2013< 10.0 10Silver 5.00U
SVug/L 1303011200.8 03/08/2013< 10.0 10Thallium 5.00U
Vanadium SVug/L 1303011200.8 03/08/201337.8 1020.0
Hardness SVmg/L 13030102340B 03/08/2013737 1015
Page 13 of 77

Certificate of AnalysisBarker-Hughesville_Pilot Study_MAR 2013_D353
DG-353
Project Name:
TDF #:
Parameter UnitsResults QualifierMDL Analyzed BatchMethod By
Dilution
Factor
13BH-DT-BENCH-SPS-C4Station ID: Date / Time Sampled:
Lab Number:
02/27/13 14:35
Matrix: Surface Water C130301-33EPA Tag No.:
C130301Workorder:
No Tag Prefix-A A
Metals (Dissolved) by EPA 200/7000 Series Methods
SVug/L 1303010200.7 03/08/2013< 500 10Aluminum 200U
SVug/L 1303010200.7 03/08/2013< 50.0 10Beryllium 20.0U
Calcium SVug/L 1303010200.7 03/08/2013198000 101000
Copper SVug/L 1303010200.7 03/08/201379.8 1020.0
SVug/L 1303010200.7 03/08/2013< 2500 10Iron 1000U
Magnesium SVug/L 1303010200.7 03/08/2013103000 101000
SVug/L 1303010200.7 03/08/2013< 50.0 10Manganese 20.0U
Potassium SVug/L 1303010200.7 03/08/2013138000 102500
Sodium SVug/L 1303010200.7 03/08/2013424000 102500
SVug/L 1303010200.7 03/08/2013< 200 10Zinc 100U
SVug/L 1303011200.8 03/08/2013< 10.0 10Antimony 5.00U
Arsenic SVug/L 1303011200.8 03/08/2013127 105.00
SVug/L 1303011200.8 03/08/2013< 100 10Barium 50.0U
Cadmium SVug/L 1303011200.8 03/08/20132.41 101.00
Chromium SVug/L 1303011200.8 03/08/201324.8 1010.0
SVug/L 1303011200.8 03/08/2013< 2.00 10Cobalt 1.00U
SVug/L 1303011200.8 03/08/2013< 2.00 10Lead 1.00U
Nickel SVug/L 1303011200.8 03/08/201326.5 105.00
Selenium SVug/L 1303011200.8 03/08/201349.6 105.00
SVug/L 1303011200.8 03/08/2013< 10.0 10Silver 5.00U
SVug/L 1303011200.8 03/08/2013< 10.0 10Thallium 5.00U
Vanadium SVug/L 1303011200.8 03/08/201328.3 1020.0J
Hardness SVmg/L 13030102340B 03/08/2013918 1015
"J" Qualifier indicates an estimated value
Page 14 of 77

Certificate of AnalysisBarker-Hughesville_Pilot Study_MAR 2013_D353
DG-353
Project Name:
TDF #:
Parameter UnitsResults QualifierMDL Analyzed BatchMethod By
Dilution
Factor
13BH-BENCH-OXDStation ID: Date / Time Sampled:
Lab Number:
02/25/13 16:00
Matrix: Surface Water C130301-02EPA Tag No.:
C130301Workorder:
No Tag Prefix-B A
Metals (Total Recov) by EPA 200/7000 Series Methods
Aluminum SVug/L 1303008200.7 03/08/20136440 5100
SVug/L 1303008200.7 03/08/2013< 25.0 5Beryllium 10.0U
Calcium SVug/L 1303008200.7 03/08/201394100 5500
Copper SVug/L 1303008200.7 03/08/2013399 510.0
Iron SVug/L 1303008200.7 03/08/201377900 5500
Magnesium SVug/L 1303008200.7 03/08/201320400 5500
Manganese SVug/L 1303008200.7 03/08/201389400 510.0
Potassium SVug/L 1303008200.7 03/08/20131630 51250J
Sodium SVug/L 1303008200.7 03/08/20135980 51250
Zinc SVug/L 1303008200.7 03/08/201338700 550.0
SVug/L 1303008200.8 03/08/2013< 5.00 5Antimony 2.50U
Arsenic SVug/L 1303008200.8 03/08/20138.10 52.50J
SVug/L 1303008200.8 03/08/2013< 50.0 5Barium 25.0U
Cadmium SVug/L 1303008200.8 03/08/2013136 50.500
SVug/L 1303008200.8 03/08/2013< 10.0 5Chromium 5.00U
Cobalt SVug/L 1303008200.8 03/08/201325.4 50.500
Lead SVug/L 1303008200.8 03/08/201374.7 50.500
Nickel SVug/L 1303008200.8 03/08/201325.9 52.50
Selenium SVug/L 1303008200.8 03/08/20137.59 52.50
SVug/L 1303008200.8 03/08/2013< 5.00 5Silver 2.50U
Thallium SVug/L 1303008200.8 03/08/20136.89 52.50
SVug/L 1303008200.8 03/08/2013< 15.0 5Vanadium 10.0U
Page 15 of 77
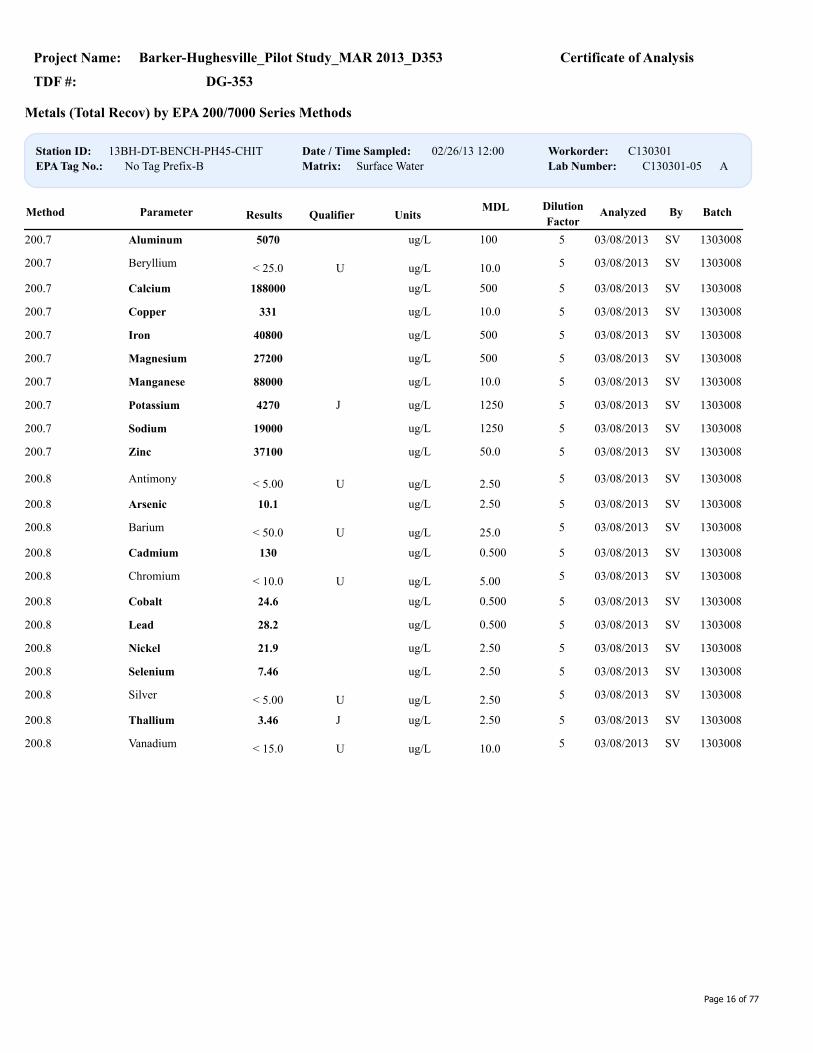
Certificate of AnalysisBarker-Hughesville_Pilot Study_MAR 2013_D353
DG-353
Project Name:
TDF #:
Parameter UnitsResults QualifierMDL Analyzed BatchMethod By
Dilution
Factor
13BH-DT-BENCH-PH45-CHITStation ID: Date / Time Sampled:
Lab Number:
02/26/13 12:00
Matrix: Surface Water C130301-05EPA Tag No.:
C130301Workorder:
No Tag Prefix-B A
Metals (Total Recov) by EPA 200/7000 Series Methods
Aluminum SVug/L 1303008200.7 03/08/20135070 5100
SVug/L 1303008200.7 03/08/2013< 25.0 5Beryllium 10.0U
Calcium SVug/L 1303008200.7 03/08/2013188000 5500
Copper SVug/L 1303008200.7 03/08/2013331 510.0
Iron SVug/L 1303008200.7 03/08/201340800 5500
Magnesium SVug/L 1303008200.7 03/08/201327200 5500
Manganese SVug/L 1303008200.7 03/08/201388000 510.0
Potassium SVug/L 1303008200.7 03/08/20134270 51250J
Sodium SVug/L 1303008200.7 03/08/201319000 51250
Zinc SVug/L 1303008200.7 03/08/201337100 550.0
SVug/L 1303008200.8 03/08/2013< 5.00 5Antimony 2.50U
Arsenic SVug/L 1303008200.8 03/08/201310.1 52.50
SVug/L 1303008200.8 03/08/2013< 50.0 5Barium 25.0U
Cadmium SVug/L 1303008200.8 03/08/2013130 50.500
SVug/L 1303008200.8 03/08/2013< 10.0 5Chromium 5.00U
Cobalt SVug/L 1303008200.8 03/08/201324.6 50.500
Lead SVug/L 1303008200.8 03/08/201328.2 50.500
Nickel SVug/L 1303008200.8 03/08/201321.9 52.50
Selenium SVug/L 1303008200.8 03/08/20137.46 52.50
SVug/L 1303008200.8 03/08/2013< 5.00 5Silver 2.50U
Thallium SVug/L 1303008200.8 03/08/20133.46 52.50J
SVug/L 1303008200.8 03/08/2013< 15.0 5Vanadium 10.0U
Page 16 of 77
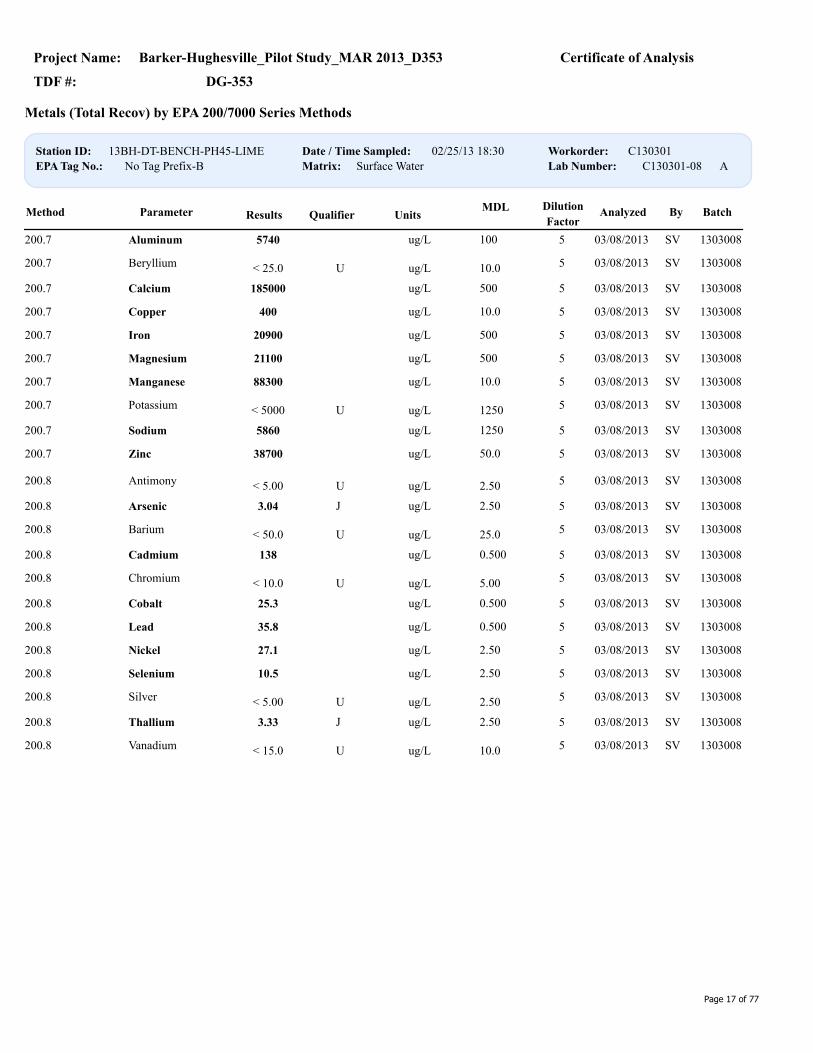
Certificate of AnalysisBarker-Hughesville_Pilot Study_MAR 2013_D353
DG-353
Project Name:
TDF #:
Parameter UnitsResults QualifierMDL Analyzed BatchMethod By
Dilution
Factor
13BH-DT-BENCH-PH45-LIMEStation ID: Date / Time Sampled:
Lab Number:
02/25/13 18:30
Matrix: Surface Water C130301-08EPA Tag No.:
C130301Workorder:
No Tag Prefix-B A
Metals (Total Recov) by EPA 200/7000 Series Methods
Aluminum SVug/L 1303008200.7 03/08/20135740 5100
SVug/L 1303008200.7 03/08/2013< 25.0 5Beryllium 10.0U
Calcium SVug/L 1303008200.7 03/08/2013185000 5500
Copper SVug/L 1303008200.7 03/08/2013400 510.0
Iron SVug/L 1303008200.7 03/08/201320900 5500
Magnesium SVug/L 1303008200.7 03/08/201321100 5500
Manganese SVug/L 1303008200.7 03/08/201388300 510.0
SVug/L 1303008200.7 03/08/2013< 5000 5Potassium 1250U
Sodium SVug/L 1303008200.7 03/08/20135860 51250
Zinc SVug/L 1303008200.7 03/08/201338700 550.0
SVug/L 1303008200.8 03/08/2013< 5.00 5Antimony 2.50U
Arsenic SVug/L 1303008200.8 03/08/20133.04 52.50J
SVug/L 1303008200.8 03/08/2013< 50.0 5Barium 25.0U
Cadmium SVug/L 1303008200.8 03/08/2013138 50.500
SVug/L 1303008200.8 03/08/2013< 10.0 5Chromium 5.00U
Cobalt SVug/L 1303008200.8 03/08/201325.3 50.500
Lead SVug/L 1303008200.8 03/08/201335.8 50.500
Nickel SVug/L 1303008200.8 03/08/201327.1 52.50
Selenium SVug/L 1303008200.8 03/08/201310.5 52.50
SVug/L 1303008200.8 03/08/2013< 5.00 5Silver 2.50U
Thallium SVug/L 1303008200.8 03/08/20133.33 52.50J
SVug/L 1303008200.8 03/08/2013< 15.0 5Vanadium 10.0U
Page 17 of 77

Certificate of AnalysisBarker-Hughesville_Pilot Study_MAR 2013_D353
DG-353
Project Name:
TDF #:
Parameter UnitsResults QualifierMDL Analyzed BatchMethod By
Dilution
Factor
13BH-DT-BENCH-PH45-NAOHStation ID: Date / Time Sampled:
Lab Number:
02/25/13 16:45
Matrix: Surface Water C130301-12EPA Tag No.:
C130301Workorder:
No Tag Prefix-B A
Metals (Total Recov) by EPA 200/7000 Series Methods
Aluminum SVug/L 1303008200.7 03/08/20135240 5100
SVug/L 1303008200.7 03/08/2013< 25.0 5Beryllium 10.0U
Calcium SVug/L 1303008200.7 03/08/201393200 5500
Copper SVug/L 1303008200.7 03/08/2013402 510.0
Iron SVug/L 1303008200.7 03/08/201311900 5500
Magnesium SVug/L 1303008200.7 03/08/201320300 5500
Manganese SVug/L 1303008200.7 03/08/201387800 510.0
SVug/L 1303008200.7 03/08/2013< 5000 5Potassium 1250U
Sodium SVug/L 1303008200.7 03/08/2013123000 51250
Zinc SVug/L 1303008200.7 03/08/201339200 550.0
SVug/L 1303008200.8 03/08/2013< 5.00 5Antimony 2.50U
Arsenic SVug/L 1303008200.8 03/08/20133.10 52.50J
SVug/L 1303008200.8 03/08/2013< 50.0 5Barium 25.0U
Cadmium SVug/L 1303008200.8 03/08/2013138 50.500
SVug/L 1303008200.8 03/08/2013< 10.0 5Chromium 5.00U
Cobalt SVug/L 1303008200.8 03/08/201326.2 50.500
Lead SVug/L 1303008200.8 03/08/201319.2 50.500
Nickel SVug/L 1303008200.8 03/08/201323.8 52.50
Selenium SVug/L 1303008200.8 03/08/20137.23 52.50
SVug/L 1303008200.8 03/08/2013< 5.00 5Silver 2.50U
Thallium SVug/L 1303008200.8 03/08/20132.83 52.50J
SVug/L 1303008200.8 03/08/2013< 15.0 5Vanadium 10.0U
Page 18 of 77

Certificate of AnalysisBarker-Hughesville_Pilot Study_MAR 2013_D353
DG-353
Project Name:
TDF #:
Parameter UnitsResults QualifierMDL Analyzed BatchMethod By
Dilution
Factor
13BH-DT-BENCH-PH95-LIMEStation ID: Date / Time Sampled:
Lab Number:
02/27/13 10:30
Matrix: Surface Water C130301-16EPA Tag No.:
C130301Workorder:
No Tag Prefix-B A
Metals (Total Recov) by EPA 200/7000 Series Methods
Aluminum SVug/L 1303008200.7 03/08/2013123 5100J
SVug/L 1303008200.7 03/08/2013< 25.0 5Beryllium 10.0U
Calcium SVug/L 1303008200.7 03/08/2013296000 5500
Copper SVug/L 1303008200.7 03/08/201310.2 510.0
SVug/L 1303008200.7 03/08/2013< 1250 5Iron 500U
Magnesium SVug/L 1303008200.7 03/08/201319700 5500
Manganese SVug/L 1303008200.7 03/08/20133770 510.0
SVug/L 1303008200.7 03/08/2013< 5000 5Potassium 1250U
Sodium SVug/L 1303008200.7 03/08/20135710 51250
Zinc SVug/L 1303008200.7 03/08/2013268 550.0
SVug/L 1303008200.8 03/08/2013< 5.00 5Antimony 2.50U
SVug/L 1303008200.8 03/08/2013< 10.0 5Arsenic 2.50U
SVug/L 1303008200.8 03/08/2013< 50.0 5Barium 25.0U
Cadmium SVug/L 1303008200.8 03/08/20131.44 50.500
SVug/L 1303008200.8 03/08/2013< 10.0 5Chromium 5.00U
SVug/L 1303008200.8 03/08/2013< 1.00 5Cobalt 0.500U
Lead SVug/L 1303008200.8 03/08/20130.575 50.500J
SVug/L 1303008200.8 03/08/2013< 5.00 5Nickel 2.50U
SVug/L 1303008200.8 03/08/2013< 5.00 5Selenium 2.50U
SVug/L 1303008200.8 03/08/2013< 5.00 5Silver 2.50U
SVug/L 1303008200.8 03/08/2013< 5.00 5Thallium 2.50U
SVug/L 1303008200.8 03/08/2013< 15.0 5Vanadium 10.0U
Page 19 of 77

Certificate of AnalysisBarker-Hughesville_Pilot Study_MAR 2013_D353
DG-353
Project Name:
TDF #:
Parameter UnitsResults QualifierMDL Analyzed BatchMethod By
Dilution
Factor
13BH-DT-BENCH-PH95-NAOHStation ID: Date / Time Sampled:
Lab Number:
02/26/13 16:00
Matrix: Surface Water C130301-19EPA Tag No.:
C130301Workorder:
No Tag Prefix-B A
Metals (Total Recov) by EPA 200/7000 Series Methods
Aluminum SVug/L 1303008200.7 03/08/2013321 5100
SVug/L 1303008200.7 03/08/2013< 25.0 5Beryllium 10.0U
Calcium SVug/L 1303008200.7 03/08/201389700 5500
Copper SVug/L 1303008200.7 03/08/201321.2 510.0
Iron SVug/L 1303008200.7 03/08/20132180 5500
Magnesium SVug/L 1303008200.7 03/08/201317100 5500
Manganese SVug/L 1303008200.7 03/08/20135690 510.0
SVug/L 1303008200.7 03/08/2013< 5000 5Potassium 1250U
Sodium SVug/L 1303008200.7 03/08/2013266000 51250
Zinc SVug/L 1303008200.7 03/08/20131240 550.0
SVug/L 1303008200.8 03/08/2013< 5.00 5Antimony 2.50U
SVug/L 1303008200.8 03/08/2013< 10.0 5Arsenic 2.50U
SVug/L 1303008200.8 03/08/2013< 50.0 5Barium 25.0U
Cadmium SVug/L 1303008200.8 03/08/20134.49 50.500
SVug/L 1303008200.8 03/08/2013< 10.0 5Chromium 5.00U
SVug/L 1303008200.8 03/08/2013< 1.00 5Cobalt 0.500U
Lead SVug/L 1303008200.8 03/08/20132.41 50.500
SVug/L 1303008200.8 03/08/2013< 5.00 5Nickel 2.50U
Selenium SVug/L 1303008200.8 03/08/20133.22 52.50J
SVug/L 1303008200.8 03/08/2013< 5.00 5Silver 2.50U
SVug/L 1303008200.8 03/08/2013< 5.00 5Thallium 2.50U
SVug/L 1303008200.8 03/08/2013< 15.0 5Vanadium 10.0U
Page 20 of 77

Certificate of AnalysisBarker-Hughesville_Pilot Study_MAR 2013_D353
DG-353
Project Name:
TDF #:
Parameter UnitsResults QualifierMDL Analyzed BatchMethod By
Dilution
Factor
13BH-DT-BENCH-RAWStation ID: Date / Time Sampled:
Lab Number:
02/25/13 14:00
Matrix: Surface Water C130301-22EPA Tag No.:
C130301Workorder:
No Tag Prefix-B A
Metals (Total Recov) by EPA 200/7000 Series Methods
Aluminum SVug/L 1303008200.7 03/08/20136490 5100
SVug/L 1303008200.7 03/08/2013< 25.0 5Beryllium 10.0U
Calcium SVug/L 1303008200.7 03/08/201394600 5500
Copper SVug/L 1303008200.7 03/08/2013426 510.0
Iron SVug/L 1303008200.7 03/08/201382400 5500
Magnesium SVug/L 1303008200.7 03/08/201320500 5500
Manganese SVug/L 1303008200.7 03/08/201389700 510.0
SVug/L 1303008200.7 03/08/2013< 5000 5Potassium 1250U
Sodium SVug/L 1303008200.7 03/08/20135780 51250
Zinc SVug/L 1303008200.7 03/08/201339100 550.0
SVug/L 1303008200.8 03/08/2013< 5.00 5Antimony 2.50U
Arsenic SVug/L 1303008200.8 03/08/201314.3 52.50
SVug/L 1303008200.8 03/08/2013< 50.0 5Barium 25.0U
Cadmium SVug/L 1303008200.8 03/08/2013134 50.500
SVug/L 1303008200.8 03/08/2013< 10.0 5Chromium 5.00U
Cobalt SVug/L 1303008200.8 03/08/201325.5 50.500
Lead SVug/L 1303008200.8 03/08/201380.3 50.500
Nickel SVug/L 1303008200.8 03/08/201319.7 52.50
Selenium SVug/L 1303008200.8 03/08/20138.16 52.50
SVug/L 1303008200.8 03/08/2013< 5.00 5Silver 2.50U
Thallium SVug/L 1303008200.8 03/08/201334.6 52.50
SVug/L 1303008200.8 03/08/2013< 15.0 5Vanadium 10.0U
Page 21 of 77

Certificate of AnalysisBarker-Hughesville_Pilot Study_MAR 2013_D353
DG-353
Project Name:
TDF #:
Parameter UnitsResults QualifierMDL Analyzed BatchMethod By
Dilution
Factor
13BH-DT-BENCH-SPS-C1Station ID: Date / Time Sampled:
Lab Number:
02/27/13 14:05
Matrix: Surface Water C130301-25EPA Tag No.:
C130301Workorder:
No Tag Prefix-B A
Metals (Total Recov) by EPA 200/7000 Series Methods
Aluminum SVug/L 1303008200.7 03/08/2013414 10200J
SVug/L 1303008200.7 03/08/2013< 50.0 10Beryllium 20.0U
Calcium SVug/L 1303008200.7 03/08/201397200 101000
Copper SVug/L 1303008200.7 03/08/201350.6 1020.0
SVug/L 1303008200.7 03/08/2013< 2500 10Iron 1000U
Magnesium SVug/L 1303008200.7 03/08/201363200 101000
Manganese SVug/L 1303008200.7 03/08/20137320 1020.0
Potassium SVug/L 1303008200.7 03/08/2013239000 102500
Sodium SVug/L 1303008200.7 03/08/2013153000 102500
Zinc SVug/L 1303008200.7 03/08/2013192 10100J
SVug/L 1303008200.8 03/08/2013< 10.0 10Antimony 5.00U
Arsenic SVug/L 1303008200.8 03/08/201335.0 105.00
Barium SVug/L 1303008200.8 03/08/201363.3 1050.0J
SVug/L 1303008200.8 03/08/2013< 2.00 10Cadmium 1.00U
SVug/L 1303008200.8 03/08/2013< 20.0 10Chromium 10.0U
Cobalt SVug/L 1303008200.8 03/08/20135.72 101.00
Lead SVug/L 1303008200.8 03/08/20133.13 101.00
Nickel SVug/L 1303008200.8 03/08/201315.0 105.00
Selenium SVug/L 1303008200.8 03/08/201310.9 105.00
SVug/L 1303008200.8 03/08/2013< 10.0 10Silver 5.00U
SVug/L 1303008200.8 03/08/2013< 10.0 10Thallium 5.00U
Vanadium SVug/L 1303008200.8 03/08/201344.4 1020.0
Page 22 of 77

Certificate of AnalysisBarker-Hughesville_Pilot Study_MAR 2013_D353
DG-353
Project Name:
TDF #:
Parameter UnitsResults QualifierMDL Analyzed BatchMethod By
Dilution
Factor
13BH-DT-BENCH-SPS-C2Station ID: Date / Time Sampled:
Lab Number:
02/27/13 14:15
Matrix: Surface Water C130301-28EPA Tag No.:
C130301Workorder:
No Tag Prefix-B A
Metals (Total Recov) by EPA 200/7000 Series Methods
Aluminum SVug/L 1303008200.7 03/08/2013485 10200J
SVug/L 1303008200.7 03/08/2013< 50.0 10Beryllium 20.0U
Calcium SVug/L 1303008200.7 03/08/2013169000 101000
Copper SVug/L 1303008200.7 03/08/201347.7 1020.0
SVug/L 1303008200.7 03/08/2013< 2500 10Iron 1000U
Magnesium SVug/L 1303008200.7 03/08/201371900 101000
Manganese SVug/L 1303008200.7 03/08/201317900 1020.0
Potassium SVug/L 1303008200.7 03/08/2013219000 102500
Sodium SVug/L 1303008200.7 03/08/201349300 102500
Zinc SVug/L 1303008200.7 03/08/2013376 10100
SVug/L 1303008200.8 03/08/2013< 10.0 10Antimony 5.00U
Arsenic SVug/L 1303008200.8 03/08/201326.7 105.00
Barium SVug/L 1303008200.8 03/08/201365.7 1050.0J
SVug/L 1303008200.8 03/08/2013< 2.00 10Cadmium 1.00U
SVug/L 1303008200.8 03/08/2013< 20.0 10Chromium 10.0U
Cobalt SVug/L 1303008200.8 03/08/20134.63 101.00
Lead SVug/L 1303008200.8 03/08/20132.35 101.00
Nickel SVug/L 1303008200.8 03/08/201315.8 105.00
SVug/L 1303008200.8 03/08/2013< 10.0 10Selenium 5.00U
SVug/L 1303008200.8 03/08/2013< 10.0 10Silver 5.00U
SVug/L 1303008200.8 03/08/2013< 10.0 10Thallium 5.00U
Vanadium SVug/L 1303008200.8 03/08/201329.8 1020.0J
Page 23 of 77

Certificate of AnalysisBarker-Hughesville_Pilot Study_MAR 2013_D353
DG-353
Project Name:
TDF #:
Parameter UnitsResults QualifierMDL Analyzed BatchMethod By
Dilution
Factor
13BH-DT-BENCH-SPS-C3Station ID: Date / Time Sampled:
Lab Number:
02/27/13 14:25
Matrix: Surface Water C130301-31EPA Tag No.:
C130301Workorder:
No Tag Prefix-B A
Metals (Total Recov) by EPA 200/7000 Series Methods
Aluminum SVug/L 1303008200.7 03/08/2013414 10200J
SVug/L 1303008200.7 03/08/2013< 50.0 10Beryllium 20.0U
Calcium SVug/L 1303008200.7 03/08/2013154000 101000
Copper SVug/L 1303008200.7 03/08/201364.8 1020.0
SVug/L 1303008200.7 03/08/2013< 2500 10Iron 1000U
Magnesium SVug/L 1303008200.7 03/08/201377400 101000
Manganese SVug/L 1303008200.7 03/08/201313000 1020.0
Potassium SVug/L 1303008200.7 03/08/2013221000 102500
Sodium SVug/L 1303008200.7 03/08/201343300 102500
Zinc SVug/L 1303008200.7 03/08/2013242 10100
SVug/L 1303008200.8 03/08/2013< 10.0 10Antimony 5.00U
Arsenic SVug/L 1303008200.8 03/08/201327.5 105.00
Barium SVug/L 1303008200.8 03/08/201363.4 1050.0J
SVug/L 1303008200.8 03/08/2013< 2.00 10Cadmium 1.00U
SVug/L 1303008200.8 03/08/2013< 20.0 10Chromium 10.0U
Cobalt SVug/L 1303008200.8 03/08/20133.65 101.00
Lead SVug/L 1303008200.8 03/08/20133.79 101.00
Nickel SVug/L 1303008200.8 03/08/201312.2 105.00
Selenium SVug/L 1303008200.8 03/08/201310.7 105.00
SVug/L 1303008200.8 03/08/2013< 10.0 10Silver 5.00U
SVug/L 1303008200.8 03/08/2013< 10.0 10Thallium 5.00U
Vanadium SVug/L 1303008200.8 03/08/201320.5 1020.0J
Page 24 of 77

Certificate of AnalysisBarker-Hughesville_Pilot Study_MAR 2013_D353
DG-353
Project Name:
TDF #:
Parameter UnitsResults QualifierMDL Analyzed BatchMethod By
Dilution
Factor
13BH-DT-BENCH-SPS-C4Station ID: Date / Time Sampled:
Lab Number:
02/27/13 14:35
Matrix: Surface Water C130301-34EPA Tag No.:
C130301Workorder:
No Tag Prefix-B A
Metals (Total Recov) by EPA 200/7000 Series Methods
SVug/L 1303008200.7 03/08/2013< 500 10Aluminum 200U
SVug/L 1303008200.7 03/08/2013< 50.0 10Beryllium 20.0U
Calcium SVug/L 1303008200.7 03/08/2013194000 101000
Copper SVug/L 1303008200.7 03/08/201349.8 1020.0
SVug/L 1303008200.7 03/08/2013< 2500 10Iron 1000U
Magnesium SVug/L 1303008200.7 03/08/2013100000 101000
SVug/L 1303008200.7 03/08/2013< 50.0 10Manganese 20.0U
Potassium SVug/L 1303008200.7 03/08/2013128000 102500
Sodium SVug/L 1303008200.7 03/08/2013379000 102500
SVug/L 1303008200.7 03/08/2013< 200 10Zinc 100U
SVug/L 1303008200.8 03/08/2013< 10.0 10Antimony 5.00U
Arsenic SVug/L 1303008200.8 03/08/2013104 105.00
SVug/L 1303008200.8 03/08/2013< 100 10Barium 50.0U
Cadmium SVug/L 1303008200.8 03/08/20132.38 101.00
Chromium SVug/L 1303008200.8 03/08/201320.4 1010.0
SVug/L 1303008200.8 03/08/2013< 2.00 10Cobalt 1.00U
SVug/L 1303008200.8 03/08/2013< 2.00 10Lead 1.00U
Nickel SVug/L 1303008200.8 03/08/201322.8 105.00
Selenium SVug/L 1303008200.8 03/08/201334.9 105.00
SVug/L 1303008200.8 03/08/2013< 10.0 10Silver 5.00U
SVug/L 1303008200.8 03/08/2013< 10.0 10Thallium 5.00U
SVug/L 1303008200.8 03/08/2013< 30.0 10Vanadium 20.0U
"J" Qualifier indicates an estimated value
Page 25 of 77

Certificate of AnalysisBarker-Hughesville_Pilot Study_MAR 2013_D353
DG-353
Project Name:
TDF #:
Parameter UnitsResults QualifierMDL Analyzed BatchMethod By
Dilution
Factor
13BH-BENCH-OXDStation ID: Date / Time Sampled:
Lab Number:
02/25/13 16:00
Matrix: Surface Water C130301-03EPA Tag No.:
C130301Workorder:
No Tag Prefix-C A
Classical Chemistry by EPA/ASTM/APHA Methods
NPmg/L 1303036EPA 300.0 03/19/2013< 20.0 10Chloride 10.0U
Fluoride NPmg/L 1303036EPA 300.0 03/19/20131.9 101.0J
Sulfate as SO4 NPmg/L 1303036EPA 300.0 03/19/2013841 1020.0
SVmg CaCO3 / L 1303009EPA 310.1 03/07/2013< 5.00 1Total Alkalinity 5.00
Parameter UnitsResults QualifierMDL Analyzed BatchMethod By
Dilution
Factor
13BH-DT-BENCH-PH45-CHITStation ID: Date / Time Sampled:
Lab Number:
02/26/13 12:00
Matrix: Surface Water C130301-06EPA Tag No.:
C130301Workorder:
No Tag Prefix-C A
Classical Chemistry by EPA/ASTM/APHA Methods
Chloride NPmg/L 1303036EPA 300.0 03/19/201319.4 1010.0J
Fluoride NPmg/L 1303036EPA 300.0 03/19/20132.4 101.0
Sulfate as SO4 NPmg/L 1303036EPA 300.0 03/19/2013829 1020.0
SVmg CaCO3 / L 1303009EPA 310.1 03/07/2013< 5.00 1Total Alkalinity 5.00
Parameter UnitsResults QualifierMDL Analyzed BatchMethod By
Dilution
Factor
13BH-DT-BENCH-PH45-LIMEStation ID: Date / Time Sampled:
Lab Number:
02/25/13 18:30
Matrix: Surface Water C130301-09EPA Tag No.:
C130301Workorder:
No Tag Prefix-C A
Classical Chemistry by EPA/ASTM/APHA Methods
NPmg/L 1303036EPA 300.0 03/19/2013< 20.0 10Chloride 10.0U
Fluoride NPmg/L 1303036EPA 300.0 03/19/20132.0 101.0
Sulfate as SO4 NPmg/L 1303036EPA 300.0 03/19/2013803 1020.0
SVmg CaCO3 / L 1303009EPA 310.1 03/07/2013< 5.00 1Total Alkalinity 5.00
Page 26 of 77

Certificate of AnalysisBarker-Hughesville_Pilot Study_MAR 2013_D353
DG-353
Project Name:
TDF #:
Parameter UnitsResults QualifierMDL Analyzed BatchMethod By
Dilution
Factor
13BH-DT-BENCH-PH45-LIME-T
SS
Station ID: Date / Time Sampled:
Lab Number:
02/26/13 10:40
Matrix: Surface Water C130301-10EPA Tag No.:
C130301Workorder:
No Tag Prefix-D A
Classical Chemistry by EPA/ASTM/APHA Methods
Total Suspended
Solids
NPmg/L 1303032EPA 160.2 03/04/2013248 110
Parameter UnitsResults QualifierMDL Analyzed BatchMethod By
Dilution
Factor
13BH-DT-BENCH-PH45-NAOHStation ID: Date / Time Sampled:
Lab Number:
02/25/13 16:45
Matrix: Surface Water C130301-13EPA Tag No.:
C130301Workorder:
No Tag Prefix-C A
Classical Chemistry by EPA/ASTM/APHA Methods
NPmg/L 1303036EPA 300.0 03/19/2013< 20.0 10Chloride 10.0U
Fluoride NPmg/L 1303036EPA 300.0 03/19/20131.8 101.0J
Sulfate as SO4 NPmg/L 1303036EPA 300.0 03/19/2013799 1020.0
SVmg CaCO3 / L 1303009EPA 310.1 03/07/2013< 5.00 1Total Alkalinity 5.00
Parameter UnitsResults QualifierMDL Analyzed BatchMethod By
Dilution
Factor
13BH-DT-BENCH-PH45-NAOH-
TSS
Station ID: Date / Time Sampled:
Lab Number:
02/26/13 10:25
Matrix: Surface Water C130301-14EPA Tag No.:
C130301Workorder:
No Tag Prefix-D A
Classical Chemistry by EPA/ASTM/APHA Methods
Total Suspended
Solids
NPmg/L 1303032EPA 160.2 03/04/2013156 110
Page 27 of 77

Certificate of AnalysisBarker-Hughesville_Pilot Study_MAR 2013_D353
DG-353
Project Name:
TDF #:
Parameter UnitsResults QualifierMDL Analyzed BatchMethod By
Dilution
Factor
13BH-DT-BENCH-PH95-LIMEStation ID: Date / Time Sampled:
Lab Number:
02/27/13 10:30
Matrix: Surface Water C130301-17EPA Tag No.:
C130301Workorder:
No Tag Prefix-C A
Classical Chemistry by EPA/ASTM/APHA Methods
NPmg/L 1303036EPA 300.0 03/19/2013< 20.0 10Chloride 10.0U
Fluoride NPmg/L 1303036EPA 300.0 03/19/20131.5 101.0J
Sulfate as SO4 NPmg/L 1303036EPA 300.0 03/19/2013817 1020.0
Total Alkalinity SVmg CaCO3 / L 1303009EPA 310.1 03/07/201314.1 15.00
Parameter UnitsResults QualifierMDL Analyzed BatchMethod By
Dilution
Factor
13BH-DT-BENCH-PH95-NAOHStation ID: Date / Time Sampled:
Lab Number:
02/26/13 16:00
Matrix: Surface Water C130301-20EPA Tag No.:
C130301Workorder:
No Tag Prefix-C A
Classical Chemistry by EPA/ASTM/APHA Methods
NPmg/L 1303036EPA 300.0 03/19/2013< 20.0 10Chloride 10.0U
Fluoride NPmg/L 1303036EPA 300.0 03/19/20131.7 101.0J
Sulfate as SO4 NPmg/L 1303036EPA 300.0 03/19/2013829 1020.0
Total Alkalinity SVmg CaCO3 / L 1303009EPA 310.1 03/07/201318.3 15.00
Parameter UnitsResults QualifierMDL Analyzed BatchMethod By
Dilution
Factor
13BH-DT-BENCH-RAWStation ID: Date / Time Sampled:
Lab Number:
02/25/13 14:00
Matrix: Surface Water C130301-23EPA Tag No.:
C130301Workorder:
No Tag Prefix-C A
Classical Chemistry by EPA/ASTM/APHA Methods
NPmg/L 1303036EPA 300.0 03/19/2013< 20.0 10Chloride 10.0U
Fluoride NPmg/L 1303036EPA 300.0 03/19/20131.9 101.0J
Sulfate as SO4 NPmg/L 1303036EPA 300.0 03/19/2013835 1020.0
SVmg CaCO3 / L 1303009EPA 310.1 03/07/2013< 5.00 1Total Alkalinity 5.00
Page 28 of 77
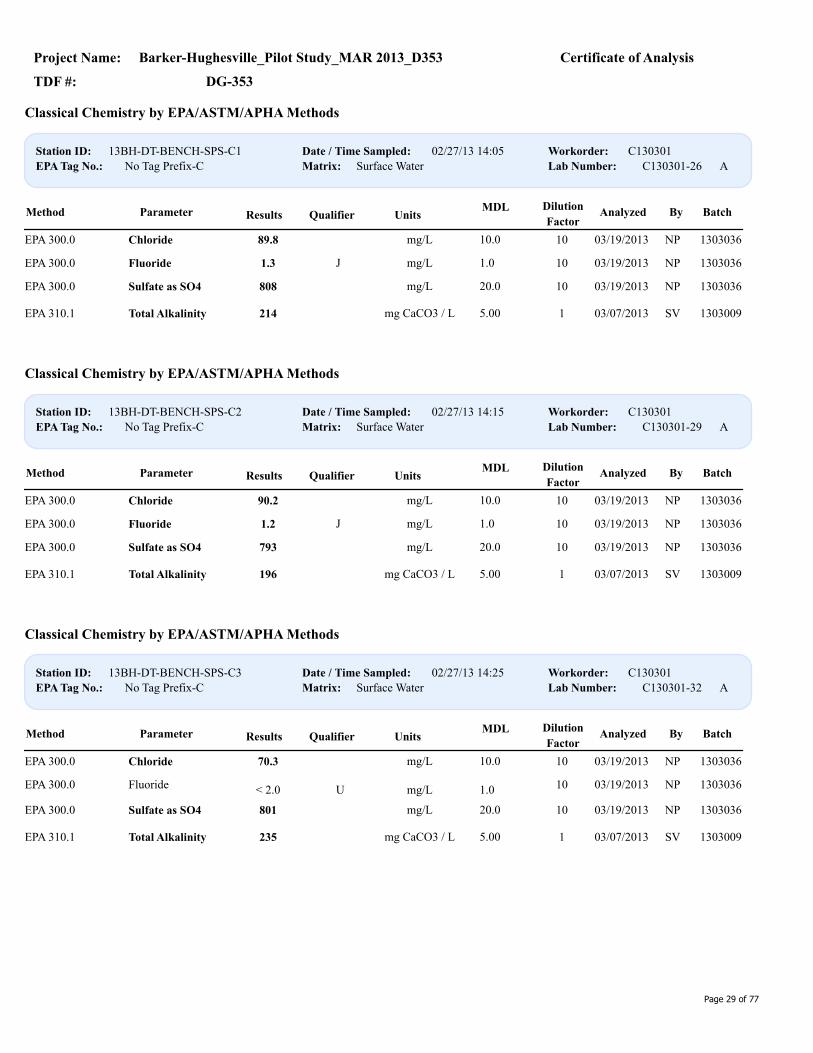
Certificate of AnalysisBarker-Hughesville_Pilot Study_MAR 2013_D353
DG-353
Project Name:
TDF #:
Parameter UnitsResults QualifierMDL Analyzed BatchMethod By
Dilution
Factor
13BH-DT-BENCH-SPS-C1Station ID: Date / Time Sampled:
Lab Number:
02/27/13 14:05
Matrix: Surface Water C130301-26EPA Tag No.:
C130301Workorder:
No Tag Prefix-C A
Classical Chemistry by EPA/ASTM/APHA Methods
Chloride NPmg/L 1303036EPA 300.0 03/19/201389.8 1010.0
Fluoride NPmg/L 1303036EPA 300.0 03/19/20131.3 101.0J
Sulfate as SO4 NPmg/L 1303036EPA 300.0 03/19/2013808 1020.0
Total Alkalinity SVmg CaCO3 / L 1303009EPA 310.1 03/07/2013214 15.00
Parameter UnitsResults QualifierMDL Analyzed BatchMethod By
Dilution
Factor
13BH-DT-BENCH-SPS-C2Station ID: Date / Time Sampled:
Lab Number:
02/27/13 14:15
Matrix: Surface Water C130301-29EPA Tag No.:
C130301Workorder:
No Tag Prefix-C A
Classical Chemistry by EPA/ASTM/APHA Methods
Chloride NPmg/L 1303036EPA 300.0 03/19/201390.2 1010.0
Fluoride NPmg/L 1303036EPA 300.0 03/19/20131.2 101.0J
Sulfate as SO4 NPmg/L 1303036EPA 300.0 03/19/2013793 1020.0
Total Alkalinity SVmg CaCO3 / L 1303009EPA 310.1 03/07/2013196 15.00
Parameter UnitsResults QualifierMDL Analyzed BatchMethod By
Dilution
Factor
13BH-DT-BENCH-SPS-C3Station ID: Date / Time Sampled:
Lab Number:
02/27/13 14:25
Matrix: Surface Water C130301-32EPA Tag No.:
C130301Workorder:
No Tag Prefix-C A
Classical Chemistry by EPA/ASTM/APHA Methods
Chloride NPmg/L 1303036EPA 300.0 03/19/201370.3 1010.0
NPmg/L 1303036EPA 300.0 03/19/2013< 2.0 10Fluoride 1.0U
Sulfate as SO4 NPmg/L 1303036EPA 300.0 03/19/2013801 1020.0
Total Alkalinity SVmg CaCO3 / L 1303009EPA 310.1 03/07/2013235 15.00
Page 29 of 77

Certificate of AnalysisBarker-Hughesville_Pilot Study_MAR 2013_D353
DG-353
Project Name:
TDF #:
Parameter UnitsResults QualifierMDL Analyzed BatchMethod By
Dilution
Factor
13BH-DT-BENCH-SPS-C4Station ID: Date / Time Sampled:
Lab Number:
02/27/13 14:35
Matrix: Surface Water C130301-35EPA Tag No.:
C130301Workorder:
No Tag Prefix-C A
Classical Chemistry by EPA/ASTM/APHA Methods
Chloride NPmg/L 1303036EPA 300.0 03/20/2013519 1010.0
Fluoride NPmg/L 1303036EPA 300.0 03/20/20132.3 101.0
Sulfate as SO4 NPmg/L 1303036EPA 300.0 03/20/2013777 1020.0
Total Alkalinity SVmg CaCO3 / L 1303009EPA 310.1 03/07/2013574 15.00
"J" Qualifier indicates an estimated value
Page 30 of 77

Certificate of AnalysisBarker-Hughesville_Pilot Study_MAR 2013_D353
DG-353
Project Name:
TDF #:
Result Det. Limit UnitsSpike
Level
Source
Result %R
%R
Limits
%D or
RPD
%D or
RPD Limit Analyte
Metals (Dissolved) by EPA 200/7000 Series Methods - Quality Control
TechLaw, Inc. - ESAT Region 8
ICPMS-PE DRC-II
Batch 1303011 - No Lab Prep Reqd ICPMS-PE DRC-IIWater
Method Blank (1303011-BLK1) Prepared: 03/07/13 Analyzed: 03/08/13 Dilution Factor: 1
Vanadium ug/L< 2.00 3.00
Chromium "< 1.00 2.00
Cobalt "< 0.100 0.200
Nickel "< 0.500 1.00
Arsenic "< 0.500 2.00
Selenium "0.620 1.00
Silver "< 0.500 1.00
Cadmium "< 0.100 0.200
Antimony "< 0.500 1.00
Barium "< 5.00 10.0
Thallium "< 0.500 1.00
Lead "< 0.100 0.200
Method Blank Spike (1303011-BS1) Prepared: 03/07/13 Analyzed: 03/08/13 Dilution Factor: 1
Vanadium ug/L 100 85-1159594.5 3.00
Chromium " 100 85-1159696.2 2.00
Cobalt " 100 85-1159493.8 0.200
Nickel " 100 85-115102102 1.00
Arsenic " 100 85-1159493.9 2.00
Selenium " 500 85-115102510 1.00
Silver " 100 85-1159090.4 1.00
Cadmium " 100 85-1159998.9 0.200
Antimony " 100 85-1159797.0 1.00
Barium " 100 85-1159695.9 10.0
Thallium " 100 85-1159797.0 1.00
Lead " 100 85-1159797.3 0.200
Duplicate (1303011-DUP1) Prepared: 03/07/13 Analyzed: 03/08/13 Source: C130301-01Dilution Factor: 5
Vanadium ug/L 20< 10.0 < 10.015.0
Chromium " 20< 5.00 < 5.0010.0
Cobalt " 200.0227.6 27.71.00
Nickel " 20126.8 26.45.00
Arsenic " 2014.88 4.8110.0
Selenium " 20337.14 5.145.00
Silver " 20< 2.50 < 2.505.00
Cadmium " 201139 1381.00
Antimony " 20< 2.50 < 2.505.00
Barium " 20< 25.0 < 25.050.0
Thallium " 20< 2.50 < 2.505.00
Page 31 of 77

Certificate of AnalysisBarker-Hughesville_Pilot Study_MAR 2013_D353
DG-353
Project Name:
TDF #:
Result Det. Limit UnitsSpike
Level
Source
Result %R
%R
Limits
%D or
RPD
%D or
RPD Limit Analyte
Metals (Dissolved) by EPA 200/7000 Series Methods - Quality Control
TechLaw, Inc. - ESAT Region 8
Batch 1303011 - No Lab Prep Reqd ICPMS-PE DRC-IIWater
Duplicate (1303011-DUP1) Prepared: 03/07/13 Analyzed: 03/08/13 Source: C130301-01Dilution Factor: 5
Lead ug/L 20578.3 82.61.00
Matrix Spike (1303011-MS1) Prepared: 03/07/13 Analyzed: 03/08/13 Source: C130301-01Dilution Factor: 5
Vanadium ug/L 100 75-1258787.1 < 10.015.0
Chromium " 100 75-1259594.6 < 5.0010.0
Cobalt " 100 75-12590117 27.71.00
Nickel " 100 75-12594121 26.45.00
Arsenic " 100 75-12597102 4.8110.0
Selenium " 500 75-12599500 5.145.00
Silver " 100 75-1258787.4 < 2.505.00
Cadmium " 100 75-12591229 1381.00
Antimony " 100 75-1259594.8 < 2.505.00
Barium " 100 75-125103103 < 25.050.0
Thallium " 100 75-1259695.7 < 2.505.00
Lead " 100 75-12589171 82.61.00
Matrix Spike Dup (1303011-MSD1) Prepared: 03/07/13 Analyzed: 03/08/13 Source: C130301-01Dilution Factor: 5
Vanadium ug/L 100 2075-12587 0.00287.1 < 10.015.0
Chromium " 100 2075-12594 0.194.4 < 5.0010.0
Cobalt " 100 2075-12593 3120 27.71.00
Nickel " 100 2075-12596 1122 26.45.00
Arsenic " 100 2075-12599 2104 4.8110.0
Selenium " 500 2075-125104 5525 5.145.00
Silver " 100 2075-12585 285.4 < 2.505.00
Cadmium " 100 2075-12595 2233 1381.00
Antimony " 100 2075-12594 193.6 < 2.505.00
Barium " 100 2075-125106 3106 < 25.050.0
Thallium " 100 2075-12596 0.195.6 < 2.505.00
Lead " 100 2075-12592 2175 82.61.00
Page 32 of 77

Certificate of AnalysisBarker-Hughesville_Pilot Study_MAR 2013_D353
DG-353
Project Name:
TDF #:
Result Det. Limit UnitsSpike
Level
Source
Result %R
%R
Limits
%D or
RPD
%D or
RPD Limit Analyte
Metals (Dissolved) by EPA 200/7000 Series Methods - Quality Control
TechLaw, Inc. - ESAT Region 8
Batch 1303023 - 1303011 ICPMS-PE DRC-IIWater
Serial Dilution (1303023-SRD1) Prepared: 03/07/13 Analyzed: 03/08/13 Source: C130301-01Dilution Factor: 2
Vanadium ug/L 10< 50.0 < 10.0075.0
Chromium " 10< 25.0 < 5.0050.0
Cobalt " 10227.2 27.75.00
Nickel " 10126.1 26.425.0
Arsenic " 10< 12.5 4.8150.0
Selenium " 10< 12.5 5.1425.0
Silver " 10< 12.5 < 2.5025.0
Cadmium " 101136 1385.00
Antimony " 10< 12.5 < 2.5025.0
Barium " 10< 125 < 25.00250
Thallium " 10< 12.5 < 2.5025.0
Lead " 10479.0 82.65.00
ICPOE - PE Optima
Batch 1303010 - No Lab Prep Reqd ICPOE - PE OptimaWater
Method Blank (1303010-BLK1) Prepared: 03/07/13 Analyzed: 03/08/13 Dilution Factor: 1
Aluminum ug/L< 20.0 50.0
Beryllium "< 2.00 5.00
Calcium "< 100 250
Copper "< 2.00 2.00
Iron "< 100 250
Potassium "< 250 1000
Magnesium "< 100 250
Manganese "< 2.00 5.00
Sodium "< 250 1000
Zinc "< 10.0 20.0
Page 33 of 77

Certificate of AnalysisBarker-Hughesville_Pilot Study_MAR 2013_D353
DG-353
Project Name:
TDF #:
Result Det. Limit UnitsSpike
Level
Source
Result %R
%R
Limits
%D or
RPD
%D or
RPD Limit Analyte
Metals (Dissolved) by EPA 200/7000 Series Methods - Quality Control
TechLaw, Inc. - ESAT Region 8
Batch 1303010 - No Lab Prep Reqd ICPOE - PE OptimaWater
Method Blank Spike (1303010-BS1) Prepared: 03/07/13 Analyzed: 03/08/13 Dilution Factor: 1
Aluminum ug/L 10100 85-11510310440 50.0
Beryllium " 100 85-115104103.8 5.00
Calcium " 10100 85-11510510560 250
Copper " 100 85-1159796.59 2.00
Iron " 10100 85-11510810930 250
Potassium " 10100 85-11510310420 1000
Magnesium " 10100 85-11510410550 250
Manganese " 100 85-115101101.0 5.00
Sodium " 10100 85-11510610660 1000
Zinc " 100 85-115106106.0 20.0
Duplicate (1303010-DUP1) Prepared: 03/07/13 Analyzed: 03/08/13 Source: C130301-01Dilution Factor: 5
Aluminum ug/L 2046480 6246250
Beryllium " 20< 10.0 < 10.025.0
Calcium " 200.896650 958501250
Copper " 201414.9 420.810.0
Iron " 20278010 791901250
Potassium " 2032163 21095000
Magnesium " 200.921100 209201250
Manganese " 200.490780 9117025.0
Sodium " 2018201 83075000
Zinc " 200.740420 40720100
Matrix Spike (1303010-MS1) Prepared: 03/07/13 Analyzed: 03/08/13 Source: C130301-01Dilution Factor: 5
Aluminum ug/L 10100 75-12510416730 6246250
Beryllium " 100 75-125112112.2 < 10.025.0
Calcium " 10100 75-12587104600 958501250
Copper " 100 75-12591512.3 420.810.0
Iron " 10100 75-1258687840 791901250
Potassium " 10100 75-12510212400 21095000
Magnesium " 10100 75-12510231170 209201250
Manganese " 100 75-125NR88880 9117025.0
Sodium " 10100 75-12510619060 83075000
Zinc " 100 75-125NR39860 40720100
Page 34 of 77

Certificate of AnalysisBarker-Hughesville_Pilot Study_MAR 2013_D353
DG-353
Project Name:
TDF #:
Result Det. Limit UnitsSpike
Level
Source
Result %R
%R
Limits
%D or
RPD
%D or
RPD Limit Analyte
Metals (Dissolved) by EPA 200/7000 Series Methods - Quality Control
TechLaw, Inc. - ESAT Region 8
Batch 1303010 - No Lab Prep Reqd ICPOE - PE OptimaWater
Matrix Spike Dup (1303010-MSD1) Prepared: 03/07/13 Analyzed: 03/08/13 Source: C130301-01Dilution Factor: 5
Aluminum ug/L 10100 2075-125104 0.0616740 6246250
Beryllium " 100 2075-125110 2110.0 < 10.025.0
Calcium " 10100 2075-12597 1105700 958501250
Copper " 100 2075-12592 0.1512.9 420.810.0
Iron " 10100 2075-12570 286280 791901250
Potassium " 10100 2075-125100 112240 21095000
Magnesium " 10100 2075-125102 0.0731190 209201250
Manganese " 100 2075-125NR 189930 9117025.0
Sodium " 10100 2075-125103 218660 83075000
Zinc " 100 2075-125NR 0.139810 40720100
Batch 1303021 - 1303010 ICPOE - PE OptimaWater
Serial Dilution (1303021-SRD1) Prepared: 03/07/13 Analyzed: 03/08/13 Source: C130301-01Dilution Factor: 2
Aluminum ug/L 1016320 62461250
Beryllium " 10< 50.0 < 10.00125
Calcium " 10194700 958506250
Copper " 1011377.5 420.850.0
Iron " 10475930 791906250
Potassium " 10< 6250 210925000
Magnesium " 10120680 209206250
Manganese " 10293340 91170125
Sodium " 1028151 830725000
Zinc " 10439050 40720500
NOTE: %R = % Recovery, %R limits do not apply when sample levels exceed 4x the spike level.
RPD = Relative Percent Difference, %D = % Difference, DL = Detection Limit for QC sample .
Page 35 of 77

Certificate of AnalysisBarker-Hughesville_Pilot Study_MAR 2013_D353
DG-353
Project Name:
TDF #:
Result Det. Limit UnitsSpike
Level
Source
Result %R
%R
Limits
%D or
RPD
%D or
RPD Limit Analyte
Metals (Total Recov) by EPA 200/7000 Series Methods - Quality Control
TechLaw, Inc. - ESAT Region 8
ICPMS-PE DRC-II
Batch 1303008 - 200.2 - TR Metals ICPMS-PE DRC-IIWater
Method Blank (1303008-BLK2) Prepared: 03/06/13 Analyzed: 03/08/13 Dilution Factor: 5
Vanadium ug/L< 10.0 15.0
Chromium "< 5.00 10.0
Cobalt "< 0.500 1.00
Nickel "< 2.50 5.00
Arsenic "< 2.50 10.0
Selenium "< 2.50 5.00
Silver "< 2.50 5.00
Cadmium "< 0.500 1.00
Antimony "< 2.50 5.00
Barium "< 25.0 50.0
Thallium "< 2.50 5.00
Lead "< 0.500 1.00
Duplicate (1303008-DUP2) Prepared: 03/06/13 Analyzed: 03/08/13 Source: C130301-22Dilution Factor: 5
Vanadium ug/L 20< 10.0 < 10.015.0
Chromium " 20< 5.00 < 5.0010.0
Cobalt " 20326.35 25.501.00
Nickel " 20921.60 19.655.00
Arsenic " 201412.49 14.3110.0
Selenium " 20455.187 8.1655.00
Silver " 20< 2.50 < 2.505.00
Cadmium " 204139.9 134.01.00
Antimony " 20< 2.50 < 2.505.00
Barium " 20< 25.0 < 25.050.0
Thallium " 201119.886 34.635.00
Lead " 20181.08 80.281.00
Matrix Spike (1303008-MS2) Prepared: 03/06/13 Analyzed: 03/08/13 Source: C130301-22Dilution Factor: 5
Vanadium ug/L 300 75-12579236.5 < 10.015.0
Chromium " 400 75-12588350.1 < 5.0010.0
Cobalt " 200 75-12580186.4 25.501.00
Nickel " 500 75-12588458.6 19.655.00
Arsenic " 800 75-12588718.5 14.3110.0
Selenium " 2000 75-125971938 8.1655.00
Silver " 75.0 75-1258966.67 < 2.505.00
Cadmium " 200 75-12589312.1 134.01.00
Antimony " 800 75-12591725.3 < 2.505.00
Barium " 200 75-12589177.7 < 25.050.0
Thallium " 2000 75-125791609 34.635.00
Page 36 of 77

Certificate of AnalysisBarker-Hughesville_Pilot Study_MAR 2013_D353
DG-353
Project Name:
TDF #:
Result Det. Limit UnitsSpike
Level
Source
Result %R
%R
Limits
%D or
RPD
%D or
RPD Limit Analyte
Metals (Total Recov) by EPA 200/7000 Series Methods - Quality Control
TechLaw, Inc. - ESAT Region 8
Batch 1303008 - 200.2 - TR Metals ICPMS-PE DRC-IIWater
Matrix Spike (1303008-MS2) Prepared: 03/06/13 Analyzed: 03/08/13 Source: C130301-22Dilution Factor: 5
Lead ug/L 1000 75-12582903.3 80.281.00
Matrix Spike Dup (1303008-MSD2) Prepared: 03/06/13 Analyzed: 03/08/13 Source: C130301-22Dilution Factor: 5
Vanadium ug/L 300 2075-12585 7254.5 < 10.015.0
Chromium " 400 2075-12585 3340.7 < 5.0010.0
Cobalt " 200 2075-12585 4194.6 25.501.00
Nickel " 500 2075-12587 0.8455.0 19.655.00
Arsenic " 800 2075-12590 2735.6 14.3110.0
Selenium " 2000 2075-12595 21909 8.1655.00
Silver " 75.0 2075-12593 469.64 < 2.505.00
Cadmium " 200 2075-12593 3320.8 134.01.00
Antimony " 800 2075-12595 5763.1 < 2.505.00
Barium " 200 2075-12596 8192.1 < 25.050.0
Thallium " 2000 2075-12584 61711 34.635.00
Lead " 1000 2075-12587 5949.3 80.281.00
Post Spike (1303008-PS2) Prepared: 03/06/13 Analyzed: 03/08/13 Source: C130301-22Dilution Factor: 5
Vanadium ug/L 100 80-1209282.34 -10.15
Chromium " 100 80-1208589.13 4.221
Cobalt " 100 80-12083108.3 25.50
Nickel " 100 80-12083102.8 19.65
Arsenic " 100 80-12098112.2 14.31
Selenium " 500 80-12099500.7 8.165
Silver " 100 80-1208585.73 0.3110
Cadmium " 100 80-12096229.6 134.0
Antimony " 100 80-1209696.43 0.8426
Barium " 100 80-1209498.18 3.691
Thallium " 100 80-12067102.1 34.63
Lead " 100 80-12090169.8 80.28
Page 37 of 77

Certificate of AnalysisBarker-Hughesville_Pilot Study_MAR 2013_D353
DG-353
Project Name:
TDF #:
Result Det. Limit UnitsSpike
Level
Source
Result %R
%R
Limits
%D or
RPD
%D or
RPD Limit Analyte
Metals (Total Recov) by EPA 200/7000 Series Methods - Quality Control
TechLaw, Inc. - ESAT Region 8
Batch 1303008 - 200.2 - TR Metals ICPMS-PE DRC-IIWater
Reference (1303008-SRM2) Prepared: 03/06/13 Analyzed: 03/08/13 Dilution Factor: 2
Vanadium ug/L 1000 80-12090897.5 60.0
Chromium " 1000 80-12091910.0 40.0
Cobalt " 1000 80-12092923.0 4.00
Nickel " 1000 80-12094935.9 20.0
Arsenic " 2000 80-120971940 40.0
Selenium " 1000 80-12099992.0 20.0
Silver " 250 80-12094236.0 20.0
Cadmium " 1000 80-12095954.4 4.00
Antimony " 2000 80-120931864 20.0
Barium " 1000 80-12094939.1 200
Thallium " 5000 80-120884415 20.0
Lead " 2000 80-120901798 4.00
Batch 1303024 - 1303008 ICPMS-PE DRC-IIWater
Serial Dilution (1303024-SRD1) Prepared: 03/06/13 Analyzed: 03/08/13 Source: C130301-22Dilution Factor: 2
Vanadium ug/L 10< 50.0 < 10.0075.0
Chromium " 10< 25.0 < 5.0050.0
Cobalt " 10426.49 25.505.00
Nickel " 10821.18 19.6525.0
Arsenic " 105224.28 14.3150.0
Selenium " 107518.05 8.16525.0
Silver " 10< 12.5 < 2.5025.0
Cadmium " 102136.7 134.05.00
Antimony " 10< 12.5 < 2.5025.0
Barium " 10< 125 < 25.00250
Thallium " 101238.98 34.6325.0
Lead " 10181.31 80.285.00
Page 38 of 77

Certificate of AnalysisBarker-Hughesville_Pilot Study_MAR 2013_D353
DG-353
Project Name:
TDF #:
Result Det. Limit UnitsSpike
Level
Source
Result %R
%R
Limits
%D or
RPD
%D or
RPD Limit Analyte
Metals (Total Recov) by EPA 200/7000 Series Methods - Quality Control
TechLaw, Inc. - ESAT Region 8
ICPOE - PE Optima
Batch 1303008 - 200.2 - TR Metals ICPOE - PE OptimaWater
Method Blank (1303008-BLK1) Prepared: 03/06/13 Analyzed: 03/08/13 Dilution Factor: 1
Aluminum ug/L< 20.0 50.0
Beryllium "< 2.00 5.00
Calcium "< 100 250
Copper "< 2.00 2.00
Iron "< 100 250
Potassium "< 250 1000
Magnesium "< 100 250
Manganese "< 2.00 5.00
Sodium "< 250 1000
Zinc "< 10.0 20.0
Duplicate (1303008-DUP1) Prepared: 03/06/13 Analyzed: 03/08/13 Source: C130301-22Dilution Factor: 5
Aluminum ug/L 200.036490 6492250
Beryllium " 20< 10.0 < 10.025.0
Calcium " 200.0994650 945701250
Copper " 200.08425.8 426.210.0
Iron " 20181650 824401250
Potassium " 20< 1250 < 12505000
Magnesium " 200.220500 204501250
Manganese " 20190630 8967025.0
Sodium " 200.55806 57755000
Zinc " 20239770 39120100
Matrix Spike (1303008-MS1) Prepared: 03/06/13 Analyzed: 03/08/13 Source: C130301-22Dilution Factor: 5
Aluminum ug/L 2000 75-125858190 6492250
Beryllium " 200 75-12598196.4 < 10.025.0
Calcium " 1000 75-125NR93780 945701250
Copper " 300 75-12592702.2 426.210.0
Iron " 3000 75-1254783860 824401250
Potassium " 10000 75-1251009975 < 12505000
Magnesium " 2000 75-1258222100 204501250
Manganese " 200 75-125NR88890 8967025.0
Sodium " 3000 75-125968657 57755000
Zinc " 200 75-125NR38940 39120100
Page 39 of 77

Certificate of AnalysisBarker-Hughesville_Pilot Study_MAR 2013_D353
DG-353
Project Name:
TDF #:
Result Det. Limit UnitsSpike
Level
Source
Result %R
%R
Limits
%D or
RPD
%D or
RPD Limit Analyte
Metals (Total Recov) by EPA 200/7000 Series Methods - Quality Control
TechLaw, Inc. - ESAT Region 8
Batch 1303008 - 200.2 - TR Metals ICPOE - PE OptimaWater
Matrix Spike Dup (1303008-MSD1) Prepared: 03/06/13 Analyzed: 03/08/13 Source: C130301-22Dilution Factor: 5
Aluminum ug/L 2000 2075-12593 28352 6492250
Beryllium " 200 2075-125102 4204.3 < 10.025.0
Calcium " 1000 2075-12542 194990 945701250
Copper " 300 2075-125100 3725.3 426.210.0
Iron " 3000 2075-12589 185110 824401250
Potassium " 10000 2075-125103 310300 < 12505000
Magnesium " 2000 2075-125104 222530 204501250
Manganese " 200 2075-12593 189860 8967025.0
Sodium " 3000 2075-125106 38944 57755000
Zinc " 200 2075-12598 139310 39120100
Post Spike (1303008-PS1) Prepared: 03/06/13 Analyzed: 03/08/13 Source: C130301-22Dilution Factor: 5
Aluminum ug/L 10100 80-12010216800 6492
Beryllium " 100 80-120103108.8 6.134
Calcium " 10100 80-12079102600 94570
Copper " 100 80-12092518.0 426.2
Iron " 10100 80-1208290730 82440
Potassium " 10100 80-12010211020 745.3
Magnesium " 10100 80-12010030540 20450
Manganese " 100 80-120NR87680 89670
Sodium " 10100 80-12010816700 5775
Zinc " 100 80-120NR38080 39120
Reference (1303008-SRM1) Prepared: 03/06/13 Analyzed: 03/08/13 Dilution Factor: 1
Aluminum ug/L 1000 80-12089887.1 50.0
Beryllium " 1000 80-12097969.4 5.00
Calcium " 1000 80-12088884.2 250
Copper " 1000 80-12097968.3 2.00
Iron " 1000 80-12091912.5 250
Potassium " 5000 80-120894427 1000
Magnesium " 1000 80-12093928.0 250
Manganese " 1000 80-120100995.1 5.00
Sodium " 1000 80-12095951.3 1000
Zinc " 1000 80-12098982.3 20.0
Page 40 of 77
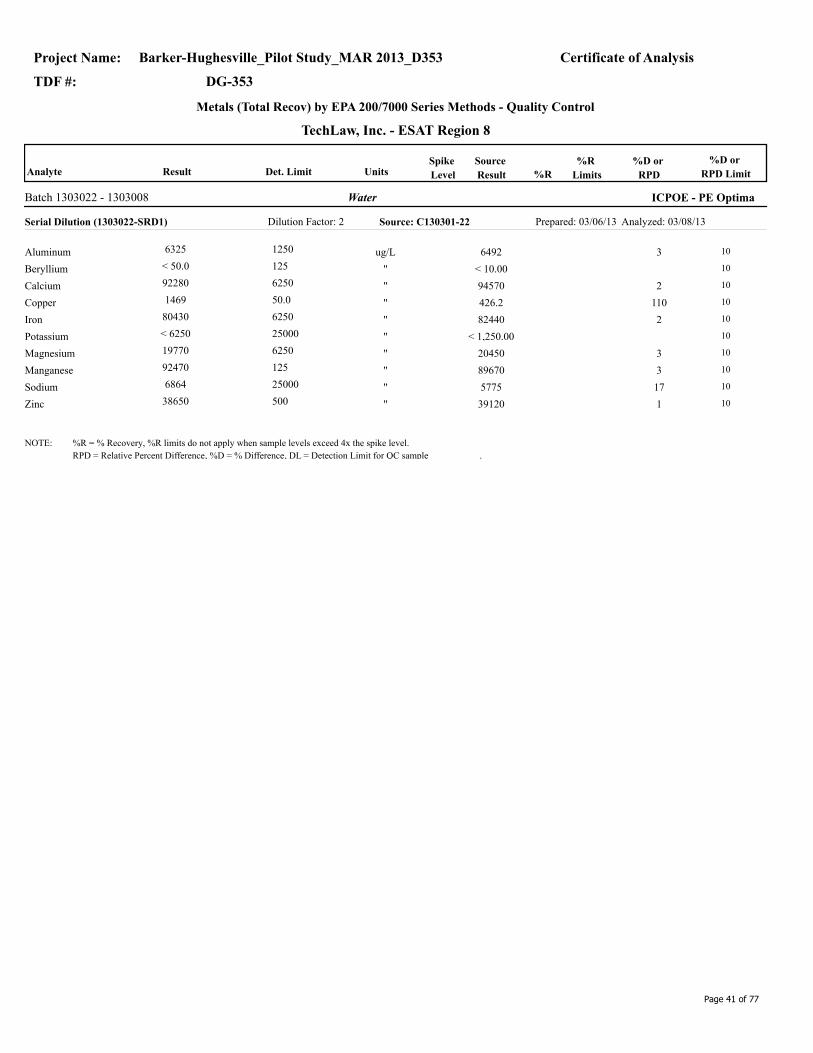
Certificate of AnalysisBarker-Hughesville_Pilot Study_MAR 2013_D353
DG-353
Project Name:
TDF #:
Result Det. Limit UnitsSpike
Level
Source
Result %R
%R
Limits
%D or
RPD
%D or
RPD Limit Analyte
Metals (Total Recov) by EPA 200/7000 Series Methods - Quality Control
TechLaw, Inc. - ESAT Region 8
Batch 1303022 - 1303008 ICPOE - PE OptimaWater
Serial Dilution (1303022-SRD1) Prepared: 03/06/13 Analyzed: 03/08/13 Source: C130301-22Dilution Factor: 2
Aluminum ug/L 1036325 64921250
Beryllium " 10< 50.0 < 10.00125
Calcium " 10292280 945706250
Copper " 101101469 426.250.0
Iron " 10280430 824406250
Potassium " 10< 6250 < 1,250.0025000
Magnesium " 10319770 204506250
Manganese " 10392470 89670125
Sodium " 10176864 577525000
Zinc " 10138650 39120500
NOTE: %R = % Recovery, %R limits do not apply when sample levels exceed 4x the spike level.
RPD = Relative Percent Difference, %D = % Difference, DL = Detection Limit for QC sample .
Page 41 of 77

Certificate of AnalysisBarker-Hughesville_Pilot Study_MAR 2013_D353
DG-353
Project Name:
TDF #:
Result Det. Limit UnitsSpike
Level
Source
Result %R
%R
Limits
%D or
RPD
%D or
RPD Limit Analyte
Classical Chemistry by EPA/ASTM/APHA Methods - Quality Control
TechLaw, Inc. - ESAT Region 8
ESAT Dionex IC
Batch 1303036 - No Prep Req ESAT Dionex ICWater
Method Blank (1303036-BLK1) Prepared & Analyzed: 03/19/13 Dilution Factor: 1
Fluoride mg/L< 0.1 0.2
Chloride "< 1.0 2.0
Sulfate as SO4 "< 2.0 5.0
Method Blank Spike (1303036-BS1) Prepared & Analyzed: 03/19/13 Dilution Factor: 1
Fluoride mg/L 5.00 90-1101015.0 0.2
Chloride " 25.0 90-1109523.7 2.0
Sulfate as SO4 " 25.0 90-1109223.1 5.0
Duplicate (1303036-DUP1) Prepared & Analyzed: 03/19/13 Source: C130301-03Dilution Factor: 1
Fluoride mg/L 2062.0 1.92.0
Chloride " 20< 10.0 < 10.020.0
Sulfate as SO4 " 201851 84150.0
Matrix Spike (1303036-MS1) Prepared & Analyzed: 03/19/13 Source: C130301-03Dilution Factor: 1
Fluoride mg/L 50.0 80-1209348.5 1.92.0
Chloride " 250 80-12096241 < 10.020.0
Sulfate as SO4 " 250 80-120981090 84150.0
Matrix Spike Dup (1303036-MSD1) Prepared & Analyzed: 03/19/13 Source: C130301-03Dilution Factor: 1
Fluoride mg/L 50.0 2080-12095 249.3 1.92.0
Chloride " 250 2080-12096 0.5240 < 10.020.0
Sulfate as SO4 " 250 2080-12093 11070 84150.0
Mettler AT
Batch 1303009 - No Prep Req Mettler ATWater
Method Blank (1303009-BLK1) Prepared: 03/06/13 Analyzed: 03/07/13 Dilution Factor: 1
Total Alkalinity mg CaCO3 /
L
< 5.00 5.00
Page 42 of 77

Certificate of AnalysisBarker-Hughesville_Pilot Study_MAR 2013_D353
DG-353
Project Name:
TDF #:
Result Det. Limit UnitsSpike
Level
Source
Result %R
%R
Limits
%D or
RPD
%D or
RPD Limit Analyte
Classical Chemistry by EPA/ASTM/APHA Methods - Quality Control
TechLaw, Inc. - ESAT Region 8
Batch 1303009 - No Prep Req Mettler ATWater
Duplicate (1303009-DUP1) Prepared: 03/06/13 Analyzed: 03/07/13 Source: C130301-03Dilution Factor: 1
Total Alkalinity mg CaCO3 /
L
20< 5.00 < 5.005.00
Reference (1303009-SRM1) Prepared: 03/06/13 Analyzed: 03/07/13 Dilution Factor: 1
Total Alkalinity mg CaCO3 /
L
115 90-11095109 5.00
None - Gravimetric
Batch 1303032 - No Prep Req None - GravimetricWater
Method Blank (1303032-BLK1) Prepared & Analyzed: 03/04/13 Dilution Factor: 1
Total Suspended Solids mg/L< 10 10
Duplicate (1303032-DUP1) Prepared & Analyzed: 03/04/13 Source: C130301-10Dilution Factor: 1
Total Suspended Solids mg/L 203240 24810
Reference (1303032-SRM1) Prepared & Analyzed: 03/04/13 Dilution Factor: 1
Total Suspended Solids mg/L 144 75-12582118 10
NOTE: %R = % Recovery, %R limits do not apply when sample levels exceed 4x the spike level.
RPD = Relative Percent Difference, %D = % Difference, DL = Detection Limit for QC sample .
Page 43 of 77

Certificate of AnalysisBarker-Hughesville_Pilot Study_MAR 2013_D353
DG-353
Project Name:
TDF #:
TechLaw Inc., ESAT Region 8
INORGANIC ANALYSES DATA SHEET
Intial and Continuing Calibration Blanks
Analysis Name:Analytical Method: EPA 310.1
mg CaCO3 / L
C130301Instrument: Mettler AT
Analytical Sequence: Total Concentration Units:
Work Order: Nu
WC - Alkalinity
Blank criteria = +/- 5x analyte MDL (+/- PQL)
AnalyteContinuing Calibration Blanks
Initial
Calibration
Blank (1 & 2)
Method
Blank
(Batch ID)PQL
Total Alkalinity 0.80 1.88
8765
1 2 3 4
3.43 NA
1303009-BLK1 NA
5.00
Page 44 of 77
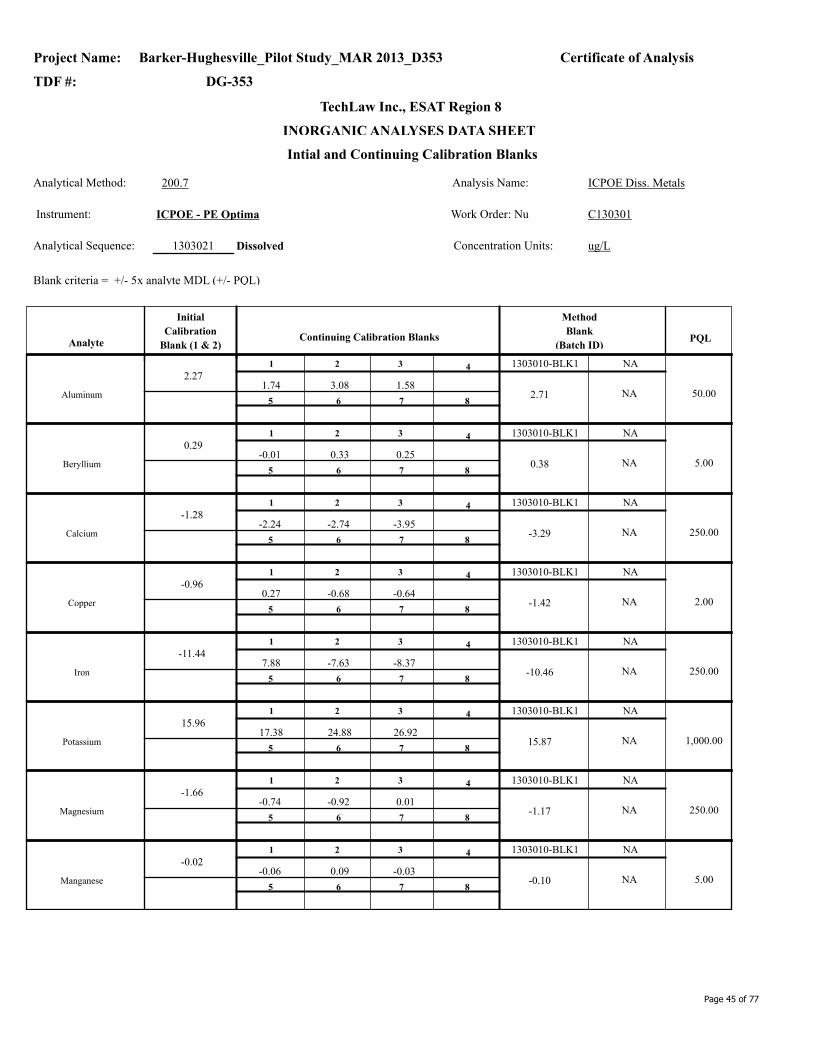
Certificate of AnalysisBarker-Hughesville_Pilot Study_MAR 2013_D353
DG-353
Project Name:
TDF #:
TechLaw Inc., ESAT Region 8
INORGANIC ANALYSES DATA SHEET
Intial and Continuing Calibration Blanks
Analysis Name:Analytical Method: 200.7
ug/L
C130301Instrument: ICPOE - PE Optima
Analytical Sequence: Dissolved Concentration Units:1303021
Work Order: Nu
ICPOE Diss. Metals
Blank criteria = +/- 5x analyte MDL (+/- PQL)
AnalyteContinuing Calibration Blanks
Initial
Calibration
Blank (1 & 2)
Method
Blank
(Batch ID)PQL
Aluminum
2.27 1.74 3.08 1.58
8765
1 2 3 4
2.71 NA
1303010-BLK1 NA
50.00
Beryllium
0.29-0.01 0.33 0.25
8765
1 2 3 4
0.38 NA
1303010-BLK1 NA
5.00
Calcium
-1.28-2.24 -2.74 -3.95
8765
1 2 3 4
-3.29 NA
1303010-BLK1 NA
250.00
Copper
-0.96 0.27 -0.68 -0.64
8765
1 2 3 4
-1.42 NA
1303010-BLK1 NA
2.00
Iron
-11.44 7.88 -7.63 -8.37
8765
1 2 3 4
-10.46 NA
1303010-BLK1 NA
250.00
Potassium
15.96 17.38 24.88 26.92
8765
1 2 3 4
15.87 NA
1303010-BLK1 NA
1,000.00
Magnesium
-1.66-0.74 -0.92 0.01
8765
1 2 3 4
-1.17 NA
1303010-BLK1 NA
250.00
Manganese
-0.02-0.06 0.09 -0.03
8765
1 2 3 4
-0.10 NA
1303010-BLK1 NA
5.00
Page 45 of 77

Certificate of AnalysisBarker-Hughesville_Pilot Study_MAR 2013_D353
DG-353
Project Name:
TDF #:
TechLaw Inc., ESAT Region 8
INORGANIC ANALYSES DATA SHEET
Intial and Continuing Calibration Blanks
Analysis Name:Analytical Method: 200.7
ug/L
C130301Instrument: ICPOE - PE Optima
Analytical Sequence: Dissolved Concentration Units:1303021
Work Order: Nu
ICPOE Diss. Metals
Blank criteria = +/- 5x analyte MDL (+/- PQL)
AnalyteContinuing Calibration Blanks
Initial
Calibration
Blank (1 & 2)
Method
Blank
(Batch ID)PQL
Sodium
2.58 0.62 13.52 16.59
8765
1 2 3 4
2.12 NA
1303010-BLK1 NA
1,000.00
Zinc
1.71 0.68 1.61 0.88
8765
1 2 3 4
1.07 NA
1303010-BLK1 NA
20.00
Page 46 of 77

Certificate of AnalysisBarker-Hughesville_Pilot Study_MAR 2013_D353
DG-353
Project Name:
TDF #:
TechLaw Inc., ESAT Region 8
INORGANIC ANALYSES DATA SHEET
Intial and Continuing Calibration Blanks
Analysis Name:Analytical Method: 200.7
ug/L
C130301Instrument: ICPOE - PE Optima
Analytical Sequence: Total Recoverable Concentration Units:1303022
Work Order: Nu
ICPOE Tot. Rec. Metals
Blank criteria = +/- 5x analyte MDL (+/- PQL)
AnalyteContinuing Calibration Blanks
Initial
Calibration
Blank (1 & 2)
Method
Blank
(Batch ID)PQL
Aluminum
2.27 1.74 3.08 1.58 1.93
8765
3.93
1 2 3 4
3.97 NA
1303008-BLK1 NA
50.00
Beryllium
0.29-0.01 0.33 0.25 -0.18
8765
-0.05
1 2 3 4
0.22 NA
1303008-BLK1 NA
5.00
Calcium
-1.28-2.24 -2.74 -3.95 -3.13
8765
-3.81
1 2 3 4
3.28 NA
1303008-BLK1 NA
250.00
Copper
-0.96 0.27 -0.68 -0.64 0.67
8765
0.53
1 2 3 4
0.08 NA
1303008-BLK1 NA
2.00
Iron
-11.44 7.88 -7.63 -8.37 -0.66
8765
-0.10
1 2 3 4
-8.21 NA
1303008-BLK1 NA
250.00
Potassium
15.96 17.38 24.88 26.92 31.57
8765
22.43
1 2 3 4
142.79 NA
1303008-BLK1 NA
1,000.00
Magnesium
-1.66-0.74 -0.92 0.01 -1.37
8765
-0.44
1 2 3 4
-1.89 NA
1303008-BLK1 NA
250.00
Manganese
-0.02-0.06 0.09 -0.03 0.14
8765
0.05
1 2 3 4
0.19 NA
1303008-BLK1 NA
5.00
Page 47 of 77

Certificate of AnalysisBarker-Hughesville_Pilot Study_MAR 2013_D353
DG-353
Project Name:
TDF #:
TechLaw Inc., ESAT Region 8
INORGANIC ANALYSES DATA SHEET
Intial and Continuing Calibration Blanks
Analysis Name:Analytical Method: 200.7
ug/L
C130301Instrument: ICPOE - PE Optima
Analytical Sequence: Total Recoverable Concentration Units:1303022
Work Order: Nu
ICPOE Tot. Rec. Metals
Blank criteria = +/- 5x analyte MDL (+/- PQL)
AnalyteContinuing Calibration Blanks
Initial
Calibration
Blank (1 & 2)
Method
Blank
(Batch ID)PQL
Sodium
2.58 0.62 13.52 16.59 8.79
8765
6.01
1 2 3 4
43.43 NA
1303008-BLK1 NA
1,000.00
Zinc
1.71 0.68 1.61 0.88 0.70
8765
0.86
1 2 3 4
6.25 NA
1303008-BLK1 NA
20.00
Page 48 of 77

Certificate of AnalysisBarker-Hughesville_Pilot Study_MAR 2013_D353
DG-353
Project Name:
TDF #:
TechLaw Inc., ESAT Region 8
INORGANIC ANALYSES DATA SHEET
Intial and Continuing Calibration Blanks
Analysis Name:Analytical Method: 200.8
ug/L
C130301Instrument: ICPMS-PE DRC-II
Analytical Sequence: Dissolved Concentration Units:1303023
Work Order: Nu
ICPMS Diss. Metals
Blank criteria = +/- 5x analyte MDL (+/- PQL)
AnalyteContinuing Calibration Blanks
Initial
Calibration
Blank (1 & 2)
Method
Blank
(Batch ID)PQL
Vanadium
0.00-0.02 0.00 -0.04
8765
1 2 3 4
0.00 NA
1303011-BLK1 NA
3.00
Chromium
-0.02-0.09 0.01 -0.13
8765
1 2 3 4
0.01 NA
1303011-BLK1 NA
2.00
Cobalt
0.00 0.00 0.00 0.00
8765
1 2 3 4
0.00 NA
1303011-BLK1 NA
0.20
Nickel
0.00 0.00 0.00 -0.01
8765
1 2 3 4
0.01 NA
1303011-BLK1 NA
1.00
Arsenic
0.05 0.06 0.23 0.46
8765
1 2 3 4
0.22 NA
1303011-BLK1 NA
2.00
Selenium
0.31 0.17 0.25 0.61
8765
1 2 3 4
0.62 NA
1303011-BLK1 NA
1.00
Silver
0.03 0.02 0.03 0.04
8765
1 2 3 4
0.02 NA
1303011-BLK1 NA
1.00
Cadmium
0.00 0.01 0.00 0.02
8765
1 2 3 4
0.01 NA
1303011-BLK1 NA
0.20
Page 49 of 77

Certificate of AnalysisBarker-Hughesville_Pilot Study_MAR 2013_D353
DG-353
Project Name:
TDF #:
TechLaw Inc., ESAT Region 8
INORGANIC ANALYSES DATA SHEET
Intial and Continuing Calibration Blanks
Analysis Name:Analytical Method: 200.8
ug/L
C130301Instrument: ICPMS-PE DRC-II
Analytical Sequence: Dissolved Concentration Units:1303023
Work Order: Nu
ICPMS Diss. Metals
Blank criteria = +/- 5x analyte MDL (+/- PQL)
AnalyteContinuing Calibration Blanks
Initial
Calibration
Blank (1 & 2)
Method
Blank
(Batch ID)PQL
Antimony
0.08 0.15 0.15 0.11
8765
1 2 3 4
0.39 NA
1303011-BLK1 NA
1.00
Barium
0.02 0.00 0.02 0.00
8765
1 2 3 4
-0.02 NA
1303011-BLK1 NA
10.00
Thallium
0.01 0.01 0.01 0.01
8765
1 2 3 4
0.06 NA
1303011-BLK1 NA
1.00
Lead
0.01 0.00 0.00 0.00
8765
1 2 3 4
0.03 NA
1303011-BLK1 NA
0.20
Page 50 of 77

Certificate of AnalysisBarker-Hughesville_Pilot Study_MAR 2013_D353
DG-353
Project Name:
TDF #:
TechLaw Inc., ESAT Region 8
INORGANIC ANALYSES DATA SHEET
Intial and Continuing Calibration Blanks
Analysis Name:Analytical Method: 200.8
ug/L
C130301Instrument: ICPMS-PE DRC-II
Analytical Sequence: Total Recoverable Concentration Units:1303024
Work Order: Nu
ICPMS Tot. Rec. Metals
Blank criteria = +/- 5x analyte MDL (+/- PQL)
AnalyteContinuing Calibration Blanks
Initial
Calibration
Blank (1 & 2)
Method
Blank
(Batch ID)PQL
Vanadium
0.00-0.02 0.00 -0.04 -0.08
8765
-0.10
1 2 3 4
NA -1.59
NA 1303008-BLK2
3.00
Chromium
-0.02-0.09 0.01 -0.13 -0.04
8765
-0.03
1 2 3 4
NA 0.48
NA 1303008-BLK2
2.00
Cobalt
0.00 0.00 0.00 0.00 0.00
8765
0.00
1 2 3 4
NA 0.00
NA 1303008-BLK2
0.20
Nickel
0.00 0.00 0.00 -0.01 0.00
8765
0.00
1 2 3 4
NA -0.01
NA 1303008-BLK2
1.00
Arsenic
0.05 0.06 0.23 0.46 0.42
8765
0.75
1 2 3 4
NA 0.29
NA 1303008-BLK2
2.00
Selenium
0.31 0.17 0.25 0.61 0.70
8765
0.48
1 2 3 4
NA 0.38
NA 1303008-BLK2
1.00
Silver
0.03 0.02 0.03 0.04 0.03
8765
0.03
1 2 3 4
NA 0.06
NA 1303008-BLK2
1.00
Cadmium
0.00 0.01 0.00 0.02 0.01
8765
0.01
1 2 3 4
NA 0.05
NA 1303008-BLK2
0.20
Page 51 of 77

Certificate of AnalysisBarker-Hughesville_Pilot Study_MAR 2013_D353
DG-353
Project Name:
TDF #:
TechLaw Inc., ESAT Region 8
INORGANIC ANALYSES DATA SHEET
Intial and Continuing Calibration Blanks
Analysis Name:Analytical Method: 200.8
ug/L
C130301Instrument: ICPMS-PE DRC-II
Analytical Sequence: Total Recoverable Concentration Units:1303024
Work Order: Nu
ICPMS Tot. Rec. Metals
Blank criteria = +/- 5x analyte MDL (+/- PQL)
AnalyteContinuing Calibration Blanks
Initial
Calibration
Blank (1 & 2)
Method
Blank
(Batch ID)PQL
Antimony
0.08 0.15 0.15 0.11 0.14
8765
0.13
1 2 3 4
NA 0.06
NA 1303008-BLK2
1.00
Barium
0.02 0.00 0.02 0.00 0.01
8765
0.00
1 2 3 4
NA 0.15
NA 1303008-BLK2
10.00
Thallium
0.01 0.01 0.01 0.01 0.23
8765
0.06
1 2 3 4
NA 0.00
NA 1303008-BLK2
1.00
Lead
0.01 0.00 0.00 0.00 0.00
8765
0.00
1 2 3 4
NA 0.02
NA 1303008-BLK2
0.20
Page 52 of 77

Certificate of AnalysisBarker-Hughesville_Pilot Study_MAR 2013_D353
DG-353
Project Name:
TDF #:
TechLaw Inc., ESAT Region 8
INORGANIC ANALYSES DATA SHEET
Intial and Continuing Calibration Blanks
Analysis Name:Analytical Method: EPA 300.0
mg/L
C130301Instrument: ESAT Dionex IC
Analytical Sequence: Dissolved Concentration Units:1303044
Work Order: Nu
WC - Anions by Ion Chromatography 2010
Blank criteria = +/- 5x analyte MDL (+/- PQL)
AnalyteContinuing Calibration Blanks
Initial
Calibration
Blank (1 & 2)
Method
Blank
(Batch ID)PQL
Fluoride
0.00 0.00 0.00 0.00 0.00
8765
1 2 3 4
0.00 NA
1303036-BLK1 NA
0.20
Chloride
0.00 0.00 0.00 0.00 0.00
8765
1 2 3 4
0.00 NA
1303036-BLK1 NA
2.00
Sulfate as SO4
0.00 0.00 0.00 0.00 0.00
8765
1 2 3 4
0.00 NA
1303036-BLK1 NA
5.00
Page 53 of 77

Certificate of AnalysisBarker-Hughesville_Pilot Study_MAR 2013_D353
DG-353
Project Name:
TDF #:
Initial and Continuing Calibration Verification Results
Mettler AT Method: EPA 310.1
Units: mg CaCO3 / LC130301Work Order:Sequence: 1303012
%RTrue%RTrue%RTrue%RTrue Found Found Found Found
TechLaw, Inc. - ESAT Region 8
Analyte
Initial (ICV1, ICV2) Continuing Calibration Verification Standards (CCVs)
Analysis Name: WC - Alkalinity
Total
Total Alkalinity
100 93.0 100 94.1 94.193.0
4 5 6
987
1 2 3
Metals - ICV & CCV %R Criteria = 90 - 110%, Classical Chemistry %R Criteria - ICV = 90 - 110%R, CCV = 80 - 120%R.
Page 54 of 77

Certificate of AnalysisBarker-Hughesville_Pilot Study_MAR 2013_D353
DG-353
Project Name:
TDF #:
Initial and Continuing Calibration Verification Results
ICPOE - PE Optima Method: 200.7
Units: ug/LC130301Work Order:Sequence: 1303021
%RTrue%RTrue%RTrue%RTrue Found Found Found Found
TechLaw, Inc. - ESAT Region 8
Analyte
Initial (ICV1, ICV2) Continuing Calibration Verification Standards (CCVs)
Analysis Name: ICPOE Diss. Metals
Dissolved
Aluminum1000 957.7
12500 95.8
101.0 12500 12820 102.6 12500 12620 101.012630
4 5 6
987
1 2 3
Beryllium1000 996.3
500 99.6
103.4 500 520.5 104.1 500 518.3 103.7517.1
4 5 6
987
1 2 3
Calcium1000 948.3
12500 94.8
104.2 12500 12940 103.5 12500 12960 103.713030
4 5 6
987
1 2 3
Copper1000 1006
1000 100.6
101.2 1000 1020 102.0 1000 1009 100.91012
4 5 6
987
1 2 3
Iron1000 994.4
12500 99.4
108.0 12500 13280 106.2 12500 13450 107.613500
4 5 6
987
1 2 3
Magnesium1000 1002
12500 100.2
103.0 12500 12920 103.4 12500 12830 102.612870
4 5 6
987
1 2 3
Page 55 of 77

Certificate of AnalysisBarker-Hughesville_Pilot Study_MAR 2013_D353
DG-353
Project Name:
TDF #:
Initial and Continuing Calibration Verification Results
ICPOE - PE Optima Method: 200.7
Units: ug/LC130301Work Order:Sequence: 1303021
%RTrue%RTrue%RTrue%RTrue Found Found Found Found
TechLaw, Inc. - ESAT Region 8
Analyte
Initial (ICV1, ICV2) Continuing Calibration Verification Standards (CCVs)
Analysis Name: ICPOE Diss. Metals
Dissolved
Manganese1000 1034
1000 103.4
104.1 1000 1036 103.6 1000 1037 103.71041
4 5 6
987
1 2 3
Potassium5000 4674
25000 93.5
99.3 25000 25420 101.7 25000 24940 99.824830
4 5 6
987
1 2 3
Sodium1000 964.2
12500 96.4
101.8 12500 12900 103.2 12500 12860 102.912730
4 5 6
987
1 2 3
Zinc1000 1026
2500 102.6
104.4 2500 2628 105.1 2500 2621 104.82609
4 5 6
987
1 2 3
Metals - ICV & CCV %R Criteria = 90 - 110%, Classical Chemistry %R Criteria - ICV = 90 - 110%R, CCV = 80 - 120%R.
Page 56 of 77

Certificate of AnalysisBarker-Hughesville_Pilot Study_MAR 2013_D353
DG-353
Project Name:
TDF #:
Initial and Continuing Calibration Verification Results
ICPOE - PE Optima Method: 200.7
Units: ug/LC130301Work Order:Sequence: 1303022
%RTrue%RTrue%RTrue%RTrue Found Found Found Found
TechLaw, Inc. - ESAT Region 8
Analyte
Initial (ICV1, ICV2) Continuing Calibration Verification Standards (CCVs)
Analysis Name: ICPOE Tot. Rec. Metals
Total Recoverable
Aluminum1000 957.7
12500 95.8
101.0 12500 12820 102.6 12500 12620 101.012630
12500 12790 12500 12640 101.1
4 5 6
987
102.3
1 2 3
Beryllium1000 996.3
500 99.6
103.4 500 520.5 104.1 500 518.3 103.7517.1
500 513.1 500 521.7 104.3
4 5 6
987
102.6
1 2 3
Calcium1000 948.3
12500 94.8
104.2 12500 12940 103.5 12500 12960 103.713030
12500 12940 12500 13140 105.1
4 5 6
987
103.5
1 2 3
Copper1000 1006
1000 100.6
101.2 1000 1020 102.0 1000 1009 100.91012
1000 1015 1000 1005 100.5
4 5 6
987
101.5
1 2 3
Iron1000 994.4
12500 99.4
108.0 12500 13280 106.2 12500 13450 107.613500
12500 13170 12500 13490 107.9
4 5 6
987
105.4
1 2 3
Magnesium1000 1002
12500 100.2
103.0 12500 12920 103.4 12500 12830 102.612870
12500 12850 12500 12840 102.7
4 5 6
987
102.8
1 2 3
Page 57 of 77

Certificate of AnalysisBarker-Hughesville_Pilot Study_MAR 2013_D353
DG-353
Project Name:
TDF #:
Initial and Continuing Calibration Verification Results
ICPOE - PE Optima Method: 200.7
Units: ug/LC130301Work Order:Sequence: 1303022
%RTrue%RTrue%RTrue%RTrue Found Found Found Found
TechLaw, Inc. - ESAT Region 8
Analyte
Initial (ICV1, ICV2) Continuing Calibration Verification Standards (CCVs)
Analysis Name: ICPOE Tot. Rec. Metals
Total Recoverable
Manganese1000 1034
1000 103.4
104.1 1000 1036 103.6 1000 1037 103.71041
1000 1037 1000 1039 103.9
4 5 6
987
103.7
1 2 3
Potassium5000 4674
25000 93.5
99.3 25000 25420 101.7 25000 24940 99.824830
25000 25410 25000 24970 99.9
4 5 6
987
101.6
1 2 3
Sodium1000 964.2
12500 96.4
101.8 12500 12900 103.2 12500 12860 102.912730
12500 12720 12500 12670 101.4
4 5 6
987
101.8
1 2 3
Zinc1000 1026
2500 102.6
104.4 2500 2628 105.1 2500 2621 104.82609
2500 2591 2500 2629 105.2
4 5 6
987
103.6
1 2 3
Metals - ICV & CCV %R Criteria = 90 - 110%, Classical Chemistry %R Criteria - ICV = 90 - 110%R, CCV = 80 - 120%R.
Page 58 of 77

Certificate of AnalysisBarker-Hughesville_Pilot Study_MAR 2013_D353
DG-353
Project Name:
TDF #:
Initial and Continuing Calibration Verification Results
ICPMS-PE DRC-II Method: 200.8
Units: ug/LC130301Work Order:Sequence: 1303023
%RTrue%RTrue%RTrue%RTrue Found Found Found Found
TechLaw, Inc. - ESAT Region 8
Analyte
Initial (ICV1, ICV2) Continuing Calibration Verification Standards (CCVs)
Analysis Name: ICPMS Diss. Metals
Dissolved
Antimony50.0 47.7
50.0 95.4
91.4 50.0 47.4 94.8 50.0 48.4 96.845.7
4 5 6
987
1 2 3
Arsenic50.0 51.6
50.0 103.2
97.6 50.0 50.7 101.4 50.0 49.8 99.648.8
4 5 6
987
1 2 3
Barium50.0 48.3
50.0 96.6
97.0 50.0 48.3 96.6 50.0 48.7 97.448.5
4 5 6
987
1 2 3
Cadmium50.0 48.2
50.0 96.4
95.4 50.0 49.7 99.4 50.0 50.3 100.647.7
4 5 6
987
1 2 3
Chromium50.0 48.0
50.0 96.0
97.2 50.0 50.8 101.6 50.0 48.5 97.048.6
4 5 6
987
1 2 3
Cobalt50.0 47.1
50.0 94.2
95.8 50.0 51.2 102.4 50.0 45.6 91.247.9
4 5 6
987
1 2 3
Page 59 of 77

Certificate of AnalysisBarker-Hughesville_Pilot Study_MAR 2013_D353
DG-353
Project Name:
TDF #:
Initial and Continuing Calibration Verification Results
ICPMS-PE DRC-II Method: 200.8
Units: ug/LC130301Work Order:Sequence: 1303023
%RTrue%RTrue%RTrue%RTrue Found Found Found Found
TechLaw, Inc. - ESAT Region 8
Analyte
Initial (ICV1, ICV2) Continuing Calibration Verification Standards (CCVs)
Analysis Name: ICPMS Diss. Metals
Dissolved
Lead50.0 51.0
50.0 102.0
98.4 50.0 48.3 96.6 50.0 46.0 92.049.2
4 5 6
987
1 2 3
Nickel50.0 48.9
50.0 97.8
96.6 50.0 53.9 107.8 50.0 47.9 95.848.3
4 5 6
987
1 2 3
Selenium250 269
50.0 107.6
103.4 50.0 54.3 108.6 50.0 51.5 103.051.7
4 5 6
987
1 2 3
Silver50.0 50.2
50.0 100.4
101.8 50.0 51.0 102.0 50.0 49.9 99.850.9
4 5 6
987
1 2 3
Thallium50.0 50.9
50.0 101.8
98.0 50.0 47.7 95.4 50.0 45.8 91.649.0
4 5 6
987
1 2 3
Vanadium50.0 47.9
50.0 95.8
96.2 50.0 51.1 102.2 50.0 47.7 95.448.1
4 5 6
987
1 2 3
Metals - ICV & CCV %R Criteria = 90 - 110%, Classical Chemistry %R Criteria - ICV = 90 - 110%R, CCV = 80 - 120%R.
Page 60 of 77

Certificate of AnalysisBarker-Hughesville_Pilot Study_MAR 2013_D353
DG-353
Project Name:
TDF #:
Initial and Continuing Calibration Verification Results
ICPMS-PE DRC-II Method: 200.8
Units: ug/LC130301Work Order:Sequence: 1303024
%RTrue%RTrue%RTrue%RTrue Found Found Found Found
TechLaw, Inc. - ESAT Region 8
Analyte
Initial (ICV1, ICV2) Continuing Calibration Verification Standards (CCVs)
Analysis Name: ICPMS Tot. Rec. Metals
Total Recoverable
Antimony50.0 47.68
50.0 95.4
91.4 50.0 47.45 94.9 50.0 48.42 96.845.69
50.0 47.48 50.0 48.08 96.2
4 5 6
987
95.0
1 2 3
Arsenic50.0 51.57
50.0 103.1
97.6 50.0 50.70 101.4 50.0 49.82 99.648.78
50.0 49.28 50.0 51.63 103.3
4 5 6
987
98.6
1 2 3
Barium50.0 48.31
50.0 96.6
97.1 50.0 48.31 96.6 50.0 48.67 97.348.53
50.0 50.35 50.0 48.69 97.4
4 5 6
987
100.7
1 2 3
Cadmium50.0 48.16
50.0 96.3
95.4 50.0 49.67 99.3 50.0 50.26 100.547.68
50.0 48.50 50.0 49.61 99.2
4 5 6
987
97.0
1 2 3
Chromium50.0 47.98
50.0 96.0
97.3 50.0 50.85 101.7 50.0 48.50 97.048.63
50.0 46.76 50.0 49.05 98.1
4 5 6
987
93.5
1 2 3
Cobalt50.0 47.07
50.0 94.1
95.9 50.0 51.17 102.3 50.0 45.64 91.347.95
50.0 46.05 50.0 47.76 95.5
4 5 6
987
92.1
1 2 3
Page 61 of 77

Certificate of AnalysisBarker-Hughesville_Pilot Study_MAR 2013_D353
DG-353
Project Name:
TDF #:
Initial and Continuing Calibration Verification Results
ICPMS-PE DRC-II Method: 200.8
Units: ug/LC130301Work Order:Sequence: 1303024
%RTrue%RTrue%RTrue%RTrue Found Found Found Found
TechLaw, Inc. - ESAT Region 8
Analyte
Initial (ICV1, ICV2) Continuing Calibration Verification Standards (CCVs)
Analysis Name: ICPMS Tot. Rec. Metals
Total Recoverable
Lead50.0 50.98
50.0 102.0
98.5 50.0 48.34 96.7 50.0 46.00 92.049.23
50.0 47.38 50.0 46.00 92.0
4 5 6
987
94.8
1 2 3
Nickel50.0 48.87
50.0 97.7
96.7 50.0 53.89 107.8 50.0 47.94 95.948.33
50.0 47.91 50.0 49.05 98.1
4 5 6
987
95.8
1 2 3
Selenium250 268.7
50.0 107.5
103.3 50.0 54.30 108.6 50.0 51.47 102.951.65
50.0 52.57 50.0 55.13 110.3
4 5 6
987
105.1
1 2 3
Silver50.0 50.19
50.0 100.4
101.8 50.0 50.96 101.9 50.0 49.89 99.850.91
50.0 49.10 50.0 48.68 97.4
4 5 6
987
98.2
1 2 3
Thallium50.0 50.91
50.0 101.8
97.9 50.0 47.72 95.4 50.0 45.80 91.648.96
50.0 47.63 50.0 46.13 92.3
4 5 6
987
95.3
1 2 3
Vanadium50.0 47.92
50.0 95.8
96.2 50.0 51.14 102.3 50.0 47.73 95.548.10
50.0 45.74 50.0 47.95 95.9
4 5 6
987
91.5
1 2 3
Metals - ICV & CCV %R Criteria = 90 - 110%, Classical Chemistry %R Criteria - ICV = 90 - 110%R, CCV = 80 - 120%R.
Page 62 of 77

Certificate of AnalysisBarker-Hughesville_Pilot Study_MAR 2013_D353
DG-353
Project Name:
TDF #:
Initial and Continuing Calibration Verification Results
ESAT Dionex IC Method: EPA 300.0
Units: mg/LC130301Work Order:Sequence: 1303044
%RTrue%RTrue%RTrue%RTrue Found Found Found Found
TechLaw, Inc. - ESAT Region 8
Analyte
Initial (ICV1, ICV2) Continuing Calibration Verification Standards (CCVs)
Analysis Name: WC - Anions by Ion Chromatography 2010
Dissolved
Chloride15.0 15.1
40.0 100.7
99.0 40.0 39.3 98.3 40.0 39.2 98.039.6
40.0 39.2
4 5 6
987
98.0
1 2 3
Fluoride10.0 10.6
4.00 106.0
102.5 4.00 4.1 102.5 4.00 4.0 100.04.1
4.00 4.1
4 5 6
987
102.5
1 2 3
Sulfate as SO475.0 77.3
100 103.1
99.9 100 98.9 98.9 100 98.2 98.299.9
100 98.6
4 5 6
987
98.6
1 2 3
Metals - ICV & CCV %R Criteria = 90 - 110%, Classical Chemistry %R Criteria - ICV = 90 - 110%R, CCV = 80 - 120%R.
Page 63 of 77

Certificate of AnalysisBarker-Hughesville_Pilot Study_MAR 2013_D353
DG-353
Project Name:
TDF #:
ICPMS-PE DRC-II
Analyte Check Sample Result* Units True %R
ICP Interference Check Sample
TechLaw, Inc. - ESAT Region 8
PQL
Sequence: 1303023 ICPMS Diss. MetalsAnalysis:
Antimony 0.1 ug/LIFA1 1.00
0.1 ug/LIFB1 1.00
Arsenic -0.1 ug/LIFA1 2.00
19.2 20 96ug/LIFB1 2.00
Barium 0.2 ug/LIFA1 10.0
0.1 ug/LIFB1 10.0
Cadmium 0.1 ug/LIFA1 0.200
19.2 20 96ug/LIFB1 0.200
Chromium 0.8 ug/LIFA1 2.00
20.4 20 102ug/LIFB1 2.00
Cobalt -0.1 ug/LIFA1 0.200
19.4 20 97ug/LIFB1 0.200
Lead 0.1 ug/LIFA1 0.200
0.1 ug/LIFB1 0.200
Nickel 0.3 ug/LIFA1 1.00
20.4 20 102ug/LIFB1 1.00
Selenium 0.0 ug/LIFA1 1.00
0.0 ug/LIFB1 1.00
Silver 0.0 ug/LIFA1 1.00
20.1 20 101ug/LIFB1 1.00
Thallium 0.0 ug/LIFA1 1.00
0.0 ug/LIFB1 1.00
Vanadium -0.2 ug/LIFA1 3.00
-0.4 ug/LIFB1 3.00
*Criteria = 80-120%R of True Value or +/- PQL
See raw data for complete analyte list and results.
Page 64 of 77

Certificate of AnalysisBarker-Hughesville_Pilot Study_MAR 2013_D353
DG-353
Project Name:
TDF #:
ICPMS-PE DRC-II
Analyte Check Sample Result* Units True %R
ICP Interference Check Sample
TechLaw, Inc. - ESAT Region 8
PQL
Sequence: 1303024 ICPMS Tot. Rec. MetalsAnalysis:
Antimony 0.1 ug/LIFA1 1.00
0.1 ug/LIFB1 1.00
Arsenic -0.1 ug/LIFA1 2.00
19.2 20 96ug/LIFB1 2.00
Barium 0.2 ug/LIFA1 10.0
0.1 ug/LIFB1 10.0
Cadmium 0.1 ug/LIFA1 0.200
19.2 20 96ug/LIFB1 0.200
Chromium 0.8 ug/LIFA1 2.00
20.4 20 102ug/LIFB1 2.00
Cobalt -0.1 ug/LIFA1 0.200
19.4 20 97ug/LIFB1 0.200
Lead 0.1 ug/LIFA1 0.200
0.1 ug/LIFB1 0.200
Nickel 0.3 ug/LIFA1 1.00
20.4 20 102ug/LIFB1 1.00
Selenium 0.0 ug/LIFA1 1.00
0.0 ug/LIFB1 1.00
Silver 0.0 ug/LIFA1 1.00
20.1 20 101ug/LIFB1 1.00
Thallium 0.0 ug/LIFA1 1.00
0.0 ug/LIFB1 1.00
Vanadium -0.2 ug/LIFA1 3.00
-0.4 ug/LIFB1 3.00
*Criteria = 80-120%R of True Value or +/- PQL
See raw data for complete analyte list and results.
Page 65 of 77
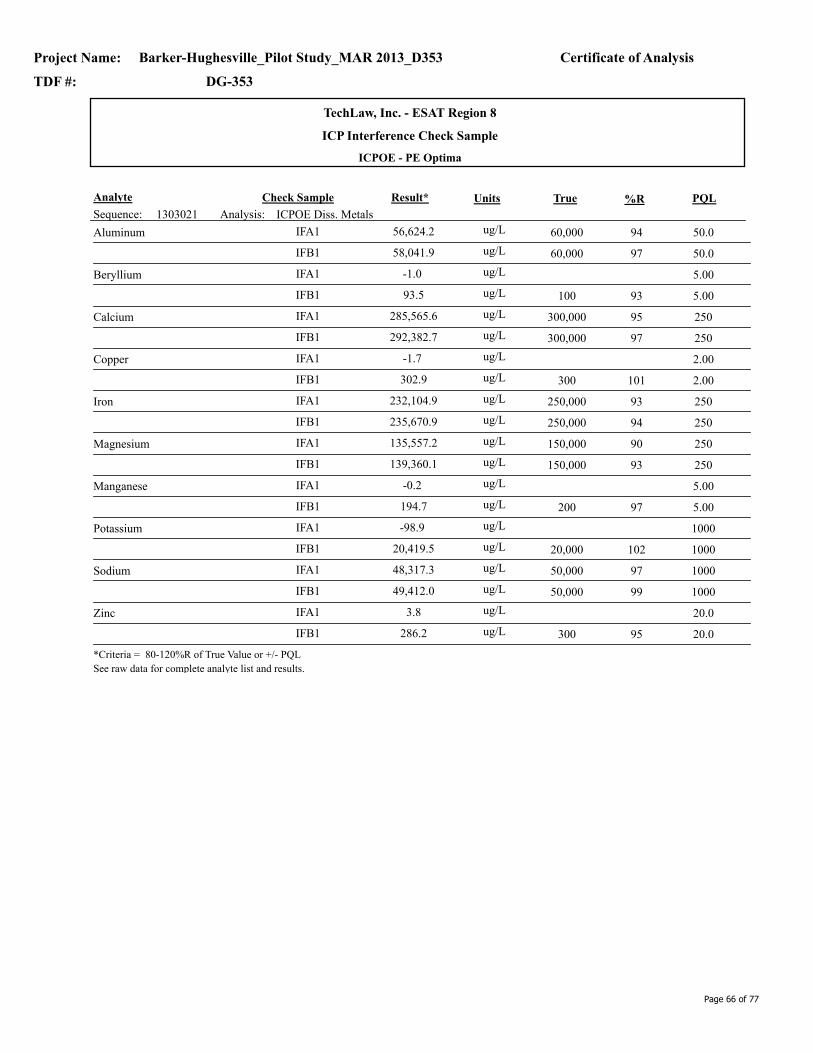
Certificate of AnalysisBarker-Hughesville_Pilot Study_MAR 2013_D353
DG-353
Project Name:
TDF #:
ICPOE - PE Optima
Analyte Check Sample Result* Units True %R
ICP Interference Check Sample
TechLaw, Inc. - ESAT Region 8
PQL
Sequence: 1303021 ICPOE Diss. MetalsAnalysis:
Aluminum 56,624.2 60,000 94ug/LIFA1 50.0
58,041.9 60,000 97ug/LIFB1 50.0
Beryllium -1.0 ug/LIFA1 5.00
93.5 100 93ug/LIFB1 5.00
Calcium 285,565.6 300,000 95ug/LIFA1 250
292,382.7 300,000 97ug/LIFB1 250
Copper -1.7 ug/LIFA1 2.00
302.9 300 101ug/LIFB1 2.00
Iron 232,104.9 250,000 93ug/LIFA1 250
235,670.9 250,000 94ug/LIFB1 250
Magnesium 135,557.2 150,000 90ug/LIFA1 250
139,360.1 150,000 93ug/LIFB1 250
Manganese -0.2 ug/LIFA1 5.00
194.7 200 97ug/LIFB1 5.00
Potassium -98.9 ug/LIFA1 1000
20,419.5 20,000 102ug/LIFB1 1000
Sodium 48,317.3 50,000 97ug/LIFA1 1000
49,412.0 50,000 99ug/LIFB1 1000
Zinc 3.8 ug/LIFA1 20.0
286.2 300 95ug/LIFB1 20.0
*Criteria = 80-120%R of True Value or +/- PQL
See raw data for complete analyte list and results.
Page 66 of 77

Certificate of AnalysisBarker-Hughesville_Pilot Study_MAR 2013_D353
DG-353
Project Name:
TDF #:
ICPOE - PE Optima
Analyte Check Sample Result* Units True %R
ICP Interference Check Sample
TechLaw, Inc. - ESAT Region 8
PQL
Sequence: 1303022 ICPOE Tot. Rec. MetalsAnalysis:
Aluminum 56,624.2 60,000 94ug/LIFA1 50.0
58,041.9 60,000 97ug/LIFB1 50.0
Beryllium -1.0 ug/LIFA1 5.00
93.5 100 93ug/LIFB1 5.00
Calcium 285,565.6 300,000 95ug/LIFA1 250
292,382.7 300,000 97ug/LIFB1 250
Copper -1.7 ug/LIFA1 2.00
302.9 300 101ug/LIFB1 2.00
Iron 232,104.9 250,000 93ug/LIFA1 250
235,670.9 250,000 94ug/LIFB1 250
Magnesium 135,557.2 150,000 90ug/LIFA1 250
139,360.1 150,000 93ug/LIFB1 250
Manganese -0.2 ug/LIFA1 5.00
194.7 200 97ug/LIFB1 5.00
Potassium -98.9 ug/LIFA1 1000
20,419.5 20,000 102ug/LIFB1 1000
Sodium 48,317.3 50,000 97ug/LIFA1 1000
49,412.0 50,000 99ug/LIFB1 1000
Zinc 3.8 ug/LIFA1 20.0
286.2 300 95ug/LIFB1 20.0
*Criteria = 80-120%R of True Value or +/- PQL
See raw data for complete analyte list and results.
Page 67 of 77

Certificate of AnalysisBarker-Hughesville_Pilot Study_MAR 2013_D353
DG-353
Project Name:
TDF #:
Analyte UnitsTrue Found %R
Detection Limit (PQL) Standard
Sequence: 1303023
ICPMS-PE DRC-II
TechLaw, Inc. - ESAT Region 8
Metals (Dissolved) by EPA 200/7000 Series Methods
Antimony 0.969 971.00 ug/L
Arsenic 2.08 1042.00 ug/L
Barium 0.565 1130.500 ug/L
Cadmium 0.194 970.200 ug/L
Chromium 0.937 941.00 ug/L
Cobalt 0.174 870.200 ug/L
Lead 0.197 990.200 ug/L
Nickel 0.989 991.00 ug/L
Selenium 0.977 981.00 ug/L
Silver 0.476 950.500 ug/L
Thallium 0.189 950.200 ug/L
Vanadium 1.99 1002.00 ug/L
Recovery Control Limits: 70-130% except Pb, Tl, Sb, & Hg at 50-150%. No limits for Al, Ca, Fe, K, Mg & Na.
Page 68 of 77

Certificate of AnalysisBarker-Hughesville_Pilot Study_MAR 2013_D353
DG-353
Project Name:
TDF #:
Analyte UnitsTrue Found %R
Detection Limit (PQL) Standard
Sequence: 1303021
ICPOE - PE Optima
TechLaw, Inc. - ESAT Region 8
Metals (Dissolved) by EPA 200/7000 Series Methods
Aluminum 100.8 101100 ug/L
Beryllium 5.119 1025.00 ug/L
Calcium 247.3 99250 ug/L
Copper 8.615 8610.0 ug/L
Iron 71.03 71100 ug/L
Magnesium 1020 1021000 ug/L
Manganese 10.40 10410.0 ug/L
Potassium 983.5 981000 ug/L
Sodium 1044 1041000 ug/L
Zinc 55.85 11250.0 ug/L
Recovery Control Limits: 70-130% except Pb, Tl, Sb, & Hg at 50-150%. No limits for Al, Ca, Fe, K, Mg & Na.
Page 69 of 77

Certificate of AnalysisBarker-Hughesville_Pilot Study_MAR 2013_D353
DG-353
Project Name:
TDF #:
Analyte UnitsTrue Found %R
Detection Limit (PQL) Standard
Sequence: 1303024
ICPMS-PE DRC-II
TechLaw, Inc. - ESAT Region 8
Metals (Total Recov) by EPA 200/7000 Series Methods
Antimony 0.9692 971.00 ug/L
Arsenic 2.083 1042.00 ug/L
Barium 0.5653 1130.500 ug/L
Cadmium 0.1941 970.200 ug/L
Chromium 0.9366 941.00 ug/L
Cobalt 0.1744 870.200 ug/L
Lead 0.1974 990.200 ug/L
Nickel 0.9895 991.00 ug/L
Selenium 0.9772 981.00 ug/L
Silver 0.4759 950.500 ug/L
Thallium 0.1893 950.200 ug/L
Vanadium 1.991 1002.00 ug/L
Recovery Control Limits: 70-130% except Pb, Tl, Sb, & Hg at 50-150%. No limits for Al, Ca, Fe, K, Mg & Na.
Page 70 of 77
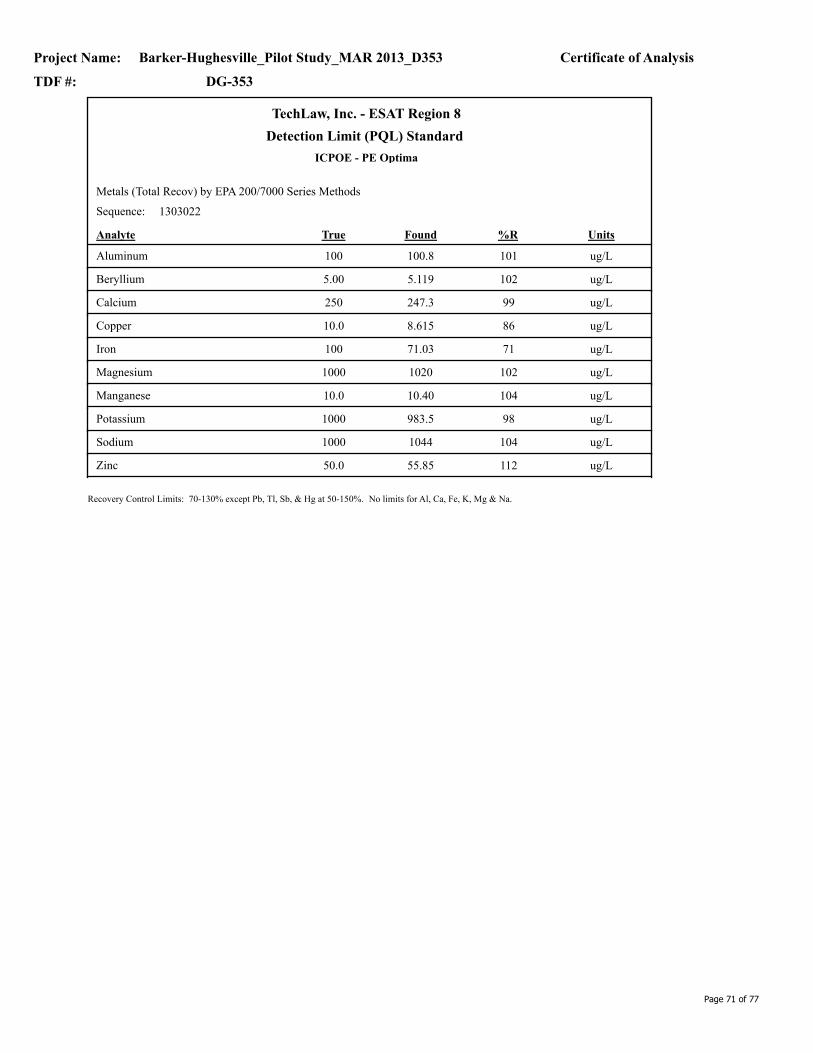
Certificate of AnalysisBarker-Hughesville_Pilot Study_MAR 2013_D353
DG-353
Project Name:
TDF #:
Analyte UnitsTrue Found %R
Detection Limit (PQL) Standard
Sequence: 1303022
ICPOE - PE Optima
TechLaw, Inc. - ESAT Region 8
Metals (Total Recov) by EPA 200/7000 Series Methods
Aluminum 100.8 101100 ug/L
Beryllium 5.119 1025.00 ug/L
Calcium 247.3 99250 ug/L
Copper 8.615 8610.0 ug/L
Iron 71.03 71100 ug/L
Magnesium 1020 1021000 ug/L
Manganese 10.40 10410.0 ug/L
Potassium 983.5 981000 ug/L
Sodium 1044 1041000 ug/L
Zinc 55.85 11250.0 ug/L
Recovery Control Limits: 70-130% except Pb, Tl, Sb, & Hg at 50-150%. No limits for Al, Ca, Fe, K, Mg & Na.
Page 71 of 77

Certificate of AnalysisBarker-Hughesville_Pilot Study_MAR 2013_D353
DG-353
Project Name:
TDF #:
INSTRUMENT ANALYSIS SEQUENCE LOG
TechLaw Inc., ESAT Region 8
Sequence ID#:Analytical Method:
Instrument ID #: Mettler AT
1303012
DG-353LSR #:
EPA 310.1 Total
Water
Analysis DateAnalysis ID Analysis TimeSample Name
1303009-SRM1 13:5003/07/13Reference
1303009-BLK1 13:5003/07/13Blank
C130301-03 13:5003/07/1313BH-BENCH-OXD
1303009-DUP1 13:5003/07/13Duplicate
C130301-06 13:5003/07/1313BH-DT-BENCH-PH45-CHIT
C130301-09 13:5003/07/1313BH-DT-BENCH-PH45-LIME
C130301-13 13:5003/07/1313BH-DT-BENCH-PH45-NAOH
C130301-17 13:5003/07/1313BH-DT-BENCH-PH95-LIME
C130301-20 13:5003/07/1313BH-DT-BENCH-PH95-NAOH
C130301-23 13:5003/07/1313BH-DT-BENCH-RAW
C130301-26 13:5003/07/1313BH-DT-BENCH-SPS-C1
C130301-29 13:5003/07/1313BH-DT-BENCH-SPS-C2
1303012-CCV1 13:5003/07/13Calibration Check
1303012-CCB1 13:5003/07/13Calibration Blank
C130301-32 13:5003/07/1313BH-DT-BENCH-SPS-C3
C130301-35 13:5003/07/1313BH-DT-BENCH-SPS-C4
1303012-CCV2 13:5003/07/13Calibration Check
1303012-CCB2 13:5003/07/13Calibration Blank
Page 72 of 77

Certificate of AnalysisBarker-Hughesville_Pilot Study_MAR 2013_D353
DG-353
Project Name:
TDF #:
INSTRUMENT ANALYSIS SEQUENCE LOG
TechLaw Inc., ESAT Region 8
Sequence ID#:Analytical Method:
Instrument ID #: ICPOE - PE Optima
1303021
DG-353LSR #:
200.7 Dissolved
Water
Analysis DateAnalysis ID Analysis TimeSample Name
1303021-ICV1 10:4203/08/13Initial Cal Check
1303021-ICB1 10:4503/08/13Initial Cal Blank
1303021-CRL1 10:4903/08/13Instrument RL Check
1303021-IFA1 10:5103/08/13Interference Check A
1303021-IFB1 10:5503/08/13Interference Check B
1303021-CCV1 10:5903/08/13Calibration Check
1303021-CCB1 11:0203/08/13Calibration Blank
1303010-BLK1 11:0503/08/13Blank
1303010-BS1 11:0803/08/13Blank Spike
C130301-01 11:1103/08/1313BH-BENCH-OXD
1303010-DUP1 11:1403/08/13Duplicate
1303021-SRD1 11:1703/08/13Serial Dilution
1303010-MS1 11:2003/08/13Matrix Spike
1303010-MSD1 11:2303/08/13Matrix Spike Dup
C130301-04 11:2703/08/1313BH-DT-BENCH-PH45-CHIT
C130301-07 11:3003/08/1313BH-DT-BENCH-PH45-LIME
1303021-CCV2 11:3603/08/13Calibration Check
1303021-CCB2 11:3903/08/13Calibration Blank
C130301-11 11:4203/08/1313BH-DT-BENCH-PH45-NAOH
C130301-15 11:4503/08/1313BH-DT-BENCH-PH95-LIME
C130301-18 11:4803/08/1313BH-DT-BENCH-PH95-NAOH
C130301-21 11:5103/08/1313BH-DT-BENCH-RAW
C130301-24 11:5403/08/1313BH-DT-BENCH-SPS-C1
C130301-27 11:5703/08/1313BH-DT-BENCH-SPS-C2
C130301-30 12:0103/08/1313BH-DT-BENCH-SPS-C3
C130301-33 12:0403/08/1313BH-DT-BENCH-SPS-C4
1303021-CCV3 12:1303/08/13Calibration Check
1303021-CCB3 12:1603/08/13Calibration Blank
Page 73 of 77

Certificate of AnalysisBarker-Hughesville_Pilot Study_MAR 2013_D353
DG-353
Project Name:
TDF #:
INSTRUMENT ANALYSIS SEQUENCE LOG
TechLaw Inc., ESAT Region 8
Sequence ID#:Analytical Method:
Instrument ID #: ICPOE - PE Optima
1303022
DG-353LSR #:
200.7 Total Recoverable
Water
Analysis DateAnalysis ID Analysis TimeSample Name
1303022-ICV1 10:4203/08/13Initial Cal Check
1303022-ICB1 10:4503/08/13Initial Cal Blank
1303022-CRL1 10:4903/08/13Instrument RL Check
1303022-IFA1 10:5103/08/13Interference Check A
1303022-IFB1 10:5503/08/13Interference Check B
1303022-CCV1 10:5903/08/13Calibration Check
1303022-CCB1 11:0203/08/13Calibration Blank
1303022-CCV2 11:3603/08/13Calibration Check
1303022-CCB2 11:3903/08/13Calibration Blank
1303022-CCV3 12:1303/08/13Calibration Check
1303022-CCB3 12:1603/08/13Calibration Blank
1303008-BLK1 12:1903/08/13Blank
1303008-SRM1 12:2203/08/13Reference
C130301-22 12:2503/08/1313BH-DT-BENCH-RAW
1303008-DUP1 12:2803/08/13Duplicate
1303022-SRD1 12:3103/08/13Serial Dilution
1303008-MS1 12:3403/08/13Matrix Spike
1303008-MSD1 12:3703/08/13Matrix Spike Dup
1303008-PS1 12:4003/08/13Post Spike
C130301-02 12:4403/08/1313BH-BENCH-OXD
1303022-CCV4 12:5003/08/13Calibration Check
1303022-CCB4 12:5303/08/13Calibration Blank
C130301-05 12:5603/08/1313BH-DT-BENCH-PH45-CHIT
C130301-08 12:5903/08/1313BH-DT-BENCH-PH45-LIME
C130301-12 13:0203/08/1313BH-DT-BENCH-PH45-NAOH
C130301-16 13:0503/08/1313BH-DT-BENCH-PH95-LIME
C130301-19 13:0803/08/1313BH-DT-BENCH-PH95-NAOH
C130301-25 13:1103/08/1313BH-DT-BENCH-SPS-C1
C130301-28 13:1503/08/1313BH-DT-BENCH-SPS-C2
C130301-31 13:1803/08/1313BH-DT-BENCH-SPS-C3
C130301-34 13:2103/08/1313BH-DT-BENCH-SPS-C4
1303022-CCV5 13:2703/08/13Calibration Check
1303022-CCB5 13:3003/08/13Calibration Blank
Page 74 of 77

Certificate of AnalysisBarker-Hughesville_Pilot Study_MAR 2013_D353
DG-353
Project Name:
TDF #:
INSTRUMENT ANALYSIS SEQUENCE LOG
TechLaw Inc., ESAT Region 8
Sequence ID#:Analytical Method:
Instrument ID #: ICPMS-PE DRC-II
1303023
DG-353LSR #:
200.8 Dissolved
Water
Analysis DateAnalysis ID Analysis TimeSample Name
1303023-ICV1 11:4003/08/13Initial Cal Check
1303023-ICB1 11:4303/08/13Initial Cal Blank
1303023-CRL1 11:4703/08/13Instrument RL Check
1303023-IFA1 11:5003/08/13Interference Check A
1303023-IFB1 11:5303/08/13Interference Check B
1303023-CCV1 11:5603/08/13Calibration Check
1303023-CCB1 12:0003/08/13Calibration Blank
1303011-BLK1 12:0303/08/13Blank
C130301-01 12:0603/08/1313BH-BENCH-OXD
1303011-DUP1 12:0903/08/13Duplicate
1303023-SRD1 12:1203/08/13Serial Dilution
1303011-BS1 12:1503/08/13Blank Spike
1303011-MS1 12:1803/08/13Matrix Spike
1303011-MSD1 12:2103/08/13Matrix Spike Dup
C130301-04 12:2403/08/1313BH-DT-BENCH-PH45-CHIT
C130301-07 12:2703/08/1313BH-DT-BENCH-PH45-LIME
1303023-CCV2 12:3303/08/13Calibration Check
1303023-CCB2 12:3703/08/13Calibration Blank
C130301-11 12:4003/08/1313BH-DT-BENCH-PH45-NAOH
C130301-15 12:4303/08/1313BH-DT-BENCH-PH95-LIME
C130301-18 12:4603/08/1313BH-DT-BENCH-PH95-NAOH
C130301-21 12:4903/08/1313BH-DT-BENCH-RAW
C130301-24 12:5203/08/1313BH-DT-BENCH-SPS-C1
C130301-27 12:5503/08/1313BH-DT-BENCH-SPS-C2
C130301-30 12:5803/08/1313BH-DT-BENCH-SPS-C3
C130301-33 13:0103/08/1313BH-DT-BENCH-SPS-C4
1303023-CCV3 13:1103/08/13Calibration Check
1303023-CCB3 13:1403/08/13Calibration Blank
Page 75 of 77

Certificate of AnalysisBarker-Hughesville_Pilot Study_MAR 2013_D353
DG-353
Project Name:
TDF #:
INSTRUMENT ANALYSIS SEQUENCE LOG
TechLaw Inc., ESAT Region 8
Sequence ID#:Analytical Method:
Instrument ID #: ICPMS-PE DRC-II
1303024
DG-353LSR #:
200.8 Total Recoverable
Water
Analysis DateAnalysis ID Analysis TimeSample Name
1303024-ICV1 11:4003/08/13Initial Cal Check
1303024-ICB1 11:4303/08/13Initial Cal Blank
1303024-CRL1 11:4703/08/13Instrument RL Check
1303024-IFA1 11:5003/08/13Interference Check A
1303024-IFB1 11:5303/08/13Interference Check B
1303024-CCV1 11:5603/08/13Calibration Check
1303024-CCB1 12:0003/08/13Calibration Blank
1303024-CCV2 12:3303/08/13Calibration Check
1303024-CCB2 12:3703/08/13Calibration Blank
1303024-CCV3 13:1103/08/13Calibration Check
1303024-CCB3 13:1403/08/13Calibration Blank
1303008-BLK2 13:1703/08/13Blank
C130301-22 13:2003/08/1313BH-DT-BENCH-RAW
1303008-DUP2 13:2303/08/13Duplicate
1303024-SRD1 13:2603/08/13Serial Dilution
1303008-SRM2 13:2903/08/13Reference
1303008-MS2 13:3203/08/13Matrix Spike
1303008-MSD2 13:3503/08/13Matrix Spike Dup
1303008-PS2 13:3803/08/13Post Spike
C130301-02 13:4203/08/1313BH-BENCH-OXD
1303024-CCV4 13:4803/08/13Calibration Check
1303024-CCB4 13:5103/08/13Calibration Blank
C130301-05 13:5403/08/1313BH-DT-BENCH-PH45-CHIT
C130301-08 13:5703/08/1313BH-DT-BENCH-PH45-LIME
C130301-12 14:0003/08/1313BH-DT-BENCH-PH45-NAOH
C130301-16 14:0303/08/1313BH-DT-BENCH-PH95-LIME
C130301-19 14:0603/08/1313BH-DT-BENCH-PH95-NAOH
C130301-25 14:1003/08/1313BH-DT-BENCH-SPS-C1
C130301-28 14:1303/08/1313BH-DT-BENCH-SPS-C2
C130301-31 14:1603/08/1313BH-DT-BENCH-SPS-C3
C130301-34 14:1903/08/1313BH-DT-BENCH-SPS-C4
1303024-CCV5 14:2503/08/13Calibration Check
1303024-CCB5 14:2803/08/13Calibration Blank
Page 76 of 77

Certificate of AnalysisBarker-Hughesville_Pilot Study_MAR 2013_D353
DG-353
Project Name:
TDF #:
INSTRUMENT ANALYSIS SEQUENCE LOG
TechLaw Inc., ESAT Region 8
Sequence ID#:Analytical Method:
Instrument ID #: ESAT Dionex IC
1303044
DG-353LSR #:
EPA 300.0 Dissolved
Water
Analysis DateAnalysis ID Analysis TimeSample Name
1303036-BS1 13:0303/19/13Blank Spike
1303044-ICV1 13:1903/19/13Initial Cal Check
1303044-ICB1 13:5203/19/13Initial Cal Blank
1303036-BLK1 14:0803/19/13Blank
C130301-03 14:2403/19/1313BH-BENCH-OXD
1303036-DUP1 14:4003/19/13Duplicate
1303036-MS1 14:5603/19/13Matrix Spike
1303036-MSD1 15:1203/19/13Matrix Spike Dup
C130301-06 15:2903/19/1313BH-DT-BENCH-PH45-CHIT
C130301-09 15:4503/19/1313BH-DT-BENCH-PH45-LIME
C130301-13 16:0103/19/1313BH-DT-BENCH-PH45-NAOH
1303044-CCV1 16:1703/19/13Calibration Check
1303044-CCB1 16:3303/19/13Calibration Blank
C130301-17 16:4903/19/1313BH-DT-BENCH-PH95-LIME
C130301-20 17:0503/19/1313BH-DT-BENCH-PH95-NAOH
C130301-23 17:2103/19/1313BH-DT-BENCH-RAW
C130301-26 17:3703/19/1313BH-DT-BENCH-SPS-C1
C130301-29 17:5303/19/1313BH-DT-BENCH-SPS-C2
C130301-32 18:0903/19/1313BH-DT-BENCH-SPS-C3
1303044-CCV2 18:4103/19/13Calibration Check
1303044-CCB2 18:5803/19/13Calibration Blank
1303044-CCV3 07:4203/20/13Calibration Check
1303044-CCB3 07:5803/20/13Calibration Blank
C130301-35 08:1503/20/1313BH-DT-BENCH-SPS-C4
1303044-CCV4 08:3103/20/13Calibration Check
1303044-CCB4 08:4703/20/13Calibration Blank
Page 77 of 77


ANALYTICAL SUMMARY REPORTANALYTICAL SUMMARY REPORTANALYTICAL SUMMARY REPORTANALYTICAL SUMMARY REPORT
The analyses presented in this report were performed by Energy Laboratories, Inc., 3161 E. Lyndale Ave., Helena, MT 59604, unless otherwise noted. Any exceptions or problems with the analyses are noted in the Laboratory Analytical Report, the QA/QC Summary Report, or the Case Narrative.
The results as reported relate only to the item(s) submitted for testing.
If you have any questions regarding these test results, please call.
Sample ID Client Sample ID Collect Date Receive Date Matrix Test
Report Approved By:
H13030003-001 13BH-DT-Bench-Raw 02/25/13 14:00 03/01/13 Aqueous Acidity, Total as CaCO3
H13030003-002 13BH-DT-Bench-Oxd 02/25/13 16:00 03/01/13 Aqueous Same As Above
H13030003-003 13BH-DT-Bench-Ph45-Naoh
02/25/13 16:45 03/01/13 Aqueous Same As Above
H13030003-004 13BH-DT-Bench-Ph45-Lime
02/25/13 18:30 03/01/13 Aqueous Same As Above
H13030003-005 13BH-DT-Bench-Ph45-Chit
02/26/13 12:00 03/01/13 Aqueous Same As Above
H13030003-006 13BH-DT-Bench-Ph95-Naoh
02/26/13 16:00 03/01/13 Aqueous Same As Above
H13030003-007 13BH-DT-Bench-Ph95-Lime
02/27/13 10:30 03/01/13 Aqueous Same As Above
H13030003-008 13BH-DT-Bench-Sps-C1 02/27/13 14:05 03/01/13 Aqueous Same As Above
H13030003-009 13BH-DT-Bench-Sps-C2 02/27/13 14:15 03/01/13 Aqueous Same As Above
H13030003-010 13BH-DT-Bench-Sps-C3 02/27/13 14:25 03/01/13 Aqueous Same As Above
H13030003-011 13BH-DT-Bench-Chi-C4 02/27/13 14:35 03/01/13 Aqueous Same As Above
CDM Federal Programs
Project Name: Danny T Bench Test Barker Hughesville Site
Workorder No.: H13030003
555 17th St Ste 1100
Denver, CO 80202
March 07, 2013
H823 - Baker-Hughsville Superfund SiteQuote ID:
Energy Laboratories Inc Helena MT received the following 11 samples for CDM Federal Programs on 3/1/2013 for analysis.
Page 1 of 15

LABORATORY ANALYTICAL REPORT
Client: CDM Federal Programs
Project: Danny T Bench Test Barker Hughesville Site
Lab ID: H13030003-001
Client Sample ID 13BH-DT-Bench-Raw
Collection Date: 02/25/13 14:00
Matrix: Aqueous
Report Date: 03/07/13
DateReceived: 03/01/13
Prepared by Helena, MT Branch
Analyses Result Units Analysis Date / ByRL Method
MCL/QCLQualifiers
INORGANICS
D 03/04/13 10:00 / cmm4.0mg/L380Acidity, Total as CaCO3 A2310 B
ReportDefinitions:
RL - Analyte reporting limit. MCL - Maximum contaminant level.
QCL - Quality control limit. ND - Not detected at the reporting limit.
D - RL increased due to sample matrix.
Page 2 of 15

LABORATORY ANALYTICAL REPORT
Client: CDM Federal Programs
Project: Danny T Bench Test Barker Hughesville Site
Lab ID: H13030003-002
Client Sample ID 13BH-DT-Bench-Oxd
Collection Date: 02/25/13 16:00
Matrix: Aqueous
Report Date: 03/07/13
DateReceived: 03/01/13
Prepared by Helena, MT Branch
Analyses Result Units Analysis Date / ByRL Method
MCL/QCLQualifiers
INORGANICS
D 03/04/13 10:00 / cmm4.0mg/L340Acidity, Total as CaCO3 A2310 B
ReportDefinitions:
RL - Analyte reporting limit. MCL - Maximum contaminant level.
QCL - Quality control limit. ND - Not detected at the reporting limit.
D - RL increased due to sample matrix.
Page 3 of 15

LABORATORY ANALYTICAL REPORT
Client: CDM Federal Programs
Project: Danny T Bench Test Barker Hughesville Site
Lab ID: H13030003-003
Client Sample ID 13BH-DT-Bench-Ph45-Naoh
Collection Date: 02/25/13 16:45
Matrix: Aqueous
Report Date: 03/07/13
DateReceived: 03/01/13
Prepared by Helena, MT Branch
Analyses Result Units Analysis Date / ByRL Method
MCL/QCLQualifiers
INORGANICS
D 03/04/13 10:00 / cmm4.0mg/L260Acidity, Total as CaCO3 A2310 B
ReportDefinitions:
RL - Analyte reporting limit. MCL - Maximum contaminant level.
QCL - Quality control limit. ND - Not detected at the reporting limit.
D - RL increased due to sample matrix.
Page 4 of 15

LABORATORY ANALYTICAL REPORT
Client: CDM Federal Programs
Project: Danny T Bench Test Barker Hughesville Site
Lab ID: H13030003-004
Client Sample ID 13BH-DT-Bench-Ph45-Lime
Collection Date: 02/25/13 18:30
Matrix: Aqueous
Report Date: 03/07/13
DateReceived: 03/01/13
Prepared by Helena, MT Branch
Analyses Result Units Analysis Date / ByRL Method
MCL/QCLQualifiers
INORGANICS
D 03/04/13 10:00 / cmm4.0mg/L110Acidity, Total as CaCO3 A2310 B
ReportDefinitions:
RL - Analyte reporting limit. MCL - Maximum contaminant level.
QCL - Quality control limit. ND - Not detected at the reporting limit.
D - RL increased due to sample matrix.
Page 5 of 15

LABORATORY ANALYTICAL REPORT
Client: CDM Federal Programs
Project: Danny T Bench Test Barker Hughesville Site
Lab ID: H13030003-005
Client Sample ID 13BH-DT-Bench-Ph45-Chit
Collection Date: 02/26/13 12:00
Matrix: Aqueous
Report Date: 03/07/13
DateReceived: 03/01/13
Prepared by Helena, MT Branch
Analyses Result Units Analysis Date / ByRL Method
MCL/QCLQualifiers
INORGANICS
D 03/04/13 10:00 / cmm4.0mg/L240Acidity, Total as CaCO3 A2310 B
ReportDefinitions:
RL - Analyte reporting limit. MCL - Maximum contaminant level.
QCL - Quality control limit. ND - Not detected at the reporting limit.
D - RL increased due to sample matrix.
Page 6 of 15

LABORATORY ANALYTICAL REPORT
Client: CDM Federal Programs
Project: Danny T Bench Test Barker Hughesville Site
Lab ID: H13030003-006
Client Sample ID 13BH-DT-Bench-Ph95-Naoh
Collection Date: 02/26/13 16:00
Matrix: Aqueous
Report Date: 03/07/13
DateReceived: 03/01/13
Prepared by Helena, MT Branch
Analyses Result Units Analysis Date / ByRL Method
MCL/QCLQualifiers
INORGANICS
D 03/04/13 10:00 / cmm4.0mg/L8.0Acidity, Total as CaCO3 A2310 B
ReportDefinitions:
RL - Analyte reporting limit. MCL - Maximum contaminant level.
QCL - Quality control limit. ND - Not detected at the reporting limit.
D - RL increased due to sample matrix.
Page 7 of 15

LABORATORY ANALYTICAL REPORT
Client: CDM Federal Programs
Project: Danny T Bench Test Barker Hughesville Site
Lab ID: H13030003-007
Client Sample ID 13BH-DT-Bench-Ph95-Lime
Collection Date: 02/27/13 10:30
Matrix: Aqueous
Report Date: 03/07/13
DateReceived: 03/01/13
Prepared by Helena, MT Branch
Analyses Result Units Analysis Date / ByRL Method
MCL/QCLQualifiers
INORGANICS
D 03/04/13 10:00 / cmm4.0mg/LNDAcidity, Total as CaCO3 A2310 B
ReportDefinitions:
RL - Analyte reporting limit. MCL - Maximum contaminant level.
QCL - Quality control limit. ND - Not detected at the reporting limit.
D - RL increased due to sample matrix.
Page 8 of 15

LABORATORY ANALYTICAL REPORT
Client: CDM Federal Programs
Project: Danny T Bench Test Barker Hughesville Site
Lab ID: H13030003-008
Client Sample ID 13BH-DT-Bench-Sps-C1
Collection Date: 02/27/13 14:05
Matrix: Aqueous
Report Date: 03/07/13
DateReceived: 03/01/13
Prepared by Helena, MT Branch
Analyses Result Units Analysis Date / ByRL Method
MCL/QCLQualifiers
INORGANICS
D 03/04/13 10:00 / cmm4.0mg/LNDAcidity, Total as CaCO3 A2310 B
ReportDefinitions:
RL - Analyte reporting limit. MCL - Maximum contaminant level.
QCL - Quality control limit. ND - Not detected at the reporting limit.
D - RL increased due to sample matrix.
Page 9 of 15

LABORATORY ANALYTICAL REPORT
Client: CDM Federal Programs
Project: Danny T Bench Test Barker Hughesville Site
Lab ID: H13030003-009
Client Sample ID 13BH-DT-Bench-Sps-C2
Collection Date: 02/27/13 14:15
Matrix: Aqueous
Report Date: 03/07/13
DateReceived: 03/01/13
Prepared by Helena, MT Branch
Analyses Result Units Analysis Date / ByRL Method
MCL/QCLQualifiers
INORGANICS
D 03/04/13 10:00 / cmm4.0mg/LNDAcidity, Total as CaCO3 A2310 B
ReportDefinitions:
RL - Analyte reporting limit. MCL - Maximum contaminant level.
QCL - Quality control limit. ND - Not detected at the reporting limit.
D - RL increased due to sample matrix.
Page 10 of 15
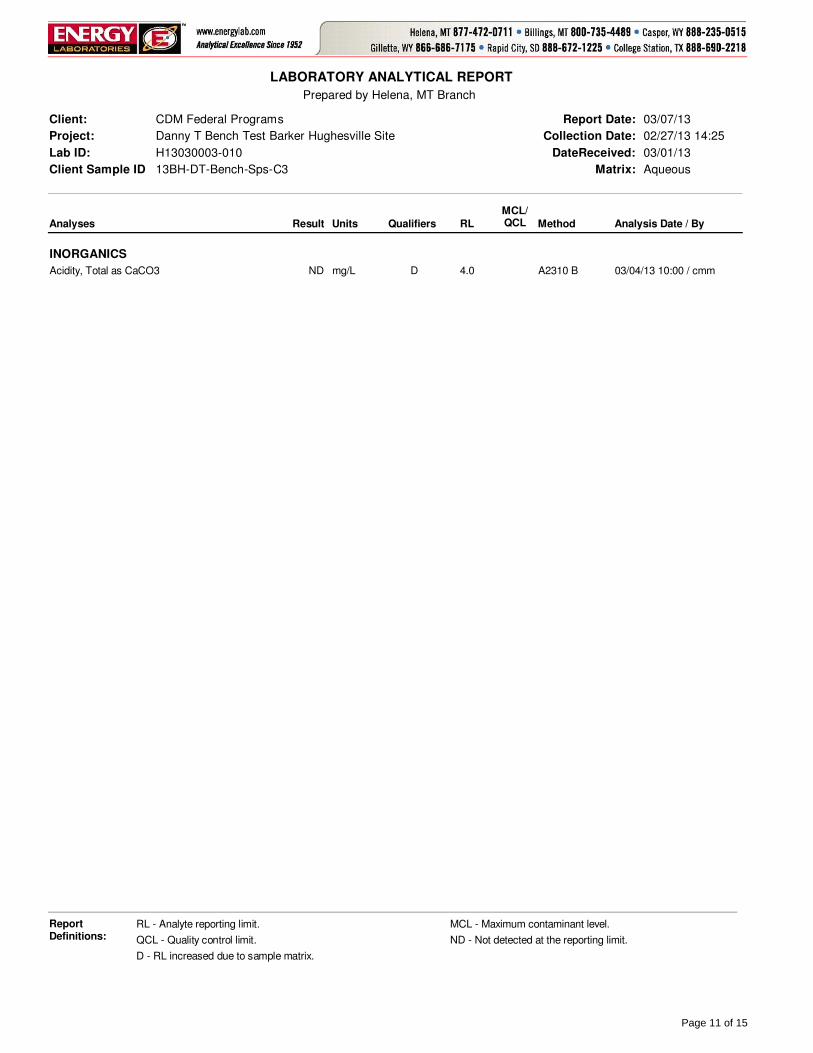
LABORATORY ANALYTICAL REPORT
Client: CDM Federal Programs
Project: Danny T Bench Test Barker Hughesville Site
Lab ID: H13030003-010
Client Sample ID 13BH-DT-Bench-Sps-C3
Collection Date: 02/27/13 14:25
Matrix: Aqueous
Report Date: 03/07/13
DateReceived: 03/01/13
Prepared by Helena, MT Branch
Analyses Result Units Analysis Date / ByRL Method
MCL/QCLQualifiers
INORGANICS
D 03/04/13 10:00 / cmm4.0mg/LNDAcidity, Total as CaCO3 A2310 B
ReportDefinitions:
RL - Analyte reporting limit. MCL - Maximum contaminant level.
QCL - Quality control limit. ND - Not detected at the reporting limit.
D - RL increased due to sample matrix.
Page 11 of 15

LABORATORY ANALYTICAL REPORT
Client: CDM Federal Programs
Project: Danny T Bench Test Barker Hughesville Site
Lab ID: H13030003-011
Client Sample ID 13BH-DT-Bench-Chi-C4
Collection Date: 02/27/13 14:35
Matrix: Aqueous
Report Date: 03/07/13
DateReceived: 03/01/13
Prepared by Helena, MT Branch
Analyses Result Units Analysis Date / ByRL Method
MCL/QCLQualifiers
INORGANICS
D 03/04/13 10:00 / cmm4.0mg/LNDAcidity, Total as CaCO3 A2310 B
ReportDefinitions:
RL - Analyte reporting limit. MCL - Maximum contaminant level.
QCL - Quality control limit. ND - Not detected at the reporting limit.
D - RL increased due to sample matrix.
Page 12 of 15

Project: Danny T Bench Test Barker Hughesville Site
Client: CDM Federal Programs
Work Order: H13030003
QA/QC Summary Report
03/07/13Report Date:
Analyte Result %REC RPDLow Limit High Limit RPDLimitRLUnits QualCount
Prepared by Helena, MT Branch
Method: A2310 B Analytical Run: MISC WC_130304A
Sample ID: CCV 03/04/13 10:00Continuing Calibration Verification Standard
Acidity, Total as CaCO3 101 90 1104.07.0 mg/L
Method: A2310 B Batch: H13030003-001A
Sample ID: H13030003-001ADUP 03/04/13 10:00Sample Duplicate Run: MISC WC_130304A
Acidity, Total as CaCO3 204.0 10420 mg/L
Sample ID: H13030003-011ADUP 03/04/13 10:00Sample Duplicate Run: MISC WC_130304A
Acidity, Total as CaCO3 204.0ND mg/L
Sample ID: LCS1303040000 03/04/13 10:00Laboratory Control Sample Run: MISC WC_130304A
Acidity, Total as CaCO3 99 90 1104.0770 mg/L
Sample ID: MBLK1303040000 03/04/13 10:00Method Blank Run: MISC WC_130304A
Acidity, Total as CaCO3 34 mg/L
Qualifiers:
RL - Analyte reporting limit. ND - Not detected at the reporting limit.
Page 13 of 15

Shipping container/cooler in good condition?
Custody seals intact on shipping container/cooler?
Custody seals intact on sample bottles?
Chain of custody present?
Chain of custody signed when relinquished and received?
Chain of custody agrees with sample labels?
Samples in proper container/bottle?
Sample containers intact?
Sufficient sample volume for indicated test?
All samples received within holding time?(Exclude analyses that are considered field parameterssuch as pH, DO, Res Cl, Sulfite, Ferrous Iron, etc.)
Container/Temp Blank temperature:
Water - VOA vials have zero headspace?
Water - pH acceptable upon receipt?
Yes
Yes
Yes
Yes
Yes
Yes
Yes
Yes
Yes
Yes
Yes
Yes
No
No
No
No
No
No
No
No
No
No
No
No
� �
�
�
�
�
�
�
�
�
�
�
�
�
�
�
�
�
�
�
�
�
�
�
Not Present
Not Present
Not Present
�
�
�
No VOA vials submitted
Not Applicable �
�
2.4°C On Ice
3/1/2013Tracy L. Lorash
FedEx Express
elm
Date Received:
Received by:
Login completed by:
Carrier name:
BL2000\jweidemoyer
3/4/2013
Reviewed by:
Reviewed Date:
Contact and Corrective Action Comments:
None
Temp Blank received? Yes No� � Not Applicable �
Workorder Receipt Checklist
CDM Federal Programs H13030003
Lab measurement of analytes considered field parameters that require analysis within 15 minutes of sampling such as pH, Dissolved Oxygen and Residual Chlorine, are qualified as being analyzed outside of recommended holding time.
Solid/soil samples are reported on a wet weight basis (as received) unless specifically indicated. If moisture corrected, data units are typically noted as –dry. For agricultural and mining soil parameters/characteristics, all samples are dried and ground prior to sample analysis.
Standard Reporting Procedures
Page 14 of 15

Page 15 of 15

ANALYTICAL SUMMARY REPORTANALYTICAL SUMMARY REPORTANALYTICAL SUMMARY REPORTANALYTICAL SUMMARY REPORT
The analyses presented in this report were performed by Energy Laboratories, Inc., 3161 E. Lyndale Ave., Helena, MT 59604, unless otherwise noted. Any exceptions or problems with the analyses are noted in the Laboratory Analytical Report, the QA/QC Summary Report, or the Case Narrative.
The results as reported relate only to the item(s) submitted for testing.
If you have any questions regarding these test results, please call.
Sample ID Client Sample ID Collect Date Receive Date Matrix Test
Report Approved By:
H13040227-001 13H-DT-Bench-BCR-C1 04/15/13 11:35 04/16/13 Aqueous Metals by ICP/ICPMS, DissolvedAcidity, Total as CaCO3AlkalinityBiochemical Oxygen Demand, 5 DayConductivityFluorideAnions by Ion ChromatographyPreparation for TSSSolids, Total SuspendedSulfide, Iodine Titrimetric
H13040227-002 13H-DT-Bench-BCR-C2 04/15/13 11:40 04/16/13 Aqueous Same As Above
H13040227-003 13H-DT-Bench-BCR-C3 04/15/13 11:45 04/16/13 Aqueous Same As Above
H13040227-004 13H-DT-Bench-BCR-C4 04/15/13 11:50 04/16/13 Aqueous Same As Above
CDM Smith Helena
Project Name: Barker-Hughsville
Workorder No.: H13040227
50 W 14th St Ste 200
Helena, MT 59601
April 25, 2013
H823 - Baker-Hughsville Superfund SiteQuote ID:
Energy Laboratories Inc Helena MT received the following 4 samples for CDM Smith Helena on 4/16/2013 for analysis.
Page 1 of 24

Project: Barker-Hughsville
CLIENT: CDM Smith Helena
Sample Delivery Group: H13040227 CASE NARRATIVE
04/25/13Report Date:
Tests associated with analyst identified as ELI-B were subcontracted to Energy Laboratories, 1120 S. 27th St., Billings, MT, EPA Number MT00005.
Page 2 of 24

LABORATORY ANALYTICAL REPORT
Client: CDM Smith Helena
Project: Barker-Hughsville
Lab ID: H13040227-001
Client Sample ID 13H-DT-Bench-BCR-C1
Collection Date: 04/15/13 11:35
Matrix: Aqueous
Report Date: 04/25/13
DateReceived: 04/16/13
Prepared by Helena, MT Branch
Analyses Result Units Analysis Date / ByRL Method
MCL/QCLQualifiers
PHYSICAL PROPERTIES
04/16/13 15:51 / cmm10mg/L1020Solids, Total Suspended TSS @ 105 C A2540 D
INORGANICS
D 04/19/13 09:00 / cmm4.0mg/L1200Acidity, Total as CaCO3 A2310 B
04/16/13 18:51 / cmm1mg/L3100Alkalinity, Total as CaCO3 A2320 B
04/16/13 18:51 / cmm1mg/L3800Bicarbonate as HCO3 A2320 B
04/16/13 18:51 / cmm1mg/LNDCarbonate as CO3 A2320 B
04/16/13 18:51 / cmm1mg/LNDHydroxide as OH A2320 B
D 04/17/13 12:22 / cmm10mg/L410Chloride E300.0
D 04/17/13 12:22 / cmm5mg/L1000Sulfate E300.0
D 04/18/13 10:11 / cmm0.2mg/L0.3Fluoride A4500-F C4
04/17/13 14:20 / eli-b221mg/L13Sulfide A4500-S F
AGGREGATE ORGANICS
04/16/13 15:30 / cmm2000mg/L>1788Oxygen Demand, Biochemical (BOD) A5210 B
Minimum DO for BOD is less than 1.0 mg/L.
METALS, DISSOLVED
04/19/13 15:05 / dck0.03mg/L0.24Aluminum E200.8
04/18/13 14:51 / dck0.001mg/L0.010Arsenic E200.8
04/18/13 14:51 / dck0.05mg/L1.69Barium E200.8
04/18/13 14:51 / dck0.001mg/LNDBeryllium E200.8
04/18/13 14:51 / dck0.001mg/LNDCadmium E200.8
04/17/13 16:43 / sld1mg/L1120Calcium E200.7
04/19/13 15:05 / dck0.005mg/LNDChromium E200.8
04/18/13 14:51 / dck0.005mg/L0.016Cobalt E200.8
04/18/13 14:51 / dck0.005mg/L0.022Copper E200.8
04/17/13 16:43 / sld0.03mg/L13.7Iron E200.7
04/18/13 14:51 / dck0.001mg/L0.003Lead E200.8
04/17/13 16:43 / sld1mg/L157Magnesium E200.7
04/19/13 15:05 / dck0.001mg/L9.90Manganese E200.8
04/18/13 14:51 / dck0.005mg/L0.071Nickel E200.8
04/17/13 16:43 / sld1mg/L1090Potassium E200.7
04/18/13 14:51 / dck0.001mg/LNDSilver E200.8
04/17/13 16:43 / sld1mg/L162Sodium E200.7
04/18/13 14:51 / dck0.0005mg/LNDThallium E200.8
04/18/13 14:51 / dck0.01mg/L0.47Zinc E200.8
ReportDefinitions:
RL - Analyte reporting limit. MCL - Maximum contaminant level.
QCL - Quality control limit. ND - Not detected at the reporting limit.
D - RL increased due to sample matrix.
Page 3 of 24

LABORATORY ANALYTICAL REPORT
Client: CDM Smith Helena
Project: Barker-Hughsville
Lab ID: H13040227-002
Client Sample ID 13H-DT-Bench-BCR-C2
Collection Date: 04/15/13 11:40
Matrix: Aqueous
Report Date: 04/25/13
DateReceived: 04/16/13
Prepared by Helena, MT Branch
Analyses Result Units Analysis Date / ByRL Method
MCL/QCLQualifiers
PHYSICAL PROPERTIES
04/16/13 15:51 / cmm10mg/L550Solids, Total Suspended TSS @ 105 C A2540 D
INORGANICS
D 04/19/13 09:00 / cmm4.0mg/L950Acidity, Total as CaCO3 A2310 B
04/16/13 19:08 / cmm1mg/L2700Alkalinity, Total as CaCO3 A2320 B
04/16/13 19:08 / cmm1mg/L3300Bicarbonate as HCO3 A2320 B
04/16/13 19:08 / cmm1mg/LNDCarbonate as CO3 A2320 B
04/16/13 19:08 / cmm1mg/LNDHydroxide as OH A2320 B
D 04/17/13 12:35 / cmm10mg/L260Chloride E300.0
D 04/17/13 12:35 / cmm5mg/L950Sulfate E300.0
D 04/18/13 10:12 / cmm0.2mg/L0.3Fluoride A4500-F C4
04/17/13 14:20 / eli-b221mg/L3Sulfide A4500-S F
AGGREGATE ORGANICS
04/16/13 15:31 / cmm2000mg/L>1782Oxygen Demand, Biochemical (BOD) A5210 B
Minimum DO for BOD is less than 1.0 mg/L.
METALS, DISSOLVED
04/19/13 15:25 / dck0.03mg/L0.22Aluminum E200.8
04/18/13 14:56 / dck0.001mg/L0.009Arsenic E200.8
04/18/13 14:56 / dck0.05mg/L1.74Barium E200.8
04/18/13 14:56 / dck0.001mg/LNDBeryllium E200.8
04/18/13 14:56 / dck0.001mg/LNDCadmium E200.8
04/17/13 16:47 / sld1mg/L1020Calcium E200.7
04/19/13 15:25 / dck0.005mg/LNDChromium E200.8
04/18/13 14:56 / dck0.005mg/L0.018Cobalt E200.8
04/18/13 14:56 / dck0.005mg/L0.016Copper E200.8
04/17/13 16:47 / sld0.03mg/L12.6Iron E200.7
04/18/13 14:56 / dck0.001mg/L0.002Lead E200.8
04/17/13 16:47 / sld1mg/L158Magnesium E200.7
04/19/13 15:25 / dck0.001mg/L19.2Manganese E200.8
04/18/13 14:56 / dck0.005mg/L0.067Nickel E200.8
04/17/13 16:47 / sld1mg/L981Potassium E200.7
04/18/13 14:56 / dck0.001mg/LNDSilver E200.8
04/17/13 16:47 / sld1mg/L65Sodium E200.7
04/18/13 14:56 / dck0.0005mg/LNDThallium E200.8
04/18/13 14:56 / dck0.01mg/L0.45Zinc E200.8
ReportDefinitions:
RL - Analyte reporting limit. MCL - Maximum contaminant level.
QCL - Quality control limit. ND - Not detected at the reporting limit.
D - RL increased due to sample matrix.
Page 4 of 24
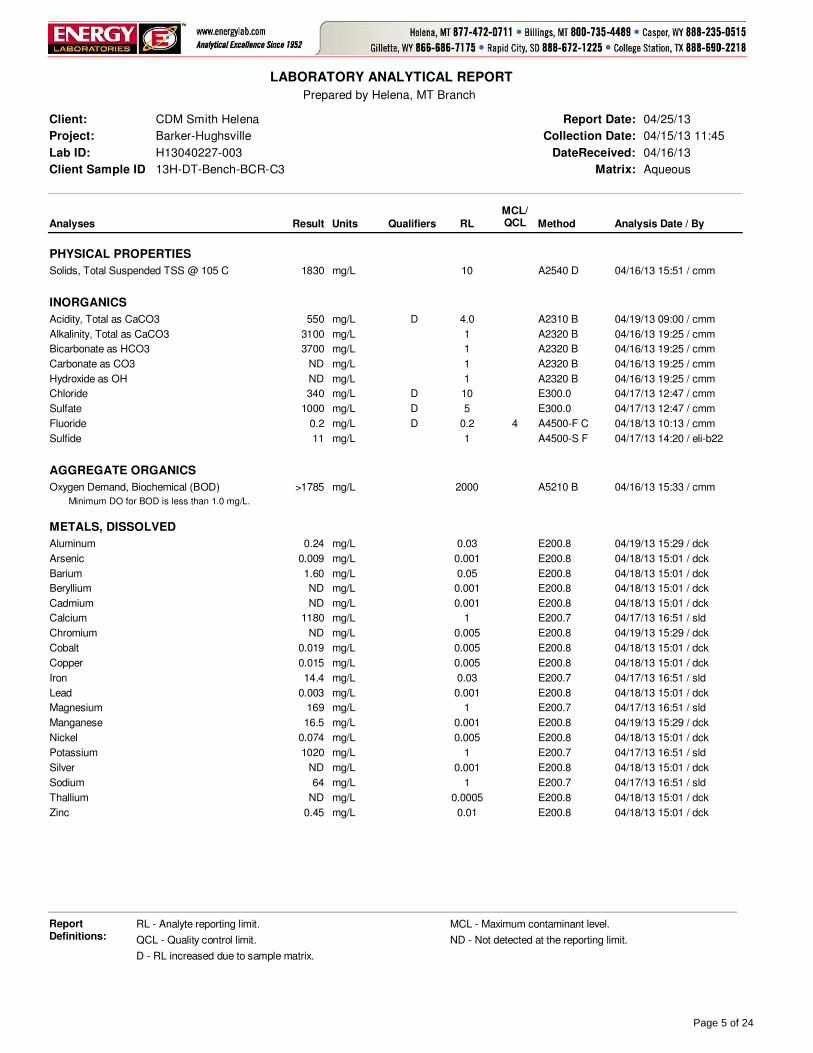
LABORATORY ANALYTICAL REPORT
Client: CDM Smith Helena
Project: Barker-Hughsville
Lab ID: H13040227-003
Client Sample ID 13H-DT-Bench-BCR-C3
Collection Date: 04/15/13 11:45
Matrix: Aqueous
Report Date: 04/25/13
DateReceived: 04/16/13
Prepared by Helena, MT Branch
Analyses Result Units Analysis Date / ByRL Method
MCL/QCLQualifiers
PHYSICAL PROPERTIES
04/16/13 15:51 / cmm10mg/L1830Solids, Total Suspended TSS @ 105 C A2540 D
INORGANICS
D 04/19/13 09:00 / cmm4.0mg/L550Acidity, Total as CaCO3 A2310 B
04/16/13 19:25 / cmm1mg/L3100Alkalinity, Total as CaCO3 A2320 B
04/16/13 19:25 / cmm1mg/L3700Bicarbonate as HCO3 A2320 B
04/16/13 19:25 / cmm1mg/LNDCarbonate as CO3 A2320 B
04/16/13 19:25 / cmm1mg/LNDHydroxide as OH A2320 B
D 04/17/13 12:47 / cmm10mg/L340Chloride E300.0
D 04/17/13 12:47 / cmm5mg/L1000Sulfate E300.0
D 04/18/13 10:13 / cmm0.2mg/L0.2Fluoride A4500-F C4
04/17/13 14:20 / eli-b221mg/L11Sulfide A4500-S F
AGGREGATE ORGANICS
04/16/13 15:33 / cmm2000mg/L>1785Oxygen Demand, Biochemical (BOD) A5210 B
Minimum DO for BOD is less than 1.0 mg/L.
METALS, DISSOLVED
04/19/13 15:29 / dck0.03mg/L0.24Aluminum E200.8
04/18/13 15:01 / dck0.001mg/L0.009Arsenic E200.8
04/18/13 15:01 / dck0.05mg/L1.60Barium E200.8
04/18/13 15:01 / dck0.001mg/LNDBeryllium E200.8
04/18/13 15:01 / dck0.001mg/LNDCadmium E200.8
04/17/13 16:51 / sld1mg/L1180Calcium E200.7
04/19/13 15:29 / dck0.005mg/LNDChromium E200.8
04/18/13 15:01 / dck0.005mg/L0.019Cobalt E200.8
04/18/13 15:01 / dck0.005mg/L0.015Copper E200.8
04/17/13 16:51 / sld0.03mg/L14.4Iron E200.7
04/18/13 15:01 / dck0.001mg/L0.003Lead E200.8
04/17/13 16:51 / sld1mg/L169Magnesium E200.7
04/19/13 15:29 / dck0.001mg/L16.5Manganese E200.8
04/18/13 15:01 / dck0.005mg/L0.074Nickel E200.8
04/17/13 16:51 / sld1mg/L1020Potassium E200.7
04/18/13 15:01 / dck0.001mg/LNDSilver E200.8
04/17/13 16:51 / sld1mg/L64Sodium E200.7
04/18/13 15:01 / dck0.0005mg/LNDThallium E200.8
04/18/13 15:01 / dck0.01mg/L0.45Zinc E200.8
ReportDefinitions:
RL - Analyte reporting limit. MCL - Maximum contaminant level.
QCL - Quality control limit. ND - Not detected at the reporting limit.
D - RL increased due to sample matrix.
Page 5 of 24

LABORATORY ANALYTICAL REPORT
Client: CDM Smith Helena
Project: Barker-Hughsville
Lab ID: H13040227-004
Client Sample ID 13H-DT-Bench-BCR-C4
Collection Date: 04/15/13 11:50
Matrix: Aqueous
Report Date: 04/25/13
DateReceived: 04/16/13
Prepared by Helena, MT Branch
Analyses Result Units Analysis Date / ByRL Method
MCL/QCLQualifiers
PHYSICAL PROPERTIES
04/16/13 15:52 / cmm10mg/L1400Solids, Total Suspended TSS @ 105 C A2540 D
INORGANICS
D 04/19/13 09:00 / cmm4.0mg/L640Acidity, Total as CaCO3 A2310 B
04/16/13 19:41 / cmm1mg/L3500Alkalinity, Total as CaCO3 A2320 B
04/16/13 19:41 / cmm1mg/L4300Bicarbonate as HCO3 A2320 B
04/16/13 19:41 / cmm1mg/LNDCarbonate as CO3 A2320 B
04/16/13 19:41 / cmm1mg/LNDHydroxide as OH A2320 B
D 04/17/13 13:00 / cmm10mg/L450Chloride E300.0
D 04/17/13 13:00 / cmm5mg/L960Sulfate E300.0
04/18/13 10:15 / cmm0.1mg/LNDFluoride A4500-F C4
04/17/13 14:20 / eli-b221mg/L8Sulfide A4500-S F
AGGREGATE ORGANICS
04/16/13 15:34 / cmm2000mg/L>1791Oxygen Demand, Biochemical (BOD) A5210 B
Minimum DO for BOD is less than 1.0 mg/L.
METALS, DISSOLVED
04/19/13 15:34 / dck0.03mg/L0.20Aluminum E200.8
04/18/13 15:05 / dck0.001mg/L0.067Arsenic E200.8
04/18/13 15:05 / dck0.05mg/L1.75Barium E200.8
04/18/13 15:05 / dck0.001mg/LNDBeryllium E200.8
04/18/13 15:05 / dck0.001mg/LNDCadmium E200.8
04/17/13 16:55 / sld1mg/L1100Calcium E200.7
04/19/13 15:34 / dck0.005mg/L0.005Chromium E200.8
04/18/13 15:05 / dck0.005mg/L0.016Cobalt E200.8
04/18/13 15:05 / dck0.005mg/L0.023Copper E200.8
04/17/13 16:55 / sld0.03mg/L13.6Iron E200.7
04/18/13 15:05 / dck0.001mg/L0.003Lead E200.8
04/17/13 16:55 / sld1mg/L205Magnesium E200.7
04/19/13 15:34 / dck0.001mg/L4.94Manganese E200.8
04/18/13 15:05 / dck0.005mg/L0.078Nickel E200.8
04/17/13 16:55 / sld1mg/L977Potassium E200.7
04/18/13 15:05 / dck0.001mg/LNDSilver E200.8
04/17/13 16:55 / sld1mg/L271Sodium E200.7
04/18/13 15:05 / dck0.0005mg/LNDThallium E200.8
04/18/13 15:05 / dck0.01mg/L0.46Zinc E200.8
ReportDefinitions:
RL - Analyte reporting limit. MCL - Maximum contaminant level.
QCL - Quality control limit. ND - Not detected at the reporting limit.
D - RL increased due to sample matrix.
Page 6 of 24

Project: Barker-Hughsville
Client: CDM Smith Helena
Work Order: H13040227
QA/QC Summary Report
04/25/13Report Date:
Analyte Result %REC RPDLow Limit High Limit RPDLimitRLUnits QualCount
Prepared by Helena, MT Branch
Method: A2310 B Batch: H13040227-001B
Sample ID: H13040227-004BDUP 04/19/13 09:00Sample Duplicate Run: MISC WC_130419B
Acidity, Total as CaCO3 204.0 0.8640 mg/L
Sample ID: LCS1304190000 04/19/13 09:00Laboratory Control Sample Run: MISC WC_130419B
Acidity, Total as CaCO3 100 90 1104.0660 mg/L
Sample ID: MBLK1304190000 04/19/13 09:00Method Blank Run: MISC WC_130419B
Acidity, Total as CaCO3 3ND mg/L
Qualifiers:
RL - Analyte reporting limit. ND - Not detected at the reporting limit.
Page 7 of 24

Project: Barker-Hughsville
Client: CDM Smith Helena
Work Order: H13040227
QA/QC Summary Report
04/25/13Report Date:
Analyte Result %REC RPDLow Limit High Limit RPDLimitRLUnits QualCount
Prepared by Helena, MT Branch
Method: A2320 B Batch: R87671
Sample ID: MBLK 04/16/13 17:26Method Blank Run: MAN-TECH_130416A
Alkalinity, Total as CaCO3 2ND mg/L
Sample ID: LCS-03252013 04/16/13 17:33Laboratory Control Sample Run: MAN-TECH_130416A
Alkalinity, Total as CaCO3 104 90 1104.0620 mg/L
Sample ID: H13040142-002ADUP 04/16/13 17:49Sample Duplicate Run: MAN-TECH_130416A3
Alkalinity, Total as CaCO3 104.0 0.7260 mg/L
Bicarbonate as HCO3 104.0 0.0300 mg/L
Carbonate as CO3 104.0 157.0 mg/L R
Sample ID: H13040142-005AMS 04/16/13 18:03Sample Matrix Spike Run: MAN-TECH_130416A
Alkalinity, Total as CaCO3 104 80 1204.0740 mg/L
Qualifiers:
RL - Analyte reporting limit. ND - Not detected at the reporting limit.
R - RPD exceeds advisory limit.
Page 8 of 24
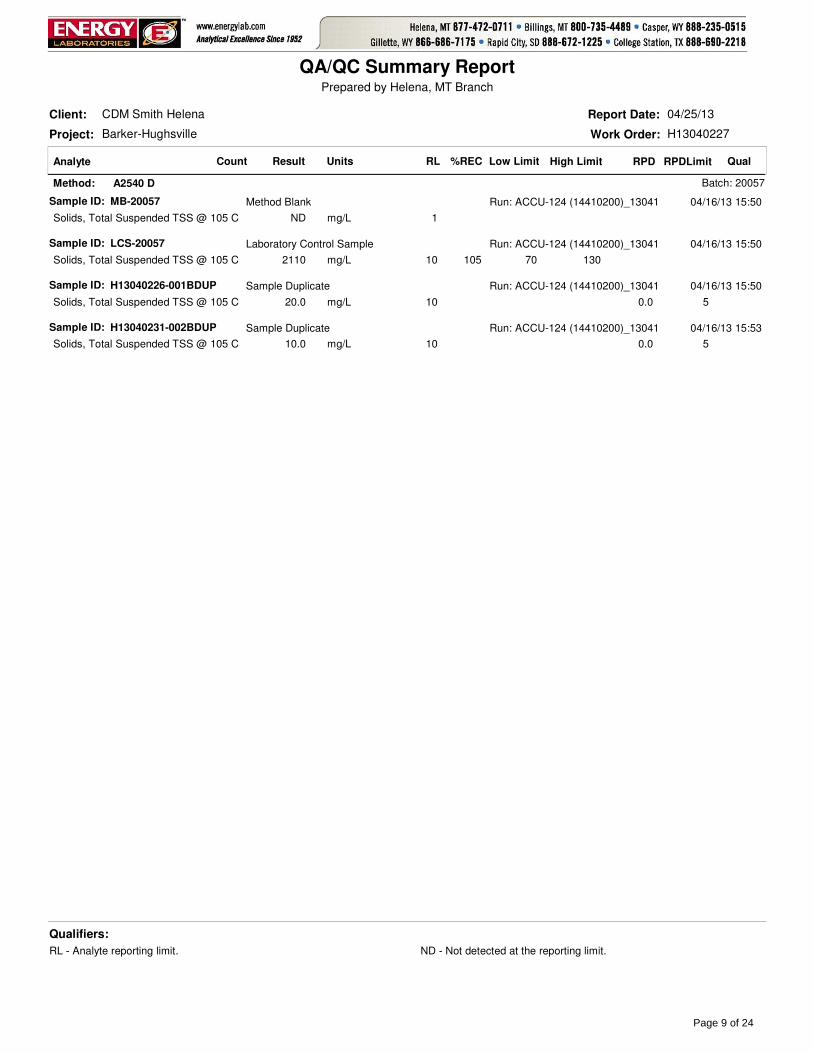
Project: Barker-Hughsville
Client: CDM Smith Helena
Work Order: H13040227
QA/QC Summary Report
04/25/13Report Date:
Analyte Result %REC RPDLow Limit High Limit RPDLimitRLUnits QualCount
Prepared by Helena, MT Branch
Method: A2540 D Batch: 20057
Sample ID: MB-20057 04/16/13 15:50Method Blank Run: ACCU-124 (14410200)_13041
Solids, Total Suspended TSS @ 105 C 1ND mg/L
Sample ID: LCS-20057 04/16/13 15:50Laboratory Control Sample Run: ACCU-124 (14410200)_13041
Solids, Total Suspended TSS @ 105 C 105 70 130102110 mg/L
Sample ID: H13040226-001BDUP 04/16/13 15:50Sample Duplicate Run: ACCU-124 (14410200)_13041
Solids, Total Suspended TSS @ 105 C 510 0.020.0 mg/L
Sample ID: H13040231-002BDUP 04/16/13 15:53Sample Duplicate Run: ACCU-124 (14410200)_13041
Solids, Total Suspended TSS @ 105 C 510 0.010.0 mg/L
Qualifiers:
RL - Analyte reporting limit. ND - Not detected at the reporting limit.
Page 9 of 24

Project: Barker-Hughsville
Client: CDM Smith Helena
Work Order: H13040227
QA/QC Summary Report
04/25/13Report Date:
Analyte Result %REC RPDLow Limit High Limit RPDLimitRLUnits QualCount
Prepared by Helena, MT Branch
Method: A4500-F C Analytical Run: PH_130418A
Sample ID: ICV1_130418A 04/18/13 10:03Initial Calibration Verification Standard
Fluoride 96 90 1100.10.7 mg/L
Method: A4500-F C Batch: 130418A-F-ISE-W
Sample ID: MBLK1_130418A 04/18/13 10:01Method Blank Run: PH_130418A
Fluoride 0.0050.01 mg/L
Sample ID: LFB1_130418A 04/18/13 10:02Laboratory Fortified Blank Run: PH_130418A
Fluoride 93 90 1100.10.5 mg/L
Sample ID: H13040210-012AMS 04/18/13 10:05Sample Matrix Spike Run: PH_130418A
Fluoride 95 85 1150.54.9 mg/L
Sample ID: H13040210-012AMSD 04/18/13 10:07Sample Matrix Spike Duplicate Run: PH_130418A
Fluoride 93 85 115 100.5 1.04.8 mg/L
Qualifiers:
RL - Analyte reporting limit. ND - Not detected at the reporting limit.
Page 10 of 24
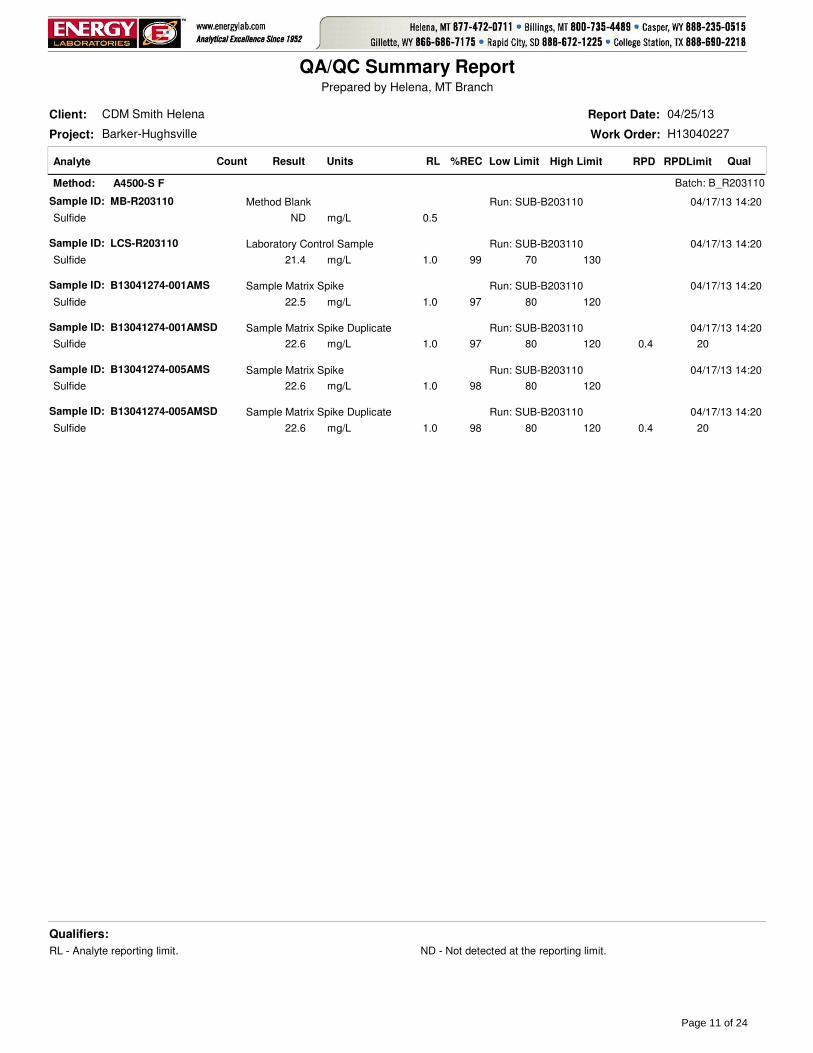
Project: Barker-Hughsville
Client: CDM Smith Helena
Work Order: H13040227
QA/QC Summary Report
04/25/13Report Date:
Analyte Result %REC RPDLow Limit High Limit RPDLimitRLUnits QualCount
Prepared by Helena, MT Branch
Method: A4500-S F Batch: B_R203110
Sample ID: MB-R203110 04/17/13 14:20Method Blank Run: SUB-B203110
Sulfide 0.5ND mg/L
Sample ID: LCS-R203110 04/17/13 14:20Laboratory Control Sample Run: SUB-B203110
Sulfide 99 70 1301.021.4 mg/L
Sample ID: B13041274-001AMS 04/17/13 14:20Sample Matrix Spike Run: SUB-B203110
Sulfide 97 80 1201.022.5 mg/L
Sample ID: B13041274-001AMSD 04/17/13 14:20Sample Matrix Spike Duplicate Run: SUB-B203110
Sulfide 97 80 120 201.0 0.422.6 mg/L
Sample ID: B13041274-005AMS 04/17/13 14:20Sample Matrix Spike Run: SUB-B203110
Sulfide 98 80 1201.022.6 mg/L
Sample ID: B13041274-005AMSD 04/17/13 14:20Sample Matrix Spike Duplicate Run: SUB-B203110
Sulfide 98 80 120 201.0 0.422.6 mg/L
Qualifiers:
RL - Analyte reporting limit. ND - Not detected at the reporting limit.
Page 11 of 24

Project: Barker-Hughsville
Client: CDM Smith Helena
Work Order: H13040227
QA/QC Summary Report
04/25/13Report Date:
Analyte Result %REC RPDLow Limit High Limit RPDLimitRLUnits QualCount
Prepared by Helena, MT Branch
Method: A5210 B Batch: 130416_1_BOD5-W
Sample ID: Dil-H201_130416 04/16/13 15:18Dilution Water Blank Run: MISC WC_130416A
Oxygen Demand, Biochemical (BOD) 0 0.22.0ND mg/L
Sample ID: GGA1_130416 04/16/13 15:24Laboratory Control Sample Run: MISC WC_130416A
Oxygen Demand, Biochemical (BOD) 105 85 11553210 mg/L
Sample ID: H13040229-002ADUP 04/16/13 15:37Sample Duplicate Run: MISC WC_130416A
Oxygen Demand, Biochemical (BOD) 90 110 10160 5.3730 mg/L
Qualifiers:
RL - Analyte reporting limit. ND - Not detected at the reporting limit.
Page 12 of 24

Project: Barker-Hughsville
Client: CDM Smith Helena
Work Order: H13040227
QA/QC Summary Report
04/25/13Report Date:
Analyte Result %REC RPDLow Limit High Limit RPDLimitRLUnits QualCount
Prepared by Helena, MT Branch
Method: E200.7 Analytical Run: ICP2-HE_130416D
Sample ID: ICV 04/17/13 12:05Initial Calibration Verification Standard5
Calcium 101 95 1051.040.5 mg/L
Iron 100 95 1050.0303.99 mg/L
Magnesium 100 95 1051.040.0 mg/L
Potassium 98 95 1051.039.4 mg/L
Sodium 99 95 1051.039.7 mg/L
Sample ID: CCV-1 04/17/13 12:09Continuing Calibration Verification Standard5
Calcium 101 95 1051.025.2 mg/L
Iron 100 95 1050.0302.49 mg/L
Magnesium 100 95 1051.024.9 mg/L
Potassium 95 95 1051.023.8 mg/L
Sodium 95 95 1051.023.8 mg/L
Sample ID: ICSA 04/17/13 12:21Interference Check Sample A5
Calcium 94 80 1201.0470 mg/L
Iron 92 80 1200.030184 mg/L
Magnesium 101 80 1201.0505 mg/L
Potassium 0 01.0-0.0398 mg/L
Sodium 0 01.00.00721 mg/L
Sample ID: ICSAB 04/17/13 12:25Interference Check Sample AB5
Calcium 95 80 1201.0475 mg/L
Iron 94 80 1200.030188 mg/L
Magnesium 103 80 1201.0517 mg/L
Potassium 110 80 1201.021.9 mg/L
Sodium 110 80 1201.022.0 mg/L
Sample ID: CCV 04/17/13 16:28Continuing Calibration Verification Standard5
Calcium 95 90 1101.023.8 mg/L
Iron 94 90 1100.0302.36 mg/L
Magnesium 98 90 1101.024.4 mg/L
Potassium 97 90 1101.024.2 mg/L
Sodium 97 90 1101.024.2 mg/L
Method: E200.7 Batch: R87703
Sample ID: ICB 04/17/13 12:33Method Blank Run: ICP2-HE_130416D5
Calcium 0.020.04 mg/L
Iron 0.003ND mg/L
Magnesium 0.0070.008 mg/L
Potassium 0.02ND mg/L
Sodium 0.02ND mg/L
Sample ID: LFB 04/17/13 12:36Laboratory Fortified Blank Run: ICP2-HE_130416D5
Calcium 99 85 1151.049.6 mg/L
Iron 98 85 1150.0304.90 mg/L
Magnesium 100 85 1151.049.9 mg/L
Qualifiers:
RL - Analyte reporting limit. ND - Not detected at the reporting limit.
Page 13 of 24

Project: Barker-Hughsville
Client: CDM Smith Helena
Work Order: H13040227
QA/QC Summary Report
04/25/13Report Date:
Analyte Result %REC RPDLow Limit High Limit RPDLimitRLUnits QualCount
Prepared by Helena, MT Branch
Method: E200.7 Batch: R87703
Sample ID: LFB 04/17/13 12:36Laboratory Fortified Blank Run: ICP2-HE_130416D5
Potassium 96 85 1151.048.0 mg/L
Sodium 97 85 1151.048.3 mg/L
Sample ID: H13040224-001BMS2 04/17/13 16:06Sample Matrix Spike Run: ICP2-HE_130416D5
Calcium 92 70 1301.067.3 mg/L
Iron 92 70 1300.0304.72 mg/L
Magnesium 95 70 1301.062.3 mg/L
Potassium 94 70 1301.051.2 mg/L
Sodium 70 1301.0665 mg/L A
Sample ID: H13040224-001BMSD 04/17/13 16:09Sample Matrix Spike Duplicate Run: ICP2-HE_130416D5
Calcium 94 70 130 201.0 1.068.0 mg/L
Iron 93 70 130 200.030 1.44.79 mg/L
Magnesium 96 70 130 201.0 0.862.9 mg/L
Potassium 98 70 130 201.0 3.753.1 mg/L
Sodium 70 130 201.0 3.1686 mg/L A
Qualifiers:
RL - Analyte reporting limit. A - The analyte level was greater than four times the spike level. In accordance with the method % recovery is not calculated.
ND - Not detected at the reporting limit.
Page 14 of 24
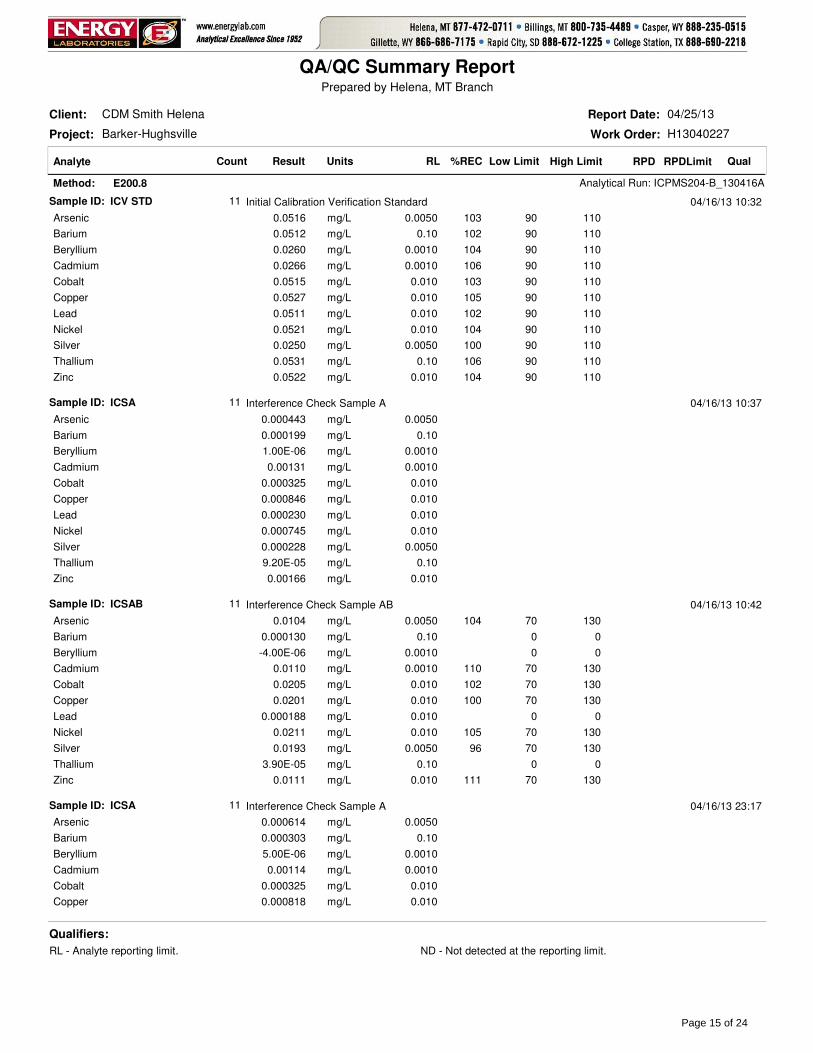
Project: Barker-Hughsville
Client: CDM Smith Helena
Work Order: H13040227
QA/QC Summary Report
04/25/13Report Date:
Analyte Result %REC RPDLow Limit High Limit RPDLimitRLUnits QualCount
Prepared by Helena, MT Branch
Method: E200.8 Analytical Run: ICPMS204-B_130416A
Sample ID: ICV STD 04/16/13 10:32Initial Calibration Verification Standard11
Arsenic 103 90 1100.00500.0516 mg/L
Barium 102 90 1100.100.0512 mg/L
Beryllium 104 90 1100.00100.0260 mg/L
Cadmium 106 90 1100.00100.0266 mg/L
Cobalt 103 90 1100.0100.0515 mg/L
Copper 105 90 1100.0100.0527 mg/L
Lead 102 90 1100.0100.0511 mg/L
Nickel 104 90 1100.0100.0521 mg/L
Silver 100 90 1100.00500.0250 mg/L
Thallium 106 90 1100.100.0531 mg/L
Zinc 104 90 1100.0100.0522 mg/L
Sample ID: ICSA 04/16/13 10:37Interference Check Sample A11
Arsenic 0.00500.000443 mg/L
Barium 0.100.000199 mg/L
Beryllium 0.00101.00E-06 mg/L
Cadmium 0.00100.00131 mg/L
Cobalt 0.0100.000325 mg/L
Copper 0.0100.000846 mg/L
Lead 0.0100.000230 mg/L
Nickel 0.0100.000745 mg/L
Silver 0.00500.000228 mg/L
Thallium 0.109.20E-05 mg/L
Zinc 0.0100.00166 mg/L
Sample ID: ICSAB 04/16/13 10:42Interference Check Sample AB11
Arsenic 104 70 1300.00500.0104 mg/L
Barium 0 00.100.000130 mg/L
Beryllium 0 00.0010-4.00E-06 mg/L
Cadmium 110 70 1300.00100.0110 mg/L
Cobalt 102 70 1300.0100.0205 mg/L
Copper 100 70 1300.0100.0201 mg/L
Lead 0 00.0100.000188 mg/L
Nickel 105 70 1300.0100.0211 mg/L
Silver 96 70 1300.00500.0193 mg/L
Thallium 0 00.103.90E-05 mg/L
Zinc 111 70 1300.0100.0111 mg/L
Sample ID: ICSA 04/16/13 23:17Interference Check Sample A11
Arsenic 0.00500.000614 mg/L
Barium 0.100.000303 mg/L
Beryllium 0.00105.00E-06 mg/L
Cadmium 0.00100.00114 mg/L
Cobalt 0.0100.000325 mg/L
Copper 0.0100.000818 mg/L
Qualifiers:
RL - Analyte reporting limit. ND - Not detected at the reporting limit.
Page 15 of 24

Project: Barker-Hughsville
Client: CDM Smith Helena
Work Order: H13040227
QA/QC Summary Report
04/25/13Report Date:
Analyte Result %REC RPDLow Limit High Limit RPDLimitRLUnits QualCount
Prepared by Helena, MT Branch
Method: E200.8 Analytical Run: ICPMS204-B_130416A
Sample ID: ICSA 04/16/13 23:17Interference Check Sample A11
Lead 0.0100.000227 mg/L
Nickel 0.0100.000771 mg/L
Silver 0.00500.000158 mg/L
Thallium 0.100.000116 mg/L
Zinc 0.0100.00132 mg/L
Sample ID: ICSAB 04/16/13 23:21Interference Check Sample AB11
Arsenic 111 70 1300.00500.0111 mg/L
Barium 0 00.100.000201 mg/L
Beryllium 0 00.0010-1.10E-05 mg/L
Cadmium 109 70 1300.00100.0110 mg/L
Cobalt 107 70 1300.0100.0213 mg/L
Copper 104 70 1300.0100.0208 mg/L
Lead 0 00.0100.000187 mg/L
Nickel 108 70 1300.0100.0215 mg/L
Silver 100 70 1300.00500.0199 mg/L
Thallium 0 00.107.00E-05 mg/L
Zinc 120 70 1300.0100.0120 mg/L
Sample ID: ICSA 04/17/13 14:23Interference Check Sample A11
Arsenic 0.00500.000493 mg/L
Barium 0.100.000253 mg/L
Beryllium 0.0010-1.00E-06 mg/L
Cadmium 0.00100.00104 mg/L
Cobalt 0.0100.000385 mg/L
Copper 0.0100.000865 mg/L
Lead 0.0100.000217 mg/L
Nickel 0.0100.000789 mg/L
Silver 0.00500.000188 mg/L
Thallium 0.100.000144 mg/L
Zinc 0.0100.00148 mg/L
Sample ID: ICSAB 04/17/13 14:28Interference Check Sample AB11
Arsenic 112 70 1300.00500.0112 mg/L
Barium 0 00.100.000180 mg/L
Beryllium 0 00.0010-9.00E-06 mg/L
Cadmium 106 70 1300.00100.0106 mg/L
Cobalt 113 70 1300.0100.0226 mg/L
Copper 105 70 1300.0100.0211 mg/L
Lead 0 00.0100.000188 mg/L
Nickel 110 70 1300.0100.0221 mg/L
Silver 98 70 1300.00500.0196 mg/L
Thallium 0 00.100.000100 mg/L
Zinc 112 70 1300.0100.0112 mg/L
Qualifiers:
RL - Analyte reporting limit. ND - Not detected at the reporting limit.
Page 16 of 24

Project: Barker-Hughsville
Client: CDM Smith Helena
Work Order: H13040227
QA/QC Summary Report
04/25/13Report Date:
Analyte Result %REC RPDLow Limit High Limit RPDLimitRLUnits QualCount
Prepared by Helena, MT Branch
Method: E200.8 Analytical Run: ICPMS204-B_130416A
Sample ID: ICSA 04/18/13 05:39Interference Check Sample A11
Arsenic 0.00500.000382 mg/L
Barium 0.100.000294 mg/L
Beryllium 0.0010-5.00E-06 mg/L
Cadmium 0.00100.000848 mg/L
Cobalt 0.0100.000330 mg/L
Copper 0.0100.000806 mg/L
Lead 0.0100.000203 mg/L
Nickel 0.0100.000746 mg/L
Silver 0.00500.000218 mg/L
Thallium 0.100.000234 mg/L
Zinc 0.0100.00143 mg/L
Sample ID: ICSAB 04/18/13 05:44Interference Check Sample AB11
Arsenic 109 70 1300.00500.0109 mg/L
Barium 0 00.100.000217 mg/L
Beryllium 0 00.0010-4.00E-06 mg/L
Cadmium 104 70 1300.00100.0104 mg/L
Cobalt 110 70 1300.0100.0220 mg/L
Copper 102 70 1300.0100.0204 mg/L
Lead 0 00.0100.000175 mg/L
Nickel 106 70 1300.0100.0212 mg/L
Silver 95 70 1300.00500.0190 mg/L
Thallium 0 00.100.000130 mg/L
Zinc 104 70 1300.0100.0104 mg/L
Sample ID: ICV STD 04/18/13 12:19Initial Calibration Verification Standard11
Arsenic 109 90 1100.00500.0543 mg/L
Barium 107 90 1100.100.0533 mg/L
Beryllium 100 90 1100.00100.0249 mg/L
Cadmium 103 90 1100.00100.0259 mg/L
Cobalt 108 90 1100.0100.0542 mg/L
Copper 108 90 1100.0100.0541 mg/L
Lead 104 90 1100.0100.0522 mg/L
Nickel 108 90 1100.0100.0538 mg/L
Silver 100 90 1100.00500.0249 mg/L
Thallium 109 90 1100.100.0546 mg/L
Zinc 108 90 1100.0100.0542 mg/L
Sample ID: ICSA 04/18/13 12:24Interference Check Sample A11
Arsenic 0.00500.000403 mg/L
Barium 0.100.000319 mg/L
Beryllium 0.0010-5.00E-06 mg/L
Cadmium 0.00100.000839 mg/L
Cobalt 0.0100.000322 mg/L
Copper 0.0100.000768 mg/L
Qualifiers:
RL - Analyte reporting limit. ND - Not detected at the reporting limit.
Page 17 of 24

Project: Barker-Hughsville
Client: CDM Smith Helena
Work Order: H13040227
QA/QC Summary Report
04/25/13Report Date:
Analyte Result %REC RPDLow Limit High Limit RPDLimitRLUnits QualCount
Prepared by Helena, MT Branch
Method: E200.8 Analytical Run: ICPMS204-B_130416A
Sample ID: ICSA 04/18/13 12:24Interference Check Sample A11
Lead 0.0100.000210 mg/L
Nickel 0.0100.000665 mg/L
Silver 0.00500.000230 mg/L
Thallium 0.100.000270 mg/L
Zinc 0.0100.00134 mg/L
Sample ID: ICSAB 04/18/13 12:29Interference Check Sample AB11
Arsenic 113 70 1300.00500.0113 mg/L
Barium 0 00.100.000253 mg/L
Beryllium 0 00.0010-2.00E-06 mg/L
Cadmium 106 70 1300.00100.0106 mg/L
Cobalt 109 70 1300.0100.0218 mg/L
Copper 104 70 1300.0100.0208 mg/L
Lead 0 00.0100.000174 mg/L
Nickel 109 70 1300.0100.0218 mg/L
Silver 94 70 1300.00500.0187 mg/L
Thallium 0 00.100.000185 mg/L
Zinc 112 70 1300.0100.0112 mg/L
Method: E200.8 Batch: R87679
Sample ID: LFB-20022 04/16/13 11:46Laboratory Fortified Blank Run: ICPMS204-B_130416A10
Arsenic 102 85 1151.051.1 mg/kg
Barium 100 85 1151.050.4 mg/kg
Beryllium 100 85 1151.050.2 mg/kg
Cadmium 105 85 1150.1052.6 mg/kg
Cobalt 102 85 1151.051.1 mg/kg
Copper 104 85 1151.053.8 mg/kg
Lead 102 85 1151.051.2 mg/kg
Nickel 105 85 1151.052.7 mg/kg
Thallium 104 85 1151.052.2 mg/kg
Zinc 102 85 1151.053.2 mg/kg
Sample ID: LFB-20023 04/16/13 18:50Laboratory Fortified Blank Run: ICPMS204-B_130416A10
Arsenic 104 85 1151.052.0 mg/kg
Barium 102 85 1151.051.3 mg/kg
Beryllium 102 85 1151.050.9 mg/kg
Cadmium 107 85 1150.1053.3 mg/kg
Cobalt 109 85 1151.054.7 mg/kg
Copper 107 85 1151.054.0 mg/kg
Lead 105 85 1151.052.8 mg/kg
Nickel 108 85 1151.054.1 mg/kg
Thallium 105 85 1151.052.7 mg/kg
Zinc 104 85 1151.053.8 mg/kg
Qualifiers:
RL - Analyte reporting limit. ND - Not detected at the reporting limit.
Page 18 of 24
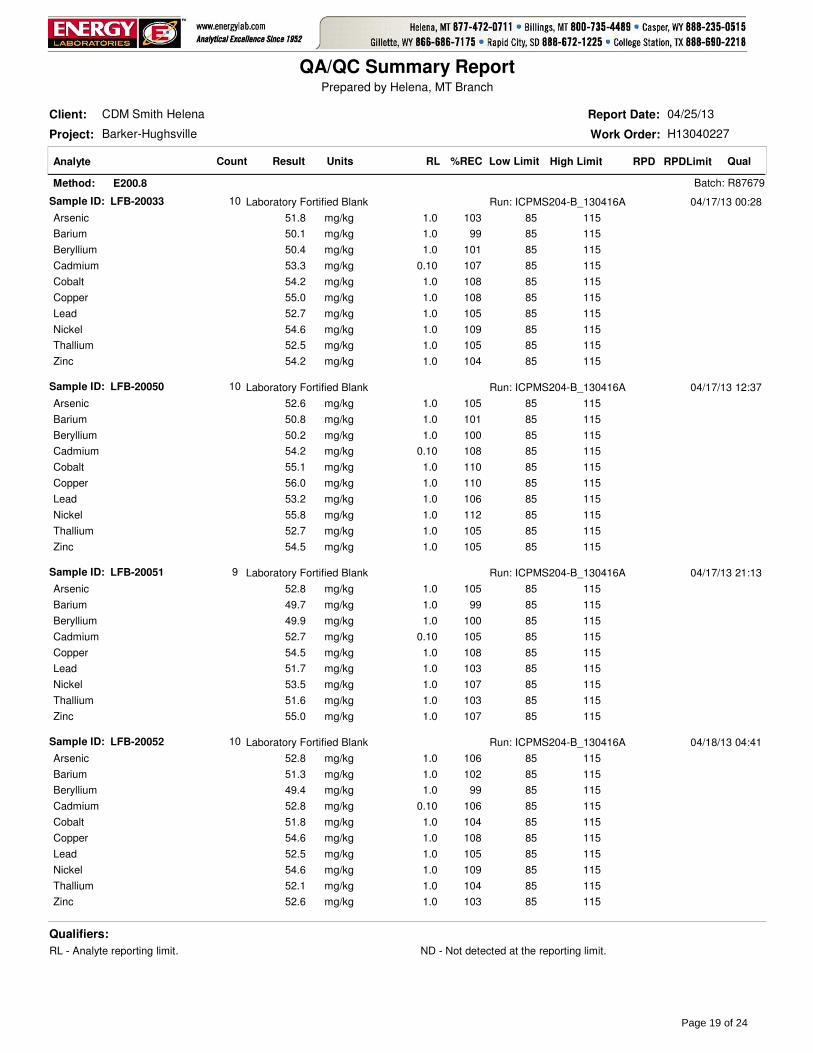
Project: Barker-Hughsville
Client: CDM Smith Helena
Work Order: H13040227
QA/QC Summary Report
04/25/13Report Date:
Analyte Result %REC RPDLow Limit High Limit RPDLimitRLUnits QualCount
Prepared by Helena, MT Branch
Method: E200.8 Batch: R87679
Sample ID: LFB-20033 04/17/13 00:28Laboratory Fortified Blank Run: ICPMS204-B_130416A10
Arsenic 103 85 1151.051.8 mg/kg
Barium 99 85 1151.050.1 mg/kg
Beryllium 101 85 1151.050.4 mg/kg
Cadmium 107 85 1150.1053.3 mg/kg
Cobalt 108 85 1151.054.2 mg/kg
Copper 108 85 1151.055.0 mg/kg
Lead 105 85 1151.052.7 mg/kg
Nickel 109 85 1151.054.6 mg/kg
Thallium 105 85 1151.052.5 mg/kg
Zinc 104 85 1151.054.2 mg/kg
Sample ID: LFB-20050 04/17/13 12:37Laboratory Fortified Blank Run: ICPMS204-B_130416A10
Arsenic 105 85 1151.052.6 mg/kg
Barium 101 85 1151.050.8 mg/kg
Beryllium 100 85 1151.050.2 mg/kg
Cadmium 108 85 1150.1054.2 mg/kg
Cobalt 110 85 1151.055.1 mg/kg
Copper 110 85 1151.056.0 mg/kg
Lead 106 85 1151.053.2 mg/kg
Nickel 112 85 1151.055.8 mg/kg
Thallium 105 85 1151.052.7 mg/kg
Zinc 105 85 1151.054.5 mg/kg
Sample ID: LFB-20051 04/17/13 21:13Laboratory Fortified Blank Run: ICPMS204-B_130416A9
Arsenic 105 85 1151.052.8 mg/kg
Barium 99 85 1151.049.7 mg/kg
Beryllium 100 85 1151.049.9 mg/kg
Cadmium 105 85 1150.1052.7 mg/kg
Copper 108 85 1151.054.5 mg/kg
Lead 103 85 1151.051.7 mg/kg
Nickel 107 85 1151.053.5 mg/kg
Thallium 103 85 1151.051.6 mg/kg
Zinc 107 85 1151.055.0 mg/kg
Sample ID: LFB-20052 04/18/13 04:41Laboratory Fortified Blank Run: ICPMS204-B_130416A10
Arsenic 106 85 1151.052.8 mg/kg
Barium 102 85 1151.051.3 mg/kg
Beryllium 99 85 1151.049.4 mg/kg
Cadmium 106 85 1150.1052.8 mg/kg
Cobalt 104 85 1151.051.8 mg/kg
Copper 108 85 1151.054.6 mg/kg
Lead 105 85 1151.052.5 mg/kg
Nickel 109 85 1151.054.6 mg/kg
Thallium 104 85 1151.052.1 mg/kg
Zinc 103 85 1151.052.6 mg/kg
Qualifiers:
RL - Analyte reporting limit. ND - Not detected at the reporting limit.
Page 19 of 24

Project: Barker-Hughsville
Client: CDM Smith Helena
Work Order: H13040227
QA/QC Summary Report
04/25/13Report Date:
Analyte Result %REC RPDLow Limit High Limit RPDLimitRLUnits QualCount
Prepared by Helena, MT Branch
Method: E200.8 Batch: R87679
Sample ID: LFB-20052 04/18/13 04:41Laboratory Fortified Blank Run: ICPMS204-B_130416A10
Sample ID: ICB 04/18/13 12:55Method Blank Run: ICPMS204-B_130416A11
Arsenic 7E-05ND mg/L
Barium 5E-05ND mg/L
Beryllium 2E-05ND mg/L
Cadmium 7E-06ND mg/L
Cobalt 2E-05ND mg/L
Copper 3E-05ND mg/L
Lead 6E-06ND mg/L
Nickel 6E-05ND mg/L
Silver 4E-05ND mg/L
Thallium 1E-05ND mg/L
Zinc 0.0003ND mg/L
Sample ID: LFB 04/18/13 13:00Laboratory Fortified Blank Run: ICPMS204-B_130416A11
Arsenic 104 85 1150.00500.0520 mg/L
Barium 100 85 1150.100.0501 mg/L
Beryllium 93 85 1150.00100.0463 mg/L
Cadmium 98 85 1150.00100.0490 mg/L
Cobalt 105 85 1150.0100.0525 mg/L
Copper 103 85 1150.0100.0513 mg/L
Lead 100 85 1150.0100.0499 mg/L
Nickel 104 85 1150.0100.0518 mg/L
Silver 99 85 1150.00500.0199 mg/L
Thallium 102 85 1150.100.0512 mg/L
Zinc 105 85 1150.0100.0523 mg/L
Sample ID: H13040220-001AMS 04/18/13 14:04Sample Matrix Spike Run: ICPMS204-B_130416A11
Arsenic 103 70 1300.00100.0904 mg/L
Barium 102 70 1300.0500.0779 mg/L
Beryllium 89 70 1300.00100.0516 mg/L
Cadmium 20 70 1300.00100.104 mg/L S
Cobalt 70 1300.00500.481 mg/L A
Copper 70 1300.00504.12 mg/L A
Lead 103 70 1300.00100.0621 mg/L
Nickel 70 1300.00500.269 mg/L A
Silver 90 70 1300.00100.0182 mg/L
Thallium 104 70 1300.000500.0523 mg/L
Zinc 70 1300.01086.4 mg/L A
Sample ID: H13040220-001AMSD 04/18/13 14:08Sample Matrix Spike Duplicate Run: ICPMS204-B_130416A11
Arsenic 102 70 130 200.0010 1.00.0896 mg/L
Barium 100 70 130 200.050 1.50.0768 mg/L
Beryllium 88 70 130 200.0010 1.40.0508 mg/L
Cadmium 19 70 130 200.0010 0.50.104 mg/L S
Qualifiers:
RL - Analyte reporting limit. A - The analyte level was greater than four times the spike level. In accordance with the method % recovery is not calculated.
ND - Not detected at the reporting limit. S - Spike recovery outside of advisory limits.
Page 20 of 24
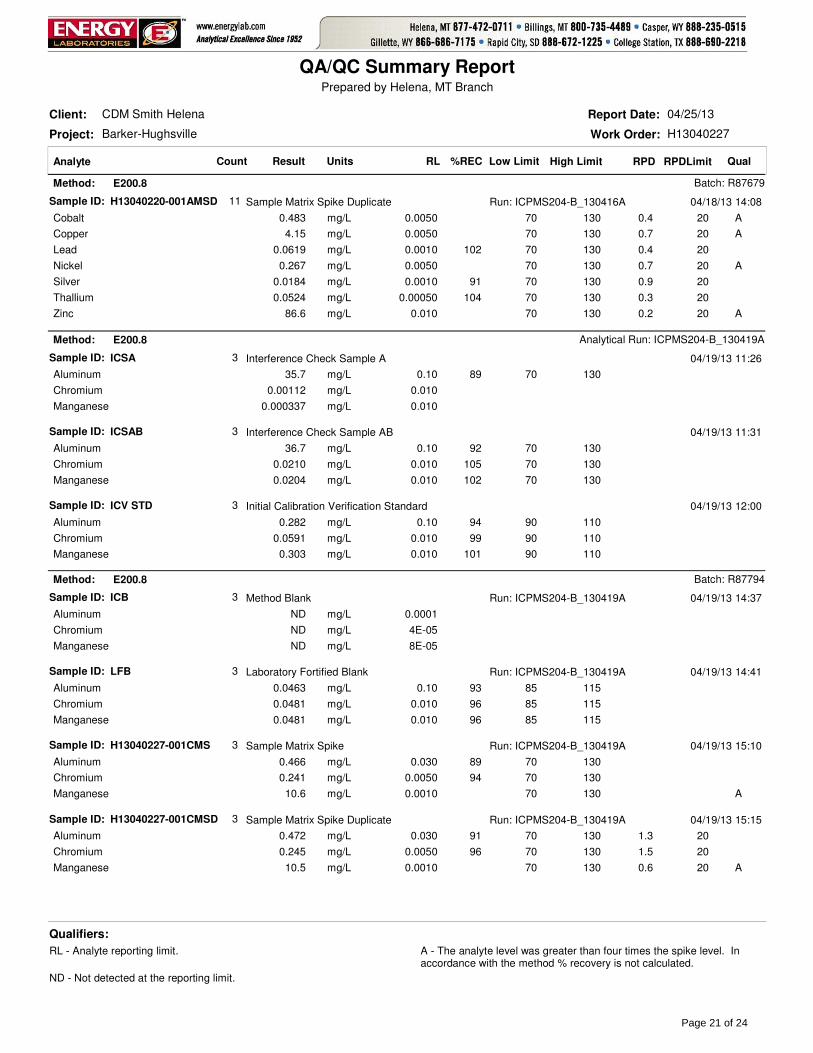
Project: Barker-Hughsville
Client: CDM Smith Helena
Work Order: H13040227
QA/QC Summary Report
04/25/13Report Date:
Analyte Result %REC RPDLow Limit High Limit RPDLimitRLUnits QualCount
Prepared by Helena, MT Branch
Method: E200.8 Batch: R87679
Sample ID: H13040220-001AMSD 04/18/13 14:08Sample Matrix Spike Duplicate Run: ICPMS204-B_130416A11
Cobalt 70 130 200.0050 0.40.483 mg/L A
Copper 70 130 200.0050 0.74.15 mg/L A
Lead 102 70 130 200.0010 0.40.0619 mg/L
Nickel 70 130 200.0050 0.70.267 mg/L A
Silver 91 70 130 200.0010 0.90.0184 mg/L
Thallium 104 70 130 200.00050 0.30.0524 mg/L
Zinc 70 130 200.010 0.286.6 mg/L A
Method: E200.8 Analytical Run: ICPMS204-B_130419A
Sample ID: ICSA 04/19/13 11:26Interference Check Sample A3
Aluminum 89 70 1300.1035.7 mg/L
Chromium 0.0100.00112 mg/L
Manganese 0.0100.000337 mg/L
Sample ID: ICSAB 04/19/13 11:31Interference Check Sample AB3
Aluminum 92 70 1300.1036.7 mg/L
Chromium 105 70 1300.0100.0210 mg/L
Manganese 102 70 1300.0100.0204 mg/L
Sample ID: ICV STD 04/19/13 12:00Initial Calibration Verification Standard3
Aluminum 94 90 1100.100.282 mg/L
Chromium 99 90 1100.0100.0591 mg/L
Manganese 101 90 1100.0100.303 mg/L
Method: E200.8 Batch: R87794
Sample ID: ICB 04/19/13 14:37Method Blank Run: ICPMS204-B_130419A3
Aluminum 0.0001ND mg/L
Chromium 4E-05ND mg/L
Manganese 8E-05ND mg/L
Sample ID: LFB 04/19/13 14:41Laboratory Fortified Blank Run: ICPMS204-B_130419A3
Aluminum 93 85 1150.100.0463 mg/L
Chromium 96 85 1150.0100.0481 mg/L
Manganese 96 85 1150.0100.0481 mg/L
Sample ID: H13040227-001CMS 04/19/13 15:10Sample Matrix Spike Run: ICPMS204-B_130419A3
Aluminum 89 70 1300.0300.466 mg/L
Chromium 94 70 1300.00500.241 mg/L
Manganese 70 1300.001010.6 mg/L A
Sample ID: H13040227-001CMSD 04/19/13 15:15Sample Matrix Spike Duplicate Run: ICPMS204-B_130419A3
Aluminum 91 70 130 200.030 1.30.472 mg/L
Chromium 96 70 130 200.0050 1.50.245 mg/L
Manganese 70 130 200.0010 0.610.5 mg/L A
Qualifiers:
RL - Analyte reporting limit. A - The analyte level was greater than four times the spike level. In accordance with the method % recovery is not calculated.
ND - Not detected at the reporting limit.
Page 21 of 24

Project: Barker-Hughsville
Client: CDM Smith Helena
Work Order: H13040227
QA/QC Summary Report
04/25/13Report Date:
Analyte Result %REC RPDLow Limit High Limit RPDLimitRLUnits QualCount
Prepared by Helena, MT Branch
Method: E300.0 Analytical Run: IC102-H_130417A
Sample ID: ICV041713-12 04/17/13 10:03Initial Calibration Verification Standard2
Chloride 102 90 1101.0100 mg/L
Sulfate 101 90 1101.0400 mg/L
Sample ID: CCV041713-15 04/17/13 10:41Continuing Calibration Verification Standard2
Chloride 102 90 1101.0100 mg/L
Sulfate 102 90 1101.0410 mg/L
Method: E300.0 Batch: R87693
Sample ID: ICB041713-13 04/17/13 10:16Method Blank Run: IC102-H_130417A2
Chloride 0.008ND mg/L
Sulfate 0.08ND mg/L
Sample ID: LFB041713-14 04/17/13 10:29Laboratory Fortified Blank Run: IC102-H_130417A2
Chloride 98 90 1101.049 mg/L
Sulfate 98 90 1101.0200 mg/L
Sample ID: H13040224-003AMS 04/17/13 11:44Sample Matrix Spike Run: IC102-H_130417A2
Chloride 110 90 1101.077 mg/L
Sulfate 111 90 1101.0660 mg/L S
Sample ID: H13040224-003AMSD 04/17/13 11:57Sample Matrix Spike Duplicate Run: IC102-H_130417A2
Chloride 110 90 110 201.0 0.077 mg/L
Sulfate 110 90 110 201.0 0.5660 mg/L
Qualifiers:
RL - Analyte reporting limit. ND - Not detected at the reporting limit.
S - Spike recovery outside of advisory limits.
Page 22 of 24

Shipping container/cooler in good condition?
Custody seals intact on shipping container/cooler?
Custody seals intact on sample bottles?
Chain of custody present?
Chain of custody signed when relinquished and received?
Chain of custody agrees with sample labels?
Samples in proper container/bottle?
Sample containers intact?
Sufficient sample volume for indicated test?
All samples received within holding time?(Exclude analyses that are considered field parameterssuch as pH, DO, Res Cl, Sulfite, Ferrous Iron, etc.)
Container/Temp Blank temperature:
Water - VOA vials have zero headspace?
Water - pH acceptable upon receipt?
Yes
Yes
Yes
Yes
Yes
Yes
Yes
Yes
Yes
Yes
Yes
Yes
No
No
No
No
No
No
No
No
No
No
No
No
� �
�
�
�
�
�
�
�
�
�
�
�
�
�
�
�
�
�
�
�
�
�
�
Not Present
Not Present
Not Present
�
�
�
No VOA vials submitted
Not Applicable �
�
2.7°C On Ice
4/16/2013Tracy L. Lorash
UPS ARS NDA
reh
Date Received:
Received by:
Login completed by:
Carrier name:
BL2000\jweidemoyer
4/19/2013
Reviewed by:
Reviewed Date:
Contact and Corrective Action Comments:
Sample ID on COC has 13H-DT-Bench as part of it - ID on bottles does not. Logged in with ID from COC. All dissolved metals samples received at a pH of 3. No sulfide samples were pH tested due to very strong odor. Tl 4/18/13.
Temp Blank received? Yes No� � Not Applicable �
Workorder Receipt Checklist
CDM Smith Helena H13040227
Lab measurement of analytes considered field parameters that require analysis within 15 minutes of sampling such as pH, Dissolved Oxygen and Residual Chlorine, are qualified as being analyzed outside of recommended holding time.
Solid/soil samples are reported on a wet weight basis (as received) unless specifically indicated. If moisture corrected, data units are typically noted as –dry. For agricultural and mining soil parameters/characteristics, all samples are dried and ground prior to sample analysis.
Standard Reporting Procedures
Page 23 of 24

Page 24 of 24

Appendix B.2 Pilot-Scale Laboratory Data Packages
Barker Hughesville Danny T Treatability Study Technical Memorandum

This page intentionally blank.
Barker Hughesville Danny T Treatability Study Technical Memorandum
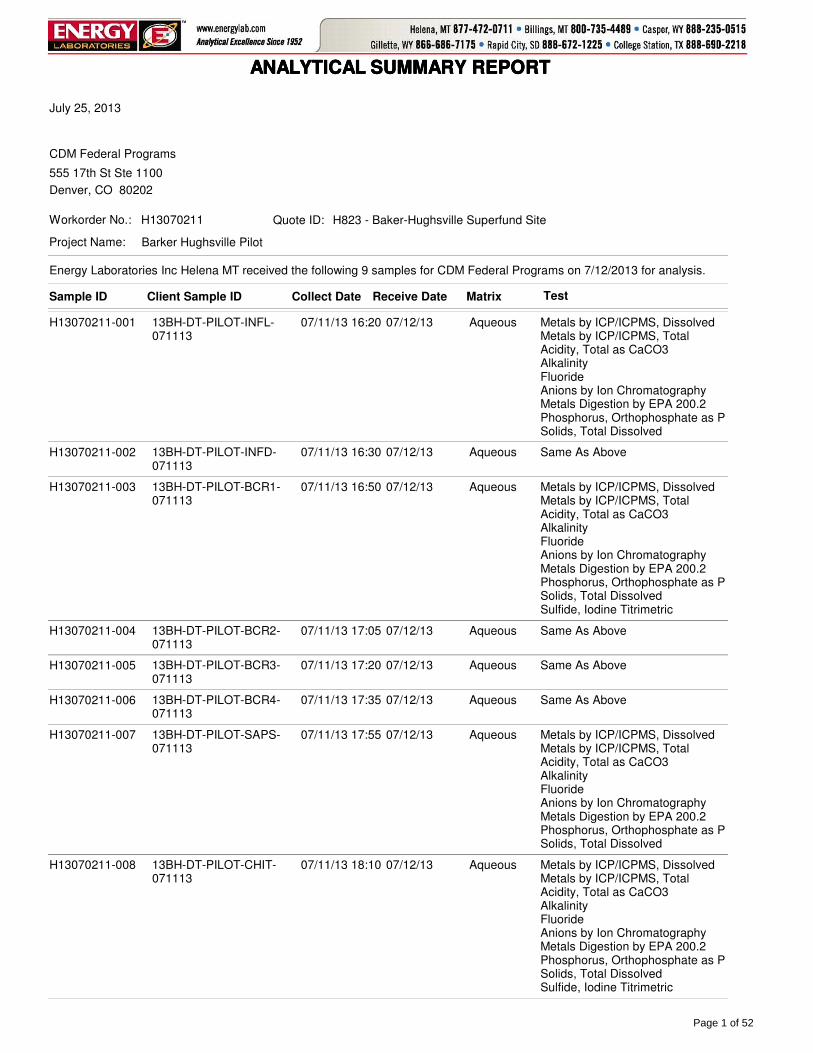
ANALYTICAL SUMMARY REPORTANALYTICAL SUMMARY REPORTANALYTICAL SUMMARY REPORTANALYTICAL SUMMARY REPORT
Sample ID Client Sample ID Collect Date Receive Date Matrix Test
H13070211-001 13BH-DT-PILOT-INFL-071113
07/11/13 16:20 07/12/13 Aqueous Metals by ICP/ICPMS, DissolvedMetals by ICP/ICPMS, TotalAcidity, Total as CaCO3AlkalinityFluorideAnions by Ion ChromatographyMetals Digestion by EPA 200.2Phosphorus, Orthophosphate as PSolids, Total Dissolved
H13070211-002 13BH-DT-PILOT-INFD-071113
07/11/13 16:30 07/12/13 Aqueous Same As Above
H13070211-003 13BH-DT-PILOT-BCR1-071113
07/11/13 16:50 07/12/13 Aqueous Metals by ICP/ICPMS, DissolvedMetals by ICP/ICPMS, TotalAcidity, Total as CaCO3AlkalinityFluorideAnions by Ion ChromatographyMetals Digestion by EPA 200.2Phosphorus, Orthophosphate as PSolids, Total DissolvedSulfide, Iodine Titrimetric
H13070211-004 13BH-DT-PILOT-BCR2-071113
07/11/13 17:05 07/12/13 Aqueous Same As Above
H13070211-005 13BH-DT-PILOT-BCR3-071113
07/11/13 17:20 07/12/13 Aqueous Same As Above
H13070211-006 13BH-DT-PILOT-BCR4-071113
07/11/13 17:35 07/12/13 Aqueous Same As Above
H13070211-007 13BH-DT-PILOT-SAPS-071113
07/11/13 17:55 07/12/13 Aqueous Metals by ICP/ICPMS, DissolvedMetals by ICP/ICPMS, TotalAcidity, Total as CaCO3AlkalinityFluorideAnions by Ion ChromatographyMetals Digestion by EPA 200.2Phosphorus, Orthophosphate as PSolids, Total Dissolved
H13070211-008 13BH-DT-PILOT-CHIT-071113
07/11/13 18:10 07/12/13 Aqueous Metals by ICP/ICPMS, DissolvedMetals by ICP/ICPMS, TotalAcidity, Total as CaCO3AlkalinityFluorideAnions by Ion ChromatographyMetals Digestion by EPA 200.2Phosphorus, Orthophosphate as PSolids, Total DissolvedSulfide, Iodine Titrimetric
CDM Federal Programs
Project Name: Barker Hughsville Pilot
Workorder No.: H13070211
555 17th St Ste 1100
Denver, CO 80202
July 25, 2013
H823 - Baker-Hughsville Superfund SiteQuote ID:
Energy Laboratories Inc Helena MT received the following 9 samples for CDM Federal Programs on 7/12/2013 for analysis.
Page 1 of 52

ANALYTICAL SUMMARY REPORTANALYTICAL SUMMARY REPORTANALYTICAL SUMMARY REPORTANALYTICAL SUMMARY REPORT
The analyses presented in this report were performed by Energy Laboratories, Inc., 3161 E. Lyndale Ave., Helena, MT 59604, unless otherwise noted. Any exceptions or problems with the analyses are noted in the Laboratory Analytical Report, the QA/QC Summary Report, or the Case Narrative.
The results as reported relate only to the item(s) submitted for testing.
If you have any questions regarding these test results, please call.
Report Approved By:
H13070211-009 13BH-DT-PILOT-MGOH-071113
07/11/13 18:30 07/12/13 Aqueous Metals by ICP/ICPMS, DissolvedMetals by ICP/ICPMS, TotalAcidity, Total as CaCO3AlkalinityFluorideAnions by Ion ChromatographyMetals Digestion by EPA 200.2Phosphorus, Orthophosphate as PSolids, Total Dissolved
Page 2 of 52

Project: Barker Hughsville Pilot
CLIENT: CDM Federal Programs
Sample Delivery Group: H13070211 CASE NARRATIVE
07/25/13Report Date:
Tests associated with analyst identified as ELI-B were subcontracted to Energy Laboratories, 1120 S. 27th St., Billings, MT, EPA Number MT00005.
Page 3 of 52
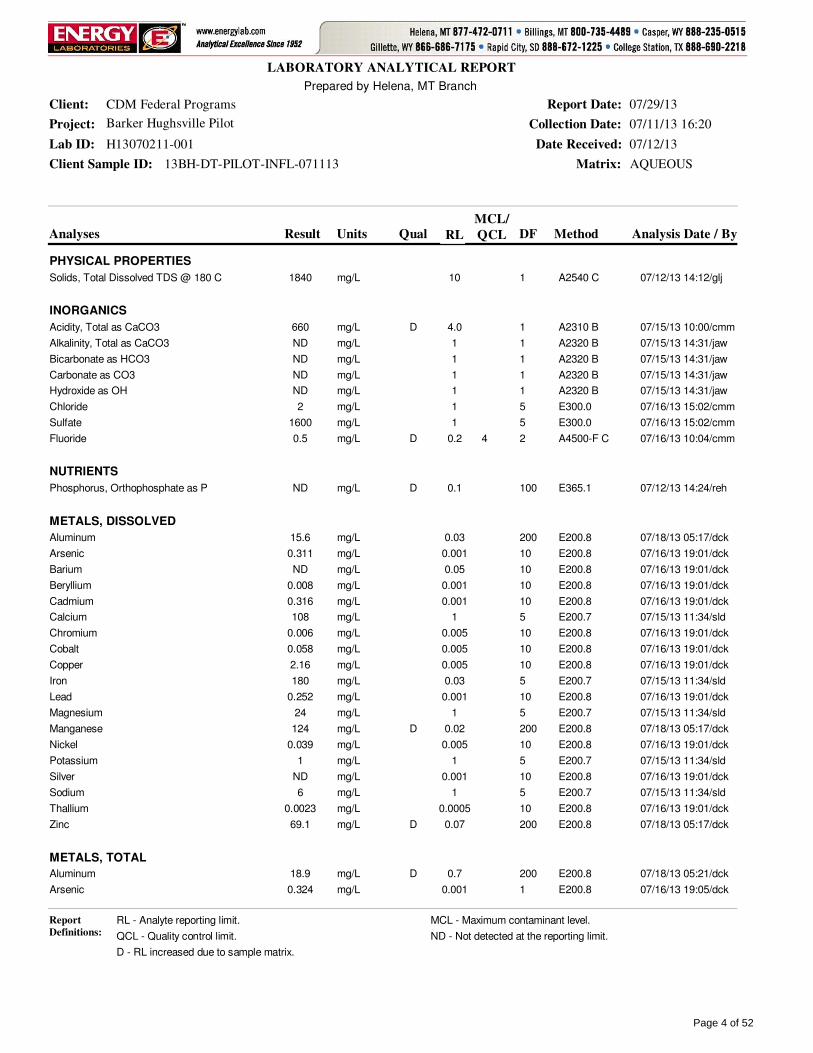
Analyses Result QualUnits Analysis Date / ByRL DF
MCL/
QCL
LABORATORY ANALYTICAL REPORT
Project: Barker Hughsville Pilot
Client Sample ID: 13BH-DT-PILOT-INFL-071113
Collection Date: 07/11/13 16:20
Matrix: AQUEOUS
Client: CDM Federal Programs
Lab ID: H13070211-001
Report Date: 07/29/13
Date Received: 07/12/13
Method
Prepared by Helena, MT Branch
PHYSICAL PROPERTIES
07/12/13 14:12/glj10mg/L1840Solids, Total Dissolved TDS @ 180 C A2540 C1
INORGANICS
D 07/15/13 10:00/cmm4.0mg/L660Acidity, Total as CaCO3 A2310 B1
07/15/13 14:31/jaw1mg/LNDAlkalinity, Total as CaCO3 A2320 B1
07/15/13 14:31/jaw1mg/LNDBicarbonate as HCO3 A2320 B1
07/15/13 14:31/jaw1mg/LNDCarbonate as CO3 A2320 B1
07/15/13 14:31/jaw1mg/LNDHydroxide as OH A2320 B1
07/16/13 15:02/cmm1mg/L2Chloride E300.05
07/16/13 15:02/cmm1mg/L1600Sulfate E300.05
D 07/16/13 10:04/cmm0.2mg/L0.5Fluoride A4500-F C4 2
NUTRIENTS
D 07/12/13 14:24/reh0.1mg/LNDPhosphorus, Orthophosphate as P E365.1100
METALS, DISSOLVED
07/18/13 05:17/dck0.03mg/L15.6Aluminum E200.8200
07/16/13 19:01/dck0.001mg/L0.311Arsenic E200.810
07/16/13 19:01/dck0.05mg/LNDBarium E200.810
07/16/13 19:01/dck0.001mg/L0.008Beryllium E200.810
07/16/13 19:01/dck0.001mg/L0.316Cadmium E200.810
07/15/13 11:34/sld1mg/L108Calcium E200.75
07/16/13 19:01/dck0.005mg/L0.006Chromium E200.810
07/16/13 19:01/dck0.005mg/L0.058Cobalt E200.810
07/16/13 19:01/dck0.005mg/L2.16Copper E200.810
07/15/13 11:34/sld0.03mg/L180Iron E200.75
07/16/13 19:01/dck0.001mg/L0.252Lead E200.810
07/15/13 11:34/sld1mg/L24Magnesium E200.75
D 07/18/13 05:17/dck0.02mg/L124Manganese E200.8200
07/16/13 19:01/dck0.005mg/L0.039Nickel E200.810
07/15/13 11:34/sld1mg/L1Potassium E200.75
07/16/13 19:01/dck0.001mg/LNDSilver E200.810
07/15/13 11:34/sld1mg/L6Sodium E200.75
07/16/13 19:01/dck0.0005mg/L0.0023Thallium E200.810
D 07/18/13 05:17/dck0.07mg/L69.1Zinc E200.8200
METALS, TOTAL
D 07/18/13 05:21/dck0.7mg/L18.9Aluminum E200.8200
07/16/13 19:05/dck0.001mg/L0.324Arsenic E200.81
Report
Definitions: RL - Analyte reporting limit. MCL - Maximum contaminant level.
QCL - Quality control limit. ND - Not detected at the reporting limit.
D - RL increased due to sample matrix.
Page 4 of 52

Analyses Result QualUnits Analysis Date / ByRL DF
MCL/
QCL
LABORATORY ANALYTICAL REPORT
Project: Barker Hughsville Pilot
Client Sample ID: 13BH-DT-PILOT-INFL-071113
Collection Date: 07/11/13 16:20
Matrix: AQUEOUS
Client: CDM Federal Programs
Lab ID: H13070211-001
Report Date: 07/29/13
Date Received: 07/12/13
Method
Prepared by Helena, MT Branch
METALS, TOTAL
07/16/13 19:05/dck0.05mg/LNDBarium E200.81
07/16/13 19:05/dck0.001mg/L0.008Beryllium E200.81
07/16/13 19:05/dck0.001mg/L0.293Cadmium E200.81
07/16/13 12:53/sld1mg/L107Calcium E200.71
07/16/13 19:05/dck0.005mg/L0.006Chromium E200.81
07/16/13 19:05/dck0.005mg/L0.056Cobalt E200.81
07/16/13 19:05/dck0.005mg/L2.04Copper E200.81
07/16/13 12:53/sld0.03mg/L179Iron E200.71
07/16/13 19:05/dck0.001mg/L0.255Lead E200.81
07/16/13 12:53/sld1mg/L24Magnesium E200.71
D 07/18/13 05:21/dck0.1mg/L129Manganese E200.8200
07/16/13 19:05/dck0.005mg/L0.039Nickel E200.81
07/16/13 12:53/sld1mg/LNDPotassium E200.71
07/16/13 19:05/dck0.001mg/LNDSilver E200.81
07/16/13 12:53/sld1mg/L5Sodium E200.71
07/16/13 19:05/dck0.0005mg/L0.0025Thallium E200.81
D 07/18/13 05:21/dck1mg/L71Zinc E200.8200
Report
Definitions: RL - Analyte reporting limit. MCL - Maximum contaminant level.
QCL - Quality control limit. ND - Not detected at the reporting limit.
D - RL increased due to sample matrix.
Page 5 of 52

Analyses Result QualUnits Analysis Date / ByRL DF
MCL/
QCL
LABORATORY ANALYTICAL REPORT
Project: Barker Hughsville Pilot
Client Sample ID: 13BH-DT-PILOT-INFD-071113
Collection Date: 07/11/13 16:30
Matrix: AQUEOUS
Client: CDM Federal Programs
Lab ID: H13070211-002
Report Date: 07/29/13
Date Received: 07/12/13
Method
Prepared by Helena, MT Branch
PHYSICAL PROPERTIES
07/12/13 14:13/glj10mg/L1860Solids, Total Dissolved TDS @ 180 C A2540 C1
INORGANICS
D 07/15/13 10:00/cmm4.0mg/L740Acidity, Total as CaCO3 A2310 B1
07/15/13 14:35/jaw1mg/LNDAlkalinity, Total as CaCO3 A2320 B1
07/15/13 14:35/jaw1mg/LNDBicarbonate as HCO3 A2320 B1
07/15/13 14:35/jaw1mg/LNDCarbonate as CO3 A2320 B1
07/15/13 14:35/jaw1mg/LNDHydroxide as OH A2320 B1
07/15/13 14:58/jaw1mg/L2Chloride E300.05
07/15/13 14:58/jaw1mg/L1700Sulfate E300.05
D 07/16/13 10:05/cmm0.2mg/L0.6Fluoride A4500-F C4 2
NUTRIENTS
D 07/12/13 14:25/reh0.1mg/LNDPhosphorus, Orthophosphate as P E365.1100
METALS, DISSOLVED
07/18/13 05:26/dck0.03mg/L7.87Aluminum E200.8100
07/16/13 19:22/dck0.001mg/L0.313Arsenic E200.810
07/16/13 19:22/dck0.05mg/LNDBarium E200.810
07/16/13 19:22/dck0.001mg/L0.008Beryllium E200.810
07/16/13 19:22/dck0.001mg/L0.315Cadmium E200.810
07/15/13 11:38/sld1mg/L105Calcium E200.75
07/16/13 19:22/dck0.005mg/L0.006Chromium E200.810
07/16/13 19:22/dck0.005mg/L0.057Cobalt E200.810
07/16/13 19:22/dck0.005mg/L2.16Copper E200.810
07/15/13 11:38/sld0.03mg/L177Iron E200.75
07/16/13 19:22/dck0.001mg/L0.255Lead E200.810
07/15/13 11:38/sld1mg/L23Magnesium E200.75
D 07/18/13 05:26/dck0.008mg/L63.7Manganese E200.8100
07/16/13 19:22/dck0.005mg/L0.037Nickel E200.810
07/15/13 11:38/sld1mg/LNDPotassium E200.75
07/16/13 19:22/dck0.001mg/LNDSilver E200.810
07/15/13 11:38/sld1mg/L4Sodium E200.75
07/16/13 19:22/dck0.0005mg/L0.0032Thallium E200.810
D 07/18/13 05:26/dck0.03mg/L34.8Zinc E200.8100
METALS, TOTAL
D 07/18/13 05:31/dck0.4mg/L17.5Aluminum E200.8100
07/16/13 19:27/dck0.001mg/L0.337Arsenic E200.81
Report
Definitions: RL - Analyte reporting limit. MCL - Maximum contaminant level.
QCL - Quality control limit. ND - Not detected at the reporting limit.
D - RL increased due to sample matrix.
Page 6 of 52

Analyses Result QualUnits Analysis Date / ByRL DF
MCL/
QCL
LABORATORY ANALYTICAL REPORT
Project: Barker Hughsville Pilot
Client Sample ID: 13BH-DT-PILOT-INFD-071113
Collection Date: 07/11/13 16:30
Matrix: AQUEOUS
Client: CDM Federal Programs
Lab ID: H13070211-002
Report Date: 07/29/13
Date Received: 07/12/13
Method
Prepared by Helena, MT Branch
METALS, TOTAL
07/16/13 19:27/dck0.05mg/LNDBarium E200.81
07/16/13 19:27/dck0.001mg/L0.008Beryllium E200.81
07/16/13 19:27/dck0.001mg/L0.300Cadmium E200.81
07/16/13 13:15/sld1mg/L106Calcium E200.71
07/16/13 19:27/dck0.005mg/L0.006Chromium E200.81
07/16/13 19:27/dck0.005mg/L0.056Cobalt E200.81
07/16/13 19:27/dck0.005mg/L1.95Copper E200.81
07/16/13 13:15/sld0.03mg/L179Iron E200.71
07/16/13 19:27/dck0.001mg/L0.251Lead E200.81
07/16/13 13:15/sld1mg/L23Magnesium E200.71
D 07/18/13 05:31/dck0.05mg/L131Manganese E200.8100
07/16/13 19:27/dck0.005mg/L0.039Nickel E200.81
07/16/13 13:15/sld1mg/LNDPotassium E200.71
07/16/13 19:27/dck0.001mg/LNDSilver E200.81
07/16/13 13:15/sld1mg/L4Sodium E200.71
07/16/13 19:27/dck0.0005mg/L0.0026Thallium E200.81
D 07/18/13 05:31/dck0.5mg/L71.3Zinc E200.8100
Report
Definitions: RL - Analyte reporting limit. MCL - Maximum contaminant level.
QCL - Quality control limit. ND - Not detected at the reporting limit.
D - RL increased due to sample matrix.
Page 7 of 52

Analyses Result QualUnits Analysis Date / ByRL DF
MCL/
QCL
LABORATORY ANALYTICAL REPORT
Project: Barker Hughsville Pilot
Client Sample ID: 13BH-DT-PILOT-BCR1-071113
Collection Date: 07/11/13 16:50
Matrix: AQUEOUS
Client: CDM Federal Programs
Lab ID: H13070211-003
Report Date: 07/29/13
Date Received: 07/12/13
Method
Prepared by Helena, MT Branch
PHYSICAL PROPERTIES
07/12/13 14:13/glj10mg/L3730Solids, Total Dissolved TDS @ 180 C A2540 C1
INORGANICS
D 07/15/13 10:00/cmm4.0mg/LNDAcidity, Total as CaCO3 A2310 B1
07/15/13 14:45/jaw1mg/L1400Alkalinity, Total as CaCO3 A2320 B1
07/15/13 14:45/jaw1mg/L1700Bicarbonate as HCO3 A2320 B1
07/15/13 14:45/jaw1mg/LNDCarbonate as CO3 A2320 B1
07/15/13 14:45/jaw1mg/LNDHydroxide as OH A2320 B1
D 07/15/13 15:11/jaw2mg/L100Chloride E300.010
07/15/13 15:11/jaw1mg/L240Sulfate E300.010
07/16/13 10:06/cmm0.1mg/L0.3Fluoride A4500-F C4 1
07/16/13 14:30/eli-b221mg/L4Sulfide A4500-S F1
NUTRIENTS
D 07/12/13 14:26/reh0.1mg/L43.8Phosphorus, Orthophosphate as P E365.1100
METALS, DISSOLVED
07/16/13 21:19/dck0.03mg/L0.13Aluminum E200.810
07/16/13 21:19/dck0.001mg/L0.015Arsenic E200.810
07/16/13 21:19/dck0.05mg/L0.55Barium E200.810
07/16/13 21:19/dck0.001mg/LNDBeryllium E200.810
07/16/13 21:19/dck0.001mg/LNDCadmium E200.810
07/15/13 11:41/sld1mg/L428Calcium E200.75
07/16/13 21:19/dck0.005mg/LNDChromium E200.810
07/16/13 21:19/dck0.005mg/LNDCobalt E200.810
07/16/13 21:19/dck0.005mg/L0.006Copper E200.810
07/15/13 11:41/sld0.03mg/L5.10Iron E200.75
07/16/13 21:19/dck0.001mg/LNDLead E200.810
07/15/13 11:41/sld1mg/L162Magnesium E200.75
D 07/15/13 11:41/sld0.003mg/L21.7Manganese E200.75
07/16/13 21:19/dck0.005mg/L0.022Nickel E200.810
07/15/13 11:41/sld1mg/L166Potassium E200.75
07/16/13 21:19/dck0.001mg/LNDSilver E200.810
07/15/13 11:41/sld1mg/L23Sodium E200.75
07/16/13 21:19/dck0.0005mg/LNDThallium E200.810
07/16/13 21:19/dck0.01mg/L0.05Zinc E200.810
METALS, TOTAL
07/16/13 19:31/dck0.03mg/L1.07Aluminum E200.81
Report
Definitions: RL - Analyte reporting limit. MCL - Maximum contaminant level.
QCL - Quality control limit. ND - Not detected at the reporting limit.
D - RL increased due to sample matrix.
Page 8 of 52

Analyses Result QualUnits Analysis Date / ByRL DF
MCL/
QCL
LABORATORY ANALYTICAL REPORT
Project: Barker Hughsville Pilot
Client Sample ID: 13BH-DT-PILOT-BCR1-071113
Collection Date: 07/11/13 16:50
Matrix: AQUEOUS
Client: CDM Federal Programs
Lab ID: H13070211-003
Report Date: 07/29/13
Date Received: 07/12/13
Method
Prepared by Helena, MT Branch
METALS, TOTAL
07/16/13 19:31/dck0.001mg/L0.094Arsenic E200.81
07/16/13 19:31/dck0.05mg/L0.64Barium E200.81
07/16/13 19:31/dck0.001mg/LNDBeryllium E200.81
07/16/13 19:31/dck0.001mg/L0.021Cadmium E200.81
07/16/13 13:19/sld1mg/L437Calcium E200.72
07/16/13 19:31/dck0.005mg/LNDChromium E200.81
07/16/13 19:31/dck0.005mg/L0.014Cobalt E200.81
07/16/13 19:31/dck0.005mg/L0.191Copper E200.81
D 07/16/13 13:19/sld0.05mg/L8.49Iron E200.72
07/16/13 19:31/dck0.001mg/L0.060Lead E200.81
07/16/13 13:19/sld1mg/L163Magnesium E200.72
D 07/16/13 13:19/sld0.006mg/L21.9Manganese E200.72
07/16/13 19:31/dck0.005mg/L0.024Nickel E200.81
07/16/13 13:19/sld1mg/L169Potassium E200.72
07/16/13 19:31/dck0.001mg/LNDSilver E200.81
07/16/13 13:19/sld1mg/L22Sodium E200.72
07/16/13 19:31/dck0.0005mg/LNDThallium E200.81
07/16/13 13:19/sld0.01mg/L3.69Zinc E200.72
Report
Definitions: RL - Analyte reporting limit. MCL - Maximum contaminant level.
QCL - Quality control limit. ND - Not detected at the reporting limit.
D - RL increased due to sample matrix.
Page 9 of 52
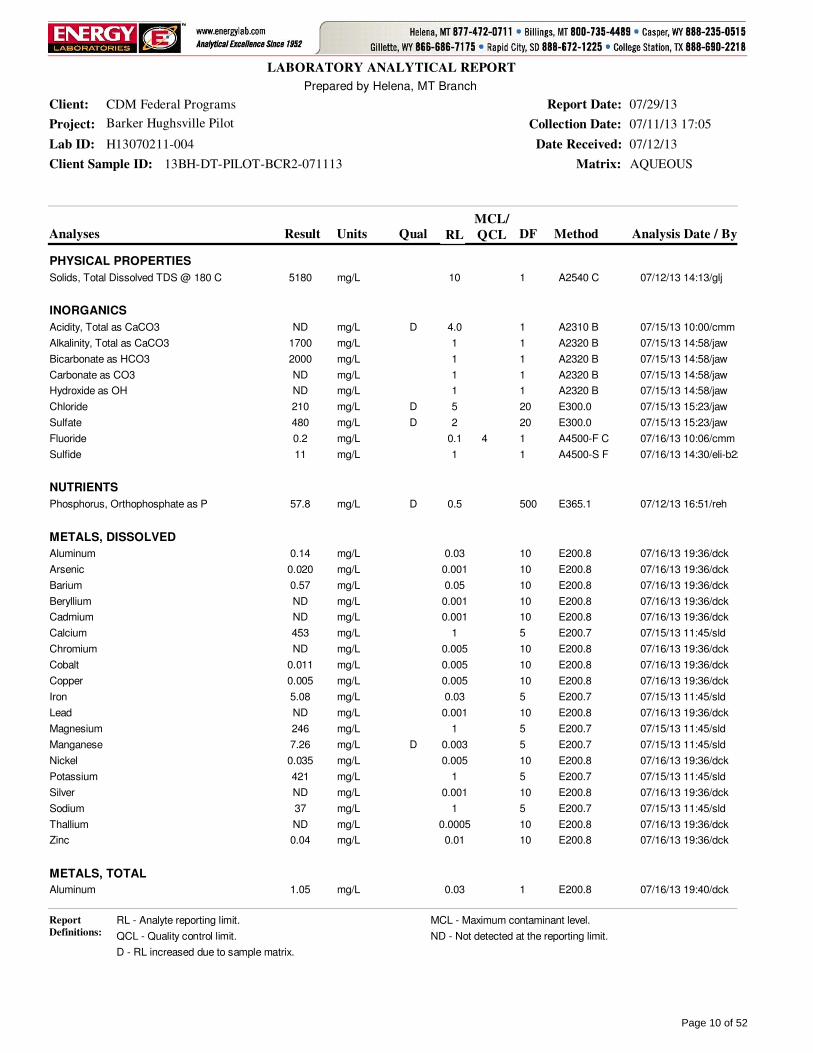
Analyses Result QualUnits Analysis Date / ByRL DF
MCL/
QCL
LABORATORY ANALYTICAL REPORT
Project: Barker Hughsville Pilot
Client Sample ID: 13BH-DT-PILOT-BCR2-071113
Collection Date: 07/11/13 17:05
Matrix: AQUEOUS
Client: CDM Federal Programs
Lab ID: H13070211-004
Report Date: 07/29/13
Date Received: 07/12/13
Method
Prepared by Helena, MT Branch
PHYSICAL PROPERTIES
07/12/13 14:13/glj10mg/L5180Solids, Total Dissolved TDS @ 180 C A2540 C1
INORGANICS
D 07/15/13 10:00/cmm4.0mg/LNDAcidity, Total as CaCO3 A2310 B1
07/15/13 14:58/jaw1mg/L1700Alkalinity, Total as CaCO3 A2320 B1
07/15/13 14:58/jaw1mg/L2000Bicarbonate as HCO3 A2320 B1
07/15/13 14:58/jaw1mg/LNDCarbonate as CO3 A2320 B1
07/15/13 14:58/jaw1mg/LNDHydroxide as OH A2320 B1
D 07/15/13 15:23/jaw5mg/L210Chloride E300.020
D 07/15/13 15:23/jaw2mg/L480Sulfate E300.020
07/16/13 10:06/cmm0.1mg/L0.2Fluoride A4500-F C4 1
07/16/13 14:30/eli-b221mg/L11Sulfide A4500-S F1
NUTRIENTS
D 07/12/13 16:51/reh0.5mg/L57.8Phosphorus, Orthophosphate as P E365.1500
METALS, DISSOLVED
07/16/13 19:36/dck0.03mg/L0.14Aluminum E200.810
07/16/13 19:36/dck0.001mg/L0.020Arsenic E200.810
07/16/13 19:36/dck0.05mg/L0.57Barium E200.810
07/16/13 19:36/dck0.001mg/LNDBeryllium E200.810
07/16/13 19:36/dck0.001mg/LNDCadmium E200.810
07/15/13 11:45/sld1mg/L453Calcium E200.75
07/16/13 19:36/dck0.005mg/LNDChromium E200.810
07/16/13 19:36/dck0.005mg/L0.011Cobalt E200.810
07/16/13 19:36/dck0.005mg/L0.005Copper E200.810
07/15/13 11:45/sld0.03mg/L5.08Iron E200.75
07/16/13 19:36/dck0.001mg/LNDLead E200.810
07/15/13 11:45/sld1mg/L246Magnesium E200.75
D 07/15/13 11:45/sld0.003mg/L7.26Manganese E200.75
07/16/13 19:36/dck0.005mg/L0.035Nickel E200.810
07/15/13 11:45/sld1mg/L421Potassium E200.75
07/16/13 19:36/dck0.001mg/LNDSilver E200.810
07/15/13 11:45/sld1mg/L37Sodium E200.75
07/16/13 19:36/dck0.0005mg/LNDThallium E200.810
07/16/13 19:36/dck0.01mg/L0.04Zinc E200.810
METALS, TOTAL
07/16/13 19:40/dck0.03mg/L1.05Aluminum E200.81
Report
Definitions: RL - Analyte reporting limit. MCL - Maximum contaminant level.
QCL - Quality control limit. ND - Not detected at the reporting limit.
D - RL increased due to sample matrix.
Page 10 of 52

Analyses Result QualUnits Analysis Date / ByRL DF
MCL/
QCL
LABORATORY ANALYTICAL REPORT
Project: Barker Hughsville Pilot
Client Sample ID: 13BH-DT-PILOT-BCR2-071113
Collection Date: 07/11/13 17:05
Matrix: AQUEOUS
Client: CDM Federal Programs
Lab ID: H13070211-004
Report Date: 07/29/13
Date Received: 07/12/13
Method
Prepared by Helena, MT Branch
METALS, TOTAL
07/16/13 19:40/dck0.001mg/L0.064Arsenic E200.81
07/16/13 19:40/dck0.05mg/L0.71Barium E200.81
07/16/13 19:40/dck0.001mg/LNDBeryllium E200.81
07/16/13 19:40/dck0.001mg/L0.009Cadmium E200.81
07/16/13 13:22/sld1mg/L461Calcium E200.72
07/16/13 19:40/dck0.005mg/L0.005Chromium E200.81
07/16/13 19:40/dck0.005mg/L0.016Cobalt E200.81
07/16/13 19:40/dck0.005mg/L0.186Copper E200.81
D 07/16/13 13:22/sld0.05mg/L6.54Iron E200.72
07/16/13 19:40/dck0.001mg/L0.072Lead E200.81
07/16/13 13:22/sld1mg/L243Magnesium E200.72
D 07/16/13 13:22/sld0.006mg/L7.59Manganese E200.72
07/16/13 19:40/dck0.005mg/L0.039Nickel E200.81
07/16/13 13:22/sld1mg/L424Potassium E200.72
07/16/13 19:40/dck0.001mg/LNDSilver E200.81
07/16/13 13:22/sld1mg/L35Sodium E200.72
07/16/13 19:40/dck0.0005mg/LNDThallium E200.81
07/16/13 13:22/sld0.01mg/L1.58Zinc E200.72
Report
Definitions: RL - Analyte reporting limit. MCL - Maximum contaminant level.
QCL - Quality control limit. ND - Not detected at the reporting limit.
D - RL increased due to sample matrix.
Page 11 of 52

Analyses Result QualUnits Analysis Date / ByRL DF
MCL/
QCL
LABORATORY ANALYTICAL REPORT
Project: Barker Hughsville Pilot
Client Sample ID: 13BH-DT-PILOT-BCR3-071113
Collection Date: 07/11/13 17:20
Matrix: AQUEOUS
Client: CDM Federal Programs
Lab ID: H13070211-005
Report Date: 07/29/13
Date Received: 07/12/13
Method
Prepared by Helena, MT Branch
PHYSICAL PROPERTIES
07/12/13 14:13/glj10mg/L7300Solids, Total Dissolved TDS @ 180 C A2540 C1
INORGANICS
D 07/15/13 10:00/cmm4.0mg/LNDAcidity, Total as CaCO3 A2310 B1
07/15/13 15:14/jaw1mg/L2600Alkalinity, Total as CaCO3 A2320 B1
07/15/13 15:14/jaw1mg/L3100Bicarbonate as HCO3 A2320 B1
07/15/13 15:14/jaw1mg/LNDCarbonate as CO3 A2320 B1
07/15/13 15:14/jaw1mg/LNDHydroxide as OH A2320 B1
D 07/16/13 15:53/cmm10mg/L450Chloride E300.050
D 07/16/13 15:53/cmm5mg/L750Sulfate E300.050
07/16/13 10:07/cmm0.1mg/L0.1Fluoride A4500-F C4 1
07/16/13 14:30/eli-b221mg/L11Sulfide A4500-S F1
NUTRIENTS
D 07/12/13 16:52/reh0.5mg/L72.3Phosphorus, Orthophosphate as P E365.1500
METALS, DISSOLVED
07/16/13 19:44/dck0.03mg/L0.17Aluminum E200.810
07/16/13 19:44/dck0.001mg/L0.075Arsenic E200.810
07/16/13 19:44/dck0.05mg/L0.79Barium E200.810
07/16/13 19:44/dck0.001mg/LNDBeryllium E200.810
07/16/13 19:44/dck0.001mg/LNDCadmium E200.810
07/15/13 11:49/sld1mg/L593Calcium E200.75
07/16/13 19:44/dck0.005mg/LNDChromium E200.810
07/16/13 19:44/dck0.005mg/L0.024Cobalt E200.810
07/16/13 19:44/dck0.005mg/L0.008Copper E200.810
07/15/13 11:49/sld0.03mg/L8.71Iron E200.75
07/16/13 19:44/dck0.001mg/L0.001Lead E200.810
07/15/13 11:49/sld1mg/L288Magnesium E200.75
D 07/15/13 11:49/sld0.003mg/L6.36Manganese E200.75
07/16/13 19:44/dck0.005mg/L0.066Nickel E200.810
07/15/13 11:49/sld1mg/L379Potassium E200.75
07/16/13 19:44/dck0.001mg/LNDSilver E200.810
07/15/13 11:49/sld1mg/L350Sodium E200.75
07/16/13 19:44/dck0.0005mg/LNDThallium E200.810
07/16/13 19:44/dck0.01mg/L0.04Zinc E200.810
METALS, TOTAL
07/16/13 20:07/dck0.03mg/L0.79Aluminum E200.81
Report
Definitions: RL - Analyte reporting limit. MCL - Maximum contaminant level.
QCL - Quality control limit. ND - Not detected at the reporting limit.
D - RL increased due to sample matrix.
Page 12 of 52

Analyses Result QualUnits Analysis Date / ByRL DF
MCL/
QCL
LABORATORY ANALYTICAL REPORT
Project: Barker Hughsville Pilot
Client Sample ID: 13BH-DT-PILOT-BCR3-071113
Collection Date: 07/11/13 17:20
Matrix: AQUEOUS
Client: CDM Federal Programs
Lab ID: H13070211-005
Report Date: 07/29/13
Date Received: 07/12/13
Method
Prepared by Helena, MT Branch
METALS, TOTAL
07/16/13 20:07/dck0.001mg/L0.107Arsenic E200.81
07/16/13 20:07/dck0.05mg/L0.85Barium E200.81
07/16/13 20:07/dck0.001mg/LNDBeryllium E200.81
07/16/13 20:07/dck0.001mg/L0.007Cadmium E200.81
07/16/13 13:26/sld1mg/L605Calcium E200.72
07/16/13 20:07/dck0.005mg/LNDChromium E200.81
07/16/13 20:07/dck0.005mg/L0.023Cobalt E200.81
07/16/13 20:07/dck0.005mg/L0.169Copper E200.81
D 07/16/13 13:26/sld0.05mg/L9.66Iron E200.72
07/16/13 20:07/dck0.001mg/L0.074Lead E200.81
07/16/13 13:26/sld1mg/L288Magnesium E200.72
D 07/16/13 13:26/sld0.006mg/L6.51Manganese E200.72
07/16/13 20:07/dck0.005mg/L0.068Nickel E200.81
07/16/13 13:26/sld1mg/L379Potassium E200.72
07/16/13 20:07/dck0.001mg/LNDSilver E200.81
07/16/13 13:26/sld1mg/L346Sodium E200.72
07/16/13 20:07/dck0.0005mg/LNDThallium E200.81
07/16/13 20:07/dck0.01mg/L0.62Zinc E200.81
Report
Definitions: RL - Analyte reporting limit. MCL - Maximum contaminant level.
QCL - Quality control limit. ND - Not detected at the reporting limit.
D - RL increased due to sample matrix.
Page 13 of 52

Analyses Result QualUnits Analysis Date / ByRL DF
MCL/
QCL
LABORATORY ANALYTICAL REPORT
Project: Barker Hughsville Pilot
Client Sample ID: 13BH-DT-PILOT-BCR4-071113
Collection Date: 07/11/13 17:35
Matrix: AQUEOUS
Client: CDM Federal Programs
Lab ID: H13070211-006
Report Date: 07/29/13
Date Received: 07/12/13
Method
Prepared by Helena, MT Branch
PHYSICAL PROPERTIES
07/12/13 14:13/glj10mg/L4590Solids, Total Dissolved TDS @ 180 C A2540 C1
INORGANICS
D 07/15/13 10:00/cmm4.0mg/LNDAcidity, Total as CaCO3 A2310 B1
07/15/13 15:26/jaw1mg/L1500Alkalinity, Total as CaCO3 A2320 B1
07/15/13 15:26/jaw1mg/L1900Bicarbonate as HCO3 A2320 B1
07/15/13 15:26/jaw1mg/LNDCarbonate as CO3 A2320 B1
07/15/13 15:26/jaw1mg/LNDHydroxide as OH A2320 B1
D 07/15/13 15:49/jaw5mg/L140Chloride E300.020
D 07/15/13 15:49/jaw2mg/L280Sulfate E300.020
07/16/13 10:08/cmm0.1mg/L0.2Fluoride A4500-F C4 1
07/16/13 14:30/eli-b221mg/L4Sulfide A4500-S F1
NUTRIENTS
D 07/12/13 16:53/reh0.5mg/L46.8Phosphorus, Orthophosphate as P E365.1500
METALS, DISSOLVED
07/16/13 20:11/dck0.03mg/L0.13Aluminum E200.810
07/16/13 20:11/dck0.001mg/L0.020Arsenic E200.810
07/16/13 20:11/dck0.05mg/L0.55Barium E200.810
07/16/13 20:11/dck0.001mg/LNDBeryllium E200.810
07/16/13 20:11/dck0.001mg/LNDCadmium E200.810
07/15/13 11:52/sld1mg/L409Calcium E200.75
07/16/13 20:11/dck0.005mg/LNDChromium E200.810
07/16/13 20:11/dck0.005mg/L0.006Cobalt E200.810
07/16/13 20:11/dck0.005mg/LNDCopper E200.810
07/15/13 11:52/sld0.03mg/L3.42Iron E200.75
07/16/13 20:11/dck0.001mg/LNDLead E200.810
07/15/13 11:52/sld1mg/L241Magnesium E200.75
D 07/15/13 11:52/sld0.003mg/L11.0Manganese E200.75
07/16/13 20:11/dck0.005mg/L0.029Nickel E200.810
07/15/13 11:52/sld1mg/L227Potassium E200.75
07/16/13 20:11/dck0.001mg/LNDSilver E200.810
07/15/13 11:52/sld1mg/L31Sodium E200.75
07/16/13 20:11/dck0.0005mg/LNDThallium E200.810
07/16/13 20:11/dck0.01mg/L0.04Zinc E200.810
METALS, TOTAL
07/16/13 20:16/dck0.03mg/L1.07Aluminum E200.81
Report
Definitions: RL - Analyte reporting limit. MCL - Maximum contaminant level.
QCL - Quality control limit. ND - Not detected at the reporting limit.
D - RL increased due to sample matrix.
Page 14 of 52

Analyses Result QualUnits Analysis Date / ByRL DF
MCL/
QCL
LABORATORY ANALYTICAL REPORT
Project: Barker Hughsville Pilot
Client Sample ID: 13BH-DT-PILOT-BCR4-071113
Collection Date: 07/11/13 17:35
Matrix: AQUEOUS
Client: CDM Federal Programs
Lab ID: H13070211-006
Report Date: 07/29/13
Date Received: 07/12/13
Method
Prepared by Helena, MT Branch
METALS, TOTAL
07/16/13 20:16/dck0.001mg/L0.118Arsenic E200.81
07/16/13 20:16/dck0.05mg/L0.65Barium E200.81
07/16/13 20:16/dck0.001mg/LNDBeryllium E200.81
07/16/13 20:16/dck0.001mg/L0.027Cadmium E200.81
07/16/13 13:30/sld1mg/L425Calcium E200.72
07/16/13 20:16/dck0.005mg/LNDChromium E200.81
07/16/13 20:16/dck0.005mg/L0.013Cobalt E200.81
07/16/13 20:16/dck0.005mg/L0.172Copper E200.81
07/16/13 20:16/dck0.03mg/L6.09Iron E200.81
07/16/13 20:16/dck0.001mg/L0.084Lead E200.81
07/16/13 13:30/sld1mg/L243Magnesium E200.72
D 07/16/13 13:30/sld0.006mg/L11.6Manganese E200.72
07/16/13 20:16/dck0.005mg/L0.032Nickel E200.81
07/16/13 13:30/sld1mg/L231Potassium E200.72
07/16/13 20:16/dck0.001mg/LNDSilver E200.81
07/16/13 13:30/sld1mg/L29Sodium E200.72
07/16/13 20:16/dck0.0005mg/LNDThallium E200.81
07/16/13 13:30/sld0.01mg/L3.27Zinc E200.72
Report
Definitions: RL - Analyte reporting limit. MCL - Maximum contaminant level.
QCL - Quality control limit. ND - Not detected at the reporting limit.
D - RL increased due to sample matrix.
Page 15 of 52

Analyses Result QualUnits Analysis Date / ByRL DF
MCL/
QCL
LABORATORY ANALYTICAL REPORT
Project: Barker Hughsville Pilot
Client Sample ID: 13BH-DT-PILOT-SAPS-071113
Collection Date: 07/11/13 17:55
Matrix: AQUEOUS
Client: CDM Federal Programs
Lab ID: H13070211-007
Report Date: 07/29/13
Date Received: 07/12/13
Method
Prepared by Helena, MT Branch
PHYSICAL PROPERTIES
07/12/13 14:13/glj10mg/L2140Solids, Total Dissolved TDS @ 180 C A2540 C1
INORGANICS
D 07/15/13 10:00/cmm4.0mg/LNDAcidity, Total as CaCO3 A2310 B1
07/15/13 15:34/jaw1mg/L750Alkalinity, Total as CaCO3 A2320 B1
07/15/13 15:34/jaw1mg/L910Bicarbonate as HCO3 A2320 B1
07/15/13 15:34/jaw1mg/LNDCarbonate as CO3 A2320 B1
07/15/13 15:34/jaw1mg/LNDHydroxide as OH A2320 B1
07/15/13 16:01/jaw1mg/L27Chloride E300.05
07/15/13 16:01/jaw1mg/L600Sulfate E300.05
07/16/13 10:10/cmm0.1mg/L0.8Fluoride A4500-F C4 1
NUTRIENTS
D 07/12/13 14:30/reh0.1mg/L10.4Phosphorus, Orthophosphate as P E365.1100
METALS, DISSOLVED
07/16/13 20:20/dck0.03mg/L0.04Aluminum E200.810
07/16/13 20:20/dck0.001mg/L0.006Arsenic E200.810
07/16/13 20:20/dck0.05mg/L0.30Barium E200.810
07/16/13 20:20/dck0.001mg/LNDBeryllium E200.810
07/16/13 20:20/dck0.001mg/LNDCadmium E200.810
07/15/13 11:56/sld1mg/L371Calcium E200.75
07/16/13 20:20/dck0.005mg/LNDChromium E200.810
07/16/13 20:20/dck0.005mg/LNDCobalt E200.810
07/16/13 20:20/dck0.005mg/LNDCopper E200.810
07/15/13 11:56/sld0.03mg/L2.63Iron E200.75
07/16/13 20:20/dck0.001mg/LNDLead E200.810
07/15/13 11:56/sld1mg/L81Magnesium E200.75
D 07/15/13 11:56/sld0.003mg/L42.4Manganese E200.75
07/16/13 20:20/dck0.005mg/L0.005Nickel E200.810
07/15/13 11:56/sld1mg/L38Potassium E200.75
07/16/13 20:20/dck0.001mg/LNDSilver E200.810
07/15/13 11:56/sld1mg/L13Sodium E200.75
07/16/13 20:20/dck0.0005mg/LNDThallium E200.810
07/16/13 20:20/dck0.01mg/L0.07Zinc E200.810
METALS, TOTAL
07/16/13 20:25/dck0.03mg/L0.22Aluminum E200.81
07/16/13 20:25/dck0.001mg/L0.056Arsenic E200.81
Report
Definitions: RL - Analyte reporting limit. MCL - Maximum contaminant level.
QCL - Quality control limit. ND - Not detected at the reporting limit.
D - RL increased due to sample matrix.
Page 16 of 52

Analyses Result QualUnits Analysis Date / ByRL DF
MCL/
QCL
LABORATORY ANALYTICAL REPORT
Project: Barker Hughsville Pilot
Client Sample ID: 13BH-DT-PILOT-SAPS-071113
Collection Date: 07/11/13 17:55
Matrix: AQUEOUS
Client: CDM Federal Programs
Lab ID: H13070211-007
Report Date: 07/29/13
Date Received: 07/12/13
Method
Prepared by Helena, MT Branch
METALS, TOTAL
07/16/13 20:25/dck0.05mg/L0.32Barium E200.81
07/16/13 20:25/dck0.001mg/LNDBeryllium E200.81
07/16/13 20:25/dck0.001mg/L0.019Cadmium E200.81
07/16/13 13:33/sld1mg/L375Calcium E200.71
07/16/13 20:25/dck0.005mg/LNDChromium E200.81
07/16/13 20:25/dck0.005mg/L0.008Cobalt E200.81
07/16/13 20:25/dck0.005mg/L0.088Copper E200.81
07/16/13 13:33/sld0.03mg/L4.86Iron E200.71
07/16/13 20:25/dck0.001mg/L0.014Lead E200.81
07/16/13 13:33/sld1mg/L81Magnesium E200.71
D 07/16/13 13:33/sld0.003mg/L42.6Manganese E200.71
07/16/13 20:25/dck0.005mg/L0.010Nickel E200.81
07/16/13 13:33/sld1mg/L38Potassium E200.71
07/16/13 20:25/dck0.001mg/LNDSilver E200.81
07/16/13 13:33/sld1mg/L11Sodium E200.71
07/16/13 20:25/dck0.0005mg/LNDThallium E200.81
07/16/13 13:33/sld0.01mg/L6.05Zinc E200.71
Report
Definitions: RL - Analyte reporting limit. MCL - Maximum contaminant level.
QCL - Quality control limit. ND - Not detected at the reporting limit.
D - RL increased due to sample matrix.
Page 17 of 52

Analyses Result QualUnits Analysis Date / ByRL DF
MCL/
QCL
LABORATORY ANALYTICAL REPORT
Project: Barker Hughsville Pilot
Client Sample ID: 13BH-DT-PILOT-CHIT-071113
Collection Date: 07/11/13 18:10
Matrix: AQUEOUS
Client: CDM Federal Programs
Lab ID: H13070211-008
Report Date: 07/29/13
Date Received: 07/12/13
Method
Prepared by Helena, MT Branch
PHYSICAL PROPERTIES
07/12/13 14:14/glj10mg/L51300Solids, Total Dissolved TDS @ 180 C A2540 C1
INORGANICS
D 07/15/13 10:00/cmm4.0mg/LNDAcidity, Total as CaCO3 A2310 B1
07/17/13 14:45/cmm1mg/L23000Alkalinity, Total as CaCO3 A2320 B1
07/17/13 14:45/cmm1mg/L28000Bicarbonate as HCO3 A2320 B1
07/17/13 14:45/cmm1mg/LNDCarbonate as CO3 A2320 B1
07/17/13 14:45/cmm1mg/LNDHydroxide as OH A2320 B1
D 07/16/13 16:05/cmm50mg/L12000Chloride E300.0200
D 07/16/13 16:05/cmm20mg/L2300Sulfate E300.0200
07/16/13 10:11/cmm0.1mg/LNDFluoride A4500-F C4 1
07/16/13 14:30/eli-b221mg/L29Sulfide A4500-S F1
NUTRIENTS
D 07/12/13 16:54/reh0.5mg/L47.7Phosphorus, Orthophosphate as P E365.1500
METALS, DISSOLVED
07/16/13 20:29/dck0.03mg/L0.30Aluminum E200.810
07/16/13 20:29/dck0.001mg/L4.18Arsenic E200.810
07/16/13 20:29/dck0.05mg/L0.28Barium E200.810
07/16/13 20:29/dck0.001mg/LNDBeryllium E200.810
07/16/13 20:29/dck0.001mg/L0.044Cadmium E200.810
07/15/13 12:00/sld1mg/L3010Calcium E200.725
07/16/13 20:29/dck0.005mg/L0.023Chromium E200.810
07/16/13 20:29/dck0.005mg/L0.183Cobalt E200.810
07/16/13 20:29/dck0.005mg/L0.430Copper E200.810
D 07/15/13 12:00/sld0.1mg/L26.5Iron E200.725
07/16/13 20:29/dck0.001mg/L0.007Lead E200.810
07/15/13 12:00/sld1mg/L1270Magnesium E200.725
07/16/13 20:29/dck0.001mg/L3.11Manganese E200.810
07/16/13 20:29/dck0.005mg/L1.06Nickel E200.810
07/15/13 12:00/sld1mg/L1490Potassium E200.725
D 07/18/13 05:35/dck0.002mg/LNDSilver E200.850
07/15/13 12:00/sld1mg/L6850Sodium E200.725
07/16/13 20:29/dck0.0005mg/LNDThallium E200.810
07/16/13 20:29/dck0.01mg/L1.04Zinc E200.810
METALS, TOTAL
07/16/13 20:47/dck0.03mg/L0.71Aluminum E200.81
Report
Definitions: RL - Analyte reporting limit. MCL - Maximum contaminant level.
QCL - Quality control limit. ND - Not detected at the reporting limit.
D - RL increased due to sample matrix.
Page 18 of 52
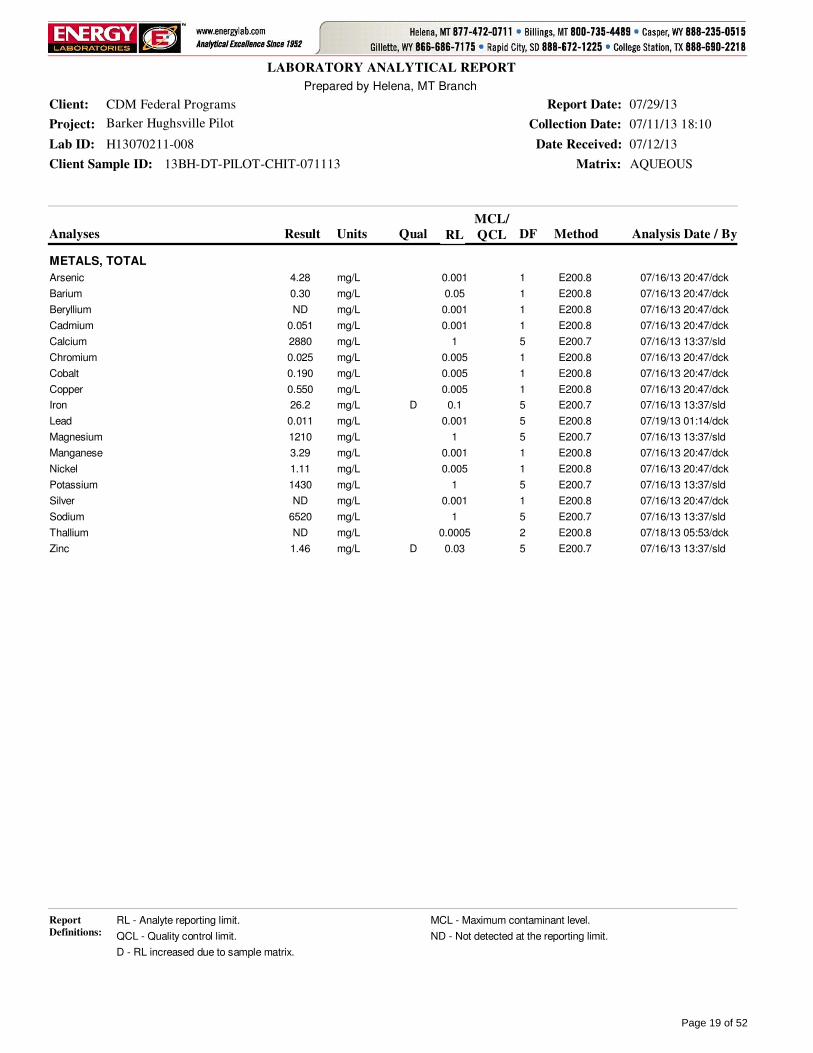
Analyses Result QualUnits Analysis Date / ByRL DF
MCL/
QCL
LABORATORY ANALYTICAL REPORT
Project: Barker Hughsville Pilot
Client Sample ID: 13BH-DT-PILOT-CHIT-071113
Collection Date: 07/11/13 18:10
Matrix: AQUEOUS
Client: CDM Federal Programs
Lab ID: H13070211-008
Report Date: 07/29/13
Date Received: 07/12/13
Method
Prepared by Helena, MT Branch
METALS, TOTAL
07/16/13 20:47/dck0.001mg/L4.28Arsenic E200.81
07/16/13 20:47/dck0.05mg/L0.30Barium E200.81
07/16/13 20:47/dck0.001mg/LNDBeryllium E200.81
07/16/13 20:47/dck0.001mg/L0.051Cadmium E200.81
07/16/13 13:37/sld1mg/L2880Calcium E200.75
07/16/13 20:47/dck0.005mg/L0.025Chromium E200.81
07/16/13 20:47/dck0.005mg/L0.190Cobalt E200.81
07/16/13 20:47/dck0.005mg/L0.550Copper E200.81
D 07/16/13 13:37/sld0.1mg/L26.2Iron E200.75
07/19/13 01:14/dck0.001mg/L0.011Lead E200.85
07/16/13 13:37/sld1mg/L1210Magnesium E200.75
07/16/13 20:47/dck0.001mg/L3.29Manganese E200.81
07/16/13 20:47/dck0.005mg/L1.11Nickel E200.81
07/16/13 13:37/sld1mg/L1430Potassium E200.75
07/16/13 20:47/dck0.001mg/LNDSilver E200.81
07/16/13 13:37/sld1mg/L6520Sodium E200.75
07/18/13 05:53/dck0.0005mg/LNDThallium E200.82
D 07/16/13 13:37/sld0.03mg/L1.46Zinc E200.75
Report
Definitions: RL - Analyte reporting limit. MCL - Maximum contaminant level.
QCL - Quality control limit. ND - Not detected at the reporting limit.
D - RL increased due to sample matrix.
Page 19 of 52

Analyses Result QualUnits Analysis Date / ByRL DF
MCL/
QCL
LABORATORY ANALYTICAL REPORT
Project: Barker Hughsville Pilot
Client Sample ID: 13BH-DT-PILOT-MGOH-071113
Collection Date: 07/11/13 18:30
Matrix: AQUEOUS
Client: CDM Federal Programs
Lab ID: H13070211-009
Report Date: 07/29/13
Date Received: 07/12/13
Method
Prepared by Helena, MT Branch
PHYSICAL PROPERTIES
07/12/13 14:14/glj10mg/L1800Solids, Total Dissolved TDS @ 180 C A2540 C1
INORGANICS
D 07/15/13 10:00/cmm4.0mg/L330Acidity, Total as CaCO3 A2310 B1
07/15/13 15:56/jaw1mg/LNDAlkalinity, Total as CaCO3 A2320 B1
07/15/13 15:56/jaw1mg/LNDBicarbonate as HCO3 A2320 B1
07/15/13 15:56/jaw1mg/LNDCarbonate as CO3 A2320 B1
07/15/13 15:56/jaw1mg/LNDHydroxide as OH A2320 B1
07/15/13 16:39/jaw1mg/L4Chloride E300.05
07/15/13 16:39/jaw1mg/L1200Sulfate E300.05
D 07/16/13 10:14/cmm0.5mg/LNDFluoride A4500-F C4 5
NUTRIENTS
D 07/12/13 14:32/reh0.1mg/LNDPhosphorus, Orthophosphate as P E365.1100
METALS, DISSOLVED
07/16/13 20:52/dck0.03mg/L0.87Aluminum E200.810
07/16/13 20:52/dck0.001mg/L0.007Arsenic E200.810
07/16/13 20:52/dck0.05mg/LNDBarium E200.810
07/16/13 20:52/dck0.001mg/L0.001Beryllium E200.810
07/16/13 20:52/dck0.001mg/L0.249Cadmium E200.810
07/15/13 12:04/sld1mg/L102Calcium E200.75
07/16/13 20:52/dck0.005mg/LNDChromium E200.810
07/16/13 20:52/dck0.005mg/L0.044Cobalt E200.810
07/16/13 20:52/dck0.005mg/L0.361Copper E200.810
07/15/13 12:04/sld0.03mg/L41.0Iron E200.75
07/16/13 20:52/dck0.001mg/LNDLead E200.810
07/15/13 12:04/sld1mg/L146Magnesium E200.75
D 07/15/13 12:04/sld0.003mg/L100Manganese E200.75
07/16/13 20:52/dck0.005mg/L0.030Nickel E200.810
07/15/13 12:04/sld1mg/L1Potassium E200.75
07/16/13 20:52/dck0.001mg/LNDSilver E200.810
07/15/13 12:04/sld1mg/L9Sodium E200.75
07/16/13 20:52/dck0.0005mg/L0.0021Thallium E200.810
07/15/13 12:04/sld0.01mg/L47.5Zinc E200.75
METALS, TOTAL
07/16/13 21:14/dck0.03mg/L1.56Aluminum E200.81
07/16/13 21:14/dck0.001mg/L0.034Arsenic E200.81
Report
Definitions: RL - Analyte reporting limit. MCL - Maximum contaminant level.
QCL - Quality control limit. ND - Not detected at the reporting limit.
D - RL increased due to sample matrix.
Page 20 of 52

Analyses Result QualUnits Analysis Date / ByRL DF
MCL/
QCL
LABORATORY ANALYTICAL REPORT
Project: Barker Hughsville Pilot
Client Sample ID: 13BH-DT-PILOT-MGOH-071113
Collection Date: 07/11/13 18:30
Matrix: AQUEOUS
Client: CDM Federal Programs
Lab ID: H13070211-009
Report Date: 07/29/13
Date Received: 07/12/13
Method
Prepared by Helena, MT Branch
METALS, TOTAL
07/16/13 21:14/dck0.05mg/LNDBarium E200.81
07/16/13 21:14/dck0.001mg/L0.002Beryllium E200.81
07/16/13 21:14/dck0.001mg/L0.248Cadmium E200.81
07/16/13 13:41/sld1mg/L103Calcium E200.71
07/16/13 21:14/dck0.005mg/LNDChromium E200.81
07/16/13 21:14/dck0.005mg/L0.044Cobalt E200.81
07/16/13 21:14/dck0.005mg/L0.463Copper E200.81
07/16/13 13:41/sld0.03mg/L54.8Iron E200.71
07/16/13 21:14/dck0.001mg/L0.020Lead E200.81
07/16/13 13:41/sld1mg/L148Magnesium E200.71
D 07/16/13 13:41/sld0.003mg/L101Manganese E200.71
07/16/13 21:14/dck0.005mg/L0.031Nickel E200.81
07/16/13 13:41/sld1mg/LNDPotassium E200.71
07/16/13 21:14/dck0.001mg/LNDSilver E200.81
07/16/13 13:41/sld1mg/L8Sodium E200.71
07/16/13 21:14/dck0.0005mg/L0.0022Thallium E200.81
07/16/13 13:41/sld0.01mg/L47.6Zinc E200.71
Report
Definitions: RL - Analyte reporting limit. MCL - Maximum contaminant level.
QCL - Quality control limit. ND - Not detected at the reporting limit.
D - RL increased due to sample matrix.
Page 21 of 52

Project: Barker Hughsville Pilot
Client: CDM Federal Programs
Work Order: H13070211
QA/QC Summary Report
07/29/13Report Date:
Analyte Result %REC RPDLow Limit High Limit RPDLimitRLUnits Qual
Prepared by Helena, MT Branch
Method: A2310 B Batch: H13070211-001A
Sample ID: H13070211-009ADUP 07/15/13 10:00Sample Duplicate Run: MISC WC_130715A
Acidity, Total as CaCO3 204.0 7.1350 mg/L
Sample ID: LCS1307010000 07/15/13 10:00Laboratory Control Sample Run: MISC WC_130715A
Acidity, Total as CaCO3 104 90 1104.0670 mg/L
Sample ID: MBLK1307010000 07/15/13 10:00Method Blank Run: MISC WC_130715A
Acidity, Total as CaCO3 3ND mg/L
Method: A2310 B Batch: H13070211-001A
Sample ID: H13070211-002A DUP 07/22/13 08:30Sample Duplicate Run: MISC WC_130722A
Acidity, Total as CaCO3 204.0 2.8720 mg/L
Sample ID: LCS1307220000 07/22/13 08:30Laboratory Control Sample Run: MISC WC_130722A
Acidity, Total as CaCO3 107 90 1104.0700 mg/L
Sample ID: MBLK1307220000 07/22/13 08:30Method Blank Run: MISC WC_130722A
Acidity, Total as CaCO3 34 mg/L
Qualifiers:
RL - Analyte reporting limit. ND - Not detected at the reporting limit.
Page 22 of 52

Project: Barker Hughsville Pilot
Client: CDM Federal Programs
Work Order: H13070211
QA/QC Summary Report
07/29/13Report Date:
Analyte Result %REC RPDLow Limit High Limit RPDLimitRLUnits Qual
Prepared by Helena, MT Branch
Method: A2320 B Batch: R89739
Sample ID: MBLK 07/15/13 13:58Method Blank Run: MAN-TECH_130715B
Alkalinity, Total as CaCO3 2ND mg/L
Sample ID: LCS-06192013 07/15/13 14:06Laboratory Control Sample Run: MAN-TECH_130715B
Alkalinity, Total as CaCO3 103 90 1104.0620 mg/L
Sample ID: H13070209-001ADUP 07/15/13 14:21Sample Duplicate Run: MAN-TECH_130715B
Alkalinity, Total as CaCO3 104.0 0.4340 mg/L
Bicarbonate as HCO3 104.0 0.5410 mg/L
Carbonate as CO3 104.0ND mg/L
Sample ID: H13070222-001ADUP 07/15/13 16:12Sample Duplicate Run: MAN-TECH_130715B
Alkalinity, Total as CaCO3 104.0 0.5250 mg/L
Bicarbonate as HCO3 104.0 0.5310 mg/L
Carbonate as CO3 104.0ND mg/L
Sample ID: H13070222-002AMS 07/15/13 16:28Sample Matrix Spike Run: MAN-TECH_130715B
Alkalinity, Total as CaCO3 110 80 1204.0900 mg/L
Method: A2320 B Batch: 130717A-ALK-W
Sample ID: MBLK1_130717A 07/17/13 13:10Method Blank Run: PH_130717A
Alkalinity, Total as CaCO3 0.92 mg/L
Sample ID: MBLK1_130717AMS 07/17/13 13:11Sample Matrix Spike Run: PH_130717A
Alkalinity, Total as CaCO3 83 80 1204.0500 mg/L
Sample ID: LCS1_130717A 07/17/13 13:39Laboratory Control Sample Run: PH_130717A
Alkalinity, Total as CaCO3 94 90 1104.0560 mg/L
Sample ID: H13070211-008ADUP 07/17/13 14:45Sample Duplicate Run: PH_130717A
Alkalinity, Total as CaCO3 104.0 3.222000 mg/L
Bicarbonate as HCO3 104.0 3.227000 mg/L
Carbonate as CO3 104.0ND mg/L
Qualifiers:
RL - Analyte reporting limit. ND - Not detected at the reporting limit.
Page 23 of 52

Project: Barker Hughsville Pilot
Client: CDM Federal Programs
Work Order: H13070211
QA/QC Summary Report
07/29/13Report Date:
Analyte Result %REC RPDLow Limit High Limit RPDLimitRLUnits Qual
Prepared by Helena, MT Branch
Method: A2540 C Batch: TDS130712A
Sample ID: MB-1_130712A 07/12/13 14:11Method Blank Run: ACCU-124 (14410200)_130712
Solids, Total Dissolved TDS @ 180 C 1ND mg/L
Sample ID: LCS-2_130712A 07/12/13 14:12Laboratory Control Sample Run: ACCU-124 (14410200)_130712
Solids, Total Dissolved TDS @ 180 C 100 90 110101990 mg/L
Sample ID: H13070209-001A DUP 07/12/13 14:12Sample Duplicate Run: ACCU-124 (14410200)_130712
Solids, Total Dissolved TDS @ 180 C 510 3.85110 mg/L
Sample ID: H13070209-002A MS 07/12/13 14:12Sample Matrix Spike Run: ACCU-124 (14410200)_130712
Solids, Total Dissolved TDS @ 180 C 96 80 120108500 mg/L
Sample ID: H13070211-009A DUP 07/12/13 14:14Sample Duplicate Run: ACCU-124 (14410200)_130712
Solids, Total Dissolved TDS @ 180 C 510 0.71780 mg/L
Qualifiers:
RL - Analyte reporting limit. ND - Not detected at the reporting limit.
Page 24 of 52
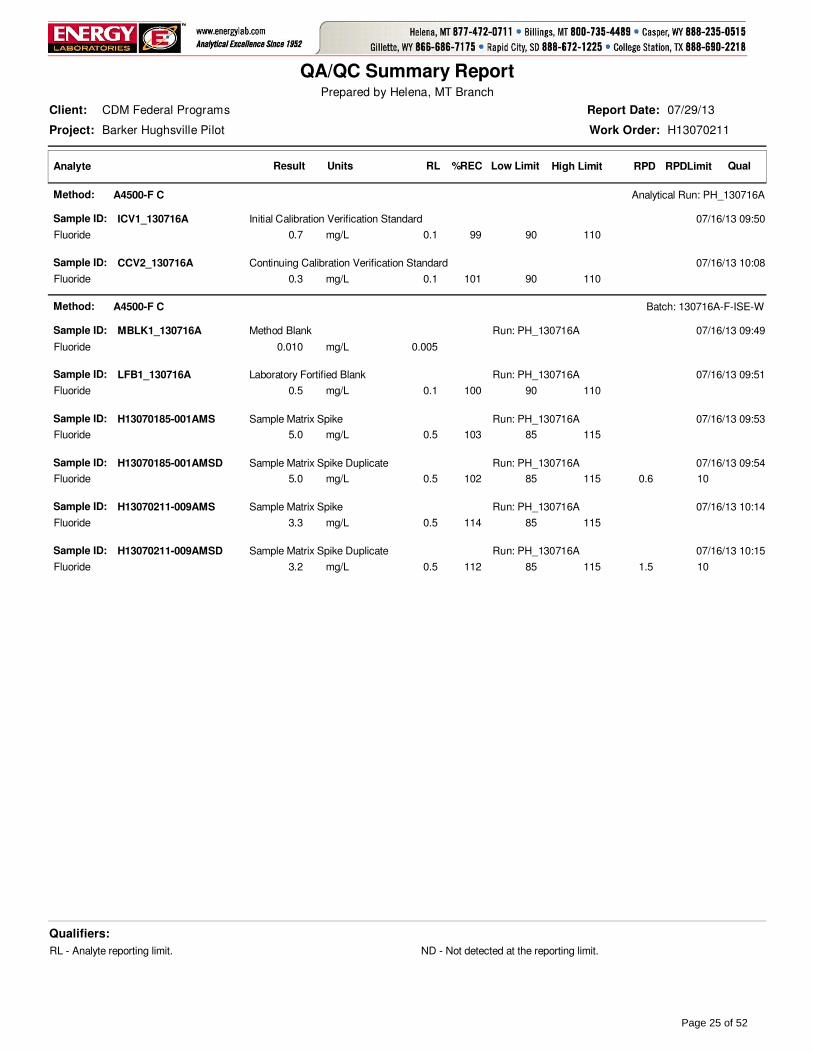
Project: Barker Hughsville Pilot
Client: CDM Federal Programs
Work Order: H13070211
QA/QC Summary Report
07/29/13Report Date:
Analyte Result %REC RPDLow Limit High Limit RPDLimitRLUnits Qual
Prepared by Helena, MT Branch
Method: A4500-F C Analytical Run: PH_130716A
Sample ID: ICV1_130716A 07/16/13 09:50Initial Calibration Verification Standard
Fluoride 99 90 1100.10.7 mg/L
Sample ID: CCV2_130716A 07/16/13 10:08Continuing Calibration Verification Standard
Fluoride 101 90 1100.10.3 mg/L
Method: A4500-F C Batch: 130716A-F-ISE-W
Sample ID: MBLK1_130716A 07/16/13 09:49Method Blank Run: PH_130716A
Fluoride 0.0050.010 mg/L
Sample ID: LFB1_130716A 07/16/13 09:51Laboratory Fortified Blank Run: PH_130716A
Fluoride 100 90 1100.10.5 mg/L
Sample ID: H13070185-001AMS 07/16/13 09:53Sample Matrix Spike Run: PH_130716A
Fluoride 103 85 1150.55.0 mg/L
Sample ID: H13070185-001AMSD 07/16/13 09:54Sample Matrix Spike Duplicate Run: PH_130716A
Fluoride 102 85 115 100.5 0.65.0 mg/L
Sample ID: H13070211-009AMS 07/16/13 10:14Sample Matrix Spike Run: PH_130716A
Fluoride 114 85 1150.53.3 mg/L
Sample ID: H13070211-009AMSD 07/16/13 10:15Sample Matrix Spike Duplicate Run: PH_130716A
Fluoride 112 85 115 100.5 1.53.2 mg/L
Qualifiers:
RL - Analyte reporting limit. ND - Not detected at the reporting limit.
Page 25 of 52

Project: Barker Hughsville Pilot
Client: CDM Federal Programs
Work Order: H13070211
QA/QC Summary Report
07/29/13Report Date:
Analyte Result %REC RPDLow Limit High Limit RPDLimitRLUnits Qual
Prepared by Helena, MT Branch
Method: A4500-S F Batch: B_R208278
Sample ID: MB-R208278 07/16/13 14:30Method Blank Run: SUB-B208278
Sulfide 0.5ND mg/L
Sample ID: LCS-R208278 07/16/13 14:30Laboratory Control Sample Run: SUB-B208278
Sulfide 100 70 1301.026.6 mg/L
Sample ID: B13070209-001FMS 07/16/13 14:30Sample Matrix Spike Run: SUB-B208278
Sulfide 100 80 1201.027.4 mg/L
Sample ID: B13070209-001FMSD 07/16/13 14:30Sample Matrix Spike Duplicate Run: SUB-B208278
Sulfide 99 80 120 201.0 0.327.4 mg/L
Qualifiers:
RL - Analyte reporting limit. ND - Not detected at the reporting limit.
Page 26 of 52

Project: Barker Hughsville Pilot
Client: CDM Federal Programs
Work Order: H13070211
QA/QC Summary Report
07/29/13Report Date:
Analyte Result %REC RPDLow Limit High Limit RPDLimitRLUnits Qual
Prepared by Helena, MT Branch
Method: E200.7 Analytical Run: ICP2-HE_130715A
Sample ID: ICV 07/15/13 10:34Initial Calibration Verification Standard
Calcium 101 95 1051.040.4 mg/L
Iron 100 95 1050.0303.99 mg/L
Magnesium 102 95 1051.040.7 mg/L
Manganese 99 95 1050.0103.96 mg/L
Potassium 100 95 1051.039.9 mg/L
Sodium 100 95 1051.040.1 mg/L
Zinc 102 95 1050.0100.813 mg/L
Sample ID: CCV-1 07/15/13 10:38Continuing Calibration Verification Standard
Calcium 100 95 1051.025.0 mg/L
Iron 100 95 1050.0302.49 mg/L
Magnesium 100 95 1051.025.1 mg/L
Manganese 99 95 1050.0102.47 mg/L
Potassium 100 95 1051.024.9 mg/L
Sodium 100 95 1051.024.9 mg/L
Zinc 102 95 1050.0102.56 mg/L
Sample ID: ICSA 07/15/13 10:48Interference Check Sample A
Calcium 94 80 1201.0468 mg/L
Iron 94 80 1200.030188 mg/L
Magnesium 102 80 1201.0510 mg/L
Manganese 0 00.0100.00357 mg/L
Potassium 0 01.00.0292 mg/L
Sodium 0 01.00.0216 mg/L
Zinc 0 00.0100.0132 mg/L
Sample ID: ICSAB 07/15/13 10:53Interference Check Sample AB
Calcium 94 80 1201.0472 mg/L
Iron 94 80 1200.030189 mg/L
Magnesium 102 80 1201.0509 mg/L
Manganese 96 80 1200.0100.482 mg/L
Potassium 114 80 1201.022.7 mg/L
Sodium 115 80 1201.022.9 mg/L
Zinc 101 80 1200.0101.01 mg/L
Sample ID: CCV 07/15/13 11:23Continuing Calibration Verification Standard
Calcium 96 90 1101.024.1 mg/L
Iron 98 90 1100.0302.45 mg/L
Magnesium 94 90 1101.023.5 mg/L
Manganese 97 90 1100.0102.41 mg/L
Potassium 99 90 1101.024.8 mg/L
Sodium 100 90 1101.025.0 mg/L
Zinc 98 90 1100.0102.45 mg/L
Qualifiers:
RL - Analyte reporting limit. ND - Not detected at the reporting limit.
Page 27 of 52

Project: Barker Hughsville Pilot
Client: CDM Federal Programs
Work Order: H13070211
QA/QC Summary Report
07/29/13Report Date:
Analyte Result %REC RPDLow Limit High Limit RPDLimitRLUnits Qual
Prepared by Helena, MT Branch
Method: E200.7 Batch: R89727
Sample ID: ICB 07/15/13 11:00Method Blank Run: ICP2-HE_130715A
Calcium 0.030.03 mg/L
Iron 0.005ND mg/L
Magnesium 0.02ND mg/L
Manganese 0.0005ND mg/L
Potassium 0.03ND mg/L
Sodium 0.03ND mg/L
Zinc 0.001ND mg/L
Sample ID: LFB 07/15/13 11:04Laboratory Fortified Blank Run: ICP2-HE_130715A
Calcium 98 85 1151.049.3 mg/L
Iron 98 85 1150.0304.90 mg/L
Magnesium 100 85 1151.050.0 mg/L
Manganese 97 85 1150.0104.86 mg/L
Potassium 96 85 1151.048.0 mg/L
Sodium 96 85 1151.048.2 mg/L
Zinc 99 85 1150.0100.994 mg/L
Sample ID: H13070209-001BMS2 07/15/13 11:15Sample Matrix Spike Run: ICP2-HE_130715A
Calcium 94 70 1301.0529 mg/L
Iron 98 70 1300.03024.5 mg/L
Magnesium 95 70 1301.0432 mg/L
Manganese 97 70 1300.002724.4 mg/L
Potassium 99 70 1301.0250 mg/L
Sodium 99 70 1301.01190 mg/L
Zinc 98 70 1300.0104.91 mg/L
Sample ID: H13070209-001BMSD2 07/15/13 11:19Sample Matrix Spike Duplicate Run: ICP2-HE_130715A
Calcium 93 70 130 201.0 0.6526 mg/L
Iron 98 70 130 200.030 0.324.6 mg/L
Magnesium 94 70 130 201.0 1.0428 mg/L
Manganese 98 70 130 200.0027 0.524.5 mg/L
Potassium 100 70 130 201.0 0.8252 mg/L
Sodium 95 70 130 201.0 0.91180 mg/L
Zinc 98 70 130 200.010 0.44.89 mg/L
Sample ID: H13070211-009CMS2 07/15/13 12:18Sample Matrix Spike Run: ICP2-HE_130715A
Calcium 98 70 1301.0347 mg/L
Iron 97 70 1300.03065.2 mg/L
Magnesium 101 70 1301.0399 mg/L
Manganese 70 1300.0027123 mg/L A
Potassium 99 70 1301.0249 mg/L
Sodium 101 70 1301.0261 mg/L
Zinc 70 1300.01052.1 mg/L A
Qualifiers:
RL - Analyte reporting limit. A - The analyte level was greater than four times the spike level. In accordance with the method % recovery is not calculated.
ND - Not detected at the reporting limit.
Page 28 of 52

Project: Barker Hughsville Pilot
Client: CDM Federal Programs
Work Order: H13070211
QA/QC Summary Report
07/29/13Report Date:
Analyte Result %REC RPDLow Limit High Limit RPDLimitRLUnits Qual
Prepared by Helena, MT Branch
Method: E200.7 Batch: R89727
Sample ID: H13070211-009CMSD2 07/15/13 12:22Sample Matrix Spike Duplicate Run: ICP2-HE_130715A
Calcium 99 70 130 201.0 0.4348 mg/L
Iron 97 70 130 200.030 0.165.2 mg/L
Magnesium 102 70 130 201.0 0.3400 mg/L
Manganese 70 130 200.0027 0.2123 mg/L A
Potassium 100 70 130 201.0 0.5250 mg/L
Sodium 101 70 130 201.0 0.5263 mg/L
Zinc 70 130 200.010 0.252.2 mg/L A
Qualifiers:
RL - Analyte reporting limit. A - The analyte level was greater than four times the spike level. In accordance with the method % recovery is not calculated.
ND - Not detected at the reporting limit.
Page 29 of 52

Project: Barker Hughsville Pilot
Client: CDM Federal Programs
Work Order: H13070211
QA/QC Summary Report
07/29/13Report Date:
Analyte Result %REC RPDLow Limit High Limit RPDLimitRLUnits Qual
Prepared by Helena, MT Branch
Method: E200.7 Analytical Run: ICP2-HE_130716A
Sample ID: ICV 07/16/13 10:43Initial Calibration Verification Standard
Calcium 99 95 1051.039.8 mg/L
Iron 99 95 1050.0303.95 mg/L
Magnesium 100 95 1051.039.8 mg/L
Manganese 97 95 1050.0103.87 mg/L
Potassium 100 95 1051.040.0 mg/L
Sodium 101 95 1051.040.3 mg/L
Zinc 98 95 1050.0100.781 mg/L
Sample ID: CCV-1 07/16/13 10:46Continuing Calibration Verification Standard
Calcium 100 95 1051.025.0 mg/L
Iron 99 95 1050.0302.48 mg/L
Magnesium 100 95 1051.025.0 mg/L
Manganese 97 95 1050.0102.43 mg/L
Potassium 97 95 1051.024.3 mg/L
Sodium 97 95 1051.024.3 mg/L
Zinc 102 95 1050.0102.55 mg/L
Sample ID: ICSA 07/16/13 10:57Interference Check Sample A
Calcium 95 80 1201.0476 mg/L
Iron 94 80 1200.030188 mg/L
Magnesium 100 80 1201.0501 mg/L
Manganese 0 00.0100.00465 mg/L
Potassium 0 01.0-0.00887 mg/L
Sodium 0 01.00.0212 mg/L
Zinc 0 00.0100.0128 mg/L
Sample ID: ICSAB 07/16/13 11:01Interference Check Sample AB
Calcium 95 80 1201.0474 mg/L
Iron 95 80 1200.030190 mg/L
Magnesium 101 80 1201.0505 mg/L
Manganese 96 80 1200.0100.481 mg/L
Potassium 115 80 1201.022.9 mg/L
Sodium 115 80 1201.023.1 mg/L
Zinc 99 80 1200.0100.995 mg/L
Sample ID: CCV 07/16/13 12:16Continuing Calibration Verification Standard
Calcium 96 90 1101.024.1 mg/L
Iron 97 90 1100.0302.42 mg/L
Magnesium 95 90 1101.023.8 mg/L
Manganese 95 90 1100.0102.37 mg/L
Potassium 99 90 1101.024.7 mg/L
Sodium 99 90 1101.024.7 mg/L
Zinc 95 90 1100.0102.37 mg/L
Qualifiers:
RL - Analyte reporting limit. ND - Not detected at the reporting limit.
Page 30 of 52

Project: Barker Hughsville Pilot
Client: CDM Federal Programs
Work Order: H13070211
QA/QC Summary Report
07/29/13Report Date:
Analyte Result %REC RPDLow Limit High Limit RPDLimitRLUnits Qual
Prepared by Helena, MT Branch
Method: E200.7 Analytical Run: ICP2-HE_130716A
Sample ID: CCV 07/16/13 13:01Continuing Calibration Verification Standard
Calcium 97 90 1101.024.3 mg/L
Iron 97 90 1100.0302.43 mg/L
Magnesium 96 90 1101.024.0 mg/L
Manganese 95 90 1100.0102.38 mg/L
Potassium 95 90 1101.023.8 mg/L
Sodium 96 90 1101.023.9 mg/L
Zinc 96 90 1100.0102.41 mg/L
Method: E200.7 Batch: 20955
Sample ID: MB-20955 07/16/13 11:50Method Blank Run: ICP2-HE_130716A
Calcium 0.06ND mg/L
Iron 0.005ND mg/L
Magnesium 0.006ND mg/L
Manganese 0.0006ND mg/L
Potassium 0.03ND mg/L
Sodium 0.03ND mg/L
Zinc 0.0010.002 mg/L
Sample ID: LCS-20955 07/16/13 11:54Laboratory Control Sample Run: ICP2-HE_130716A
Calcium 97 85 1151.024.2 mg/L
Iron 96 85 1150.0302.41 mg/L
Magnesium 96 85 1151.024.1 mg/L
Manganese 95 85 1150.00102.37 mg/L
Potassium 98 85 1151.024.5 mg/L
Sodium 98 85 1151.024.6 mg/L
Zinc 95 85 1150.0100.479 mg/L
Sample ID: H13070211-001DMS3 07/16/13 13:08Sample Matrix Spike Run: ICP2-HE_130716A
Calcium 100 70 1301.0232 mg/L
Iron 70 1300.030192 mg/L A
Magnesium 100 70 1301.0148 mg/L
Manganese 70 1300.0031136 mg/L A
Potassium 102 70 1301.0129 mg/L
Sodium 103 70 1301.0133 mg/L
Zinc 70 1300.01064.7 mg/L A
Sample ID: H13070211-001DMSD3 07/16/13 13:12Sample Matrix Spike Duplicate Run: ICP2-HE_130716A
Calcium 99 70 130 201.0 0.7231 mg/L
Iron 70 130 200.030 0.3191 mg/L A
Magnesium 98 70 130 201.0 1.1147 mg/L
Manganese 70 130 200.0031 0.4135 mg/L A
Potassium 102 70 130 201.0 0.4129 mg/L
Sodium 103 70 130 201.0 0.0133 mg/L
Qualifiers:
RL - Analyte reporting limit. A - The analyte level was greater than four times the spike level. In accordance with the method % recovery is not calculated.
ND - Not detected at the reporting limit.
Page 31 of 52

Project: Barker Hughsville Pilot
Client: CDM Federal Programs
Work Order: H13070211
QA/QC Summary Report
07/29/13Report Date:
Analyte Result %REC RPDLow Limit High Limit RPDLimitRLUnits Qual
Prepared by Helena, MT Branch
Method: E200.7 Batch: 20955
Sample ID: H13070211-001DMSD3 07/16/13 13:12Sample Matrix Spike Duplicate Run: ICP2-HE_130716A
Zinc 70 130 200.010 1.164.1 mg/L A
Qualifiers:
RL - Analyte reporting limit. A - The analyte level was greater than four times the spike level. In accordance with the method % recovery is not calculated.
ND - Not detected at the reporting limit.
Page 32 of 52

Project: Barker Hughsville Pilot
Client: CDM Federal Programs
Work Order: H13070211
QA/QC Summary Report
07/29/13Report Date:
Analyte Result %REC RPDLow Limit High Limit RPDLimitRLUnits Qual
Prepared by Helena, MT Branch
Method: E200.8 Analytical Run: ICPMS204-B_130716A
Sample ID: ICV STD 07/16/13 11:41Initial Calibration Verification Standard
Aluminum 97 90 1100.100.291 mg/L
Arsenic 100 90 1100.00500.0600 mg/L
Barium 99 90 1100.100.0596 mg/L
Beryllium 103 90 1100.00100.0310 mg/L
Cadmium 106 90 1100.00100.0318 mg/L
Chromium 100 90 1100.0100.0599 mg/L
Cobalt 99 90 1100.0100.0596 mg/L
Copper 102 90 1100.0100.0610 mg/L
Iron 100 90 1100.0300.299 mg/L
Lead 103 90 1100.0100.0618 mg/L
Manganese 101 90 1100.0100.301 mg/L
Nickel 101 90 1100.0100.0606 mg/L
Silver 100 90 1100.00500.0300 mg/L
Thallium 100 90 1100.100.0601 mg/L
Zinc 103 90 1100.0100.0620 mg/L
Sample ID: ICSA 07/16/13 11:45Interference Check Sample A
Aluminum 91 70 1300.1036.5 mg/L
Arsenic 0.00500.000313 mg/L
Barium 0.100.000266 mg/L
Beryllium 0.00103.00E-06 mg/L
Cadmium 0.00100.00118 mg/L
Chromium 0.0100.00125 mg/L
Cobalt 0.0100.000415 mg/L
Copper 0.0100.000338 mg/L
Iron 93 70 1300.03093.4 mg/L
Lead 0.0100.000184 mg/L
Manganese 0.0100.000666 mg/L
Nickel 0.0100.000736 mg/L
Silver 0.00500.000177 mg/L
Thallium 0.107.70E-05 mg/L
Zinc 0.0100.00123 mg/L
Sample ID: ICSAB 07/16/13 11:57Interference Check Sample AB
Aluminum 93 70 1300.1037.0 mg/L
Arsenic 106 70 1300.00500.0106 mg/L
Barium 0 00.100.000105 mg/L
Beryllium 0 00.00106.00E-06 mg/L
Cadmium 103 70 1300.00100.0103 mg/L
Chromium 110 70 1300.0100.0219 mg/L
Cobalt 109 70 1300.0100.0218 mg/L
Copper 101 70 1300.0100.0203 mg/L
Iron 93 70 1300.03093.2 mg/L
Qualifiers:
RL - Analyte reporting limit. ND - Not detected at the reporting limit.
Page 33 of 52

Project: Barker Hughsville Pilot
Client: CDM Federal Programs
Work Order: H13070211
QA/QC Summary Report
07/29/13Report Date:
Analyte Result %REC RPDLow Limit High Limit RPDLimitRLUnits Qual
Prepared by Helena, MT Branch
Method: E200.8 Analytical Run: ICPMS204-B_130716A
Sample ID: ICSAB 07/16/13 11:57Interference Check Sample AB
Lead 0 00.0100.000219 mg/L
Manganese 105 70 1300.0100.0211 mg/L
Nickel 104 70 1300.0100.0208 mg/L
Silver 92 70 1300.00500.0183 mg/L
Thallium 0 00.104.50E-05 mg/L
Zinc 105 70 1300.0100.0105 mg/L
Sample ID: ICV STD 07/16/13 17:06Initial Calibration Verification Standard
Aluminum 100 90 1100.100.300 mg/L
Arsenic 104 90 1100.00500.0626 mg/L
Barium 100 90 1100.100.0602 mg/L
Beryllium 105 90 1100.00100.0315 mg/L
Cadmium 109 90 1100.00100.0328 mg/L
Chromium 104 90 1100.0100.0627 mg/L
Cobalt 98 90 1100.0100.0590 mg/L
Copper 107 90 1100.0100.0644 mg/L
Iron 108 90 1100.0300.325 mg/L
Lead 104 90 1100.0100.0621 mg/L
Manganese 100 90 1100.0100.301 mg/L
Nickel 106 90 1100.0100.0636 mg/L
Silver 102 90 1100.00500.0306 mg/L
Thallium 101 90 1100.100.0605 mg/L
Zinc 108 90 1100.0100.0646 mg/L
Sample ID: ICSA 07/16/13 17:10Interference Check Sample A
Aluminum 95 70 1300.1038.1 mg/L
Arsenic 0.00500.000345 mg/L
Barium 0.100.000245 mg/L
Beryllium 0.00101.00E-06 mg/L
Cadmium 0.00100.00116 mg/L
Chromium 0.0100.00116 mg/L
Cobalt 0.0100.000416 mg/L
Copper 0.0100.000301 mg/L
Iron 98 70 1300.03097.9 mg/L
Lead 0.0100.000169 mg/L
Manganese 0.0100.000604 mg/L
Nickel 0.0100.000686 mg/L
Silver 0.00500.000182 mg/L
Thallium 0.107.50E-05 mg/L
Zinc 0.0100.00107 mg/L
Sample ID: ICSAB 07/16/13 17:14Interference Check Sample AB
Aluminum 95 70 1300.1038.1 mg/L
Arsenic 111 70 1300.00500.0111 mg/L
Qualifiers:
RL - Analyte reporting limit. ND - Not detected at the reporting limit.
Page 34 of 52

Project: Barker Hughsville Pilot
Client: CDM Federal Programs
Work Order: H13070211
QA/QC Summary Report
07/29/13Report Date:
Analyte Result %REC RPDLow Limit High Limit RPDLimitRLUnits Qual
Prepared by Helena, MT Branch
Method: E200.8 Analytical Run: ICPMS204-B_130716A
Sample ID: ICSAB 07/16/13 17:14Interference Check Sample AB
Barium 0 00.108.10E-05 mg/L
Beryllium 0 00.00106.00E-06 mg/L
Cadmium 108 70 1300.00100.0108 mg/L
Chromium 114 70 1300.0100.0227 mg/L
Cobalt 114 70 1300.0100.0229 mg/L
Copper 105 70 1300.0100.0209 mg/L
Iron 100 70 1300.03099.6 mg/L
Lead 0 00.0100.000221 mg/L
Manganese 108 70 1300.0100.0216 mg/L
Nickel 109 70 1300.0100.0219 mg/L
Silver 92 70 1300.00500.0184 mg/L
Thallium 0 00.105.30E-05 mg/L
Zinc 107 70 1300.0100.0107 mg/L
Sample ID: ICV STD 07/17/13 00:59Initial Calibration Verification Standard
Aluminum 101 90 1100.100.302 mg/L
Arsenic 100 90 1100.00500.0603 mg/L
Barium 100 90 1100.100.0603 mg/L
Beryllium 103 90 1100.00100.0310 mg/L
Cadmium 109 90 1100.00100.0326 mg/L
Chromium 101 90 1100.0100.0604 mg/L
Cobalt 108 90 1100.0100.0645 mg/L
Copper 102 90 1100.0100.0613 mg/L
Iron 105 90 1100.0300.314 mg/L
Lead 107 90 1100.0100.0641 mg/L
Manganese 99 90 1100.0100.297 mg/L
Nickel 101 90 1100.0100.0607 mg/L
Silver 101 90 1100.00500.0304 mg/L
Thallium 99 90 1100.100.0592 mg/L
Zinc 105 90 1100.0100.0631 mg/L
Sample ID: ICSA 07/17/13 01:03Interference Check Sample A
Aluminum 94 70 1300.1037.6 mg/L
Arsenic 0.00500.000348 mg/L
Barium 0.100.000276 mg/L
Beryllium 0.00104.00E-06 mg/L
Cadmium 0.00100.00110 mg/L
Chromium 0.0100.00117 mg/L
Cobalt 0.0100.000439 mg/L
Copper 0.0100.000296 mg/L
Iron 93 70 1300.03093.3 mg/L
Lead 0.0100.000177 mg/L
Manganese 0.0100.000563 mg/L
Qualifiers:
RL - Analyte reporting limit. ND - Not detected at the reporting limit.
Page 35 of 52

Project: Barker Hughsville Pilot
Client: CDM Federal Programs
Work Order: H13070211
QA/QC Summary Report
07/29/13Report Date:
Analyte Result %REC RPDLow Limit High Limit RPDLimitRLUnits Qual
Prepared by Helena, MT Branch
Method: E200.8 Analytical Run: ICPMS204-B_130716A
Sample ID: ICSA 07/17/13 01:03Interference Check Sample A
Nickel 0.0100.000619 mg/L
Silver 0.00500.000196 mg/L
Thallium 0.104.30E-05 mg/L
Zinc 0.0100.000902 mg/L
Sample ID: ICSAB 07/17/13 01:08Interference Check Sample AB
Aluminum 92 70 1300.1036.9 mg/L
Arsenic 105 70 1300.00500.0105 mg/L
Barium 0 00.100.000111 mg/L
Beryllium 0 00.00101.20E-05 mg/L
Cadmium 107 70 1300.00100.0107 mg/L
Chromium 108 70 1300.0100.0216 mg/L
Cobalt 113 70 1300.0100.0226 mg/L
Copper 101 70 1300.0100.0201 mg/L
Iron 91 70 1300.03091.0 mg/L
Lead 0 00.0100.000235 mg/L
Manganese 105 70 1300.0100.0210 mg/L
Nickel 106 70 1300.0100.0212 mg/L
Silver 92 70 1300.00500.0184 mg/L
Thallium 0 00.103.10E-05 mg/L
Zinc 102 70 1300.0100.0102 mg/L
Sample ID: ICV STD 07/17/13 09:50Initial Calibration Verification Standard
Aluminum 97 90 1100.100.291 mg/L
Arsenic 100 90 1100.00500.0601 mg/L
Barium 100 90 1100.100.0602 mg/L
Beryllium 102 90 1100.00100.0306 mg/L
Cadmium 108 90 1100.00100.0324 mg/L
Chromium 102 90 1100.0100.0611 mg/L
Cobalt 98 90 1100.0100.0591 mg/L
Copper 104 90 1100.0100.0622 mg/L
Iron 104 90 1100.0300.312 mg/L
Lead 105 90 1100.0100.0628 mg/L
Manganese 100 90 1100.0100.301 mg/L
Nickel 103 90 1100.0100.0616 mg/L
Silver 101 90 1100.00500.0304 mg/L
Thallium 100 90 1100.100.0601 mg/L
Zinc 105 90 1100.0100.0631 mg/L
Sample ID: ICSA 07/17/13 09:54Interference Check Sample A
Aluminum 92 70 1300.1036.9 mg/L
Arsenic 0.00500.000287 mg/L
Barium 0.100.000283 mg/L
Beryllium 0.00109.00E-06 mg/L
Qualifiers:
RL - Analyte reporting limit. ND - Not detected at the reporting limit.
Page 36 of 52

Project: Barker Hughsville Pilot
Client: CDM Federal Programs
Work Order: H13070211
QA/QC Summary Report
07/29/13Report Date:
Analyte Result %REC RPDLow Limit High Limit RPDLimitRLUnits Qual
Prepared by Helena, MT Branch
Method: E200.8 Analytical Run: ICPMS204-B_130716A
Sample ID: ICSA 07/17/13 09:54Interference Check Sample A
Cadmium 0.00100.00116 mg/L
Chromium 0.0100.00116 mg/L
Cobalt 0.0100.000412 mg/L
Copper 0.0100.000263 mg/L
Iron 94 70 1300.03093.8 mg/L
Lead 0.0100.000171 mg/L
Manganese 0.0100.000533 mg/L
Nickel 0.0100.000713 mg/L
Silver 0.00500.000193 mg/L
Thallium 0.108.70E-05 mg/L
Zinc 0.0100.00118 mg/L
Sample ID: ICSAB 07/17/13 09:59Interference Check Sample AB
Aluminum 90 70 1300.1036.1 mg/L
Arsenic 108 70 1300.00500.0108 mg/L
Barium 0 00.100.000103 mg/L
Beryllium 0 00.00101.10E-05 mg/L
Cadmium 107 70 1300.00100.0107 mg/L
Chromium 112 70 1300.0100.0224 mg/L
Cobalt 113 70 1300.0100.0226 mg/L
Copper 103 70 1300.0100.0206 mg/L
Iron 95 70 1300.03095.2 mg/L
Lead 0 00.0100.000219 mg/L
Manganese 106 70 1300.0100.0212 mg/L
Nickel 106 70 1300.0100.0212 mg/L
Silver 91 70 1300.00500.0183 mg/L
Thallium 0 00.106.80E-05 mg/L
Zinc 108 70 1300.0100.0108 mg/L
Sample ID: ICSA 07/18/13 04:59Interference Check Sample A
Aluminum 91 70 1300.1036.2 mg/L
Arsenic 0.00500.000329 mg/L
Barium 0.100.000306 mg/L
Beryllium 0.00108.00E-06 mg/L
Cadmium 0.00100.000928 mg/L
Chromium 0.0100.00115 mg/L
Cobalt 0.0100.000426 mg/L
Copper 0.0100.000285 mg/L
Iron 96 70 1300.03095.6 mg/L
Lead 0.0100.000190 mg/L
Manganese 0.0100.000426 mg/L
Nickel 0.0100.000750 mg/L
Silver 0.00500.000211 mg/L
Qualifiers:
RL - Analyte reporting limit. ND - Not detected at the reporting limit.
Page 37 of 52

Project: Barker Hughsville Pilot
Client: CDM Federal Programs
Work Order: H13070211
QA/QC Summary Report
07/29/13Report Date:
Analyte Result %REC RPDLow Limit High Limit RPDLimitRLUnits Qual
Prepared by Helena, MT Branch
Method: E200.8 Analytical Run: ICPMS204-B_130716A
Sample ID: ICSA 07/18/13 04:59Interference Check Sample A
Thallium 0.100.000161 mg/L
Zinc 0.0100.00123 mg/L
Sample ID: ICSAB 07/18/13 05:03Interference Check Sample AB
Aluminum 91 70 1300.1036.4 mg/L
Arsenic 108 70 1300.00500.0108 mg/L
Barium 0 00.100.000125 mg/L
Beryllium 0 00.00101.30E-05 mg/L
Cadmium 116 70 1300.00100.0116 mg/L
Chromium 111 70 1300.0100.0222 mg/L
Cobalt 117 70 1300.0100.0234 mg/L
Copper 105 70 1300.0100.0209 mg/L
Iron 95 70 1300.03094.6 mg/L
Lead 0 00.0100.000229 mg/L
Manganese 111 70 1300.0100.0222 mg/L
Nickel 109 70 1300.0100.0219 mg/L
Silver 94 70 1300.00500.0188 mg/L
Thallium 0 00.100.000112 mg/L
Zinc 107 70 1300.0100.0107 mg/L
Sample ID: ICV STD 07/18/13 09:04Initial Calibration Verification Standard
Aluminum 102 90 1100.100.306 mg/L
Arsenic 101 90 1100.00500.0606 mg/L
Barium 102 90 1100.100.0613 mg/L
Beryllium 107 90 1100.00100.0320 mg/L
Cadmium 109 90 1100.00100.0328 mg/L
Chromium 102 90 1100.0100.0609 mg/L
Cobalt 100 90 1100.0100.0600 mg/L
Copper 105 90 1100.0100.0632 mg/L
Iron 106 90 1100.0300.318 mg/L
Lead 106 90 1100.0100.0637 mg/L
Manganese 100 90 1100.0100.301 mg/L
Nickel 103 90 1100.0100.0617 mg/L
Silver 101 90 1100.00500.0302 mg/L
Thallium 99 90 1100.100.0593 mg/L
Zinc 106 90 1100.0100.0638 mg/L
Sample ID: ICSA 07/18/13 09:08Interference Check Sample A
Aluminum 92 70 1300.1037.0 mg/L
Arsenic 0.00500.000229 mg/L
Barium 0.100.000234 mg/L
Beryllium 0.00101.30E-05 mg/L
Cadmium 0.00100.00111 mg/L
Chromium 0.0100.00112 mg/L
Qualifiers:
RL - Analyte reporting limit. ND - Not detected at the reporting limit.
Page 38 of 52

Project: Barker Hughsville Pilot
Client: CDM Federal Programs
Work Order: H13070211
QA/QC Summary Report
07/29/13Report Date:
Analyte Result %REC RPDLow Limit High Limit RPDLimitRLUnits Qual
Prepared by Helena, MT Branch
Method: E200.8 Analytical Run: ICPMS204-B_130716A
Sample ID: ICSA 07/18/13 09:08Interference Check Sample A
Cobalt 0.0100.000449 mg/L
Copper 0.0100.000289 mg/L
Iron 92 70 1300.03092.2 mg/L
Lead 0.0100.000178 mg/L
Manganese 0.0100.000589 mg/L
Nickel 0.0100.000741 mg/L
Silver 0.00500.000178 mg/L
Thallium 0.100.000105 mg/L
Zinc 0.0100.00103 mg/L
Sample ID: ICSAB 07/18/13 09:13Interference Check Sample AB
Aluminum 93 70 1300.1037.2 mg/L
Arsenic 103 70 1300.00500.0103 mg/L
Barium 0 00.108.50E-05 mg/L
Beryllium 0 00.00109.00E-06 mg/L
Cadmium 106 70 1300.00100.0106 mg/L
Chromium 108 70 1300.0100.0215 mg/L
Cobalt 113 70 1300.0100.0227 mg/L
Copper 101 70 1300.0100.0201 mg/L
Iron 94 70 1300.03093.6 mg/L
Lead 0 00.0100.000226 mg/L
Manganese 106 70 1300.0100.0213 mg/L
Nickel 104 70 1300.0100.0209 mg/L
Silver 90 70 1300.00500.0180 mg/L
Thallium 0 00.107.40E-05 mg/L
Zinc 105 70 1300.0100.0105 mg/L
Sample ID: ICV STD 07/18/13 16:56Initial Calibration Verification Standard
Aluminum 99 90 1100.100.296 mg/L
Arsenic 101 90 1100.00500.0608 mg/L
Barium 100 90 1100.100.0600 mg/L
Beryllium 103 90 1100.00100.0310 mg/L
Cadmium 108 90 1100.00100.0323 mg/L
Chromium 102 90 1100.0100.0611 mg/L
Cobalt 104 90 1100.0100.0623 mg/L
Copper 104 90 1100.0100.0623 mg/L
Iron 110 90 1100.0300.331 mg/L
Lead 106 90 1100.0100.0638 mg/L
Manganese 100 90 1100.0100.299 mg/L
Nickel 103 90 1100.0100.0616 mg/L
Silver 101 90 1100.00500.0302 mg/L
Thallium 96 90 1100.100.0577 mg/L
Zinc 107 90 1100.0100.0644 mg/L
Qualifiers:
RL - Analyte reporting limit. ND - Not detected at the reporting limit.
Page 39 of 52

Project: Barker Hughsville Pilot
Client: CDM Federal Programs
Work Order: H13070211
QA/QC Summary Report
07/29/13Report Date:
Analyte Result %REC RPDLow Limit High Limit RPDLimitRLUnits Qual
Prepared by Helena, MT Branch
Method: E200.8 Analytical Run: ICPMS204-B_130716A
Sample ID: ICSA 07/18/13 17:00Interference Check Sample A
Aluminum 94 70 1300.1037.4 mg/L
Arsenic 0.00500.000325 mg/L
Barium 0.100.000273 mg/L
Beryllium 0.00109.00E-06 mg/L
Cadmium 0.00100.00115 mg/L
Chromium 0.0100.00117 mg/L
Cobalt 0.0100.000463 mg/L
Copper 0.0100.000300 mg/L
Iron 97 70 1300.03096.7 mg/L
Lead 0.0100.000179 mg/L
Manganese 0.0100.000597 mg/L
Nickel 0.0100.000687 mg/L
Silver 0.00500.000179 mg/L
Thallium 0.100.000121 mg/L
Zinc 0.0100.00102 mg/L
Sample ID: ICSAB 07/18/13 17:04Interference Check Sample AB
Aluminum 91 70 1300.1036.3 mg/L
Arsenic 103 70 1300.00500.0103 mg/L
Barium 0 00.100.000108 mg/L
Beryllium 0 00.00101.10E-05 mg/L
Cadmium 106 70 1300.00100.0106 mg/L
Chromium 106 70 1300.0100.0212 mg/L
Cobalt 115 70 1300.0100.0230 mg/L
Copper 98 70 1300.0100.0197 mg/L
Iron 93 70 1300.03092.8 mg/L
Lead 0 00.0100.000233 mg/L
Manganese 106 70 1300.0100.0213 mg/L
Nickel 101 70 1300.0100.0202 mg/L
Silver 91 70 1300.00500.0183 mg/L
Thallium 0 00.109.60E-05 mg/L
Zinc 101 70 1300.0100.0101 mg/L
Method: E200.8 Batch: 20955
Sample ID: MB-20955 07/16/13 17:42Method Blank Run: ICPMS204-B_130716A
Aluminum 0.00070.0008 mg/L
Arsenic 0.0002ND mg/L
Barium 0.0002ND mg/L
Beryllium 2E-05ND mg/L
Cadmium 2E-05ND mg/L
Chromium 0.0002ND mg/L
Cobalt 5E-05ND mg/L
Copper 0.0002ND mg/L
Qualifiers:
RL - Analyte reporting limit. ND - Not detected at the reporting limit.
Page 40 of 52

Project: Barker Hughsville Pilot
Client: CDM Federal Programs
Work Order: H13070211
QA/QC Summary Report
07/29/13Report Date:
Analyte Result %REC RPDLow Limit High Limit RPDLimitRLUnits Qual
Prepared by Helena, MT Branch
Method: E200.8 Batch: 20955
Sample ID: MB-20955 07/16/13 17:42Method Blank Run: ICPMS204-B_130716A
Iron 0.002ND mg/L
Lead 3E-05ND mg/L
Manganese 0.0001ND mg/L
Nickel 0.0001ND mg/L
Silver 0.0001ND mg/L
Thallium 5E-05ND mg/L
Zinc 0.0010.002 mg/L
Sample ID: LCS-20955 07/16/13 17:46Laboratory Control Sample Run: ICPMS204-B_130716A
Aluminum 92 85 1150.0302.31 mg/L
Arsenic 101 85 1150.00100.503 mg/L
Barium 92 85 1150.0500.459 mg/L
Beryllium 98 85 1150.00100.245 mg/L
Cadmium 94 85 1150.00100.235 mg/L
Chromium 95 85 1150.00500.473 mg/L
Cobalt 91 85 1150.00500.457 mg/L
Copper 94 85 1150.00500.470 mg/L
Iron 100 85 1150.0302.49 mg/L
Lead 91 85 1150.00100.456 mg/L
Manganese 95 85 1150.00102.37 mg/L
Nickel 102 85 1150.00500.508 mg/L
Silver 97 85 1150.00100.0486 mg/L
Thallium 88 85 1150.000500.439 mg/L
Zinc 102 85 1150.0100.513 mg/L
Sample ID: H13070211-001DMS3 07/16/13 19:10Sample Matrix Spike Run: ICPMS204-B_130716A
Aluminum 88 70 1300.03025.6 mg/L
Arsenic 100 70 1300.00102.83 mg/L
Barium 95 70 1300.0502.39 mg/L
Beryllium 94 70 1300.00101.18 mg/L
Cadmium 86 70 1300.00101.37 mg/L
Chromium 94 70 1300.00502.36 mg/L
Cobalt 88 70 1300.00502.25 mg/L
Copper 87 70 1300.00504.23 mg/L
Iron 70 1300.030189 mg/L A
Lead 93 70 1300.00102.58 mg/L
Manganese 70 1300.0010126 mg/L A
Nickel 101 70 1300.00502.56 mg/L
Silver 97 70 1300.00100.242 mg/L
Thallium 91 70 1300.000502.27 mg/L
Zinc 70 1300.01060.7 mg/L A
Sample ID: H13070211-001DMSD3 07/16/13 19:14Sample Matrix Spike Duplicate Run: ICPMS204-B_130716A
Aluminum 90 70 130 200.030 1.025.9 mg/L
Qualifiers:
RL - Analyte reporting limit. A - The analyte level was greater than four times the spike level. In accordance with the method % recovery is not calculated.
ND - Not detected at the reporting limit.
Page 41 of 52

Project: Barker Hughsville Pilot
Client: CDM Federal Programs
Work Order: H13070211
QA/QC Summary Report
07/29/13Report Date:
Analyte Result %REC RPDLow Limit High Limit RPDLimitRLUnits Qual
Prepared by Helena, MT Branch
Method: E200.8 Batch: 20955
Sample ID: H13070211-001DMSD3 07/16/13 19:14Sample Matrix Spike Duplicate Run: ICPMS204-B_130716A
Arsenic 103 70 130 200.0010 2.52.90 mg/L
Barium 98 70 130 200.050 2.52.45 mg/L
Beryllium 95 70 130 200.0010 0.81.19 mg/L
Cadmium 89 70 130 200.0010 2.61.41 mg/L
Chromium 97 70 130 200.0050 3.22.44 mg/L
Cobalt 90 70 130 200.0050 2.92.32 mg/L
Copper 93 70 130 200.0050 3.04.36 mg/L
Iron 70 130 200.030 4.7198 mg/L A
Lead 94 70 130 200.0010 1.02.60 mg/L
Manganese 70 130 200.0010 3.2130 mg/L A
Nickel 104 70 130 200.0050 3.32.65 mg/L
Silver 99 70 130 200.0010 2.40.248 mg/L
Thallium 91 70 130 200.00050 0.92.29 mg/L
Zinc 70 130 200.010 3.562.8 mg/L A
Method: E200.8 Batch: R89782
Sample ID: ICB 07/16/13 14:56Method Blank Run: ICPMS204-B_130716A
Aluminum 0.00010.001 mg/L
Arsenic 7E-05ND mg/L
Barium 5E-05ND mg/L
Beryllium 2E-05ND mg/L
Cadmium 7E-06ND mg/L
Chromium 4E-05ND mg/L
Cobalt 2E-05ND mg/L
Copper 3E-05ND mg/L
Lead 6E-06ND mg/L
Manganese 8E-05ND mg/L
Nickel 6E-05ND mg/L
Silver 4E-05ND mg/L
Thallium 1E-05ND mg/L
Zinc 0.00030.0005 mg/L
Sample ID: LFB 07/16/13 15:01Laboratory Fortified Blank Run: ICPMS204-B_130716A
Aluminum 99 85 1150.100.0507 mg/L
Arsenic 106 85 1150.00500.0530 mg/L
Barium 103 85 1150.100.0515 mg/L
Beryllium 104 85 1150.00100.0518 mg/L
Cadmium 108 85 1150.00100.0542 mg/L
Chromium 105 85 1150.0100.0524 mg/L
Cobalt 113 85 1150.0100.0563 mg/L
Copper 108 85 1150.0100.0540 mg/L
Lead 109 85 1150.0100.0547 mg/L
Manganese 103 85 1150.0100.0513 mg/L
Qualifiers:
RL - Analyte reporting limit. A - The analyte level was greater than four times the spike level. In accordance with the method % recovery is not calculated.
ND - Not detected at the reporting limit.
Page 42 of 52

Project: Barker Hughsville Pilot
Client: CDM Federal Programs
Work Order: H13070211
QA/QC Summary Report
07/29/13Report Date:
Analyte Result %REC RPDLow Limit High Limit RPDLimitRLUnits Qual
Prepared by Helena, MT Branch
Method: E200.8 Batch: R89782
Sample ID: LFB 07/16/13 15:01Laboratory Fortified Blank Run: ICPMS204-B_130716A
Nickel 108 85 1150.0100.0540 mg/L
Silver 106 85 1150.00500.0213 mg/L
Thallium 99 85 1150.100.0493 mg/L
Zinc 109 85 1150.0100.0553 mg/L
Sample ID: H13070211-008CMS 07/16/13 20:34Sample Matrix Spike Run: ICPMS204-B_130716A
Aluminum 100 70 1300.0300.799 mg/L
Arsenic 70 1300.00105.26 mg/L A
Barium 104 70 1300.0500.797 mg/L
Beryllium 85 70 1300.00100.427 mg/L
Cadmium 87 70 1300.00100.477 mg/L
Chromium 108 70 1300.00500.563 mg/L
Cobalt 107 70 1300.00500.718 mg/L
Copper 105 70 1300.00500.954 mg/L
Lead 113 70 1300.00100.570 mg/L
Manganese 70 1300.00103.68 mg/L A
Nickel 112 70 1300.00501.62 mg/L
Thallium 119 70 1300.000500.594 mg/L
Zinc 97 70 1300.0101.53 mg/L
Sample ID: H13070211-008CMSD 07/16/13 20:38Sample Matrix Spike Duplicate Run: ICPMS204-B_130716A
Aluminum 96 70 130 200.030 2.40.780 mg/L
Arsenic 70 130 200.0010 0.95.30 mg/L A
Barium 105 70 130 200.050 0.30.799 mg/L
Beryllium 85 70 130 200.0010 0.30.425 mg/L
Cadmium 87 70 130 200.0010 0.10.477 mg/L
Chromium 107 70 130 200.0050 0.60.560 mg/L
Cobalt 106 70 130 200.0050 0.50.714 mg/L
Copper 104 70 130 200.0050 0.30.951 mg/L
Lead 113 70 130 200.0010 0.10.571 mg/L
Manganese 70 130 200.0010 0.83.71 mg/L A
Nickel 113 70 130 200.0050 0.21.62 mg/L
Thallium 120 70 130 200.00050 0.90.599 mg/L
Zinc 98 70 130 200.010 0.11.53 mg/L
Sample ID: ICB 07/17/13 16:01Method Blank Run: ICPMS204-B_130716A
Aluminum 0.00010.0005 mg/L
Arsenic 7E-05ND mg/L
Barium 5E-05ND mg/L
Beryllium 2E-05ND mg/L
Cadmium 7E-06ND mg/L
Chromium 4E-05ND mg/L
Cobalt 2E-05ND mg/L
Copper 3E-050.0004 mg/L
Qualifiers:
RL - Analyte reporting limit. A - The analyte level was greater than four times the spike level. In accordance with the method % recovery is not calculated.
ND - Not detected at the reporting limit.
Page 43 of 52

Project: Barker Hughsville Pilot
Client: CDM Federal Programs
Work Order: H13070211
QA/QC Summary Report
07/29/13Report Date:
Analyte Result %REC RPDLow Limit High Limit RPDLimitRLUnits Qual
Prepared by Helena, MT Branch
Method: E200.8 Batch: R89782
Sample ID: ICB 07/17/13 16:01Method Blank Run: ICPMS204-B_130716A
Lead 6E-064E-05 mg/L
Manganese 8E-05ND mg/L
Nickel 6E-05ND mg/L
Silver 4E-05ND mg/L
Thallium 1E-05ND mg/L
Zinc 0.00030.002 mg/L
Sample ID: LFB 07/17/13 16:05Laboratory Fortified Blank Run: ICPMS204-B_130716A
Aluminum 99 85 1150.100.0500 mg/L
Arsenic 101 85 1150.00500.0503 mg/L
Barium 99 85 1150.100.0494 mg/L
Beryllium 100 85 1150.00100.0501 mg/L
Cadmium 106 85 1150.00100.0530 mg/L
Chromium 99 85 1150.0100.0497 mg/L
Cobalt 101 85 1150.0100.0504 mg/L
Copper 101 85 1150.0100.0511 mg/L
Lead 106 85 1150.0100.0532 mg/L
Manganese 97 85 1150.0100.0487 mg/L
Nickel 101 85 1150.0100.0506 mg/L
Silver 100 85 1150.00500.0200 mg/L
Thallium 98 85 1150.100.0490 mg/L
Zinc 102 85 1150.0100.0529 mg/L
Sample ID: H13070211-008CMS 07/18/13 05:40Sample Matrix Spike Run: ICPMS204-B_130716A
Aluminum 96 70 1300.0302.92 mg/L
Arsenic 111 70 1300.00336.58 mg/L
Barium 106 70 1300.0502.95 mg/L
Beryllium 96 70 1300.00102.40 mg/L
Cadmium 101 70 1300.00102.59 mg/L
Chromium 100 70 1300.00502.53 mg/L
Cobalt 112 70 1300.00503.02 mg/L
Copper 101 70 1300.00503.00 mg/L
Lead 111 70 1300.00102.77 mg/L
Manganese 103 70 1300.00385.72 mg/L
Nickel 101 70 1300.00503.64 mg/L
Silver 65 70 1300.00200.654 mg/L S
Thallium 110 70 1300.000562.74 mg/L
Zinc 99 70 1300.0173.70 mg/L
Sample ID: H13070211-008CMSD 07/18/13 05:44Sample Matrix Spike Duplicate Run: ICPMS204-B_130716A
Aluminum 92 70 130 200.030 4.22.80 mg/L
Arsenic 110 70 130 200.0033 0.56.54 mg/L
Barium 103 70 130 200.050 2.92.86 mg/L
Beryllium 92 70 130 200.0010 4.12.31 mg/L
Qualifiers:
RL - Analyte reporting limit. ND - Not detected at the reporting limit.
S - Spike recovery outside of advisory limits.
Page 44 of 52
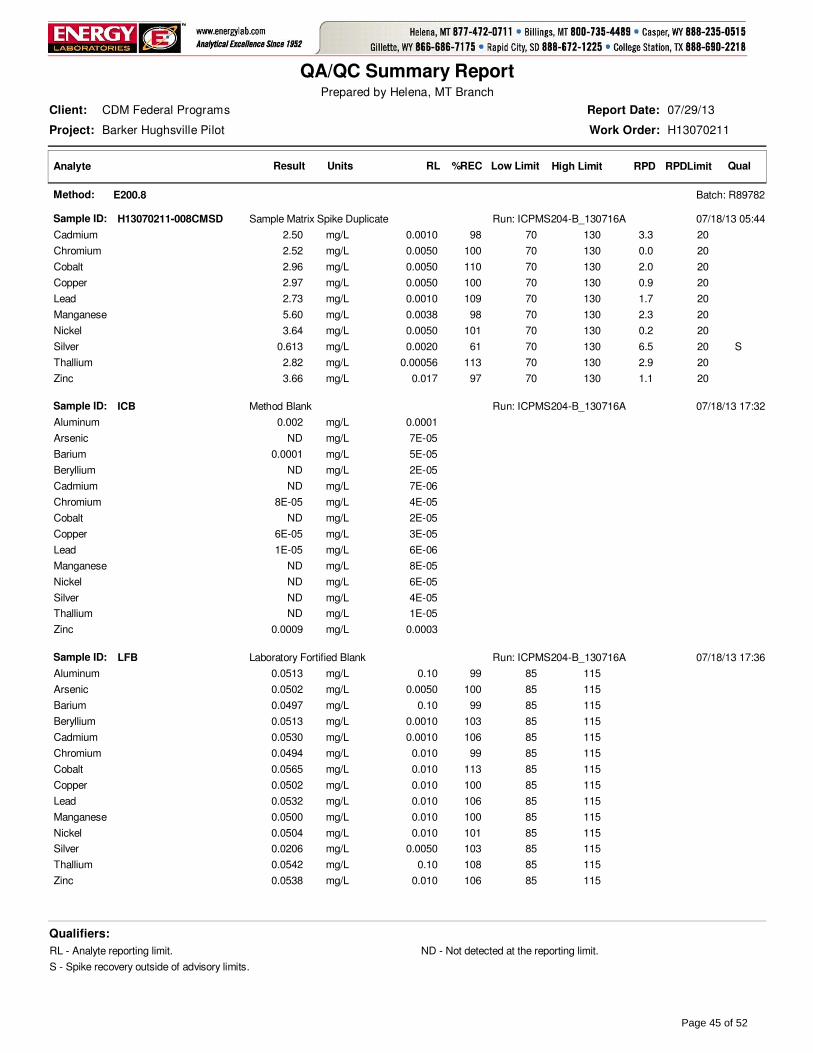
Project: Barker Hughsville Pilot
Client: CDM Federal Programs
Work Order: H13070211
QA/QC Summary Report
07/29/13Report Date:
Analyte Result %REC RPDLow Limit High Limit RPDLimitRLUnits Qual
Prepared by Helena, MT Branch
Method: E200.8 Batch: R89782
Sample ID: H13070211-008CMSD 07/18/13 05:44Sample Matrix Spike Duplicate Run: ICPMS204-B_130716A
Cadmium 98 70 130 200.0010 3.32.50 mg/L
Chromium 100 70 130 200.0050 0.02.52 mg/L
Cobalt 110 70 130 200.0050 2.02.96 mg/L
Copper 100 70 130 200.0050 0.92.97 mg/L
Lead 109 70 130 200.0010 1.72.73 mg/L
Manganese 98 70 130 200.0038 2.35.60 mg/L
Nickel 101 70 130 200.0050 0.23.64 mg/L
Silver 61 70 130 200.0020 6.50.613 mg/L S
Thallium 113 70 130 200.00056 2.92.82 mg/L
Zinc 97 70 130 200.017 1.13.66 mg/L
Sample ID: ICB 07/18/13 17:32Method Blank Run: ICPMS204-B_130716A
Aluminum 0.00010.002 mg/L
Arsenic 7E-05ND mg/L
Barium 5E-050.0001 mg/L
Beryllium 2E-05ND mg/L
Cadmium 7E-06ND mg/L
Chromium 4E-058E-05 mg/L
Cobalt 2E-05ND mg/L
Copper 3E-056E-05 mg/L
Lead 6E-061E-05 mg/L
Manganese 8E-05ND mg/L
Nickel 6E-05ND mg/L
Silver 4E-05ND mg/L
Thallium 1E-05ND mg/L
Zinc 0.00030.0009 mg/L
Sample ID: LFB 07/18/13 17:36Laboratory Fortified Blank Run: ICPMS204-B_130716A
Aluminum 99 85 1150.100.0513 mg/L
Arsenic 100 85 1150.00500.0502 mg/L
Barium 99 85 1150.100.0497 mg/L
Beryllium 103 85 1150.00100.0513 mg/L
Cadmium 106 85 1150.00100.0530 mg/L
Chromium 99 85 1150.0100.0494 mg/L
Cobalt 113 85 1150.0100.0565 mg/L
Copper 100 85 1150.0100.0502 mg/L
Lead 106 85 1150.0100.0532 mg/L
Manganese 100 85 1150.0100.0500 mg/L
Nickel 101 85 1150.0100.0504 mg/L
Silver 103 85 1150.00500.0206 mg/L
Thallium 108 85 1150.100.0542 mg/L
Zinc 106 85 1150.0100.0538 mg/L
Qualifiers:
RL - Analyte reporting limit. ND - Not detected at the reporting limit.
S - Spike recovery outside of advisory limits.
Page 45 of 52

Project: Barker Hughsville Pilot
Client: CDM Federal Programs
Work Order: H13070211
QA/QC Summary Report
07/29/13Report Date:
Analyte Result %REC RPDLow Limit High Limit RPDLimitRLUnits Qual
Prepared by Helena, MT Branch
Method: E200.8 Batch: R89782
Sample ID: H13070185-001BMS 07/19/13 00:52Sample Matrix Spike Run: ICPMS204-B_130716A
Aluminum 97 70 1300.0301.01 mg/L
Arsenic 98 70 1300.00130.983 mg/L
Barium 101 70 1300.0501.03 mg/L
Beryllium 93 70 1300.00100.934 mg/L
Cadmium 94 70 1300.00100.939 mg/L
Chromium 98 70 1300.00500.978 mg/L
Cobalt 115 70 1300.00501.15 mg/L
Copper 100 70 1300.00501.00 mg/L
Lead 110 70 1300.00101.10 mg/L
Manganese 105 70 1300.00151.08 mg/L
Nickel 97 70 1300.00501.04 mg/L
Silver 89 70 1300.00100.356 mg/L
Thallium 112 70 1300.000501.12 mg/L
Zinc 91 70 1300.0100.939 mg/L
Sample ID: H13070185-001BMSD 07/19/13 00:56Sample Matrix Spike Duplicate Run: ICPMS204-B_130716A
Aluminum 96 70 130 200.030 0.31.01 mg/L
Arsenic 101 70 130 200.0013 2.71.01 mg/L
Barium 101 70 130 200.050 0.21.03 mg/L
Beryllium 93 70 130 200.0010 0.70.928 mg/L
Cadmium 94 70 130 200.0010 0.40.935 mg/L
Chromium 101 70 130 200.0050 2.81.01 mg/L
Cobalt 113 70 130 200.0050 1.11.14 mg/L
Copper 98 70 130 200.0050 1.90.984 mg/L
Lead 109 70 130 200.0010 0.91.09 mg/L
Manganese 104 70 130 200.0015 0.61.08 mg/L
Nickel 98 70 130 200.0050 0.91.05 mg/L
Silver 90 70 130 200.0010 1.10.360 mg/L
Thallium 112 70 130 200.00050 0.21.12 mg/L
Zinc 92 70 130 200.010 1.10.949 mg/L
Qualifiers:
RL - Analyte reporting limit. ND - Not detected at the reporting limit.
Page 46 of 52

Project: Barker Hughsville Pilot
Client: CDM Federal Programs
Work Order: H13070211
QA/QC Summary Report
07/29/13Report Date:
Analyte Result %REC RPDLow Limit High Limit RPDLimitRLUnits Qual
Prepared by Helena, MT Branch
Method: E300.0 Analytical Run: IC102-H_130715A
Sample ID: ICV 07/15/13 10:08Initial Calibration Verification Standard
Chloride 102 90 1101.0100 mg/L
Sulfate 100 90 1101.0400 mg/L
Sample ID: CCV071513-2 07/15/13 13:43Continuing Calibration Verification Standard
Chloride 100 90 1101.0100 mg/L
Sulfate 100 90 1101.0400 mg/L
Method: E300.0 Batch: R89737
Sample ID: ICB 07/15/13 10:21Method Blank Run: IC102-H_130715A
Chloride 0.008ND mg/L
Sulfate 0.080.5 mg/L
Sample ID: LFB 07/15/13 10:34Laboratory Fortified Blank Run: IC102-H_130715A
Chloride 99 90 1101.049 mg/L
Sulfate 99 90 1101.0200 mg/L
Sample ID: H13070207-008AMS 07/15/13 16:52Sample Matrix Spike Run: IC102-H_130715A
Chloride 101 90 1101.051 mg/L
Sulfate 102 90 1101.0200 mg/L
Sample ID: H13070207-008AMSD 07/15/13 17:04Sample Matrix Spike Duplicate Run: IC102-H_130715A
Chloride 102 90 110 201.0 0.851 mg/L
Sulfate 103 90 110 201.0 0.5210 mg/L
Qualifiers:
RL - Analyte reporting limit. ND - Not detected at the reporting limit.
Page 47 of 52

Project: Barker Hughsville Pilot
Client: CDM Federal Programs
Work Order: H13070211
QA/QC Summary Report
07/29/13Report Date:
Analyte Result %REC RPDLow Limit High Limit RPDLimitRLUnits Qual
Prepared by Helena, MT Branch
Method: E300.0 Analytical Run: IC102-H_130716A
Sample ID: ICV 07/16/13 13:59Initial Calibration Verification Standard
Chloride 102 90 1101.0100 mg/L
Sulfate 101 90 1101.0400 mg/L
Sample ID: CCV071613-1 07/16/13 14:37Continuing Calibration Verification Standard
Chloride 99 90 1101.099 mg/L
Sulfate 100 90 1101.0400 mg/L
Method: E300.0 Batch: R89776
Sample ID: ICB 07/16/13 14:12Method Blank Run: IC102-H_130716A
Chloride 0.008ND mg/L
Sulfate 0.08ND mg/L
Sample ID: LFB 07/16/13 14:25Laboratory Fortified Blank Run: IC102-H_130716A
Chloride 104 90 1101.052 mg/L
Sulfate 105 90 1101.0210 mg/L
Sample ID: H13070211-002AMS 07/16/13 15:28Sample Matrix Spike Run: IC102-H_130716A
Chloride 100 90 1101.4250 mg/L
Sulfate 67 90 1101.02300 mg/L S
Sample ID: H13070211-002AMSD 07/16/13 15:40Sample Matrix Spike Duplicate Run: IC102-H_130716A
Chloride 96 90 110 201.4 3.1240 mg/L
Sulfate 69 90 110 201.0 0.72300 mg/L S
Qualifiers:
RL - Analyte reporting limit. ND - Not detected at the reporting limit.
S - Spike recovery outside of advisory limits.
Page 48 of 52

Project: Barker Hughsville Pilot
Client: CDM Federal Programs
Work Order: H13070211
QA/QC Summary Report
07/29/13Report Date:
Analyte Result %REC RPDLow Limit High Limit RPDLimitRLUnits Qual
Prepared by Helena, MT Branch
Method: E365.1 Analytical Run: FIA202-HE_130712C
Sample ID: ICV 07/12/13 14:15Initial Calibration Verification Standard
Phosphorus, Orthophosphate as P 96 90 1100.00500.240 mg/L
Sample ID: ICB 07/12/13 14:16Initial Calibration Blank, Instrument Blank
Phosphorus, Orthophosphate as P 0 00.0050-0.00194 mg/L
Sample ID: CCV 07/12/13 14:18Continuing Calibration Verification Standard
Phosphorus, Orthophosphate as P 104 90 1100.00500.104 mg/L
Sample ID: CCV 07/12/13 14:34Continuing Calibration Verification Standard
Phosphorus, Orthophosphate as P 108 90 1100.00500.108 mg/L
Method: E365.1 Batch: R89703
Sample ID: LFB 07/12/13 14:17Laboratory Fortified Blank Run: FIA202-HE_130712C
Phosphorus, Orthophosphate as P 102 90 1100.00500.204 mg/L
Sample ID: H13070209-001AMS 07/12/13 14:21Sample Matrix Spike Run: FIA202-HE_130712C
Phosphorus, Orthophosphate as P 101 90 1100.00500.221 mg/L
Sample ID: H13070209-001AMSD 07/12/13 14:22Sample Matrix Spike Duplicate Run: FIA202-HE_130712C
Phosphorus, Orthophosphate as P 103 90 110 200.0050 1.20.224 mg/L
Method: E365.1 Analytical Run: FIA202-HE_130712D
Sample ID: ICV 07/12/13 16:42Initial Calibration Verification Standard
Phosphorus, Orthophosphate as P 94 90 1100.00500.235 mg/L
Sample ID: ICB 07/12/13 16:43Initial Calibration Blank, Instrument Blank
Phosphorus, Orthophosphate as P 0 00.0050-0.00170 mg/L
Sample ID: CCV 07/12/13 16:45Continuing Calibration Verification Standard
Phosphorus, Orthophosphate as P 92 90 1100.00500.0918 mg/L
Sample ID: CCV 07/12/13 16:56Continuing Calibration Verification Standard
Phosphorus, Orthophosphate as P 93 90 1100.00500.0931 mg/L
Method: E365.1 Batch: R89708
Sample ID: H13070211-007AMS 07/12/13 16:48Sample Matrix Spike Run: FIA202-HE_130712D
Phosphorus, Orthophosphate as P 115 90 1100.00500.299 mg/L S
Sample ID: H13070211-007AMSD 07/12/13 16:49Sample Matrix Spike Duplicate Run: FIA202-HE_130712D
Phosphorus, Orthophosphate as P 119 90 110 200.0050 2.40.307 mg/L S
Sample ID: LFB 07/12/13 16:50Laboratory Fortified Blank Run: FIA202-HE_130712D
Phosphorus, Orthophosphate as P 97 90 1100.00500.195 mg/L
Qualifiers:
RL - Analyte reporting limit. ND - Not detected at the reporting limit.
S - Spike recovery outside of advisory limits.
Page 49 of 52

Shipping container/cooler in good condition?
Custody seals intact on all shipping container(s)/cooler(s)?
Custody seals intact on all sample bottles?
Chain of custody present?
Chain of custody signed when relinquished and received?
Chain of custody agrees with sample labels?
Samples in proper container/bottle?
Sample containers intact?
Sufficient sample volume for indicated test?
All samples received within holding time?(Exclude analyses that are considered field parameterssuch as pH, DO, Res Cl, Sulfite, Ferrous Iron, etc.)
Container/Temp Blank temperature:
Water - VOA vials have zero headspace?
Water - pH acceptable upon receipt?
Yes
Yes
Yes
Yes
Yes
Yes
Yes
Yes
Yes
Yes
Yes
Yes
No
No
No
No
No
No
No
No
No
No
No
No
� �
�
�
�
�
�
�
�
�
�
�
�
�
�
�
�
�
�
�
�
�
�
�
Not Present
Not Present
Not Present
�
�
�
No VOA vials submitted
Not Applicable �
�
5.4°C On Ice
7/12/2013Tracy L. Lorash
Hand Del
TLL
Date Received:
Received by:
Login completed by:
Carrier name:
BL2000\sdull
7/19/2013
Reviewed by:
Reviewed Date:
Contact and Corrective Action Comments:
No collection time on the following bottles; INFL total metals, all sulfides, all of MGOH and BCR1 - took from COC. BCR3 Total Metals sample was preserved with 2 mL nitric acid upon receipt to pH <2 in the laboratory. In accordance with the Clean Water Act, these samples must be held for 24 hours prior to analysis.BCR3 Dissolved Metals sample was preserved with 2 mL nitric acid upon receipt to pH <2 in the laboratory.CHIT Total Metals sample was preserved with 8 mL nitric acid upon receipt in the laboratory; however, due to sample matrix we were unable to reach a pH of <2. In accordance with the Clean Water Act, these samples must be held for 24 hours prior to analysis.CHIT Dissolved Metals sample was preserved with 8 mL nitric acid upon receipt in the laboratory; however, due to sample matrix we were unable to reach a pH of <2. Tl 7/12/13
Temp Blank received in all shipping container(s)/cooler(s)? Yes No� � Not Applicable �
Workorder Receipt Checklist
CDM Federal Programs H13070211
Lab measurement of analytes considered field parameters that require analysis within 15 minutes of sampling such as pH, Dissolved Oxygen and Residual Chlorine, are qualified as being analyzed outside of recommended holding time.
Solid/soil samples are reported on a wet weight basis (as received) unless specifically indicated. If moisture corrected, data units are typically noted as –dry. For agricultural and mining soil parameters/characteristics, all samples are dried and ground prior to sample analysis.
Standard Reporting Procedures
Page 50 of 52

Page 51 of 52
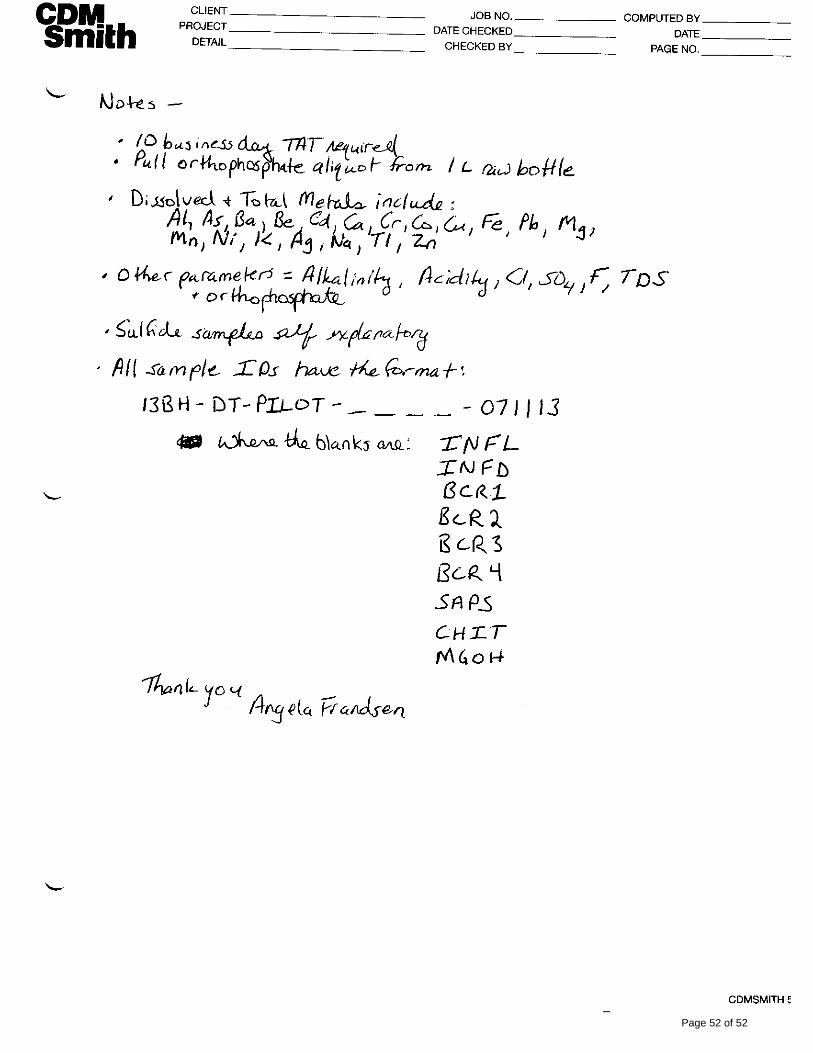
Page 52 of 52
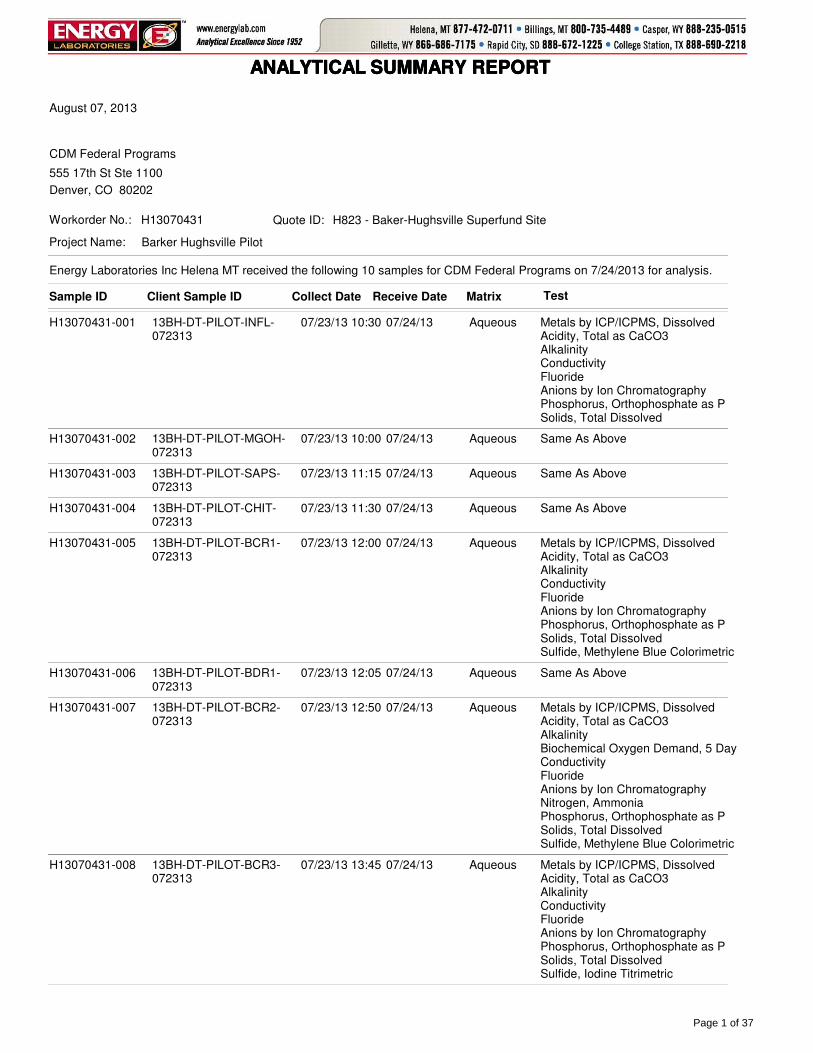
ANALYTICAL SUMMARY REPORTANALYTICAL SUMMARY REPORTANALYTICAL SUMMARY REPORTANALYTICAL SUMMARY REPORT
Sample ID Client Sample ID Collect Date Receive Date Matrix Test
H13070431-001 13BH-DT-PILOT-INFL-072313
07/23/13 10:30 07/24/13 Aqueous Metals by ICP/ICPMS, DissolvedAcidity, Total as CaCO3AlkalinityConductivityFluorideAnions by Ion ChromatographyPhosphorus, Orthophosphate as PSolids, Total Dissolved
H13070431-002 13BH-DT-PILOT-MGOH-072313
07/23/13 10:00 07/24/13 Aqueous Same As Above
H13070431-003 13BH-DT-PILOT-SAPS-072313
07/23/13 11:15 07/24/13 Aqueous Same As Above
H13070431-004 13BH-DT-PILOT-CHIT-072313
07/23/13 11:30 07/24/13 Aqueous Same As Above
H13070431-005 13BH-DT-PILOT-BCR1-072313
07/23/13 12:00 07/24/13 Aqueous Metals by ICP/ICPMS, DissolvedAcidity, Total as CaCO3AlkalinityConductivityFluorideAnions by Ion ChromatographyPhosphorus, Orthophosphate as PSolids, Total DissolvedSulfide, Methylene Blue Colorimetric
H13070431-006 13BH-DT-PILOT-BDR1-072313
07/23/13 12:05 07/24/13 Aqueous Same As Above
H13070431-007 13BH-DT-PILOT-BCR2-072313
07/23/13 12:50 07/24/13 Aqueous Metals by ICP/ICPMS, DissolvedAcidity, Total as CaCO3AlkalinityBiochemical Oxygen Demand, 5 DayConductivityFluorideAnions by Ion ChromatographyNitrogen, AmmoniaPhosphorus, Orthophosphate as PSolids, Total DissolvedSulfide, Methylene Blue Colorimetric
H13070431-008 13BH-DT-PILOT-BCR3-072313
07/23/13 13:45 07/24/13 Aqueous Metals by ICP/ICPMS, DissolvedAcidity, Total as CaCO3AlkalinityConductivityFluorideAnions by Ion ChromatographyPhosphorus, Orthophosphate as PSolids, Total DissolvedSulfide, Iodine Titrimetric
CDM Federal Programs
Project Name: Barker Hughsville Pilot
Workorder No.: H13070431
555 17th St Ste 1100
Denver, CO 80202
August 07, 2013
H823 - Baker-Hughsville Superfund SiteQuote ID:
Energy Laboratories Inc Helena MT received the following 10 samples for CDM Federal Programs on 7/24/2013 for analysis.
Page 1 of 37

ANALYTICAL SUMMARY REPORTANALYTICAL SUMMARY REPORTANALYTICAL SUMMARY REPORTANALYTICAL SUMMARY REPORT
The analyses presented in this report were performed by Energy Laboratories, Inc., 3161 E. Lyndale Ave., Helena, MT 59604, unless otherwise noted. Any exceptions or problems with the analyses are noted in the Laboratory Analytical Report, the QA/QC Summary Report, or the Case Narrative.
The results as reported relate only to the item(s) submitted for testing.
If you have any questions regarding these test results, please call.
Report Approved By:
H13070431-009 13BH-DT-PILOT-BCR4-072313
07/23/13 14:15 07/24/13 Aqueous Metals by ICP/ICPMS, DissolvedAcidity, Total as CaCO3AlkalinityConductivityFluorideAnions by Ion ChromatographyPhosphorus, Orthophosphate as PSolids, Total DissolvedSulfide, Methylene Blue Colorimetric
H13070431-010 13BH-DT-PILOT-BCR2-POST
07/23/13 14:45 07/24/13 Aqueous Biochemical Oxygen Demand, 5 DayNitrogen, AmmoniaSulfide, Methylene Blue Colorimetric
Page 2 of 37

Project: Barker Hughsville Pilot
CLIENT: CDM Federal Programs
Sample Delivery Group: H13070431 CASE NARRATIVE
08/07/13Report Date:
Tests associated with analyst identified as ELI-B were subcontracted to Energy Laboratories, 1120 S. 27th St., Billings, MT, EPA Number MT00005.
Page 3 of 37

LABORATORY ANALYTICAL REPORT
Client: CDM Federal Programs
Project: Barker Hughsville Pilot
Lab ID: H13070431-001
Client Sample ID 13BH-DT-PILOT-INFL-072313
Collection Date: 07/23/13 10:30
Matrix: Aqueous
Report Date: 08/07/13
DateReceived: 07/24/13
Prepared by Helena, MT Branch
Analyses Result Units Analysis Date / ByRL Method
MCL/QCLQualifiers
PHYSICAL PROPERTIES
07/24/13 13:58 / glj10mg/L1860Solids, Total Dissolved TDS @ 180 C A2540 C
INORGANICS
D 08/05/13 09:00 / cmm4.0mg/L820Acidity, Total as CaCO3 A2310 B
07/24/13 17:35 / cmm1mg/LNDAlkalinity, Total as CaCO3 A2320 B
07/24/13 17:35 / cmm1mg/LNDBicarbonate as HCO3 A2320 B
07/24/13 17:35 / cmm1mg/LNDCarbonate as CO3 A2320 B
07/24/13 17:35 / cmm1mg/LNDHydroxide as OH A2320 B
07/25/13 13:55 / cmm1mg/L1Chloride E300.0
07/25/13 13:55 / cmm1mg/L2000Sulfate E300.0
08/05/13 15:35 / cmm0.1mg/L0.2Fluoride A4500-F C4
NUTRIENTS
D 07/24/13 10:51 / reh0.01mg/L0.28Phosphorus, Orthophosphate as P E365.1
METALS, DISSOLVED
07/25/13 14:51 / sld0.03mg/L14.9Aluminum E200.7
07/24/13 23:03 / raw0.001mg/L0.278Arsenic E200.8
07/24/13 23:03 / raw0.05mg/LNDBarium E200.8
07/24/13 23:03 / raw0.001mg/L0.008Beryllium E200.8
07/24/13 23:03 / raw0.001mg/L0.298Cadmium E200.8
07/24/13 23:03 / raw1mg/L106Calcium E200.8
07/24/13 23:03 / raw0.005mg/L0.006Chromium E200.8
07/25/13 21:25 / dck0.005mg/L0.048Cobalt E200.8
07/24/13 23:03 / raw0.005mg/L1.94Copper E200.8
07/24/13 23:03 / raw0.03mg/L179Iron E200.8
07/24/13 23:03 / raw0.001mg/L0.212Lead E200.8
07/24/13 23:03 / raw1mg/L25Magnesium E200.8
D 07/26/13 10:38 / sld0.003mg/L128Manganese E200.7
07/24/13 23:03 / raw0.005mg/L0.037Nickel E200.8
07/24/13 23:03 / raw1mg/L1Potassium E200.8
07/24/13 23:03 / raw0.001mg/LNDSilver E200.8
07/24/13 23:03 / raw1mg/L7Sodium E200.8
07/24/13 23:03 / raw0.0005mg/L0.0022Thallium E200.8
07/25/13 14:51 / sld0.01mg/L57.4Zinc E200.7
ReportDefinitions:
RL - Analyte reporting limit. MCL - Maximum contaminant level.
QCL - Quality control limit. ND - Not detected at the reporting limit.
D - RL increased due to sample matrix.
Page 4 of 37

LABORATORY ANALYTICAL REPORT
Client: CDM Federal Programs
Project: Barker Hughsville Pilot
Lab ID: H13070431-002
Client Sample ID 13BH-DT-PILOT-MGOH-072313
Collection Date: 07/23/13 10:00
Matrix: Aqueous
Report Date: 08/07/13
DateReceived: 07/24/13
Prepared by Helena, MT Branch
Analyses Result Units Analysis Date / ByRL Method
MCL/QCLQualifiers
PHYSICAL PROPERTIES
07/24/13 13:58 / glj10mg/L1810Solids, Total Dissolved TDS @ 180 C A2540 C
INORGANICS
D 08/05/13 09:00 / cmm4.0mg/L390Acidity, Total as CaCO3 A2310 B
07/24/13 17:39 / cmm1mg/LNDAlkalinity, Total as CaCO3 A2320 B
07/24/13 17:39 / cmm1mg/LNDBicarbonate as HCO3 A2320 B
07/24/13 17:39 / cmm1mg/LNDCarbonate as CO3 A2320 B
07/24/13 17:39 / cmm1mg/LNDHydroxide as OH A2320 B
07/25/13 14:08 / cmm1mg/L4Chloride E300.0
07/25/13 14:08 / cmm1mg/L1600Sulfate E300.0
D 08/05/13 15:43 / cmm0.2mg/L1.5Fluoride A4500-F C4
NUTRIENTS
D 07/24/13 10:52 / reh0.01mg/L0.10Phosphorus, Orthophosphate as P E365.1
METALS, DISSOLVED
07/25/13 14:55 / sld0.03mg/L7.52Aluminum E200.7
07/24/13 23:07 / raw0.001mg/L0.004Arsenic E200.8
07/24/13 23:07 / raw0.05mg/LNDBarium E200.8
07/24/13 23:07 / raw0.001mg/L0.005Beryllium E200.8
07/24/13 23:07 / raw0.001mg/L0.280Cadmium E200.8
07/24/13 23:07 / raw1mg/L111Calcium E200.8
07/24/13 23:07 / raw0.005mg/LNDChromium E200.8
07/25/13 21:30 / dck0.005mg/L0.047Cobalt E200.8
07/24/13 23:07 / raw0.005mg/L1.40Copper E200.8
07/24/13 23:07 / raw0.03mg/L0.47Iron E200.8
07/24/13 23:07 / raw0.001mg/L0.023Lead E200.8
07/24/13 23:07 / raw1mg/L149Magnesium E200.8
D 07/26/13 10:59 / sld0.003mg/L122Manganese E200.7
07/24/13 23:07 / raw0.005mg/L0.036Nickel E200.8
07/24/13 23:07 / raw1mg/L1Potassium E200.8
07/24/13 23:07 / raw0.001mg/LNDSilver E200.8
07/24/13 23:07 / raw1mg/L9Sodium E200.8
07/24/13 23:07 / raw0.0005mg/L0.0022Thallium E200.8
07/25/13 14:55 / sld0.01mg/L52.8Zinc E200.7
ReportDefinitions:
RL - Analyte reporting limit. MCL - Maximum contaminant level.
QCL - Quality control limit. ND - Not detected at the reporting limit.
D - RL increased due to sample matrix.
Page 5 of 37

LABORATORY ANALYTICAL REPORT
Client: CDM Federal Programs
Project: Barker Hughsville Pilot
Lab ID: H13070431-003
Client Sample ID 13BH-DT-PILOT-SAPS-072313
Collection Date: 07/23/13 11:15
Matrix: Aqueous
Report Date: 08/07/13
DateReceived: 07/24/13
Prepared by Helena, MT Branch
Analyses Result Units Analysis Date / ByRL Method
MCL/QCLQualifiers
PHYSICAL PROPERTIES
07/24/13 13:58 / glj10mg/L1950Solids, Total Dissolved TDS @ 180 C A2540 C
INORGANICS
D 08/05/13 09:00 / cmm4.0mg/L440Acidity, Total as CaCO3 A2310 B
07/24/13 17:45 / cmm1mg/L10Alkalinity, Total as CaCO3 A2320 B
07/24/13 17:45 / cmm1mg/L12Bicarbonate as HCO3 A2320 B
07/24/13 17:45 / cmm1mg/LNDCarbonate as CO3 A2320 B
07/24/13 17:45 / cmm1mg/LNDHydroxide as OH A2320 B
07/30/13 15:33 / abb1mg/LNDChloride E300.0
07/31/13 11:24 / jaw1mg/L1500Sulfate E300.0
D 08/05/13 15:48 / cmm0.2mg/L1.4Fluoride A4500-F C4
NUTRIENTS
D 07/24/13 11:43 / reh0.01mg/L0.07Phosphorus, Orthophosphate as P E365.1
METALS, DISSOLVED
07/24/13 23:12 / raw0.03mg/L1.44Aluminum E200.8
07/24/13 23:12 / raw0.001mg/L0.005Arsenic E200.8
07/24/13 23:12 / raw0.05mg/L0.09Barium E200.8
07/24/13 23:12 / raw0.001mg/L0.001Beryllium E200.8
07/24/13 23:12 / raw0.001mg/L0.045Cadmium E200.8
07/24/13 23:12 / raw1mg/L267Calcium E200.8
07/24/13 23:12 / raw0.005mg/LNDChromium E200.8
07/25/13 21:34 / dck0.005mg/L0.062Cobalt E200.8
07/24/13 23:12 / raw0.005mg/L0.007Copper E200.8
07/24/13 23:12 / raw0.03mg/L108Iron E200.8
07/24/13 23:12 / raw0.001mg/LNDLead E200.8
07/24/13 23:12 / raw1mg/L28Magnesium E200.8
D 07/26/13 11:03 / sld0.003mg/L135Manganese E200.7
07/24/13 23:12 / raw0.005mg/L0.037Nickel E200.8
07/24/13 23:12 / raw1mg/L2Potassium E200.8
07/24/13 23:12 / raw0.001mg/LNDSilver E200.8
07/24/13 23:12 / raw1mg/L7Sodium E200.8
07/24/13 23:12 / raw0.0005mg/LNDThallium E200.8
07/25/13 14:59 / sld0.01mg/L42.9Zinc E200.7
ReportDefinitions:
RL - Analyte reporting limit. MCL - Maximum contaminant level.
QCL - Quality control limit. ND - Not detected at the reporting limit.
D - RL increased due to sample matrix.
Page 6 of 37

LABORATORY ANALYTICAL REPORT
Client: CDM Federal Programs
Project: Barker Hughsville Pilot
Lab ID: H13070431-004
Client Sample ID 13BH-DT-PILOT-CHIT-072313
Collection Date: 07/23/13 11:30
Matrix: Aqueous
Report Date: 08/07/13
DateReceived: 07/24/13
Prepared by Helena, MT Branch
Analyses Result Units Analysis Date / ByRL Method
MCL/QCLQualifiers
PHYSICAL PROPERTIES
07/24/13 13:59 / glj10mg/L3980Solids, Total Dissolved TDS @ 180 C A2540 C
INORGANICS
D 08/05/13 09:00 / cmm4.0mg/LNDAcidity, Total as CaCO3 A2310 B
07/24/13 17:58 / cmm1mg/L1800Alkalinity, Total as CaCO3 A2320 B
07/24/13 17:58 / cmm1mg/L2200Bicarbonate as HCO3 A2320 B
07/24/13 17:58 / cmm1mg/LNDCarbonate as CO3 A2320 B
07/24/13 17:58 / cmm1mg/LNDHydroxide as OH A2320 B
D 07/30/13 15:45 / abb5mg/L37Chloride E300.0
D 07/30/13 15:45 / abb2mg/L1100Sulfate E300.0
08/05/13 15:49 / cmm0.1mg/L0.1Fluoride A4500-F C4
NUTRIENTS
D 07/24/13 10:54 / reh0.1mg/L12.5Phosphorus, Orthophosphate as P E365.1
METALS, DISSOLVED
07/24/13 23:16 / raw0.03mg/LNDAluminum E200.8
07/24/13 23:16 / raw0.001mg/L0.024Arsenic E200.8
07/24/13 23:16 / raw0.05mg/L0.05Barium E200.8
07/24/13 23:16 / raw0.001mg/LNDBeryllium E200.8
07/24/13 23:16 / raw0.001mg/LNDCadmium E200.8
07/24/13 23:16 / raw1mg/L926Calcium E200.8
07/24/13 23:16 / raw0.005mg/LNDChromium E200.8
07/29/13 14:55 / dck0.005mg/L0.006Cobalt E200.8
07/24/13 23:16 / raw0.005mg/LNDCopper E200.8
07/24/13 23:16 / raw0.03mg/L0.82Iron E200.8
07/24/13 23:16 / raw0.001mg/LNDLead E200.8
07/24/13 23:16 / raw1mg/L60Magnesium E200.8
D 07/25/13 15:03 / sld0.003mg/L8.88Manganese E200.7
07/24/13 23:16 / raw0.005mg/L0.009Nickel E200.8
07/24/13 23:16 / raw1mg/L10Potassium E200.8
07/24/13 23:16 / raw0.001mg/LNDSilver E200.8
07/24/13 23:16 / raw1mg/L42Sodium E200.8
07/24/13 23:16 / raw0.0005mg/LNDThallium E200.8
07/24/13 23:16 / raw0.01mg/L0.02Zinc E200.8
ReportDefinitions:
RL - Analyte reporting limit. MCL - Maximum contaminant level.
QCL - Quality control limit. ND - Not detected at the reporting limit.
D - RL increased due to sample matrix.
Page 7 of 37

LABORATORY ANALYTICAL REPORT
Client: CDM Federal Programs
Project: Barker Hughsville Pilot
Lab ID: H13070431-005
Client Sample ID 13BH-DT-PILOT-BCR1-072313
Collection Date: 07/23/13 12:00
Matrix: Aqueous
Report Date: 08/07/13
DateReceived: 07/24/13
Prepared by Helena, MT Branch
Analyses Result Units Analysis Date / ByRL Method
MCL/QCLQualifiers
PHYSICAL PROPERTIES
07/24/13 13:59 / glj10mg/L1870Solids, Total Dissolved TDS @ 180 C A2540 C
INORGANICS
D 08/05/13 09:00 / cmm4.0mg/L270Acidity, Total as CaCO3 A2310 B
07/24/13 18:04 / cmm1mg/L93Alkalinity, Total as CaCO3 A2320 B
07/24/13 18:04 / cmm1mg/L110Bicarbonate as HCO3 A2320 B
07/24/13 18:04 / cmm1mg/LNDCarbonate as CO3 A2320 B
07/24/13 18:04 / cmm1mg/LNDHydroxide as OH A2320 B
07/30/13 15:58 / abb1mg/L2Chloride E300.0
07/31/13 11:37 / jaw1mg/L1200Sulfate E300.0
D 08/05/13 15:51 / cmm0.2mg/L1.3Fluoride A4500-F C4
07/26/13 14:15 / eli-b220.04mg/L0.94Sulfide A4500-S D
NUTRIENTS
D 07/24/13 11:44 / reh0.01mg/L0.81Phosphorus, Orthophosphate as P E365.1
METALS, DISSOLVED
07/24/13 23:58 / raw0.03mg/L0.09Aluminum E200.8
07/24/13 23:58 / raw0.001mg/L0.007Arsenic E200.8
07/24/13 23:58 / raw0.05mg/L0.36Barium E200.8
07/24/13 23:58 / raw0.001mg/LNDBeryllium E200.8
07/24/13 23:58 / raw0.001mg/LNDCadmium E200.8
07/24/13 23:58 / raw1mg/L301Calcium E200.8
07/24/13 23:58 / raw0.005mg/LNDChromium E200.8
07/25/13 21:43 / dck0.005mg/L0.028Cobalt E200.8
07/24/13 23:58 / raw0.005mg/LNDCopper E200.8
07/24/13 23:58 / raw0.03mg/L104Iron E200.8
07/24/13 23:58 / raw0.001mg/LNDLead E200.8
07/24/13 23:58 / raw1mg/L40Magnesium E200.8
D 07/26/13 11:07 / sld0.003mg/L122Manganese E200.7
07/24/13 23:58 / raw0.005mg/L0.008Nickel E200.8
07/24/13 23:58 / raw1mg/L7Potassium E200.8
07/24/13 23:58 / raw0.001mg/LNDSilver E200.8
07/24/13 23:58 / raw1mg/L5Sodium E200.8
07/24/13 23:58 / raw0.0005mg/LNDThallium E200.8
07/24/13 23:58 / raw0.01mg/L0.06Zinc E200.8
ReportDefinitions:
RL - Analyte reporting limit. MCL - Maximum contaminant level.
QCL - Quality control limit. ND - Not detected at the reporting limit.
D - RL increased due to sample matrix.
Page 8 of 37

LABORATORY ANALYTICAL REPORT
Client: CDM Federal Programs
Project: Barker Hughsville Pilot
Lab ID: H13070431-006
Client Sample ID 13BH-DT-PILOT-BDR1-072313
Collection Date: 07/23/13 12:05
Matrix: Aqueous
Report Date: 08/07/13
DateReceived: 07/24/13
Prepared by Helena, MT Branch
Analyses Result Units Analysis Date / ByRL Method
MCL/QCLQualifiers
PHYSICAL PROPERTIES
07/24/13 13:59 / glj10mg/L1900Solids, Total Dissolved TDS @ 180 C A2540 C
INORGANICS
D 08/05/13 09:00 / cmm4.0mg/L270Acidity, Total as CaCO3 A2310 B
07/24/13 18:10 / cmm1mg/L99Alkalinity, Total as CaCO3 A2320 B
07/24/13 18:10 / cmm1mg/L120Bicarbonate as HCO3 A2320 B
07/24/13 18:10 / cmm1mg/LNDCarbonate as CO3 A2320 B
07/24/13 18:10 / cmm1mg/LNDHydroxide as OH A2320 B
07/30/13 16:10 / abb1mg/L2Chloride E300.0
07/25/13 14:58 / cmm1mg/L1300Sulfate E300.0
D 08/05/13 15:52 / cmm0.2mg/L1.3Fluoride A4500-F C4
D 07/26/13 14:15 / eli-b220.2mg/L1.2Sulfide A4500-S D
NUTRIENTS
D 07/24/13 11:45 / reh0.01mg/L1.43Phosphorus, Orthophosphate as P E365.1
METALS, DISSOLVED
07/25/13 00:02 / raw0.03mg/L0.09Aluminum E200.8
07/25/13 00:02 / raw0.001mg/L0.008Arsenic E200.8
07/25/13 00:02 / raw0.05mg/L0.36Barium E200.8
07/25/13 00:02 / raw0.001mg/LNDBeryllium E200.8
07/25/13 00:02 / raw0.001mg/LNDCadmium E200.8
07/25/13 00:02 / raw1mg/L300Calcium E200.8
07/25/13 00:02 / raw0.005mg/LNDChromium E200.8
07/25/13 21:48 / dck0.005mg/L0.040Cobalt E200.8
07/25/13 00:02 / raw0.005mg/LNDCopper E200.8
07/25/13 00:02 / raw0.03mg/L106Iron E200.8
07/25/13 00:02 / raw0.001mg/LNDLead E200.8
07/25/13 00:02 / raw1mg/L40Magnesium E200.8
D 07/26/13 11:10 / sld0.003mg/L122Manganese E200.7
07/25/13 00:02 / raw0.005mg/L0.007Nickel E200.8
07/25/13 00:02 / raw1mg/L8Potassium E200.8
07/25/13 00:02 / raw0.001mg/LNDSilver E200.8
07/25/13 00:02 / raw1mg/L7Sodium E200.8
07/25/13 00:02 / raw0.0005mg/LNDThallium E200.8
07/25/13 00:02 / raw0.01mg/L0.09Zinc E200.8
ReportDefinitions:
RL - Analyte reporting limit. MCL - Maximum contaminant level.
QCL - Quality control limit. ND - Not detected at the reporting limit.
D - RL increased due to sample matrix.
Page 9 of 37

LABORATORY ANALYTICAL REPORT
Client: CDM Federal Programs
Project: Barker Hughsville Pilot
Lab ID: H13070431-007
Client Sample ID 13BH-DT-PILOT-BCR2-072313
Collection Date: 07/23/13 12:50
Matrix: Aqueous
Report Date: 08/07/13
DateReceived: 07/24/13
Prepared by Helena, MT Branch
Analyses Result Units Analysis Date / ByRL Method
MCL/QCLQualifiers
PHYSICAL PROPERTIES
07/24/13 13:59 / glj10mg/L1890Solids, Total Dissolved TDS @ 180 C A2540 C
INORGANICS
D 08/05/13 09:00 / cmm4.0mg/L16Acidity, Total as CaCO3 A2310 B
07/24/13 18:16 / cmm1mg/L200Alkalinity, Total as CaCO3 A2320 B
07/24/13 18:16 / cmm1mg/L250Bicarbonate as HCO3 A2320 B
07/24/13 18:16 / cmm1mg/LNDCarbonate as CO3 A2320 B
07/24/13 18:16 / cmm1mg/LNDHydroxide as OH A2320 B
07/25/13 15:11 / cmm1mg/L3Chloride E300.0
07/25/13 15:11 / cmm1mg/L1200Sulfate E300.0
D 08/05/13 15:52 / cmm0.2mg/L0.8Fluoride A4500-F C4
D 07/26/13 14:15 / eli-b220.2mg/L2.4Sulfide A4500-S D
AGGREGATE ORGANICS
07/24/13 15:22 / kjw30mg/L75Oxygen Demand, Biochemical (BOD) A5210 B
NUTRIENTS
D 07/29/13 11:51 / reh0.1mg/L3.2Nitrogen, Ammonia as N E350.1
D 07/24/13 11:46 / reh0.02mg/L4.77Phosphorus, Orthophosphate as P E365.1
METALS, DISSOLVED
07/25/13 00:07 / raw0.03mg/LNDAluminum E200.8
07/25/13 00:07 / raw0.001mg/L0.002Arsenic E200.8
07/25/13 00:07 / raw0.05mg/L0.42Barium E200.8
07/25/13 00:07 / raw0.001mg/LNDBeryllium E200.8
07/25/13 00:07 / raw0.001mg/LNDCadmium E200.8
07/25/13 00:07 / raw1mg/L349Calcium E200.8
07/25/13 00:07 / raw0.005mg/LNDChromium E200.8
07/25/13 21:52 / dck0.005mg/L0.007Cobalt E200.8
07/25/13 00:07 / raw0.005mg/LNDCopper E200.8
07/25/13 00:07 / raw0.03mg/L33.3Iron E200.8
07/25/13 00:07 / raw0.001mg/LNDLead E200.8
07/25/13 00:07 / raw1mg/L48Magnesium E200.8
D 07/26/13 11:14 / sld0.003mg/L102Manganese E200.7
07/25/13 00:07 / raw0.005mg/LNDNickel E200.8
07/25/13 00:07 / raw1mg/L13Potassium E200.8
07/25/13 00:07 / raw0.001mg/LNDSilver E200.8
07/25/13 00:07 / raw1mg/L7Sodium E200.8
07/25/13 00:07 / raw0.0005mg/LNDThallium E200.8
07/25/13 00:07 / raw0.01mg/L0.02Zinc E200.8
ReportDefinitions:
RL - Analyte reporting limit. MCL - Maximum contaminant level.
QCL - Quality control limit. ND - Not detected at the reporting limit.
D - RL increased due to sample matrix.
Page 10 of 37

LABORATORY ANALYTICAL REPORT
Client: CDM Federal Programs
Project: Barker Hughsville Pilot
Lab ID: H13070431-008
Client Sample ID 13BH-DT-PILOT-BCR3-072313
Collection Date: 07/23/13 13:45
Matrix: Aqueous
Report Date: 08/07/13
DateReceived: 07/24/13
Prepared by Helena, MT Branch
Analyses Result Units Analysis Date / ByRL Method
MCL/QCLQualifiers
PHYSICAL PROPERTIES
07/24/13 13:59 / glj10mg/L4490Solids, Total Dissolved TDS @ 180 C A2540 C
INORGANICS
D 08/05/13 09:00 / cmm4.0mg/LNDAcidity, Total as CaCO3 A2310 B
07/24/13 18:32 / cmm1mg/L2600Alkalinity, Total as CaCO3 A2320 B
07/24/13 18:32 / cmm1mg/L3200Bicarbonate as HCO3 A2320 B
07/24/13 18:32 / cmm1mg/LNDCarbonate as CO3 A2320 B
07/24/13 18:32 / cmm1mg/LNDHydroxide as OH A2320 B
D 07/25/13 16:14 / cmm5mg/L96Chloride E300.0
D 07/25/13 16:14 / cmm2mg/L970Sulfate E300.0
08/05/13 15:53 / cmm0.1mg/L0.1Fluoride A4500-F C4
07/26/13 14:00 / eli-b221mg/L23Sulfide A4500-S F
NUTRIENTS
D 07/24/13 11:53 / reh0.05mg/L15.3Phosphorus, Orthophosphate as P E365.1
METALS, DISSOLVED
07/25/13 00:11 / raw0.03mg/LNDAluminum E200.8
07/25/13 00:11 / raw0.001mg/L0.041Arsenic E200.8
07/25/13 00:11 / raw0.05mg/L0.53Barium E200.8
07/25/13 00:11 / raw0.001mg/LNDBeryllium E200.8
07/25/13 00:11 / raw0.001mg/LNDCadmium E200.8
07/25/13 00:11 / raw1mg/L824Calcium E200.8
07/25/13 00:11 / raw0.005mg/LNDChromium E200.8
07/25/13 22:15 / dck0.005mg/LNDCobalt E200.8
07/25/13 00:11 / raw0.005mg/LNDCopper E200.8
07/29/13 15:17 / dck0.03mg/L0.14Iron E200.8
07/25/13 00:11 / raw0.001mg/LNDLead E200.8
07/25/13 00:11 / raw1mg/L113Magnesium E200.8
D 07/25/13 15:38 / sld0.003mg/L1.72Manganese E200.7
07/25/13 00:11 / raw0.005mg/L0.011Nickel E200.8
07/25/13 00:11 / raw1mg/L39Potassium E200.8
07/25/13 00:11 / raw0.001mg/LNDSilver E200.8
07/25/13 00:11 / raw1mg/L60Sodium E200.8
07/25/13 00:11 / raw0.0005mg/LNDThallium E200.8
07/25/13 00:11 / raw0.01mg/L0.02Zinc E200.8
ReportDefinitions:
RL - Analyte reporting limit. MCL - Maximum contaminant level.
QCL - Quality control limit. ND - Not detected at the reporting limit.
D - RL increased due to sample matrix.
Page 11 of 37

LABORATORY ANALYTICAL REPORT
Client: CDM Federal Programs
Project: Barker Hughsville Pilot
Lab ID: H13070431-009
Client Sample ID 13BH-DT-PILOT-BCR4-072313
Collection Date: 07/23/13 14:15
Matrix: Aqueous
Report Date: 08/07/13
DateReceived: 07/24/13
Prepared by Helena, MT Branch
Analyses Result Units Analysis Date / ByRL Method
MCL/QCLQualifiers
PHYSICAL PROPERTIES
07/24/13 13:59 / glj10mg/L1860Solids, Total Dissolved TDS @ 180 C A2540 C
INORGANICS
D 08/05/13 09:00 / cmm4.0mg/LNDAcidity, Total as CaCO3 A2310 B
07/24/13 18:39 / cmm1mg/L200Alkalinity, Total as CaCO3 A2320 B
07/24/13 18:39 / cmm1mg/L240Bicarbonate as HCO3 A2320 B
07/24/13 18:39 / cmm1mg/LNDCarbonate as CO3 A2320 B
07/24/13 18:39 / cmm1mg/LNDHydroxide as OH A2320 B
07/30/13 17:39 / abb1mg/L4Chloride E300.0
07/25/13 16:26 / cmm1mg/L1100Sulfate E300.0
D 08/05/13 15:54 / cmm0.2mg/L1.2Fluoride A4500-F C4
D 07/26/13 14:15 / eli-b220.2mg/L6.6Sulfide A4500-S D
NUTRIENTS
D 07/24/13 11:54 / reh0.02mg/L5.66Phosphorus, Orthophosphate as P E365.1
METALS, DISSOLVED
07/25/13 00:16 / raw0.03mg/LNDAluminum E200.8
07/25/13 00:16 / raw0.001mg/L0.002Arsenic E200.8
07/25/13 00:16 / raw0.05mg/L0.34Barium E200.8
07/25/13 00:16 / raw0.001mg/LNDBeryllium E200.8
07/25/13 00:16 / raw0.001mg/LNDCadmium E200.8
07/25/13 00:16 / raw1mg/L219Calcium E200.8
07/25/13 00:16 / raw0.005mg/LNDChromium E200.8
07/25/13 22:20 / dck0.005mg/LNDCobalt E200.8
07/25/13 00:16 / raw0.005mg/LNDCopper E200.8
07/25/13 00:16 / raw0.03mg/L1.50Iron E200.8
07/25/13 00:16 / raw0.001mg/LNDLead E200.8
07/25/13 00:16 / raw1mg/L150Magnesium E200.8
07/25/13 15:42 / sld0.001mg/L61.1Manganese E200.7
07/25/13 00:16 / raw0.005mg/LNDNickel E200.8
07/25/13 00:16 / raw1mg/L9Potassium E200.8
07/25/13 00:16 / raw0.001mg/LNDSilver E200.8
07/25/13 00:16 / raw1mg/L9Sodium E200.8
07/25/13 00:16 / raw0.0005mg/LNDThallium E200.8
07/29/13 15:22 / dck0.01mg/L0.02Zinc E200.8
ReportDefinitions:
RL - Analyte reporting limit. MCL - Maximum contaminant level.
QCL - Quality control limit. ND - Not detected at the reporting limit.
D - RL increased due to sample matrix.
Page 12 of 37

LABORATORY ANALYTICAL REPORT
Client: CDM Federal Programs
Project: Barker Hughsville Pilot
Lab ID: H13070431-010
Client Sample ID 13BH-DT-PILOT-BCR2-POST
Collection Date: 07/23/13 14:45
Matrix: Aqueous
Report Date: 08/07/13
DateReceived: 07/24/13
Prepared by Helena, MT Branch
Analyses Result Units Analysis Date / ByRL Method
MCL/QCLQualifiers
INORGANICS
07/26/13 14:15 / eli-b220.04mg/L0.47Sulfide A4500-S D
AGGREGATE ORGANICS
07/24/13 15:23 / kjw30mg/L94Oxygen Demand, Biochemical (BOD) A5210 B
NUTRIENTS
D 07/29/13 12:16 / reh0.2mg/L5.0Nitrogen, Ammonia as N E350.1
ReportDefinitions:
RL - Analyte reporting limit. MCL - Maximum contaminant level.
QCL - Quality control limit. ND - Not detected at the reporting limit.
D - RL increased due to sample matrix.
Page 13 of 37

Project: Barker Hughsville Pilot
Client: CDM Federal Programs
Work Order: H13070431
QA/QC Summary Report
08/07/13Report Date:
Analyte Result %REC RPDLow Limit High Limit RPDLimitRLUnits QualCount
Prepared by Helena, MT Branch
Method: A2310 B Batch: H13070399-018A
Sample ID: H13070431-009ADUP 08/05/13 09:00Sample Duplicate Run: MISC WC_130805A
Acidity, Total as CaCO3 204.0ND mg/L
Sample ID: LCS1308050900 08/05/13 09:00Laboratory Control Sample Run: MISC WC_130805A
Acidity, Total as CaCO3 92 90 1104.0720 mg/L
Sample ID: MBLK1308050900 08/05/13 09:00Method Blank Run: MISC WC_130805A
Acidity, Total as CaCO3 3ND mg/L
Qualifiers:
RL - Analyte reporting limit. ND - Not detected at the reporting limit.
Page 14 of 37

Project: Barker Hughsville Pilot
Client: CDM Federal Programs
Work Order: H13070431
QA/QC Summary Report
08/07/13Report Date:
Analyte Result %REC RPDLow Limit High Limit RPDLimitRLUnits QualCount
Prepared by Helena, MT Branch
Method: A2320 B Batch: R89957
Sample ID: MBLK 07/24/13 16:48Method Blank Run: MAN-TECH_130724C
Alkalinity, Total as CaCO3 2ND mg/L
Sample ID: LCS-07222013 07/24/13 16:57Laboratory Control Sample Run: MAN-TECH_130724C
Alkalinity, Total as CaCO3 105 90 1104.0630 mg/L
Sample ID: H13070395-001ADUP 07/24/13 17:12Sample Duplicate Run: MAN-TECH_130724C3
Alkalinity, Total as CaCO3 104.0 0.2260 mg/L
Bicarbonate as HCO3 104.0 0.2310 mg/L
Carbonate as CO3 104.0ND mg/L
Sample ID: H13070399-002AMS 07/24/13 17:27Sample Matrix Spike Run: MAN-TECH_130724C
Alkalinity, Total as CaCO3 102 80 1204.0680 mg/L
Sample ID: H13070431-009ADUP 07/24/13 18:46Sample Duplicate Run: MAN-TECH_130724C3
Alkalinity, Total as CaCO3 104.0 0.9190 mg/L
Bicarbonate as HCO3 104.0 0.9240 mg/L
Carbonate as CO3 104.0ND mg/L
Qualifiers:
RL - Analyte reporting limit. ND - Not detected at the reporting limit.
Page 15 of 37
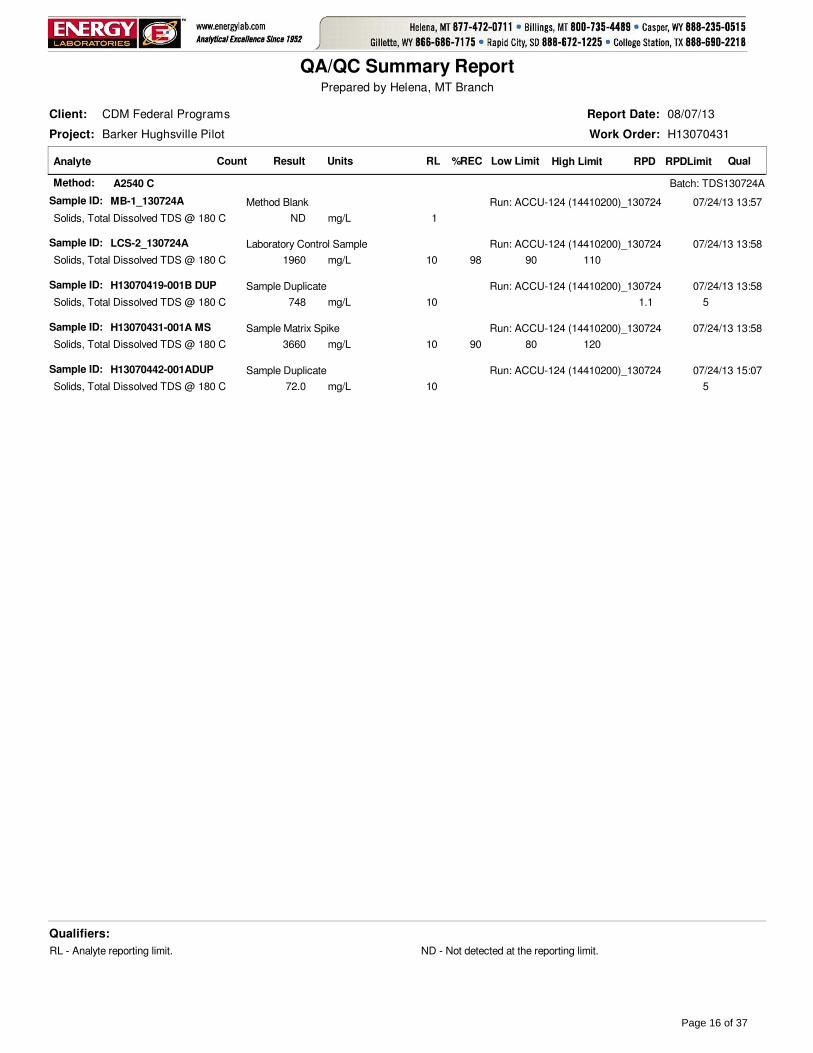
Project: Barker Hughsville Pilot
Client: CDM Federal Programs
Work Order: H13070431
QA/QC Summary Report
08/07/13Report Date:
Analyte Result %REC RPDLow Limit High Limit RPDLimitRLUnits QualCount
Prepared by Helena, MT Branch
Method: A2540 C Batch: TDS130724A
Sample ID: MB-1_130724A 07/24/13 13:57Method Blank Run: ACCU-124 (14410200)_130724
Solids, Total Dissolved TDS @ 180 C 1ND mg/L
Sample ID: LCS-2_130724A 07/24/13 13:58Laboratory Control Sample Run: ACCU-124 (14410200)_130724
Solids, Total Dissolved TDS @ 180 C 98 90 110101960 mg/L
Sample ID: H13070419-001B DUP 07/24/13 13:58Sample Duplicate Run: ACCU-124 (14410200)_130724
Solids, Total Dissolved TDS @ 180 C 510 1.1748 mg/L
Sample ID: H13070431-001A MS 07/24/13 13:58Sample Matrix Spike Run: ACCU-124 (14410200)_130724
Solids, Total Dissolved TDS @ 180 C 90 80 120103660 mg/L
Sample ID: H13070442-001ADUP 07/24/13 15:07Sample Duplicate Run: ACCU-124 (14410200)_130724
Solids, Total Dissolved TDS @ 180 C 51072.0 mg/L
Qualifiers:
RL - Analyte reporting limit. ND - Not detected at the reporting limit.
Page 16 of 37

Project: Barker Hughsville Pilot
Client: CDM Federal Programs
Work Order: H13070431
QA/QC Summary Report
08/07/13Report Date:
Analyte Result %REC RPDLow Limit High Limit RPDLimitRLUnits QualCount
Prepared by Helena, MT Branch
Method: A4500-F C Analytical Run: PH_130805A
Sample ID: ICV1_130805A 08/05/13 15:20Initial Calibration Verification Standard
Fluoride 96 90 1100.10.7 mg/L
Method: A4500-F C Batch: 130805A-F-ISE-W
Sample ID: MBLK1_130805A 08/05/13 15:19Method Blank Run: PH_130805A
Fluoride 0.0050.008 mg/L
Sample ID: LFB1_130805A 08/05/13 15:21Laboratory Fortified Blank Run: PH_130805A
Fluoride 99 90 1100.10.5 mg/L
Sample ID: H13070414-001AMS 08/05/13 15:33Sample Matrix Spike Run: PH_130805A
Fluoride 88 85 1150.54.8 mg/L
Sample ID: H13070414-001AMSD 08/05/13 15:34Sample Matrix Spike Duplicate Run: PH_130805A
Fluoride 87 85 115 100.5 0.34.7 mg/L
Sample ID: H13070442-001AMS 08/05/13 16:04Sample Matrix Spike Run: PH_130805A
Fluoride 98 85 1150.10.6 mg/L
Sample ID: H13070442-001AMSD 08/05/13 16:05Sample Matrix Spike Duplicate Run: PH_130805A
Fluoride 99 85 115 100.1 0.90.6 mg/L
Qualifiers:
RL - Analyte reporting limit. ND - Not detected at the reporting limit.
Page 17 of 37

Project: Barker Hughsville Pilot
Client: CDM Federal Programs
Work Order: H13070431
QA/QC Summary Report
08/07/13Report Date:
Analyte Result %REC RPDLow Limit High Limit RPDLimitRLUnits QualCount
Prepared by Helena, MT Branch
Method: A4500-S D Batch: B_R208956
Sample ID: MB-R208956 07/26/13 14:15Method Blank Run: SUB-B208956
Sulfide 0.002ND mg/L
Sample ID: LCS-R208956 07/26/13 14:15Laboratory Control Sample Run: SUB-B208956
Sulfide 112 70 1300.0400.268 mg/L
Sample ID: B13072242-002DMS 07/26/13 14:15Sample Matrix Spike Run: SUB-B208956
Sulfide 121 70 1300.0400.332 mg/L
Sample ID: B13072242-002DMSD 07/26/13 14:15Sample Matrix Spike Duplicate Run: SUB-B208956
Sulfide 114 70 130 200.040 5.10.316 mg/L
Sample ID: B13072211-001DMS 07/26/13 14:15Sample Matrix Spike Run: SUB-B208956
Sulfide 100 70 1300.0400.264 mg/L
Sample ID: B13072211-001DMSD 07/26/13 14:15Sample Matrix Spike Duplicate Run: SUB-B208956
Sulfide 104 70 130 200.040 3.10.272 mg/L
Qualifiers:
RL - Analyte reporting limit. ND - Not detected at the reporting limit.
Page 18 of 37

Project: Barker Hughsville Pilot
Client: CDM Federal Programs
Work Order: H13070431
QA/QC Summary Report
08/07/13Report Date:
Analyte Result %REC RPDLow Limit High Limit RPDLimitRLUnits QualCount
Prepared by Helena, MT Branch
Method: A4500-S F Batch: B_R208958
Sample ID: MB-R208958 07/26/13 14:00Method Blank Run: SUB-B208958
Sulfide 0.5ND mg/L
Sample ID: LCS-R208958 07/26/13 14:00Laboratory Control Sample Run: SUB-B208958
Sulfide 99 70 1301.025.6 mg/L
Sample ID: B13072117-001BMS 07/26/13 14:00Sample Matrix Spike Run: SUB-B208958
Sulfide 100 80 1201.025.8 mg/L
Sample ID: B13072117-001BMSD 07/26/13 14:00Sample Matrix Spike Duplicate Run: SUB-B208958
Sulfide 101 80 120 201.0 0.325.9 mg/L
Qualifiers:
RL - Analyte reporting limit. ND - Not detected at the reporting limit.
Page 19 of 37

Project: Barker Hughsville Pilot
Client: CDM Federal Programs
Work Order: H13070431
QA/QC Summary Report
08/07/13Report Date:
Analyte Result %REC RPDLow Limit High Limit RPDLimitRLUnits QualCount
Prepared by Helena, MT Branch
Method: A5210 B Batch: 130724_1_BOD5-W
Sample ID: Dil-H201_130724 07/24/13 15:06Dilution Water Blank Run: MISC WC_130724A
Oxygen Demand, Biochemical (BOD) 0 0.22.00.10 mg/L
Sample ID: GGA1_130724 07/24/13 15:11Laboratory Control Sample Run: MISC WC_130724A
Oxygen Demand, Biochemical (BOD) 101 85 11558200 mg/L
Sample ID: H13070435-001BDUP 07/24/13 15:25Sample Duplicate Run: MISC WC_130724A
Oxygen Demand, Biochemical (BOD) 90 110 10120 0.1150 mg/L
Qualifiers:
RL - Analyte reporting limit. ND - Not detected at the reporting limit.
Page 20 of 37

Project: Barker Hughsville Pilot
Client: CDM Federal Programs
Work Order: H13070431
QA/QC Summary Report
08/07/13Report Date:
Analyte Result %REC RPDLow Limit High Limit RPDLimitRLUnits QualCount
Prepared by Helena, MT Branch
Method: E200.7 Analytical Run: ICP2-HE_130725B
Sample ID: ICV 07/25/13 12:49Initial Calibration Verification Standard3
Aluminum 101 95 1050.104.02 mg/L
Manganese 99 95 1050.0103.94 mg/L
Zinc 101 95 1050.0100.805 mg/L
Sample ID: CCV-1 07/25/13 12:53Continuing Calibration Verification Standard3
Aluminum 100 95 1050.102.49 mg/L
Manganese 99 95 1050.0102.47 mg/L
Zinc 100 95 1050.0102.50 mg/L
Sample ID: ICSA 07/25/13 13:04Interference Check Sample A3
Aluminum 104 80 1200.10521 mg/L
Manganese 0 00.0100.00323 mg/L
Zinc 0 00.0100.0126 mg/L
Sample ID: ICSAB 07/25/13 13:08Interference Check Sample AB3
Aluminum 104 80 1200.10518 mg/L
Manganese 97 80 1200.0100.487 mg/L
Zinc 99 80 1200.0100.993 mg/L
Sample ID: CCV 07/25/13 14:22Continuing Calibration Verification Standard3
Aluminum 96 90 1100.102.41 mg/L
Manganese 95 90 1100.0102.38 mg/L
Zinc 95 90 1100.0102.37 mg/L
Sample ID: CCV 07/25/13 15:07Continuing Calibration Verification Standard3
Aluminum 97 90 1100.102.43 mg/L
Manganese 97 90 1100.0102.42 mg/L
Zinc 97 90 1100.0102.42 mg/L
Method: E200.7 Batch: R89996
Sample ID: ICB 07/25/13 13:15Method Blank Run: ICP2-HE_130725B3
Aluminum 0.004ND mg/L
Manganese 0.0005ND mg/L
Zinc 0.0010.001 mg/L
Sample ID: LFB 07/25/13 13:19Laboratory Fortified Blank Run: ICP2-HE_130725B3
Aluminum 97 85 1150.104.86 mg/L
Manganese 96 85 1150.0104.79 mg/L
Zinc 96 85 1150.0100.958 mg/L
Sample ID: H13070372-050AMS2 07/25/13 14:29Sample Matrix Spike Run: ICP2-HE_130725B3
Aluminum 93 70 1300.0304.65 mg/L
Manganese 97 70 1300.00104.89 mg/L
Zinc 96 70 1300.0100.975 mg/L
Sample ID: H13070372-050AMSD2 07/25/13 14:33Sample Matrix Spike Duplicate Run: ICP2-HE_130725B3
Aluminum 93 70 130 200.030 0.34.66 mg/L
Qualifiers:
RL - Analyte reporting limit. ND - Not detected at the reporting limit.
Page 21 of 37

Project: Barker Hughsville Pilot
Client: CDM Federal Programs
Work Order: H13070431
QA/QC Summary Report
08/07/13Report Date:
Analyte Result %REC RPDLow Limit High Limit RPDLimitRLUnits QualCount
Prepared by Helena, MT Branch
Method: E200.7 Batch: R89996
Sample ID: H13070372-050AMSD2 07/25/13 14:33Sample Matrix Spike Duplicate Run: ICP2-HE_130725B3
Manganese 97 70 130 200.0010 0.84.93 mg/L
Zinc 96 70 130 200.010 0.20.973 mg/L
Sample ID: H13070431-006BMS2 07/25/13 15:26Sample Matrix Spike Run: ICP2-HE_130725B3
Aluminum 102 70 1300.0305.17 mg/L
Manganese 70 1300.0010114 mg/L A
Zinc 96 70 1300.0101.03 mg/L
Sample ID: H13070431-006BMSD2 07/25/13 15:30Sample Matrix Spike Duplicate Run: ICP2-HE_130725B3
Aluminum 101 70 130 200.030 0.95.12 mg/L
Manganese 70 130 200.0010 0.7113 mg/L A
Zinc 93 70 130 200.010 2.11.00 mg/L
Method: E200.7 Analytical Run: ICP2-HE_130726A
Sample ID: ICV 07/26/13 10:04Initial Calibration Verification Standard
Manganese 98 95 1050.0103.94 mg/L
Sample ID: CCV-1 07/26/13 10:08Continuing Calibration Verification Standard
Manganese 98 95 1050.0102.46 mg/L
Sample ID: ICSA 07/26/13 10:19Interference Check Sample A
Manganese 0 00.0100.00371 mg/L
Sample ID: ICSAB 07/26/13 10:23Interference Check Sample AB
Manganese 97 80 1200.0100.483 mg/L
Sample ID: CCV 07/26/13 10:52Continuing Calibration Verification Standard
Manganese 101 90 1100.0102.52 mg/L
Method: E200.7 Batch: R90028
Sample ID: ICB 07/26/13 10:31Method Blank Run: ICP2-HE_130726A
Manganese 0.0005ND mg/L
Sample ID: LFB 07/26/13 10:34Laboratory Fortified Blank Run: ICP2-HE_130726A
Manganese 98 85 1150.0104.92 mg/L
Sample ID: H13070431-001BMS2 07/26/13 10:45Sample Matrix Spike Run: ICP2-HE_130726A
Manganese 70 1300.0027154 mg/L A
Sample ID: H13070431-001BMSD2 07/26/13 10:49Sample Matrix Spike Duplicate Run: ICP2-HE_130726A
Manganese 70 130 200.0027 0.8153 mg/L A
Qualifiers:
RL - Analyte reporting limit. A - The analyte level was greater than four times the spike level. In accordance with the method % recovery is not calculated.
ND - Not detected at the reporting limit.
Page 22 of 37

Project: Barker Hughsville Pilot
Client: CDM Federal Programs
Work Order: H13070431
QA/QC Summary Report
08/07/13Report Date:
Analyte Result %REC RPDLow Limit High Limit RPDLimitRLUnits QualCount
Prepared by Helena, MT Branch
Method: E200.8 Analytical Run: ICPMS204-B_130724A
Sample ID: ICV STD 07/24/13 12:40Initial Calibration Verification Standard17
Aluminum 96 90 1100.100.289 mg/L
Arsenic 102 90 1100.00500.0612 mg/L
Barium 102 90 1100.100.0613 mg/L
Beryllium 103 90 1100.00100.0308 mg/L
Cadmium 109 90 1100.00100.0326 mg/L
Calcium 107 90 1100.503.20 mg/L
Chromium 102 90 1100.0100.0614 mg/L
Copper 104 90 1100.0100.0623 mg/L
Iron 107 90 1100.0300.320 mg/L
Lead 104 90 1100.0100.0627 mg/L
Magnesium 104 90 1100.503.13 mg/L
Nickel 105 90 1100.0100.0629 mg/L
Potassium 102 90 1100.503.05 mg/L
Silver 103 90 1100.00500.0309 mg/L
Sodium 102 90 1100.503.06 mg/L
Thallium 99 90 1100.100.0594 mg/L
Zinc 106 90 1100.0100.0636 mg/L
Sample ID: ICSA 07/24/13 12:45Interference Check Sample A17
Aluminum 88 70 1300.1035.4 mg/L
Arsenic 0.00500.000322 mg/L
Barium 0.100.000238 mg/L
Beryllium 0.0010ND mg/L
Cadmium 0.00100.00103 mg/L
Calcium 90 70 1300.50108 mg/L
Chromium 0.0100.00111 mg/L
Copper 0.0100.000338 mg/L
Iron 94 70 1300.03094.3 mg/L
Lead 0.0100.000225 mg/L
Magnesium 99 70 1300.5039.5 mg/L
Nickel 0.0100.000678 mg/L
Potassium 98 70 1300.5039.0 mg/L
Silver 0.00500.000203 mg/L
Sodium 98 70 1300.5098.0 mg/L
Thallium 0.107.00E-05 mg/L
Zinc 0.0100.00123 mg/L
Sample ID: ICSAB 07/24/13 12:49Interference Check Sample AB17
Aluminum 89 70 1300.1035.5 mg/L
Arsenic 105 70 1300.00500.0105 mg/L
Barium 0 00.107.30E-05 mg/L
Beryllium 0 00.00101.50E-05 mg/L
Cadmium 106 70 1300.00100.0106 mg/L
Calcium 91 70 1300.50109 mg/L
Chromium 110 70 1300.0100.0219 mg/L
Qualifiers:
RL - Analyte reporting limit. ND - Not detected at the reporting limit.
Page 23 of 37

Project: Barker Hughsville Pilot
Client: CDM Federal Programs
Work Order: H13070431
QA/QC Summary Report
08/07/13Report Date:
Analyte Result %REC RPDLow Limit High Limit RPDLimitRLUnits QualCount
Prepared by Helena, MT Branch
Method: E200.8 Analytical Run: ICPMS204-B_130724A
Sample ID: ICSAB 07/24/13 12:49Interference Check Sample AB17
Copper 100 70 1300.0100.0200 mg/L
Iron 93 70 1300.03092.5 mg/L
Lead 0 00.0100.000233 mg/L
Magnesium 101 70 1300.5040.3 mg/L
Nickel 105 70 1300.0100.0209 mg/L
Potassium 99 70 1300.5039.7 mg/L
Silver 93 70 1300.00500.0185 mg/L
Sodium 101 70 1300.50101 mg/L
Thallium 0 00.103.50E-05 mg/L
Zinc 107 70 1300.0100.0107 mg/L
Sample ID: ICV STD 07/24/13 22:17Initial Calibration Verification Standard17
Aluminum 99 90 1100.100.296 mg/L
Arsenic 102 90 1100.00500.0611 mg/L
Barium 102 90 1100.100.0614 mg/L
Beryllium 106 90 1100.00100.0317 mg/L
Cadmium 110 90 1100.00100.0331 mg/L
Calcium 106 90 1100.503.17 mg/L
Chromium 105 90 1100.0100.0629 mg/L
Copper 106 90 1100.0100.0638 mg/L
Iron 108 90 1100.0300.323 mg/L
Lead 105 90 1100.0100.0631 mg/L
Magnesium 105 90 1100.503.14 mg/L
Nickel 106 90 1100.0100.0639 mg/L
Potassium 102 90 1100.503.07 mg/L
Silver 101 90 1100.00500.0302 mg/L
Sodium 104 90 1100.503.12 mg/L
Thallium 101 90 1100.100.0606 mg/L
Zinc 107 90 1100.0100.0643 mg/L
Sample ID: ICSA 07/24/13 22:22Interference Check Sample A17
Aluminum 91 70 1300.1036.3 mg/L
Arsenic 0.00500.000306 mg/L
Barium 0.100.000248 mg/L
Beryllium 0.00101.00E-06 mg/L
Cadmium 0.00100.00102 mg/L
Calcium 93 70 1300.50112 mg/L
Chromium 0.0100.00115 mg/L
Copper 0.0100.000314 mg/L
Iron 96 70 1300.03095.8 mg/L
Lead 0.0100.000204 mg/L
Magnesium 100 70 1300.5040.1 mg/L
Nickel 0.0100.000682 mg/L
Potassium 101 70 1300.5040.2 mg/L
Silver 0.00500.000194 mg/L
Qualifiers:
RL - Analyte reporting limit. ND - Not detected at the reporting limit.
Page 24 of 37

Project: Barker Hughsville Pilot
Client: CDM Federal Programs
Work Order: H13070431
QA/QC Summary Report
08/07/13Report Date:
Analyte Result %REC RPDLow Limit High Limit RPDLimitRLUnits QualCount
Prepared by Helena, MT Branch
Method: E200.8 Analytical Run: ICPMS204-B_130724A
Sample ID: ICSA 07/24/13 22:22Interference Check Sample A17
Sodium 100 70 1300.50100 mg/L
Thallium 0.105.80E-05 mg/L
Zinc 0.0100.00133 mg/L
Sample ID: ICSAB 07/24/13 22:26Interference Check Sample AB17
Aluminum 91 70 1300.1036.4 mg/L
Arsenic 111 70 1300.00500.0111 mg/L
Barium 0 00.106.60E-05 mg/L
Beryllium 0 00.00101.60E-05 mg/L
Cadmium 108 70 1300.00100.0108 mg/L
Calcium 94 70 1300.50113 mg/L
Chromium 112 70 1300.0100.0224 mg/L
Copper 105 70 1300.0100.0209 mg/L
Iron 97 70 1300.03096.6 mg/L
Lead 0 00.0100.000223 mg/L
Magnesium 101 70 1300.5040.6 mg/L
Nickel 109 70 1300.0100.0218 mg/L
Potassium 101 70 1300.5040.4 mg/L
Silver 94 70 1300.00500.0188 mg/L
Sodium 100 70 1300.50100 mg/L
Thallium 0 00.102.20E-05 mg/L
Zinc 114 70 1300.0100.0114 mg/L
Method: E200.8 Batch: R89985
Sample ID: ICB 07/24/13 13:49Method Blank Run: ICPMS204-B_130724A17
Aluminum 0.00010.0002 mg/L
Arsenic 7E-05ND mg/L
Barium 5E-05ND mg/L
Beryllium 2E-05ND mg/L
Cadmium 7E-06ND mg/L
Calcium 0.0060.02 mg/L
Chromium 4E-05ND mg/L
Copper 3E-05ND mg/L
Iron 0.00020.0006 mg/L
Lead 6E-062E-05 mg/L
Magnesium 0.0007ND mg/L
Nickel 6E-05ND mg/L
Potassium 0.02ND mg/L
Silver 4E-05ND mg/L
Sodium 0.005ND mg/L
Thallium 1E-05ND mg/L
Zinc 0.00030.0003 mg/L
Sample ID: LFB 07/24/13 13:54Laboratory Fortified Blank Run: ICPMS204-B_130724A17
Aluminum 102 85 1150.100.0514 mg/L
Qualifiers:
RL - Analyte reporting limit. ND - Not detected at the reporting limit.
Page 25 of 37

Project: Barker Hughsville Pilot
Client: CDM Federal Programs
Work Order: H13070431
QA/QC Summary Report
08/07/13Report Date:
Analyte Result %REC RPDLow Limit High Limit RPDLimitRLUnits QualCount
Prepared by Helena, MT Branch
Method: E200.8 Batch: R89985
Sample ID: LFB 07/24/13 13:54Laboratory Fortified Blank Run: ICPMS204-B_130724A17
Arsenic 101 85 1150.00500.0504 mg/L
Barium 101 85 1150.100.0505 mg/L
Beryllium 100 85 1150.00100.0500 mg/L
Cadmium 104 85 1150.00100.0522 mg/L
Calcium 108 85 1150.501.10 mg/L
Chromium 100 85 1150.0100.0501 mg/L
Copper 102 85 1150.0100.0508 mg/L
Iron 108 85 1150.0300.163 mg/L
Lead 104 85 1150.0100.0521 mg/L
Magnesium 100 85 1150.500.998 mg/L
Nickel 102 85 1150.0100.0510 mg/L
Potassium 101 85 1150.501.01 mg/L
Silver 102 85 1150.00500.0204 mg/L
Sodium 100 85 1150.500.995 mg/L
Thallium 107 85 1150.100.0537 mg/L
Zinc 105 85 1150.0100.0530 mg/L
Sample ID: H13070431-004BMS 07/24/13 23:21Sample Matrix Spike Run: ICPMS204-B_130724A17
Aluminum 102 70 1300.0300.258 mg/L
Arsenic 108 70 1300.00100.294 mg/L
Barium 104 70 1300.0500.313 mg/L
Beryllium 98 70 1300.00100.244 mg/L
Cadmium 101 70 1300.00100.252 mg/L
Calcium 70 1301.0924 mg/L A
Chromium 103 70 1300.00500.258 mg/L
Copper 102 70 1300.00500.257 mg/L
Iron 88 70 1300.0301.48 mg/L
Lead 116 70 1300.00100.291 mg/L
Magnesium 70 1301.064.2 mg/L A
Nickel 104 70 1300.00500.269 mg/L
Potassium 101 70 1301.015.2 mg/L
Silver 75 70 1300.00100.0752 mg/L
Sodium 70 1301.047.1 mg/L A
Thallium 120 70 1300.000500.299 mg/L
Zinc 98 70 1300.0100.264 mg/L
Sample ID: H13070431-004BMSD 07/24/13 23:25Sample Matrix Spike Duplicate Run: ICPMS204-B_130724A17
Aluminum 100 70 130 200.030 2.00.252 mg/L
Arsenic 108 70 130 200.0010 0.30.295 mg/L
Barium 104 70 130 200.050 0.10.313 mg/L
Beryllium 96 70 130 200.0010 1.40.241 mg/L
Cadmium 101 70 130 200.0010 0.40.251 mg/L
Calcium 70 130 201.0 1.7940 mg/L A
Chromium 102 70 130 200.0050 0.80.255 mg/L
Copper 101 70 130 200.0050 1.30.254 mg/L
Qualifiers:
RL - Analyte reporting limit. A - The analyte level was greater than four times the spike level. In accordance with the method % recovery is not calculated.
ND - Not detected at the reporting limit.
Page 26 of 37
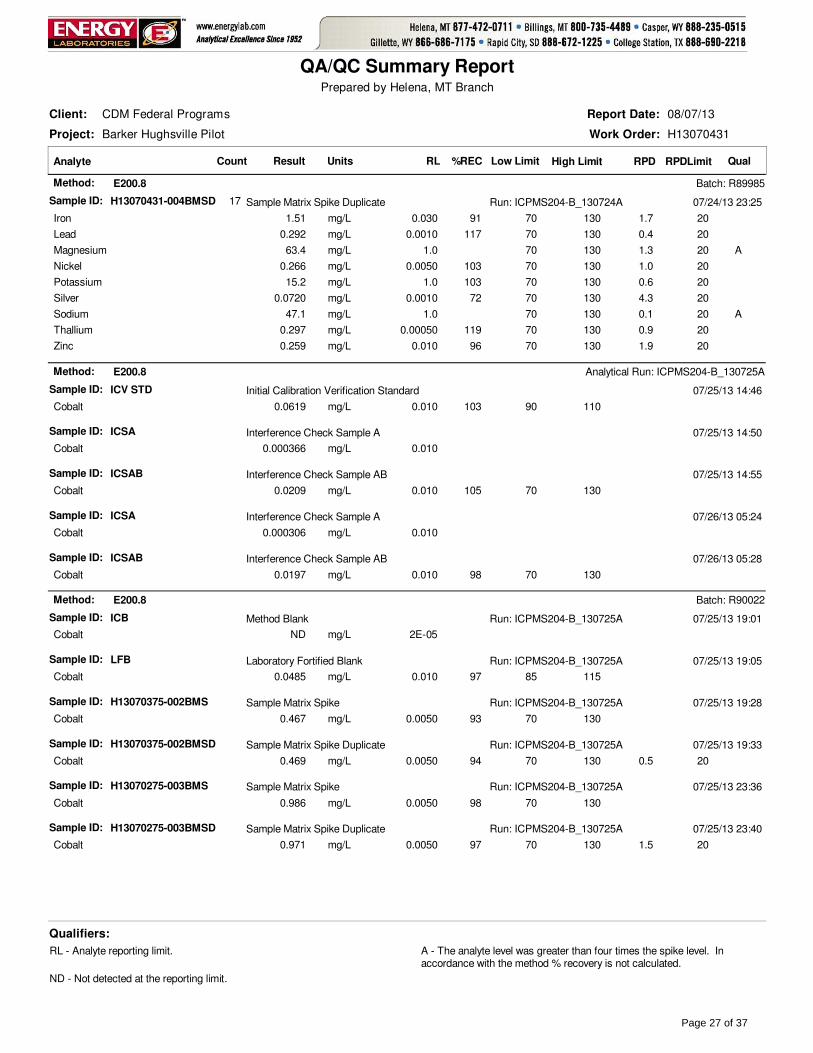
Project: Barker Hughsville Pilot
Client: CDM Federal Programs
Work Order: H13070431
QA/QC Summary Report
08/07/13Report Date:
Analyte Result %REC RPDLow Limit High Limit RPDLimitRLUnits QualCount
Prepared by Helena, MT Branch
Method: E200.8 Batch: R89985
Sample ID: H13070431-004BMSD 07/24/13 23:25Sample Matrix Spike Duplicate Run: ICPMS204-B_130724A17
Iron 91 70 130 200.030 1.71.51 mg/L
Lead 117 70 130 200.0010 0.40.292 mg/L
Magnesium 70 130 201.0 1.363.4 mg/L A
Nickel 103 70 130 200.0050 1.00.266 mg/L
Potassium 103 70 130 201.0 0.615.2 mg/L
Silver 72 70 130 200.0010 4.30.0720 mg/L
Sodium 70 130 201.0 0.147.1 mg/L A
Thallium 119 70 130 200.00050 0.90.297 mg/L
Zinc 96 70 130 200.010 1.90.259 mg/L
Method: E200.8 Analytical Run: ICPMS204-B_130725A
Sample ID: ICV STD 07/25/13 14:46Initial Calibration Verification Standard
Cobalt 103 90 1100.0100.0619 mg/L
Sample ID: ICSA 07/25/13 14:50Interference Check Sample A
Cobalt 0.0100.000366 mg/L
Sample ID: ICSAB 07/25/13 14:55Interference Check Sample AB
Cobalt 105 70 1300.0100.0209 mg/L
Sample ID: ICSA 07/26/13 05:24Interference Check Sample A
Cobalt 0.0100.000306 mg/L
Sample ID: ICSAB 07/26/13 05:28Interference Check Sample AB
Cobalt 98 70 1300.0100.0197 mg/L
Method: E200.8 Batch: R90022
Sample ID: ICB 07/25/13 19:01Method Blank Run: ICPMS204-B_130725A
Cobalt 2E-05ND mg/L
Sample ID: LFB 07/25/13 19:05Laboratory Fortified Blank Run: ICPMS204-B_130725A
Cobalt 97 85 1150.0100.0485 mg/L
Sample ID: H13070375-002BMS 07/25/13 19:28Sample Matrix Spike Run: ICPMS204-B_130725A
Cobalt 93 70 1300.00500.467 mg/L
Sample ID: H13070375-002BMSD 07/25/13 19:33Sample Matrix Spike Duplicate Run: ICPMS204-B_130725A
Cobalt 94 70 130 200.0050 0.50.469 mg/L
Sample ID: H13070275-003BMS 07/25/13 23:36Sample Matrix Spike Run: ICPMS204-B_130725A
Cobalt 98 70 1300.00500.986 mg/L
Sample ID: H13070275-003BMSD 07/25/13 23:40Sample Matrix Spike Duplicate Run: ICPMS204-B_130725A
Cobalt 97 70 130 200.0050 1.50.971 mg/L
Qualifiers:
RL - Analyte reporting limit. A - The analyte level was greater than four times the spike level. In accordance with the method % recovery is not calculated.
ND - Not detected at the reporting limit.
Page 27 of 37

Project: Barker Hughsville Pilot
Client: CDM Federal Programs
Work Order: H13070431
QA/QC Summary Report
08/07/13Report Date:
Analyte Result %REC RPDLow Limit High Limit RPDLimitRLUnits QualCount
Prepared by Helena, MT Branch
Method: E200.8 Analytical Run: ICPMS204-B_130729A
Sample ID: ICV STD 07/29/13 10:44Initial Calibration Verification Standard3
Cobalt 105 90 1100.0100.0630 mg/L
Iron 104 90 1100.0300.313 mg/L
Zinc 105 90 1100.0100.0632 mg/L
Sample ID: ICSA 07/29/13 10:48Interference Check Sample A3
Cobalt 0.0100.000440 mg/L
Iron 99 70 1300.03099.3 mg/L
Zinc 0.0100.00142 mg/L
Sample ID: ICSAB 07/29/13 10:53Interference Check Sample AB3
Cobalt 108 70 1300.0100.0215 mg/L
Iron 94 70 1300.03094.2 mg/L
Zinc 112 70 1300.0100.0112 mg/L
Sample ID: ICV STD 07/29/13 18:57Initial Calibration Verification Standard3
Cobalt 106 90 1100.0100.0635 mg/L
Iron 104 90 1100.0300.312 mg/L
Zinc 108 90 1100.0100.0650 mg/L
Sample ID: ICSA 07/29/13 19:01Interference Check Sample A3
Cobalt 0.0100.000483 mg/L
Iron 91 70 1300.03090.8 mg/L
Zinc 0.0100.00102 mg/L
Sample ID: ICSAB 07/29/13 19:06Interference Check Sample AB3
Cobalt 112 70 1300.0100.0225 mg/L
Iron 91 70 1300.03091.3 mg/L
Zinc 110 70 1300.0100.0110 mg/L
Sample ID: ICV STD 07/30/13 10:43Initial Calibration Verification Standard3
Cobalt 103 90 1100.0100.0620 mg/L
Iron 106 90 1100.0300.317 mg/L
Zinc 107 90 1100.0100.0640 mg/L
Sample ID: ICSA 07/30/13 10:47Interference Check Sample A3
Cobalt 0.0100.000442 mg/L
Iron 91 70 1300.03091.5 mg/L
Zinc 0.0100.00120 mg/L
Sample ID: ICSAB 07/30/13 10:52Interference Check Sample AB3
Cobalt 109 70 1300.0100.0218 mg/L
Iron 90 70 1300.03090.4 mg/L
Zinc 110 70 1300.0100.0110 mg/L
Sample ID: ICSA 07/30/13 13:23Interference Check Sample A3
Cobalt 0.0100.000972 mg/L
Iron 94 70 1300.03093.7 mg/L
Qualifiers:
RL - Analyte reporting limit. ND - Not detected at the reporting limit.
Page 28 of 37

Project: Barker Hughsville Pilot
Client: CDM Federal Programs
Work Order: H13070431
QA/QC Summary Report
08/07/13Report Date:
Analyte Result %REC RPDLow Limit High Limit RPDLimitRLUnits QualCount
Prepared by Helena, MT Branch
Method: E200.8 Analytical Run: ICPMS204-B_130729A
Sample ID: ICSA 07/30/13 13:23Interference Check Sample A3
Zinc 0.0100.00103 mg/L
Sample ID: ICSAB 07/30/13 13:28Interference Check Sample AB3
Cobalt 112 70 1300.0100.0224 mg/L
Iron 100 70 1300.03099.9 mg/L
Zinc 106 70 1300.0100.0106 mg/L
Sample ID: ICV STD 07/30/13 13:51Initial Calibration Verification Standard3
Cobalt 106 90 1100.0100.0635 mg/L
Iron 103 90 1100.0300.309 mg/L
Zinc 105 90 1100.0100.0628 mg/L
Sample ID: ICV STD 07/30/13 17:49Initial Calibration Verification Standard3
Cobalt 106 90 1100.0100.0633 mg/L
Iron 108 90 1100.0300.325 mg/L
Zinc 110 90 1100.0100.0660 mg/L
Sample ID: ICSA 07/30/13 17:53Interference Check Sample A3
Cobalt 0.0100.000553 mg/L
Iron 98 70 1300.03098.3 mg/L
Zinc 0.0100.00110 mg/L
Sample ID: ICSAB 07/30/13 17:58Interference Check Sample AB3
Cobalt 112 70 1300.0100.0224 mg/L
Iron 102 70 1300.030102 mg/L
Zinc 107 70 1300.0100.0107 mg/L
Method: E200.8 Batch: R90061
Sample ID: ICB 07/29/13 12:25Method Blank Run: ICPMS204-B_130729A3
Cobalt 2E-05ND mg/L
Iron 0.00020.001 mg/L
Zinc 0.00030.0007 mg/L
Sample ID: LFB 07/29/13 12:29Laboratory Fortified Blank Run: ICPMS204-B_130729A3
Cobalt 108 85 1150.0100.0540 mg/L
Iron 112 85 1150.0300.170 mg/L
Zinc 111 85 1150.0100.0561 mg/L
Sample ID: H13070431-004BMS 07/29/13 14:59Sample Matrix Spike Run: ICPMS204-B_130729A3
Cobalt 115 70 1300.00501.16 mg/L
Iron 99 70 1300.0303.69 mg/L
Zinc 106 70 1300.0101.09 mg/L
Sample ID: H13070431-004BMSD 07/29/13 15:04Sample Matrix Spike Duplicate Run: ICPMS204-B_130729A3
Cobalt 109 70 130 200.0050 5.41.10 mg/L
Iron 102 70 130 200.030 2.83.79 mg/L
Zinc 102 70 130 200.010 2.91.06 mg/L
Qualifiers:
RL - Analyte reporting limit. ND - Not detected at the reporting limit.
Page 29 of 37

Project: Barker Hughsville Pilot
Client: CDM Federal Programs
Work Order: H13070431
QA/QC Summary Report
08/07/13Report Date:
Analyte Result %REC RPDLow Limit High Limit RPDLimitRLUnits QualCount
Prepared by Helena, MT Branch
Method: E200.8 Batch: R90061
Sample ID: H13070431-004BMSD 07/29/13 15:04Sample Matrix Spike Duplicate Run: ICPMS204-B_130729A3
Sample ID: ICB 07/30/13 16:18Method Blank Run: ICPMS204-B_130729A3
Cobalt 0.0050ND mg/L
Iron 0.030ND mg/L
Zinc 0.010ND mg/L
Sample ID: LFB 07/30/13 16:22Laboratory Fortified Blank Run: ICPMS204-B_130729A3
Cobalt 97 85 1150.0100.0487 mg/L
Iron 110 85 1150.0300.165 mg/L
Zinc 99 85 1150.0100.0495 mg/L
Sample ID: H13070431-004BMS 07/30/13 16:39Sample Matrix Spike Run: ICPMS204-B_130729A3
Cobalt 100 70 1300.00501.01 mg/L
Iron 101 70 1300.0303.72 mg/L
Zinc 91 70 1300.0100.940 mg/L
Sample ID: H13070431-004BMSD 07/30/13 16:44Sample Matrix Spike Duplicate Run: ICPMS204-B_130729A3
Cobalt 91 70 130 200.0050 9.70.914 mg/L
Iron 102 70 130 200.030 0.73.75 mg/L
Zinc 93 70 130 200.010 1.70.956 mg/L
Qualifiers:
RL - Analyte reporting limit. ND - Not detected at the reporting limit.
Page 30 of 37

Project: Barker Hughsville Pilot
Client: CDM Federal Programs
Work Order: H13070431
QA/QC Summary Report
08/07/13Report Date:
Analyte Result %REC RPDLow Limit High Limit RPDLimitRLUnits QualCount
Prepared by Helena, MT Branch
Method: E300.0 Analytical Run: IC102-H_130725A
Sample ID: ICV 07/25/13 12:02Initial Calibration Verification Standard2
Chloride 100 90 1101.0100 mg/L
Sulfate 100 90 1101.0400 mg/L
Sample ID: CCV072513-1 07/25/13 13:05Continuing Calibration Verification Standard2
Chloride 103 90 1101.0100 mg/L
Sulfate 103 90 1101.0410 mg/L
Sample ID: CCV072513-2 07/25/13 15:48Continuing Calibration Verification Standard2
Chloride 103 90 1101.0100 mg/L
Sulfate 103 90 1101.0410 mg/L
Method: E300.0 Batch: R89997
Sample ID: ICB 07/25/13 12:39Method Blank Run: IC102-H_130725A2
Chloride 1.0ND mg/L
Sulfate 1.0ND mg/L
Sample ID: LFB 07/25/13 12:52Laboratory Fortified Blank Run: IC102-H_130725A2
Chloride 104 90 1101.052 mg/L
Sulfate 104 90 1101.0210 mg/L
Sample ID: H13070431-007AMS 07/25/13 15:23Sample Matrix Spike Run: IC102-H_130725A2
Chloride 102 90 1101.4260 mg/L
Sulfate 110 90 1101.02300 mg/L
Sample ID: H13070431-007AMSD 07/25/13 15:36Sample Matrix Spike Duplicate Run: IC102-H_130725A2
Chloride 101 90 110 201.4 1.5260 mg/L
Sulfate 105 90 110 201.0 2.52200 mg/L
Sample ID: H13070452-001AMS 07/25/13 17:04Sample Matrix Spike Run: IC102-H_130725A2
Chloride 101 90 1101.056 mg/L
Sulfate 107 90 1101.0420 mg/L
Sample ID: H13070452-001AMSD 07/25/13 17:16Sample Matrix Spike Duplicate Run: IC102-H_130725A2
Chloride 101 90 110 201.0 0.156 mg/L
Sulfate 107 90 110 201.0 0.1420 mg/L
Qualifiers:
RL - Analyte reporting limit. ND - Not detected at the reporting limit.
Page 31 of 37

Project: Barker Hughsville Pilot
Client: CDM Federal Programs
Work Order: H13070431
QA/QC Summary Report
08/07/13Report Date:
Analyte Result %REC RPDLow Limit High Limit RPDLimitRLUnits QualCount
Prepared by Helena, MT Branch
Method: E300.0 Analytical Run: IC102-H_130730A
Sample ID: ICV 07/30/13 12:49Initial Calibration Verification Standard2
Chloride 98 90 1101.098 mg/L
Sulfate 99 90 1101.0390 mg/L
Sample ID: CCV073013-1 07/30/13 13:39Continuing Calibration Verification Standard2
Chloride 102 90 1101.0100 mg/L
Sulfate 102 90 1101.0410 mg/L
Sample ID: CCV073013-2 07/30/13 16:23Continuing Calibration Verification Standard2
Chloride 101 90 1101.0100 mg/L
Sulfate 102 90 1101.0410 mg/L
Method: E300.0 Batch: R90112
Sample ID: ICB 07/30/13 13:01Method Blank Run: IC102-H_130730A2
Chloride 0.008ND mg/L
Sulfate 0.08ND mg/L
Sample ID: LFB 07/30/13 13:14Laboratory Fortified Blank Run: IC102-H_130730A2
Chloride 99 90 1101.050 mg/L
Sulfate 100 90 1101.0200 mg/L
Sample ID: H13070532-001AMS 07/30/13 14:17Sample Matrix Spike Run: IC102-H_130730A2
Chloride 97 90 110287400 mg/L
Sulfate 100 90 1101128000 mg/L
Sample ID: H13070532-001AMSD 07/30/13 14:30Sample Matrix Spike Duplicate Run: IC102-H_130730A2
Chloride 98 90 110 2028 0.27400 mg/L
Sulfate 100 90 110 2011 0.228000 mg/L
Sample ID: H13070431-007AMS 07/30/13 17:01Sample Matrix Spike Run: IC102-H_130730A2
Chloride 109 90 1101.058 mg/L
Sulfate 90 1101.01500 mg/L A
Sample ID: H13070431-007AMSD 07/30/13 17:13Sample Matrix Spike Duplicate Run: IC102-H_130730A2
Chloride 109 90 110 201.0 0.258 mg/L
Sulfate 90 110 201.0 0.81500 mg/L A
Qualifiers:
RL - Analyte reporting limit. A - The analyte level was greater than four times the spike level. In accordance with the method % recovery is not calculated.
ND - Not detected at the reporting limit.
Page 32 of 37

Project: Barker Hughsville Pilot
Client: CDM Federal Programs
Work Order: H13070431
QA/QC Summary Report
08/07/13Report Date:
Analyte Result %REC RPDLow Limit High Limit RPDLimitRLUnits QualCount
Prepared by Helena, MT Branch
Method: E300.0 Analytical Run: IC102-H_130731A
Sample ID: ICV 07/31/13 09:56Initial Calibration Verification Standard
Sulfate 98 90 1101.0390 mg/L
Sample ID: CCV073113-1 07/31/13 10:34Continuing Calibration Verification Standard
Sulfate 101 90 1101.0400 mg/L
Method: E300.0 Batch: R90157
Sample ID: ICB 07/31/13 10:09Method Blank Run: IC102-H_130731A
Sulfate 0.080.1 mg/L
Sample ID: LFB 07/31/13 10:21Laboratory Fortified Blank Run: IC102-H_130731A
Sulfate 97 90 1101.0190 mg/L
Sample ID: H13070514-002AMS 07/31/13 13:05Sample Matrix Spike Run: IC102-H_130731A
Sulfate 99 90 1101.01100 mg/L
Sample ID: H13070514-002AMSD 07/31/13 13:18Sample Matrix Spike Duplicate Run: IC102-H_130731A
Sulfate 97 90 110 201.0 1.51000 mg/L
Qualifiers:
RL - Analyte reporting limit. ND - Not detected at the reporting limit.
Page 33 of 37

Project: Barker Hughsville Pilot
Client: CDM Federal Programs
Work Order: H13070431
QA/QC Summary Report
08/07/13Report Date:
Analyte Result %REC RPDLow Limit High Limit RPDLimitRLUnits QualCount
Prepared by Helena, MT Branch
Method: E350.1 Analytical Run: FIA203-HE_130729A
Sample ID: ICV 07/29/13 11:28Initial Calibration Verification Standard
Nitrogen, Ammonia as N 101 90 1100.255.72 mg/L
Sample ID: ICB 07/29/13 11:32Initial Calibration Blank, Instrument Blank
Nitrogen, Ammonia as N 0 00.050-0.0566 mg/L
Sample ID: CCV 07/29/13 11:50Continuing Calibration Verification Standard
Nitrogen, Ammonia as N 98 90 1100.0500.488 mg/L
Sample ID: CCV 07/29/13 12:07Continuing Calibration Verification Standard
Nitrogen, Ammonia as N 99 90 1100.0500.493 mg/L
Method: E350.1 Batch: R90059
Sample ID: LFB 07/29/13 11:30Laboratory Fortified Blank Run: FIA203-HE_130729A
Nitrogen, Ammonia as N 104 90 1100.0551.04 mg/L
Sample ID: MBLK 07/29/13 11:33Method Blank Run: FIA203-HE_130729A
Nitrogen, Ammonia as N 0.01ND mg/L
Sample ID: H13070447-001AMS 07/29/13 11:57Sample Matrix Spike Run: FIA203-HE_130729A
Nitrogen, Ammonia as N 98 80 1200.0550.978 mg/L
Sample ID: H13070447-001AMSD 07/29/13 11:58Sample Matrix Spike Duplicate Run: FIA203-HE_130729A
Nitrogen, Ammonia as N 99 80 120 100.055 0.80.986 mg/L
Sample ID: H13070505-005AMS 07/29/13 12:14Sample Matrix Spike Run: FIA203-HE_130729A
Nitrogen, Ammonia as N 91 80 1200.0550.906 mg/L
Sample ID: H13070505-005AMSD 07/29/13 12:15Sample Matrix Spike Duplicate Run: FIA203-HE_130729A
Nitrogen, Ammonia as N 92 80 120 100.055 1.60.921 mg/L
Qualifiers:
RL - Analyte reporting limit. ND - Not detected at the reporting limit.
Page 34 of 37

Project: Barker Hughsville Pilot
Client: CDM Federal Programs
Work Order: H13070431
QA/QC Summary Report
08/07/13Report Date:
Analyte Result %REC RPDLow Limit High Limit RPDLimitRLUnits QualCount
Prepared by Helena, MT Branch
Method: E365.1 Analytical Run: FIA202-HE_130724A
Sample ID: ICV 07/24/13 10:46Initial Calibration Verification Standard
Phosphorus, Orthophosphate as P 98 90 1100.00500.244 mg/L
Sample ID: ICB 07/24/13 10:47Initial Calibration Blank, Instrument Blank
Phosphorus, Orthophosphate as P 0 00.0050-0.00722 mg/L
Sample ID: CCV 07/24/13 10:49Continuing Calibration Verification Standard
Phosphorus, Orthophosphate as P 102 90 1100.00500.102 mg/L
Method: E365.1 Batch: R89945
Sample ID: LFB 07/24/13 10:48Laboratory Fortified Blank Run: FIA202-HE_130724A
Phosphorus, Orthophosphate as P 106 90 1100.00500.212 mg/L
Sample ID: MBLK 07/24/13 11:03Method Blank Run: FIA202-HE_130724A
Phosphorus, Orthophosphate as P 0.0010ND mg/L
Sample ID: H13070431-005AMS 07/24/13 11:06Sample Matrix Spike Run: FIA202-HE_130724A
Phosphorus, Orthophosphate as P 101 90 1100.1020.9 mg/L
Sample ID: H13070431-005AMSD 07/24/13 11:07Sample Matrix Spike Duplicate Run: FIA202-HE_130724A
Phosphorus, Orthophosphate as P 106 90 110 200.10 5.022.0 mg/L
Method: E365.1 Analytical Run: FIA202-HE_130724B
Sample ID: ICV 07/24/13 11:34Initial Calibration Verification Standard
Phosphorus, Orthophosphate as P 96 90 1100.00500.240 mg/L
Sample ID: ICB 07/24/13 11:35Initial Calibration Blank, Instrument Blank
Phosphorus, Orthophosphate as P 0 00.0050-0.00466 mg/L
Sample ID: CCV 07/24/13 11:37Continuing Calibration Verification Standard
Phosphorus, Orthophosphate as P 100 90 1100.00500.100 mg/L
Sample ID: CCV 07/24/13 11:50Continuing Calibration Verification Standard
Phosphorus, Orthophosphate as P 102 90 1100.00500.102 mg/L
Method: E365.1 Batch: R89947
Sample ID: LFB 07/24/13 11:36Laboratory Fortified Blank Run: FIA202-HE_130724B
Phosphorus, Orthophosphate as P 102 90 1100.00500.203 mg/L
Sample ID: H13070431-005AMS 07/24/13 11:41Sample Matrix Spike Run: FIA202-HE_130724B
Phosphorus, Orthophosphate as P 103 90 1100.1021.1 mg/L
Sample ID: H13070431-005AMSD 07/24/13 11:42Sample Matrix Spike Duplicate Run: FIA202-HE_130724B
Phosphorus, Orthophosphate as P 106 90 110 200.10 2.821.7 mg/L
Qualifiers:
RL - Analyte reporting limit. ND - Not detected at the reporting limit.
Page 35 of 37

Shipping container/cooler in good condition?
Custody seals intact on all shipping container(s)/cooler(s)?
Custody seals intact on all sample bottles?
Chain of custody present?
Chain of custody signed when relinquished and received?
Chain of custody agrees with sample labels?
Samples in proper container/bottle?
Sample containers intact?
Sufficient sample volume for indicated test?
All samples received within holding time?(Exclude analyses that are considered field parameterssuch as pH, DO, Res Cl, Sulfite, Ferrous Iron, etc.)
Container/Temp Blank temperature:
Water - VOA vials have zero headspace?
Water - pH acceptable upon receipt?
Yes
Yes
Yes
Yes
Yes
Yes
Yes
Yes
Yes
Yes
Yes
Yes
No
No
No
No
No
No
No
No
No
No
No
No
� �
�
�
�
�
�
�
�
�
�
�
�
�
�
�
�
�
�
�
�
�
�
�
Not Present
Not Present
Not Present
�
�
�
No VOA vials submitted
Not Applicable �
�
9.5°C On Ice
7/24/2013Tracy L. Lorash
Hand Del
elm
Date Received:
Received by:
Login completed by:
Carrier name:
BL2000\sdull
7/26/2013
Reviewed by:
Reviewed Date:
Contact and Corrective Action Comments:
Sample ID on COC is 13BH-DT-PILOT-INFL-072313 - ID on bottles is 13BH-DT-PILOT-INFL-072311. Logged in with ID from COC.Sample ID on COC is 13BH-DT-PILOT-MGOH-072313 - ID on bottles is 13BH-DT-PILOT-MGOH-072311. Logged in with ID from COC. Tl 7/24/13
Temp Blank received in all shipping container(s)/cooler(s)? Yes No� � Not Applicable �
Workorder Receipt Checklist
CDM Federal Programs H13070431
Lab measurement of analytes considered field parameters that require analysis within 15 minutes of sampling such as pH, Dissolved Oxygen and Residual Chlorine, are qualified as being analyzed outside of recommended holding time.
Solid/soil samples are reported on a wet weight basis (as received) unless specifically indicated. If moisture corrected, data units are typically noted as –dry. For agricultural and mining soil parameters/characteristics, all samples are dried and ground prior to sample analysis.
Standard Reporting Procedures
Page 36 of 37
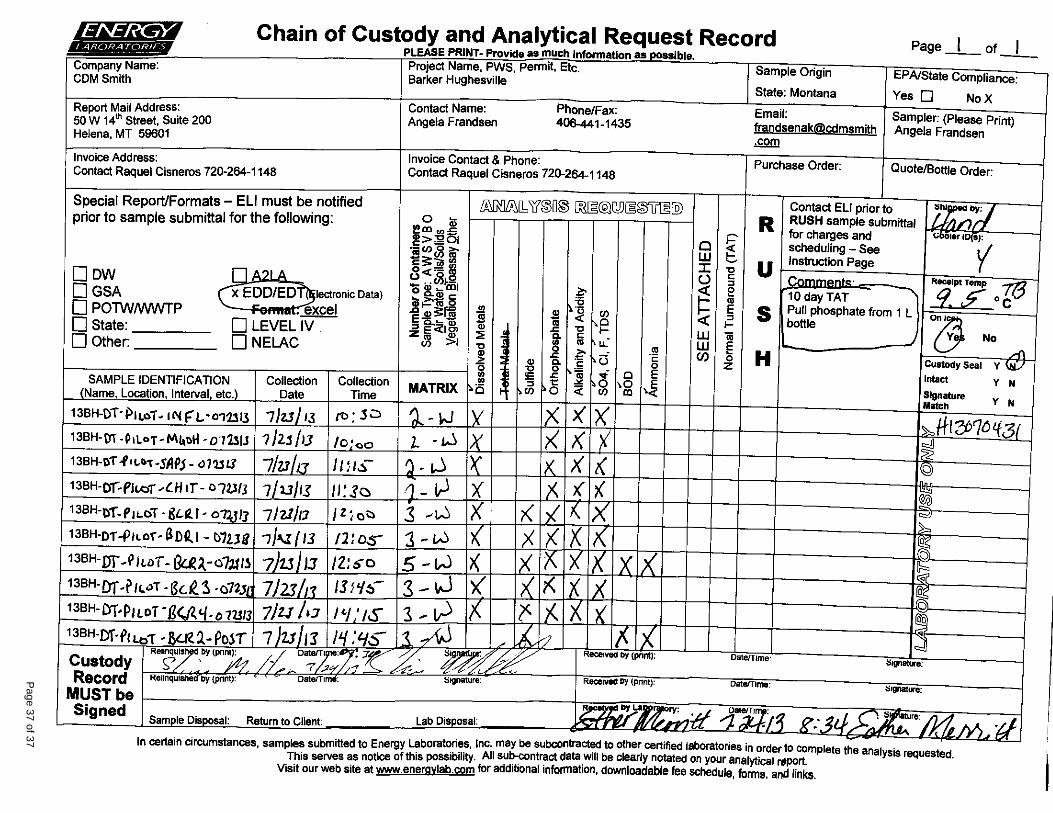
Page 37 of 37

ANALYTICAL SUMMARY REPORTANALYTICAL SUMMARY REPORTANALYTICAL SUMMARY REPORTANALYTICAL SUMMARY REPORT
Sample ID Client Sample ID Collect Date Receive Date Matrix Test
H13080161-001 13BH-DT-PILOT-INFL-080713
08/07/13 10:25 08/08/13 Aqueous Metals by ICP/ICPMS, DissolvedAcidity, Total as CaCO3AlkalinityConductivityFluorideAnions by Ion ChromatographyPhosphorus, Orthophosphate as PSolids, Total Dissolved
H13080161-002 13BH-DT-PILOT-SAPS-080713
08/07/13 10:45 08/08/13 Aqueous Same As Above
H13080161-003 13BH-DT-PILOT-CHIT-080713
08/07/13 11:00 08/08/13 Aqueous Same As Above
H13080161-004 13BH-DT-PILOT-MGOH-080713
08/07/13 11:15 08/08/13 Aqueous Same As Above
H13080161-005 13BH-DT-PILOT-BCR1-080713
08/07/13 11:40 08/08/13 Aqueous Metals by ICP/ICPMS, DissolvedAcidity, Total as CaCO3AlkalinityConductivityFluorideAnions by Ion ChromatographyPhosphorus, Orthophosphate as PSolids, Total DissolvedSulfide, Methylene Blue Colorimetric
H13080161-006 13BH-DT-PILOT-BCR2-080713
08/07/13 11:55 08/08/13 Aqueous Same As Above
H13080161-007 13BH-DT-PILOT-BCR3-080713
08/07/13 12:15 08/08/13 Aqueous Metals by ICP/ICPMS, DissolvedAcidity, Total as CaCO3AlkalinityBiochemical Oxygen Demand, 5 DayConductivityFluorideAnions by Ion ChromatographyNitrogen, AmmoniaPhosphorus, Orthophosphate as PSolids, Total DissolvedSulfide, Iodine Titrimetric
H13080161-008 13BH-DT-PILOT-BCR4-080713
08/07/13 12:45 08/08/13 Aqueous Metals by ICP/ICPMS, DissolvedAcidity, Total as CaCO3AlkalinityConductivityFluorideAnions by Ion ChromatographyPhosphorus, Orthophosphate as PSolids, Total DissolvedSulfide, Methylene Blue Colorimetric
CDM Federal Programs
Project Name: Barker Hughsville Pilot
Workorder No.: H13080161
555 17th St Ste 1100
Denver, CO 80202
August 21, 2013
H823 - Baker-Hughsville Superfund SiteQuote ID:
Energy Laboratories Inc Helena MT received the following 10 samples for CDM Federal Programs on 8/8/2013 for analysis.
Page 1 of 44

ANALYTICAL SUMMARY REPORTANALYTICAL SUMMARY REPORTANALYTICAL SUMMARY REPORTANALYTICAL SUMMARY REPORT
The analyses presented in this report were performed by Energy Laboratories, Inc., 3161 E. Lyndale Ave., Helena, MT 59604, unless otherwise noted. Any exceptions or problems with the analyses are noted in the Laboratory Analytical Report, the QA/QC Summary Report, or the Case Narrative.
The results as reported relate only to the item(s) submitted for testing.
If you have any questions regarding these test results, please call.
Report Approved By:
H13080161-009 13BH-DT-PILOT-BDR4-080713
08/07/13 12:50 08/08/13 Aqueous Same As Above
H13080161-010 13BH-DT-PILOT-BCR3-POST-080713
08/07/13 14:35 08/08/13 Aqueous Biochemical Oxygen Demand, 5 DayNitrogen, AmmoniaSulfide, Methylene Blue Colorimetric
Page 2 of 44

Project: Barker Hughsville Pilot
CLIENT: CDM Federal Programs
Sample Delivery Group: H13080161 CASE NARRATIVE
08/21/13Report Date:
Tests associated with analyst identified as ELI-B were subcontracted to Energy Laboratories, 1120 S. 27th St., Billings, MT, EPA Number MT00005.
Page 3 of 44

LABORATORY ANALYTICAL REPORT
Client: CDM Federal Programs
Project: Barker Hughsville Pilot
Lab ID: H13080161-001
Client Sample ID 13BH-DT-PILOT-INFL-080713
Collection Date: 08/07/13 10:25
Matrix: Aqueous
Report Date: 08/21/13
DateReceived: 08/08/13
Prepared by Helena, MT Branch
Analyses Result Units Analysis Date / ByRL Method
MCL/QCLQualifiers
PHYSICAL PROPERTIES
08/08/13 12:02 / glj10mg/L1750Solids, Total Dissolved TDS @ 180 C A2540 C
INORGANICS
D 08/12/13 09:30 / cmm4.0mg/L700Acidity, Total as CaCO3 A2310 B
08/08/13 18:18 / cmm1mg/LNDAlkalinity, Total as CaCO3 A2320 B
08/08/13 18:18 / cmm1mg/LNDBicarbonate as HCO3 A2320 B
08/08/13 18:18 / cmm1mg/LNDCarbonate as CO3 A2320 B
08/08/13 18:18 / cmm1mg/LNDHydroxide as OH A2320 B
08/13/13 12:26 / cmm1mg/LNDChloride E300.0
08/13/13 12:26 / cmm1mg/L2200Sulfate E300.0
D 08/13/13 16:18 / cmm0.2mg/L0.7Fluoride A4500-F C4
NUTRIENTS
08/08/13 14:01 / reh0.005mg/L0.478Phosphorus, Orthophosphate as P E365.1
METALS, DISSOLVED
08/08/13 17:19 / sld0.03mg/L12.8Aluminum E200.7
08/09/13 06:10 / raw0.001mg/L0.210Arsenic E200.8
08/09/13 06:10 / raw0.05mg/LNDBarium E200.8
08/09/13 06:10 / raw0.001mg/L0.006Beryllium E200.8
08/09/13 06:10 / raw0.001mg/L0.191Cadmium E200.8
08/08/13 17:19 / sld1mg/L93Calcium E200.7
08/09/13 06:10 / raw0.005mg/LNDChromium E200.8
08/10/13 06:26 / raw0.005mg/L0.055Cobalt E200.8
08/08/13 17:19 / sld0.005mg/L1.40Copper E200.7
08/09/13 11:48 / sld0.03mg/L162Iron E200.7
08/09/13 06:10 / raw0.001mg/L0.173Lead E200.8
08/08/13 17:19 / sld1mg/L20Magnesium E200.7
D 08/09/13 11:48 / sld0.003mg/L116Manganese E200.7
08/09/13 06:10 / raw0.005mg/L0.034Nickel E200.8
08/08/13 17:19 / sld1mg/L1Potassium E200.7
08/09/13 06:10 / raw0.001mg/LNDSilver E200.8
08/08/13 17:19 / sld1mg/L7Sodium E200.7
08/09/13 06:10 / raw0.0005mg/L0.0021Thallium E200.8
08/08/13 17:19 / sld0.01mg/L53.3Zinc E200.7
ReportDefinitions:
RL - Analyte reporting limit. MCL - Maximum contaminant level.
QCL - Quality control limit. ND - Not detected at the reporting limit.
D - RL increased due to sample matrix.
Page 4 of 44

LABORATORY ANALYTICAL REPORT
Client: CDM Federal Programs
Project: Barker Hughsville Pilot
Lab ID: H13080161-002
Client Sample ID 13BH-DT-PILOT-SAPS-080713
Collection Date: 08/07/13 10:45
Matrix: Aqueous
Report Date: 08/21/13
DateReceived: 08/08/13
Prepared by Helena, MT Branch
Analyses Result Units Analysis Date / ByRL Method
MCL/QCLQualifiers
PHYSICAL PROPERTIES
08/08/13 12:02 / glj10mg/L1870Solids, Total Dissolved TDS @ 180 C A2540 C
INORGANICS
D 08/12/13 09:30 / cmm4.0mg/L450Acidity, Total as CaCO3 A2310 B
08/08/13 18:27 / cmm1mg/LNDAlkalinity, Total as CaCO3 A2320 B
08/08/13 18:27 / cmm1mg/L1Bicarbonate as HCO3 A2320 B
08/08/13 18:27 / cmm1mg/LNDCarbonate as CO3 A2320 B
08/08/13 18:27 / cmm1mg/LNDHydroxide as OH A2320 B
08/13/13 12:39 / cmm1mg/LNDChloride E300.0
08/13/13 12:39 / cmm1mg/L1700Sulfate E300.0
D 08/13/13 16:23 / cmm0.2mg/L1.9Fluoride A4500-F C4
NUTRIENTS
08/08/13 14:16 / reh0.005mg/L0.110Phosphorus, Orthophosphate as P E365.1
METALS, DISSOLVED
08/08/13 17:34 / sld0.03mg/L2.55Aluminum E200.7
08/09/13 06:34 / raw0.001mg/L0.004Arsenic E200.8
08/09/13 06:34 / raw0.05mg/LNDBarium E200.8
D 08/10/13 06:31 / raw0.002mg/L0.003Beryllium E200.8
08/09/13 06:34 / raw0.001mg/L0.071Cadmium E200.8
08/09/13 11:51 / sld1mg/L235Calcium E200.7
08/09/13 06:34 / raw0.005mg/LNDChromium E200.8
08/10/13 06:31 / raw0.005mg/L0.059Cobalt E200.8
08/09/13 06:34 / raw0.005mg/L0.020Copper E200.8
08/09/13 11:51 / sld0.03mg/L111Iron E200.7
08/09/13 06:34 / raw0.001mg/L0.002Lead E200.8
08/08/13 17:34 / sld1mg/L21Magnesium E200.7
D 08/09/13 11:51 / sld0.003mg/L120Manganese E200.7
08/09/13 06:34 / raw0.005mg/L0.042Nickel E200.8
08/08/13 17:34 / sld1mg/L1Potassium E200.7
08/09/13 06:34 / raw0.001mg/LNDSilver E200.8
08/08/13 17:34 / sld1mg/L7Sodium E200.7
08/09/13 06:34 / raw0.0005mg/L0.0008Thallium E200.8
08/08/13 17:34 / sld0.01mg/L63.2Zinc E200.7
ReportDefinitions:
RL - Analyte reporting limit. MCL - Maximum contaminant level.
QCL - Quality control limit. ND - Not detected at the reporting limit.
D - RL increased due to sample matrix.
Page 5 of 44

LABORATORY ANALYTICAL REPORT
Client: CDM Federal Programs
Project: Barker Hughsville Pilot
Lab ID: H13080161-003
Client Sample ID 13BH-DT-PILOT-CHIT-080713
Collection Date: 08/07/13 11:00
Matrix: Aqueous
Report Date: 08/21/13
DateReceived: 08/08/13
Prepared by Helena, MT Branch
Analyses Result Units Analysis Date / ByRL Method
MCL/QCLQualifiers
PHYSICAL PROPERTIES
08/08/13 12:02 / glj10mg/L6320Solids, Total Dissolved TDS @ 180 C A2540 C
INORGANICS
D 08/12/13 09:30 / cmm4.0mg/LNDAcidity, Total as CaCO3 A2310 B
08/15/13 15:31 / cmm1mg/L3200Alkalinity, Total as CaCO3 A2320 B
08/15/13 15:31 / cmm1mg/L3900Bicarbonate as HCO3 A2320 B
08/15/13 15:31 / cmm1mg/LNDCarbonate as CO3 A2320 B
08/15/13 15:31 / cmm1mg/LNDHydroxide as OH A2320 B
D 08/15/13 15:21 / cmm10mg/L190Chloride E300.0
D 08/15/13 15:21 / cmm5mg/L780Sulfate E300.0
D 08/13/13 16:24 / cmm0.2mg/L0.2Fluoride A4500-F C4
NUTRIENTS
D 08/08/13 14:03 / reh0.1mg/L40.2Phosphorus, Orthophosphate as P E365.1
METALS, DISSOLVED
08/13/13 03:52 / raw0.03mg/LNDAluminum E200.8
08/09/13 06:39 / raw0.001mg/L0.058Arsenic E200.8
08/09/13 06:39 / raw0.05mg/L0.07Barium E200.8
08/10/13 06:54 / raw0.001mg/LNDBeryllium E200.8
08/09/13 06:39 / raw0.001mg/LNDCadmium E200.8
08/08/13 17:38 / sld1mg/L1060Calcium E200.7
08/09/13 06:39 / raw0.005mg/LNDChromium E200.8
08/10/13 06:54 / raw0.005mg/L0.009Cobalt E200.8
08/09/13 06:39 / raw0.005mg/LNDCopper E200.8
08/08/13 17:38 / sld0.03mg/L1.37Iron E200.7
08/09/13 06:39 / raw0.001mg/LNDLead E200.8
08/08/13 17:38 / sld1mg/L65Magnesium E200.7
D 08/08/13 17:38 / sld0.003mg/L64.3Manganese E200.7
08/09/13 06:39 / raw0.005mg/L0.019Nickel E200.8
08/08/13 17:38 / sld1mg/L16Potassium E200.7
08/09/13 06:39 / raw0.001mg/LNDSilver E200.8
08/08/13 17:38 / sld1mg/L82Sodium E200.7
08/09/13 06:39 / raw0.0005mg/LNDThallium E200.8
08/09/13 06:39 / raw0.01mg/L0.05Zinc E200.8
ReportDefinitions:
RL - Analyte reporting limit. MCL - Maximum contaminant level.
QCL - Quality control limit. ND - Not detected at the reporting limit.
D - RL increased due to sample matrix.
Page 6 of 44

LABORATORY ANALYTICAL REPORT
Client: CDM Federal Programs
Project: Barker Hughsville Pilot
Lab ID: H13080161-004
Client Sample ID 13BH-DT-PILOT-MGOH-080713
Collection Date: 08/07/13 11:15
Matrix: Aqueous
Report Date: 08/21/13
DateReceived: 08/08/13
Prepared by Helena, MT Branch
Analyses Result Units Analysis Date / ByRL Method
MCL/QCLQualifiers
PHYSICAL PROPERTIES
08/08/13 12:02 / glj10mg/L1800Solids, Total Dissolved TDS @ 180 C A2540 C
INORGANICS
D 08/12/13 09:30 / cmm4.0mg/L700Acidity, Total as CaCO3 A2310 B
08/08/13 18:57 / cmm1mg/LNDAlkalinity, Total as CaCO3 A2320 B
08/08/13 18:57 / cmm1mg/LNDBicarbonate as HCO3 A2320 B
08/08/13 18:57 / cmm1mg/LNDCarbonate as CO3 A2320 B
08/08/13 18:57 / cmm1mg/LNDHydroxide as OH A2320 B
08/12/13 17:40 / cmm1mg/LNDChloride E300.0
08/15/13 15:34 / cmm1mg/L2300Sulfate E300.0
D 08/13/13 16:25 / cmm0.2mg/L0.8Fluoride A4500-F C4
NUTRIENTS
08/08/13 14:04 / reh0.005mg/L0.343Phosphorus, Orthophosphate as P E365.1
METALS, DISSOLVED
08/08/13 17:42 / sld0.03mg/L12.8Aluminum E200.7
08/09/13 06:43 / raw0.001mg/L0.152Arsenic E200.8
08/09/13 06:43 / raw0.05mg/LNDBarium E200.8
D 08/10/13 06:59 / raw0.002mg/L0.007Beryllium E200.8
08/09/13 06:43 / raw0.001mg/L0.186Cadmium E200.8
08/09/13 11:55 / sld1mg/L107Calcium E200.7
08/09/13 06:43 / raw0.005mg/LNDChromium E200.8
08/10/13 06:59 / raw0.005mg/L0.051Cobalt E200.8
08/08/13 17:42 / sld0.005mg/L1.57Copper E200.7
08/09/13 11:55 / sld0.03mg/L140Iron E200.7
08/09/13 06:43 / raw0.001mg/L0.165Lead E200.8
08/08/13 17:42 / sld1mg/L29Magnesium E200.7
D 08/09/13 11:55 / sld0.003mg/L117Manganese E200.7
08/09/13 06:43 / raw0.005mg/L0.034Nickel E200.8
08/08/13 17:42 / sld1mg/L1Potassium E200.7
08/09/13 06:43 / raw0.001mg/LNDSilver E200.8
08/08/13 17:42 / sld1mg/L7Sodium E200.7
08/09/13 06:43 / raw0.0005mg/L0.0020Thallium E200.8
08/08/13 17:42 / sld0.01mg/L53.1Zinc E200.7
ReportDefinitions:
RL - Analyte reporting limit. MCL - Maximum contaminant level.
QCL - Quality control limit. ND - Not detected at the reporting limit.
D - RL increased due to sample matrix.
Page 7 of 44

LABORATORY ANALYTICAL REPORT
Client: CDM Federal Programs
Project: Barker Hughsville Pilot
Lab ID: H13080161-005
Client Sample ID 13BH-DT-PILOT-BCR1-080713
Collection Date: 08/07/13 11:40
Matrix: Aqueous
Report Date: 08/21/13
DateReceived: 08/08/13
Prepared by Helena, MT Branch
Analyses Result Units Analysis Date / ByRL Method
MCL/QCLQualifiers
PHYSICAL PROPERTIES
08/08/13 12:02 / glj10mg/L1890Solids, Total Dissolved TDS @ 180 C A2540 C
INORGANICS
D 08/12/13 09:30 / cmm4.0mg/L450Acidity, Total as CaCO3 A2310 B
08/08/13 19:03 / cmm1mg/L76Alkalinity, Total as CaCO3 A2320 B
08/08/13 19:03 / cmm1mg/L92Bicarbonate as HCO3 A2320 B
08/08/13 19:03 / cmm1mg/LNDCarbonate as CO3 A2320 B
08/08/13 19:03 / cmm1mg/LNDHydroxide as OH A2320 B
08/12/13 17:52 / cmm1mg/LNDChloride E300.0
08/13/13 13:04 / cmm1mg/L1400Sulfate E300.0
D 08/13/13 16:25 / cmm0.2mg/L2.0Fluoride A4500-F C4
08/09/13 14:30 / eli-b220.04mg/L0.12Sulfide A4500-S D
NUTRIENTS
08/08/13 14:17 / reh0.005mg/L0.083Phosphorus, Orthophosphate as P E365.1
METALS, DISSOLVED
08/09/13 06:48 / raw0.03mg/L0.29Aluminum E200.8
08/09/13 06:48 / raw0.001mg/L0.015Arsenic E200.8
08/09/13 06:48 / raw0.05mg/L0.10Barium E200.8
08/20/13 09:58 / dck0.001mg/LNDBeryllium E200.8
08/09/13 06:48 / raw0.001mg/LNDCadmium E200.8
08/08/13 17:46 / sld1mg/L233Calcium E200.7
08/09/13 06:48 / raw0.005mg/LNDChromium E200.8
08/10/13 07:04 / raw0.005mg/L0.055Cobalt E200.8
08/09/13 06:48 / raw0.005mg/LNDCopper E200.8
08/08/13 17:46 / sld0.03mg/L138Iron E200.7
08/09/13 06:48 / raw0.001mg/LNDLead E200.8
08/08/13 17:46 / sld1mg/L22Magnesium E200.7
D 08/09/13 11:58 / sld0.003mg/L122Manganese E200.7
08/09/13 06:48 / raw0.005mg/L0.036Nickel E200.8
08/08/13 17:46 / sld1mg/L2Potassium E200.7
08/09/13 06:48 / raw0.001mg/LNDSilver E200.8
08/08/13 17:46 / sld1mg/L6Sodium E200.7
08/09/13 06:48 / raw0.0005mg/LNDThallium E200.8
08/08/13 17:46 / sld0.01mg/L20.7Zinc E200.7
ReportDefinitions:
RL - Analyte reporting limit. MCL - Maximum contaminant level.
QCL - Quality control limit. ND - Not detected at the reporting limit.
D - RL increased due to sample matrix.
Page 8 of 44

LABORATORY ANALYTICAL REPORT
Client: CDM Federal Programs
Project: Barker Hughsville Pilot
Lab ID: H13080161-006
Client Sample ID 13BH-DT-PILOT-BCR2-080713
Collection Date: 08/07/13 11:55
Matrix: Aqueous
Report Date: 08/21/13
DateReceived: 08/08/13
Prepared by Helena, MT Branch
Analyses Result Units Analysis Date / ByRL Method
MCL/QCLQualifiers
PHYSICAL PROPERTIES
08/08/13 12:02 / glj10mg/L1800Solids, Total Dissolved TDS @ 180 C A2540 C
INORGANICS
D 08/12/13 09:30 / cmm4.0mg/L270Acidity, Total as CaCO3 A2310 B
08/08/13 19:08 / cmm1mg/L110Alkalinity, Total as CaCO3 A2320 B
08/08/13 19:08 / cmm1mg/L130Bicarbonate as HCO3 A2320 B
08/08/13 19:08 / cmm1mg/LNDCarbonate as CO3 A2320 B
08/08/13 19:08 / cmm1mg/LNDHydroxide as OH A2320 B
08/12/13 18:05 / cmm1mg/LNDChloride E300.0
08/13/13 13:16 / cmm1mg/L1300Sulfate E300.0
D 08/13/13 16:26 / cmm0.2mg/L1.9Fluoride A4500-F C4
D 08/09/13 14:30 / eli-b220.2mg/L0.7Sulfide A4500-S D
NUTRIENTS
08/08/13 14:18 / reh0.005mg/L0.355Phosphorus, Orthophosphate as P E365.1
METALS, DISSOLVED
08/09/13 06:52 / raw0.03mg/L0.04Aluminum E200.8
08/09/13 06:52 / raw0.001mg/L0.003Arsenic E200.8
08/09/13 06:52 / raw0.05mg/L0.23Barium E200.8
08/10/13 07:08 / raw0.001mg/LNDBeryllium E200.8
08/09/13 06:52 / raw0.001mg/LNDCadmium E200.8
08/08/13 17:50 / sld1mg/L275Calcium E200.7
08/09/13 06:52 / raw0.005mg/LNDChromium E200.8
08/10/13 07:08 / raw0.005mg/L0.029Cobalt E200.8
08/09/13 06:52 / raw0.005mg/LNDCopper E200.8
08/08/13 17:50 / sld0.03mg/L77.0Iron E200.7
08/09/13 06:52 / raw0.001mg/LNDLead E200.8
08/08/13 17:50 / sld1mg/L22Magnesium E200.7
D 08/09/13 12:02 / sld0.003mg/L127Manganese E200.7
08/09/13 06:52 / raw0.005mg/L0.014Nickel E200.8
08/08/13 17:50 / sld1mg/L2Potassium E200.7
08/09/13 06:52 / raw0.001mg/LNDSilver E200.8
08/08/13 17:50 / sld1mg/L7Sodium E200.7
08/09/13 06:52 / raw0.0005mg/LNDThallium E200.8
08/08/13 17:50 / sld0.01mg/L1.58Zinc E200.7
ReportDefinitions:
RL - Analyte reporting limit. MCL - Maximum contaminant level.
QCL - Quality control limit. ND - Not detected at the reporting limit.
D - RL increased due to sample matrix.
Page 9 of 44
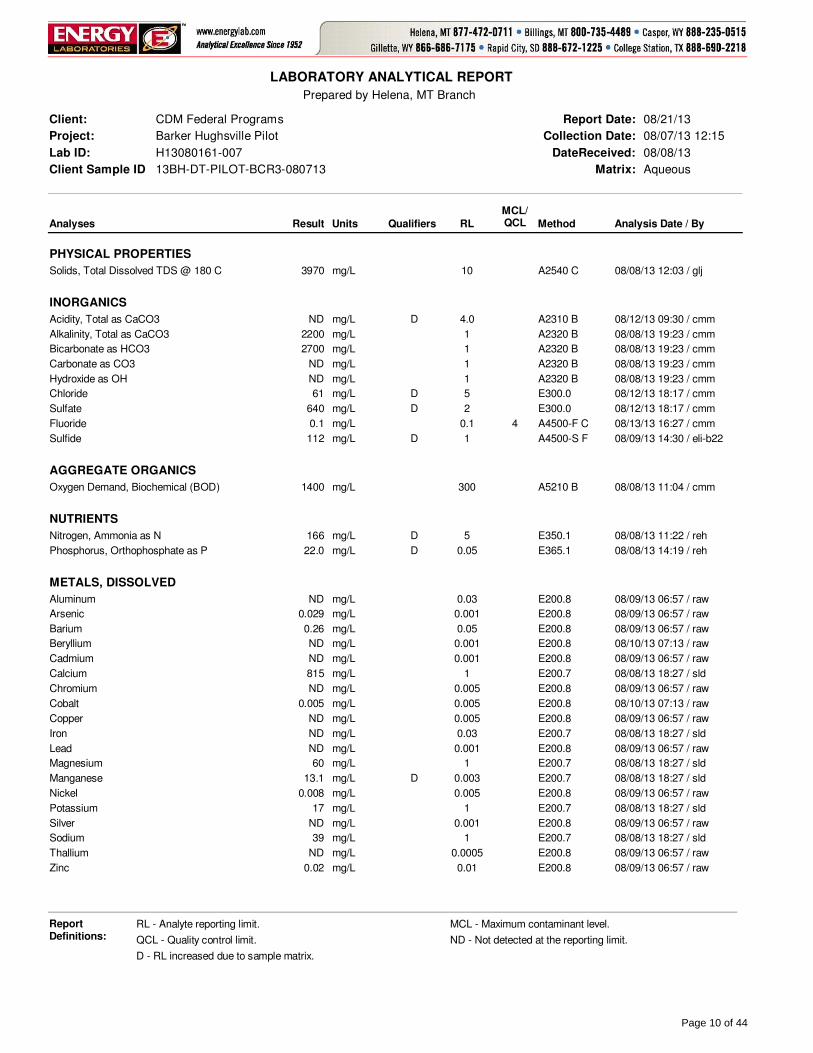
LABORATORY ANALYTICAL REPORT
Client: CDM Federal Programs
Project: Barker Hughsville Pilot
Lab ID: H13080161-007
Client Sample ID 13BH-DT-PILOT-BCR3-080713
Collection Date: 08/07/13 12:15
Matrix: Aqueous
Report Date: 08/21/13
DateReceived: 08/08/13
Prepared by Helena, MT Branch
Analyses Result Units Analysis Date / ByRL Method
MCL/QCLQualifiers
PHYSICAL PROPERTIES
08/08/13 12:03 / glj10mg/L3970Solids, Total Dissolved TDS @ 180 C A2540 C
INORGANICS
D 08/12/13 09:30 / cmm4.0mg/LNDAcidity, Total as CaCO3 A2310 B
08/08/13 19:23 / cmm1mg/L2200Alkalinity, Total as CaCO3 A2320 B
08/08/13 19:23 / cmm1mg/L2700Bicarbonate as HCO3 A2320 B
08/08/13 19:23 / cmm1mg/LNDCarbonate as CO3 A2320 B
08/08/13 19:23 / cmm1mg/LNDHydroxide as OH A2320 B
D 08/12/13 18:17 / cmm5mg/L61Chloride E300.0
D 08/12/13 18:17 / cmm2mg/L640Sulfate E300.0
08/13/13 16:27 / cmm0.1mg/L0.1Fluoride A4500-F C4
D 08/09/13 14:30 / eli-b221mg/L112Sulfide A4500-S F
AGGREGATE ORGANICS
08/08/13 11:04 / cmm300mg/L1400Oxygen Demand, Biochemical (BOD) A5210 B
NUTRIENTS
D 08/08/13 11:22 / reh5mg/L166Nitrogen, Ammonia as N E350.1
D 08/08/13 14:19 / reh0.05mg/L22.0Phosphorus, Orthophosphate as P E365.1
METALS, DISSOLVED
08/09/13 06:57 / raw0.03mg/LNDAluminum E200.8
08/09/13 06:57 / raw0.001mg/L0.029Arsenic E200.8
08/09/13 06:57 / raw0.05mg/L0.26Barium E200.8
08/10/13 07:13 / raw0.001mg/LNDBeryllium E200.8
08/09/13 06:57 / raw0.001mg/LNDCadmium E200.8
08/08/13 18:27 / sld1mg/L815Calcium E200.7
08/09/13 06:57 / raw0.005mg/LNDChromium E200.8
08/10/13 07:13 / raw0.005mg/L0.005Cobalt E200.8
08/09/13 06:57 / raw0.005mg/LNDCopper E200.8
08/08/13 18:27 / sld0.03mg/LNDIron E200.7
08/09/13 06:57 / raw0.001mg/LNDLead E200.8
08/08/13 18:27 / sld1mg/L60Magnesium E200.7
D 08/08/13 18:27 / sld0.003mg/L13.1Manganese E200.7
08/09/13 06:57 / raw0.005mg/L0.008Nickel E200.8
08/08/13 18:27 / sld1mg/L17Potassium E200.7
08/09/13 06:57 / raw0.001mg/LNDSilver E200.8
08/08/13 18:27 / sld1mg/L39Sodium E200.7
08/09/13 06:57 / raw0.0005mg/LNDThallium E200.8
08/09/13 06:57 / raw0.01mg/L0.02Zinc E200.8
ReportDefinitions:
RL - Analyte reporting limit. MCL - Maximum contaminant level.
QCL - Quality control limit. ND - Not detected at the reporting limit.
D - RL increased due to sample matrix.
Page 10 of 44

LABORATORY ANALYTICAL REPORT
Client: CDM Federal Programs
Project: Barker Hughsville Pilot
Lab ID: H13080161-008
Client Sample ID 13BH-DT-PILOT-BCR4-080713
Collection Date: 08/07/13 12:45
Matrix: Aqueous
Report Date: 08/21/13
DateReceived: 08/08/13
Prepared by Helena, MT Branch
Analyses Result Units Analysis Date / ByRL Method
MCL/QCLQualifiers
PHYSICAL PROPERTIES
08/08/13 12:03 / glj10mg/L1840Solids, Total Dissolved TDS @ 180 C A2540 C
INORGANICS
D 08/12/13 09:30 / cmm4.0mg/L260Acidity, Total as CaCO3 A2310 B
08/08/13 19:29 / cmm1mg/L100Alkalinity, Total as CaCO3 A2320 B
08/08/13 19:29 / cmm1mg/L120Bicarbonate as HCO3 A2320 B
08/08/13 19:29 / cmm1mg/LNDCarbonate as CO3 A2320 B
08/08/13 19:29 / cmm1mg/LNDHydroxide as OH A2320 B
08/12/13 18:30 / cmm1mg/LNDChloride E300.0
08/13/13 13:29 / cmm1mg/L1300Sulfate E300.0
D 08/13/13 16:28 / cmm0.2mg/L1.9Fluoride A4500-F C4
D 08/09/13 14:30 / eli-b220.2mg/L0.7Sulfide A4500-S D
NUTRIENTS
08/08/13 14:20 / reh0.005mg/L0.085Phosphorus, Orthophosphate as P E365.1
METALS, DISSOLVED
08/09/13 07:02 / raw0.03mg/L0.05Aluminum E200.8
08/09/13 07:02 / raw0.001mg/L0.005Arsenic E200.8
08/09/13 07:02 / raw0.05mg/L0.23Barium E200.8
08/14/13 20:19 / dck0.001mg/LNDBeryllium E200.8
08/09/13 07:02 / raw0.001mg/LNDCadmium E200.8
08/08/13 18:31 / sld1mg/L252Calcium E200.7
08/09/13 07:02 / raw0.005mg/LNDChromium E200.8
08/10/13 07:18 / raw0.005mg/L0.042Cobalt E200.8
08/09/13 07:02 / raw0.005mg/LNDCopper E200.8
08/08/13 18:31 / sld0.03mg/L65.4Iron E200.7
08/09/13 07:02 / raw0.001mg/LNDLead E200.8
08/08/13 18:31 / sld1mg/L40Magnesium E200.7
D 08/09/13 12:13 / sld0.003mg/L146Manganese E200.7
08/09/13 07:02 / raw0.005mg/L0.018Nickel E200.8
08/08/13 18:31 / sld1mg/L1Potassium E200.7
08/09/13 07:02 / raw0.001mg/LNDSilver E200.8
08/08/13 18:31 / sld1mg/L5Sodium E200.7
08/09/13 07:02 / raw0.0005mg/LNDThallium E200.8
08/08/13 18:31 / sld0.01mg/L7.36Zinc E200.7
ReportDefinitions:
RL - Analyte reporting limit. MCL - Maximum contaminant level.
QCL - Quality control limit. ND - Not detected at the reporting limit.
D - RL increased due to sample matrix.
Page 11 of 44

LABORATORY ANALYTICAL REPORT
Client: CDM Federal Programs
Project: Barker Hughsville Pilot
Lab ID: H13080161-009
Client Sample ID 13BH-DT-PILOT-BDR4-080713
Collection Date: 08/07/13 12:50
Matrix: Aqueous
Report Date: 08/21/13
DateReceived: 08/08/13
Prepared by Helena, MT Branch
Analyses Result Units Analysis Date / ByRL Method
MCL/QCLQualifiers
PHYSICAL PROPERTIES
08/08/13 12:03 / glj10mg/L1820Solids, Total Dissolved TDS @ 180 C A2540 C
INORGANICS
D 08/12/13 09:30 / cmm4.0mg/L270Acidity, Total as CaCO3 A2310 B
08/08/13 19:35 / cmm1mg/L100Alkalinity, Total as CaCO3 A2320 B
08/08/13 19:35 / cmm1mg/L130Bicarbonate as HCO3 A2320 B
08/08/13 19:35 / cmm1mg/LNDCarbonate as CO3 A2320 B
08/08/13 19:35 / cmm1mg/LNDHydroxide as OH A2320 B
08/12/13 18:43 / cmm1mg/LNDChloride E300.0
08/13/13 13:42 / cmm1mg/L1200Sulfate E300.0
D 08/13/13 16:28 / cmm0.2mg/L1.9Fluoride A4500-F C4
D 08/09/13 14:30 / eli-b220.2mg/L0.9Sulfide A4500-S D
NUTRIENTS
08/08/13 14:21 / reh0.005mg/L0.143Phosphorus, Orthophosphate as P E365.1
METALS, DISSOLVED
08/09/13 07:06 / raw0.03mg/L0.05Aluminum E200.8
08/09/13 07:06 / raw0.001mg/L0.005Arsenic E200.8
08/09/13 07:06 / raw0.05mg/L0.24Barium E200.8
08/14/13 20:24 / dck0.001mg/LNDBeryllium E200.8
08/09/13 07:06 / raw0.001mg/LNDCadmium E200.8
08/08/13 18:35 / sld1mg/L253Calcium E200.7
08/09/13 07:06 / raw0.005mg/LNDChromium E200.8
08/10/13 07:41 / raw0.005mg/L0.037Cobalt E200.8
08/09/13 07:06 / raw0.005mg/LNDCopper E200.8
08/08/13 18:35 / sld0.03mg/L65.4Iron E200.7
08/09/13 07:06 / raw0.001mg/LNDLead E200.8
08/08/13 18:35 / sld1mg/L41Magnesium E200.7
D 08/09/13 12:17 / sld0.003mg/L147Manganese E200.7
08/09/13 07:06 / raw0.005mg/L0.018Nickel E200.8
08/08/13 18:35 / sld1mg/L2Potassium E200.7
08/09/13 07:06 / raw0.001mg/LNDSilver E200.8
08/08/13 18:35 / sld1mg/L7Sodium E200.7
08/09/13 07:06 / raw0.0005mg/LNDThallium E200.8
08/08/13 18:35 / sld0.01mg/L7.08Zinc E200.7
ReportDefinitions:
RL - Analyte reporting limit. MCL - Maximum contaminant level.
QCL - Quality control limit. ND - Not detected at the reporting limit.
D - RL increased due to sample matrix.
Page 12 of 44

LABORATORY ANALYTICAL REPORT
Client: CDM Federal Programs
Project: Barker Hughsville Pilot
Lab ID: H13080161-010
Client Sample ID 13BH-DT-PILOT-BCR3-POST-080713
Collection Date: 08/07/13 14:35
Matrix: Aqueous
Report Date: 08/21/13
DateReceived: 08/08/13
Prepared by Helena, MT Branch
Analyses Result Units Analysis Date / ByRL Method
MCL/QCLQualifiers
INORGANICS
D 08/09/13 14:30 / eli-b220.2mg/L1.7Sulfide A4500-S D
AGGREGATE ORGANICS
08/08/13 11:06 / cmm300mg/L1700Oxygen Demand, Biochemical (BOD) A5210 B
NUTRIENTS
D 08/08/13 11:39 / reh10mg/L237Nitrogen, Ammonia as N E350.1
ReportDefinitions:
RL - Analyte reporting limit. MCL - Maximum contaminant level.
QCL - Quality control limit. ND - Not detected at the reporting limit.
D - RL increased due to sample matrix.
Page 13 of 44

Project: Barker Hughsville Pilot
Client: CDM Federal Programs
Work Order: H13080161
QA/QC Summary Report
08/29/13Report Date:
Analyte Result %REC RPDLow Limit High Limit RPDLimitRLUnits QualCount
Prepared by Helena, MT Branch
Method: A2310 B Batch: H13080161-001A
Sample ID: H13080161-009ADUP 08/12/13 09:30Sample Duplicate Run: MISC WC_130812A
Acidity, Total as CaCO3 204.0 2.9280 mg/L
Sample ID: LCS1308120930 08/12/13 09:30Laboratory Control Sample Run: MISC WC_130812A
Acidity, Total as CaCO3 102 90 1104.0670 mg/L
Sample ID: MBLK1308120930 08/12/13 09:30Method Blank Run: MISC WC_130812A
Acidity, Total as CaCO3 310 mg/L
Qualifiers:
RL - Analyte reporting limit. ND - Not detected at the reporting limit.
Page 14 of 44

Project: Barker Hughsville Pilot
Client: CDM Federal Programs
Work Order: H13080161
QA/QC Summary Report
08/29/13Report Date:
Analyte Result %REC RPDLow Limit High Limit RPDLimitRLUnits QualCount
Prepared by Helena, MT Branch
Method: A2320 B Batch: R90332
Sample ID: MBLK 08/08/13 13:56Method Blank Run: MAN-TECH_130808A
Alkalinity, Total as CaCO3 2ND mg/L
Sample ID: LCS-07222013 08/08/13 14:03Laboratory Control Sample Run: MAN-TECH_130808A
Alkalinity, Total as CaCO3 105 90 1104.0630 mg/L
Sample ID: H13080121-002ADUP 08/08/13 14:29Sample Duplicate Run: MAN-TECH_130808A3
Alkalinity, Total as CaCO3 104.0 0.1800 mg/L
Bicarbonate as HCO3 104.0 0.4910 mg/L
Carbonate as CO3 104.0 4.932 mg/L
Sample ID: H13080158-009ADUP 08/08/13 16:54Sample Duplicate Run: MAN-TECH_130808A3
Alkalinity, Total as CaCO3 104.0 0.4450 mg/L
Bicarbonate as HCO3 104.0 0.2490 mg/L
Carbonate as CO3 104.0 1.831 mg/L
Sample ID: H13080158-010AMS 08/08/13 17:12Sample Matrix Spike Run: MAN-TECH_130808A
Alkalinity, Total as CaCO3 108 80 1204.01300 mg/L
Sample ID: MBLK 08/08/13 17:19Method Blank Run: MAN-TECH_130808A
Alkalinity, Total as CaCO3 2ND mg/L
Sample ID: LCS-0722013 08/08/13 17:26Laboratory Control Sample Run: MAN-TECH_130808A
Alkalinity, Total as CaCO3 106 90 1104.0630 mg/L
Sample ID: H13080159-001ADUP 08/08/13 17:43Sample Duplicate Run: MAN-TECH_130808A3
Alkalinity, Total as CaCO3 104.0 0.1800 mg/L
Bicarbonate as HCO3 104.0 0.1970 mg/L
Carbonate as CO3 104.0ND mg/L
Sample ID: H13080161-001ADUP 08/08/13 18:22Sample Duplicate Run: MAN-TECH_130808A3
Alkalinity, Total as CaCO3 104.0ND mg/L
Bicarbonate as HCO3 104.0ND mg/L
Carbonate as CO3 104.0ND mg/L
Sample ID: H13080161-002AMS 08/08/13 18:34Sample Matrix Spike Run: MAN-TECH_130808A
Alkalinity, Total as CaCO3 80 80 1204.0480 mg/L
Qualifiers:
RL - Analyte reporting limit. ND - Not detected at the reporting limit.
Page 15 of 44

Project: Barker Hughsville Pilot
Client: CDM Federal Programs
Work Order: H13080161
QA/QC Summary Report
08/29/13Report Date:
Analyte Result %REC RPDLow Limit High Limit RPDLimitRLUnits QualCount
Prepared by Helena, MT Branch
Method: A2320 B Batch: R90533
Sample ID: MBLK 08/15/13 15:04Method Blank Run: MAN-TECH_130815B
Alkalinity, Total as CaCO3 2ND mg/L
Sample ID: LCS 08/15/13 15:12Laboratory Control Sample Run: MAN-TECH_130815B
Alkalinity, Total as CaCO3 104 90 1104.0630 mg/L
Sample ID: H13080192-004ADUP 08/15/13 16:08Sample Duplicate Run: MAN-TECH_130815B3
Alkalinity, Total as CaCO3 104.0 0.21300 mg/L
Bicarbonate as HCO3 104.0 0.21600 mg/L
Carbonate as CO3 104.0ND mg/L
Sample ID: H13080283-001AMS 08/15/13 16:31Sample Matrix Spike Run: MAN-TECH_130815B
Alkalinity, Total as CaCO3 96 80 1204.02000 mg/L
Qualifiers:
RL - Analyte reporting limit. ND - Not detected at the reporting limit.
Page 16 of 44
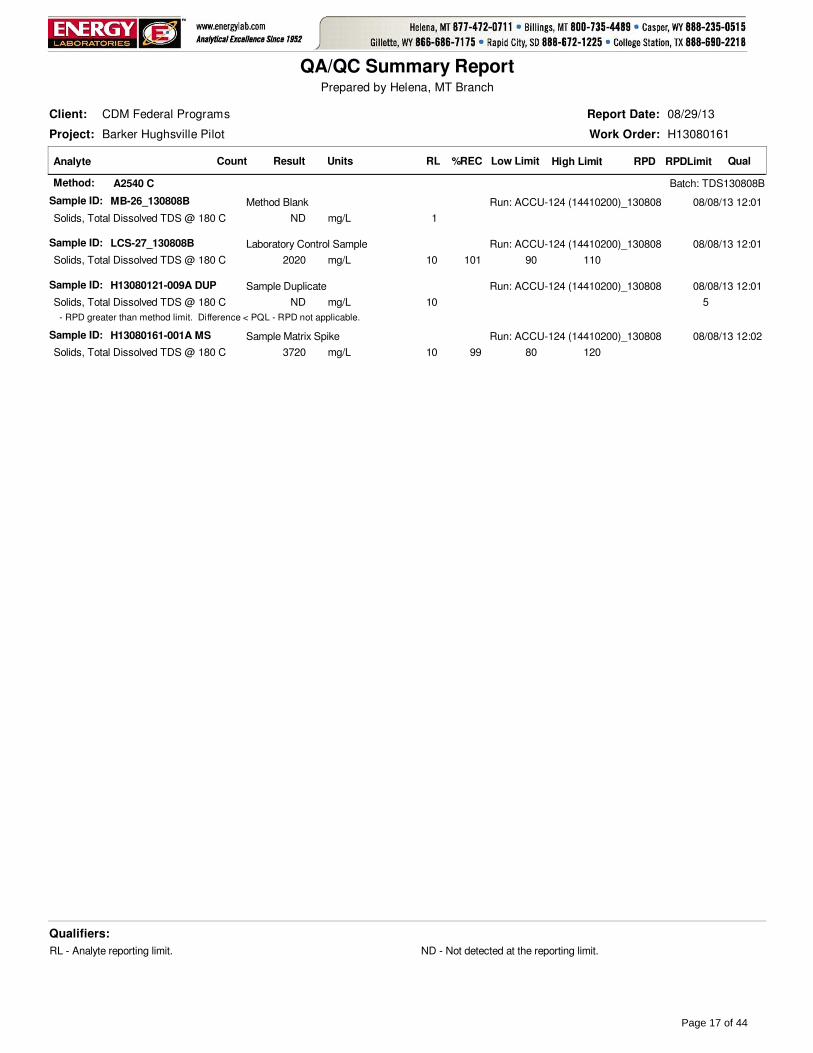
Project: Barker Hughsville Pilot
Client: CDM Federal Programs
Work Order: H13080161
QA/QC Summary Report
08/29/13Report Date:
Analyte Result %REC RPDLow Limit High Limit RPDLimitRLUnits QualCount
Prepared by Helena, MT Branch
Method: A2540 C Batch: TDS130808B
Sample ID: MB-26_130808B 08/08/13 12:01Method Blank Run: ACCU-124 (14410200)_130808
Solids, Total Dissolved TDS @ 180 C 1ND mg/L
Sample ID: LCS-27_130808B 08/08/13 12:01Laboratory Control Sample Run: ACCU-124 (14410200)_130808
Solids, Total Dissolved TDS @ 180 C 101 90 110102020 mg/L
Sample ID: H13080121-009A DUP 08/08/13 12:01Sample Duplicate Run: ACCU-124 (14410200)_130808
Solids, Total Dissolved TDS @ 180 C 510ND mg/L
- RPD greater than method limit. Difference < PQL - RPD not applicable.
Sample ID: H13080161-001A MS 08/08/13 12:02Sample Matrix Spike Run: ACCU-124 (14410200)_130808
Solids, Total Dissolved TDS @ 180 C 99 80 120103720 mg/L
Qualifiers:
RL - Analyte reporting limit. ND - Not detected at the reporting limit.
Page 17 of 44

Project: Barker Hughsville Pilot
Client: CDM Federal Programs
Work Order: H13080161
QA/QC Summary Report
08/29/13Report Date:
Analyte Result %REC RPDLow Limit High Limit RPDLimitRLUnits QualCount
Prepared by Helena, MT Branch
Method: A4500-F C Analytical Run: PH_130813A
Sample ID: ICV1_130813A 08/13/13 15:05Initial Calibration Verification Standard
Fluoride 97 90 1100.10.7 mg/L
Sample ID: CCV4_130813A 08/13/13 16:18Continuing Calibration Verification Standard
Fluoride 99 90 1100.10.2 mg/L
Method: A4500-F C Batch: 130813A-F-ISE-W
Sample ID: MBLK1_130813A 08/13/13 15:04Method Blank Run: PH_130813A
Fluoride 0.0050.01 mg/L
Sample ID: LFB1_130813A 08/13/13 15:09Laboratory Fortified Blank Run: PH_130813A
Fluoride 99 90 1100.10.5 mg/L
Sample ID: H13080161-001AMS 08/13/13 16:20Sample Matrix Spike Run: PH_130813A
Fluoride 35 85 1150.21.1 mg/L S
Sample ID: H13080161-001AMSD 08/13/13 16:20Sample Matrix Spike Duplicate Run: PH_130813A
Fluoride 35 85 115 100.2 0.41.1 mg/L S
Sample ID: H13080192-001AMS 08/13/13 16:34Sample Matrix Spike Run: PH_130813A
Fluoride 91 85 1151.08.8 mg/L
Sample ID: H13080192-001AMSD 08/13/13 16:35Sample Matrix Spike Duplicate Run: PH_130813A
Fluoride 92 85 115 101.0 0.38.8 mg/L
Qualifiers:
RL - Analyte reporting limit. ND - Not detected at the reporting limit.
S - Spike recovery outside of advisory limits.
Page 18 of 44

Project: Barker Hughsville Pilot
Client: CDM Federal Programs
Work Order: H13080161
QA/QC Summary Report
08/29/13Report Date:
Analyte Result %REC RPDLow Limit High Limit RPDLimitRLUnits QualCount
Prepared by Helena, MT Branch
Method: A4500-S D Batch: B_R209723
Sample ID: MB-R209723 08/09/13 14:30Method Blank Run: SUB-B209723
Sulfide 0.002ND mg/L
Sample ID: LCS-R209723 08/09/13 14:30Laboratory Control Sample Run: SUB-B209723
Sulfide 111 70 1300.0400.275 mg/L
Sample ID: H13080167-001H 08/09/13 14:30Sample Matrix Spike Run: SUB-B209723
Sulfide 34 70 1300.0400.0959 mg/L S
- Matrix spike recoveries outside the acceptance range are considered matrix-related.
Sample ID: H13080167-001H 08/09/13 14:30Sample Matrix Spike Duplicate Run: SUB-B209723
Sulfide 38 70 130 200.040 8.60.104 mg/L S
- Matrix spike recoveries outside the acceptance range are considered matrix-related.
Qualifiers:
RL - Analyte reporting limit. ND - Not detected at the reporting limit.
S - Spike recovery outside of advisory limits.
Page 19 of 44

Project: Barker Hughsville Pilot
Client: CDM Federal Programs
Work Order: H13080161
QA/QC Summary Report
08/29/13Report Date:
Analyte Result %REC RPDLow Limit High Limit RPDLimitRLUnits QualCount
Prepared by Helena, MT Branch
Method: A4500-S F Batch: B_R209724
Sample ID: MB-R209724 08/09/13 14:30Method Blank Run: SUB-B209724
Sulfide 0.5ND mg/L
Sample ID: LCS-R209724 08/09/13 14:30Laboratory Control Sample Run: SUB-B209724
Sulfide 101 70 1301.033.3 mg/L
Sample ID: H13080161-005C 08/09/13 14:30Sample Matrix Spike Run: SUB-B209724
Sulfide 97 80 1201.033.6 mg/L
Sample ID: H13080161-005C 08/09/13 14:30Sample Matrix Spike Duplicate Run: SUB-B209724
Sulfide 96 80 120 201.0 1.233.2 mg/L
Qualifiers:
RL - Analyte reporting limit. ND - Not detected at the reporting limit.
Page 20 of 44

Project: Barker Hughsville Pilot
Client: CDM Federal Programs
Work Order: H13080161
QA/QC Summary Report
08/29/13Report Date:
Analyte Result %REC RPDLow Limit High Limit RPDLimitRLUnits QualCount
Prepared by Helena, MT Branch
Method: A5210 B Batch: 130808_1_BOD5-W
Sample ID: Dil-H201_130808 08/08/13 10:59Dilution Water Blank Run: MISC WC_130808A
Oxygen Demand, Biochemical (BOD) 0 0.22.00.27 mg/L
Dilution water blank exceeds 0.2 mg/L.
Sample ID: GGA1_130808 08/08/13 11:01Laboratory Control Sample Run: MISC WC_130808A
Oxygen Demand, Biochemical (BOD) 97 85 11553190 mg/L
Sample ID: H13070399-010ADUP 08/08/13 11:03Sample Duplicate Run: MISC WC_130808A
Oxygen Demand, Biochemical (BOD) 90 110 1032 0.238 mg/L
Qualifiers:
RL - Analyte reporting limit. ND - Not detected at the reporting limit.
Page 21 of 44

Project: Barker Hughsville Pilot
Client: CDM Federal Programs
Work Order: H13080161
QA/QC Summary Report
08/29/13Report Date:
Analyte Result %REC RPDLow Limit High Limit RPDLimitRLUnits QualCount
Prepared by Helena, MT Branch
Method: E200.7 Analytical Run: ICP2-HE_130808A
Sample ID: ICV 08/08/13 09:38Initial Calibration Verification Standard9
Aluminum 102 95 1050.104.08 mg/L
Calcium 102 95 1051.040.7 mg/L
Copper 101 95 1050.0100.805 mg/L
Iron 100 95 1050.0303.99 mg/L
Magnesium 101 95 1051.040.5 mg/L
Manganese 100 95 1050.0103.98 mg/L
Potassium 99 95 1051.039.6 mg/L
Sodium 99 95 1051.039.7 mg/L
Zinc 98 95 1050.0100.785 mg/L
Sample ID: CCV-1 08/08/13 09:41Continuing Calibration Verification Standard9
Aluminum 102 95 1050.102.54 mg/L
Calcium 102 95 1051.025.5 mg/L
Copper 101 95 1050.0102.52 mg/L
Iron 100 95 1050.0302.51 mg/L
Magnesium 101 95 1051.025.3 mg/L
Manganese 100 95 1050.0102.51 mg/L
Potassium 99 95 1051.024.8 mg/L
Sodium 99 95 1051.024.7 mg/L
Zinc 101 95 1050.0102.52 mg/L
Sample ID: ICSA 08/08/13 09:52Interference Check Sample A9
Aluminum 106 80 1200.10531 mg/L
Calcium 98 80 1201.0492 mg/L
Copper 0 00.0100.00219 mg/L
Iron 96 80 1200.030192 mg/L
Magnesium 104 80 1201.0519 mg/L
Manganese 0 00.0100.00567 mg/L
Potassium 0 01.0-0.0129 mg/L
Sodium 0 01.00.00926 mg/L
Zinc 0 00.0100.0116 mg/L
Sample ID: ICSAB 08/08/13 09:56Interference Check Sample AB9
Aluminum 105 80 1200.10525 mg/L
Calcium 97 80 1201.0485 mg/L
Copper 102 80 1200.0100.510 mg/L
Iron 95 80 1200.030190 mg/L
Magnesium 103 80 1201.0516 mg/L
Manganese 99 80 1200.0100.494 mg/L
Potassium 115 80 1201.023.1 mg/L
Sodium 115 80 1201.023.1 mg/L
Zinc 98 80 1200.0100.976 mg/L
Sample ID: CCV 08/08/13 17:08Continuing Calibration Verification Standard9
Aluminum 95 90 1100.102.38 mg/L
Qualifiers:
RL - Analyte reporting limit. ND - Not detected at the reporting limit.
Page 22 of 44
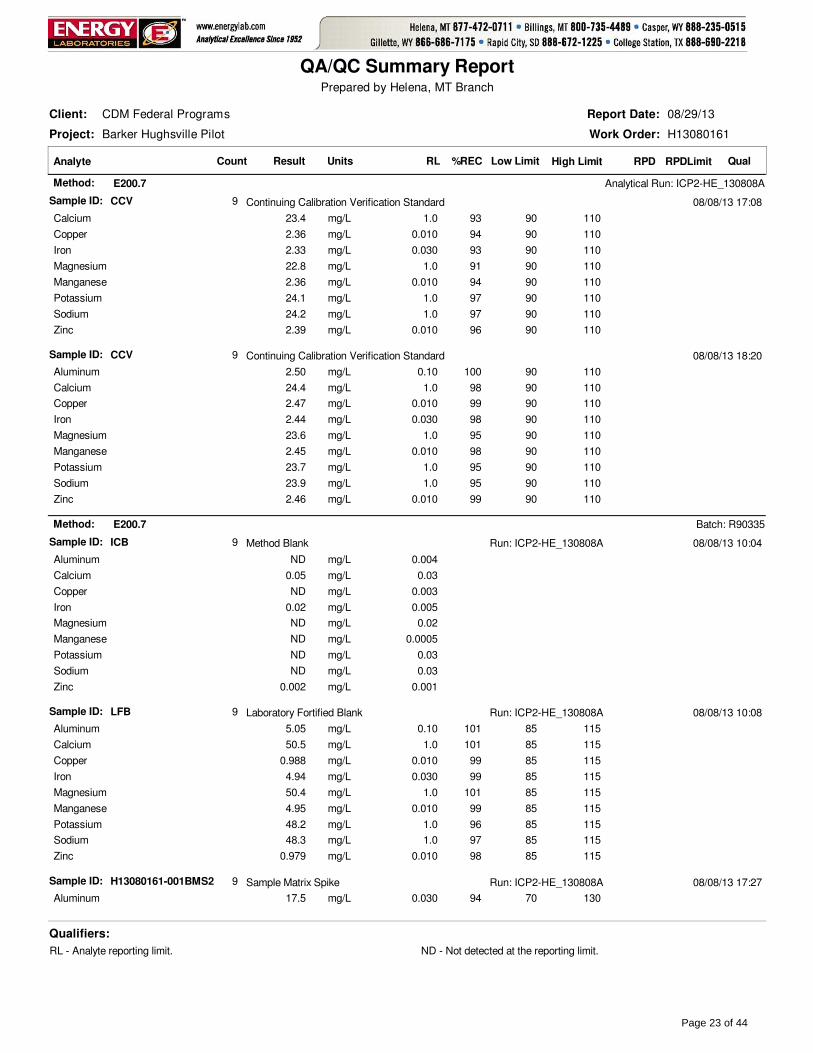
Project: Barker Hughsville Pilot
Client: CDM Federal Programs
Work Order: H13080161
QA/QC Summary Report
08/29/13Report Date:
Analyte Result %REC RPDLow Limit High Limit RPDLimitRLUnits QualCount
Prepared by Helena, MT Branch
Method: E200.7 Analytical Run: ICP2-HE_130808A
Sample ID: CCV 08/08/13 17:08Continuing Calibration Verification Standard9
Calcium 93 90 1101.023.4 mg/L
Copper 94 90 1100.0102.36 mg/L
Iron 93 90 1100.0302.33 mg/L
Magnesium 91 90 1101.022.8 mg/L
Manganese 94 90 1100.0102.36 mg/L
Potassium 97 90 1101.024.1 mg/L
Sodium 97 90 1101.024.2 mg/L
Zinc 96 90 1100.0102.39 mg/L
Sample ID: CCV 08/08/13 18:20Continuing Calibration Verification Standard9
Aluminum 100 90 1100.102.50 mg/L
Calcium 98 90 1101.024.4 mg/L
Copper 99 90 1100.0102.47 mg/L
Iron 98 90 1100.0302.44 mg/L
Magnesium 95 90 1101.023.6 mg/L
Manganese 98 90 1100.0102.45 mg/L
Potassium 95 90 1101.023.7 mg/L
Sodium 95 90 1101.023.9 mg/L
Zinc 99 90 1100.0102.46 mg/L
Method: E200.7 Batch: R90335
Sample ID: ICB 08/08/13 10:04Method Blank Run: ICP2-HE_130808A9
Aluminum 0.004ND mg/L
Calcium 0.030.05 mg/L
Copper 0.003ND mg/L
Iron 0.0050.02 mg/L
Magnesium 0.02ND mg/L
Manganese 0.0005ND mg/L
Potassium 0.03ND mg/L
Sodium 0.03ND mg/L
Zinc 0.0010.002 mg/L
Sample ID: LFB 08/08/13 10:08Laboratory Fortified Blank Run: ICP2-HE_130808A9
Aluminum 101 85 1150.105.05 mg/L
Calcium 101 85 1151.050.5 mg/L
Copper 99 85 1150.0100.988 mg/L
Iron 99 85 1150.0304.94 mg/L
Magnesium 101 85 1151.050.4 mg/L
Manganese 99 85 1150.0104.95 mg/L
Potassium 96 85 1151.048.2 mg/L
Sodium 97 85 1151.048.3 mg/L
Zinc 98 85 1150.0100.979 mg/L
Sample ID: H13080161-001BMS2 08/08/13 17:27Sample Matrix Spike Run: ICP2-HE_130808A9
Aluminum 94 70 1300.03017.5 mg/L
Qualifiers:
RL - Analyte reporting limit. ND - Not detected at the reporting limit.
Page 23 of 44
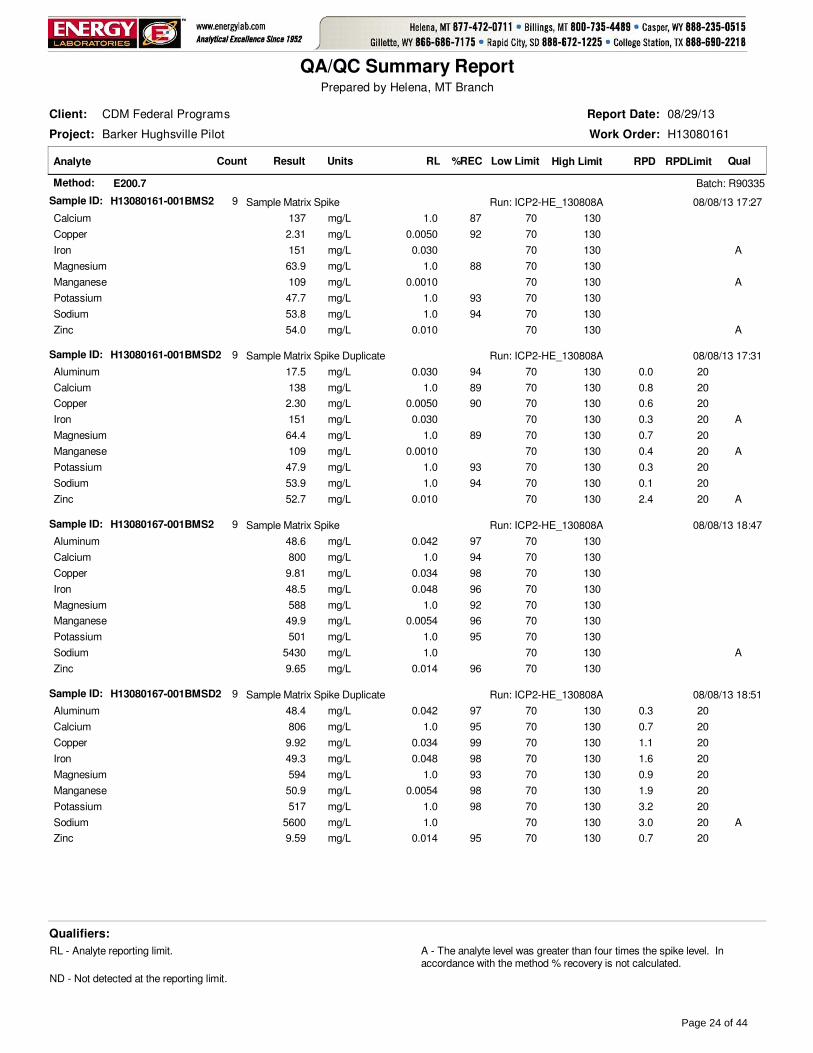
Project: Barker Hughsville Pilot
Client: CDM Federal Programs
Work Order: H13080161
QA/QC Summary Report
08/29/13Report Date:
Analyte Result %REC RPDLow Limit High Limit RPDLimitRLUnits QualCount
Prepared by Helena, MT Branch
Method: E200.7 Batch: R90335
Sample ID: H13080161-001BMS2 08/08/13 17:27Sample Matrix Spike Run: ICP2-HE_130808A9
Calcium 87 70 1301.0137 mg/L
Copper 92 70 1300.00502.31 mg/L
Iron 70 1300.030151 mg/L A
Magnesium 88 70 1301.063.9 mg/L
Manganese 70 1300.0010109 mg/L A
Potassium 93 70 1301.047.7 mg/L
Sodium 94 70 1301.053.8 mg/L
Zinc 70 1300.01054.0 mg/L A
Sample ID: H13080161-001BMSD2 08/08/13 17:31Sample Matrix Spike Duplicate Run: ICP2-HE_130808A9
Aluminum 94 70 130 200.030 0.017.5 mg/L
Calcium 89 70 130 201.0 0.8138 mg/L
Copper 90 70 130 200.0050 0.62.30 mg/L
Iron 70 130 200.030 0.3151 mg/L A
Magnesium 89 70 130 201.0 0.764.4 mg/L
Manganese 70 130 200.0010 0.4109 mg/L A
Potassium 93 70 130 201.0 0.347.9 mg/L
Sodium 94 70 130 201.0 0.153.9 mg/L
Zinc 70 130 200.010 2.452.7 mg/L A
Sample ID: H13080167-001BMS2 08/08/13 18:47Sample Matrix Spike Run: ICP2-HE_130808A9
Aluminum 97 70 1300.04248.6 mg/L
Calcium 94 70 1301.0800 mg/L
Copper 98 70 1300.0349.81 mg/L
Iron 96 70 1300.04848.5 mg/L
Magnesium 92 70 1301.0588 mg/L
Manganese 96 70 1300.005449.9 mg/L
Potassium 95 70 1301.0501 mg/L
Sodium 70 1301.05430 mg/L A
Zinc 96 70 1300.0149.65 mg/L
Sample ID: H13080167-001BMSD2 08/08/13 18:51Sample Matrix Spike Duplicate Run: ICP2-HE_130808A9
Aluminum 97 70 130 200.042 0.348.4 mg/L
Calcium 95 70 130 201.0 0.7806 mg/L
Copper 99 70 130 200.034 1.19.92 mg/L
Iron 98 70 130 200.048 1.649.3 mg/L
Magnesium 93 70 130 201.0 0.9594 mg/L
Manganese 98 70 130 200.0054 1.950.9 mg/L
Potassium 98 70 130 201.0 3.2517 mg/L
Sodium 70 130 201.0 3.05600 mg/L A
Zinc 95 70 130 200.014 0.79.59 mg/L
Qualifiers:
RL - Analyte reporting limit. A - The analyte level was greater than four times the spike level. In accordance with the method % recovery is not calculated.
ND - Not detected at the reporting limit.
Page 24 of 44

Project: Barker Hughsville Pilot
Client: CDM Federal Programs
Work Order: H13080161
QA/QC Summary Report
08/29/13Report Date:
Analyte Result %REC RPDLow Limit High Limit RPDLimitRLUnits QualCount
Prepared by Helena, MT Branch
Method: E200.7 Analytical Run: ICP2-HE_130809A
Sample ID: ICV 08/09/13 10:34Initial Calibration Verification Standard3
Calcium 101 95 1051.040.5 mg/L
Iron 101 95 1050.0304.03 mg/L
Manganese 98 95 1050.0103.93 mg/L
Sample ID: CCV-1 08/09/13 10:37Continuing Calibration Verification Standard3
Calcium 101 95 1051.025.3 mg/L
Iron 101 95 1050.0302.51 mg/L
Manganese 98 95 1050.0102.45 mg/L
Sample ID: ICSA 08/09/13 10:48Interference Check Sample A3
Calcium 95 80 1201.0473 mg/L
Iron 95 80 1200.030190 mg/L
Manganese 0 00.0100.00389 mg/L
Sample ID: ICSAB 08/09/13 10:52Interference Check Sample AB3
Calcium 94 80 1201.0468 mg/L
Iron 94 80 1200.030188 mg/L
Manganese 95 80 1200.0100.475 mg/L
Sample ID: CCV 08/09/13 11:22Continuing Calibration Verification Standard3
Calcium 99 90 1101.024.9 mg/L
Iron 99 90 1100.0302.48 mg/L
Manganese 97 90 1100.0102.43 mg/L
Sample ID: CCV 08/09/13 12:06Continuing Calibration Verification Standard3
Calcium 98 90 1101.024.4 mg/L
Iron 97 90 1100.0302.44 mg/L
Manganese 95 90 1100.0102.37 mg/L
Method: E200.7 Batch: R90370
Sample ID: ICB 08/09/13 11:00Method Blank Run: ICP2-HE_130809A3
Calcium 0.030.06 mg/L
Iron 0.005ND mg/L
Manganese 0.0005ND mg/L
Sample ID: LFB 08/09/13 11:04Laboratory Fortified Blank Run: ICP2-HE_130809A3
Calcium 99 85 1151.049.5 mg/L
Iron 98 85 1150.0304.92 mg/L
Manganese 96 85 1150.0104.79 mg/L
Sample ID: H13080121-006BMS2 08/09/13 11:37Sample Matrix Spike Run: ICP2-HE_130809A3
Calcium 98 70 1301.0119 mg/L
Iron 99 70 1300.0305.11 mg/L
Manganese 98 70 1300.00104.91 mg/L
Sample ID: H13080121-006BMSD2 08/09/13 11:40Sample Matrix Spike Duplicate Run: ICP2-HE_130809A3
Calcium 100 70 130 201.0 0.7119 mg/L
Qualifiers:
RL - Analyte reporting limit. ND - Not detected at the reporting limit.
Page 25 of 44

Project: Barker Hughsville Pilot
Client: CDM Federal Programs
Work Order: H13080161
QA/QC Summary Report
08/29/13Report Date:
Analyte Result %REC RPDLow Limit High Limit RPDLimitRLUnits QualCount
Prepared by Helena, MT Branch
Method: E200.7 Batch: R90370
Sample ID: H13080121-006BMSD2 08/09/13 11:40Sample Matrix Spike Duplicate Run: ICP2-HE_130809A3
Iron 100 70 130 200.030 0.85.15 mg/L
Manganese 98 70 130 200.0010 0.84.94 mg/L
Sample ID: H13080161-009BMS2 08/09/13 12:24Sample Matrix Spike Run: ICP2-HE_130809A3
Calcium 99 70 1301.0515 mg/L
Iron 95 70 1300.03092.1 mg/L
Manganese 70 1300.0027168 mg/L A
Sample ID: H13080161-009BMSD2 08/09/13 12:27Sample Matrix Spike Duplicate Run: ICP2-HE_130809A3
Calcium 97 70 130 201.0 1.0510 mg/L
Iron 92 70 130 200.030 0.991.2 mg/L
Manganese 70 130 200.0027 0.0168 mg/L A
Qualifiers:
RL - Analyte reporting limit. A - The analyte level was greater than four times the spike level. In accordance with the method % recovery is not calculated.
ND - Not detected at the reporting limit.
Page 26 of 44

Project: Barker Hughsville Pilot
Client: CDM Federal Programs
Work Order: H13080161
QA/QC Summary Report
08/29/13Report Date:
Analyte Result %REC RPDLow Limit High Limit RPDLimitRLUnits QualCount
Prepared by Helena, MT Branch
Method: E200.8 Analytical Run: ICPMS204-B_130808C
Sample ID: ICV STD 08/08/13 17:02Initial Calibration Verification Standard12
Aluminum 91 90 1100.100.273 mg/L
Arsenic 100 90 1100.00500.0597 mg/L
Barium 100 90 1100.100.0600 mg/L
Beryllium 103 90 1100.00100.0308 mg/L
Cadmium 105 90 1100.00100.0314 mg/L
Chromium 101 90 1100.0100.0603 mg/L
Copper 101 90 1100.0100.0608 mg/L
Lead 106 90 1100.0100.0634 mg/L
Nickel 103 90 1100.0100.0617 mg/L
Silver 100 90 1100.00500.0299 mg/L
Thallium 106 90 1100.100.0638 mg/L
Zinc 100 90 1100.0100.0600 mg/L
Sample ID: ICSA 08/08/13 17:06Interference Check Sample A12
Aluminum 84 70 1300.1033.8 mg/L
Arsenic 0.00500.000273 mg/L
Barium 0.100.000100 mg/L
Beryllium 0.00102.40E-05 mg/L
Cadmium 0.00100.000944 mg/L
Chromium 0.0100.00110 mg/L
Copper 0.0100.000262 mg/L
Lead 0.0100.000217 mg/L
Nickel 0.0100.000650 mg/L
Silver 0.00500.000118 mg/L
Thallium 0.107.00E-05 mg/L
Zinc 0.0100.00103 mg/L
Sample ID: ICSAB 08/08/13 17:11Interference Check Sample AB12
Aluminum 85 70 1300.1034.2 mg/L
Arsenic 102 70 1300.00500.0102 mg/L
Barium 0 00.107.50E-05 mg/L
Beryllium 0 00.00101.20E-05 mg/L
Cadmium 99 70 1300.00100.00995 mg/L
Chromium 103 70 1300.0100.0206 mg/L
Copper 95 70 1300.0100.0191 mg/L
Lead 0 00.0100.000156 mg/L
Nickel 102 70 1300.0100.0203 mg/L
Silver 93 70 1300.00500.0186 mg/L
Thallium 0 00.102.70E-05 mg/L
Zinc 105 70 1300.0100.0105 mg/L
Sample ID: ICSA 08/09/13 07:57Interference Check Sample A12
Aluminum 82 70 1300.1032.6 mg/L
Arsenic 0.00500.000476 mg/L
Barium 0.100.000127 mg/L
Qualifiers:
RL - Analyte reporting limit. ND - Not detected at the reporting limit.
Page 27 of 44

Project: Barker Hughsville Pilot
Client: CDM Federal Programs
Work Order: H13080161
QA/QC Summary Report
08/29/13Report Date:
Analyte Result %REC RPDLow Limit High Limit RPDLimitRLUnits QualCount
Prepared by Helena, MT Branch
Method: E200.8 Analytical Run: ICPMS204-B_130808C
Sample ID: ICSA 08/09/13 07:57Interference Check Sample A12
Beryllium 0.00103.00E-05 mg/L
Cadmium 0.00100.00107 mg/L
Chromium 0.0100.00113 mg/L
Copper 0.0100.000374 mg/L
Lead 0.0100.000347 mg/L
Nickel 0.0100.00118 mg/L
Silver 0.00500.000398 mg/L
Thallium 0.102.60E-05 mg/L
Zinc 0.0100.00146 mg/L
Sample ID: ICSAB 08/09/13 08:02Interference Check Sample AB12
Aluminum 83 70 1300.1033.1 mg/L
Arsenic 103 70 1300.00500.0103 mg/L
Barium 0 00.100.000117 mg/L
Beryllium 0 00.00102.40E-05 mg/L
Cadmium 101 70 1300.00100.0101 mg/L
Chromium 107 70 1300.0100.0213 mg/L
Copper 101 70 1300.0100.0203 mg/L
Lead 0 00.0100.000175 mg/L
Nickel 109 70 1300.0100.0218 mg/L
Silver 87 70 1300.00500.0174 mg/L
Thallium 0 00.102.20E-05 mg/L
Zinc 106 70 1300.0100.0106 mg/L
Sample ID: ICV STD 08/09/13 11:23Initial Calibration Verification Standard12
Aluminum 94 90 1100.100.283 mg/L
Arsenic 101 90 1100.00500.0605 mg/L
Barium 100 90 1100.100.0599 mg/L
Beryllium 104 90 1100.00100.0312 mg/L
Cadmium 108 90 1100.00100.0324 mg/L
Chromium 102 90 1100.0100.0613 mg/L
Copper 104 90 1100.0100.0625 mg/L
Lead 100 90 1100.0100.0601 mg/L
Nickel 104 90 1100.0100.0621 mg/L
Silver 103 90 1100.00500.0308 mg/L
Thallium 105 90 1100.100.0630 mg/L
Zinc 102 90 1100.0100.0614 mg/L
Sample ID: ICSA 08/09/13 11:28Interference Check Sample A12
Aluminum 86 70 1300.1034.4 mg/L
Arsenic 0.00500.000185 mg/L
Barium 0.100.000149 mg/L
Beryllium 0.00109.00E-06 mg/L
Cadmium 0.00100.00115 mg/L
Chromium 0.0100.00112 mg/L
Qualifiers:
RL - Analyte reporting limit. ND - Not detected at the reporting limit.
Page 28 of 44

Project: Barker Hughsville Pilot
Client: CDM Federal Programs
Work Order: H13080161
QA/QC Summary Report
08/29/13Report Date:
Analyte Result %REC RPDLow Limit High Limit RPDLimitRLUnits QualCount
Prepared by Helena, MT Branch
Method: E200.8 Analytical Run: ICPMS204-B_130808C
Sample ID: ICSA 08/09/13 11:28Interference Check Sample A12
Copper 0.0100.000306 mg/L
Lead 0.0100.000199 mg/L
Nickel 0.0100.000675 mg/L
Silver 0.00500.000222 mg/L
Thallium 0.106.20E-05 mg/L
Zinc 0.0100.00112 mg/L
Sample ID: ICSAB 08/09/13 11:32Interference Check Sample AB12
Aluminum 86 70 1300.1034.4 mg/L
Arsenic 104 70 1300.00500.0104 mg/L
Barium 0 00.100.000147 mg/L
Beryllium 0 00.00107.00E-06 mg/L
Cadmium 103 70 1300.00100.0103 mg/L
Chromium 106 70 1300.0100.0211 mg/L
Copper 99 70 1300.0100.0198 mg/L
Lead 0 00.0100.000157 mg/L
Nickel 104 70 1300.0100.0208 mg/L
Silver 93 70 1300.00500.0187 mg/L
Thallium 0 00.102.80E-05 mg/L
Zinc 106 70 1300.0100.0106 mg/L
Sample ID: ICV STD 08/09/13 20:53Initial Calibration Verification Standard13
Aluminum 92 90 1100.100.277 mg/L
Arsenic 102 90 1100.00500.0612 mg/L
Barium 98 90 1100.100.0588 mg/L
Beryllium 102 90 1100.00100.0305 mg/L
Cadmium 106 90 1100.00100.0319 mg/L
Chromium 103 90 1100.0100.0617 mg/L
Cobalt 107 90 1100.0100.0643 mg/L
Copper 104 90 1100.0100.0625 mg/L
Lead 100 90 1100.0100.0600 mg/L
Nickel 104 90 1100.0100.0622 mg/L
Silver 100 90 1100.00500.0299 mg/L
Thallium 106 90 1100.100.0634 mg/L
Zinc 105 90 1100.0100.0633 mg/L
Sample ID: ICSA 08/09/13 20:58Interference Check Sample A13
Aluminum 85 70 1300.1034.1 mg/L
Arsenic 0.00500.000237 mg/L
Barium 0.100.000235 mg/L
Beryllium 0.00102.10E-05 mg/L
Cadmium 0.00100.00104 mg/L
Chromium 0.0100.00186 mg/L
Cobalt 0.0100.000531 mg/L
Copper 0.0100.000223 mg/L
Qualifiers:
RL - Analyte reporting limit. ND - Not detected at the reporting limit.
Page 29 of 44

Project: Barker Hughsville Pilot
Client: CDM Federal Programs
Work Order: H13080161
QA/QC Summary Report
08/29/13Report Date:
Analyte Result %REC RPDLow Limit High Limit RPDLimitRLUnits QualCount
Prepared by Helena, MT Branch
Method: E200.8 Analytical Run: ICPMS204-B_130808C
Sample ID: ICSA 08/09/13 20:58Interference Check Sample A13
Lead 0.0100.000214 mg/L
Nickel 0.0100.000626 mg/L
Silver 0.00500.000181 mg/L
Thallium 0.100.000153 mg/L
Zinc 0.0100.00112 mg/L
Sample ID: ICSAB 08/09/13 21:03Interference Check Sample AB13
Aluminum 86 70 1300.1034.4 mg/L
Arsenic 102 70 1300.00500.0102 mg/L
Barium 0 00.100.000158 mg/L
Beryllium 0 00.00102.10E-05 mg/L
Cadmium 101 70 1300.00100.0101 mg/L
Chromium 108 70 1300.0100.0215 mg/L
Cobalt 104 70 1300.0100.0209 mg/L
Copper 99 70 1300.0100.0197 mg/L
Lead 0 00.0100.000146 mg/L
Nickel 103 70 1300.0100.0207 mg/L
Silver 92 70 1300.00500.0183 mg/L
Thallium 0 00.107.10E-05 mg/L
Zinc 108 70 1300.0100.0108 mg/L
Sample ID: ICSA 08/10/13 08:10Interference Check Sample A13
Aluminum 86 70 1300.1034.4 mg/L
Arsenic 0.00500.000283 mg/L
Barium 0.100.000177 mg/L
Beryllium 0.00103.00E-06 mg/L
Cadmium 0.00100.00104 mg/L
Chromium 0.0100.00104 mg/L
Cobalt 0.0100.000517 mg/L
Copper 0.0100.000193 mg/L
Lead 0.0100.000166 mg/L
Nickel 0.0100.000729 mg/L
Silver 0.00500.000286 mg/L
Thallium 0.105.80E-05 mg/L
Zinc 0.0100.000983 mg/L
Sample ID: ICSAB 08/10/13 08:14Interference Check Sample AB13
Aluminum 86 70 1300.1034.3 mg/L
Arsenic 106 70 1300.00500.0106 mg/L
Barium 0 00.109.10E-05 mg/L
Beryllium 0 00.0010-5.00E-06 mg/L
Cadmium 101 70 1300.00100.0101 mg/L
Chromium 106 70 1300.0100.0212 mg/L
Cobalt 104 70 1300.0100.0207 mg/L
Copper 98 70 1300.0100.0195 mg/L
Qualifiers:
RL - Analyte reporting limit. ND - Not detected at the reporting limit.
Page 30 of 44

Project: Barker Hughsville Pilot
Client: CDM Federal Programs
Work Order: H13080161
QA/QC Summary Report
08/29/13Report Date:
Analyte Result %REC RPDLow Limit High Limit RPDLimitRLUnits QualCount
Prepared by Helena, MT Branch
Method: E200.8 Analytical Run: ICPMS204-B_130808C
Sample ID: ICSAB 08/10/13 08:14Interference Check Sample AB13
Lead 0 00.0100.000144 mg/L
Nickel 103 70 1300.0100.0205 mg/L
Silver 91 70 1300.00500.0182 mg/L
Thallium 0 00.104.40E-05 mg/L
Zinc 112 70 1300.0100.0112 mg/L
Method: E200.8 Batch: R90353
Sample ID: ICB 08/08/13 17:39Method Blank Run: ICPMS204-B_130808C13
Aluminum 0.00010.0002 mg/L
Arsenic 7E-05ND mg/L
Barium 5E-05ND mg/L
Beryllium 2E-052E-05 mg/L
Cadmium 7E-068E-06 mg/L
Chromium 4E-05ND mg/L
Cobalt 2E-05ND mg/L
Copper 3E-05ND mg/L
Lead 6E-061E-05 mg/L
Nickel 6E-05ND mg/L
Silver 4E-055E-05 mg/L
Thallium 1E-05ND mg/L
Zinc 0.00030.001 mg/L
Sample ID: LFB 08/08/13 17:44Laboratory Fortified Blank Run: ICPMS204-B_130808C13
Aluminum 97 85 1150.100.0489 mg/L
Arsenic 99 85 1150.00500.0496 mg/L
Barium 101 85 1150.100.0503 mg/L
Beryllium 99 85 1150.00100.0494 mg/L
Cadmium 101 85 1150.00100.0505 mg/L
Chromium 101 85 1150.0100.0505 mg/L
Cobalt 111 85 1150.0100.0553 mg/L
Copper 104 85 1150.0100.0520 mg/L
Lead 104 85 1150.0100.0520 mg/L
Nickel 105 85 1150.0100.0524 mg/L
Silver 101 85 1150.00500.0202 mg/L
Thallium 105 85 1150.100.0524 mg/L
Zinc 103 85 1150.0100.0525 mg/L
Sample ID: H13080158-009BMS 08/09/13 05:47Sample Matrix Spike Run: ICPMS204-B_130808C13
Aluminum 100 70 1300.0300.127 mg/L
Arsenic 124 70 1300.00100.0629 mg/L
Barium 110 70 1300.0500.0775 mg/L
Beryllium 104 70 1300.00100.0520 mg/L
Cadmium 103 70 1300.00100.0517 mg/L
Chromium 106 70 1300.00500.0557 mg/L
Cobalt 125 70 1300.00500.0648 mg/L
Qualifiers:
RL - Analyte reporting limit. ND - Not detected at the reporting limit.
Page 31 of 44
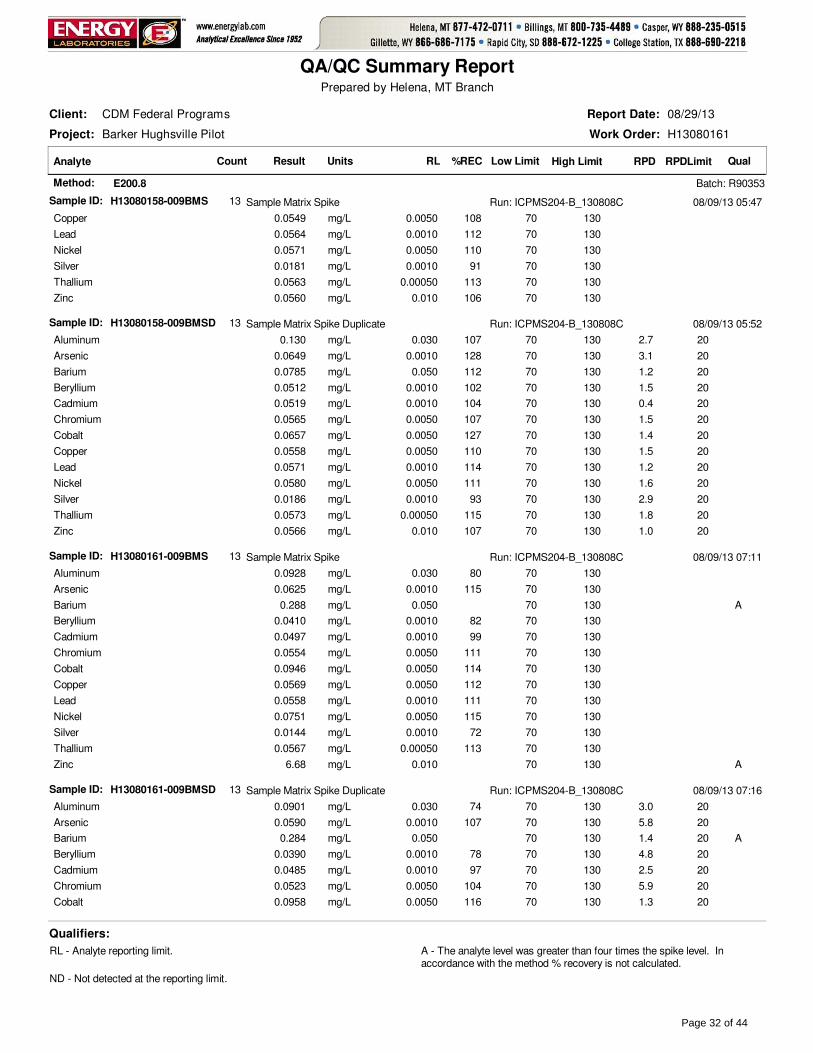
Project: Barker Hughsville Pilot
Client: CDM Federal Programs
Work Order: H13080161
QA/QC Summary Report
08/29/13Report Date:
Analyte Result %REC RPDLow Limit High Limit RPDLimitRLUnits QualCount
Prepared by Helena, MT Branch
Method: E200.8 Batch: R90353
Sample ID: H13080158-009BMS 08/09/13 05:47Sample Matrix Spike Run: ICPMS204-B_130808C13
Copper 108 70 1300.00500.0549 mg/L
Lead 112 70 1300.00100.0564 mg/L
Nickel 110 70 1300.00500.0571 mg/L
Silver 91 70 1300.00100.0181 mg/L
Thallium 113 70 1300.000500.0563 mg/L
Zinc 106 70 1300.0100.0560 mg/L
Sample ID: H13080158-009BMSD 08/09/13 05:52Sample Matrix Spike Duplicate Run: ICPMS204-B_130808C13
Aluminum 107 70 130 200.030 2.70.130 mg/L
Arsenic 128 70 130 200.0010 3.10.0649 mg/L
Barium 112 70 130 200.050 1.20.0785 mg/L
Beryllium 102 70 130 200.0010 1.50.0512 mg/L
Cadmium 104 70 130 200.0010 0.40.0519 mg/L
Chromium 107 70 130 200.0050 1.50.0565 mg/L
Cobalt 127 70 130 200.0050 1.40.0657 mg/L
Copper 110 70 130 200.0050 1.50.0558 mg/L
Lead 114 70 130 200.0010 1.20.0571 mg/L
Nickel 111 70 130 200.0050 1.60.0580 mg/L
Silver 93 70 130 200.0010 2.90.0186 mg/L
Thallium 115 70 130 200.00050 1.80.0573 mg/L
Zinc 107 70 130 200.010 1.00.0566 mg/L
Sample ID: H13080161-009BMS 08/09/13 07:11Sample Matrix Spike Run: ICPMS204-B_130808C13
Aluminum 80 70 1300.0300.0928 mg/L
Arsenic 115 70 1300.00100.0625 mg/L
Barium 70 1300.0500.288 mg/L A
Beryllium 82 70 1300.00100.0410 mg/L
Cadmium 99 70 1300.00100.0497 mg/L
Chromium 111 70 1300.00500.0554 mg/L
Cobalt 114 70 1300.00500.0946 mg/L
Copper 112 70 1300.00500.0569 mg/L
Lead 111 70 1300.00100.0558 mg/L
Nickel 115 70 1300.00500.0751 mg/L
Silver 72 70 1300.00100.0144 mg/L
Thallium 113 70 1300.000500.0567 mg/L
Zinc 70 1300.0106.68 mg/L A
Sample ID: H13080161-009BMSD 08/09/13 07:16Sample Matrix Spike Duplicate Run: ICPMS204-B_130808C13
Aluminum 74 70 130 200.030 3.00.0901 mg/L
Arsenic 107 70 130 200.0010 5.80.0590 mg/L
Barium 70 130 200.050 1.40.284 mg/L A
Beryllium 78 70 130 200.0010 4.80.0390 mg/L
Cadmium 97 70 130 200.0010 2.50.0485 mg/L
Chromium 104 70 130 200.0050 5.90.0523 mg/L
Cobalt 116 70 130 200.0050 1.30.0958 mg/L
Qualifiers:
RL - Analyte reporting limit. A - The analyte level was greater than four times the spike level. In accordance with the method % recovery is not calculated.
ND - Not detected at the reporting limit.
Page 32 of 44

Project: Barker Hughsville Pilot
Client: CDM Federal Programs
Work Order: H13080161
QA/QC Summary Report
08/29/13Report Date:
Analyte Result %REC RPDLow Limit High Limit RPDLimitRLUnits QualCount
Prepared by Helena, MT Branch
Method: E200.8 Batch: R90353
Sample ID: H13080161-009BMSD 08/09/13 07:16Sample Matrix Spike Duplicate Run: ICPMS204-B_130808C13
Copper 105 70 130 200.0050 6.70.0532 mg/L
Lead 109 70 130 200.0010 1.80.0548 mg/L
Nickel 106 70 130 200.0050 6.20.0706 mg/L
Silver 73 70 130 200.0010 1.50.0146 mg/L
Thallium 111 70 130 200.00050 1.90.0556 mg/L
Zinc 70 130 200.010 5.06.35 mg/L A
Sample ID: ICB 08/09/13 21:31Method Blank Run: ICPMS204-B_130808C13
Aluminum 0.00010.001 mg/L
Arsenic 7E-05ND mg/L
Barium 5E-056E-05 mg/L
Beryllium 2E-05ND mg/L
Cadmium 7E-069E-06 mg/L
Chromium 4E-05ND mg/L
Cobalt 2E-05ND mg/L
Copper 3E-054E-05 mg/L
Lead 6E-062E-05 mg/L
Nickel 6E-05ND mg/L
Silver 4E-056E-05 mg/L
Thallium 1E-05ND mg/L
Zinc 0.00030.001 mg/L
Sample ID: LFB 08/09/13 21:35Laboratory Fortified Blank Run: ICPMS204-B_130808C13
Aluminum 99 85 1150.100.0505 mg/L
Arsenic 102 85 1150.00500.0509 mg/L
Barium 99 85 1150.100.0495 mg/L
Beryllium 99 85 1150.00100.0494 mg/L
Cadmium 105 85 1150.00100.0523 mg/L
Chromium 103 85 1150.0100.0517 mg/L
Cobalt 109 85 1150.0100.0544 mg/L
Copper 106 85 1150.0100.0529 mg/L
Lead 101 85 1150.0100.0506 mg/L
Nickel 106 85 1150.0100.0529 mg/L
Silver 100 85 1150.00500.0201 mg/L
Thallium 106 85 1150.100.0529 mg/L
Zinc 106 85 1150.0100.0545 mg/L
Sample ID: H13080158-008BMS 08/10/13 05:58Sample Matrix Spike Run: ICPMS204-B_130808C13
Aluminum 97 70 1300.0300.0530 mg/L
Arsenic 113 70 1300.00100.0565 mg/L
Barium 98 70 1300.0500.148 mg/L
Beryllium 96 70 1300.00100.0480 mg/L
Cadmium 96 70 1300.00100.0480 mg/L
Chromium 101 70 1300.00500.0505 mg/L
Cobalt 104 70 1300.00500.0540 mg/L
Qualifiers:
RL - Analyte reporting limit. A - The analyte level was greater than four times the spike level. In accordance with the method % recovery is not calculated.
ND - Not detected at the reporting limit.
Page 33 of 44

Project: Barker Hughsville Pilot
Client: CDM Federal Programs
Work Order: H13080161
QA/QC Summary Report
08/29/13Report Date:
Analyte Result %REC RPDLow Limit High Limit RPDLimitRLUnits QualCount
Prepared by Helena, MT Branch
Method: E200.8 Batch: R90353
Sample ID: H13080158-008BMS 08/10/13 05:58Sample Matrix Spike Run: ICPMS204-B_130808C13
Copper 100 70 1300.00500.0501 mg/L
Lead 101 70 1300.00100.0507 mg/L
Nickel 101 70 1300.00500.0510 mg/L
Silver 78 70 1300.00100.0157 mg/L
Thallium 106 70 1300.000500.0529 mg/L
Zinc 98 70 1300.0100.0515 mg/L
Sample ID: H13080158-008BMSD 08/10/13 06:03Sample Matrix Spike Duplicate Run: ICPMS204-B_130808C13
Aluminum 98 70 130 200.030 1.00.0535 mg/L
Arsenic 112 70 130 200.0010 0.20.0564 mg/L
Barium 104 70 130 200.050 1.90.151 mg/L
Beryllium 100 70 130 200.0010 4.10.0500 mg/L
Cadmium 98 70 130 200.0010 1.80.0489 mg/L
Chromium 101 70 130 200.0050 0.10.0504 mg/L
Cobalt 106 70 130 200.0050 1.70.0549 mg/L
Copper 100 70 130 200.0050 0.40.0503 mg/L
Lead 104 70 130 200.0010 2.30.0519 mg/L
Nickel 101 70 130 200.0050 0.10.0511 mg/L
Silver 83 70 130 200.0010 5.20.0165 mg/L
Thallium 109 70 130 200.00050 2.80.0544 mg/L
Zinc 99 70 130 200.010 1.10.0521 mg/L
Sample ID: H13080161-008BMS 08/10/13 07:22Sample Matrix Spike Run: ICPMS204-B_130808C13
Aluminum 94 70 1300.0304.71 mg/L
Arsenic 99 70 1300.00654.94 mg/L
Barium 95 70 1300.0504.99 mg/L
Beryllium 90 70 1300.00174.49 mg/L
Cadmium 99 70 1300.00104.94 mg/L
Chromium 100 70 1300.00504.98 mg/L
Cobalt 102 70 1300.00505.16 mg/L
Copper 101 70 1300.00505.05 mg/L
Lead 95 70 1300.00104.76 mg/L
Nickel 101 70 1300.00635.14 mg/L
Silver 64 70 1300.00401.28 mg/L S
Thallium 101 70 1300.00115.03 mg/L
Zinc 95 70 1300.03413.5 mg/L
Sample ID: H13080161-008BMSD 08/10/13 07:27Sample Matrix Spike Duplicate Run: ICPMS204-B_130808C13
Aluminum 94 70 130 200.030 0.84.75 mg/L
Arsenic 100 70 130 200.0065 1.45.01 mg/L
Barium 96 70 130 200.050 0.75.03 mg/L
Beryllium 91 70 130 200.0017 1.54.56 mg/L
Cadmium 100 70 130 200.0010 1.15.00 mg/L
Chromium 102 70 130 200.0050 2.45.10 mg/L
Cobalt 102 70 130 200.0050 0.65.12 mg/L
Qualifiers:
RL - Analyte reporting limit. ND - Not detected at the reporting limit.
S - Spike recovery outside of advisory limits.
Page 34 of 44

Project: Barker Hughsville Pilot
Client: CDM Federal Programs
Work Order: H13080161
QA/QC Summary Report
08/29/13Report Date:
Analyte Result %REC RPDLow Limit High Limit RPDLimitRLUnits QualCount
Prepared by Helena, MT Branch
Method: E200.8 Batch: R90353
Sample ID: H13080161-008BMSD 08/10/13 07:27Sample Matrix Spike Duplicate Run: ICPMS204-B_130808C13
Copper 101 70 130 200.0050 0.05.05 mg/L
Lead 96 70 130 200.0010 1.34.83 mg/L
Nickel 102 70 130 200.0063 0.25.15 mg/L
Silver 70 70 130 200.0040 8.21.39 mg/L
Thallium 100 70 130 200.0011 0.25.02 mg/L
Zinc 91 70 130 200.034 1.313.4 mg/L
Method: E200.8 Analytical Run: ICPMS204-B_130812A
Sample ID: ICV STD 08/12/13 18:18Initial Calibration Verification Standard
Aluminum 98 90 1100.100.294 mg/L
Sample ID: ICSA 08/12/13 18:22Interference Check Sample A
Aluminum 92 70 1300.1036.6 mg/L
Sample ID: ICSAB 08/12/13 18:27Interference Check Sample AB
Aluminum 91 70 1300.1036.5 mg/L
Method: E200.8 Batch: R90425
Sample ID: ICB 08/12/13 21:00Method Blank Run: ICPMS204-B_130812A
Aluminum 0.00010.001 mg/L
Sample ID: LFB 08/12/13 21:05Laboratory Fortified Blank Run: ICPMS204-B_130812A
Aluminum 99 85 1150.100.0508 mg/L
Sample ID: H13080173-002BMS 08/13/13 00:46Sample Matrix Spike Run: ICPMS204-B_130812A
Aluminum 104 70 1300.0300.0846 mg/L
Sample ID: H13080173-002BMSD 08/13/13 00:50Sample Matrix Spike Duplicate Run: ICPMS204-B_130812A
Aluminum 94 70 130 200.030 6.20.0795 mg/L
Qualifiers:
RL - Analyte reporting limit. ND - Not detected at the reporting limit.
Page 35 of 44

Project: Barker Hughsville Pilot
Client: CDM Federal Programs
Work Order: H13080161
QA/QC Summary Report
08/29/13Report Date:
Analyte Result %REC RPDLow Limit High Limit RPDLimitRLUnits QualCount
Prepared by Helena, MT Branch
Method: E200.8 Analytical Run: ICPMS204-B_130813A
Sample ID: ICV STD 08/13/13 11:30Initial Calibration Verification Standard
Beryllium 101 90 1100.00100.0303 mg/L
Sample ID: ICSA 08/13/13 11:34Interference Check Sample A
Beryllium 0.00101.00E-05 mg/L
Sample ID: ICSAB 08/13/13 11:39Interference Check Sample AB
Beryllium 0 00.0010-4.00E-06 mg/L
Sample ID: ICV STD 08/14/13 09:11Initial Calibration Verification Standard
Beryllium 106 90 1100.00100.0318 mg/L
Sample ID: ICSA 08/14/13 09:17Interference Check Sample A
Beryllium 0.00107.00E-06 mg/L
Sample ID: ICSAB 08/14/13 09:38Interference Check Sample AB
Beryllium 0 00.00102.00E-06 mg/L
Method: E200.8 Batch: R90470
Sample ID: ICB 08/13/13 12:53Method Blank Run: ICPMS204-B_130813A
Beryllium 2E-05ND mg/L
Sample ID: LFB 08/14/13 01:17Laboratory Fortified Blank Run: ICPMS204-B_130813A
Beryllium 94 85 1150.00100.0468 mg/L
Sample ID: H13080192-002BMS 08/14/13 05:24Sample Matrix Spike Run: ICPMS204-B_130813A
Beryllium 90 70 1300.00100.225 mg/L
Sample ID: H13080192-002BMSD 08/14/13 05:29Sample Matrix Spike Duplicate Run: ICPMS204-B_130813A
Beryllium 89 70 130 200.0010 0.60.224 mg/L
Sample ID: ICB 08/14/13 15:05Method Blank Run: ICPMS204-B_130813A
Beryllium 2E-05ND mg/L
Sample ID: LFB 08/14/13 15:09Laboratory Fortified Blank Run: ICPMS204-B_130813A
Beryllium 96 85 1150.00100.0481 mg/L
Sample ID: H13080161-002BMS 08/14/13 19:56Sample Matrix Spike Run: ICPMS204-B_130813A
Beryllium 94 70 1300.00102.37 mg/L
Sample ID: H13080161-002BMSD 08/14/13 20:01Sample Matrix Spike Duplicate Run: ICPMS204-B_130813A
Beryllium 94 70 130 200.0010 0.82.35 mg/L
Sample ID: LFB-21293 08/15/13 07:06Laboratory Fortified Blank Run: ICPMS204-B_130813A
Beryllium 99 85 1151.049.3 mg/kg
Qualifiers:
RL - Analyte reporting limit. ND - Not detected at the reporting limit.
Page 36 of 44
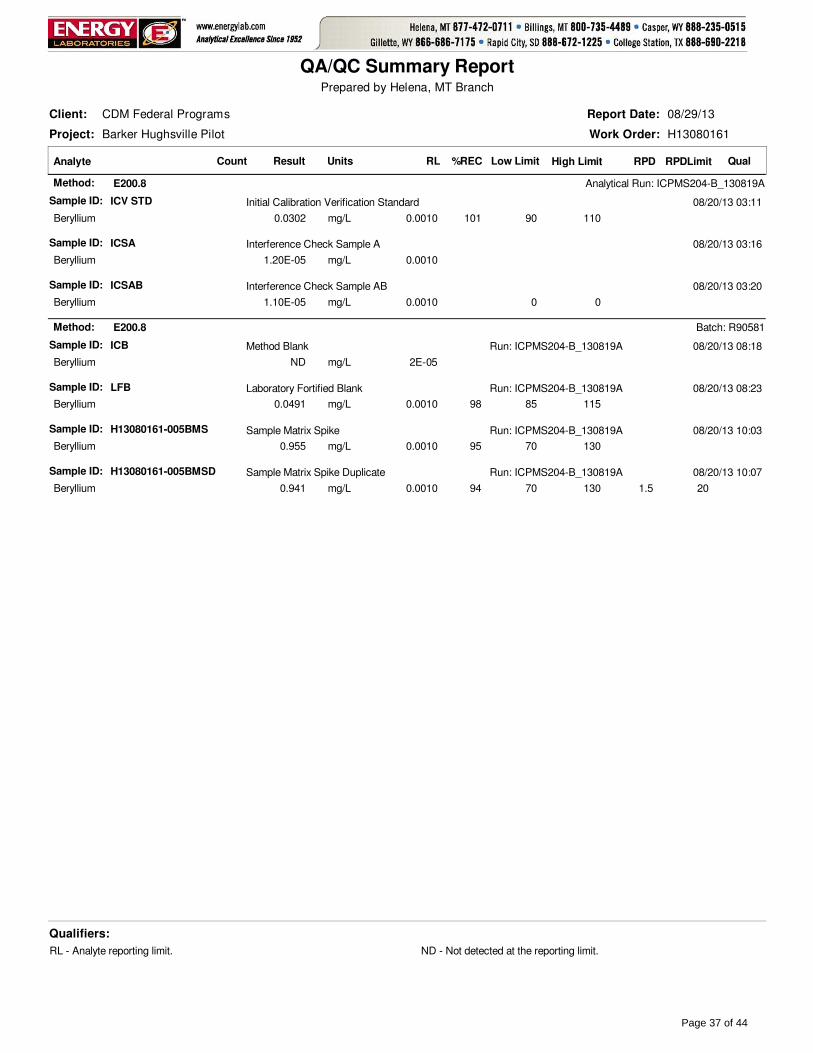
Project: Barker Hughsville Pilot
Client: CDM Federal Programs
Work Order: H13080161
QA/QC Summary Report
08/29/13Report Date:
Analyte Result %REC RPDLow Limit High Limit RPDLimitRLUnits QualCount
Prepared by Helena, MT Branch
Method: E200.8 Analytical Run: ICPMS204-B_130819A
Sample ID: ICV STD 08/20/13 03:11Initial Calibration Verification Standard
Beryllium 101 90 1100.00100.0302 mg/L
Sample ID: ICSA 08/20/13 03:16Interference Check Sample A
Beryllium 0.00101.20E-05 mg/L
Sample ID: ICSAB 08/20/13 03:20Interference Check Sample AB
Beryllium 0 00.00101.10E-05 mg/L
Method: E200.8 Batch: R90581
Sample ID: ICB 08/20/13 08:18Method Blank Run: ICPMS204-B_130819A
Beryllium 2E-05ND mg/L
Sample ID: LFB 08/20/13 08:23Laboratory Fortified Blank Run: ICPMS204-B_130819A
Beryllium 98 85 1150.00100.0491 mg/L
Sample ID: H13080161-005BMS 08/20/13 10:03Sample Matrix Spike Run: ICPMS204-B_130819A
Beryllium 95 70 1300.00100.955 mg/L
Sample ID: H13080161-005BMSD 08/20/13 10:07Sample Matrix Spike Duplicate Run: ICPMS204-B_130819A
Beryllium 94 70 130 200.0010 1.50.941 mg/L
Qualifiers:
RL - Analyte reporting limit. ND - Not detected at the reporting limit.
Page 37 of 44

Project: Barker Hughsville Pilot
Client: CDM Federal Programs
Work Order: H13080161
QA/QC Summary Report
08/29/13Report Date:
Analyte Result %REC RPDLow Limit High Limit RPDLimitRLUnits QualCount
Prepared by Helena, MT Branch
Method: E300.0 Analytical Run: IC102-H_130812A
Sample ID: ICV 08/12/13 12:25Initial Calibration Verification Standard2
Chloride 98 90 1101.098 mg/L
Sulfate 100 90 1101.0400 mg/L
Sample ID: CCV081213-3 08/12/13 15:59Continuing Calibration Verification Standard2
Chloride 103 90 1101.0100 mg/L
Sulfate 104 90 1101.0420 mg/L
Method: E300.0 Batch: R90424
Sample ID: ICB 08/12/13 12:37Method Blank Run: IC102-H_130812A2
Chloride 0.008ND mg/L
Sulfate 0.080.4 mg/L
Sample ID: LFB 08/12/13 12:50Laboratory Fortified Blank Run: IC102-H_130812A2
Chloride 99 90 1101.050 mg/L
Sulfate 103 90 1101.0210 mg/L
Sample ID: H13080121-002AMS 08/12/13 14:18Sample Matrix Spike Run: IC102-H_130812A2
Chloride 93 90 1101.058 mg/L
Sulfate 96 90 1101.0190 mg/L
Sample ID: H13080121-002AMSD 08/12/13 14:31Sample Matrix Spike Duplicate Run: IC102-H_130812A2
Chloride 102 90 110 201.0 7.263 mg/L
Sulfate 105 90 110 201.0 9.3210 mg/L
Sample ID: H13080161-003AMS 08/12/13 17:14Sample Matrix Spike Run: IC102-H_130812A2
Chloride 97 90 110142700 mg/L
Sulfate 102 90 1105.711000 mg/L
Sample ID: H13080161-003AMSD 08/12/13 17:27Sample Matrix Spike Duplicate Run: IC102-H_130812A2
Chloride 98 90 110 2014 0.92700 mg/L
Sulfate 103 90 110 205.7 0.411000 mg/L
Sample ID: H13080192-003AMS 08/12/13 20:11Sample Matrix Spike Run: IC102-H_130812A2
Chloride 96 90 1101.0120 mg/L
Sulfate 106 90 1101.0720 mg/L
Sample ID: H13080192-003AMSD 08/12/13 20:23Sample Matrix Spike Duplicate Run: IC102-H_130812A2
Chloride 98 90 110 201.0 1.4120 mg/L
Sulfate 108 90 110 201.0 1.2730 mg/L
Qualifiers:
RL - Analyte reporting limit. ND - Not detected at the reporting limit.
Page 38 of 44

Project: Barker Hughsville Pilot
Client: CDM Federal Programs
Work Order: H13080161
QA/QC Summary Report
08/29/13Report Date:
Analyte Result %REC RPDLow Limit High Limit RPDLimitRLUnits QualCount
Prepared by Helena, MT Branch
Method: E300.0 Analytical Run: IC102-H_130813A
Sample ID: ICV 08/13/13 10:58Initial Calibration Verification Standard2
Chloride 97 90 1101.097 mg/L
Sulfate 101 90 1101.0400 mg/L
Sample ID: CCV081313-1 08/13/13 11:36Continuing Calibration Verification Standard2
Chloride 100 90 1101.0100 mg/L
Sulfate 104 90 1101.0420 mg/L
Method: E300.0 Batch: R90461
Sample ID: ICB 08/13/13 11:10Method Blank Run: IC102-H_130813A2
Chloride 0.0080.008 mg/L
Sulfate 0.080.5 mg/L
Sample ID: LFB 08/13/13 11:23Laboratory Fortified Blank Run: IC102-H_130813A2
Chloride 100 90 1101.050 mg/L
Sulfate 106 90 1101.0210 mg/L
Sample ID: H13080197-001AMS 08/13/13 14:07Sample Matrix Spike Run: IC102-H_130813A2
Chloride 99 90 1101.070 mg/L
Sulfate 108 90 1101.0260 mg/L
Sample ID: H13080197-001AMSD 08/13/13 14:19Sample Matrix Spike Duplicate Run: IC102-H_130813A2
Chloride 100 90 110 201.0 0.370 mg/L
Sulfate 109 90 110 201.0 0.3260 mg/L
Qualifiers:
RL - Analyte reporting limit. ND - Not detected at the reporting limit.
Page 39 of 44
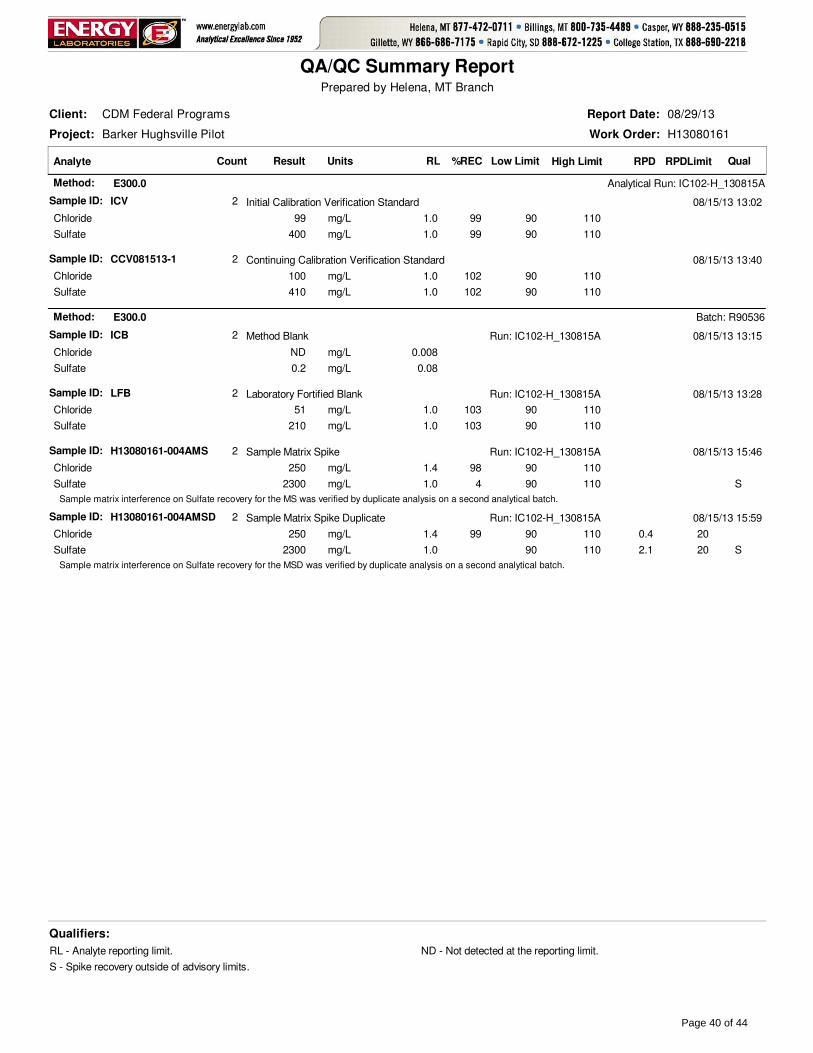
Project: Barker Hughsville Pilot
Client: CDM Federal Programs
Work Order: H13080161
QA/QC Summary Report
08/29/13Report Date:
Analyte Result %REC RPDLow Limit High Limit RPDLimitRLUnits QualCount
Prepared by Helena, MT Branch
Method: E300.0 Analytical Run: IC102-H_130815A
Sample ID: ICV 08/15/13 13:02Initial Calibration Verification Standard2
Chloride 99 90 1101.099 mg/L
Sulfate 99 90 1101.0400 mg/L
Sample ID: CCV081513-1 08/15/13 13:40Continuing Calibration Verification Standard2
Chloride 102 90 1101.0100 mg/L
Sulfate 102 90 1101.0410 mg/L
Method: E300.0 Batch: R90536
Sample ID: ICB 08/15/13 13:15Method Blank Run: IC102-H_130815A2
Chloride 0.008ND mg/L
Sulfate 0.080.2 mg/L
Sample ID: LFB 08/15/13 13:28Laboratory Fortified Blank Run: IC102-H_130815A2
Chloride 103 90 1101.051 mg/L
Sulfate 103 90 1101.0210 mg/L
Sample ID: H13080161-004AMS 08/15/13 15:46Sample Matrix Spike Run: IC102-H_130815A2
Chloride 98 90 1101.4250 mg/L
Sulfate 4 90 1101.02300 mg/L S
Sample matrix interference on Sulfate recovery for the MS was verified by duplicate analysis on a second analytical batch.
Sample ID: H13080161-004AMSD 08/15/13 15:59Sample Matrix Spike Duplicate Run: IC102-H_130815A2
Chloride 99 90 110 201.4 0.4250 mg/L
Sulfate 90 110 201.0 2.12300 mg/L S
Sample matrix interference on Sulfate recovery for the MSD was verified by duplicate analysis on a second analytical batch.
Qualifiers:
RL - Analyte reporting limit. ND - Not detected at the reporting limit.
S - Spike recovery outside of advisory limits.
Page 40 of 44

Project: Barker Hughsville Pilot
Client: CDM Federal Programs
Work Order: H13080161
QA/QC Summary Report
08/29/13Report Date:
Analyte Result %REC RPDLow Limit High Limit RPDLimitRLUnits QualCount
Prepared by Helena, MT Branch
Method: E350.1 Analytical Run: FIA203-HE_130808A
Sample ID: ICV 08/08/13 09:54Initial Calibration Verification Standard
Nitrogen, Ammonia as N 104 90 1100.255.88 mg/L
Sample ID: ICB 08/08/13 09:58Initial Calibration Blank, Instrument Blank
Nitrogen, Ammonia as N 0 00.050-0.0373 mg/L
Sample ID: CCV 08/08/13 11:06Continuing Calibration Verification Standard
Nitrogen, Ammonia as N 98 90 1100.0500.491 mg/L
Sample ID: CCV 08/08/13 11:38Continuing Calibration Verification Standard
Nitrogen, Ammonia as N 98 90 1100.0500.491 mg/L
Method: E350.1 Batch: R90324
Sample ID: LFB 08/08/13 09:56Laboratory Fortified Blank Run: FIA203-HE_130808A
Nitrogen, Ammonia as N 97 90 1100.0550.970 mg/L
Sample ID: MBLK 08/08/13 09:59Method Blank Run: FIA203-HE_130808A
Nitrogen, Ammonia as N 0.01ND mg/L
Sample ID: H13080143-002AMS 08/08/13 11:10Sample Matrix Spike Run: FIA203-HE_130808A
Nitrogen, Ammonia as N 84 80 1200.0551.33 mg/L
Sample ID: H13080143-002AMSD 08/08/13 11:11Sample Matrix Spike Duplicate Run: FIA203-HE_130808A
Nitrogen, Ammonia as N 84 80 120 100.055 0.21.33 mg/L
Sample ID: H13080161-010BMS 08/08/13 11:40Sample Matrix Spike Run: FIA203-HE_130808A
Nitrogen, Ammonia as N 85 80 12025664 mg/L
Sample ID: H13080161-010BMSD 08/08/13 11:41Sample Matrix Spike Duplicate Run: FIA203-HE_130808A
Nitrogen, Ammonia as N 85 80 120 1025 0.2662 mg/L
Qualifiers:
RL - Analyte reporting limit. ND - Not detected at the reporting limit.
Page 41 of 44

Project: Barker Hughsville Pilot
Client: CDM Federal Programs
Work Order: H13080161
QA/QC Summary Report
08/29/13Report Date:
Analyte Result %REC RPDLow Limit High Limit RPDLimitRLUnits QualCount
Prepared by Helena, MT Branch
Method: E365.1 Analytical Run: FIA202-HE_130808B
Sample ID: ICV 08/08/13 13:51Initial Calibration Verification Standard
Phosphorus, Orthophosphate as P 96 90 1100.00500.239 mg/L
Sample ID: ICB 08/08/13 13:52Initial Calibration Blank, Instrument Blank
Phosphorus, Orthophosphate as P 0 00.00500.000360 mg/L
Sample ID: CCV 08/08/13 13:54Continuing Calibration Verification Standard
Phosphorus, Orthophosphate as P 94 90 1100.00500.0942 mg/L
Sample ID: CCV 08/08/13 14:11Continuing Calibration Verification Standard
Phosphorus, Orthophosphate as P 107 90 1100.00500.107 mg/L
Method: E365.1 Batch: R90327
Sample ID: LFB 08/08/13 13:53Laboratory Fortified Blank Run: FIA202-HE_130808B
Phosphorus, Orthophosphate as P 105 90 1100.00500.210 mg/L
Sample ID: H13080148-001CMS 08/08/13 13:58Sample Matrix Spike Run: FIA202-HE_130808B
Phosphorus, Orthophosphate as P 108 90 1100.00500.323 mg/L
Sample ID: H13080148-001CMSD 08/08/13 14:00Sample Matrix Spike Duplicate Run: FIA202-HE_130808B
Phosphorus, Orthophosphate as P 109 90 110 200.0050 0.40.324 mg/L
Sample ID: H13080167-001AMS 08/08/13 14:14Sample Matrix Spike Run: FIA202-HE_130808B
Phosphorus, Orthophosphate as P 97 90 1100.00500.456 mg/L
Sample ID: H13080167-001AMSD 08/08/13 14:15Sample Matrix Spike Duplicate Run: FIA202-HE_130808B
Phosphorus, Orthophosphate as P 100 90 110 200.0050 2.90.469 mg/L
Qualifiers:
RL - Analyte reporting limit. ND - Not detected at the reporting limit.
Page 42 of 44

Shipping container/cooler in good condition?
Custody seals intact on all shipping container(s)/cooler(s)?
Custody seals intact on all sample bottles?
Chain of custody present?
Chain of custody signed when relinquished and received?
Chain of custody agrees with sample labels?
Samples in proper container/bottle?
Sample containers intact?
Sufficient sample volume for indicated test?
All samples received within holding time?(Exclude analyses that are considered field parameterssuch as pH, DO, Res Cl, Sulfite, Ferrous Iron, etc.)
Container/Temp Blank temperature:
Water - VOA vials have zero headspace?
Water - pH acceptable upon receipt?
Yes
Yes
Yes
Yes
Yes
Yes
Yes
Yes
Yes
Yes
Yes
Yes
No
No
No
No
No
No
No
No
No
No
No
No
� �
�
�
�
�
�
�
�
�
�
�
�
�
�
�
�
�
�
�
�
�
�
�
Not Present
Not Present
Not Present
�
�
�
No VOA vials submitted
Not Applicable �
�
°C See comments
8/8/2013Tracy L. Lorash
Hand Del
elm
Date Received:
Received by:
Login completed by:
Carrier name:
BL2000\jweidemoyer
8/9/2013
Reviewed by:
Reviewed Date:
Contact and Corrective Action Comments:
Cooler 1 was received at 3.2°C, Cooler 2 at 3.0°C. Samples were received on wet ice.CHIT sample for Dissolved Metals was preserved to pH <2 with 2 mL of Nitric acid per 250 mL in the laboratory. BCR3 and BCR3-POST samples for Nutrients were preserved to pH <2 with 2 mL of sulfuric acid per 250 mL in the laboratory upon receipt. Tl 8/8/13
Temp Blank received in all shipping container(s)/cooler(s)? Yes No� � Not Applicable �
Workorder Receipt Checklist
CDM Federal Programs H13080161
Lab measurement of analytes considered field parameters that require analysis within 15 minutes of sampling such as pH, Dissolved Oxygen and Residual Chlorine, are qualified as being analyzed outside of recommended holding time.
Solid/soil samples are reported on a wet weight basis (as received) unless specifically indicated. If moisture corrected, data units are typically noted as –dry. For agricultural and mining soil parameters/characteristics, all samples are dried and ground prior to sample analysis.
Standard Reporting Procedures
Page 43 of 44

Page 44 of 44

ANALYTICAL SUMMARY REPORTANALYTICAL SUMMARY REPORTANALYTICAL SUMMARY REPORTANALYTICAL SUMMARY REPORT
Sample ID Client Sample ID Collect Date Receive Date Matrix Test
H13080347-001 13BH-DT-PILOT-INFL-081913
08/19/13 11:30 08/20/13 Aqueous Metals by ICP/ICPMS, DissolvedAcidity, Total as CaCO3AlkalinityConductivityFluorideAnions by Ion ChromatographyPhosphorus, Orthophosphate as PSolids, Total Dissolved
H13080347-002 13BH-DT-PILOT-SAPS-081913
08/19/13 12:25 08/20/13 Aqueous Same As Above
H13080347-003 13BH-DT-PILOT-CHIT-081913
08/19/13 12:45 08/20/13 Aqueous Same As Above
H13080347-004 13BH-DT-PILOT-MGOH-081913
08/19/13 13:05 08/20/13 Aqueous Same As Above
H13080347-005 13BH-DT-PILOT-BCR1-081913
08/19/13 13:20 08/20/13 Aqueous Metals by ICP/ICPMS, DissolvedAcidity, Total as CaCO3AlkalinityConductivityFluorideAnions by Ion ChromatographyPhosphorus, Orthophosphate as PSolids, Total DissolvedSulfide, Methylene Blue Colorimetric
H13080347-006 13BH-DT-PILOT-BCR2-081913
08/19/13 13:35 08/20/13 Aqueous Metals by ICP/ICPMS, DissolvedAcidity, Total as CaCO3AlkalinityBiochemical Oxygen Demand, 5 DayConductivityFluorideAnions by Ion ChromatographyNitrogen, AmmoniaPhosphorus, Orthophosphate as PSolids, Total DissolvedSulfide, Methylene Blue Colorimetric
H13080347-007 13BH-DT-PILOT-BCR3-081913
08/19/13 13:55 08/20/13 Aqueous Metals by ICP/ICPMS, DissolvedAcidity, Total as CaCO3AlkalinityConductivityFluorideAnions by Ion ChromatographyPhosphorus, Orthophosphate as PSolids, Total DissolvedSulfide, Iodine Titrimetric
H13080347-008 13BH-DT-PILOT-BDR3-081913
08/19/13 14:00 08/20/13 Aqueous Same As Above
CDM Federal Programs
Project Name: Barker Hughsville Pilot
Workorder No.: H13080347
555 17th St Ste 1100
Denver, CO 80202
August 30, 2013
H823 - Baker-Hughsville Superfund SiteQuote ID:
Energy Laboratories Inc Helena MT received the following 10 samples for CDM Federal Programs on 8/20/2013 for analysis.
Page 1 of 38

ANALYTICAL SUMMARY REPORTANALYTICAL SUMMARY REPORTANALYTICAL SUMMARY REPORTANALYTICAL SUMMARY REPORT
The analyses presented in this report were performed by Energy Laboratories, Inc., 3161 E. Lyndale Ave., Helena, MT 59604, unless otherwise noted. Any exceptions or problems with the analyses are noted in the Laboratory Analytical Report, the QA/QC Summary Report, or the Case Narrative.
The results as reported relate only to the item(s) submitted for testing.
If you have any questions regarding these test results, please call.
Report Approved By:
H13080347-009 13BH-DT-PILOT-BCR2-POST-081913
08/19/13 14:10 08/20/13 Aqueous Biochemical Oxygen Demand, 5 DayNitrogen, AmmoniaSulfide, Methylene Blue Colorimetric
H13080347-010 13BH-DT-PILOT-BCR4-081913
08/19/13 14:30 08/20/13 Aqueous Metals by ICP/ICPMS, DissolvedAcidity, Total as CaCO3AlkalinityConductivityFluorideAnions by Ion ChromatographyPhosphorus, Orthophosphate as PSolids, Total DissolvedSulfide, Methylene Blue Colorimetric
Page 2 of 38

Project: Barker Hughsville Pilot
CLIENT: CDM Federal Programs
Sample Delivery Group: H13080347 CASE NARRATIVE
08/30/13Report Date:
Revised Date: 08/30/13
Tests associated with analyst identified as ELI-B were subcontracted to Energy Laboratories, 1120 S. 27th St., Billings, MT, EPA Number MT00005.
Page 3 of 38

LABORATORY ANALYTICAL REPORT
Client: CDM Federal Programs
Project: Barker Hughsville Pilot
Lab ID: H13080347-001
Client Sample ID 13BH-DT-PILOT-INFL-081913
Collection Date: 08/19/13 11:30
Matrix: Aqueous
Report Date: 08/30/13
DateReceived: 08/20/13
Revised Date: 08/30/13Prepared by Helena, MT Branch
Analyses Result Units Analysis Date / ByRL Method
MCL/QCLQualifiers
PHYSICAL PROPERTIES
08/20/13 13:55 / cmm10mg/L1600Solids, Total Dissolved TDS @ 180 C A2540 C
INORGANICS
D 08/26/13 10:00 / cmm4.0mg/L670Acidity, Total as CaCO3 A2310 B
08/20/13 16:04 / cmm1mg/LNDAlkalinity, Total as CaCO3 A2320 B
08/20/13 16:04 / cmm1mg/LNDBicarbonate as HCO3 A2320 B
08/20/13 16:04 / cmm1mg/LNDCarbonate as CO3 A2320 B
08/20/13 16:04 / cmm1mg/LNDHydroxide as OH A2320 B
08/21/13 18:33 / cmm1mg/LNDChloride E300.0
08/21/13 18:33 / cmm1mg/L1900Sulfate E300.0
D 08/23/13 11:31 / cmm0.2mg/L0.7Fluoride A4500-F C4
NUTRIENTS
08/20/13 13:14 / reh0.005mg/L0.218Phosphorus, Orthophosphate as P E365.1
METALS, DISSOLVED
D 08/20/13 13:50 / sld0.05mg/L12.0Aluminum E200.7
08/21/13 10:32 / dck0.001mg/L0.168Arsenic E200.8
08/21/13 10:32 / dck0.05mg/LNDBarium E200.8
08/21/13 10:32 / dck0.001mg/L0.006Beryllium E200.8
08/22/13 11:54 / dck0.001mg/L0.228Cadmium E200.8
08/20/13 13:50 / sld1mg/L95Calcium E200.7
08/21/13 10:32 / dck0.005mg/LNDChromium E200.8
08/21/13 10:32 / dck0.005mg/L0.041Cobalt E200.8
08/22/13 11:54 / dck0.005mg/L1.30Copper E200.8
08/20/13 13:50 / sld0.03mg/L145Iron E200.7
08/21/13 10:32 / dck0.001mg/L0.151Lead E200.8
08/20/13 13:50 / sld1mg/L21Magnesium E200.7
D 08/20/13 13:50 / sld0.003mg/L106Manganese E200.7
08/21/13 10:32 / dck0.005mg/L0.029Nickel E200.8
08/20/13 13:50 / sld1mg/L1Potassium E200.7
08/21/13 10:32 / dck0.001mg/LNDSilver E200.8
08/20/13 13:50 / sld1mg/L7Sodium E200.7
08/21/13 10:32 / dck0.0005mg/L0.0018Thallium E200.8
08/21/13 15:06 / sld0.01mg/L51.3Zinc E200.7
ReportDefinitions:
RL - Analyte reporting limit. MCL - Maximum contaminant level.
QCL - Quality control limit. ND - Not detected at the reporting limit.
D - RL increased due to sample matrix.
Page 4 of 38
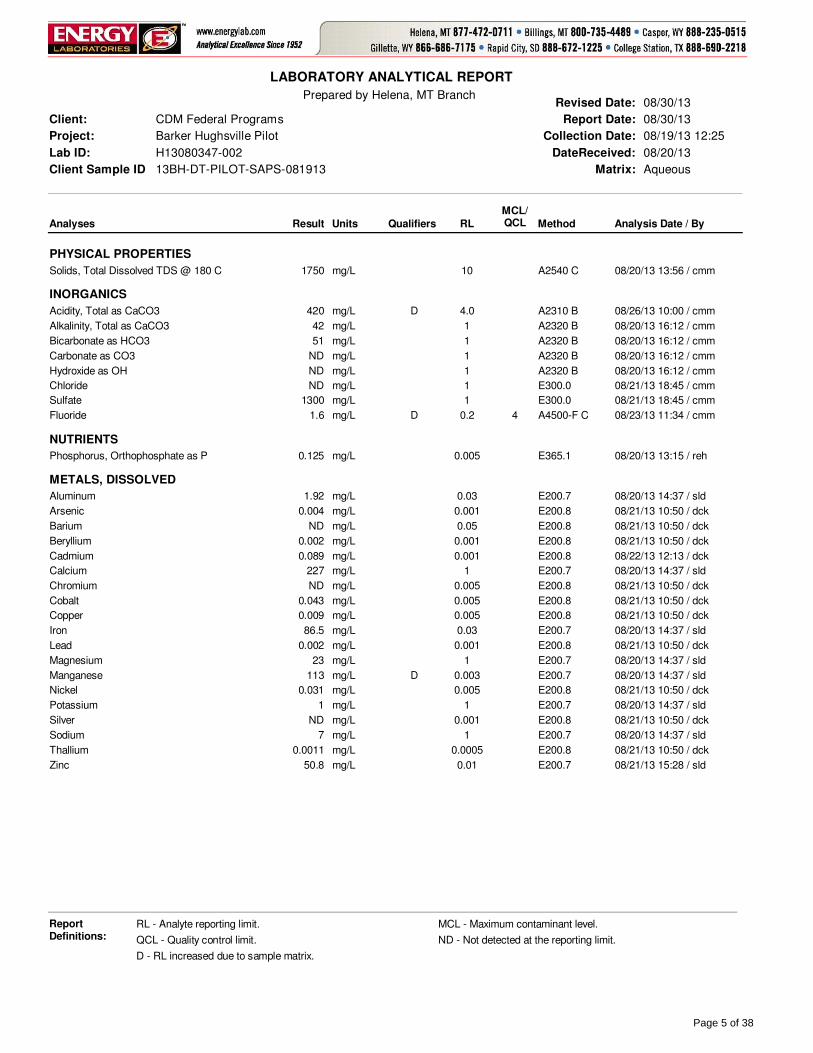
LABORATORY ANALYTICAL REPORT
Client: CDM Federal Programs
Project: Barker Hughsville Pilot
Lab ID: H13080347-002
Client Sample ID 13BH-DT-PILOT-SAPS-081913
Collection Date: 08/19/13 12:25
Matrix: Aqueous
Report Date: 08/30/13
DateReceived: 08/20/13
Revised Date: 08/30/13Prepared by Helena, MT Branch
Analyses Result Units Analysis Date / ByRL Method
MCL/QCLQualifiers
PHYSICAL PROPERTIES
08/20/13 13:56 / cmm10mg/L1750Solids, Total Dissolved TDS @ 180 C A2540 C
INORGANICS
D 08/26/13 10:00 / cmm4.0mg/L420Acidity, Total as CaCO3 A2310 B
08/20/13 16:12 / cmm1mg/L42Alkalinity, Total as CaCO3 A2320 B
08/20/13 16:12 / cmm1mg/L51Bicarbonate as HCO3 A2320 B
08/20/13 16:12 / cmm1mg/LNDCarbonate as CO3 A2320 B
08/20/13 16:12 / cmm1mg/LNDHydroxide as OH A2320 B
08/21/13 18:45 / cmm1mg/LNDChloride E300.0
08/21/13 18:45 / cmm1mg/L1300Sulfate E300.0
D 08/23/13 11:34 / cmm0.2mg/L1.6Fluoride A4500-F C4
NUTRIENTS
08/20/13 13:15 / reh0.005mg/L0.125Phosphorus, Orthophosphate as P E365.1
METALS, DISSOLVED
08/20/13 14:37 / sld0.03mg/L1.92Aluminum E200.7
08/21/13 10:50 / dck0.001mg/L0.004Arsenic E200.8
08/21/13 10:50 / dck0.05mg/LNDBarium E200.8
08/21/13 10:50 / dck0.001mg/L0.002Beryllium E200.8
08/22/13 12:13 / dck0.001mg/L0.089Cadmium E200.8
08/20/13 14:37 / sld1mg/L227Calcium E200.7
08/21/13 10:50 / dck0.005mg/LNDChromium E200.8
08/21/13 10:50 / dck0.005mg/L0.043Cobalt E200.8
08/21/13 10:50 / dck0.005mg/L0.009Copper E200.8
08/20/13 14:37 / sld0.03mg/L86.5Iron E200.7
08/21/13 10:50 / dck0.001mg/L0.002Lead E200.8
08/20/13 14:37 / sld1mg/L23Magnesium E200.7
D 08/20/13 14:37 / sld0.003mg/L113Manganese E200.7
08/21/13 10:50 / dck0.005mg/L0.031Nickel E200.8
08/20/13 14:37 / sld1mg/L1Potassium E200.7
08/21/13 10:50 / dck0.001mg/LNDSilver E200.8
08/20/13 14:37 / sld1mg/L7Sodium E200.7
08/21/13 10:50 / dck0.0005mg/L0.0011Thallium E200.8
08/21/13 15:28 / sld0.01mg/L50.8Zinc E200.7
ReportDefinitions:
RL - Analyte reporting limit. MCL - Maximum contaminant level.
QCL - Quality control limit. ND - Not detected at the reporting limit.
D - RL increased due to sample matrix.
Page 5 of 38

LABORATORY ANALYTICAL REPORT
Client: CDM Federal Programs
Project: Barker Hughsville Pilot
Lab ID: H13080347-003
Client Sample ID 13BH-DT-PILOT-CHIT-081913
Collection Date: 08/19/13 12:45
Matrix: Aqueous
Report Date: 08/30/13
DateReceived: 08/20/13
Revised Date: 08/30/13Prepared by Helena, MT Branch
Analyses Result Units Analysis Date / ByRL Method
MCL/QCLQualifiers
PHYSICAL PROPERTIES
08/20/13 13:56 / cmm10mg/L3830Solids, Total Dissolved TDS @ 180 C A2540 C
INORGANICS
D 08/26/13 10:00 / cmm4.0mg/LNDAcidity, Total as CaCO3 A2310 B
08/28/13 19:48 / cmm1mg/L1700Alkalinity, Total as CaCO3 A2320 B
08/28/13 19:48 / cmm1mg/L2100Bicarbonate as HCO3 A2320 B
08/28/13 19:48 / cmm1mg/LNDCarbonate as CO3 A2320 B
08/28/13 19:48 / cmm1mg/LNDHydroxide as OH A2320 B
D 08/27/13 15:54 / cmm5mg/L31Chloride E300.0
D 08/27/13 15:54 / cmm2mg/L1100Sulfate E300.0
D 08/23/13 11:35 / cmm0.2mg/L0.6Fluoride A4500-F C4
NUTRIENTS
D 08/20/13 13:27 / reh0.2mg/L45.2Phosphorus, Orthophosphate as P E365.1
METALS, DISSOLVED
08/21/13 11:19 / dck0.03mg/LNDAluminum E200.8
08/21/13 11:19 / dck0.001mg/L0.023Arsenic E200.8
08/21/13 11:19 / dck0.05mg/L0.05Barium E200.8
08/21/13 11:19 / dck0.001mg/LNDBeryllium E200.8
08/22/13 12:36 / dck0.001mg/LNDCadmium E200.8
08/20/13 14:41 / sld1mg/L852Calcium E200.7
08/21/13 11:19 / dck0.005mg/LNDChromium E200.8
08/21/13 11:19 / dck0.005mg/L0.012Cobalt E200.8
08/21/13 11:19 / dck0.005mg/LNDCopper E200.8
08/20/13 14:41 / sld0.03mg/L32.2Iron E200.7
08/21/13 11:19 / dck0.001mg/LNDLead E200.8
08/20/13 14:41 / sld1mg/L46Magnesium E200.7
D 08/20/13 14:41 / sld0.003mg/L75.0Manganese E200.7
08/21/13 11:19 / dck0.005mg/L0.008Nickel E200.8
08/20/13 14:41 / sld1mg/L6Potassium E200.7
08/21/13 11:19 / dck0.001mg/LNDSilver E200.8
08/20/13 14:41 / sld1mg/L30Sodium E200.7
08/21/13 11:19 / dck0.0005mg/LNDThallium E200.8
08/21/13 11:19 / dck0.01mg/L0.02Zinc E200.8
ReportDefinitions:
RL - Analyte reporting limit. MCL - Maximum contaminant level.
QCL - Quality control limit. ND - Not detected at the reporting limit.
D - RL increased due to sample matrix.
Page 6 of 38

LABORATORY ANALYTICAL REPORT
Client: CDM Federal Programs
Project: Barker Hughsville Pilot
Lab ID: H13080347-004
Client Sample ID 13BH-DT-PILOT-MGOH-081913
Collection Date: 08/19/13 13:05
Matrix: Aqueous
Report Date: 08/30/13
DateReceived: 08/20/13
Revised Date: 08/30/13Prepared by Helena, MT Branch
Analyses Result Units Analysis Date / ByRL Method
MCL/QCLQualifiers
PHYSICAL PROPERTIES
08/20/13 13:56 / cmm10mg/L1440Solids, Total Dissolved TDS @ 180 C A2540 C
INORGANICS
D 08/26/13 10:00 / cmm4.0mg/L410Acidity, Total as CaCO3 A2310 B
08/20/13 16:36 / cmm1mg/LNDAlkalinity, Total as CaCO3 A2320 B
08/20/13 16:36 / cmm1mg/LNDBicarbonate as HCO3 A2320 B
08/20/13 16:36 / cmm1mg/LNDCarbonate as CO3 A2320 B
08/20/13 16:36 / cmm1mg/LNDHydroxide as OH A2320 B
08/21/13 19:36 / cmm1mg/L2Chloride E300.0
08/21/13 19:36 / cmm1mg/L1400Sulfate E300.0
D 08/23/13 11:38 / cmm0.2mg/L1.3Fluoride A4500-F C4
NUTRIENTS
08/20/13 13:18 / reh0.005mg/L0.182Phosphorus, Orthophosphate as P E365.1
METALS, DISSOLVED
D 08/20/13 14:45 / sld0.05mg/L10.2Aluminum E200.7
08/21/13 11:24 / dck0.001mg/L0.009Arsenic E200.8
08/21/13 11:24 / dck0.05mg/LNDBarium E200.8
08/21/13 11:24 / dck0.001mg/L0.005Beryllium E200.8
08/22/13 12:40 / dck0.001mg/L0.224Cadmium E200.8
08/20/13 14:45 / sld1mg/L103Calcium E200.7
08/21/13 11:24 / dck0.005mg/LNDChromium E200.8
08/21/13 11:24 / dck0.005mg/L0.040Cobalt E200.8
08/22/13 12:40 / dck0.005mg/L1.11Copper E200.8
08/20/13 14:45 / sld0.03mg/L36.6Iron E200.7
08/21/13 11:24 / dck0.001mg/L0.111Lead E200.8
08/20/13 14:45 / sld1mg/L88Magnesium E200.7
D 08/20/13 14:45 / sld0.003mg/L109Manganese E200.7
08/21/13 11:24 / dck0.005mg/L0.028Nickel E200.8
08/20/13 14:45 / sld1mg/LNDPotassium E200.7
08/21/13 11:24 / dck0.001mg/LNDSilver E200.8
08/20/13 14:45 / sld1mg/L8Sodium E200.7
08/21/13 11:24 / dck0.0005mg/L0.0018Thallium E200.8
08/21/13 15:31 / sld0.01mg/L51.0Zinc E200.7
ReportDefinitions:
RL - Analyte reporting limit. MCL - Maximum contaminant level.
QCL - Quality control limit. ND - Not detected at the reporting limit.
D - RL increased due to sample matrix.
Page 7 of 38
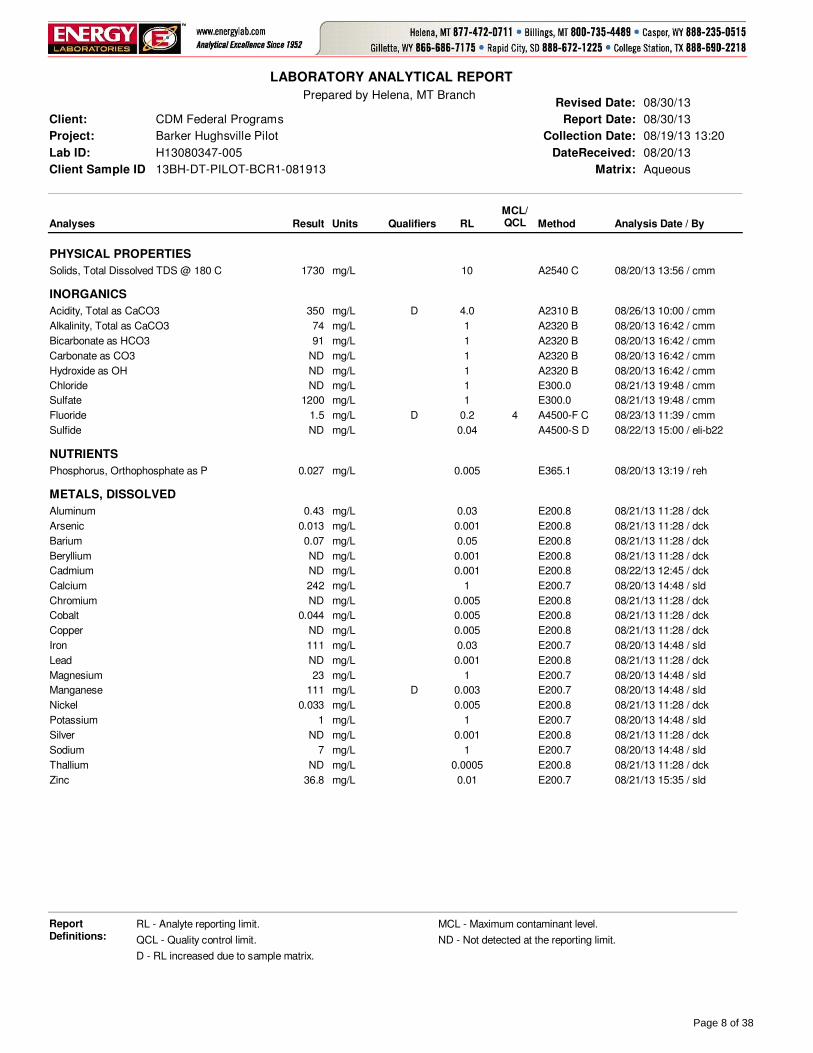
LABORATORY ANALYTICAL REPORT
Client: CDM Federal Programs
Project: Barker Hughsville Pilot
Lab ID: H13080347-005
Client Sample ID 13BH-DT-PILOT-BCR1-081913
Collection Date: 08/19/13 13:20
Matrix: Aqueous
Report Date: 08/30/13
DateReceived: 08/20/13
Revised Date: 08/30/13Prepared by Helena, MT Branch
Analyses Result Units Analysis Date / ByRL Method
MCL/QCLQualifiers
PHYSICAL PROPERTIES
08/20/13 13:56 / cmm10mg/L1730Solids, Total Dissolved TDS @ 180 C A2540 C
INORGANICS
D 08/26/13 10:00 / cmm4.0mg/L350Acidity, Total as CaCO3 A2310 B
08/20/13 16:42 / cmm1mg/L74Alkalinity, Total as CaCO3 A2320 B
08/20/13 16:42 / cmm1mg/L91Bicarbonate as HCO3 A2320 B
08/20/13 16:42 / cmm1mg/LNDCarbonate as CO3 A2320 B
08/20/13 16:42 / cmm1mg/LNDHydroxide as OH A2320 B
08/21/13 19:48 / cmm1mg/LNDChloride E300.0
08/21/13 19:48 / cmm1mg/L1200Sulfate E300.0
D 08/23/13 11:39 / cmm0.2mg/L1.5Fluoride A4500-F C4
08/22/13 15:00 / eli-b220.04mg/LNDSulfide A4500-S D
NUTRIENTS
08/20/13 13:19 / reh0.005mg/L0.027Phosphorus, Orthophosphate as P E365.1
METALS, DISSOLVED
08/21/13 11:28 / dck0.03mg/L0.43Aluminum E200.8
08/21/13 11:28 / dck0.001mg/L0.013Arsenic E200.8
08/21/13 11:28 / dck0.05mg/L0.07Barium E200.8
08/21/13 11:28 / dck0.001mg/LNDBeryllium E200.8
08/22/13 12:45 / dck0.001mg/LNDCadmium E200.8
08/20/13 14:48 / sld1mg/L242Calcium E200.7
08/21/13 11:28 / dck0.005mg/LNDChromium E200.8
08/21/13 11:28 / dck0.005mg/L0.044Cobalt E200.8
08/21/13 11:28 / dck0.005mg/LNDCopper E200.8
08/20/13 14:48 / sld0.03mg/L111Iron E200.7
08/21/13 11:28 / dck0.001mg/LNDLead E200.8
08/20/13 14:48 / sld1mg/L23Magnesium E200.7
D 08/20/13 14:48 / sld0.003mg/L111Manganese E200.7
08/21/13 11:28 / dck0.005mg/L0.033Nickel E200.8
08/20/13 14:48 / sld1mg/L1Potassium E200.7
08/21/13 11:28 / dck0.001mg/LNDSilver E200.8
08/20/13 14:48 / sld1mg/L7Sodium E200.7
08/21/13 11:28 / dck0.0005mg/LNDThallium E200.8
08/21/13 15:35 / sld0.01mg/L36.8Zinc E200.7
ReportDefinitions:
RL - Analyte reporting limit. MCL - Maximum contaminant level.
QCL - Quality control limit. ND - Not detected at the reporting limit.
D - RL increased due to sample matrix.
Page 8 of 38

LABORATORY ANALYTICAL REPORT
Client: CDM Federal Programs
Project: Barker Hughsville Pilot
Lab ID: H13080347-006
Client Sample ID 13BH-DT-PILOT-BCR2-081913
Collection Date: 08/19/13 13:35
Matrix: Aqueous
Report Date: 08/30/13
DateReceived: 08/20/13
Revised Date: 08/30/13Prepared by Helena, MT Branch
Analyses Result Units Analysis Date / ByRL Method
MCL/QCLQualifiers
PHYSICAL PROPERTIES
08/20/13 13:56 / cmm10mg/L1630Solids, Total Dissolved TDS @ 180 C A2540 C
INORGANICS
D 08/26/13 10:00 / cmm4.0mg/L200Acidity, Total as CaCO3 A2310 B
08/20/13 16:48 / cmm1mg/L110Alkalinity, Total as CaCO3 A2320 B
08/20/13 16:48 / cmm1mg/L140Bicarbonate as HCO3 A2320 B
08/20/13 16:48 / cmm1mg/LNDCarbonate as CO3 A2320 B
08/20/13 16:48 / cmm1mg/LNDHydroxide as OH A2320 B
08/21/13 20:01 / cmm1mg/LNDChloride E300.0
08/21/13 20:01 / cmm1mg/L1100Sulfate E300.0
D 08/23/13 11:39 / cmm0.2mg/L1.6Fluoride A4500-F C4
08/22/13 15:00 / eli-b220.04mg/LNDSulfide A4500-S D
AGGREGATE ORGANICS
08/20/13 14:29 / cmm40mg/L<39Oxygen Demand, Biochemical (BOD) A5210 B
No BOD dilution depleted greater than 2.0 mg/L DO.
NUTRIENTS
08/29/13 12:45 / reh0.05mg/L0.05Nitrogen, Ammonia as N E350.1
08/20/13 13:23 / reh0.005mg/L0.196Phosphorus, Orthophosphate as P E365.1
METALS, DISSOLVED
08/22/13 12:50 / dck0.03mg/L0.05Aluminum E200.8
08/22/13 12:50 / dck0.001mg/L0.002Arsenic E200.8
08/22/13 12:50 / dck0.05mg/L0.15Barium E200.8
08/22/13 12:50 / dck0.001mg/LNDBeryllium E200.8
08/22/13 12:50 / dck0.001mg/LNDCadmium E200.8
08/20/13 14:52 / sld1mg/L290Calcium E200.7
08/22/13 12:50 / dck0.005mg/LNDChromium E200.8
08/22/13 12:50 / dck0.005mg/L0.030Cobalt E200.8
08/22/13 12:50 / dck0.005mg/LNDCopper E200.8
08/20/13 14:52 / sld0.03mg/L69.3Iron E200.7
08/23/13 21:41 / dck0.001mg/LNDLead E200.8
08/20/13 14:52 / sld1mg/L23Magnesium E200.7
D 08/20/13 14:52 / sld0.003mg/L113Manganese E200.7
08/22/13 12:50 / dck0.005mg/L0.016Nickel E200.8
08/20/13 14:52 / sld1mg/L1Potassium E200.7
08/23/13 21:41 / dck0.001mg/LNDSilver E200.8
08/20/13 14:52 / sld1mg/L7Sodium E200.7
08/22/13 12:50 / dck0.0005mg/LNDThallium E200.8
08/21/13 15:39 / sld0.01mg/L5.85Zinc E200.7
ReportDefinitions:
RL - Analyte reporting limit. MCL - Maximum contaminant level.
QCL - Quality control limit. ND - Not detected at the reporting limit.
D - RL increased due to sample matrix.
Page 9 of 38

LABORATORY ANALYTICAL REPORT
Client: CDM Federal Programs
Project: Barker Hughsville Pilot
Lab ID: H13080347-007
Client Sample ID 13BH-DT-PILOT-BCR3-081913
Collection Date: 08/19/13 13:55
Matrix: Aqueous
Report Date: 08/30/13
DateReceived: 08/20/13
Revised Date: 08/30/13Prepared by Helena, MT Branch
Analyses Result Units Analysis Date / ByRL Method
MCL/QCLQualifiers
PHYSICAL PROPERTIES
08/20/13 13:57 / cmm10mg/L4310Solids, Total Dissolved TDS @ 180 C A2540 C
INORGANICS
D 08/26/13 10:00 / cmm4.0mg/LNDAcidity, Total as CaCO3 A2310 B
08/28/13 20:43 / cmm1mg/L2600Alkalinity, Total as CaCO3 A2320 B
08/28/13 20:43 / cmm1mg/L3200Bicarbonate as HCO3 A2320 B
08/28/13 20:43 / cmm1mg/LNDCarbonate as CO3 A2320 B
08/28/13 20:43 / cmm1mg/LNDHydroxide as OH A2320 B
D 08/21/13 20:13 / cmm5mg/L63Chloride E300.0
D 08/21/13 20:13 / cmm2mg/L670Sulfate E300.0
08/23/13 11:41 / cmm0.1mg/L0.2Fluoride A4500-F C4
08/22/13 14:45 / eli-b221mg/L62Sulfide A4500-S F
NUTRIENTS
D 08/20/13 13:24 / reh0.2mg/L30.2Phosphorus, Orthophosphate as P E365.1
METALS, DISSOLVED
08/21/13 11:38 / dck0.03mg/LNDAluminum E200.8
08/21/13 11:38 / dck0.001mg/L0.030Arsenic E200.8
08/21/13 11:38 / dck0.05mg/L0.28Barium E200.8
08/21/13 11:38 / dck0.001mg/LNDBeryllium E200.8
08/22/13 12:54 / dck0.001mg/LNDCadmium E200.8
08/20/13 14:56 / sld1mg/L1040Calcium E200.7
08/21/13 11:38 / dck0.005mg/LNDChromium E200.8
08/21/13 11:38 / dck0.005mg/LNDCobalt E200.8
08/21/13 11:38 / dck0.005mg/LNDCopper E200.8
08/21/13 11:38 / dck0.03mg/L0.16Iron E200.8
08/21/13 11:38 / dck0.001mg/LNDLead E200.8
08/20/13 14:56 / sld1mg/L64Magnesium E200.7
D 08/20/13 14:56 / sld0.003mg/L48.6Manganese E200.7
08/21/13 11:38 / dck0.005mg/LNDNickel E200.8
08/20/13 14:56 / sld1mg/L14Potassium E200.7
08/21/13 11:38 / dck0.001mg/LNDSilver E200.8
08/20/13 14:56 / sld1mg/L49Sodium E200.7
08/21/13 11:38 / dck0.0005mg/LNDThallium E200.8
08/21/13 11:38 / dck0.01mg/L0.02Zinc E200.8
ReportDefinitions:
RL - Analyte reporting limit. MCL - Maximum contaminant level.
QCL - Quality control limit. ND - Not detected at the reporting limit.
D - RL increased due to sample matrix.
Page 10 of 38

LABORATORY ANALYTICAL REPORT
Client: CDM Federal Programs
Project: Barker Hughsville Pilot
Lab ID: H13080347-008
Client Sample ID 13BH-DT-PILOT-BDR3-081913
Collection Date: 08/19/13 14:00
Matrix: Aqueous
Report Date: 08/30/13
DateReceived: 08/20/13
Revised Date: 08/30/13Prepared by Helena, MT Branch
Analyses Result Units Analysis Date / ByRL Method
MCL/QCLQualifiers
PHYSICAL PROPERTIES
08/20/13 13:57 / cmm10mg/L4650Solids, Total Dissolved TDS @ 180 C A2540 C
INORGANICS
D 08/26/13 10:00 / cmm4.0mg/LNDAcidity, Total as CaCO3 A2310 B
08/28/13 21:00 / cmm1mg/L2600Alkalinity, Total as CaCO3 A2320 B
08/28/13 21:00 / cmm1mg/L3200Bicarbonate as HCO3 A2320 B
08/28/13 21:00 / cmm1mg/LNDCarbonate as CO3 A2320 B
08/28/13 21:00 / cmm1mg/LNDHydroxide as OH A2320 B
D 08/21/13 20:51 / cmm5mg/L67Chloride E300.0
D 08/21/13 20:51 / cmm2mg/L630Sulfate E300.0
08/23/13 11:43 / cmm0.1mg/L0.2Fluoride A4500-F C4
08/22/13 14:45 / eli-b221mg/L67Sulfide A4500-S F
NUTRIENTS
D 08/20/13 13:25 / reh0.2mg/L36.5Phosphorus, Orthophosphate as P E365.1
METALS, DISSOLVED
08/21/13 11:42 / dck0.03mg/LNDAluminum E200.8
08/21/13 11:42 / dck0.001mg/L0.032Arsenic E200.8
08/21/13 11:42 / dck0.05mg/L0.29Barium E200.8
08/21/13 11:42 / dck0.001mg/LNDBeryllium E200.8
08/22/13 12:59 / dck0.001mg/LNDCadmium E200.8
08/20/13 15:00 / sld1mg/L1050Calcium E200.7
08/21/13 11:42 / dck0.005mg/LNDChromium E200.8
08/21/13 11:42 / dck0.005mg/LNDCobalt E200.8
08/21/13 11:42 / dck0.005mg/LNDCopper E200.8
08/21/13 11:42 / dck0.03mg/L0.12Iron E200.8
08/21/13 11:42 / dck0.001mg/LNDLead E200.8
08/20/13 15:00 / sld1mg/L64Magnesium E200.7
D 08/20/13 15:00 / sld0.003mg/L48.3Manganese E200.7
08/21/13 11:42 / dck0.005mg/LNDNickel E200.8
08/20/13 15:00 / sld1mg/L14Potassium E200.7
08/21/13 11:42 / dck0.001mg/LNDSilver E200.8
08/20/13 15:00 / sld1mg/L48Sodium E200.7
08/21/13 11:42 / dck0.0005mg/LNDThallium E200.8
08/22/13 12:59 / dck0.01mg/LNDZinc E200.8
ReportDefinitions:
RL - Analyte reporting limit. MCL - Maximum contaminant level.
QCL - Quality control limit. ND - Not detected at the reporting limit.
D - RL increased due to sample matrix.
Page 11 of 38

LABORATORY ANALYTICAL REPORT
Client: CDM Federal Programs
Project: Barker Hughsville Pilot
Lab ID: H13080347-009
Client Sample ID 13BH-DT-PILOT-BCR2-POST-081913
Collection Date: 08/19/13 14:10
Matrix: Aqueous
Report Date: 08/30/13
DateReceived: 08/20/13
Revised Date: 08/30/13Prepared by Helena, MT Branch
Analyses Result Units Analysis Date / ByRL Method
MCL/QCLQualifiers
INORGANICS
08/22/13 15:00 / eli-b220.04mg/LNDSulfide A4500-S D
AGGREGATE ORGANICS
08/20/13 14:31 / cmm40mg/L56Oxygen Demand, Biochemical (BOD) A5210 B
NUTRIENTS
08/29/13 12:47 / reh0.05mg/L0.08Nitrogen, Ammonia as N E350.1
ReportDefinitions:
RL - Analyte reporting limit. MCL - Maximum contaminant level.
QCL - Quality control limit. ND - Not detected at the reporting limit.
Page 12 of 38

LABORATORY ANALYTICAL REPORT
Client: CDM Federal Programs
Project: Barker Hughsville Pilot
Lab ID: H13080347-010
Client Sample ID 13BH-DT-PILOT-BCR4-081913
Collection Date: 08/19/13 14:30
Matrix: Aqueous
Report Date: 08/30/13
DateReceived: 08/20/13
Revised Date: 08/30/13Prepared by Helena, MT Branch
Analyses Result Units Analysis Date / ByRL Method
MCL/QCLQualifiers
PHYSICAL PROPERTIES
08/20/13 13:57 / cmm10mg/L1490Solids, Total Dissolved TDS @ 180 C A2540 C
INORGANICS
D 08/26/13 10:00 / cmm4.0mg/L120Acidity, Total as CaCO3 A2310 B
08/20/13 17:28 / cmm1mg/L96Alkalinity, Total as CaCO3 A2320 B
08/20/13 17:28 / cmm1mg/L120Bicarbonate as HCO3 A2320 B
08/20/13 17:28 / cmm1mg/LNDCarbonate as CO3 A2320 B
08/20/13 17:28 / cmm1mg/LNDHydroxide as OH A2320 B
08/21/13 21:04 / cmm1mg/LNDChloride E300.0
08/21/13 21:04 / cmm1mg/L1000Sulfate E300.0
D 08/23/13 11:44 / cmm0.2mg/L1.4Fluoride A4500-F C4
08/22/13 15:00 / eli-b220.04mg/L0.11Sulfide A4500-S D
NUTRIENTS
08/20/13 13:26 / reh0.005mg/L0.211Phosphorus, Orthophosphate as P E365.1
METALS, DISSOLVED
08/20/13 15:11 / sld0.03mg/LNDAluminum E200.7
08/21/13 11:47 / dck0.001mg/L0.003Arsenic E200.8
08/21/13 11:47 / dck0.05mg/L0.12Barium E200.8
08/21/13 11:47 / dck0.001mg/LNDBeryllium E200.8
08/22/13 13:04 / dck0.001mg/LNDCadmium E200.8
08/20/13 15:11 / sld1mg/L167Calcium E200.7
08/21/13 11:47 / dck0.005mg/LNDChromium E200.8
08/21/13 11:47 / dck0.005mg/L0.010Cobalt E200.8
08/21/13 11:47 / dck0.005mg/LNDCopper E200.8
08/20/13 15:11 / sld0.03mg/L14.0Iron E200.7
08/21/13 11:47 / dck0.001mg/LNDLead E200.8
08/20/13 15:11 / sld1mg/L121Magnesium E200.7
D 08/20/13 15:11 / sld0.003mg/L98.1Manganese E200.7
08/21/13 11:47 / dck0.005mg/LNDNickel E200.8
08/20/13 15:11 / sld1mg/L2Potassium E200.7
08/21/13 11:47 / dck0.001mg/LNDSilver E200.8
08/20/13 15:11 / sld1mg/L8Sodium E200.7
08/21/13 11:47 / dck0.0005mg/LNDThallium E200.8
08/22/13 13:04 / dck0.01mg/L0.90Zinc E200.8
ReportDefinitions:
RL - Analyte reporting limit. MCL - Maximum contaminant level.
QCL - Quality control limit. ND - Not detected at the reporting limit.
D - RL increased due to sample matrix.
Page 13 of 38

Project: Barker Hughsville Pilot
Client: CDM Federal Programs
Work Order: H13080347
QA/QC Summary Report
08/30/13Report Date:
Analyte Result %REC RPDLow Limit High Limit RPDLimitRLUnits Qual
Revised Date: 08/30/13Prepared by Helena, MT Branch
Method: A2310 B Batch: H13080347-001A
Sample ID: H13080347-001A DUP 08/26/13 10:00Sample Duplicate Run: MISC WC_130826A
Acidity, Total as CaCO3 204.0 2.9690 mg/L
Sample ID: LCS1308260000 08/26/13 10:00Laboratory Control Sample Run: MISC WC_130826A
Acidity, Total as CaCO3 98 90 1104.0770 mg/L
Sample ID: MBLK1308260000 08/26/13 10:00Method Blank Run: MISC WC_130826A
Acidity, Total as CaCO3 36 mg/L
Method: A2310 B Batch: H13080347-001A rerun
Sample ID: H13080347-006ADUP 08/26/13 10:00Sample Duplicate Run: MISC WC_130828A
Acidity, Total as CaCO3 204.0 13220 mg/L
Sample ID: LCS1308260000 08/26/13 10:00Laboratory Control Sample Run: MISC WC_130828A
Acidity, Total as CaCO3 99 90 1104.0640 mg/L
Sample ID: MBLK1308260000 08/26/13 10:00Method Blank Run: MISC WC_130828A
Acidity, Total as CaCO3 3ND mg/L
Qualifiers:
RL - Analyte reporting limit. ND - Not detected at the reporting limit.
Page 14 of 38
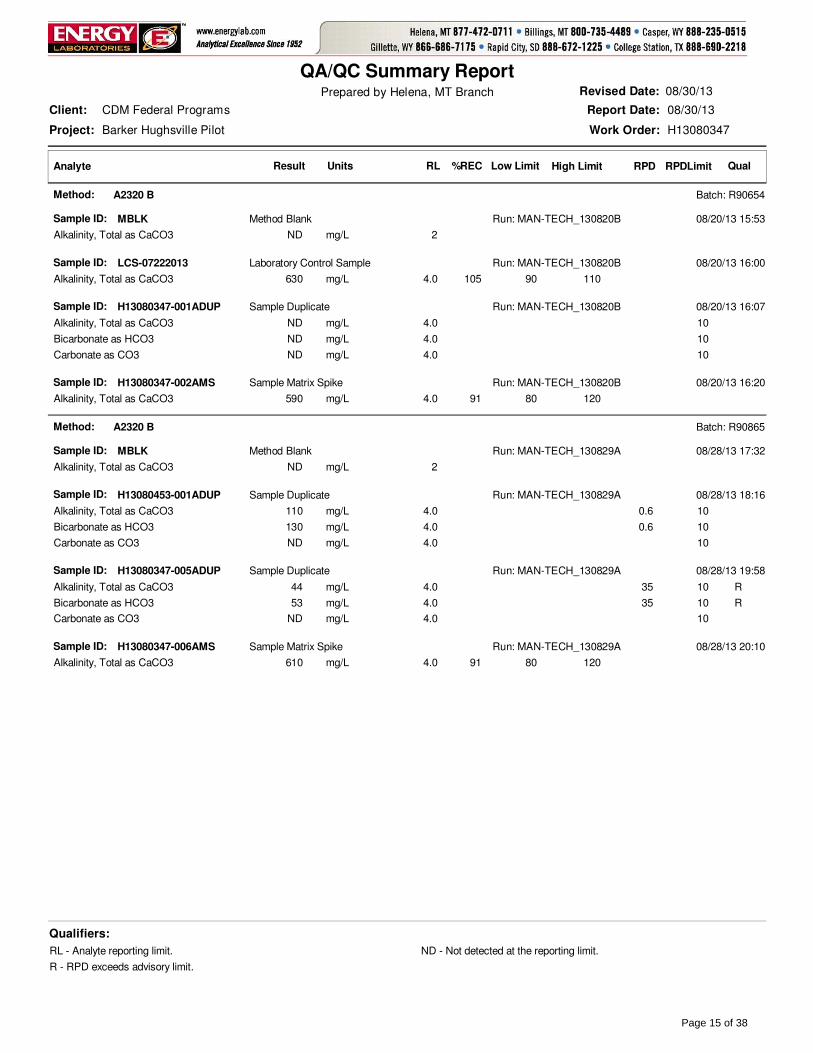
Project: Barker Hughsville Pilot
Client: CDM Federal Programs
Work Order: H13080347
QA/QC Summary Report
08/30/13Report Date:
Analyte Result %REC RPDLow Limit High Limit RPDLimitRLUnits Qual
Revised Date: 08/30/13Prepared by Helena, MT Branch
Method: A2320 B Batch: R90654
Sample ID: MBLK 08/20/13 15:53Method Blank Run: MAN-TECH_130820B
Alkalinity, Total as CaCO3 2ND mg/L
Sample ID: LCS-07222013 08/20/13 16:00Laboratory Control Sample Run: MAN-TECH_130820B
Alkalinity, Total as CaCO3 105 90 1104.0630 mg/L
Sample ID: H13080347-001ADUP 08/20/13 16:07Sample Duplicate Run: MAN-TECH_130820B
Alkalinity, Total as CaCO3 104.0ND mg/L
Bicarbonate as HCO3 104.0ND mg/L
Carbonate as CO3 104.0ND mg/L
Sample ID: H13080347-002AMS 08/20/13 16:20Sample Matrix Spike Run: MAN-TECH_130820B
Alkalinity, Total as CaCO3 91 80 1204.0590 mg/L
Method: A2320 B Batch: R90865
Sample ID: MBLK 08/28/13 17:32Method Blank Run: MAN-TECH_130829A
Alkalinity, Total as CaCO3 2ND mg/L
Sample ID: H13080453-001ADUP 08/28/13 18:16Sample Duplicate Run: MAN-TECH_130829A
Alkalinity, Total as CaCO3 104.0 0.6110 mg/L
Bicarbonate as HCO3 104.0 0.6130 mg/L
Carbonate as CO3 104.0ND mg/L
Sample ID: H13080347-005ADUP 08/28/13 19:58Sample Duplicate Run: MAN-TECH_130829A
Alkalinity, Total as CaCO3 104.0 3544 mg/L R
Bicarbonate as HCO3 104.0 3553 mg/L R
Carbonate as CO3 104.0ND mg/L
Sample ID: H13080347-006AMS 08/28/13 20:10Sample Matrix Spike Run: MAN-TECH_130829A
Alkalinity, Total as CaCO3 91 80 1204.0610 mg/L
Qualifiers:
RL - Analyte reporting limit. ND - Not detected at the reporting limit.
R - RPD exceeds advisory limit.
Page 15 of 38

Project: Barker Hughsville Pilot
Client: CDM Federal Programs
Work Order: H13080347
QA/QC Summary Report
08/30/13Report Date:
Analyte Result %REC RPDLow Limit High Limit RPDLimitRLUnits Qual
Revised Date: 08/30/13Prepared by Helena, MT Branch
Method: A2540 C Batch: TDS130820A
Sample ID: MB-1_130820A 08/20/13 13:54Method Blank Run: ACCU-124 (14410200)_130820
Solids, Total Dissolved TDS @ 180 C 1ND mg/L
Sample ID: LCS-2_130820A 08/20/13 13:54Laboratory Control Sample Run: ACCU-124 (14410200)_130820
Solids, Total Dissolved TDS @ 180 C 93 90 110101870 mg/L
Sample ID: H13080344-001A DUP 08/20/13 13:55Sample Duplicate Run: ACCU-124 (14410200)_130820
Solids, Total Dissolved TDS @ 180 C 510 4.4117 mg/L
Sample ID: H13080346-001B MS 08/20/13 13:55Sample Matrix Spike Run: ACCU-124 (14410200)_130820
Solids, Total Dissolved TDS @ 180 C 95 80 120102420 mg/L
Sample ID: H13080347-010A DUP 08/20/13 13:57Sample Duplicate Run: ACCU-124 (14410200)_130820
Solids, Total Dissolved TDS @ 180 C 510 0.31490 mg/L
Qualifiers:
RL - Analyte reporting limit. ND - Not detected at the reporting limit.
Page 16 of 38

Project: Barker Hughsville Pilot
Client: CDM Federal Programs
Work Order: H13080347
QA/QC Summary Report
08/30/13Report Date:
Analyte Result %REC RPDLow Limit High Limit RPDLimitRLUnits Qual
Revised Date: 08/30/13Prepared by Helena, MT Branch
Method: A4500-F C Analytical Run: PH_130823A
Sample ID: ICV1_130823A 08/23/13 11:24Initial Calibration Verification Standard
Fluoride 93 90 1100.10.7 mg/L
Sample ID: CCV2_130823A 08/23/13 11:40Continuing Calibration Verification Standard
Fluoride 94 90 1100.10.2 mg/L
Method: A4500-F C Batch: 130823A-F-ISE-W
Sample ID: MBLK1_130823A 08/23/13 11:23Method Blank Run: PH_130823A
Fluoride 0.0050.01 mg/L
Sample ID: LFB1_130823A 08/23/13 11:25Laboratory Fortified Blank Run: PH_130823A
Fluoride 93 90 1100.10.5 mg/L
Sample ID: H13070399-005AMS 08/23/13 11:26Sample Matrix Spike Run: PH_130823A
Fluoride 86 85 1150.21.8 mg/L
Sample ID: H13070399-005AMSD 08/23/13 11:27Sample Matrix Spike Duplicate Run: PH_130823A
Fluoride 87 85 115 100.2 0.41.8 mg/L
Sample ID: H13080347-007AMS 08/23/13 11:42Sample Matrix Spike Run: PH_130823A
Fluoride 84 85 1150.10.6 mg/L S
Sample ID: H13080347-007AMSD 08/23/13 11:42Sample Matrix Spike Duplicate Run: PH_130823A
Fluoride 85 85 115 100.1 0.30.6 mg/L
Qualifiers:
RL - Analyte reporting limit. ND - Not detected at the reporting limit.
S - Spike recovery outside of advisory limits.
Page 17 of 38

Project: Barker Hughsville Pilot
Client: CDM Federal Programs
Work Order: H13080347
QA/QC Summary Report
08/30/13Report Date:
Analyte Result %REC RPDLow Limit High Limit RPDLimitRLUnits Qual
Revised Date: 08/30/13Prepared by Helena, MT Branch
Method: A4500-S D Batch: B_R210507
Sample ID: MB-R210507 08/22/13 15:00Method Blank Run: SUB-B210507
Sulfide 0.002ND mg/L
Sample ID: LCS-R210507 08/22/13 15:00Laboratory Control Sample Run: SUB-B210507
Sulfide 114 70 1300.0400.281 mg/L
Sample ID: B13081719-001BMS 08/22/13 15:00Sample Matrix Spike Run: SUB-B210507
Sulfide 42 70 1300.0400.115 mg/L S
- Matrix spike recoveries outside the acceptance range are considered matrix-related.
Sample ID: B13081719-001BMSD 08/22/13 15:00Sample Matrix Spike Duplicate Run: SUB-B210507
Sulfide 49 70 130 200.040 120.130 mg/L S
- Matrix spike recoveries outside the acceptance range are considered matrix-related.
Sample ID: B13081949-001DMS 08/22/13 15:00Sample Matrix Spike Run: SUB-B210507
Sulfide 107 70 1300.0400.287 mg/L
Sample ID: B13081949-001DMSD 08/22/13 15:00Sample Matrix Spike Duplicate Run: SUB-B210507
Sulfide 110 70 130 200.040 2.60.295 mg/L
Qualifiers:
RL - Analyte reporting limit. ND - Not detected at the reporting limit.
S - Spike recovery outside of advisory limits.
Page 18 of 38

Project: Barker Hughsville Pilot
Client: CDM Federal Programs
Work Order: H13080347
QA/QC Summary Report
08/30/13Report Date:
Analyte Result %REC RPDLow Limit High Limit RPDLimitRLUnits Qual
Revised Date: 08/30/13Prepared by Helena, MT Branch
Method: A4500-S F Batch: B_R210506
Sample ID: MB-R210506 08/22/13 14:45Method Blank Run: SUB-B210506
Sulfide 0.5ND mg/L
Sample ID: LCS-R210506 08/22/13 14:45Laboratory Control Sample Run: SUB-B210506
Sulfide 100 70 1301.024.6 mg/L
Sample ID: H13080347-007C 08/22/13 14:45Sample Matrix Spike Run: SUB-B210506
Sulfide 110 80 1201.0117 mg/L
Sample ID: H13080347-007C 08/22/13 14:45Sample Matrix Spike Duplicate Run: SUB-B210506
Sulfide 113 80 120 201.0 1.2118 mg/L
Qualifiers:
RL - Analyte reporting limit. ND - Not detected at the reporting limit.
Page 19 of 38
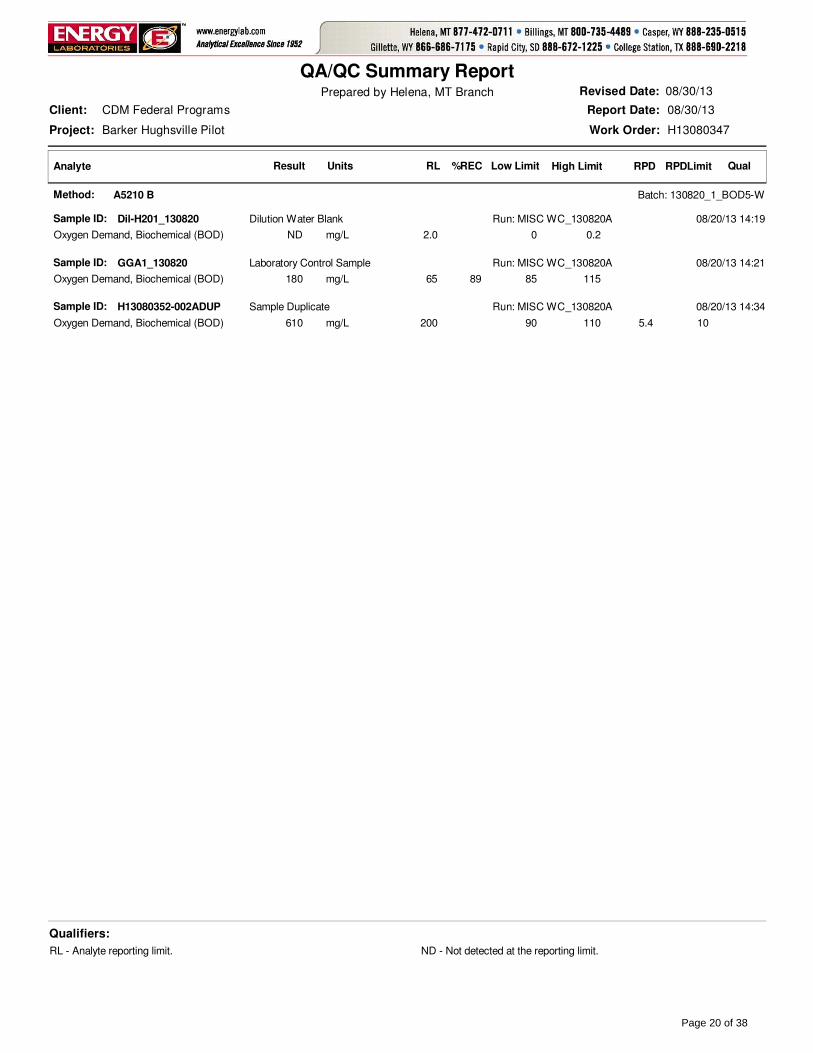
Project: Barker Hughsville Pilot
Client: CDM Federal Programs
Work Order: H13080347
QA/QC Summary Report
08/30/13Report Date:
Analyte Result %REC RPDLow Limit High Limit RPDLimitRLUnits Qual
Revised Date: 08/30/13Prepared by Helena, MT Branch
Method: A5210 B Batch: 130820_1_BOD5-W
Sample ID: Dil-H201_130820 08/20/13 14:19Dilution Water Blank Run: MISC WC_130820A
Oxygen Demand, Biochemical (BOD) 0 0.22.0ND mg/L
Sample ID: GGA1_130820 08/20/13 14:21Laboratory Control Sample Run: MISC WC_130820A
Oxygen Demand, Biochemical (BOD) 89 85 11565180 mg/L
Sample ID: H13080352-002ADUP 08/20/13 14:34Sample Duplicate Run: MISC WC_130820A
Oxygen Demand, Biochemical (BOD) 90 110 10200 5.4610 mg/L
Qualifiers:
RL - Analyte reporting limit. ND - Not detected at the reporting limit.
Page 20 of 38
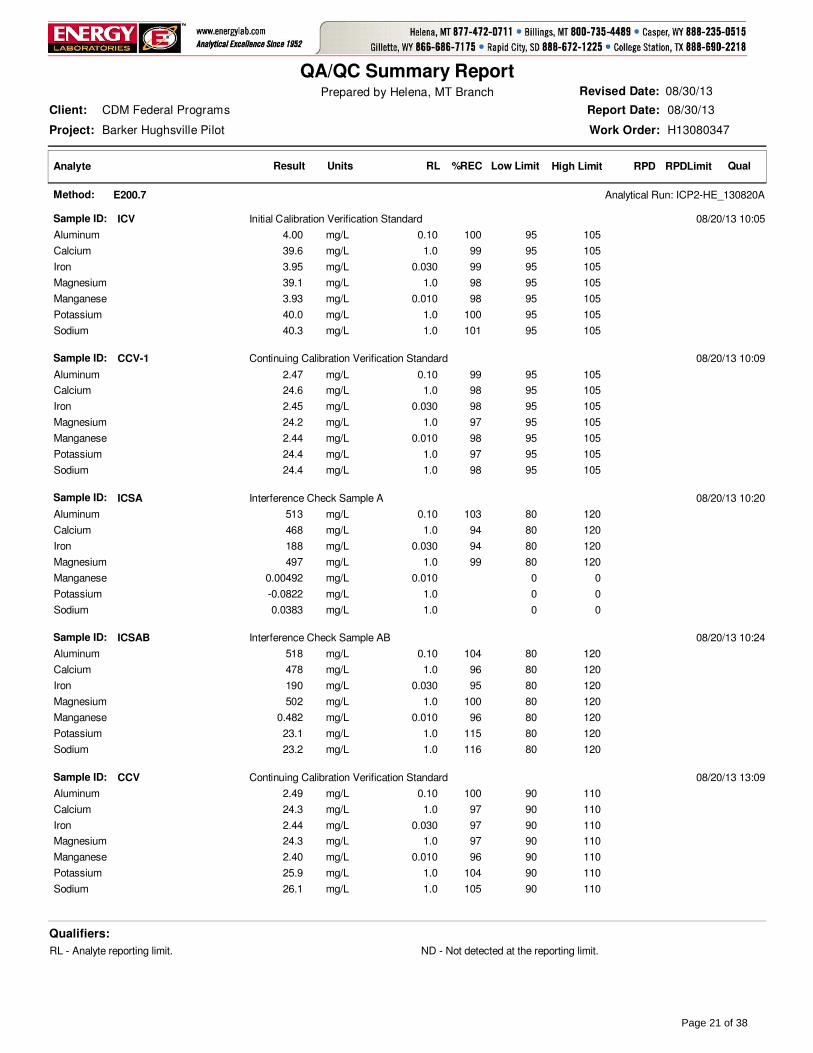
Project: Barker Hughsville Pilot
Client: CDM Federal Programs
Work Order: H13080347
QA/QC Summary Report
08/30/13Report Date:
Analyte Result %REC RPDLow Limit High Limit RPDLimitRLUnits Qual
Revised Date: 08/30/13Prepared by Helena, MT Branch
Method: E200.7 Analytical Run: ICP2-HE_130820A
Sample ID: ICV 08/20/13 10:05Initial Calibration Verification Standard
Aluminum 100 95 1050.104.00 mg/L
Calcium 99 95 1051.039.6 mg/L
Iron 99 95 1050.0303.95 mg/L
Magnesium 98 95 1051.039.1 mg/L
Manganese 98 95 1050.0103.93 mg/L
Potassium 100 95 1051.040.0 mg/L
Sodium 101 95 1051.040.3 mg/L
Sample ID: CCV-1 08/20/13 10:09Continuing Calibration Verification Standard
Aluminum 99 95 1050.102.47 mg/L
Calcium 98 95 1051.024.6 mg/L
Iron 98 95 1050.0302.45 mg/L
Magnesium 97 95 1051.024.2 mg/L
Manganese 98 95 1050.0102.44 mg/L
Potassium 97 95 1051.024.4 mg/L
Sodium 98 95 1051.024.4 mg/L
Sample ID: ICSA 08/20/13 10:20Interference Check Sample A
Aluminum 103 80 1200.10513 mg/L
Calcium 94 80 1201.0468 mg/L
Iron 94 80 1200.030188 mg/L
Magnesium 99 80 1201.0497 mg/L
Manganese 0 00.0100.00492 mg/L
Potassium 0 01.0-0.0822 mg/L
Sodium 0 01.00.0383 mg/L
Sample ID: ICSAB 08/20/13 10:24Interference Check Sample AB
Aluminum 104 80 1200.10518 mg/L
Calcium 96 80 1201.0478 mg/L
Iron 95 80 1200.030190 mg/L
Magnesium 100 80 1201.0502 mg/L
Manganese 96 80 1200.0100.482 mg/L
Potassium 115 80 1201.023.1 mg/L
Sodium 116 80 1201.023.2 mg/L
Sample ID: CCV 08/20/13 13:09Continuing Calibration Verification Standard
Aluminum 100 90 1100.102.49 mg/L
Calcium 97 90 1101.024.3 mg/L
Iron 97 90 1100.0302.44 mg/L
Magnesium 97 90 1101.024.3 mg/L
Manganese 96 90 1100.0102.40 mg/L
Potassium 104 90 1101.025.9 mg/L
Sodium 105 90 1101.026.1 mg/L
Qualifiers:
RL - Analyte reporting limit. ND - Not detected at the reporting limit.
Page 21 of 38
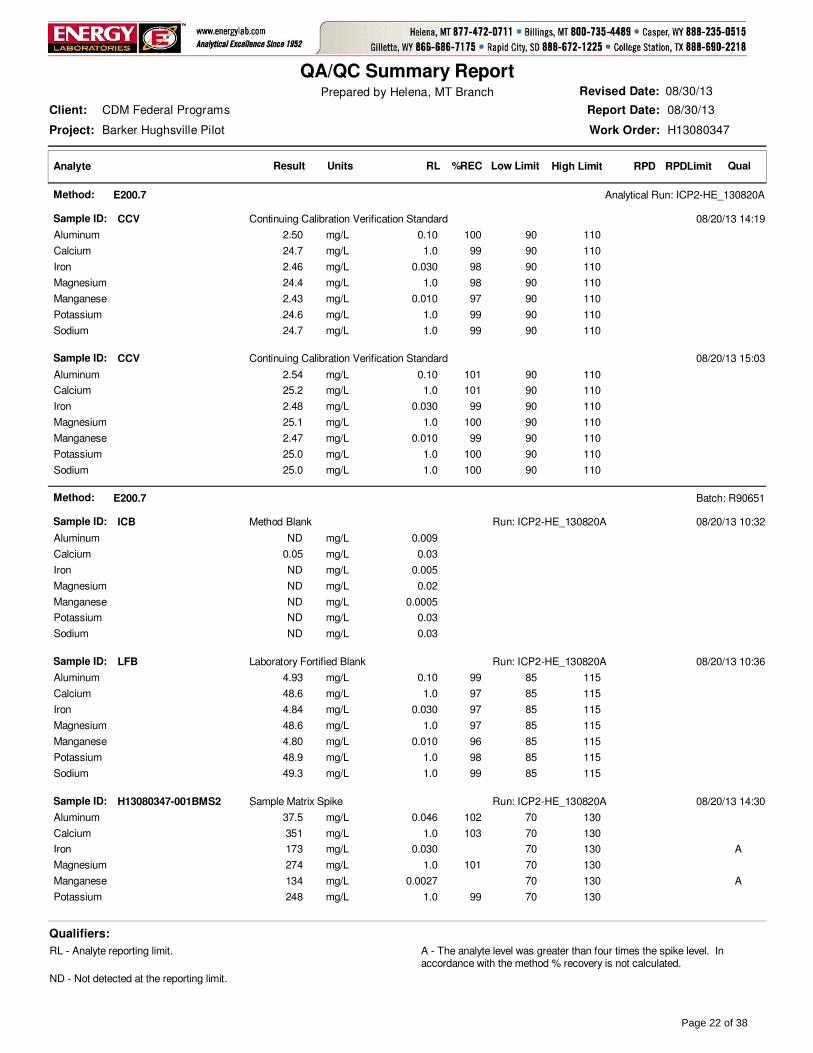
Project: Barker Hughsville Pilot
Client: CDM Federal Programs
Work Order: H13080347
QA/QC Summary Report
08/30/13Report Date:
Analyte Result %REC RPDLow Limit High Limit RPDLimitRLUnits Qual
Revised Date: 08/30/13Prepared by Helena, MT Branch
Method: E200.7 Analytical Run: ICP2-HE_130820A
Sample ID: CCV 08/20/13 14:19Continuing Calibration Verification Standard
Aluminum 100 90 1100.102.50 mg/L
Calcium 99 90 1101.024.7 mg/L
Iron 98 90 1100.0302.46 mg/L
Magnesium 98 90 1101.024.4 mg/L
Manganese 97 90 1100.0102.43 mg/L
Potassium 99 90 1101.024.6 mg/L
Sodium 99 90 1101.024.7 mg/L
Sample ID: CCV 08/20/13 15:03Continuing Calibration Verification Standard
Aluminum 101 90 1100.102.54 mg/L
Calcium 101 90 1101.025.2 mg/L
Iron 99 90 1100.0302.48 mg/L
Magnesium 100 90 1101.025.1 mg/L
Manganese 99 90 1100.0102.47 mg/L
Potassium 100 90 1101.025.0 mg/L
Sodium 100 90 1101.025.0 mg/L
Method: E200.7 Batch: R90651
Sample ID: ICB 08/20/13 10:32Method Blank Run: ICP2-HE_130820A
Aluminum 0.009ND mg/L
Calcium 0.030.05 mg/L
Iron 0.005ND mg/L
Magnesium 0.02ND mg/L
Manganese 0.0005ND mg/L
Potassium 0.03ND mg/L
Sodium 0.03ND mg/L
Sample ID: LFB 08/20/13 10:36Laboratory Fortified Blank Run: ICP2-HE_130820A
Aluminum 99 85 1150.104.93 mg/L
Calcium 97 85 1151.048.6 mg/L
Iron 97 85 1150.0304.84 mg/L
Magnesium 97 85 1151.048.6 mg/L
Manganese 96 85 1150.0104.80 mg/L
Potassium 98 85 1151.048.9 mg/L
Sodium 99 85 1151.049.3 mg/L
Sample ID: H13080347-001BMS2 08/20/13 14:30Sample Matrix Spike Run: ICP2-HE_130820A
Aluminum 102 70 1300.04637.5 mg/L
Calcium 103 70 1301.0351 mg/L
Iron 70 1300.030173 mg/L A
Magnesium 101 70 1301.0274 mg/L
Manganese 70 1300.0027134 mg/L A
Potassium 99 70 1301.0248 mg/L
Qualifiers:
RL - Analyte reporting limit. A - The analyte level was greater than four times the spike level. In accordance with the method % recovery is not calculated.
ND - Not detected at the reporting limit.
Page 22 of 38

Project: Barker Hughsville Pilot
Client: CDM Federal Programs
Work Order: H13080347
QA/QC Summary Report
08/30/13Report Date:
Analyte Result %REC RPDLow Limit High Limit RPDLimitRLUnits Qual
Revised Date: 08/30/13Prepared by Helena, MT Branch
Method: E200.7 Batch: R90651
Sample ID: H13080347-001BMS2 08/20/13 14:30Sample Matrix Spike Run: ICP2-HE_130820A
Sodium 99 70 1301.0256 mg/L
Sample ID: H13080347-001BMSD2 08/20/13 14:34Sample Matrix Spike Duplicate Run: ICP2-HE_130820A
Aluminum 102 70 130 200.046 0.037.5 mg/L
Calcium 102 70 130 201.0 0.2351 mg/L
Iron 70 130 200.030 0.2173 mg/L A
Magnesium 101 70 130 201.0 0.4273 mg/L
Manganese 70 130 200.0027 0.3134 mg/L A
Potassium 99 70 130 201.0 0.4249 mg/L
Sodium 100 70 130 201.0 0.5257 mg/L
Sample ID: H13080347-010BMS2 08/20/13 15:18Sample Matrix Spike Run: ICP2-HE_130820A
Aluminum 102 70 1300.04625.5 mg/L
Calcium 99 70 1301.0415 mg/L
Iron 98 70 1300.03038.4 mg/L
Magnesium 99 70 1301.0369 mg/L
Manganese 91 70 1300.0027121 mg/L
Potassium 100 70 1301.0252 mg/L
Sodium 101 70 1301.0260 mg/L
Sample ID: H13080347-010BMSD2 08/20/13 15:22Sample Matrix Spike Duplicate Run: ICP2-HE_130820A
Aluminum 102 70 130 200.046 0.125.5 mg/L
Calcium 99 70 130 201.0 0.1415 mg/L
Iron 98 70 130 200.030 0.438.6 mg/L
Magnesium 99 70 130 201.0 0.0369 mg/L
Manganese 92 70 130 200.0027 0.2121 mg/L
Potassium 99 70 130 201.0 1.5248 mg/L
Sodium 99 70 130 201.0 1.4256 mg/L
Qualifiers:
RL - Analyte reporting limit. A - The analyte level was greater than four times the spike level. In accordance with the method % recovery is not calculated.
ND - Not detected at the reporting limit.
Page 23 of 38

Project: Barker Hughsville Pilot
Client: CDM Federal Programs
Work Order: H13080347
QA/QC Summary Report
08/30/13Report Date:
Analyte Result %REC RPDLow Limit High Limit RPDLimitRLUnits Qual
Revised Date: 08/30/13Prepared by Helena, MT Branch
Method: E200.7 Analytical Run: ICP2-HE_130821C
Sample ID: ICV 08/21/13 14:33Initial Calibration Verification Standard
Zinc 101 95 1050.0100.811 mg/L
Sample ID: CCV-1 08/21/13 14:36Continuing Calibration Verification Standard
Zinc 104 95 1050.0102.61 mg/L
Sample ID: ICSA 08/21/13 14:47Interference Check Sample A
Zinc 0 00.0100.00768 mg/L
Sample ID: ICSAB 08/21/13 14:51Interference Check Sample AB
Zinc 101 80 1200.0101.01 mg/L
Sample ID: CCV 08/21/13 15:20Continuing Calibration Verification Standard
Zinc 102 90 1100.0102.54 mg/L
Method: E200.7 Batch: R90691
Sample ID: ICB 08/21/13 14:59Method Blank Run: ICP2-HE_130821C
Zinc 0.0010.003 mg/L
Sample ID: LFB 08/21/13 15:03Laboratory Fortified Blank Run: ICP2-HE_130821C
Zinc 99 85 1150.0100.993 mg/L
Sample ID: H13080347-001BMS2 08/21/13 15:14Sample Matrix Spike Run: ICP2-HE_130821C
Zinc 70 1300.01055.4 mg/L A
Sample ID: H13080347-001BMSD2 08/21/13 15:17Sample Matrix Spike Duplicate Run: ICP2-HE_130821C
Zinc 70 130 200.010 5.352.6 mg/L A
Qualifiers:
RL - Analyte reporting limit. A - The analyte level was greater than four times the spike level. In accordance with the method % recovery is not calculated.
ND - Not detected at the reporting limit.
Page 24 of 38

Project: Barker Hughsville Pilot
Client: CDM Federal Programs
Work Order: H13080347
QA/QC Summary Report
08/30/13Report Date:
Analyte Result %REC RPDLow Limit High Limit RPDLimitRLUnits Qual
Revised Date: 08/30/13Prepared by Helena, MT Branch
Method: E200.8 Analytical Run: ICPMS204-B_130820A
Sample ID: ICV STD 08/20/13 14:49Initial Calibration Verification Standard
Aluminum 95 90 1100.100.286 mg/L
Arsenic 97 90 1100.00500.0580 mg/L
Barium 97 90 1100.100.0583 mg/L
Beryllium 103 90 1100.00100.0308 mg/L
Cadmium 105 90 1100.00100.0314 mg/L
Chromium 97 90 1100.0100.0585 mg/L
Cobalt 108 90 1100.0100.0648 mg/L
Copper 98 90 1100.0100.0590 mg/L
Iron 100 90 1100.0300.300 mg/L
Lead 101 90 1100.0100.0608 mg/L
Nickel 98 90 1100.0100.0585 mg/L
Silver 98 90 1100.00500.0294 mg/L
Thallium 97 90 1100.100.0583 mg/L
Zinc 100 90 1100.0100.0599 mg/L
Sample ID: ICSA 08/20/13 14:54Interference Check Sample A
Aluminum 91 70 1300.1036.2 mg/L
Arsenic 0.00500.000258 mg/L
Barium 0.103.20E-05 mg/L
Beryllium 0.00106.00E-06 mg/L
Cadmium 0.00100.00122 mg/L
Chromium 0.0100.00108 mg/L
Cobalt 0.0100.000324 mg/L
Copper 0.0100.000555 mg/L
Iron 91 70 1300.03090.5 mg/L
Lead 0.0100.000186 mg/L
Nickel 0.0100.000627 mg/L
Silver 0.00507.70E-05 mg/L
Thallium 0.100.000106 mg/L
Zinc 0.0100.000983 mg/L
Sample ID: ICSAB 08/20/13 14:58Interference Check Sample AB
Aluminum 91 70 1300.1036.5 mg/L
Arsenic 96 70 1300.00500.00963 mg/L
Barium 0 00.103.00E-05 mg/L
Beryllium 0 00.0010ND mg/L
Cadmium 103 70 1300.00100.0103 mg/L
Chromium 104 70 1300.0100.0208 mg/L
Cobalt 101 70 1300.0100.0202 mg/L
Copper 97 70 1300.0100.0193 mg/L
Iron 95 70 1300.03094.9 mg/L
Lead 0 00.0100.000154 mg/L
Nickel 99 70 1300.0100.0198 mg/L
Qualifiers:
RL - Analyte reporting limit. ND - Not detected at the reporting limit.
Page 25 of 38

Project: Barker Hughsville Pilot
Client: CDM Federal Programs
Work Order: H13080347
QA/QC Summary Report
08/30/13Report Date:
Analyte Result %REC RPDLow Limit High Limit RPDLimitRLUnits Qual
Revised Date: 08/30/13Prepared by Helena, MT Branch
Method: E200.8 Analytical Run: ICPMS204-B_130820A
Sample ID: ICSAB 08/20/13 14:58Interference Check Sample AB
Silver 93 70 1300.00500.0186 mg/L
Thallium 0 00.105.50E-05 mg/L
Zinc 102 70 1300.0100.0102 mg/L
Sample ID: ICV STD 08/21/13 04:48Initial Calibration Verification Standard
Aluminum 97 90 1100.100.291 mg/L
Arsenic 102 90 1100.00500.0610 mg/L
Barium 101 90 1100.100.0603 mg/L
Beryllium 101 90 1100.00100.0304 mg/L
Cadmium 107 90 1100.00100.0322 mg/L
Chromium 101 90 1100.0100.0608 mg/L
Cobalt 109 90 1100.0100.0657 mg/L
Copper 103 90 1100.0100.0620 mg/L
Iron 106 90 1100.0300.319 mg/L
Lead 102 90 1100.0100.0614 mg/L
Nickel 104 90 1100.0100.0621 mg/L
Silver 100 90 1100.00500.0299 mg/L
Thallium 97 90 1100.100.0584 mg/L
Zinc 106 90 1100.0100.0634 mg/L
Sample ID: ICSA 08/21/13 04:52Interference Check Sample A
Aluminum 90 70 1300.1036.0 mg/L
Arsenic 0.00500.000202 mg/L
Barium 0.107.20E-05 mg/L
Beryllium 0.00107.00E-06 mg/L
Cadmium 0.00100.00118 mg/L
Chromium 0.0100.00107 mg/L
Cobalt 0.0100.000319 mg/L
Copper 0.0100.000517 mg/L
Iron 89 70 1300.03089.0 mg/L
Lead 0.0100.000182 mg/L
Nickel 0.0100.000615 mg/L
Silver 0.00500.000107 mg/L
Thallium 0.100.000134 mg/L
Zinc 0.0100.00113 mg/L
Sample ID: ICSAB 08/21/13 04:57Interference Check Sample AB
Aluminum 90 70 1300.1036.1 mg/L
Arsenic 99 70 1300.00500.00995 mg/L
Barium 0 00.105.40E-05 mg/L
Beryllium 0 00.00105.00E-06 mg/L
Cadmium 103 70 1300.00100.0103 mg/L
Chromium 103 70 1300.0100.0206 mg/L
Cobalt 103 70 1300.0100.0206 mg/L
Qualifiers:
RL - Analyte reporting limit. ND - Not detected at the reporting limit.
Page 26 of 38

Project: Barker Hughsville Pilot
Client: CDM Federal Programs
Work Order: H13080347
QA/QC Summary Report
08/30/13Report Date:
Analyte Result %REC RPDLow Limit High Limit RPDLimitRLUnits Qual
Revised Date: 08/30/13Prepared by Helena, MT Branch
Method: E200.8 Analytical Run: ICPMS204-B_130820A
Sample ID: ICSAB 08/21/13 04:57Interference Check Sample AB
Copper 97 70 1300.0100.0194 mg/L
Iron 91 70 1300.03091.1 mg/L
Lead 0 00.0100.000142 mg/L
Nickel 100 70 1300.0100.0201 mg/L
Silver 94 70 1300.00500.0188 mg/L
Thallium 0 00.108.50E-05 mg/L
Zinc 107 70 1300.0100.0107 mg/L
Sample ID: ICV STD 08/22/13 03:10Initial Calibration Verification Standard
Aluminum 96 90 1100.100.289 mg/L
Arsenic 97 90 1100.00500.0582 mg/L
Barium 97 90 1100.100.0584 mg/L
Beryllium 99 90 1100.00100.0297 mg/L
Cadmium 104 90 1100.00100.0313 mg/L
Chromium 98 90 1100.0100.0586 mg/L
Cobalt 104 90 1100.0100.0622 mg/L
Copper 100 90 1100.0100.0597 mg/L
Iron 104 90 1100.0300.312 mg/L
Lead 99 90 1100.0100.0594 mg/L
Nickel 99 90 1100.0100.0597 mg/L
Silver 98 90 1100.00500.0295 mg/L
Thallium 98 90 1100.100.0588 mg/L
Zinc 102 90 1100.0100.0612 mg/L
Sample ID: ICSA 08/22/13 03:15Interference Check Sample A
Aluminum 90 70 1300.1035.8 mg/L
Arsenic 0.00500.000184 mg/L
Barium 0.100.000137 mg/L
Beryllium 0.00101.30E-05 mg/L
Cadmium 0.00100.00114 mg/L
Chromium 0.0100.00114 mg/L
Cobalt 0.0100.000303 mg/L
Copper 0.0100.000559 mg/L
Iron 92 70 1300.03092.5 mg/L
Lead 0.0100.000172 mg/L
Nickel 0.0100.000663 mg/L
Silver 0.00500.000191 mg/L
Thallium 0.100.000145 mg/L
Zinc 0.0100.000957 mg/L
Sample ID: ICSAB 08/22/13 03:19Interference Check Sample AB
Aluminum 89 70 1300.1035.6 mg/L
Arsenic 103 70 1300.00500.0103 mg/L
Barium 0 00.100.000158 mg/L
Qualifiers:
RL - Analyte reporting limit. ND - Not detected at the reporting limit.
Page 27 of 38

Project: Barker Hughsville Pilot
Client: CDM Federal Programs
Work Order: H13080347
QA/QC Summary Report
08/30/13Report Date:
Analyte Result %REC RPDLow Limit High Limit RPDLimitRLUnits Qual
Revised Date: 08/30/13Prepared by Helena, MT Branch
Method: E200.8 Analytical Run: ICPMS204-B_130820A
Sample ID: ICSAB 08/22/13 03:19Interference Check Sample AB
Beryllium 0 00.00106.00E-06 mg/L
Cadmium 102 70 1300.00100.0102 mg/L
Chromium 107 70 1300.0100.0213 mg/L
Cobalt 98 70 1300.0100.0197 mg/L
Copper 101 70 1300.0100.0202 mg/L
Iron 94 70 1300.03093.6 mg/L
Lead 0 00.0100.000139 mg/L
Nickel 106 70 1300.0100.0212 mg/L
Silver 86 70 1300.00500.0172 mg/L
Thallium 0 00.109.50E-05 mg/L
Zinc 114 70 1300.0100.0114 mg/L
Method: E200.8 Batch: R90656
Sample ID: ICB 08/20/13 15:52Method Blank Run: ICPMS204-B_130820A
Aluminum 0.00010.0005 mg/L
Arsenic 7E-05ND mg/L
Barium 5E-05ND mg/L
Beryllium 2E-05ND mg/L
Cadmium 7E-06ND mg/L
Chromium 4E-05ND mg/L
Cobalt 2E-05ND mg/L
Copper 3E-05ND mg/L
Iron 0.00020.0005 mg/L
Lead 6E-06ND mg/L
Nickel 6E-05ND mg/L
Silver 4E-05ND mg/L
Thallium 1E-05ND mg/L
Zinc 0.00030.0006 mg/L
Sample ID: LFB 08/20/13 15:57Laboratory Fortified Blank Run: ICPMS204-B_130820A
Aluminum 100 85 1150.100.0502 mg/L
Arsenic 95 85 1150.00500.0476 mg/L
Barium 96 85 1150.100.0481 mg/L
Beryllium 95 85 1150.00100.0477 mg/L
Cadmium 100 85 1150.00100.0499 mg/L
Chromium 96 85 1150.0100.0479 mg/L
Cobalt 103 85 1150.0100.0515 mg/L
Copper 96 85 1150.0100.0481 mg/L
Iron 109 85 1150.0300.164 mg/L
Lead 100 85 1150.0100.0498 mg/L
Nickel 98 85 1150.0100.0490 mg/L
Silver 95 85 1150.00500.0191 mg/L
Thallium 97 85 1150.100.0482 mg/L
Qualifiers:
RL - Analyte reporting limit. ND - Not detected at the reporting limit.
Page 28 of 38

Project: Barker Hughsville Pilot
Client: CDM Federal Programs
Work Order: H13080347
QA/QC Summary Report
08/30/13Report Date:
Analyte Result %REC RPDLow Limit High Limit RPDLimitRLUnits Qual
Revised Date: 08/30/13Prepared by Helena, MT Branch
Method: E200.8 Batch: R90656
Sample ID: LFB 08/20/13 15:57Laboratory Fortified Blank Run: ICPMS204-B_130820A
Zinc 102 85 1150.0100.0518 mg/L
Sample ID: H13080347-001BMS 08/21/13 10:37Sample Matrix Spike Run: ICPMS204-B_130820A
Aluminum 70 1300.0309.75 mg/L A
Arsenic 91 70 1300.00100.213 mg/L
Barium 90 70 1300.0500.0489 mg/L
Beryllium 84 70 1300.00100.0481 mg/L
Chromium 94 70 1300.00500.0511 mg/L
Cobalt 96 70 1300.00500.0894 mg/L
Copper 70 1300.00501.31 mg/L A
Iron 70 1300.030132 mg/L A
Lead 79 70 1300.00100.191 mg/L
Nickel 96 70 1300.00500.0772 mg/L
Silver 81 70 1300.00100.0162 mg/L
Thallium 102 70 1300.000500.0530 mg/L
Zinc 70 1300.01047.7 mg/L A
Sample ID: H13080347-001BMSD 08/21/13 10:41Sample Matrix Spike Duplicate Run: ICPMS204-B_130820A
Aluminum 70 130 200.030 3.69.41 mg/L A
Arsenic 93 70 130 200.0010 0.60.215 mg/L
Barium 94 70 130 200.0500.0511 mg/L
Beryllium 79 70 130 200.0010 5.60.0454 mg/L
Chromium 94 70 130 200.0050 0.30.0512 mg/L
Cobalt 90 70 130 200.0050 3.10.0867 mg/L
Copper 70 130 200.0050 0.81.30 mg/L A
Iron 70 130 200.030 0.3133 mg/L A
Lead 77 70 130 200.0010 0.50.190 mg/L
Nickel 96 70 130 200.0050 0.00.0772 mg/L
Silver 84 70 130 200.0010 3.40.0168 mg/L
Thallium 103 70 130 200.00050 0.70.0533 mg/L
Zinc 70 130 200.010 0.547.9 mg/L A
Sample ID: H13080347-001BMS 08/22/13 11:59Sample Matrix Spike Run: ICPMS204-B_130820A
Aluminum 70 1300.03011.2 mg/L A
Arsenic 92 70 1300.00100.620 mg/L
Barium 91 70 1300.0500.462 mg/L
Beryllium 91 70 1300.00100.462 mg/L
Cadmium 95 70 1300.00100.704 mg/L
Chromium 90 70 1300.00500.455 mg/L
Cobalt 97 70 1300.00500.525 mg/L
Copper 95 70 1300.00501.78 mg/L
Iron 70 1300.030140 mg/L A
Lead 95 70 1300.00100.622 mg/L
Nickel 92 70 1300.00500.487 mg/L
Qualifiers:
RL - Analyte reporting limit. A - The analyte level was greater than four times the spike level. In accordance with the method % recovery is not calculated.
ND - Not detected at the reporting limit.
Page 29 of 38

Project: Barker Hughsville Pilot
Client: CDM Federal Programs
Work Order: H13080347
QA/QC Summary Report
08/30/13Report Date:
Analyte Result %REC RPDLow Limit High Limit RPDLimitRLUnits Qual
Revised Date: 08/30/13Prepared by Helena, MT Branch
Method: E200.8 Batch: R90656
Sample ID: H13080347-001BMS 08/22/13 11:59Sample Matrix Spike Run: ICPMS204-B_130820A
Silver 87 70 1300.00100.175 mg/L
Thallium 94 70 1300.000500.471 mg/L
Zinc 70 1300.01050.2 mg/L A
Sample ID: H13080347-001BMSD 08/22/13 12:03Sample Matrix Spike Duplicate Run: ICPMS204-B_130820A
Aluminum 70 130 200.030 0.311.1 mg/L A
Arsenic 91 70 130 200.0010 1.30.612 mg/L
Barium 94 70 130 200.050 2.90.475 mg/L
Beryllium 92 70 130 200.0010 1.10.468 mg/L
Cadmium 96 70 130 200.0010 0.60.708 mg/L
Chromium 90 70 130 200.0050 0.30.454 mg/L
Cobalt 98 70 130 200.0050 1.30.532 mg/L
Copper 91 70 130 200.0050 1.01.76 mg/L
Iron 70 130 200.030 0.9139 mg/L A
Lead 95 70 130 200.0010 0.40.624 mg/L
Nickel 91 70 130 200.0050 0.50.485 mg/L
Silver 91 70 130 200.0010 4.10.182 mg/L
Thallium 94 70 130 200.00050 0.50.473 mg/L
Zinc 70 130 200.010 0.550.0 mg/L A
Qualifiers:
RL - Analyte reporting limit. A - The analyte level was greater than four times the spike level. In accordance with the method % recovery is not calculated.
ND - Not detected at the reporting limit.
Page 30 of 38

Project: Barker Hughsville Pilot
Client: CDM Federal Programs
Work Order: H13080347
QA/QC Summary Report
08/30/13Report Date:
Analyte Result %REC RPDLow Limit High Limit RPDLimitRLUnits Qual
Revised Date: 08/30/13Prepared by Helena, MT Branch
Method: E200.8 Analytical Run: ICPMS204-B_130823A
Sample ID: ICV STD 08/23/13 14:37Initial Calibration Verification Standard
Lead 103 90 1100.0100.0619 mg/L
Silver 97 90 1100.00500.0291 mg/L
Sample ID: ICSA 08/23/13 14:42Interference Check Sample A
Lead 0.0100.000192 mg/L
Silver 0.00500.000194 mg/L
Sample ID: ICSAB 08/23/13 14:46Interference Check Sample AB
Lead 0 00.0100.000154 mg/L
Silver 92 70 1300.00500.0183 mg/L
Sample ID: ICV STD 08/24/13 03:12Initial Calibration Verification Standard
Lead 96 90 1100.0100.0575 mg/L
Silver 94 90 1100.00500.0282 mg/L
Sample ID: ICSA 08/24/13 03:17Interference Check Sample A
Lead 0.0100.000177 mg/L
Silver 0.00500.000189 mg/L
Sample ID: ICSAB 08/24/13 03:22Interference Check Sample AB
Lead 0 00.0100.000149 mg/L
Silver 89 70 1300.00500.0178 mg/L
Sample ID: ICV STD 08/24/13 13:32Initial Calibration Verification Standard
Lead 104 90 1100.0100.0625 mg/L
Silver 98 90 1100.00500.0294 mg/L
Sample ID: ICSA 08/24/13 13:36Interference Check Sample A
Lead 0.0100.000173 mg/L
Silver 0.00500.000199 mg/L
Sample ID: ICSAB 08/24/13 13:41Interference Check Sample AB
Lead 0 00.0100.000163 mg/L
Silver 92 70 1300.00500.0184 mg/L
Method: E200.8 Batch: R90752
Sample ID: ICB 08/23/13 15:16Method Blank Run: ICPMS204-B_130823A
Lead 6E-067E-06 mg/L
Silver 4E-059E-05 mg/L
Sample ID: LFB 08/23/13 15:21Laboratory Fortified Blank Run: ICPMS204-B_130823A
Lead 101 85 1150.0100.0507 mg/L
Silver 92 85 1150.00500.0186 mg/L
Qualifiers:
RL - Analyte reporting limit. ND - Not detected at the reporting limit.
Page 31 of 38

Project: Barker Hughsville Pilot
Client: CDM Federal Programs
Work Order: H13080347
QA/QC Summary Report
08/30/13Report Date:
Analyte Result %REC RPDLow Limit High Limit RPDLimitRLUnits Qual
Revised Date: 08/30/13Prepared by Helena, MT Branch
Method: E200.8 Batch: R90752
Sample ID: H13080414-002BMS 08/24/13 09:06Sample Matrix Spike Run: ICPMS204-B_130823A
Lead 103 70 1300.00100.117 mg/L
Silver 79 70 1300.00100.0318 mg/L
Sample ID: H13080414-002BMSD 08/24/13 09:11Sample Matrix Spike Duplicate Run: ICPMS204-B_130823A
Lead 104 70 130 200.0010 0.50.117 mg/L
Silver 81 70 130 200.0010 1.40.0322 mg/L
Qualifiers:
RL - Analyte reporting limit. ND - Not detected at the reporting limit.
Page 32 of 38

Project: Barker Hughsville Pilot
Client: CDM Federal Programs
Work Order: H13080347
QA/QC Summary Report
08/30/13Report Date:
Analyte Result %REC RPDLow Limit High Limit RPDLimitRLUnits Qual
Revised Date: 08/30/13Prepared by Helena, MT Branch
Method: E300.0 Analytical Run: IC102-H_130821A
Sample ID: ICV 08/21/13 10:31Initial Calibration Verification Standard
Chloride 97 90 1101.097 mg/L
Sulfate 98 90 1101.0390 mg/L
Sample ID: CCV082113-2 08/21/13 17:17Continuing Calibration Verification Standard
Chloride 102 90 1101.0100 mg/L
Sulfate 102 90 1101.0410 mg/L
Sample ID: CCV082113-3 08/21/13 20:26Continuing Calibration Verification Standard
Chloride 102 90 1101.0100 mg/L
Sulfate 103 90 1101.0410 mg/L
Method: E300.0 Batch: R90696
Sample ID: ICB 08/21/13 10:56Method Blank Run: IC102-H_130821A
Chloride 0.008ND mg/L
Sulfate 0.08ND mg/L
Sample ID: LFB 08/21/13 11:09Laboratory Fortified Blank Run: IC102-H_130821A
Chloride 98 90 1101.049 mg/L
Sulfate 100 90 1101.0200 mg/L
Sample ID: H13080347-003AMS 08/21/13 19:10Sample Matrix Spike Run: IC102-H_130821A
Chloride 76 90 1105.71100 mg/L S
Sulfate 103 90 1102.37800 mg/L
Sample ID: H13080347-003AMSD 08/21/13 19:23Sample Matrix Spike Duplicate Run: IC102-H_130821A
Chloride 75 90 110 205.7 0.71100 mg/L S
Sulfate 109 90 110 202.3 2.98000 mg/L
Sample ID: H13080347-010AMS 08/21/13 21:17Sample Matrix Spike Run: IC102-H_130821A
Chloride 98 90 1101.4250 mg/L
Sulfate 108 90 1101.02100 mg/L
Sample ID: H13080347-010AMSD 08/21/13 21:29Sample Matrix Spike Duplicate Run: IC102-H_130821A
Chloride 99 90 110 201.4 0.5250 mg/L
Sulfate 105 90 110 201.0 1.42100 mg/L
Qualifiers:
RL - Analyte reporting limit. ND - Not detected at the reporting limit.
S - Spike recovery outside of advisory limits.
Page 33 of 38

Project: Barker Hughsville Pilot
Client: CDM Federal Programs
Work Order: H13080347
QA/QC Summary Report
08/30/13Report Date:
Analyte Result %REC RPDLow Limit High Limit RPDLimitRLUnits Qual
Revised Date: 08/30/13Prepared by Helena, MT Branch
Method: E300.0 Analytical Run: IC102-H_130827A
Sample ID: ICV 08/27/13 11:05Initial Calibration Verification Standard
Chloride 98 90 1101.098 mg/L
Sulfate 100 90 1101.0400 mg/L
Sample ID: CCV082713-2 08/27/13 14:39Continuing Calibration Verification Standard
Chloride 102 90 1101.0100 mg/L
Sulfate 104 90 1101.0420 mg/L
Method: E300.0 Batch: R90831
Sample ID: ICB 08/27/13 11:17Method Blank Run: IC102-H_130827A
Chloride 0.008ND mg/L
Sulfate 0.080.2 mg/L
Sample ID: LFB 08/27/13 11:30Laboratory Fortified Blank Run: IC102-H_130827A
Chloride 100 90 1101.050 mg/L
Sulfate 103 90 1101.0210 mg/L
Sample ID: H13080347-008AMS 08/27/13 16:57Sample Matrix Spike Run: IC102-H_130827A
Chloride 101 90 1105.71100 mg/L
Sulfate 98 90 1102.34800 mg/L
Sample ID: H13080347-008AMSD 08/27/13 17:10Sample Matrix Spike Duplicate Run: IC102-H_130827A
Chloride 101 90 110 205.7 0.11100 mg/L
Sulfate 98 90 110 202.3 0.04800 mg/L
Qualifiers:
RL - Analyte reporting limit. ND - Not detected at the reporting limit.
Page 34 of 38
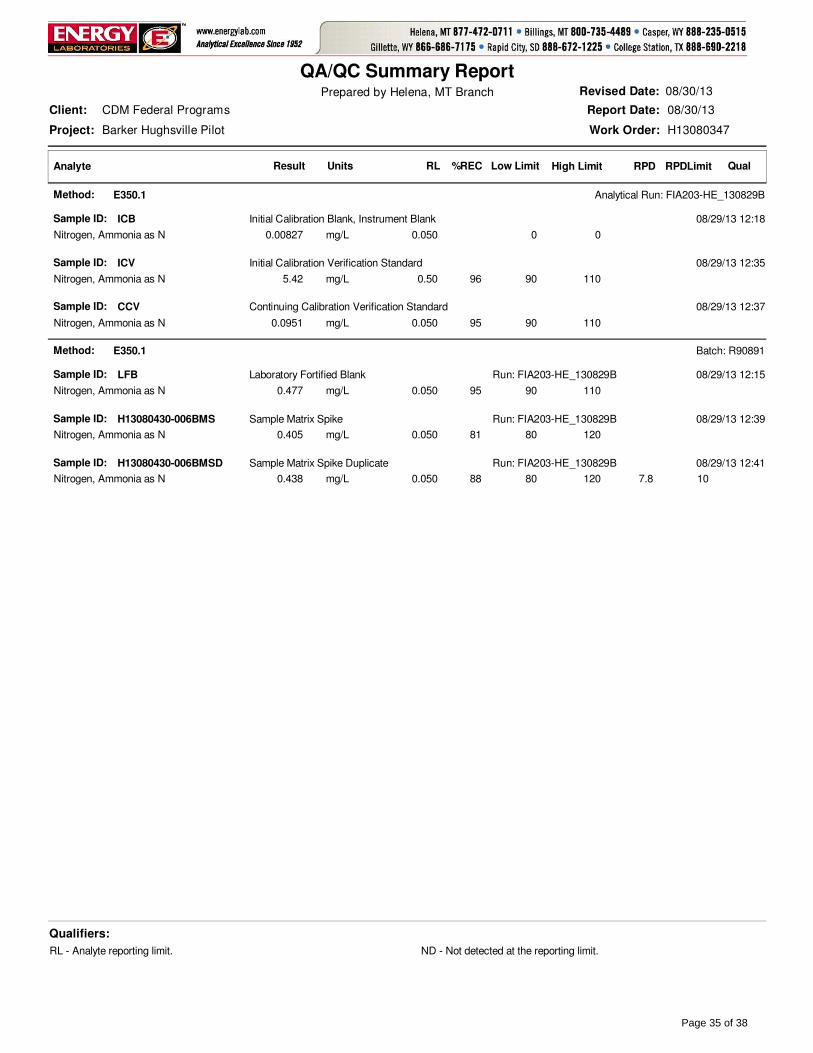
Project: Barker Hughsville Pilot
Client: CDM Federal Programs
Work Order: H13080347
QA/QC Summary Report
08/30/13Report Date:
Analyte Result %REC RPDLow Limit High Limit RPDLimitRLUnits Qual
Revised Date: 08/30/13Prepared by Helena, MT Branch
Method: E350.1 Analytical Run: FIA203-HE_130829B
Sample ID: ICB 08/29/13 12:18Initial Calibration Blank, Instrument Blank
Nitrogen, Ammonia as N 0 00.0500.00827 mg/L
Sample ID: ICV 08/29/13 12:35Initial Calibration Verification Standard
Nitrogen, Ammonia as N 96 90 1100.505.42 mg/L
Sample ID: CCV 08/29/13 12:37Continuing Calibration Verification Standard
Nitrogen, Ammonia as N 95 90 1100.0500.0951 mg/L
Method: E350.1 Batch: R90891
Sample ID: LFB 08/29/13 12:15Laboratory Fortified Blank Run: FIA203-HE_130829B
Nitrogen, Ammonia as N 95 90 1100.0500.477 mg/L
Sample ID: H13080430-006BMS 08/29/13 12:39Sample Matrix Spike Run: FIA203-HE_130829B
Nitrogen, Ammonia as N 81 80 1200.0500.405 mg/L
Sample ID: H13080430-006BMSD 08/29/13 12:41Sample Matrix Spike Duplicate Run: FIA203-HE_130829B
Nitrogen, Ammonia as N 88 80 120 100.050 7.80.438 mg/L
Qualifiers:
RL - Analyte reporting limit. ND - Not detected at the reporting limit.
Page 35 of 38

Project: Barker Hughsville Pilot
Client: CDM Federal Programs
Work Order: H13080347
QA/QC Summary Report
08/30/13Report Date:
Analyte Result %REC RPDLow Limit High Limit RPDLimitRLUnits Qual
Revised Date: 08/30/13Prepared by Helena, MT Branch
Method: E365.1 Analytical Run: FIA202-HE_130820A
Sample ID: ICV 08/20/13 13:09Initial Calibration Verification Standard
Phosphorus, Orthophosphate as P 97 90 1100.00500.242 mg/L
Sample ID: ICB 08/20/13 13:10Initial Calibration Blank, Instrument Blank
Phosphorus, Orthophosphate as P 0 00.0050-0.000780 mg/L
Sample ID: CCV 08/20/13 13:12Continuing Calibration Verification Standard
Phosphorus, Orthophosphate as P 90 90 1100.00500.0896 mg/L
Method: E365.1 Batch: R90648
Sample ID: LFB 08/20/13 13:11Laboratory Fortified Blank Run: FIA202-HE_130820A
Phosphorus, Orthophosphate as P 94 90 1100.00500.189 mg/L
Sample ID: H13080347-002AMS 08/20/13 13:16Sample Matrix Spike Run: FIA202-HE_130820A
Phosphorus, Orthophosphate as P 81 90 1100.00500.450 mg/L S
Sample ID: H13080347-002AMSD 08/20/13 13:17Sample Matrix Spike Duplicate Run: FIA202-HE_130820A
Phosphorus, Orthophosphate as P 85 90 110 200.0050 3.60.467 mg/L S
Qualifiers:
RL - Analyte reporting limit. ND - Not detected at the reporting limit.
S - Spike recovery outside of advisory limits.
Page 36 of 38

Shipping container/cooler in good condition?
Custody seals intact on all shipping container(s)/cooler(s)?
Custody seals intact on all sample bottles?
Chain of custody present?
Chain of custody signed when relinquished and received?
Chain of custody agrees with sample labels?
Samples in proper container/bottle?
Sample containers intact?
Sufficient sample volume for indicated test?
All samples received within holding time?(Exclude analyses that are considered field parameterssuch as pH, DO, Res Cl, Sulfite, Ferrous Iron, etc.)
Container/Temp Blank temperature:
Water - VOA vials have zero headspace?
Water - pH acceptable upon receipt?
Yes
Yes
Yes
Yes
Yes
Yes
Yes
Yes
Yes
Yes
Yes
Yes
No
No
No
No
No
No
No
No
No
No
No
No
� �
�
�
�
�
�
�
�
�
�
�
�
�
�
�
�
�
�
�
�
�
�
�
Not Present
Not Present
Not Present
�
�
�
No VOA vials submitted
Not Applicable �
�
°C See comments
8/20/2013Tracy L. Lorash
Hand Del
elm
Date Received:
Received by:
Login completed by:
Carrier name:
BL2000\sdull
8/23/2013
Reviewed by:
Reviewed Date:
Contact and Corrective Action Comments:
Sample ID on COC has the date as 081913 - ID on INFL, SAPS, CHIT bottles has date as 08192013. Logged in with ID from COC.Cooler 1 was received at 0.3°C, Cooler 2 at 0.6°C. Samples were received on wet ice.BCR3 and BDR3 dissolved metals samples were preserved with 2 mL nitric acid upon receipt to pH <2 in the laboratory. Tl 8/20/13
Temp Blank received in all shipping container(s)/cooler(s)? Yes No� � Not Applicable �
Workorder Receipt Checklist
CDM Federal Programs H13080347
Lab measurement of analytes considered field parameters that require analysis within 15 minutes of sampling such as pH, Dissolved Oxygen and Residual Chlorine, are qualified as being analyzed outside of recommended holding time.
Solid/soil samples are reported on a wet weight basis (as received) unless specifically indicated. If moisture corrected, data units are typically noted as –dry. For agricultural and mining soil parameters/characteristics, all samples are dried and ground prior to sample analysis.
Standard Reporting Procedures
Page 37 of 38

Page 38 of 38

ANALYTICAL SUMMARY REPORTANALYTICAL SUMMARY REPORTANALYTICAL SUMMARY REPORTANALYTICAL SUMMARY REPORT
Sample ID Client Sample ID Collect Date Receive Date Matrix Test
H13090077-001 13BH-DT-PILOT-BCR3-090413
09/04/13 9:40 09/05/13 Aqueous Metals by ICP/ICPMS, DissolvedMetals by ICP/ICPMS, TotalAcidity, Total as CaCO3AlkalinityBiochemical Oxygen Demand, 5 DayConductivityFluorideAnions by Ion ChromatographyNitrogen, AmmoniaMetals Digestion by EPA 200.2Phosphorus, Orthophosphate as PSolids, Total DissolvedSulfide, Iodine Titrimetric
H13090077-002 13BH-DT-PILOT-BCR1-090413
09/04/13 10:25 09/05/13 Aqueous Metals by ICP/ICPMS, DissolvedMetals by ICP/ICPMS, TotalAcidity, Total as CaCO3AlkalinityConductivityFluorideAnions by Ion ChromatographyMetals Digestion by EPA 200.2Phosphorus, Orthophosphate as PSolids, Total DissolvedSulfide, Methylene Blue Colorimetric
H13090077-003 13BH-DT-PILOT-BDR1-090413
09/04/13 10:30 09/05/13 Aqueous Same As Above
H13090077-004 13BH-DT-PILOT-BCR2-090413
09/04/13 10:55 09/05/13 Aqueous Same As Above
H13090077-005 13BH-DT-PILOT-BCR4-090413
09/04/13 11:10 09/05/13 Aqueous Same As Above
H13090077-006 13BH-DT-PILOT-INFL-090413
09/04/13 11:20 09/05/13 Aqueous Metals by ICP/ICPMS, DissolvedMetals by ICP/ICPMS, TotalAcidity, Total as CaCO3AlkalinityConductivityFluorideAnions by Ion ChromatographyMetals Digestion by EPA 200.2Phosphorus, Orthophosphate as PSolids, Total Dissolved
H13090077-007 13BH-DT-PILOT-SAPS-090413
09/04/13 11:35 09/05/13 Aqueous Same As Above
H13090077-008 13BH-DT-PILOT-MGOH-090413
09/04/13 11:45 09/05/13 Aqueous Same As Above
CDM Federal Programs
Project Name: Barker Hughsville Pilot
Workorder No.: H13090077
555 17th St Ste 1100
Denver, CO 80202
September 27, 2013
H823 - Baker-Hughsville Superfund SiteQuote ID:
Energy Laboratories Inc Helena MT received the following 10 samples for CDM Federal Programs on 9/5/2013 for analysis.
Page 1 of 56
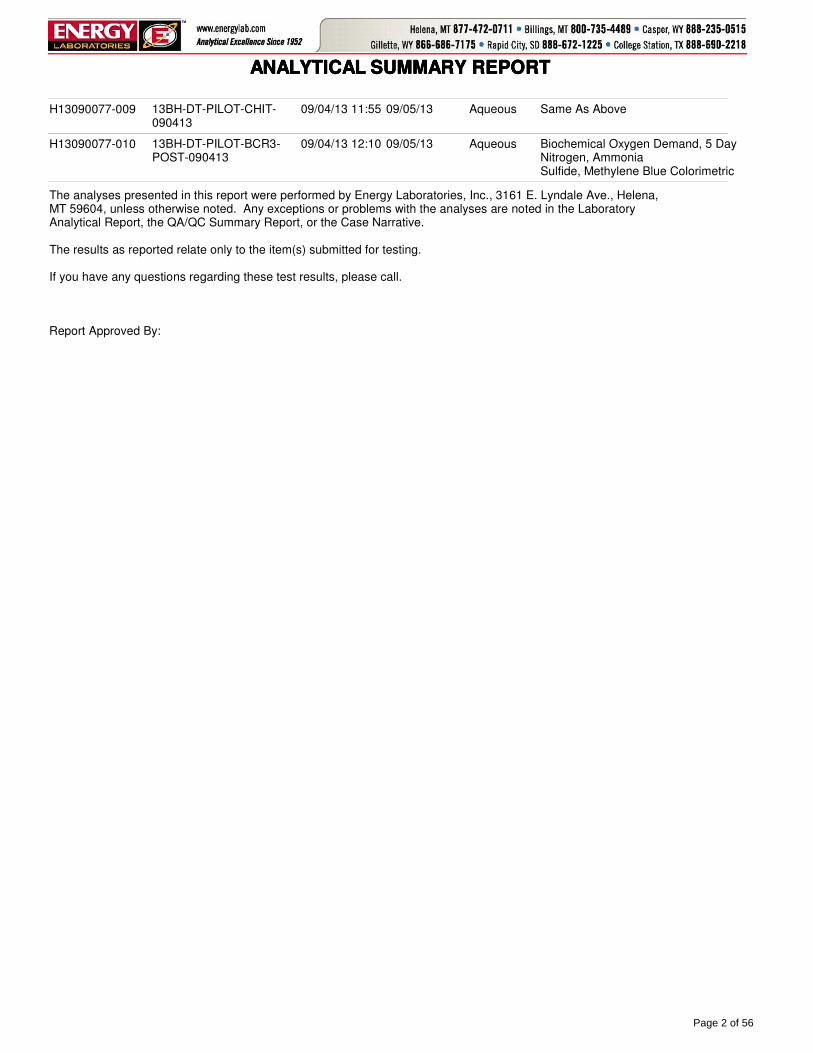
ANALYTICAL SUMMARY REPORTANALYTICAL SUMMARY REPORTANALYTICAL SUMMARY REPORTANALYTICAL SUMMARY REPORT
The analyses presented in this report were performed by Energy Laboratories, Inc., 3161 E. Lyndale Ave., Helena, MT 59604, unless otherwise noted. Any exceptions or problems with the analyses are noted in the Laboratory Analytical Report, the QA/QC Summary Report, or the Case Narrative.
The results as reported relate only to the item(s) submitted for testing.
If you have any questions regarding these test results, please call.
Report Approved By:
H13090077-009 13BH-DT-PILOT-CHIT-090413
09/04/13 11:55 09/05/13 Aqueous Same As Above
H13090077-010 13BH-DT-PILOT-BCR3-POST-090413
09/04/13 12:10 09/05/13 Aqueous Biochemical Oxygen Demand, 5 DayNitrogen, AmmoniaSulfide, Methylene Blue Colorimetric
Page 2 of 56

Project: Barker Hughsville Pilot
CLIENT: CDM Federal Programs
Sample Delivery Group: H13090077 CASE NARRATIVE
09/27/13Report Date:
Tests associated with analyst identified as ELI-B were subcontracted to Energy Laboratories, 1120 S. 27th St., Billings, MT, EPA Number MT00005.
Page 3 of 56

LABORATORY ANALYTICAL REPORT
Client: CDM Federal Programs
Project: Barker Hughsville Pilot
Lab ID: H13090077-001
Client Sample ID 13BH-DT-PILOT-BCR3-090413
Collection Date: 09/04/13 09:40
Matrix: Aqueous
Report Date: 09/27/13
DateReceived: 09/05/13
Prepared by Helena, MT Branch
Analyses Result Units Analysis Date / ByRL Method
MCL/QCLQualifiers
PHYSICAL PROPERTIES
09/05/13 12:43 / cmm10mg/L2630Solids, Total Dissolved TDS @ 180 C A2540 C
INORGANICS
D 09/09/13 11:00 / cmm4.0mg/LNDAcidity, Total as CaCO3 A2310 B
09/05/13 16:11 / cmm1mg/L1700Alkalinity, Total as CaCO3 A2320 B
09/05/13 16:11 / cmm1mg/L2100Bicarbonate as HCO3 A2320 B
09/05/13 16:11 / cmm1mg/LNDCarbonate as CO3 A2320 B
09/05/13 16:11 / cmm1mg/LNDHydroxide as OH A2320 B
D 09/09/13 16:01 / cmm5mg/L31Chloride E300.0
D 09/10/13 12:27 / cmm5mg/L350Sulfate E300.0
D 09/10/13 10:51 / cmm0.2mg/L0.4Fluoride A4500-F C4
09/06/13 14:45 / eli-b221mg/L78Sulfide A4500-S F
AGGREGATE ORGANICS
09/05/13 15:19 / cmm400mg/L1500Oxygen Demand, Biochemical (BOD) A5210 B
NUTRIENTS
D 09/05/13 12:17 / reh5mg/L179Nitrogen, Ammonia as N E350.1
D 09/05/13 16:12 / reh0.2mg/L62.1Phosphorus, Orthophosphate as P E365.1
METALS, DISSOLVED
09/10/13 23:28 / dck0.03mg/LNDAluminum E200.8
09/10/13 23:28 / dck0.001mg/L0.023Arsenic E200.8
09/10/13 23:28 / dck0.05mg/L0.12Barium E200.8
09/10/13 23:28 / dck0.001mg/LNDBeryllium E200.8
09/10/13 23:28 / dck0.001mg/LNDCadmium E200.8
09/06/13 11:16 / sld1mg/L583Calcium E200.7
09/10/13 23:28 / dck0.005mg/LNDChromium E200.8
09/10/13 23:28 / dck0.005mg/LNDCobalt E200.8
09/10/13 23:28 / dck0.005mg/LNDCopper E200.8
09/10/13 23:28 / dck0.03mg/L0.09Iron E200.8
09/10/13 23:28 / dck0.001mg/LNDLead E200.8
09/06/13 11:16 / sld1mg/L43Magnesium E200.7
D 09/06/13 11:16 / sld0.003mg/L60.0Manganese E200.7
09/10/13 23:28 / dck0.005mg/LNDNickel E200.8
09/06/13 11:16 / sld1mg/L8Potassium E200.7
09/10/13 23:28 / dck0.001mg/LNDSilver E200.8
09/06/13 11:16 / sld1mg/L26Sodium E200.7
09/10/13 23:28 / dck0.0005mg/LNDThallium E200.8
09/10/13 23:28 / dck0.01mg/LNDZinc E200.8
METALS, TOTAL
09/12/13 00:35 / dck0.03mg/L0.16Aluminum E200.8
09/12/13 00:35 / dck0.001mg/L0.029Arsenic E200.8
ReportDefinitions:
RL - Analyte reporting limit. MCL - Maximum contaminant level.
QCL - Quality control limit. ND - Not detected at the reporting limit.
D - RL increased due to sample matrix.
Page 4 of 56

LABORATORY ANALYTICAL REPORT
Client: CDM Federal Programs
Project: Barker Hughsville Pilot
Lab ID: H13090077-001
Client Sample ID 13BH-DT-PILOT-BCR3-090413
Collection Date: 09/04/13 09:40
Matrix: Aqueous
Report Date: 09/27/13
DateReceived: 09/05/13
Prepared by Helena, MT Branch
Analyses Result Units Analysis Date / ByRL Method
MCL/QCLQualifiers
METALS, TOTAL
09/12/13 00:35 / dck0.05mg/L0.13Barium E200.8
09/12/13 00:35 / dck0.001mg/LNDBeryllium E200.8
09/12/13 00:35 / dck0.001mg/LNDCadmium E200.8
09/10/13 14:13 / sld1mg/L586Calcium E200.7
09/12/13 00:35 / dck0.005mg/LNDChromium E200.8
09/12/13 00:35 / dck0.005mg/LNDCobalt E200.8
09/12/13 00:35 / dck0.005mg/LNDCopper E200.8
09/12/13 00:35 / dck0.03mg/L0.55Iron E200.8
09/12/13 00:35 / dck0.001mg/L0.003Lead E200.8
09/10/13 14:13 / sld1mg/L44Magnesium E200.7
D 09/10/13 14:13 / sld0.003mg/L61.2Manganese E200.7
09/12/13 00:35 / dck0.005mg/LNDNickel E200.8
09/10/13 14:13 / sld1mg/L8Potassium E200.7
09/12/13 00:35 / dck0.001mg/LNDSilver E200.8
09/10/13 14:13 / sld1mg/L25Sodium E200.7
09/12/13 00:35 / dck0.0005mg/L0.0005Thallium E200.8
09/12/13 00:35 / dck0.01mg/L0.03Zinc E200.8
ReportDefinitions:
RL - Analyte reporting limit. MCL - Maximum contaminant level.
QCL - Quality control limit. ND - Not detected at the reporting limit.
D - RL increased due to sample matrix.
Page 5 of 56

LABORATORY ANALYTICAL REPORT
Client: CDM Federal Programs
Project: Barker Hughsville Pilot
Lab ID: H13090077-002
Client Sample ID 13BH-DT-PILOT-BCR1-090413
Collection Date: 09/04/13 10:25
Matrix: Aqueous
Report Date: 09/27/13
DateReceived: 09/05/13
Prepared by Helena, MT Branch
Analyses Result Units Analysis Date / ByRL Method
MCL/QCLQualifiers
PHYSICAL PROPERTIES
09/05/13 12:43 / cmm10mg/L1580Solids, Total Dissolved TDS @ 180 C A2540 C
INORGANICS
D 09/09/13 11:00 / cmm4.0mg/L230Acidity, Total as CaCO3 A2310 B
09/05/13 16:17 / cmm1mg/L76Alkalinity, Total as CaCO3 A2320 B
09/05/13 16:17 / cmm1mg/L93Bicarbonate as HCO3 A2320 B
09/05/13 16:17 / cmm1mg/LNDCarbonate as CO3 A2320 B
09/05/13 16:17 / cmm1mg/LNDHydroxide as OH A2320 B
09/09/13 16:14 / cmm1mg/L1Chloride E300.0
09/10/13 12:40 / cmm1mg/L1100Sulfate E300.0
D 09/10/13 10:54 / cmm0.2mg/L1.3Fluoride A4500-F C4
09/06/13 15:00 / eli-b220.04mg/LNDSulfide A4500-S D
NUTRIENTS
09/05/13 16:13 / reh0.005mg/L0.029Phosphorus, Orthophosphate as P E365.1
METALS, DISSOLVED
09/10/13 23:46 / dck0.03mg/L0.84Aluminum E200.8
09/10/13 23:46 / dck0.001mg/L0.008Arsenic E200.8
09/10/13 23:46 / dck0.05mg/L0.05Barium E200.8
09/10/13 23:46 / dck0.001mg/L0.001Beryllium E200.8
09/10/13 23:46 / dck0.001mg/L0.001Cadmium E200.8
09/06/13 11:27 / sld1mg/L235Calcium E200.7
09/10/13 23:46 / dck0.005mg/LNDChromium E200.8
09/10/13 23:46 / dck0.005mg/L0.040Cobalt E200.8
09/10/13 23:46 / dck0.005mg/LNDCopper E200.8
09/06/13 11:27 / sld0.03mg/L86.2Iron E200.7
09/10/13 23:46 / dck0.001mg/LNDLead E200.8
09/06/13 11:27 / sld1mg/L23Magnesium E200.7
D 09/06/13 11:27 / sld0.003mg/L105Manganese E200.7
09/10/13 23:46 / dck0.005mg/L0.029Nickel E200.8
09/06/13 11:27 / sld1mg/L1Potassium E200.7
09/10/13 23:46 / dck0.001mg/LNDSilver E200.8
09/06/13 11:27 / sld1mg/L7Sodium E200.7
09/10/13 23:46 / dck0.0005mg/LNDThallium E200.8
09/06/13 11:27 / sld0.01mg/L35.5Zinc E200.7
METALS, TOTAL
09/12/13 00:56 / dck0.03mg/L0.87Aluminum E200.8
09/12/13 00:56 / dck0.001mg/L0.010Arsenic E200.8
09/12/13 00:56 / dck0.05mg/L0.05Barium E200.8
09/12/13 00:56 / dck0.001mg/L0.001Beryllium E200.8
09/12/13 00:56 / dck0.001mg/L0.001Cadmium E200.8
09/10/13 14:35 / sld1mg/L228Calcium E200.7
ReportDefinitions:
RL - Analyte reporting limit. MCL - Maximum contaminant level.
QCL - Quality control limit. ND - Not detected at the reporting limit.
D - RL increased due to sample matrix.
Page 6 of 56

LABORATORY ANALYTICAL REPORT
Client: CDM Federal Programs
Project: Barker Hughsville Pilot
Lab ID: H13090077-002
Client Sample ID 13BH-DT-PILOT-BCR1-090413
Collection Date: 09/04/13 10:25
Matrix: Aqueous
Report Date: 09/27/13
DateReceived: 09/05/13
Prepared by Helena, MT Branch
Analyses Result Units Analysis Date / ByRL Method
MCL/QCLQualifiers
METALS, TOTAL
09/12/13 00:56 / dck0.005mg/LNDChromium E200.8
09/12/13 00:56 / dck0.005mg/L0.039Cobalt E200.8
09/12/13 00:56 / dck0.005mg/LNDCopper E200.8
09/10/13 14:35 / sld0.03mg/L83.4Iron E200.7
09/12/13 00:56 / dck0.001mg/L0.009Lead E200.8
09/10/13 14:35 / sld1mg/L21Magnesium E200.7
D 09/10/13 14:35 / sld0.003mg/L102Manganese E200.7
09/12/13 00:56 / dck0.005mg/L0.029Nickel E200.8
09/10/13 14:35 / sld1mg/LNDPotassium E200.7
09/12/13 00:56 / dck0.001mg/LNDSilver E200.8
09/10/13 14:35 / sld1mg/L5Sodium E200.7
09/12/13 00:56 / dck0.0005mg/LNDThallium E200.8
09/10/13 14:35 / sld0.01mg/L34.3Zinc E200.7
ReportDefinitions:
RL - Analyte reporting limit. MCL - Maximum contaminant level.
QCL - Quality control limit. ND - Not detected at the reporting limit.
D - RL increased due to sample matrix.
Page 7 of 56

LABORATORY ANALYTICAL REPORT
Client: CDM Federal Programs
Project: Barker Hughsville Pilot
Lab ID: H13090077-003
Client Sample ID 13BH-DT-PILOT-BDR1-090413
Collection Date: 09/04/13 10:30
Matrix: Aqueous
Report Date: 09/27/13
DateReceived: 09/05/13
Prepared by Helena, MT Branch
Analyses Result Units Analysis Date / ByRL Method
MCL/QCLQualifiers
PHYSICAL PROPERTIES
09/05/13 12:43 / cmm10mg/L1590Solids, Total Dissolved TDS @ 180 C A2540 C
INORGANICS
D 09/09/13 11:00 / cmm4.0mg/L280Acidity, Total as CaCO3 A2310 B
09/05/13 16:22 / cmm1mg/L75Alkalinity, Total as CaCO3 A2320 B
09/05/13 16:22 / cmm1mg/L91Bicarbonate as HCO3 A2320 B
09/05/13 16:22 / cmm1mg/LNDCarbonate as CO3 A2320 B
09/05/13 16:22 / cmm1mg/LNDHydroxide as OH A2320 B
09/09/13 16:26 / cmm1mg/L1Chloride E300.0
09/10/13 12:53 / cmm1mg/L1100Sulfate E300.0
D 09/10/13 10:55 / cmm0.2mg/L1.3Fluoride A4500-F C4
09/06/13 15:00 / eli-b220.04mg/LNDSulfide A4500-S D
NUTRIENTS
09/05/13 16:16 / reh0.005mg/L0.030Phosphorus, Orthophosphate as P E365.1
METALS, DISSOLVED
09/06/13 11:30 / sld0.03mg/L1.22Aluminum E200.7
09/10/13 23:51 / dck0.001mg/L0.008Arsenic E200.8
09/10/13 23:51 / dck0.05mg/L0.05Barium E200.8
09/10/13 23:51 / dck0.001mg/L0.001Beryllium E200.8
09/10/13 23:51 / dck0.001mg/L0.001Cadmium E200.8
09/06/13 11:30 / sld1mg/L235Calcium E200.7
09/10/13 23:51 / dck0.005mg/LNDChromium E200.8
09/10/13 23:51 / dck0.005mg/L0.040Cobalt E200.8
09/10/13 23:51 / dck0.005mg/LNDCopper E200.8
09/06/13 11:30 / sld0.03mg/L86.1Iron E200.7
09/10/13 23:51 / dck0.001mg/LNDLead E200.8
09/06/13 11:30 / sld1mg/L23Magnesium E200.7
D 09/06/13 11:30 / sld0.003mg/L105Manganese E200.7
09/10/13 23:51 / dck0.005mg/L0.030Nickel E200.8
09/06/13 11:30 / sld1mg/LNDPotassium E200.7
09/10/13 23:51 / dck0.001mg/LNDSilver E200.8
09/06/13 11:30 / sld1mg/L5Sodium E200.7
09/10/13 23:51 / dck0.0005mg/LNDThallium E200.8
09/06/13 11:30 / sld0.01mg/L35.9Zinc E200.7
METALS, TOTAL
D 09/10/13 14:38 / sld0.06mg/L1.01Aluminum E200.7
09/12/13 01:01 / dck0.001mg/L0.010Arsenic E200.8
09/12/13 01:01 / dck0.05mg/L0.05Barium E200.8
09/12/13 01:01 / dck0.001mg/L0.001Beryllium E200.8
09/12/13 01:01 / dck0.001mg/L0.001Cadmium E200.8
09/10/13 14:38 / sld1mg/L233Calcium E200.7
ReportDefinitions:
RL - Analyte reporting limit. MCL - Maximum contaminant level.
QCL - Quality control limit. ND - Not detected at the reporting limit.
D - RL increased due to sample matrix.
Page 8 of 56
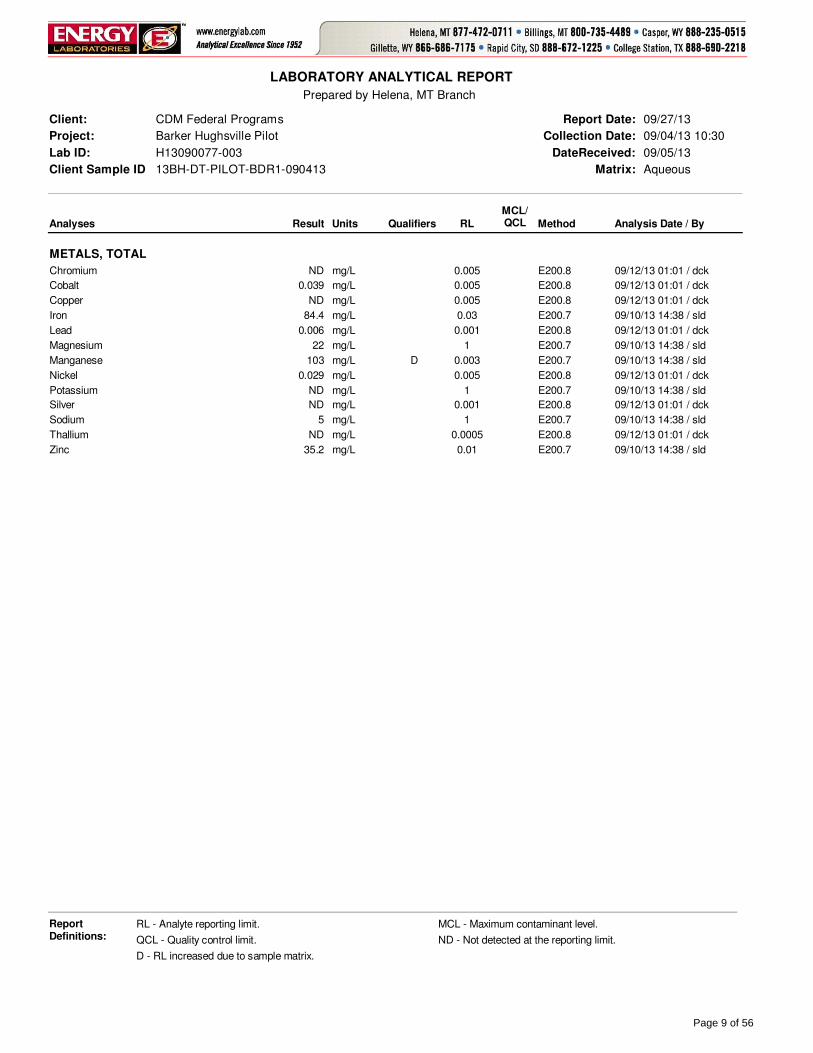
LABORATORY ANALYTICAL REPORT
Client: CDM Federal Programs
Project: Barker Hughsville Pilot
Lab ID: H13090077-003
Client Sample ID 13BH-DT-PILOT-BDR1-090413
Collection Date: 09/04/13 10:30
Matrix: Aqueous
Report Date: 09/27/13
DateReceived: 09/05/13
Prepared by Helena, MT Branch
Analyses Result Units Analysis Date / ByRL Method
MCL/QCLQualifiers
METALS, TOTAL
09/12/13 01:01 / dck0.005mg/LNDChromium E200.8
09/12/13 01:01 / dck0.005mg/L0.039Cobalt E200.8
09/12/13 01:01 / dck0.005mg/LNDCopper E200.8
09/10/13 14:38 / sld0.03mg/L84.4Iron E200.7
09/12/13 01:01 / dck0.001mg/L0.006Lead E200.8
09/10/13 14:38 / sld1mg/L22Magnesium E200.7
D 09/10/13 14:38 / sld0.003mg/L103Manganese E200.7
09/12/13 01:01 / dck0.005mg/L0.029Nickel E200.8
09/10/13 14:38 / sld1mg/LNDPotassium E200.7
09/12/13 01:01 / dck0.001mg/LNDSilver E200.8
09/10/13 14:38 / sld1mg/L5Sodium E200.7
09/12/13 01:01 / dck0.0005mg/LNDThallium E200.8
09/10/13 14:38 / sld0.01mg/L35.2Zinc E200.7
ReportDefinitions:
RL - Analyte reporting limit. MCL - Maximum contaminant level.
QCL - Quality control limit. ND - Not detected at the reporting limit.
D - RL increased due to sample matrix.
Page 9 of 56

LABORATORY ANALYTICAL REPORT
Client: CDM Federal Programs
Project: Barker Hughsville Pilot
Lab ID: H13090077-004
Client Sample ID 13BH-DT-PILOT-BCR2-090413
Collection Date: 09/04/13 10:55
Matrix: Aqueous
Report Date: 09/27/13
DateReceived: 09/05/13
Prepared by Helena, MT Branch
Analyses Result Units Analysis Date / ByRL Method
MCL/QCLQualifiers
PHYSICAL PROPERTIES
09/05/13 12:43 / cmm10mg/L1510Solids, Total Dissolved TDS @ 180 C A2540 C
INORGANICS
D 09/09/13 11:00 / cmm4.0mg/L120Acidity, Total as CaCO3 A2310 B
09/05/13 16:28 / cmm1mg/L100Alkalinity, Total as CaCO3 A2320 B
09/05/13 16:28 / cmm1mg/L120Bicarbonate as HCO3 A2320 B
09/05/13 16:28 / cmm1mg/LNDCarbonate as CO3 A2320 B
09/05/13 16:28 / cmm1mg/LNDHydroxide as OH A2320 B
09/09/13 16:39 / cmm1mg/L1Chloride E300.0
09/10/13 13:05 / cmm1mg/L1000Sulfate E300.0
D 09/10/13 10:56 / cmm0.2mg/L1.4Fluoride A4500-F C4
09/06/13 15:00 / eli-b220.04mg/L0.15Sulfide A4500-S D
NUTRIENTS
09/05/13 16:17 / reh0.005mg/L0.050Phosphorus, Orthophosphate as P E365.1
METALS, DISSOLVED
09/10/13 23:55 / dck0.03mg/L0.08Aluminum E200.8
09/10/13 23:55 / dck0.001mg/L0.002Arsenic E200.8
09/10/13 23:55 / dck0.05mg/L0.10Barium E200.8
09/10/13 23:55 / dck0.001mg/LNDBeryllium E200.8
09/10/13 23:55 / dck0.001mg/LNDCadmium E200.8
09/06/13 11:34 / sld1mg/L276Calcium E200.7
09/10/13 23:55 / dck0.005mg/LNDChromium E200.8
09/10/13 23:55 / dck0.005mg/L0.035Cobalt E200.8
09/10/13 23:55 / dck0.005mg/LNDCopper E200.8
09/06/13 11:34 / sld0.03mg/L46.4Iron E200.7
09/10/13 23:55 / dck0.001mg/LNDLead E200.8
09/06/13 11:34 / sld1mg/L22Magnesium E200.7
D 09/06/13 11:34 / sld0.003mg/L104Manganese E200.7
09/10/13 23:55 / dck0.005mg/L0.024Nickel E200.8
09/06/13 11:34 / sld1mg/L1Potassium E200.7
09/10/13 23:55 / dck0.001mg/LNDSilver E200.8
09/06/13 11:34 / sld1mg/L7Sodium E200.7
09/10/13 23:55 / dck0.0005mg/LNDThallium E200.8
09/06/13 11:34 / sld0.01mg/L12.2Zinc E200.7
METALS, TOTAL
09/25/13 10:36 / dck0.03mg/L0.12Aluminum E200.8
09/25/13 10:36 / dck0.001mg/L0.003Arsenic E200.8
09/25/13 10:36 / dck0.05mg/L0.08Barium E200.8
09/25/13 10:36 / dck0.001mg/LNDBeryllium E200.8
09/25/13 10:36 / dck0.001mg/LNDCadmium E200.8
09/10/13 14:42 / sld1mg/L271Calcium E200.7
ReportDefinitions:
RL - Analyte reporting limit. MCL - Maximum contaminant level.
QCL - Quality control limit. ND - Not detected at the reporting limit.
D - RL increased due to sample matrix.
Page 10 of 56

LABORATORY ANALYTICAL REPORT
Client: CDM Federal Programs
Project: Barker Hughsville Pilot
Lab ID: H13090077-004
Client Sample ID 13BH-DT-PILOT-BCR2-090413
Collection Date: 09/04/13 10:55
Matrix: Aqueous
Report Date: 09/27/13
DateReceived: 09/05/13
Prepared by Helena, MT Branch
Analyses Result Units Analysis Date / ByRL Method
MCL/QCLQualifiers
METALS, TOTAL
09/25/13 10:36 / dck0.005mg/LNDChromium E200.8
09/25/13 10:36 / dck0.005mg/L0.037Cobalt E200.8
09/25/13 10:36 / dck0.005mg/LNDCopper E200.8
09/10/13 14:42 / sld0.03mg/L45.0Iron E200.7
09/25/13 10:36 / dck0.001mg/L0.001Lead E200.8
09/10/13 14:42 / sld1mg/L22Magnesium E200.7
D 09/10/13 14:42 / sld0.003mg/L102Manganese E200.7
09/25/13 10:36 / dck0.005mg/L0.027Nickel E200.8
09/10/13 14:42 / sld1mg/LNDPotassium E200.7
09/25/13 10:36 / dck0.001mg/LNDSilver E200.8
09/10/13 14:42 / sld1mg/L5Sodium E200.7
09/25/13 10:36 / dck0.0005mg/LNDThallium E200.8
09/10/13 14:42 / sld0.01mg/L15.5Zinc E200.7
ReportDefinitions:
RL - Analyte reporting limit. MCL - Maximum contaminant level.
QCL - Quality control limit. ND - Not detected at the reporting limit.
D - RL increased due to sample matrix.
Page 11 of 56

LABORATORY ANALYTICAL REPORT
Client: CDM Federal Programs
Project: Barker Hughsville Pilot
Lab ID: H13090077-005
Client Sample ID 13BH-DT-PILOT-BCR4-090413
Collection Date: 09/04/13 11:10
Matrix: Aqueous
Report Date: 09/27/13
DateReceived: 09/05/13
Prepared by Helena, MT Branch
Analyses Result Units Analysis Date / ByRL Method
MCL/QCLQualifiers
PHYSICAL PROPERTIES
09/05/13 12:43 / cmm10mg/L1510Solids, Total Dissolved TDS @ 180 C A2540 C
INORGANICS
D 09/09/13 11:00 / cmm4.0mg/L170Acidity, Total as CaCO3 A2310 B
09/05/13 16:34 / cmm1mg/L100Alkalinity, Total as CaCO3 A2320 B
09/05/13 16:34 / cmm1mg/L120Bicarbonate as HCO3 A2320 B
09/05/13 16:34 / cmm1mg/LNDCarbonate as CO3 A2320 B
09/05/13 16:34 / cmm1mg/LNDHydroxide as OH A2320 B
09/09/13 16:51 / cmm1mg/L2Chloride E300.0
09/10/13 13:18 / cmm1mg/L1000Sulfate E300.0
D 09/10/13 10:57 / cmm0.2mg/L1.8Fluoride A4500-F C4
09/06/13 15:00 / eli-b220.04mg/L0.34Sulfide A4500-S D
NUTRIENTS
09/05/13 16:18 / reh0.005mg/L0.048Phosphorus, Orthophosphate as P E365.1
METALS, DISSOLVED
09/11/13 00:00 / dck0.03mg/L0.09Aluminum E200.8
09/11/13 00:00 / dck0.001mg/L0.006Arsenic E200.8
09/11/13 00:00 / dck0.05mg/L0.11Barium E200.8
09/11/13 00:00 / dck0.001mg/LNDBeryllium E200.8
09/11/13 00:00 / dck0.001mg/LNDCadmium E200.8
09/06/13 11:38 / sld1mg/L239Calcium E200.7
09/11/13 00:00 / dck0.005mg/LNDChromium E200.8
09/11/13 00:00 / dck0.005mg/L0.043Cobalt E200.8
09/11/13 00:00 / dck0.005mg/LNDCopper E200.8
09/06/13 11:38 / sld0.03mg/L52.2Iron E200.7
09/11/13 00:00 / dck0.001mg/LNDLead E200.8
09/06/13 11:38 / sld1mg/L41Magnesium E200.7
D 09/06/13 11:38 / sld0.003mg/L116Manganese E200.7
09/11/13 00:00 / dck0.005mg/L0.029Nickel E200.8
09/06/13 11:38 / sld1mg/L1Potassium E200.7
09/11/13 00:00 / dck0.001mg/LNDSilver E200.8
09/06/13 11:38 / sld1mg/L7Sodium E200.7
09/11/13 00:00 / dck0.0005mg/LNDThallium E200.8
09/06/13 11:38 / sld0.01mg/L10.4Zinc E200.7
METALS, TOTAL
09/12/13 01:27 / dck0.03mg/L0.13Aluminum E200.8
09/12/13 01:27 / dck0.001mg/L0.006Arsenic E200.8
09/12/13 01:27 / dck0.05mg/L0.10Barium E200.8
09/12/13 01:27 / dck0.001mg/LNDBeryllium E200.8
09/12/13 01:27 / dck0.001mg/LNDCadmium E200.8
09/10/13 14:46 / sld1mg/L233Calcium E200.7
ReportDefinitions:
RL - Analyte reporting limit. MCL - Maximum contaminant level.
QCL - Quality control limit. ND - Not detected at the reporting limit.
D - RL increased due to sample matrix.
Page 12 of 56

LABORATORY ANALYTICAL REPORT
Client: CDM Federal Programs
Project: Barker Hughsville Pilot
Lab ID: H13090077-005
Client Sample ID 13BH-DT-PILOT-BCR4-090413
Collection Date: 09/04/13 11:10
Matrix: Aqueous
Report Date: 09/27/13
DateReceived: 09/05/13
Prepared by Helena, MT Branch
Analyses Result Units Analysis Date / ByRL Method
MCL/QCLQualifiers
METALS, TOTAL
09/12/13 01:27 / dck0.005mg/LNDChromium E200.8
09/12/13 01:27 / dck0.005mg/L0.044Cobalt E200.8
09/12/13 01:27 / dck0.005mg/LNDCopper E200.8
09/10/13 14:46 / sld0.03mg/L51.9Iron E200.7
09/12/13 01:27 / dck0.001mg/LNDLead E200.8
09/10/13 14:46 / sld1mg/L36Magnesium E200.7
D 09/10/13 14:46 / sld0.003mg/L113Manganese E200.7
09/12/13 01:27 / dck0.005mg/L0.031Nickel E200.8
09/10/13 14:46 / sld1mg/LNDPotassium E200.7
09/12/13 01:27 / dck0.001mg/LNDSilver E200.8
09/10/13 14:46 / sld1mg/L5Sodium E200.7
09/12/13 01:27 / dck0.0005mg/LNDThallium E200.8
09/10/13 14:46 / sld0.01mg/L14.6Zinc E200.7
ReportDefinitions:
RL - Analyte reporting limit. MCL - Maximum contaminant level.
QCL - Quality control limit. ND - Not detected at the reporting limit.
D - RL increased due to sample matrix.
Page 13 of 56

LABORATORY ANALYTICAL REPORT
Client: CDM Federal Programs
Project: Barker Hughsville Pilot
Lab ID: H13090077-006
Client Sample ID 13BH-DT-PILOT-INFL-090413
Collection Date: 09/04/13 11:20
Matrix: Aqueous
Report Date: 09/27/13
DateReceived: 09/05/13
Prepared by Helena, MT Branch
Analyses Result Units Analysis Date / ByRL Method
MCL/QCLQualifiers
PHYSICAL PROPERTIES
09/05/13 12:44 / cmm10mg/L1420Solids, Total Dissolved TDS @ 180 C A2540 C
INORGANICS
D 09/09/13 11:00 / cmm4.0mg/L510Acidity, Total as CaCO3 A2310 B
09/05/13 16:37 / cmm1mg/LNDAlkalinity, Total as CaCO3 A2320 B
09/05/13 16:37 / cmm1mg/LNDBicarbonate as HCO3 A2320 B
09/05/13 16:37 / cmm1mg/LNDCarbonate as CO3 A2320 B
09/05/13 16:37 / cmm1mg/LNDHydroxide as OH A2320 B
09/09/13 17:07 / cmm1mg/L2Chloride E300.0
09/10/13 13:30 / cmm1mg/L2500Sulfate E300.0
D 09/10/13 10:58 / cmm0.2mg/L0.8Fluoride A4500-F C4
NUTRIENTS
09/05/13 17:00 / reh0.005mg/L0.225Phosphorus, Orthophosphate as P E365.1
METALS, DISSOLVED
09/06/13 11:41 / sld0.03mg/L10.9Aluminum E200.7
09/11/13 00:23 / dck0.001mg/L0.113Arsenic E200.8
09/11/13 00:23 / dck0.05mg/LNDBarium E200.8
09/11/13 00:23 / dck0.001mg/L0.006Beryllium E200.8
09/12/13 01:32 / dck0.001mg/L0.155Cadmium E200.8
09/06/13 11:41 / sld1mg/L97Calcium E200.7
09/11/13 00:23 / dck0.005mg/LNDChromium E200.8
09/11/13 00:23 / dck0.005mg/L0.038Cobalt E200.8
09/12/13 18:32 / dck0.005mg/L1.12Copper E200.8
09/06/13 11:41 / sld0.03mg/L130Iron E200.7
09/11/13 00:23 / dck0.001mg/L0.136Lead E200.8
09/06/13 11:41 / sld1mg/L22Magnesium E200.7
D 09/06/13 11:41 / sld0.003mg/L103Manganese E200.7
09/11/13 00:23 / dck0.005mg/L0.028Nickel E200.8
09/06/13 11:41 / sld1mg/LNDPotassium E200.7
09/11/13 00:23 / dck0.001mg/LNDSilver E200.8
09/06/13 11:41 / sld1mg/L7Sodium E200.7
09/11/13 00:23 / dck0.0005mg/L0.0022Thallium E200.8
09/06/13 11:41 / sld0.01mg/L47.8Zinc E200.7
METALS, TOTAL
D 09/10/13 14:49 / sld0.06mg/L12.6Aluminum E200.7
09/12/13 01:36 / dck0.001mg/L0.150Arsenic E200.8
09/12/13 01:36 / dck0.05mg/LNDBarium E200.8
09/12/13 01:36 / dck0.001mg/L0.005Beryllium E200.8
09/12/13 01:36 / dck0.001mg/L0.150Cadmium E200.8
09/10/13 14:49 / sld1mg/L98Calcium E200.7
09/12/13 01:36 / dck0.005mg/LNDChromium E200.8
ReportDefinitions:
RL - Analyte reporting limit. MCL - Maximum contaminant level.
QCL - Quality control limit. ND - Not detected at the reporting limit.
D - RL increased due to sample matrix.
Page 14 of 56

LABORATORY ANALYTICAL REPORT
Client: CDM Federal Programs
Project: Barker Hughsville Pilot
Lab ID: H13090077-006
Client Sample ID 13BH-DT-PILOT-INFL-090413
Collection Date: 09/04/13 11:20
Matrix: Aqueous
Report Date: 09/27/13
DateReceived: 09/05/13
Prepared by Helena, MT Branch
Analyses Result Units Analysis Date / ByRL Method
MCL/QCLQualifiers
METALS, TOTAL
09/12/13 01:36 / dck0.005mg/L0.039Cobalt E200.8
09/12/13 18:54 / dck0.005mg/L1.18Copper E200.8
09/10/13 14:49 / sld0.03mg/L129Iron E200.7
09/12/13 01:36 / dck0.001mg/L0.258Lead E200.8
09/10/13 14:49 / sld1mg/L22Magnesium E200.7
D 09/10/13 14:49 / sld0.003mg/L101Manganese E200.7
09/12/13 01:36 / dck0.005mg/L0.029Nickel E200.8
09/10/13 14:49 / sld1mg/L1Potassium E200.7
09/12/13 01:36 / dck0.001mg/LNDSilver E200.8
09/10/13 14:49 / sld1mg/L5Sodium E200.7
09/12/13 01:36 / dck0.0005mg/L0.0025Thallium E200.8
09/10/13 14:49 / sld0.01mg/L45.7Zinc E200.7
ReportDefinitions:
RL - Analyte reporting limit. MCL - Maximum contaminant level.
QCL - Quality control limit. ND - Not detected at the reporting limit.
D - RL increased due to sample matrix.
Page 15 of 56

LABORATORY ANALYTICAL REPORT
Client: CDM Federal Programs
Project: Barker Hughsville Pilot
Lab ID: H13090077-007
Client Sample ID 13BH-DT-PILOT-SAPS-090413
Collection Date: 09/04/13 11:35
Matrix: Aqueous
Report Date: 09/27/13
DateReceived: 09/05/13
Prepared by Helena, MT Branch
Analyses Result Units Analysis Date / ByRL Method
MCL/QCLQualifiers
PHYSICAL PROPERTIES
09/05/13 12:44 / cmm10mg/L1580Solids, Total Dissolved TDS @ 180 C A2540 C
INORGANICS
D 09/09/13 11:00 / cmm4.0mg/L320Acidity, Total as CaCO3 A2310 B
09/05/13 16:43 / cmm1mg/L51Alkalinity, Total as CaCO3 A2320 B
09/05/13 16:43 / cmm1mg/L62Bicarbonate as HCO3 A2320 B
09/05/13 16:43 / cmm1mg/LNDCarbonate as CO3 A2320 B
09/05/13 16:43 / cmm1mg/LNDHydroxide as OH A2320 B
09/09/13 17:20 / cmm1mg/L2Chloride E300.0
09/10/13 13:43 / cmm1mg/L1300Sulfate E300.0
D 09/10/13 11:02 / cmm0.2mg/L1.5Fluoride A4500-F C4
NUTRIENTS
09/05/13 17:01 / reh0.005mg/L0.151Phosphorus, Orthophosphate as P E365.1
METALS, DISSOLVED
09/11/13 00:36 / dck0.03mg/L0.68Aluminum E200.8
09/11/13 00:36 / dck0.001mg/L0.003Arsenic E200.8
09/11/13 00:36 / dck0.05mg/LNDBarium E200.8
09/11/13 00:36 / dck0.001mg/L0.001Beryllium E200.8
09/11/13 00:36 / dck0.001mg/L0.067Cadmium E200.8
09/06/13 11:45 / sld1mg/L238Calcium E200.7
09/11/13 00:36 / dck0.005mg/LNDChromium E200.8
09/11/13 00:36 / dck0.005mg/L0.040Cobalt E200.8
09/11/13 00:36 / dck0.005mg/LNDCopper E200.8
09/06/13 11:45 / sld0.03mg/L79.1Iron E200.7
09/11/13 00:36 / dck0.001mg/L0.001Lead E200.8
09/06/13 11:45 / sld1mg/L23Magnesium E200.7
D 09/06/13 11:45 / sld0.003mg/L105Manganese E200.7
09/11/13 00:36 / dck0.005mg/L0.029Nickel E200.8
09/06/13 11:45 / sld1mg/LNDPotassium E200.7
09/11/13 00:36 / dck0.001mg/LNDSilver E200.8
09/06/13 11:45 / sld1mg/L7Sodium E200.7
09/11/13 00:36 / dck0.0005mg/L0.0023Thallium E200.8
09/06/13 11:45 / sld0.01mg/L50.1Zinc E200.7
METALS, TOTAL
D 09/10/13 14:53 / sld0.05mg/L154Aluminum E200.7
09/12/13 01:41 / dck0.001mg/L0.746Arsenic E200.8
09/12/13 01:41 / dck0.05mg/L0.05Barium E200.8
09/12/13 01:41 / dck0.001mg/L0.063Beryllium E200.8
09/12/13 18:58 / dck0.001mg/L0.584Cadmium E200.8
09/10/13 14:53 / sld1mg/L210Calcium E200.7
09/12/13 01:41 / dck0.005mg/L0.082Chromium E200.8
ReportDefinitions:
RL - Analyte reporting limit. MCL - Maximum contaminant level.
QCL - Quality control limit. ND - Not detected at the reporting limit.
D - RL increased due to sample matrix.
Page 16 of 56

LABORATORY ANALYTICAL REPORT
Client: CDM Federal Programs
Project: Barker Hughsville Pilot
Lab ID: H13090077-007
Client Sample ID 13BH-DT-PILOT-SAPS-090413
Collection Date: 09/04/13 11:35
Matrix: Aqueous
Report Date: 09/27/13
DateReceived: 09/05/13
Prepared by Helena, MT Branch
Analyses Result Units Analysis Date / ByRL Method
MCL/QCLQualifiers
METALS, TOTAL
09/12/13 01:41 / dck0.005mg/L0.038Cobalt E200.8
D 09/12/13 18:58 / dck0.009mg/L10.1Copper E200.8
D 09/11/13 10:50 / sld0.1mg/L669Iron E200.7
09/12/13 01:41 / dck0.001mg/L1.95Lead E200.8
09/10/13 14:53 / sld1mg/L20Magnesium E200.7
D 09/10/13 14:53 / sld0.002mg/L96.3Manganese E200.7
09/12/13 01:41 / dck0.005mg/L0.030Nickel E200.8
09/10/13 14:53 / sld1mg/LNDPotassium E200.7
09/12/13 01:41 / dck0.001mg/L0.001Silver E200.8
09/10/13 14:53 / sld1mg/L5Sodium E200.7
09/12/13 01:41 / dck0.0005mg/L0.0067Thallium E200.8
09/10/13 14:53 / sld0.01mg/L69.8Zinc E200.7
ReportDefinitions:
RL - Analyte reporting limit. MCL - Maximum contaminant level.
QCL - Quality control limit. ND - Not detected at the reporting limit.
D - RL increased due to sample matrix.
Page 17 of 56

LABORATORY ANALYTICAL REPORT
Client: CDM Federal Programs
Project: Barker Hughsville Pilot
Lab ID: H13090077-008
Client Sample ID 13BH-DT-PILOT-MGOH-090413
Collection Date: 09/04/13 11:45
Matrix: Aqueous
Report Date: 09/27/13
DateReceived: 09/05/13
Prepared by Helena, MT Branch
Analyses Result Units Analysis Date / ByRL Method
MCL/QCLQualifiers
PHYSICAL PROPERTIES
09/05/13 12:44 / cmm10mg/L1460Solids, Total Dissolved TDS @ 180 C A2540 C
INORGANICS
D 09/09/13 11:00 / cmm4.0mg/L220Acidity, Total as CaCO3 A2310 B
09/05/13 16:48 / cmm1mg/L8Alkalinity, Total as CaCO3 A2320 B
09/05/13 16:48 / cmm1mg/L9Bicarbonate as HCO3 A2320 B
09/05/13 16:48 / cmm1mg/LNDCarbonate as CO3 A2320 B
09/05/13 16:48 / cmm1mg/LNDHydroxide as OH A2320 B
09/09/13 17:32 / cmm1mg/L2Chloride E300.0
09/10/13 14:46 / cmm1mg/L1000Sulfate E300.0
D 09/10/13 11:03 / cmm0.2mg/L1.0Fluoride A4500-F C4
NUTRIENTS
09/05/13 17:04 / reh0.005mg/L0.185Phosphorus, Orthophosphate as P E365.1
METALS, DISSOLVED
09/11/13 00:41 / dck0.03mg/L0.21Aluminum E200.8
09/11/13 00:41 / dck0.001mg/LNDArsenic E200.8
09/11/13 00:41 / dck0.05mg/LNDBarium E200.8
09/11/13 00:41 / dck0.001mg/LNDBeryllium E200.8
09/11/13 00:41 / dck0.001mg/L0.176Cadmium E200.8
09/06/13 11:49 / sld1mg/L102Calcium E200.7
09/11/13 00:41 / dck0.005mg/LNDChromium E200.8
09/11/13 00:41 / dck0.005mg/L0.038Cobalt E200.8
09/11/13 00:41 / dck0.005mg/L0.079Copper E200.8
09/06/13 11:49 / sld0.03mg/L4.68Iron E200.7
09/11/13 00:41 / dck0.001mg/LNDLead E200.8
09/06/13 11:49 / sld1mg/L123Magnesium E200.7
D 09/06/13 11:49 / sld0.003mg/L102Manganese E200.7
09/11/13 00:41 / dck0.005mg/L0.028Nickel E200.8
09/06/13 11:49 / sld1mg/LNDPotassium E200.7
09/11/13 00:41 / dck0.001mg/LNDSilver E200.8
09/06/13 11:49 / sld1mg/L8Sodium E200.7
09/11/13 00:41 / dck0.0005mg/L0.0021Thallium E200.8
09/06/13 11:49 / sld0.01mg/L42.0Zinc E200.7
METALS, TOTAL
D 09/10/13 14:57 / sld0.06mg/L3.41Aluminum E200.7
09/12/13 01:45 / dck0.001mg/L0.034Arsenic E200.8
09/12/13 01:45 / dck0.05mg/LNDBarium E200.8
09/12/13 01:45 / dck0.001mg/L0.002Beryllium E200.8
09/12/13 01:45 / dck0.001mg/L0.161Cadmium E200.8
09/10/13 14:57 / sld1mg/L98Calcium E200.7
09/12/13 01:45 / dck0.005mg/LNDChromium E200.8
ReportDefinitions:
RL - Analyte reporting limit. MCL - Maximum contaminant level.
QCL - Quality control limit. ND - Not detected at the reporting limit.
D - RL increased due to sample matrix.
Page 18 of 56

LABORATORY ANALYTICAL REPORT
Client: CDM Federal Programs
Project: Barker Hughsville Pilot
Lab ID: H13090077-008
Client Sample ID 13BH-DT-PILOT-MGOH-090413
Collection Date: 09/04/13 11:45
Matrix: Aqueous
Report Date: 09/27/13
DateReceived: 09/05/13
Prepared by Helena, MT Branch
Analyses Result Units Analysis Date / ByRL Method
MCL/QCLQualifiers
METALS, TOTAL
09/12/13 01:45 / dck0.005mg/L0.038Cobalt E200.8
09/12/13 01:45 / dck0.005mg/L0.362Copper E200.8
09/10/13 14:57 / sld0.03mg/L36.3Iron E200.7
09/12/13 01:45 / dck0.001mg/L0.058Lead E200.8
09/10/13 14:57 / sld1mg/L120Magnesium E200.7
D 09/10/13 14:57 / sld0.003mg/L98.8Manganese E200.7
09/12/13 01:45 / dck0.005mg/L0.027Nickel E200.8
09/10/13 14:57 / sld1mg/LNDPotassium E200.7
09/12/13 01:45 / dck0.001mg/LNDSilver E200.8
09/10/13 14:57 / sld1mg/L6Sodium E200.7
09/12/13 01:45 / dck0.0005mg/L0.0022Thallium E200.8
09/10/13 14:57 / sld0.01mg/L44.4Zinc E200.7
ReportDefinitions:
RL - Analyte reporting limit. MCL - Maximum contaminant level.
QCL - Quality control limit. ND - Not detected at the reporting limit.
D - RL increased due to sample matrix.
Page 19 of 56
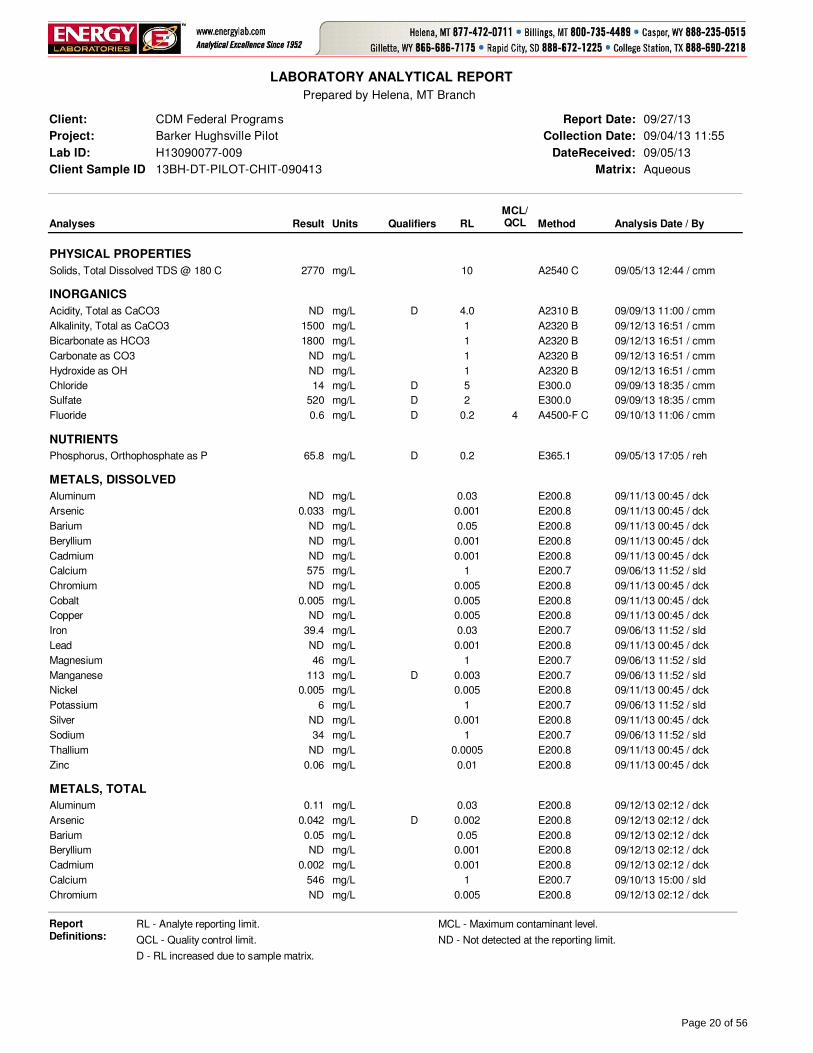
LABORATORY ANALYTICAL REPORT
Client: CDM Federal Programs
Project: Barker Hughsville Pilot
Lab ID: H13090077-009
Client Sample ID 13BH-DT-PILOT-CHIT-090413
Collection Date: 09/04/13 11:55
Matrix: Aqueous
Report Date: 09/27/13
DateReceived: 09/05/13
Prepared by Helena, MT Branch
Analyses Result Units Analysis Date / ByRL Method
MCL/QCLQualifiers
PHYSICAL PROPERTIES
09/05/13 12:44 / cmm10mg/L2770Solids, Total Dissolved TDS @ 180 C A2540 C
INORGANICS
D 09/09/13 11:00 / cmm4.0mg/LNDAcidity, Total as CaCO3 A2310 B
09/12/13 16:51 / cmm1mg/L1500Alkalinity, Total as CaCO3 A2320 B
09/12/13 16:51 / cmm1mg/L1800Bicarbonate as HCO3 A2320 B
09/12/13 16:51 / cmm1mg/LNDCarbonate as CO3 A2320 B
09/12/13 16:51 / cmm1mg/LNDHydroxide as OH A2320 B
D 09/09/13 18:35 / cmm5mg/L14Chloride E300.0
D 09/09/13 18:35 / cmm2mg/L520Sulfate E300.0
D 09/10/13 11:06 / cmm0.2mg/L0.6Fluoride A4500-F C4
NUTRIENTS
D 09/05/13 17:05 / reh0.2mg/L65.8Phosphorus, Orthophosphate as P E365.1
METALS, DISSOLVED
09/11/13 00:45 / dck0.03mg/LNDAluminum E200.8
09/11/13 00:45 / dck0.001mg/L0.033Arsenic E200.8
09/11/13 00:45 / dck0.05mg/LNDBarium E200.8
09/11/13 00:45 / dck0.001mg/LNDBeryllium E200.8
09/11/13 00:45 / dck0.001mg/LNDCadmium E200.8
09/06/13 11:52 / sld1mg/L575Calcium E200.7
09/11/13 00:45 / dck0.005mg/LNDChromium E200.8
09/11/13 00:45 / dck0.005mg/L0.005Cobalt E200.8
09/11/13 00:45 / dck0.005mg/LNDCopper E200.8
09/06/13 11:52 / sld0.03mg/L39.4Iron E200.7
09/11/13 00:45 / dck0.001mg/LNDLead E200.8
09/06/13 11:52 / sld1mg/L46Magnesium E200.7
D 09/06/13 11:52 / sld0.003mg/L113Manganese E200.7
09/11/13 00:45 / dck0.005mg/L0.005Nickel E200.8
09/06/13 11:52 / sld1mg/L6Potassium E200.7
09/11/13 00:45 / dck0.001mg/LNDSilver E200.8
09/06/13 11:52 / sld1mg/L34Sodium E200.7
09/11/13 00:45 / dck0.0005mg/LNDThallium E200.8
09/11/13 00:45 / dck0.01mg/L0.06Zinc E200.8
METALS, TOTAL
09/12/13 02:12 / dck0.03mg/L0.11Aluminum E200.8
D 09/12/13 02:12 / dck0.002mg/L0.042Arsenic E200.8
09/12/13 02:12 / dck0.05mg/L0.05Barium E200.8
09/12/13 02:12 / dck0.001mg/LNDBeryllium E200.8
09/12/13 02:12 / dck0.001mg/L0.002Cadmium E200.8
09/10/13 15:00 / sld1mg/L546Calcium E200.7
09/12/13 02:12 / dck0.005mg/LNDChromium E200.8
ReportDefinitions:
RL - Analyte reporting limit. MCL - Maximum contaminant level.
QCL - Quality control limit. ND - Not detected at the reporting limit.
D - RL increased due to sample matrix.
Page 20 of 56

LABORATORY ANALYTICAL REPORT
Client: CDM Federal Programs
Project: Barker Hughsville Pilot
Lab ID: H13090077-009
Client Sample ID 13BH-DT-PILOT-CHIT-090413
Collection Date: 09/04/13 11:55
Matrix: Aqueous
Report Date: 09/27/13
DateReceived: 09/05/13
Prepared by Helena, MT Branch
Analyses Result Units Analysis Date / ByRL Method
MCL/QCLQualifiers
METALS, TOTAL
09/12/13 02:12 / dck0.005mg/L0.008Cobalt E200.8
09/12/13 02:12 / dck0.005mg/L0.021Copper E200.8
D 09/10/13 15:00 / sld0.05mg/L45.3Iron E200.7
09/12/13 02:12 / dck0.001mg/L0.002Lead E200.8
09/10/13 15:00 / sld1mg/L43Magnesium E200.7
D 09/10/13 15:00 / sld0.006mg/L109Manganese E200.7
09/12/13 02:12 / dck0.005mg/L0.008Nickel E200.8
09/10/13 15:00 / sld1mg/L6Potassium E200.7
09/12/13 02:12 / dck0.001mg/LNDSilver E200.8
09/10/13 15:00 / sld1mg/L31Sodium E200.7
09/12/13 02:12 / dck0.0005mg/LNDThallium E200.8
09/12/13 02:12 / dck0.01mg/L0.66Zinc E200.8
ReportDefinitions:
RL - Analyte reporting limit. MCL - Maximum contaminant level.
QCL - Quality control limit. ND - Not detected at the reporting limit.
D - RL increased due to sample matrix.
Page 21 of 56
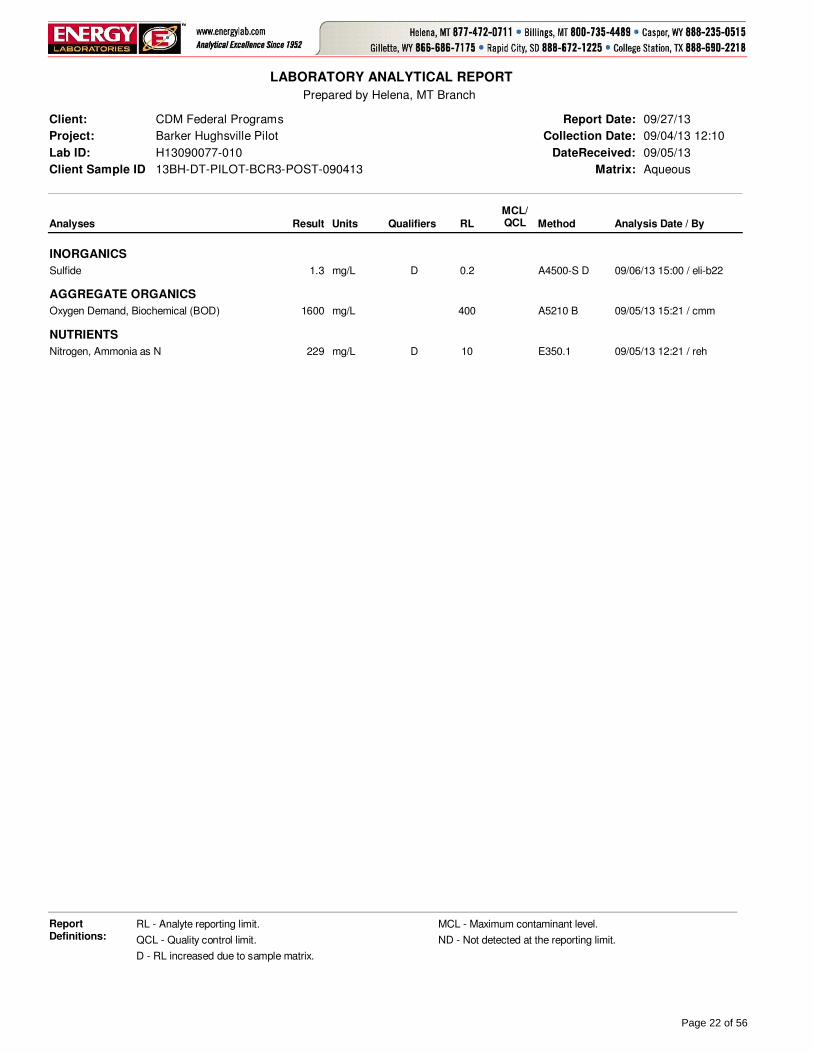
LABORATORY ANALYTICAL REPORT
Client: CDM Federal Programs
Project: Barker Hughsville Pilot
Lab ID: H13090077-010
Client Sample ID 13BH-DT-PILOT-BCR3-POST-090413
Collection Date: 09/04/13 12:10
Matrix: Aqueous
Report Date: 09/27/13
DateReceived: 09/05/13
Prepared by Helena, MT Branch
Analyses Result Units Analysis Date / ByRL Method
MCL/QCLQualifiers
INORGANICS
D 09/06/13 15:00 / eli-b220.2mg/L1.3Sulfide A4500-S D
AGGREGATE ORGANICS
09/05/13 15:21 / cmm400mg/L1600Oxygen Demand, Biochemical (BOD) A5210 B
NUTRIENTS
D 09/05/13 12:21 / reh10mg/L229Nitrogen, Ammonia as N E350.1
ReportDefinitions:
RL - Analyte reporting limit. MCL - Maximum contaminant level.
QCL - Quality control limit. ND - Not detected at the reporting limit.
D - RL increased due to sample matrix.
Page 22 of 56

Project: Barker Hughsville Pilot
Client: CDM Federal Programs
Work Order: H13090077
QA/QC Summary Report
09/27/13Report Date:
Analyte Result %REC RPDLow Limit High Limit RPDLimitRLUnits QualCount
Prepared by Helena, MT Branch
Method: A2310 B Batch: H13090077-001A
Sample ID: H13090077-009ADUP 09/09/13 11:00Sample Duplicate Run: MISC WC_130909C
Acidity, Total as CaCO3 204.0ND mg/L
Sample ID: LCS1309091100 09/09/13 11:00Laboratory Control Sample Run: MISC WC_130909C
Acidity, Total as CaCO3 97 90 1104.0750 mg/L
Sample ID: MBLK1309091100 09/09/13 11:00Method Blank Run: MISC WC_130909C
Acidity, Total as CaCO3 3ND mg/L
Qualifiers:
RL - Analyte reporting limit. ND - Not detected at the reporting limit.
Page 23 of 56

Project: Barker Hughsville Pilot
Client: CDM Federal Programs
Work Order: H13090077
QA/QC Summary Report
09/27/13Report Date:
Analyte Result %REC RPDLow Limit High Limit RPDLimitRLUnits QualCount
Prepared by Helena, MT Branch
Method: A2320 B Batch: R91062
Sample ID: MBLK 09/05/13 15:04Method Blank Run: MAN-TECH_130905B
Alkalinity, Total as CaCO3 2ND mg/L
Sample ID: LCS-08282013 09/05/13 15:12Laboratory Control Sample Run: MAN-TECH_130905B
Alkalinity, Total as CaCO3 104 90 1104.0620 mg/L
Sample ID: H13080533-002ADUP 09/05/13 15:41Sample Duplicate Run: MAN-TECH_130905B3
Alkalinity, Total as CaCO3 104.0 2.8240 mg/L
Bicarbonate as HCO3 104.0 2.8290 mg/L
Carbonate as CO3 104.0ND mg/L
Sample ID: H13080555-001AMS 09/05/13 15:59Sample Matrix Spike Run: MAN-TECH_130905B
Alkalinity, Total as CaCO3 105 80 1204.01100 mg/L
Sample ID: H13090077-009ADUP 09/05/13 17:12Sample Duplicate Run: MAN-TECH_130905B3
Alkalinity, Total as CaCO3 104.0 0.41600 mg/L
Bicarbonate as HCO3 104.0 0.41900 mg/L
Carbonate as CO3 104.0ND mg/L
Method: A2320 B Batch: R91272
Sample ID: MBLK 09/12/13 16:31Method Blank Run: MAN-TECH_130912A
Alkalinity, Total as CaCO3 2ND mg/L
Sample ID: LCS-08282013 09/12/13 16:40Laboratory Control Sample Run: MAN-TECH_130912A
Alkalinity, Total as CaCO3 103 90 1104.0620 mg/L
Sample ID: H13090192-006ADUP 09/12/13 17:45Sample Duplicate Run: MAN-TECH_130912A3
Alkalinity, Total as CaCO3 104.0 0.4110 mg/L
Bicarbonate as HCO3 104.0 0.4130 mg/L
Carbonate as CO3 104.0ND mg/L
Sample ID: H13090192-007AMS 09/12/13 18:01Sample Matrix Spike Run: MAN-TECH_130912A
Alkalinity, Total as CaCO3 105 80 1204.0740 mg/L
Qualifiers:
RL - Analyte reporting limit. ND - Not detected at the reporting limit.
Page 24 of 56

Project: Barker Hughsville Pilot
Client: CDM Federal Programs
Work Order: H13090077
QA/QC Summary Report
09/27/13Report Date:
Analyte Result %REC RPDLow Limit High Limit RPDLimitRLUnits QualCount
Prepared by Helena, MT Branch
Method: A2540 C Batch: TDS130905A
Sample ID: MB-1_130905A 09/05/13 12:42Method Blank Run: ACCU-124 (14410200)_130905
Solids, Total Dissolved TDS @ 180 C 110 mg/L
Sample ID: LCS-2_130905A 09/05/13 12:42Laboratory Control Sample Run: ACCU-124 (14410200)_130905
Solids, Total Dissolved TDS @ 180 C 95 90 110101910 mg/L
Sample ID: H13090066-001A DUP 09/05/13 12:42Sample Duplicate Run: ACCU-124 (14410200)_130905
Solids, Total Dissolved TDS @ 180 C 510 2.75930 mg/L
Sample ID: H13090077-001A MS 09/05/13 12:43Sample Matrix Spike Run: ACCU-124 (14410200)_130905
Solids, Total Dissolved TDS @ 180 C 97 80 120106520 mg/L
Sample ID: H13090083-001A DUP 09/05/13 14:59Sample Duplicate Run: ACCU-124 (14410200)_130905
Solids, Total Dissolved TDS @ 180 C 510 2.1193 mg/L
Qualifiers:
RL - Analyte reporting limit. ND - Not detected at the reporting limit.
Page 25 of 56

Project: Barker Hughsville Pilot
Client: CDM Federal Programs
Work Order: H13090077
QA/QC Summary Report
09/27/13Report Date:
Analyte Result %REC RPDLow Limit High Limit RPDLimitRLUnits QualCount
Prepared by Helena, MT Branch
Method: A4500-F C Analytical Run: PH_130910A
Sample ID: ICV1_130910A 09/10/13 10:41Initial Calibration Verification Standard
Fluoride 90 90 1100.10.7 mg/L
Sample ID: CCV2_130910A 09/10/13 11:05Continuing Calibration Verification Standard
Fluoride 90 90 1100.10.2 mg/L
Method: A4500-F C Batch: 130910A-F-ISE-W
Sample ID: MBLK1_130910A 09/10/13 10:40Method Blank Run: PH_130910A
Fluoride 0.0050.010 mg/L
Sample ID: LFB1_130910A 09/10/13 10:41Laboratory Fortified Blank Run: PH_130910A
Fluoride 90 90 1100.10.5 mg/L
Sample ID: H13090077-008AMS 09/10/13 11:03Sample Matrix Spike Run: PH_130910A
Fluoride 91 85 1150.21.9 mg/L
Sample ID: H13090077-008AMSD 09/10/13 11:04Sample Matrix Spike Duplicate Run: PH_130910A
Fluoride 90 85 115 100.2 0.51.9 mg/L
Sample ID: H13090077-009AMS 09/10/13 11:06Sample Matrix Spike Run: PH_130910A
Fluoride 90 85 1150.21.5 mg/L
Sample ID: H13090077-009AMSD 09/10/13 11:07Sample Matrix Spike Duplicate Run: PH_130910A
Fluoride 88 85 115 100.2 1.21.4 mg/L
Qualifiers:
RL - Analyte reporting limit. ND - Not detected at the reporting limit.
Page 26 of 56

Project: Barker Hughsville Pilot
Client: CDM Federal Programs
Work Order: H13090077
QA/QC Summary Report
09/27/13Report Date:
Analyte Result %REC RPDLow Limit High Limit RPDLimitRLUnits QualCount
Prepared by Helena, MT Branch
Method: A4500-S D Batch: B_R211270
Sample ID: MB-R211270 09/06/13 15:00Method Blank Run: SUB-B211270
Sulfide 0.002ND mg/L
Sample ID: LCS-R211270 09/06/13 15:00Laboratory Control Sample Run: SUB-B211270
Sulfide 111 70 1300.0400.237 mg/L
Sample ID: B13090433-002GMS 09/06/13 15:00Sample Matrix Spike Run: SUB-B211270
Sulfide 105 70 1300.0400.225 mg/L
Sample ID: B13090433-002GMSD 09/06/13 15:00Sample Matrix Spike Duplicate Run: SUB-B211270
Sulfide 105 70 130 200.040 0.10.225 mg/L
Qualifiers:
RL - Analyte reporting limit. ND - Not detected at the reporting limit.
Page 27 of 56

Project: Barker Hughsville Pilot
Client: CDM Federal Programs
Work Order: H13090077
QA/QC Summary Report
09/27/13Report Date:
Analyte Result %REC RPDLow Limit High Limit RPDLimitRLUnits QualCount
Prepared by Helena, MT Branch
Method: A4500-S F Batch: B_R211271
Sample ID: MB-R211271 09/06/13 14:45Method Blank Run: SUB-B211271
Sulfide 0.5ND mg/L
Sample ID: LCS-R211271 09/06/13 14:45Laboratory Control Sample Run: SUB-B211271
Sulfide 101 70 1301.024.5 mg/L
Sample ID: B13090499-001FMS 09/06/13 14:45Sample Matrix Spike Run: SUB-B211271
Sulfide 102 80 1201.024.7 mg/L
Sample ID: B13090499-001FMSD 09/06/13 14:45Sample Matrix Spike Duplicate Run: SUB-B211271
Sulfide 102 80 120 201.0 0.324.6 mg/L
Qualifiers:
RL - Analyte reporting limit. ND - Not detected at the reporting limit.
Page 28 of 56

Project: Barker Hughsville Pilot
Client: CDM Federal Programs
Work Order: H13090077
QA/QC Summary Report
09/27/13Report Date:
Analyte Result %REC RPDLow Limit High Limit RPDLimitRLUnits QualCount
Prepared by Helena, MT Branch
Method: A5210 B Batch: 130905_1_BOD5-W
Sample ID: Dil-H201_130905 09/05/13 15:08Dilution Water Blank Run: MISC WC_130905A
Oxygen Demand, Biochemical (BOD) 0 0.22.00.10 mg/L
Sample ID: GGA1_130905 09/05/13 15:12Laboratory Control Sample Run: MISC WC_130905A
Oxygen Demand, Biochemical (BOD) 96 85 11561190 mg/L
Sample ID: H13090081-001ADUP 09/05/13 15:26Sample Duplicate Run: MISC WC_130905A
Oxygen Demand, Biochemical (BOD) 90 110 10180 3.0610 mg/L
Qualifiers:
RL - Analyte reporting limit. ND - Not detected at the reporting limit.
Page 29 of 56

Project: Barker Hughsville Pilot
Client: CDM Federal Programs
Work Order: H13090077
QA/QC Summary Report
09/27/13Report Date:
Analyte Result %REC RPDLow Limit High Limit RPDLimitRLUnits QualCount
Prepared by Helena, MT Branch
Method: E200.7 Analytical Run: ICP2-HE_130906B
Sample ID: ICV 09/06/13 09:46Initial Calibration Verification Standard8
Aluminum 101 95 1050.104.05 mg/L
Calcium 101 95 1051.040.4 mg/L
Iron 101 95 1050.0304.03 mg/L
Magnesium 102 95 1051.040.8 mg/L
Manganese 99 95 1050.0103.96 mg/L
Potassium 101 95 1051.040.3 mg/L
Sodium 101 95 1051.040.3 mg/L
Zinc 100 95 1050.0100.798 mg/L
Sample ID: CCV-1 09/06/13 09:50Continuing Calibration Verification Standard8
Aluminum 101 95 1050.102.53 mg/L
Calcium 102 95 1051.025.5 mg/L
Iron 101 95 1050.0302.54 mg/L
Magnesium 102 95 1051.025.4 mg/L
Manganese 100 95 1050.0102.49 mg/L
Potassium 101 95 1051.025.2 mg/L
Sodium 101 95 1051.025.2 mg/L
Zinc 102 95 1050.0102.54 mg/L
Sample ID: ICSA 09/06/13 10:01Interference Check Sample A8
Aluminum 104 80 1200.10521 mg/L
Calcium 96 80 1201.0480 mg/L
Iron 96 80 1200.030192 mg/L
Magnesium 104 80 1201.0518 mg/L
Manganese 0 00.0100.00616 mg/L
Potassium 0 01.0-0.0709 mg/L
Sodium 0 01.00.0490 mg/L
Zinc 0 00.0100.00710 mg/L
Sample ID: ICSAB 09/06/13 10:05Interference Check Sample AB8
Aluminum 105 80 1200.10525 mg/L
Calcium 96 80 1201.0478 mg/L
Iron 96 80 1200.030192 mg/L
Magnesium 104 80 1201.0521 mg/L
Manganese 98 80 1200.0100.489 mg/L
Potassium 111 80 1201.022.2 mg/L
Sodium 111 80 1201.022.1 mg/L
Zinc 101 80 1200.0101.01 mg/L
Sample ID: CCV 09/06/13 10:35Continuing Calibration Verification Standard8
Aluminum 102 90 1100.102.55 mg/L
Calcium 101 90 1101.025.2 mg/L
Iron 101 90 1100.0302.53 mg/L
Magnesium 101 90 1101.025.3 mg/L
Manganese 99 90 1100.0102.46 mg/L
Qualifiers:
RL - Analyte reporting limit. ND - Not detected at the reporting limit.
Page 30 of 56

Project: Barker Hughsville Pilot
Client: CDM Federal Programs
Work Order: H13090077
QA/QC Summary Report
09/27/13Report Date:
Analyte Result %REC RPDLow Limit High Limit RPDLimitRLUnits QualCount
Prepared by Helena, MT Branch
Method: E200.7 Analytical Run: ICP2-HE_130906B
Sample ID: CCV 09/06/13 10:35Continuing Calibration Verification Standard8
Potassium 102 90 1101.025.4 mg/L
Sodium 101 90 1101.025.2 mg/L
Zinc 99 90 1100.0102.48 mg/L
Sample ID: CCV 09/06/13 11:19Continuing Calibration Verification Standard8
Aluminum 101 90 1100.102.53 mg/L
Calcium 101 90 1101.025.2 mg/L
Iron 100 90 1100.0302.50 mg/L
Magnesium 102 90 1101.025.4 mg/L
Manganese 98 90 1100.0102.46 mg/L
Potassium 101 90 1101.025.1 mg/L
Sodium 100 90 1101.025.0 mg/L
Zinc 106 90 1100.0102.66 mg/L
Method: E200.7 Batch: R91111
Sample ID: ICB 09/06/13 10:13Method Blank Run: ICP2-HE_130906B8
Aluminum 0.009ND mg/L
Calcium 0.030.04 mg/L
Iron 0.005ND mg/L
Magnesium 0.02ND mg/L
Manganese 0.0005ND mg/L
Potassium 0.03ND mg/L
Sodium 0.03ND mg/L
Zinc 0.0010.002 mg/L
Sample ID: LFB 09/06/13 10:17Laboratory Fortified Blank Run: ICP2-HE_130906B8
Aluminum 101 85 1150.105.05 mg/L
Calcium 99 85 1151.049.6 mg/L
Iron 100 85 1150.0304.98 mg/L
Magnesium 100 85 1151.050.2 mg/L
Manganese 98 85 1150.0104.89 mg/L
Potassium 99 85 1151.049.6 mg/L
Sodium 99 85 1151.049.5 mg/L
Zinc 100 85 1150.0101.00 mg/L
Sample ID: H13080497-002BMS2 09/06/13 11:04Sample Matrix Spike Run: ICP2-HE_130906B8
Aluminum 102 70 1300.09351.2 mg/L
Calcium 98 70 1301.0821 mg/L
Iron 101 70 1300.04850.3 mg/L
Magnesium 101 70 1301.0756 mg/L
Manganese 98 70 1300.005449.5 mg/L
Potassium 103 70 1301.0518 mg/L
Sodium 70 1301.04870 mg/L A
Zinc 102 70 1300.01410.2 mg/L
Qualifiers:
RL - Analyte reporting limit. A - The analyte level was greater than four times the spike level. In accordance with the method % recovery is not calculated.
ND - Not detected at the reporting limit.
Page 31 of 56

Project: Barker Hughsville Pilot
Client: CDM Federal Programs
Work Order: H13090077
QA/QC Summary Report
09/27/13Report Date:
Analyte Result %REC RPDLow Limit High Limit RPDLimitRLUnits QualCount
Prepared by Helena, MT Branch
Method: E200.7 Batch: R91111
Sample ID: H13080497-002BMSD2 09/06/13 11:08Sample Matrix Spike Duplicate Run: ICP2-HE_130906B8
Aluminum 103 70 130 200.093 1.251.8 mg/L
Calcium 100 70 130 201.0 1.0829 mg/L
Iron 101 70 130 200.048 0.950.7 mg/L
Magnesium 102 70 130 201.0 1.2765 mg/L
Manganese 99 70 130 200.0054 1.049.9 mg/L
Potassium 102 70 130 201.0 1.7509 mg/L
Sodium 70 130 201.0 0.44890 mg/L A
Zinc 102 70 130 200.014 0.510.2 mg/L
Sample ID: H13090077-009BMS2 09/06/13 12:00Sample Matrix Spike Run: ICP2-HE_130906B8
Aluminum 104 70 1300.04626.1 mg/L
Calcium 88 70 1301.0795 mg/L
Iron 93 70 1300.03062.5 mg/L
Magnesium 100 70 1301.0297 mg/L
Manganese 70 1300.0027132 mg/L A
Potassium 99 70 1301.0253 mg/L
Sodium 98 70 1301.0278 mg/L
Zinc 101 70 1300.0105.07 mg/L
Sample ID: H13090077-009BMSD2 09/06/13 12:10Sample Matrix Spike Duplicate Run: ICP2-HE_130906B8
Aluminum 105 70 130 200.046 0.426.2 mg/L
Calcium 93 70 130 201.0 1.4806 mg/L
Iron 95 70 130 200.030 1.063.2 mg/L
Magnesium 101 70 130 201.0 0.8299 mg/L
Manganese 70 130 200.0027 1.3134 mg/L A
Potassium 103 70 130 201.0 3.9263 mg/L
Sodium 102 70 130 201.0 4.0290 mg/L
Zinc 103 70 130 200.010 2.55.20 mg/L
Qualifiers:
RL - Analyte reporting limit. A - The analyte level was greater than four times the spike level. In accordance with the method % recovery is not calculated.
ND - Not detected at the reporting limit.
Page 32 of 56

Project: Barker Hughsville Pilot
Client: CDM Federal Programs
Work Order: H13090077
QA/QC Summary Report
09/27/13Report Date:
Analyte Result %REC RPDLow Limit High Limit RPDLimitRLUnits QualCount
Prepared by Helena, MT Branch
Method: E200.7 Analytical Run: ICP2-HE_130910C
Sample ID: ICV 09/10/13 13:32Initial Calibration Verification Standard8
Aluminum 101 95 1050.104.05 mg/L
Calcium 100 95 1051.039.9 mg/L
Iron 99 95 1050.0303.98 mg/L
Magnesium 101 95 1051.040.3 mg/L
Manganese 99 95 1050.0103.95 mg/L
Potassium 99 95 1051.039.6 mg/L
Sodium 99 95 1051.039.8 mg/L
Zinc 100 95 1050.0100.803 mg/L
Sample ID: CCV-1 09/10/13 13:35Continuing Calibration Verification Standard8
Aluminum 100 95 1050.102.51 mg/L
Calcium 101 95 1051.025.2 mg/L
Iron 100 95 1050.0302.51 mg/L
Magnesium 100 95 1051.024.9 mg/L
Manganese 99 95 1050.0102.47 mg/L
Potassium 97 95 1051.024.3 mg/L
Sodium 98 95 1051.024.4 mg/L
Zinc 103 95 1050.0102.57 mg/L
Sample ID: ICSA 09/10/13 13:46Interference Check Sample A8
Aluminum 103 80 1200.10515 mg/L
Calcium 95 80 1201.0474 mg/L
Iron 94 80 1200.030188 mg/L
Magnesium 102 80 1201.0508 mg/L
Manganese 0 00.0100.00528 mg/L
Potassium 0 01.0-0.0813 mg/L
Sodium 0 01.00.0226 mg/L
Zinc 0 00.0100.00693 mg/L
Sample ID: ICSAB 09/10/13 13:50Interference Check Sample AB8
Aluminum 103 80 1200.10513 mg/L
Calcium 94 80 1201.0468 mg/L
Iron 94 80 1200.030187 mg/L
Magnesium 101 80 1201.0505 mg/L
Manganese 97 80 1200.0100.484 mg/L
Potassium 109 80 1201.021.9 mg/L
Sodium 110 80 1201.022.0 mg/L
Zinc 101 80 1200.0101.01 mg/L
Sample ID: CCV 09/10/13 14:20Continuing Calibration Verification Standard8
Aluminum 98 90 1100.102.44 mg/L
Calcium 98 90 1101.024.4 mg/L
Iron 98 90 1100.0302.45 mg/L
Magnesium 98 90 1101.024.4 mg/L
Manganese 96 90 1100.0102.39 mg/L
Qualifiers:
RL - Analyte reporting limit. ND - Not detected at the reporting limit.
Page 33 of 56

Project: Barker Hughsville Pilot
Client: CDM Federal Programs
Work Order: H13090077
QA/QC Summary Report
09/27/13Report Date:
Analyte Result %REC RPDLow Limit High Limit RPDLimitRLUnits QualCount
Prepared by Helena, MT Branch
Method: E200.7 Analytical Run: ICP2-HE_130910C
Sample ID: CCV 09/10/13 14:20Continuing Calibration Verification Standard8
Potassium 100 90 1101.025.1 mg/L
Sodium 100 90 1101.025.1 mg/L
Zinc 95 90 1100.0102.38 mg/L
Method: E200.7 Batch: 21587
Sample ID: MB-21587 09/10/13 14:05Method Blank Run: ICP2-HE_130910C8
Aluminum 0.010.02 mg/L
Calcium 0.060.3 mg/L
Iron 0.0050.009 mg/L
Magnesium 0.006ND mg/L
Manganese 0.0006ND mg/L
Potassium 0.03ND mg/L
Sodium 0.03ND mg/L
Zinc 0.0010.002 mg/L
Sample ID: LCS-21587 09/10/13 14:09Laboratory Control Sample Run: ICP2-HE_130910C8
Aluminum 103 85 1150.0302.59 mg/L
Calcium 100 85 1151.025.2 mg/L
Iron 99 85 1150.0302.49 mg/L
Magnesium 101 85 1151.025.3 mg/L
Manganese 98 85 1150.00102.46 mg/L
Potassium 102 85 1151.025.4 mg/L
Sodium 101 85 1151.025.3 mg/L
Zinc 101 85 1150.0100.505 mg/L
Sample ID: H13090077-001CMS3 09/10/13 14:28Sample Matrix Spike Run: ICP2-HE_130910C8
Aluminum 102 70 1300.05812.9 mg/L
Calcium 70 1301.0693 mg/L A
Iron 99 70 1300.03012.9 mg/L
Magnesium 98 70 1301.0167 mg/L
Manganese 70 1300.003172.2 mg/L A
Potassium 101 70 1301.0133 mg/L
Sodium 101 70 1301.0151 mg/L
Zinc 102 70 1300.0102.57 mg/L
Sample ID: H13090077-001CMSD3 09/10/13 14:31Sample Matrix Spike Duplicate Run: ICP2-HE_130910C8
Aluminum 100 70 130 200.058 1.512.7 mg/L
Calcium 70 130 201.0 1.3683 mg/L A
Iron 100 70 130 200.030 0.713.0 mg/L
Magnesium 97 70 130 201.0 1.2165 mg/L
Manganese 70 130 200.0031 1.671.0 mg/L A
Potassium 101 70 130 201.0 0.7134 mg/L
Sodium 101 70 130 201.0 0.3151 mg/L
Zinc 106 70 130 200.010 3.92.67 mg/L
Qualifiers:
RL - Analyte reporting limit. A - The analyte level was greater than four times the spike level. In accordance with the method % recovery is not calculated.
ND - Not detected at the reporting limit.
Page 34 of 56

Project: Barker Hughsville Pilot
Client: CDM Federal Programs
Work Order: H13090077
QA/QC Summary Report
09/27/13Report Date:
Analyte Result %REC RPDLow Limit High Limit RPDLimitRLUnits QualCount
Prepared by Helena, MT Branch
Method: E200.7 Batch: 21587
Sample ID: H13090086-001CMS3 09/10/13 15:23Sample Matrix Spike Run: ICP2-HE_130910C8
Aluminum 104 70 1300.0302.65 mg/L
Calcium 96 70 1301.057.6 mg/L
Iron 96 70 1300.0302.66 mg/L
Magnesium 98 70 1301.033.2 mg/L
Manganese 95 70 1300.00102.57 mg/L
Potassium 100 70 1301.026.9 mg/L
Sodium 100 70 1301.031.0 mg/L
Zinc 102 70 1300.0100.772 mg/L
Sample ID: H13090086-001CMSD3 09/10/13 15:26Sample Matrix Spike Duplicate Run: ICP2-HE_130910C8
Aluminum 100 70 130 200.030 3.92.55 mg/L
Calcium 95 70 130 201.0 0.557.3 mg/L
Iron 97 70 130 200.030 0.92.69 mg/L
Magnesium 97 70 130 201.0 0.632.9 mg/L
Manganese 96 70 130 200.0010 0.62.59 mg/L
Potassium 100 70 130 201.0 0.327.0 mg/L
Sodium 100 70 130 201.0 0.331.1 mg/L
Zinc 96 70 130 200.010 3.90.743 mg/L
Method: E200.7 Analytical Run: ICP2-HE_130911A
Sample ID: ICV 09/11/13 09:50Initial Calibration Verification Standard
Iron 101 95 1050.0304.04 mg/L
Sample ID: CCV-1 09/11/13 09:54Continuing Calibration Verification Standard
Iron 102 95 1050.0302.54 mg/L
Sample ID: ICSA 09/11/13 10:05Interference Check Sample A
Iron 97 80 1200.030193 mg/L
Sample ID: ICSAB 09/11/13 10:09Interference Check Sample AB
Iron 96 80 1200.030193 mg/L
Sample ID: CCV 09/11/13 10:39Continuing Calibration Verification Standard
Iron 101 90 1100.0302.54 mg/L
Method: E200.7 Batch: 21587
Sample ID: MB-21587 09/11/13 10:46Method Blank Run: ICP2-HE_130911A8
Aluminum 0.01ND mg/L
Calcium 0.060.07 mg/L
Iron 0.005ND mg/L
Magnesium 0.006ND mg/L
Manganese 0.0006ND mg/L
Potassium 0.03ND mg/L
Sodium 0.030.08 mg/L
Zinc 0.0010.003 mg/L
Qualifiers:
RL - Analyte reporting limit. ND - Not detected at the reporting limit.
Page 35 of 56

Project: Barker Hughsville Pilot
Client: CDM Federal Programs
Work Order: H13090077
QA/QC Summary Report
09/27/13Report Date:
Analyte Result %REC RPDLow Limit High Limit RPDLimitRLUnits QualCount
Prepared by Helena, MT Branch
Method: E200.8 Analytical Run: ICPMS204-B_130910B
Sample ID: ICV STD 09/10/13 13:30Initial Calibration Verification Standard14
Aluminum 102 90 1100.100.305 mg/L
Arsenic 101 90 1100.00500.0607 mg/L
Barium 102 90 1100.100.0610 mg/L
Beryllium 105 90 1100.00100.0314 mg/L
Cadmium 109 90 1100.00100.0326 mg/L
Chromium 103 90 1100.0100.0620 mg/L
Cobalt 104 90 1100.0100.0623 mg/L
Copper 104 90 1100.0100.0622 mg/L
Iron 107 90 1100.0300.321 mg/L
Lead 104 90 1100.0100.0623 mg/L
Nickel 104 90 1100.0100.0624 mg/L
Silver 104 90 1100.00500.0313 mg/L
Thallium 100 90 1100.100.0601 mg/L
Zinc 105 90 1100.0100.0631 mg/L
Sample ID: ICSA 09/10/13 13:34Interference Check Sample A14
Aluminum 99 70 1300.1039.6 mg/L
Arsenic 0.00500.000214 mg/L
Barium 0.100.000129 mg/L
Beryllium 0.00101.20E-05 mg/L
Cadmium 0.00100.00165 mg/L
Chromium 0.0100.00118 mg/L
Cobalt 0.0100.000406 mg/L
Copper 0.0100.000306 mg/L
Iron 94 70 1300.03094.1 mg/L
Lead 0.0100.000262 mg/L
Nickel 0.0100.000704 mg/L
Silver 0.00500.000101 mg/L
Thallium 0.109.80E-05 mg/L
Zinc 0.0100.00111 mg/L
Sample ID: ICSAB 09/10/13 13:39Interference Check Sample AB14
Aluminum 102 70 1300.1040.6 mg/L
Arsenic 107 70 1300.00500.0107 mg/L
Barium 0 00.100.000136 mg/L
Beryllium 0 00.00102.00E-06 mg/L
Cadmium 115 70 1300.00100.0115 mg/L
Chromium 113 70 1300.0100.0225 mg/L
Cobalt 106 70 1300.0100.0211 mg/L
Copper 103 70 1300.0100.0206 mg/L
Iron 97 70 1300.03097.3 mg/L
Lead 0 00.0100.000187 mg/L
Nickel 108 70 1300.0100.0216 mg/L
Silver 100 70 1300.00500.0200 mg/L
Thallium 0 00.104.90E-05 mg/L
Qualifiers:
RL - Analyte reporting limit. ND - Not detected at the reporting limit.
Page 36 of 56

Project: Barker Hughsville Pilot
Client: CDM Federal Programs
Work Order: H13090077
QA/QC Summary Report
09/27/13Report Date:
Analyte Result %REC RPDLow Limit High Limit RPDLimitRLUnits QualCount
Prepared by Helena, MT Branch
Method: E200.8 Analytical Run: ICPMS204-B_130910B
Sample ID: ICSAB 09/10/13 13:39Interference Check Sample AB14
Zinc 113 70 1300.0100.0113 mg/L
Sample ID: ICV STD 09/11/13 22:52Initial Calibration Verification Standard14
Aluminum 98 90 1100.100.294 mg/L
Arsenic 103 90 1100.00500.0618 mg/L
Barium 102 90 1100.100.0615 mg/L
Beryllium 104 90 1100.00100.0312 mg/L
Cadmium 109 90 1100.00100.0328 mg/L
Chromium 104 90 1100.0100.0623 mg/L
Cobalt 103 90 1100.0100.0620 mg/L
Copper 106 90 1100.0100.0633 mg/L
Iron 107 90 1100.0300.320 mg/L
Lead 106 90 1100.0100.0636 mg/L
Nickel 105 90 1100.0100.0628 mg/L
Silver 103 90 1100.00500.0308 mg/L
Thallium 102 90 1100.100.0615 mg/L
Zinc 107 90 1100.0100.0641 mg/L
Sample ID: ICSA 09/11/13 22:56Interference Check Sample A14
Aluminum 93 70 1300.1037.0 mg/L
Arsenic 0.00500.000209 mg/L
Barium 0.100.000155 mg/L
Beryllium 0.00101.00E-05 mg/L
Cadmium 0.00100.00175 mg/L
Chromium 0.0100.00132 mg/L
Cobalt 0.0100.000494 mg/L
Copper 0.0100.000235 mg/L
Iron 95 70 1300.03095.1 mg/L
Lead 0.0100.000215 mg/L
Nickel 0.0100.000739 mg/L
Silver 0.00500.000264 mg/L
Thallium 0.100.000101 mg/L
Zinc 0.0100.00120 mg/L
Sample ID: ICSAB 09/11/13 23:01Interference Check Sample AB14
Aluminum 92 70 1300.1036.7 mg/L
Arsenic 103 70 1300.00500.0103 mg/L
Barium 0 00.100.000118 mg/L
Beryllium 0 00.00105.00E-06 mg/L
Cadmium 115 70 1300.00100.0115 mg/L
Chromium 109 70 1300.0100.0217 mg/L
Cobalt 103 70 1300.0100.0206 mg/L
Copper 101 70 1300.0100.0202 mg/L
Iron 97 70 1300.03097.1 mg/L
Lead 0 00.0100.000171 mg/L
Qualifiers:
RL - Analyte reporting limit. ND - Not detected at the reporting limit.
Page 37 of 56

Project: Barker Hughsville Pilot
Client: CDM Federal Programs
Work Order: H13090077
QA/QC Summary Report
09/27/13Report Date:
Analyte Result %REC RPDLow Limit High Limit RPDLimitRLUnits QualCount
Prepared by Helena, MT Branch
Method: E200.8 Analytical Run: ICPMS204-B_130910B
Sample ID: ICSAB 09/11/13 23:01Interference Check Sample AB14
Nickel 105 70 1300.0100.0209 mg/L
Silver 92 70 1300.00500.0184 mg/L
Thallium 0 00.105.90E-05 mg/L
Zinc 109 70 1300.0100.0109 mg/L
Sample ID: ICV STD 09/12/13 17:42Initial Calibration Verification Standard14
Aluminum 99 90 1100.100.298 mg/L
Arsenic 103 90 1100.00500.0619 mg/L
Barium 103 90 1100.100.0617 mg/L
Beryllium 105 90 1100.00100.0316 mg/L
Cadmium 106 90 1100.00100.0317 mg/L
Chromium 103 90 1100.0100.0617 mg/L
Cobalt 105 90 1100.0100.0633 mg/L
Copper 105 90 1100.0100.0632 mg/L
Iron 106 90 1100.0300.318 mg/L
Lead 107 90 1100.0100.0641 mg/L
Nickel 104 90 1100.0100.0626 mg/L
Silver 103 90 1100.00500.0309 mg/L
Thallium 102 90 1100.100.0609 mg/L
Zinc 107 90 1100.0100.0640 mg/L
Sample ID: ICSA 09/12/13 17:47Interference Check Sample A14
Aluminum 95 70 1300.1038.0 mg/L
Arsenic 0.00500.000198 mg/L
Barium 0.100.000215 mg/L
Beryllium 0.00101.00E-05 mg/L
Cadmium 0.00100.00122 mg/L
Chromium 0.0100.00128 mg/L
Cobalt 0.0100.000481 mg/L
Copper 0.0100.000217 mg/L
Iron 100 70 1300.030100 mg/L
Lead 0.0100.000217 mg/L
Nickel 0.0100.000698 mg/L
Silver 0.00500.000278 mg/L
Thallium 0.100.000162 mg/L
Zinc 0.0100.000869 mg/L
Sample ID: ICSAB 09/12/13 17:51Interference Check Sample AB14
Aluminum 95 70 1300.1037.9 mg/L
Arsenic 108 70 1300.00500.0108 mg/L
Barium 0 00.100.000153 mg/L
Beryllium 0 00.00103.00E-06 mg/L
Cadmium 114 70 1300.00100.0114 mg/L
Chromium 110 70 1300.0100.0221 mg/L
Cobalt 108 70 1300.0100.0215 mg/L
Qualifiers:
RL - Analyte reporting limit. ND - Not detected at the reporting limit.
Page 38 of 56

Project: Barker Hughsville Pilot
Client: CDM Federal Programs
Work Order: H13090077
QA/QC Summary Report
09/27/13Report Date:
Analyte Result %REC RPDLow Limit High Limit RPDLimitRLUnits QualCount
Prepared by Helena, MT Branch
Method: E200.8 Analytical Run: ICPMS204-B_130910B
Sample ID: ICSAB 09/12/13 17:51Interference Check Sample AB14
Copper 103 70 1300.0100.0207 mg/L
Iron 102 70 1300.030102 mg/L
Lead 0 00.0100.000171 mg/L
Nickel 107 70 1300.0100.0214 mg/L
Silver 96 70 1300.00500.0191 mg/L
Thallium 0 00.108.60E-05 mg/L
Zinc 110 70 1300.0100.0110 mg/L
Method: E200.8 Batch: 21587
Sample ID: MB-21587 09/12/13 00:17Method Blank Run: ICPMS204-B_130910B14
Aluminum 0.00070.02 mg/L
Arsenic 0.0002ND mg/L
Barium 0.0002ND mg/L
Beryllium 2E-05ND mg/L
Cadmium 2E-05ND mg/L
Chromium 0.0002ND mg/L
Cobalt 5E-05ND mg/L
Copper 0.00020.0003 mg/L
Iron 0.002ND mg/L
Lead 3E-05ND mg/L
Nickel 0.0001ND mg/L
Silver 0.0001ND mg/L
Thallium 3E-054E-05 mg/L
Zinc 0.0010.002 mg/L
Sample ID: LCS-21587 09/12/13 00:21Laboratory Control Sample Run: ICPMS204-B_130910B14
Aluminum 90 85 1150.0302.27 mg/L
Arsenic 100 85 1150.00100.498 mg/L
Barium 92 85 1150.0500.461 mg/L
Beryllium 94 85 1150.00100.236 mg/L
Cadmium 96 85 1150.00100.240 mg/L
Chromium 99 85 1150.00500.496 mg/L
Cobalt 97 85 1150.00500.485 mg/L
Copper 88 85 1150.00500.441 mg/L
Iron 100 85 1150.0302.50 mg/L
Lead 95 85 1150.00100.476 mg/L
Nickel 100 85 1150.00500.499 mg/L
Silver 99 85 1150.00100.0495 mg/L
Thallium 97 85 1150.000500.484 mg/L
Zinc 104 85 1150.0100.520 mg/L
Sample ID: H13090077-001CMS3 09/12/13 00:39Sample Matrix Spike Run: ICPMS204-B_130910B14
Aluminum 86 70 1300.03010.9 mg/L
Arsenic 102 70 1300.00102.58 mg/L
Barium 91 70 1300.0502.42 mg/L
Qualifiers:
RL - Analyte reporting limit. ND - Not detected at the reporting limit.
Page 39 of 56

Project: Barker Hughsville Pilot
Client: CDM Federal Programs
Work Order: H13090077
QA/QC Summary Report
09/27/13Report Date:
Analyte Result %REC RPDLow Limit High Limit RPDLimitRLUnits QualCount
Prepared by Helena, MT Branch
Method: E200.8 Batch: 21587
Sample ID: H13090077-001CMS3 09/12/13 00:39Sample Matrix Spike Run: ICPMS204-B_130910B14
Beryllium 91 70 1300.00101.13 mg/L
Cadmium 95 70 1300.00101.19 mg/L
Chromium 100 70 1300.00502.49 mg/L
Cobalt 95 70 1300.00502.38 mg/L
Copper 87 70 1300.00502.17 mg/L
Iron 96 70 1300.03012.6 mg/L
Lead 97 70 1300.00102.42 mg/L
Nickel 100 70 1300.00502.51 mg/L
Silver 92 70 1300.00100.230 mg/L
Thallium 101 70 1300.000502.52 mg/L
Zinc 100 70 1300.0102.53 mg/L
Sample ID: H13090077-001CMSD3 09/12/13 00:43Sample Matrix Spike Duplicate Run: ICPMS204-B_130910B14
Aluminum 89 70 130 200.030 3.011.2 mg/L
Arsenic 100 70 130 200.0010 1.82.53 mg/L
Barium 93 70 130 200.050 1.32.45 mg/L
Beryllium 91 70 130 200.0010 0.41.14 mg/L
Cadmium 96 70 130 200.0010 0.51.20 mg/L
Chromium 98 70 130 200.0050 1.22.46 mg/L
Cobalt 95 70 130 200.0050 0.22.39 mg/L
Copper 86 70 130 200.0050 0.32.17 mg/L
Iron 98 70 130 200.030 1.812.8 mg/L
Lead 97 70 130 200.0010 0.02.42 mg/L
Nickel 98 70 130 200.0050 2.02.46 mg/L
Silver 94 70 130 200.0010 2.50.236 mg/L
Thallium 101 70 130 200.00050 0.22.51 mg/L
Zinc 106 70 130 200.010 5.82.68 mg/L
Sample ID: H13090086-001CMS3 09/12/13 02:56Sample Matrix Spike Run: ICPMS204-B_130910B14
Aluminum 82 70 1300.0302.09 mg/L
Arsenic 99 70 1300.00100.528 mg/L
Barium 90 70 1300.0500.459 mg/L
Beryllium 85 70 1300.00100.213 mg/L
Cadmium 94 70 1300.00100.235 mg/L
Chromium 96 70 1300.00500.481 mg/L
Cobalt 94 70 1300.00500.468 mg/L
Copper 86 70 1300.00500.432 mg/L
Iron 96 70 1300.0302.64 mg/L
Lead 94 70 1300.00100.469 mg/L
Nickel 99 70 1300.00500.497 mg/L
Silver 97 70 1300.00100.0486 mg/L
Thallium 97 70 1300.000500.484 mg/L
Zinc 101 70 1300.0100.774 mg/L
Qualifiers:
RL - Analyte reporting limit. ND - Not detected at the reporting limit.
Page 40 of 56

Project: Barker Hughsville Pilot
Client: CDM Federal Programs
Work Order: H13090077
QA/QC Summary Report
09/27/13Report Date:
Analyte Result %REC RPDLow Limit High Limit RPDLimitRLUnits QualCount
Prepared by Helena, MT Branch
Method: E200.8 Batch: 21587
Sample ID: H13090086-001CMSD3 09/12/13 03:00Sample Matrix Spike Duplicate Run: ICPMS204-B_130910B14
Aluminum 85 70 130 200.030 3.02.16 mg/L
Arsenic 102 70 130 200.0010 2.20.539 mg/L
Barium 94 70 130 200.050 4.00.478 mg/L
Beryllium 87 70 130 200.0010 2.70.219 mg/L
Cadmium 98 70 130 200.0010 4.70.246 mg/L
Chromium 99 70 130 200.0050 2.50.493 mg/L
Cobalt 97 70 130 200.0050 3.20.484 mg/L
Copper 88 70 130 200.0050 2.40.442 mg/L
Iron 98 70 130 200.030 2.52.71 mg/L
Lead 97 70 130 200.0010 3.00.483 mg/L
Nickel 101 70 130 200.0050 1.60.505 mg/L
Silver 101 70 130 200.0010 3.50.0504 mg/L
Thallium 100 70 130 200.00050 3.10.499 mg/L
Zinc 103 70 130 200.010 1.10.783 mg/L
Method: E200.8 Batch: R91216
Sample ID: ICB 09/10/13 14:10Method Blank Run: ICPMS204-B_130910B14
Aluminum 0.0001ND mg/L
Arsenic 7E-05ND mg/L
Barium 5E-05ND mg/L
Beryllium 2E-05ND mg/L
Cadmium 7E-067E-06 mg/L
Chromium 4E-05ND mg/L
Cobalt 2E-05ND mg/L
Copper 3E-05ND mg/L
Iron 0.00020.001 mg/L
Lead 6E-061E-05 mg/L
Nickel 6E-05ND mg/L
Silver 4E-05ND mg/L
Thallium 1E-05ND mg/L
Zinc 0.00030.0005 mg/L
Sample ID: LFB 09/10/13 14:15Laboratory Fortified Blank Run: ICPMS204-B_130910B14
Aluminum 107 85 1150.100.0533 mg/L
Arsenic 100 85 1150.00500.0501 mg/L
Barium 100 85 1150.100.0500 mg/L
Beryllium 103 85 1150.00100.0513 mg/L
Cadmium 104 85 1150.00100.0519 mg/L
Chromium 100 85 1150.0100.0501 mg/L
Cobalt 101 85 1150.0100.0506 mg/L
Copper 110 85 1150.0100.0548 mg/L
Iron 105 85 1150.0300.159 mg/L
Lead 102 85 1150.0100.0508 mg/L
Nickel 104 85 1150.0100.0518 mg/L
Qualifiers:
RL - Analyte reporting limit. ND - Not detected at the reporting limit.
Page 41 of 56

Project: Barker Hughsville Pilot
Client: CDM Federal Programs
Work Order: H13090077
QA/QC Summary Report
09/27/13Report Date:
Analyte Result %REC RPDLow Limit High Limit RPDLimitRLUnits QualCount
Prepared by Helena, MT Branch
Method: E200.8 Batch: R91216
Sample ID: LFB 09/10/13 14:15Laboratory Fortified Blank Run: ICPMS204-B_130910B14
Silver 102 85 1150.00500.0204 mg/L
Thallium 99 85 1150.100.0494 mg/L
Zinc 110 85 1150.0100.0557 mg/L
Sample ID: H13090077-001BMS 09/10/13 23:33Sample Matrix Spike Run: ICPMS204-B_130910B14
Aluminum 100 70 1300.0300.262 mg/L
Arsenic 107 70 1300.00100.291 mg/L
Barium 107 70 1300.0500.390 mg/L
Beryllium 102 70 1300.00100.256 mg/L
Cadmium 107 70 1300.00100.268 mg/L
Chromium 101 70 1300.00500.252 mg/L
Cobalt 102 70 1300.00500.258 mg/L
Copper 83 70 1300.00500.207 mg/L
Iron 102 70 1300.0300.853 mg/L
Lead 132 70 1300.00100.330 mg/L S
Nickel 103 70 1300.00500.260 mg/L
Silver 75 70 1300.00100.0750 mg/L
Thallium 129 70 1300.000500.321 mg/L
Zinc 106 70 1300.0100.273 mg/L
Sample ID: H13090077-001BMSD 09/10/13 23:37Sample Matrix Spike Duplicate Run: ICPMS204-B_130910B14
Aluminum 104 70 130 200.030 3.70.271 mg/L
Arsenic 111 70 130 200.0010 3.60.301 mg/L
Barium 111 70 130 200.050 2.70.401 mg/L
Beryllium 106 70 130 200.0010 3.10.264 mg/L
Cadmium 111 70 130 200.0010 3.80.279 mg/L
Chromium 105 70 130 200.0050 3.90.262 mg/L
Cobalt 104 70 130 200.0050 2.10.264 mg/L
Copper 83 70 130 200.0050 0.30.208 mg/L
Iron 107 70 130 200.030 4.00.888 mg/L
Lead 138 70 130 200.0010 4.80.346 mg/L S
Nickel 105 70 130 200.0050 2.10.265 mg/L
Silver 75 70 130 200.0010 0.30.0753 mg/L
Thallium 135 70 130 200.00050 5.00.338 mg/L S
Zinc 108 70 130 200.010 2.20.279 mg/L
Sample ID: ICB 09/11/13 23:27Method Blank Run: ICPMS204-B_130910B14
Aluminum 0.0001ND mg/L
Arsenic 7E-05ND mg/L
Barium 5E-05ND mg/L
Beryllium 2E-05ND mg/L
Cadmium 7E-06ND mg/L
Chromium 4E-05ND mg/L
Cobalt 2E-05ND mg/L
Copper 3E-05ND mg/L
Qualifiers:
RL - Analyte reporting limit. ND - Not detected at the reporting limit.
S - Spike recovery outside of advisory limits.
Page 42 of 56

Project: Barker Hughsville Pilot
Client: CDM Federal Programs
Work Order: H13090077
QA/QC Summary Report
09/27/13Report Date:
Analyte Result %REC RPDLow Limit High Limit RPDLimitRLUnits QualCount
Prepared by Helena, MT Branch
Method: E200.8 Batch: R91216
Sample ID: ICB 09/11/13 23:27Method Blank Run: ICPMS204-B_130910B14
Iron 0.00020.001 mg/L
Lead 6E-06ND mg/L
Nickel 6E-05ND mg/L
Silver 4E-055E-05 mg/L
Thallium 1E-05ND mg/L
Zinc 0.00030.001 mg/L
Sample ID: LFB 09/11/13 23:32Laboratory Fortified Blank Run: ICPMS204-B_130910B14
Aluminum 102 85 1150.100.0509 mg/L
Arsenic 101 85 1150.00500.0505 mg/L
Barium 99 85 1150.100.0494 mg/L
Beryllium 99 85 1150.00100.0493 mg/L
Cadmium 106 85 1150.00100.0530 mg/L
Chromium 101 85 1150.0100.0506 mg/L
Cobalt 102 85 1150.0100.0509 mg/L
Copper 104 85 1150.0100.0518 mg/L
Iron 102 85 1150.0300.154 mg/L
Lead 104 85 1150.0100.0518 mg/L
Nickel 103 85 1150.0100.0516 mg/L
Silver 97 85 1150.00500.0194 mg/L
Thallium 100 85 1150.100.0500 mg/L
Zinc 107 85 1150.0100.0547 mg/L
Sample ID: H12060321-048AMS 09/11/13 23:54Sample Matrix Spike Run: ICPMS204-B_130910B14
Aluminum 96 70 1300.0300.253 mg/L
Arsenic 103 70 1300.00100.259 mg/L
Barium 103 70 1300.0500.284 mg/L
Beryllium 96 70 1300.00100.240 mg/L
Cadmium 99 70 1300.00100.247 mg/L
Chromium 101 70 1300.00500.254 mg/L
Cobalt 101 70 1300.00500.252 mg/L
Copper 103 70 1300.00500.277 mg/L
Iron 103 70 1300.0300.792 mg/L
Lead 107 70 1300.00100.268 mg/L
Nickel 100 70 1300.00500.289 mg/L
Silver 86 70 1300.00100.0860 mg/L
Thallium 103 70 1300.000500.257 mg/L
Zinc 99 70 1300.0100.257 mg/L
Sample ID: H12060321-048AMSD 09/11/13 23:59Sample Matrix Spike Duplicate Run: ICPMS204-B_130910B14
Aluminum 95 70 130 200.030 0.70.251 mg/L
Arsenic 101 70 130 200.0010 2.00.254 mg/L
Barium 101 70 130 200.050 1.40.280 mg/L
Beryllium 94 70 130 200.0010 2.80.234 mg/L
Cadmium 97 70 130 200.0010 1.70.243 mg/L
Qualifiers:
RL - Analyte reporting limit. ND - Not detected at the reporting limit.
Page 43 of 56

Project: Barker Hughsville Pilot
Client: CDM Federal Programs
Work Order: H13090077
QA/QC Summary Report
09/27/13Report Date:
Analyte Result %REC RPDLow Limit High Limit RPDLimitRLUnits QualCount
Prepared by Helena, MT Branch
Method: E200.8 Batch: R91216
Sample ID: H12060321-048AMSD 09/11/13 23:59Sample Matrix Spike Duplicate Run: ICPMS204-B_130910B14
Chromium 99 70 130 200.0050 1.80.250 mg/L
Cobalt 100 70 130 200.0050 0.10.252 mg/L
Copper 100 70 130 200.0050 2.40.271 mg/L
Iron 99 70 130 200.030 3.60.764 mg/L
Lead 105 70 130 200.0010 1.50.264 mg/L
Nickel 100 70 130 200.0050 0.70.287 mg/L
Silver 86 70 130 200.0010 0.30.0857 mg/L
Thallium 101 70 130 200.00050 1.40.254 mg/L
Zinc 99 70 130 200.010 0.00.257 mg/L
Sample ID: H13090077-009BMS 09/12/13 01:54Sample Matrix Spike Run: ICPMS204-B_130910B14
Aluminum 86 70 1300.0300.218 mg/L
Arsenic 105 70 1300.00100.296 mg/L
Barium 103 70 1300.0500.283 mg/L
Beryllium 88 70 1300.00100.221 mg/L
Cadmium 109 70 1300.00100.273 mg/L
Chromium 95 70 1300.00500.238 mg/L
Cobalt 97 70 1300.00500.247 mg/L
Copper 99 70 1300.00500.250 mg/L
Iron 70 1300.03035.4 mg/L A
Lead 105 70 1300.00100.263 mg/L
Nickel 98 70 1300.00500.250 mg/L
Silver 69 70 1300.00100.0690 mg/L S
Thallium 100 70 1300.000500.251 mg/L
Zinc 91 70 1300.0100.284 mg/L
Sample ID: H13090077-009BMSD 09/12/13 01:58Sample Matrix Spike Duplicate Run: ICPMS204-B_130910B14
Aluminum 88 70 130 200.030 1.90.222 mg/L
Arsenic 104 70 130 200.0010 1.10.293 mg/L
Barium 104 70 130 200.050 0.70.285 mg/L
Beryllium 90 70 130 200.0010 2.10.225 mg/L
Cadmium 110 70 130 200.0010 1.10.276 mg/L
Chromium 97 70 130 200.0050 1.70.242 mg/L
Cobalt 98 70 130 200.0050 1.70.251 mg/L
Copper 100 70 130 200.0050 1.00.252 mg/L
Iron 70 130 200.030 0.935.1 mg/L A
Lead 107 70 130 200.0010 1.80.268 mg/L
Nickel 99 70 130 200.0050 1.10.253 mg/L
Silver 70 70 130 200.0010 0.90.0696 mg/L
Thallium 102 70 130 200.00050 1.40.255 mg/L
Zinc 93 70 130 200.010 1.90.289 mg/L
Sample ID: ICB 09/12/13 18:18Method Blank Run: ICPMS204-B_130910B14
Aluminum 0.0001ND mg/L
Arsenic 7E-05ND mg/L
Qualifiers:
RL - Analyte reporting limit. A - The analyte level was greater than four times the spike level. In accordance with the method % recovery is not calculated.
ND - Not detected at the reporting limit. S - Spike recovery outside of advisory limits.
Page 44 of 56
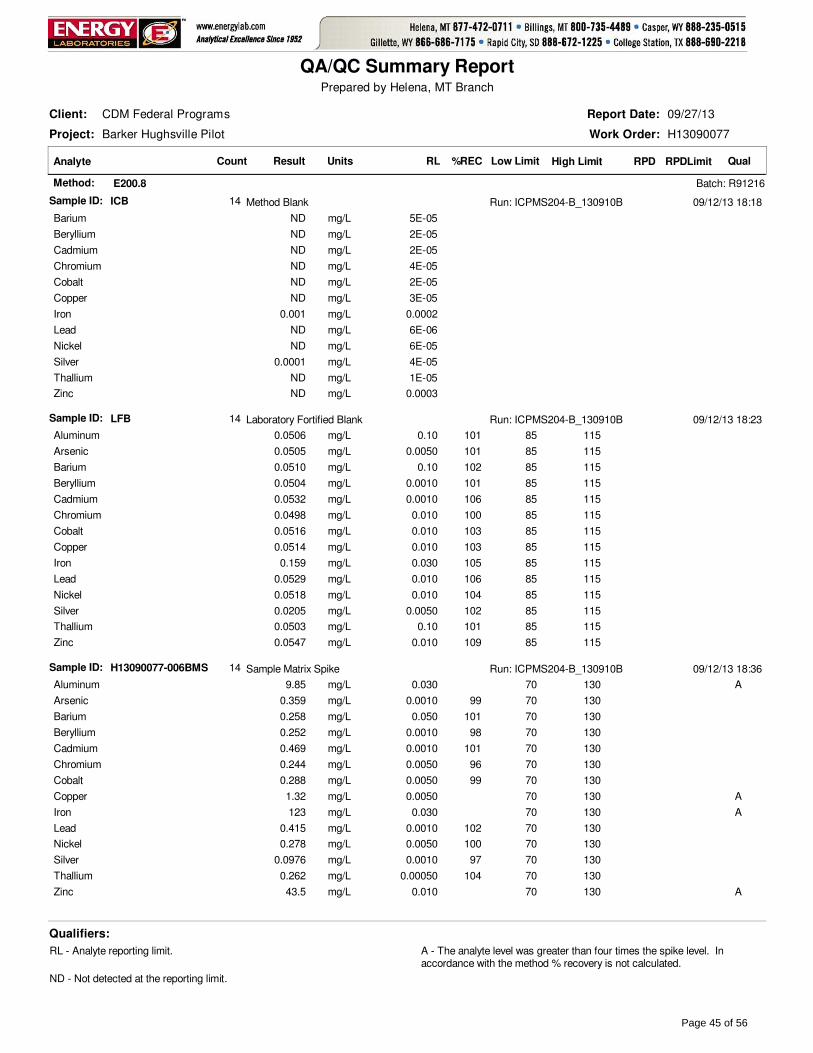
Project: Barker Hughsville Pilot
Client: CDM Federal Programs
Work Order: H13090077
QA/QC Summary Report
09/27/13Report Date:
Analyte Result %REC RPDLow Limit High Limit RPDLimitRLUnits QualCount
Prepared by Helena, MT Branch
Method: E200.8 Batch: R91216
Sample ID: ICB 09/12/13 18:18Method Blank Run: ICPMS204-B_130910B14
Barium 5E-05ND mg/L
Beryllium 2E-05ND mg/L
Cadmium 2E-05ND mg/L
Chromium 4E-05ND mg/L
Cobalt 2E-05ND mg/L
Copper 3E-05ND mg/L
Iron 0.00020.001 mg/L
Lead 6E-06ND mg/L
Nickel 6E-05ND mg/L
Silver 4E-050.0001 mg/L
Thallium 1E-05ND mg/L
Zinc 0.0003ND mg/L
Sample ID: LFB 09/12/13 18:23Laboratory Fortified Blank Run: ICPMS204-B_130910B14
Aluminum 101 85 1150.100.0506 mg/L
Arsenic 101 85 1150.00500.0505 mg/L
Barium 102 85 1150.100.0510 mg/L
Beryllium 101 85 1150.00100.0504 mg/L
Cadmium 106 85 1150.00100.0532 mg/L
Chromium 100 85 1150.0100.0498 mg/L
Cobalt 103 85 1150.0100.0516 mg/L
Copper 103 85 1150.0100.0514 mg/L
Iron 105 85 1150.0300.159 mg/L
Lead 106 85 1150.0100.0529 mg/L
Nickel 104 85 1150.0100.0518 mg/L
Silver 102 85 1150.00500.0205 mg/L
Thallium 101 85 1150.100.0503 mg/L
Zinc 109 85 1150.0100.0547 mg/L
Sample ID: H13090077-006BMS 09/12/13 18:36Sample Matrix Spike Run: ICPMS204-B_130910B14
Aluminum 70 1300.0309.85 mg/L A
Arsenic 99 70 1300.00100.359 mg/L
Barium 101 70 1300.0500.258 mg/L
Beryllium 98 70 1300.00100.252 mg/L
Cadmium 101 70 1300.00100.469 mg/L
Chromium 96 70 1300.00500.244 mg/L
Cobalt 99 70 1300.00500.288 mg/L
Copper 70 1300.00501.32 mg/L A
Iron 70 1300.030123 mg/L A
Lead 102 70 1300.00100.415 mg/L
Nickel 100 70 1300.00500.278 mg/L
Silver 97 70 1300.00100.0976 mg/L
Thallium 104 70 1300.000500.262 mg/L
Zinc 70 1300.01043.5 mg/L A
Qualifiers:
RL - Analyte reporting limit. A - The analyte level was greater than four times the spike level. In accordance with the method % recovery is not calculated.
ND - Not detected at the reporting limit.
Page 45 of 56

Project: Barker Hughsville Pilot
Client: CDM Federal Programs
Work Order: H13090077
QA/QC Summary Report
09/27/13Report Date:
Analyte Result %REC RPDLow Limit High Limit RPDLimitRLUnits QualCount
Prepared by Helena, MT Branch
Method: E200.8 Batch: R91216
Sample ID: H13090077-006BMSD 09/12/13 18:41Sample Matrix Spike Duplicate Run: ICPMS204-B_130910B14
Aluminum 70 130 200.030 0.29.83 mg/L A
Arsenic 100 70 130 200.0010 1.30.364 mg/L
Barium 101 70 130 200.050 0.10.258 mg/L
Beryllium 97 70 130 200.0010 1.10.249 mg/L
Cadmium 97 70 130 200.0010 2.10.459 mg/L
Chromium 97 70 130 200.0050 1.20.247 mg/L
Cobalt 98 70 130 200.0050 0.90.286 mg/L
Copper 70 130 200.0050 0.71.33 mg/L A
Iron 70 130 200.030 4.8129 mg/L A
Lead 100 70 130 200.0010 1.20.410 mg/L
Nickel 101 70 130 200.0050 0.90.281 mg/L
Silver 99 70 130 200.0010 2.40.0999 mg/L
Thallium 101 70 130 200.00050 2.40.255 mg/L
Zinc 70 130 200.010 0.643.8 mg/L A
Qualifiers:
RL - Analyte reporting limit. A - The analyte level was greater than four times the spike level. In accordance with the method % recovery is not calculated.
ND - Not detected at the reporting limit.
Page 46 of 56

Project: Barker Hughsville Pilot
Client: CDM Federal Programs
Work Order: H13090077
QA/QC Summary Report
09/27/13Report Date:
Analyte Result %REC RPDLow Limit High Limit RPDLimitRLUnits QualCount
Prepared by Helena, MT Branch
Method: E200.8 Analytical Run: ICPMS204-B_130924A
Sample ID: ICV STD 09/24/13 14:11Initial Calibration Verification Standard11
Aluminum 96 90 1100.100.287 mg/L
Arsenic 97 90 1100.00500.0580 mg/L
Barium 97 90 1100.100.0579 mg/L
Beryllium 100 90 1100.00100.0301 mg/L
Cadmium 102 90 1100.00100.0306 mg/L
Chromium 98 90 1100.0100.0588 mg/L
Cobalt 98 90 1100.0100.0589 mg/L
Copper 100 90 1100.0100.0600 mg/L
Lead 99 90 1100.0100.0592 mg/L
Silver 100 90 1100.00500.0301 mg/L
Thallium 97 90 1100.100.0579 mg/L
Sample ID: ICSA 09/24/13 14:15Interference Check Sample A11
Aluminum 87 70 1300.1034.8 mg/L
Arsenic 0.0050-7.90E-05 mg/L
Barium 0.109.80E-05 mg/L
Beryllium 0.0010-1.70E-05 mg/L
Cadmium 0.00100.00106 mg/L
Chromium 0.0100.00105 mg/L
Cobalt 0.0100.000225 mg/L
Copper 0.0100.000341 mg/L
Lead 0.0100.000188 mg/L
Silver 0.00500.000103 mg/L
Thallium 0.103.70E-05 mg/L
Sample ID: ICSAB 09/24/13 14:19Interference Check Sample AB11
Aluminum 87 70 1300.1035.0 mg/L
Arsenic 94 70 1300.00500.00944 mg/L
Barium 0 00.109.10E-05 mg/L
Beryllium 0 00.0010-2.60E-05 mg/L
Cadmium 101 70 1300.00100.0101 mg/L
Chromium 96 70 1300.0100.0192 mg/L
Cobalt 94 70 1300.0100.0187 mg/L
Copper 92 70 1300.0100.0184 mg/L
Lead 0 00.0100.000189 mg/L
Silver 92 70 1300.00500.0184 mg/L
Thallium 0 00.101.90E-05 mg/L
Sample ID: ICV STD 09/24/13 17:44Initial Calibration Verification Standard12
Aluminum 96 90 1100.100.287 mg/L
Arsenic 97 90 1100.00500.0580 mg/L
Barium 98 90 1100.100.0585 mg/L
Beryllium 99 90 1100.00100.0297 mg/L
Cadmium 103 90 1100.00100.0308 mg/L
Chromium 98 90 1100.0100.0590 mg/L
Qualifiers:
RL - Analyte reporting limit. ND - Not detected at the reporting limit.
Page 47 of 56
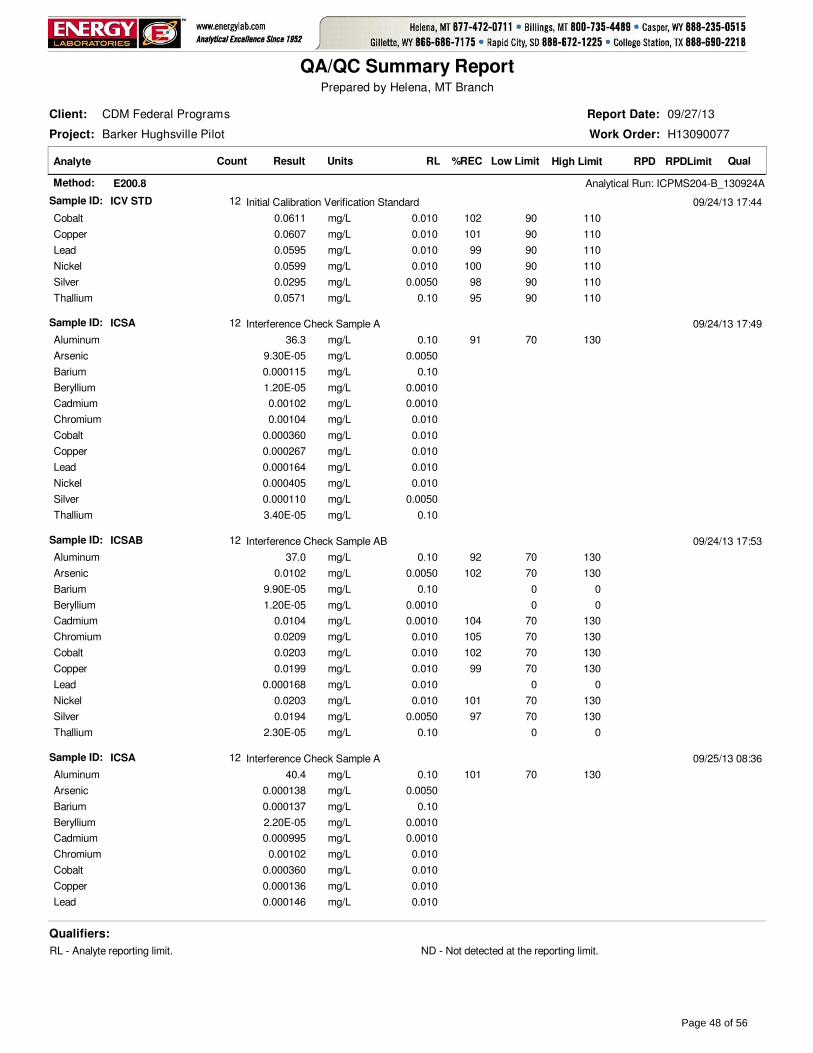
Project: Barker Hughsville Pilot
Client: CDM Federal Programs
Work Order: H13090077
QA/QC Summary Report
09/27/13Report Date:
Analyte Result %REC RPDLow Limit High Limit RPDLimitRLUnits QualCount
Prepared by Helena, MT Branch
Method: E200.8 Analytical Run: ICPMS204-B_130924A
Sample ID: ICV STD 09/24/13 17:44Initial Calibration Verification Standard12
Cobalt 102 90 1100.0100.0611 mg/L
Copper 101 90 1100.0100.0607 mg/L
Lead 99 90 1100.0100.0595 mg/L
Nickel 100 90 1100.0100.0599 mg/L
Silver 98 90 1100.00500.0295 mg/L
Thallium 95 90 1100.100.0571 mg/L
Sample ID: ICSA 09/24/13 17:49Interference Check Sample A12
Aluminum 91 70 1300.1036.3 mg/L
Arsenic 0.00509.30E-05 mg/L
Barium 0.100.000115 mg/L
Beryllium 0.00101.20E-05 mg/L
Cadmium 0.00100.00102 mg/L
Chromium 0.0100.00104 mg/L
Cobalt 0.0100.000360 mg/L
Copper 0.0100.000267 mg/L
Lead 0.0100.000164 mg/L
Nickel 0.0100.000405 mg/L
Silver 0.00500.000110 mg/L
Thallium 0.103.40E-05 mg/L
Sample ID: ICSAB 09/24/13 17:53Interference Check Sample AB12
Aluminum 92 70 1300.1037.0 mg/L
Arsenic 102 70 1300.00500.0102 mg/L
Barium 0 00.109.90E-05 mg/L
Beryllium 0 00.00101.20E-05 mg/L
Cadmium 104 70 1300.00100.0104 mg/L
Chromium 105 70 1300.0100.0209 mg/L
Cobalt 102 70 1300.0100.0203 mg/L
Copper 99 70 1300.0100.0199 mg/L
Lead 0 00.0100.000168 mg/L
Nickel 101 70 1300.0100.0203 mg/L
Silver 97 70 1300.00500.0194 mg/L
Thallium 0 00.102.30E-05 mg/L
Sample ID: ICSA 09/25/13 08:36Interference Check Sample A12
Aluminum 101 70 1300.1040.4 mg/L
Arsenic 0.00500.000138 mg/L
Barium 0.100.000137 mg/L
Beryllium 0.00102.20E-05 mg/L
Cadmium 0.00100.000995 mg/L
Chromium 0.0100.00102 mg/L
Cobalt 0.0100.000360 mg/L
Copper 0.0100.000136 mg/L
Lead 0.0100.000146 mg/L
Qualifiers:
RL - Analyte reporting limit. ND - Not detected at the reporting limit.
Page 48 of 56
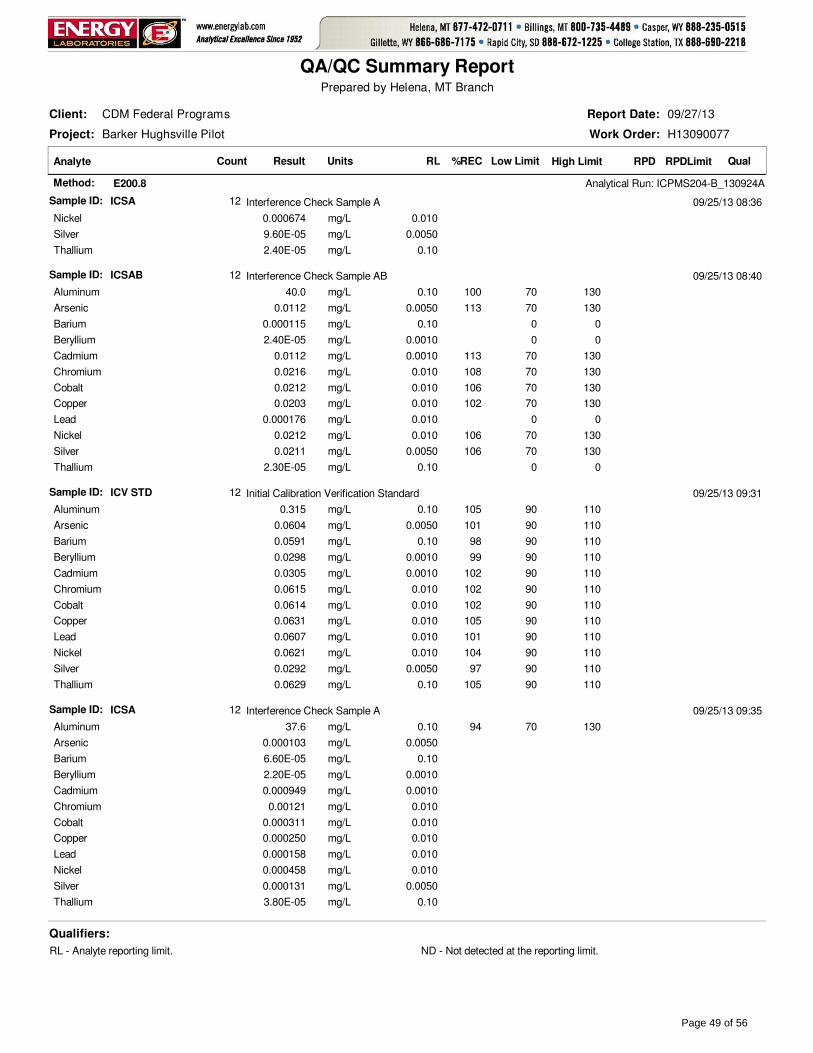
Project: Barker Hughsville Pilot
Client: CDM Federal Programs
Work Order: H13090077
QA/QC Summary Report
09/27/13Report Date:
Analyte Result %REC RPDLow Limit High Limit RPDLimitRLUnits QualCount
Prepared by Helena, MT Branch
Method: E200.8 Analytical Run: ICPMS204-B_130924A
Sample ID: ICSA 09/25/13 08:36Interference Check Sample A12
Nickel 0.0100.000674 mg/L
Silver 0.00509.60E-05 mg/L
Thallium 0.102.40E-05 mg/L
Sample ID: ICSAB 09/25/13 08:40Interference Check Sample AB12
Aluminum 100 70 1300.1040.0 mg/L
Arsenic 113 70 1300.00500.0112 mg/L
Barium 0 00.100.000115 mg/L
Beryllium 0 00.00102.40E-05 mg/L
Cadmium 113 70 1300.00100.0112 mg/L
Chromium 108 70 1300.0100.0216 mg/L
Cobalt 106 70 1300.0100.0212 mg/L
Copper 102 70 1300.0100.0203 mg/L
Lead 0 00.0100.000176 mg/L
Nickel 106 70 1300.0100.0212 mg/L
Silver 106 70 1300.00500.0211 mg/L
Thallium 0 00.102.30E-05 mg/L
Sample ID: ICV STD 09/25/13 09:31Initial Calibration Verification Standard12
Aluminum 105 90 1100.100.315 mg/L
Arsenic 101 90 1100.00500.0604 mg/L
Barium 98 90 1100.100.0591 mg/L
Beryllium 99 90 1100.00100.0298 mg/L
Cadmium 102 90 1100.00100.0305 mg/L
Chromium 102 90 1100.0100.0615 mg/L
Cobalt 102 90 1100.0100.0614 mg/L
Copper 105 90 1100.0100.0631 mg/L
Lead 101 90 1100.0100.0607 mg/L
Nickel 104 90 1100.0100.0621 mg/L
Silver 97 90 1100.00500.0292 mg/L
Thallium 105 90 1100.100.0629 mg/L
Sample ID: ICSA 09/25/13 09:35Interference Check Sample A12
Aluminum 94 70 1300.1037.6 mg/L
Arsenic 0.00500.000103 mg/L
Barium 0.106.60E-05 mg/L
Beryllium 0.00102.20E-05 mg/L
Cadmium 0.00100.000949 mg/L
Chromium 0.0100.00121 mg/L
Cobalt 0.0100.000311 mg/L
Copper 0.0100.000250 mg/L
Lead 0.0100.000158 mg/L
Nickel 0.0100.000458 mg/L
Silver 0.00500.000131 mg/L
Thallium 0.103.80E-05 mg/L
Qualifiers:
RL - Analyte reporting limit. ND - Not detected at the reporting limit.
Page 49 of 56

Project: Barker Hughsville Pilot
Client: CDM Federal Programs
Work Order: H13090077
QA/QC Summary Report
09/27/13Report Date:
Analyte Result %REC RPDLow Limit High Limit RPDLimitRLUnits QualCount
Prepared by Helena, MT Branch
Method: E200.8 Analytical Run: ICPMS204-B_130924A
Sample ID: ICSA 09/25/13 09:35Interference Check Sample A12
Sample ID: ICSAB 09/25/13 09:40Interference Check Sample AB12
Aluminum 94 70 1300.1037.4 mg/L
Arsenic 109 70 1300.00500.0109 mg/L
Barium 0 00.104.50E-05 mg/L
Beryllium 0 00.00102.60E-05 mg/L
Cadmium 104 70 1300.00100.0104 mg/L
Chromium 106 70 1300.0100.0213 mg/L
Cobalt 101 70 1300.0100.0201 mg/L
Copper 104 70 1300.0100.0209 mg/L
Lead 0 00.0100.000155 mg/L
Nickel 106 70 1300.0100.0212 mg/L
Silver 98 70 1300.00500.0196 mg/L
Thallium 0 00.102.20E-05 mg/L
Qualifiers:
RL - Analyte reporting limit. ND - Not detected at the reporting limit.
Page 50 of 56

Project: Barker Hughsville Pilot
Client: CDM Federal Programs
Work Order: H13090077
QA/QC Summary Report
09/27/13Report Date:
Analyte Result %REC RPDLow Limit High Limit RPDLimitRLUnits QualCount
Prepared by Helena, MT Branch
Method: E300.0 Analytical Run: IC102-H_130909A
Sample ID: ICV 09/09/13 14:20Initial Calibration Verification Standard2
Chloride 103 90 1101.0100 mg/L
Sulfate 102 90 1101.0410 mg/L
Sample ID: CCV090913-1 09/09/13 14:58Continuing Calibration Verification Standard2
Chloride 103 90 1101.0100 mg/L
Sulfate 103 90 1101.0410 mg/L
Sample ID: CCV090913-2 09/09/13 18:10Continuing Calibration Verification Standard2
Chloride 104 90 1101.0100 mg/L
Sulfate 105 90 1101.0420 mg/L
Method: E300.0 Batch: R91159
Sample ID: ICB 09/09/13 14:33Method Blank Run: IC102-H_130909A2
Chloride 0.008ND mg/L
Sulfate 0.080.08 mg/L
Sample ID: LFB 09/09/13 14:45Laboratory Fortified Blank Run: IC102-H_130909A2
Chloride 104 90 1101.052 mg/L
Sulfate 104 90 1101.0210 mg/L
Sample ID: H13090077-008AMS 09/09/13 17:45Sample Matrix Spike Run: IC102-H_130909A2
Chloride 101 90 1101.053 mg/L
Sulfate 90 1101.01200 mg/L A
Sample ID: H13090077-008AMSD 09/09/13 17:57Sample Matrix Spike Duplicate Run: IC102-H_130909A2
Chloride 102 90 110 201.0 0.753 mg/L
Sulfate 90 110 201.0 0.01200 mg/L A
Qualifiers:
RL - Analyte reporting limit. A - The analyte level was greater than four times the spike level. In accordance with the method % recovery is not calculated.
ND - Not detected at the reporting limit.
Page 51 of 56

Project: Barker Hughsville Pilot
Client: CDM Federal Programs
Work Order: H13090077
QA/QC Summary Report
09/27/13Report Date:
Analyte Result %REC RPDLow Limit High Limit RPDLimitRLUnits QualCount
Prepared by Helena, MT Branch
Method: E300.0 Analytical Run: IC102-H_130910A
Sample ID: ICV 09/10/13 10:47Initial Calibration Verification Standard
Sulfate 98 90 1101.0390 mg/L
Sample ID: CCV091013-1 09/10/13 11:24Continuing Calibration Verification Standard
Sulfate 103 90 1101.0410 mg/L
Sample ID: CCV091013-2 09/10/13 14:21Continuing Calibration Verification Standard
Sulfate 103 90 1101.0410 mg/L
Method: E300.0 Batch: R91199
Sample ID: ICB 09/10/13 10:59Method Blank Run: IC102-H_130910A
Sulfate 0.080.2 mg/L
Sample ID: LFB 09/10/13 11:12Laboratory Fortified Blank Run: IC102-H_130910A
Sulfate 107 90 1101.0220 mg/L
Sample ID: H13090077-007AMS 09/10/13 13:56Sample Matrix Spike Run: IC102-H_130910A
Sulfate 84 90 1101.02100 mg/L S
Sample ID: H13090077-007AMSD 09/10/13 14:08Sample Matrix Spike Duplicate Run: IC102-H_130910A
Sulfate 86 90 110 201.0 0.92100 mg/L S
Qualifiers:
RL - Analyte reporting limit. ND - Not detected at the reporting limit.
S - Spike recovery outside of advisory limits.
Page 52 of 56

Project: Barker Hughsville Pilot
Client: CDM Federal Programs
Work Order: H13090077
QA/QC Summary Report
09/27/13Report Date:
Analyte Result %REC RPDLow Limit High Limit RPDLimitRLUnits QualCount
Prepared by Helena, MT Branch
Method: E350.1 Analytical Run: FIA203-HE_130905A
Sample ID: ICB 09/05/13 11:08Initial Calibration Blank, Instrument Blank
Nitrogen, Ammonia as N 0 00.050-0.0519 mg/L
Sample ID: ICV 09/05/13 11:24Initial Calibration Verification Standard
Nitrogen, Ammonia as N 97 90 1100.255.48 mg/L
Sample ID: CCV 09/05/13 11:59Continuing Calibration Verification Standard
Nitrogen, Ammonia as N 99 90 1100.0500.497 mg/L
Method: E350.1 Batch: R91050
Sample ID: LFB 09/05/13 11:06Laboratory Fortified Blank Run: FIA203-HE_130905A
Nitrogen, Ammonia as N 98 90 1100.0550.981 mg/L
Sample ID: H13090057-001CMS 09/05/13 12:02Sample Matrix Spike Run: FIA203-HE_130905A
Nitrogen, Ammonia as N 96 80 1200.0550.960 mg/L
Sample ID: H13090057-001CMSD 09/05/13 12:03Sample Matrix Spike Duplicate Run: FIA203-HE_130905A
Nitrogen, Ammonia as N 95 80 120 100.055 1.10.949 mg/L
Qualifiers:
RL - Analyte reporting limit. ND - Not detected at the reporting limit.
Page 53 of 56

Project: Barker Hughsville Pilot
Client: CDM Federal Programs
Work Order: H13090077
QA/QC Summary Report
09/27/13Report Date:
Analyte Result %REC RPDLow Limit High Limit RPDLimitRLUnits QualCount
Prepared by Helena, MT Branch
Method: E365.1 Analytical Run: FIA202-HE_130905B
Sample ID: ICV 09/05/13 16:07Initial Calibration Verification Standard
Phosphorus, Orthophosphate as P 98 90 1100.00500.245 mg/L
Sample ID: ICB 09/05/13 16:08Initial Calibration Blank, Instrument Blank
Phosphorus, Orthophosphate as P 0 00.0050-0.000260 mg/L
Sample ID: CCV 09/05/13 16:10Continuing Calibration Verification Standard
Phosphorus, Orthophosphate as P 99 90 1100.00500.0995 mg/L
Sample ID: CCV 09/05/13 16:20Continuing Calibration Verification Standard
Phosphorus, Orthophosphate as P 101 90 1100.00500.101 mg/L
Method: E365.1 Batch: R91060
Sample ID: LFB 09/05/13 16:09Laboratory Fortified Blank Run: FIA202-HE_130905B
Phosphorus, Orthophosphate as P 104 90 1100.00500.208 mg/L
Sample ID: H13090077-002AMS 09/05/13 16:14Sample Matrix Spike Run: FIA202-HE_130905B
Phosphorus, Orthophosphate as P 91 90 1100.00500.393 mg/L
Sample ID: H13090077-002AMSD 09/05/13 16:15Sample Matrix Spike Duplicate Run: FIA202-HE_130905B
Phosphorus, Orthophosphate as P 91 90 110 200.0050 0.10.393 mg/L
Method: E365.1 Analytical Run: FIA202-HE_130905C
Sample ID: ICV 09/05/13 16:52Initial Calibration Verification Standard
Phosphorus, Orthophosphate as P 98 90 1100.00500.244 mg/L
Sample ID: ICB 09/05/13 16:53Initial Calibration Blank, Instrument Blank
Phosphorus, Orthophosphate as P 0 00.0050-0.00316 mg/L
Sample ID: CCV 09/05/13 16:55Continuing Calibration Verification Standard
Phosphorus, Orthophosphate as P 106 90 1100.00500.106 mg/L
Sample ID: CCV 09/05/13 17:03Continuing Calibration Verification Standard
Phosphorus, Orthophosphate as P 105 90 1100.00500.105 mg/L
Method: E365.1 Batch: R91065
Sample ID: LFB 09/05/13 16:54Laboratory Fortified Blank Run: FIA202-HE_130905C
Phosphorus, Orthophosphate as P 103 90 1100.00500.206 mg/L
Sample ID: H13090077-002AMS 09/05/13 16:58Sample Matrix Spike Run: FIA202-HE_130905C
Phosphorus, Orthophosphate as P 84 90 1100.00500.374 mg/L S
Sample ID: H13090077-002AMSD 09/05/13 16:59Sample Matrix Spike Duplicate Run: FIA202-HE_130905C
Phosphorus, Orthophosphate as P 88 90 110 200.0050 3.90.388 mg/L S
Qualifiers:
RL - Analyte reporting limit. ND - Not detected at the reporting limit.
S - Spike recovery outside of advisory limits.
Page 54 of 56

Shipping container/cooler in good condition?
Custody seals intact on all shipping container(s)/cooler(s)?
Custody seals intact on all sample bottles?
Chain of custody present?
Chain of custody signed when relinquished and received?
Chain of custody agrees with sample labels?
Samples in proper container/bottle?
Sample containers intact?
Sufficient sample volume for indicated test?
All samples received within holding time?(Exclude analyses that are considered field parameterssuch as pH, DO, Res Cl, Sulfite, Ferrous Iron, etc.)
Container/Temp Blank temperature:
Water - VOA vials have zero headspace?
Water - pH acceptable upon receipt?
Yes
Yes
Yes
Yes
Yes
Yes
Yes
Yes
Yes
Yes
Yes
Yes
No
No
No
No
No
No
No
No
No
No
No
No
� �
�
�
�
�
�
�
�
�
�
�
�
�
�
�
�
�
�
�
�
�
�
�
Not Present
Not Present
Not Present
�
�
�
No VOA vials submitted
Not Applicable �
�
°C See comments
9/5/2013Tracy L. Lorash
Hand Del
elm
Date Received:
Received by:
Login completed by:
Carrier name:
BL2000\jweidemoyer
9/9/2013
Reviewed by:
Reviewed Date:
Contact and Corrective Action Comments:
Cooler 1 was received at 1.6°C, Cooler 2 at 0.8°C. Samples were received on wet ice. BCR3 and BCR3-POST sample(s) for Nutrients were preserved to pH <2 with 2 mL of sulfuric acid per 250 mL in the laboratory upon receipt. Tl 9/5/13
Temp Blank received in all shipping container(s)/cooler(s)? Yes No� � Not Applicable �
Workorder Receipt Checklist
CDM Federal Programs H13090077
Lab measurement of analytes considered field parameters that require analysis within 15 minutes of sampling such as pH, Dissolved Oxygen and Residual Chlorine, are qualified as being analyzed outside of recommended holding time.
Solid/soil samples are reported on a wet weight basis (as received) unless specifically indicated. If moisture corrected, data units are typically noted as –dry. For agricultural and mining soil parameters/characteristics, all samples are dried and ground prior to sample analysis.
Standard Reporting Procedures
Page 55 of 56

Page 56 of 56
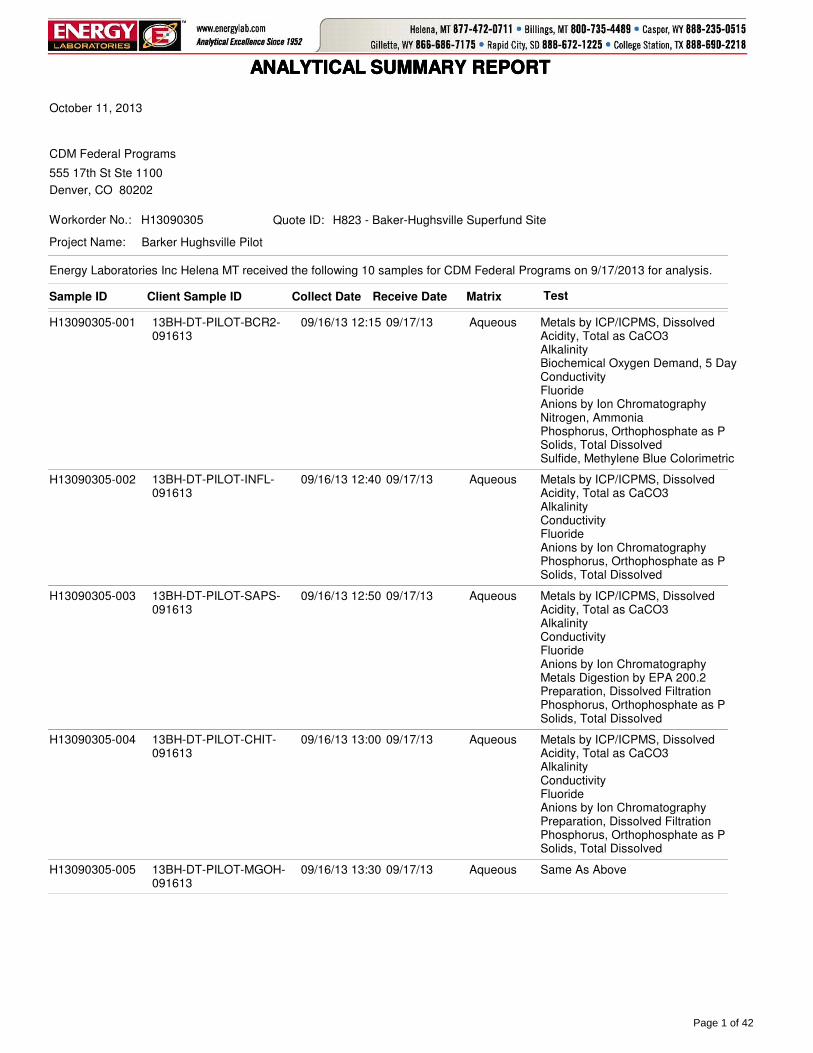
ANALYTICAL SUMMARY REPORTANALYTICAL SUMMARY REPORTANALYTICAL SUMMARY REPORTANALYTICAL SUMMARY REPORT
Sample ID Client Sample ID Collect Date Receive Date Matrix Test
H13090305-001 13BH-DT-PILOT-BCR2-091613
09/16/13 12:15 09/17/13 Aqueous Metals by ICP/ICPMS, DissolvedAcidity, Total as CaCO3AlkalinityBiochemical Oxygen Demand, 5 DayConductivityFluorideAnions by Ion ChromatographyNitrogen, AmmoniaPhosphorus, Orthophosphate as PSolids, Total DissolvedSulfide, Methylene Blue Colorimetric
H13090305-002 13BH-DT-PILOT-INFL-091613
09/16/13 12:40 09/17/13 Aqueous Metals by ICP/ICPMS, DissolvedAcidity, Total as CaCO3AlkalinityConductivityFluorideAnions by Ion ChromatographyPhosphorus, Orthophosphate as PSolids, Total Dissolved
H13090305-003 13BH-DT-PILOT-SAPS-091613
09/16/13 12:50 09/17/13 Aqueous Metals by ICP/ICPMS, DissolvedAcidity, Total as CaCO3AlkalinityConductivityFluorideAnions by Ion ChromatographyMetals Digestion by EPA 200.2Preparation, Dissolved FiltrationPhosphorus, Orthophosphate as PSolids, Total Dissolved
H13090305-004 13BH-DT-PILOT-CHIT-091613
09/16/13 13:00 09/17/13 Aqueous Metals by ICP/ICPMS, DissolvedAcidity, Total as CaCO3AlkalinityConductivityFluorideAnions by Ion ChromatographyPreparation, Dissolved FiltrationPhosphorus, Orthophosphate as PSolids, Total Dissolved
H13090305-005 13BH-DT-PILOT-MGOH-091613
09/16/13 13:30 09/17/13 Aqueous Same As Above
CDM Federal Programs
Project Name: Barker Hughsville Pilot
Workorder No.: H13090305
555 17th St Ste 1100
Denver, CO 80202
October 11, 2013
H823 - Baker-Hughsville Superfund SiteQuote ID:
Energy Laboratories Inc Helena MT received the following 10 samples for CDM Federal Programs on 9/17/2013 for analysis.
Page 1 of 42

ANALYTICAL SUMMARY REPORTANALYTICAL SUMMARY REPORTANALYTICAL SUMMARY REPORTANALYTICAL SUMMARY REPORT
The analyses presented in this report were performed by Energy Laboratories, Inc., 3161 E. Lyndale Ave., Helena, MT 59604, unless otherwise noted. Any exceptions or problems with the analyses are noted in the Laboratory Analytical Report, the QA/QC Summary Report, or the Case Narrative.
The results as reported relate only to the item(s) submitted for testing.
If you have any questions regarding these test results, please call.
Report Approved By:
H13090305-006 13BH-DT-PILOT-BCR1-091613
09/16/13 13:40 09/17/13 Aqueous Metals by ICP/ICPMS, DissolvedAcidity, Total as CaCO3AlkalinityConductivityFluorideAnions by Ion ChromatographyPreparation, Dissolved FiltrationPhosphorus, Orthophosphate as PSolids, Total DissolvedSulfide, Methylene Blue Colorimetric
H13090305-007 13BH-DT-PILOT-BCR3-091613
09/16/13 13:50 09/17/13 Aqueous Metals by ICP/ICPMS, DissolvedAcidity, Total as CaCO3AlkalinityConductivityFluorideAnions by Ion ChromatographyPhosphorus, Orthophosphate as PSolids, Total DissolvedSulfide, Iodine Titrimetric
H13090305-008 13BH-DT-PILOT-BDR3-091613
09/16/13 13:55 09/17/13 Aqueous Metals by ICP/ICPMS, DissolvedAcidity, Total as CaCO3AlkalinityConductivityFluorideAnions by Ion ChromatographyPreparation, Dissolved FiltrationPhosphorus, Orthophosphate as PSolids, Total DissolvedSulfide, Iodine Titrimetric
H13090305-009 13BH-DT-PILOT-BCR4-091613
09/16/13 14:05 09/17/13 Aqueous Metals by ICP/ICPMS, DissolvedAcidity, Total as CaCO3AlkalinityConductivityFluorideAnions by Ion ChromatographyPhosphorus, Orthophosphate as PSolids, Total DissolvedSulfide, Methylene Blue Colorimetric
H13090305-010 13BH-DT-PILOT-BCR2-POST-091613
09/16/13 14:15 09/17/13 Aqueous Biochemical Oxygen Demand, 5 DayNitrogen, AmmoniaSulfide, Methylene Blue Colorimetric
Page 2 of 42

Project: Barker Hughsville Pilot
CLIENT: CDM Federal Programs
Sample Delivery Group: H13090305 CASE NARRATIVE
10/11/13Report Date:
Tests associated with analyst identified as ELI-B were subcontracted to Energy Laboratories, 1120 S. 27th St., Billings, MT, EPA Number MT00005.
Page 3 of 42

LABORATORY ANALYTICAL REPORT
Client: CDM Federal Programs
Project: Barker Hughsville Pilot
Lab ID: H13090305-001
Client Sample ID 13BH-DT-PILOT-BCR2-091613
Collection Date: 09/16/13 12:15
Matrix: Aqueous
Report Date: 10/22/13
DateReceived: 09/17/13
Prepared by Helena, MT Branch
Analyses Result Units Analysis Date / ByRL Method
MCL/QCLQualifiers
PHYSICAL PROPERTIES
09/18/13 14:31 / cmm10mg/L1460Solids, Total Dissolved TDS @ 180 C A2540 C
INORGANICS
D 09/23/13 09:58 / cmm4.0mg/L80Acidity, Total as CaCO3 A2310 B
09/18/13 16:03 / cmm1mg/L110Alkalinity, Total as CaCO3 A2320 B
09/18/13 16:03 / cmm1mg/L140Bicarbonate as HCO3 A2320 B
09/18/13 16:03 / cmm1mg/LNDCarbonate as CO3 A2320 B
09/18/13 16:03 / cmm1mg/LNDHydroxide as OH A2320 B
D 09/19/13 13:01 / cmm2mg/LNDChloride E300.0
09/19/13 13:01 / cmm1mg/L980Sulfate E300.0
D 10/10/13 10:58 / cmm0.2mg/L1.5Fluoride A4500-F C4
D 09/20/13 11:45 / eli-b220.2mg/LNDSulfide A4500-S D
AGGREGATE ORGANICS
H 09/18/13 15:17 / cmm40mg/L<35Oxygen Demand, Biochemical (BOD) A5210 B
No BOD dilution depleted greater than 2.0 mg/L DO.
NUTRIENTS
09/17/13 16:22 / jaw0.05mg/LNDNitrogen, Ammonia as N E350.1
D 09/18/13 11:00 / jaw0.01mg/L0.02Phosphorus, Orthophosphate as P E365.1
METALS, DISSOLVED
09/20/13 09:23 / dck0.03mg/L0.06Aluminum E200.8
09/20/13 09:23 / dck0.001mg/L0.002Arsenic E200.8
09/20/13 09:23 / dck0.05mg/L0.07Barium E200.8
09/20/13 09:23 / dck0.001mg/LNDBeryllium E200.8
09/20/13 09:23 / dck0.001mg/LNDCadmium E200.8
09/18/13 12:34 / sld1mg/L280Calcium E200.7
09/20/13 09:23 / dck0.005mg/LNDChromium E200.8
09/20/13 09:23 / dck0.005mg/L0.035Cobalt E200.8
09/20/13 09:23 / dck0.005mg/LNDCopper E200.8
09/18/13 12:34 / sld0.03mg/L33.7Iron E200.7
09/20/13 09:23 / dck0.001mg/LNDLead E200.8
09/18/13 12:34 / sld1mg/L22Magnesium E200.7
D 09/18/13 12:34 / sld0.003mg/L99.9Manganese E200.7
09/20/13 09:23 / dck0.005mg/L0.024Nickel E200.8
09/18/13 12:34 / sld1mg/LNDPotassium E200.7
09/27/13 21:05 / dck0.001mg/LNDSilver E200.8
09/18/13 12:34 / sld1mg/L5Sodium E200.7
09/20/13 09:23 / dck0.0005mg/LNDThallium E200.8
09/18/13 12:34 / sld0.01mg/L13.7Zinc E200.7
ReportDefinitions:
RL - Analyte reporting limit. MCL - Maximum contaminant level.
QCL - Quality control limit. ND - Not detected at the reporting limit.
D - RL increased due to sample matrix. H - Analysis performed past recommended holding time.
Page 4 of 42

LABORATORY ANALYTICAL REPORT
Client: CDM Federal Programs
Project: Barker Hughsville Pilot
Lab ID: H13090305-002
Client Sample ID 13BH-DT-PILOT-INFL-091613
Collection Date: 09/16/13 12:40
Matrix: Aqueous
Report Date: 10/22/13
DateReceived: 09/17/13
Prepared by Helena, MT Branch
Analyses Result Units Analysis Date / ByRL Method
MCL/QCLQualifiers
PHYSICAL PROPERTIES
09/18/13 14:31 / cmm10mg/L1300Solids, Total Dissolved TDS @ 180 C A2540 C
INORGANICS
D 09/23/13 09:58 / cmm4.0mg/L460Acidity, Total as CaCO3 A2310 B
09/18/13 16:06 / cmm1mg/LNDAlkalinity, Total as CaCO3 A2320 B
09/18/13 16:06 / cmm1mg/LNDBicarbonate as HCO3 A2320 B
09/18/13 16:06 / cmm1mg/LNDCarbonate as CO3 A2320 B
09/18/13 16:06 / cmm1mg/LNDHydroxide as OH A2320 B
09/30/13 16:26 / abb1mg/LNDChloride E300.0
09/30/13 16:26 / abb1mg/L1700Sulfate E300.0
D 10/10/13 11:00 / cmm0.2mg/L0.8Fluoride A4500-F C4
NUTRIENTS
D 09/18/13 11:04 / jaw0.01mg/L0.13Phosphorus, Orthophosphate as P E365.1
METALS, DISSOLVED
09/18/13 12:37 / sld0.03mg/L8.71Aluminum E200.7
09/20/13 09:28 / dck0.001mg/L0.093Arsenic E200.8
09/20/13 09:28 / dck0.05mg/LNDBarium E200.8
09/20/13 09:28 / dck0.001mg/L0.006Beryllium E200.8
09/20/13 09:28 / dck0.001mg/L0.154Cadmium E200.8
09/18/13 12:37 / sld1mg/L93Calcium E200.7
09/20/13 09:28 / dck0.005mg/LNDChromium E200.8
09/20/13 09:28 / dck0.005mg/L0.036Cobalt E200.8
09/24/13 19:05 / dck0.005mg/L0.924Copper E200.8
09/18/13 12:37 / sld0.03mg/L112Iron E200.7
09/20/13 09:28 / dck0.001mg/L0.122Lead E200.8
09/18/13 12:37 / sld1mg/L20Magnesium E200.7
D 09/18/13 12:37 / sld0.003mg/L98.4Manganese E200.7
09/20/13 09:28 / dck0.005mg/L0.030Nickel E200.8
09/18/13 12:37 / sld1mg/LNDPotassium E200.7
09/27/13 21:12 / dck0.001mg/LNDSilver E200.8
09/18/13 12:37 / sld1mg/L5Sodium E200.7
09/20/13 09:28 / dck0.0005mg/L0.0018Thallium E200.8
09/18/13 12:37 / sld0.01mg/L44.5Zinc E200.7
ReportDefinitions:
RL - Analyte reporting limit. MCL - Maximum contaminant level.
QCL - Quality control limit. ND - Not detected at the reporting limit.
D - RL increased due to sample matrix.
Page 5 of 42

LABORATORY ANALYTICAL REPORT
Client: CDM Federal Programs
Project: Barker Hughsville Pilot
Lab ID: H13090305-003
Client Sample ID 13BH-DT-PILOT-SAPS-091613
Collection Date: 09/16/13 12:50
Matrix: Aqueous
Report Date: 10/22/13
DateReceived: 09/17/13
Prepared by Helena, MT Branch
Analyses Result Units Analysis Date / ByRL Method
MCL/QCLQualifiers
PHYSICAL PROPERTIES
09/18/13 14:32 / cmm10mg/L1490Solids, Total Dissolved TDS @ 180 C A2540 C
INORGANICS
D 09/23/13 09:58 / cmm4.0mg/L320Acidity, Total as CaCO3 A2310 B
09/18/13 16:13 / cmm1mg/L40Alkalinity, Total as CaCO3 A2320 B
09/18/13 16:13 / cmm1mg/L49Bicarbonate as HCO3 A2320 B
09/18/13 16:13 / cmm1mg/LNDCarbonate as CO3 A2320 B
09/18/13 16:13 / cmm1mg/LNDHydroxide as OH A2320 B
09/30/13 16:39 / abb1mg/LNDChloride E300.0
09/19/13 13:26 / cmm1mg/L1200Sulfate E300.0
D 10/10/13 11:06 / cmm0.5mg/L1.8Fluoride A4500-F C4
NUTRIENTS
D 09/18/13 11:02 / jaw0.02mg/L0.05Phosphorus, Orthophosphate as P E365.1
METALS, DISSOLVED
D 09/27/13 13:47 / sld0.05mg/L2.02Aluminum E200.7
09/20/13 09:33 / dck0.001mg/L0.052Arsenic E200.8
09/20/13 09:33 / dck0.05mg/LNDBarium E200.8
09/20/13 09:33 / dck0.001mg/L0.007Beryllium E200.8
09/20/13 09:33 / dck0.001mg/L0.100Cadmium E200.8
09/18/13 12:41 / sld1mg/L233Calcium E200.7
09/20/13 09:33 / dck0.005mg/L0.006Chromium E200.8
09/20/13 09:33 / dck0.005mg/L0.039Cobalt E200.8
D 09/18/13 12:41 / sld0.02mg/L0.78Copper E200.7
09/18/13 12:41 / sld0.03mg/L107Iron E200.7
09/20/13 09:33 / dck0.001mg/L0.184Lead E200.8
09/18/13 12:41 / sld1mg/L22Magnesium E200.7
D 09/18/13 12:41 / sld0.003mg/L99.0Manganese E200.7
09/20/13 09:33 / dck0.005mg/L0.026Nickel E200.8
09/18/13 12:41 / sld1mg/LNDPotassium E200.7
09/27/13 21:18 / dck0.001mg/LNDSilver E200.8
09/18/13 12:41 / sld1mg/L5Sodium E200.7
09/20/13 09:33 / dck0.0005mg/L0.0024Thallium E200.8
09/18/13 12:41 / sld0.01mg/L53.2Zinc E200.7
ReportDefinitions:
RL - Analyte reporting limit. MCL - Maximum contaminant level.
QCL - Quality control limit. ND - Not detected at the reporting limit.
D - RL increased due to sample matrix.
Page 6 of 42

LABORATORY ANALYTICAL REPORT
Client: CDM Federal Programs
Project: Barker Hughsville Pilot
Lab ID: H13090305-004
Client Sample ID 13BH-DT-PILOT-CHIT-091613
Collection Date: 09/16/13 13:00
Matrix: Aqueous
Report Date: 10/22/13
DateReceived: 09/17/13
Prepared by Helena, MT Branch
Analyses Result Units Analysis Date / ByRL Method
MCL/QCLQualifiers
PHYSICAL PROPERTIES
09/18/13 14:32 / cmm10mg/L1660Solids, Total Dissolved TDS @ 180 C A2540 C
INORGANICS
D 09/23/13 09:58 / cmm4.0mg/LNDAcidity, Total as CaCO3 A2310 B
09/18/13 16:20 / cmm1mg/L620Alkalinity, Total as CaCO3 A2320 B
09/18/13 16:20 / cmm1mg/L750Bicarbonate as HCO3 A2320 B
09/18/13 16:20 / cmm1mg/LNDCarbonate as CO3 A2320 B
09/18/13 16:20 / cmm1mg/LNDHydroxide as OH A2320 B
D 09/19/13 13:39 / cmm2mg/L16Chloride E300.0
09/19/13 13:39 / cmm1mg/L730Sulfate E300.0
D 10/10/13 11:08 / cmm0.2mg/L0.6Fluoride A4500-F C4
NUTRIENTS
D 09/18/13 11:03 / jaw1mg/L14Phosphorus, Orthophosphate as P E365.1
METALS, DISSOLVED
10/01/13 18:47 / sld0.03mg/L0.09Aluminum E200.7
09/20/13 09:51 / dck0.001mg/L0.034Arsenic E200.8
09/20/13 09:51 / dck0.05mg/LNDBarium E200.8
09/20/13 09:51 / dck0.001mg/LNDBeryllium E200.8
09/20/13 09:51 / dck0.001mg/LNDCadmium E200.8
09/18/13 12:45 / sld1mg/L377Calcium E200.7
09/20/13 09:51 / dck0.005mg/LNDChromium E200.8
09/20/13 09:51 / dck0.005mg/L0.011Cobalt E200.8
09/20/13 09:51 / dck0.005mg/LNDCopper E200.8
09/18/13 12:45 / sld0.03mg/L39.4Iron E200.7
09/20/13 09:51 / dck0.001mg/LNDLead E200.8
09/18/13 12:45 / sld1mg/L43Magnesium E200.7
D 09/18/13 12:45 / sld0.003mg/L94.1Manganese E200.7
09/20/13 09:51 / dck0.005mg/L0.015Nickel E200.8
09/18/13 12:45 / sld1mg/L5Potassium E200.7
09/27/13 21:25 / dck0.001mg/LNDSilver E200.8
09/18/13 12:45 / sld1mg/L30Sodium E200.7
09/20/13 09:51 / dck0.0005mg/LNDThallium E200.8
09/20/13 09:51 / dck0.01mg/L0.02Zinc E200.8
ReportDefinitions:
RL - Analyte reporting limit. MCL - Maximum contaminant level.
QCL - Quality control limit. ND - Not detected at the reporting limit.
D - RL increased due to sample matrix.
Page 7 of 42
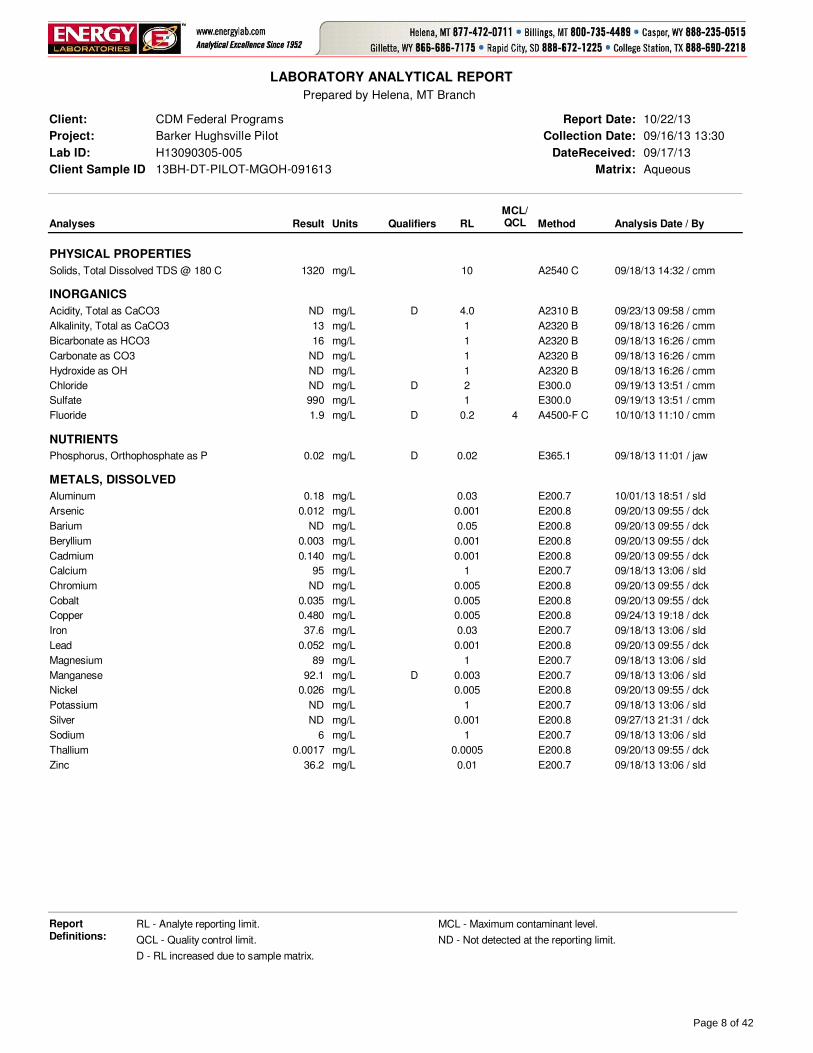
LABORATORY ANALYTICAL REPORT
Client: CDM Federal Programs
Project: Barker Hughsville Pilot
Lab ID: H13090305-005
Client Sample ID 13BH-DT-PILOT-MGOH-091613
Collection Date: 09/16/13 13:30
Matrix: Aqueous
Report Date: 10/22/13
DateReceived: 09/17/13
Prepared by Helena, MT Branch
Analyses Result Units Analysis Date / ByRL Method
MCL/QCLQualifiers
PHYSICAL PROPERTIES
09/18/13 14:32 / cmm10mg/L1320Solids, Total Dissolved TDS @ 180 C A2540 C
INORGANICS
D 09/23/13 09:58 / cmm4.0mg/LNDAcidity, Total as CaCO3 A2310 B
09/18/13 16:26 / cmm1mg/L13Alkalinity, Total as CaCO3 A2320 B
09/18/13 16:26 / cmm1mg/L16Bicarbonate as HCO3 A2320 B
09/18/13 16:26 / cmm1mg/LNDCarbonate as CO3 A2320 B
09/18/13 16:26 / cmm1mg/LNDHydroxide as OH A2320 B
D 09/19/13 13:51 / cmm2mg/LNDChloride E300.0
09/19/13 13:51 / cmm1mg/L990Sulfate E300.0
D 10/10/13 11:10 / cmm0.2mg/L1.9Fluoride A4500-F C4
NUTRIENTS
D 09/18/13 11:01 / jaw0.02mg/L0.02Phosphorus, Orthophosphate as P E365.1
METALS, DISSOLVED
10/01/13 18:51 / sld0.03mg/L0.18Aluminum E200.7
09/20/13 09:55 / dck0.001mg/L0.012Arsenic E200.8
09/20/13 09:55 / dck0.05mg/LNDBarium E200.8
09/20/13 09:55 / dck0.001mg/L0.003Beryllium E200.8
09/20/13 09:55 / dck0.001mg/L0.140Cadmium E200.8
09/18/13 13:06 / sld1mg/L95Calcium E200.7
09/20/13 09:55 / dck0.005mg/LNDChromium E200.8
09/20/13 09:55 / dck0.005mg/L0.035Cobalt E200.8
09/24/13 19:18 / dck0.005mg/L0.480Copper E200.8
09/18/13 13:06 / sld0.03mg/L37.6Iron E200.7
09/20/13 09:55 / dck0.001mg/L0.052Lead E200.8
09/18/13 13:06 / sld1mg/L89Magnesium E200.7
D 09/18/13 13:06 / sld0.003mg/L92.1Manganese E200.7
09/20/13 09:55 / dck0.005mg/L0.026Nickel E200.8
09/18/13 13:06 / sld1mg/LNDPotassium E200.7
09/27/13 21:31 / dck0.001mg/LNDSilver E200.8
09/18/13 13:06 / sld1mg/L6Sodium E200.7
09/20/13 09:55 / dck0.0005mg/L0.0017Thallium E200.8
09/18/13 13:06 / sld0.01mg/L36.2Zinc E200.7
ReportDefinitions:
RL - Analyte reporting limit. MCL - Maximum contaminant level.
QCL - Quality control limit. ND - Not detected at the reporting limit.
D - RL increased due to sample matrix.
Page 8 of 42

LABORATORY ANALYTICAL REPORT
Client: CDM Federal Programs
Project: Barker Hughsville Pilot
Lab ID: H13090305-006
Client Sample ID 13BH-DT-PILOT-BCR1-091613
Collection Date: 09/16/13 13:40
Matrix: Aqueous
Report Date: 10/22/13
DateReceived: 09/17/13
Prepared by Helena, MT Branch
Analyses Result Units Analysis Date / ByRL Method
MCL/QCLQualifiers
PHYSICAL PROPERTIES
09/18/13 14:32 / cmm10mg/L1500Solids, Total Dissolved TDS @ 180 C A2540 C
INORGANICS
D 09/23/13 09:58 / cmm4.0mg/L130Acidity, Total as CaCO3 A2310 B
09/18/13 16:32 / cmm1mg/L70Alkalinity, Total as CaCO3 A2320 B
09/18/13 16:32 / cmm1mg/L85Bicarbonate as HCO3 A2320 B
09/18/13 16:32 / cmm1mg/LNDCarbonate as CO3 A2320 B
09/18/13 16:32 / cmm1mg/LNDHydroxide as OH A2320 B
D 09/19/13 14:04 / cmm2mg/LNDChloride E300.0
09/19/13 14:04 / cmm1mg/L1000Sulfate E300.0
D 10/10/13 11:12 / cmm0.2mg/L1.4Fluoride A4500-F C4
D 09/20/13 11:45 / eli-b220.2mg/LNDSulfide A4500-S D
NUTRIENTS
D 09/18/13 10:56 / jaw0.01mg/L0.04Phosphorus, Orthophosphate as P E365.1
METALS, DISSOLVED
10/01/13 19:28 / sld0.03mg/L0.29Aluminum E200.7
09/20/13 10:00 / dck0.001mg/L0.006Arsenic E200.8
09/20/13 10:00 / dck0.05mg/LNDBarium E200.8
09/20/13 10:00 / dck0.001mg/L0.001Beryllium E200.8
09/20/13 10:00 / dck0.001mg/LNDCadmium E200.8
09/18/13 13:10 / sld1mg/L223Calcium E200.7
09/20/13 10:00 / dck0.005mg/LNDChromium E200.8
09/20/13 10:00 / dck0.005mg/L0.042Cobalt E200.8
09/20/13 10:00 / dck0.005mg/LNDCopper E200.8
09/18/13 13:10 / sld0.03mg/L74.7Iron E200.7
09/20/13 10:00 / dck0.001mg/LNDLead E200.8
09/18/13 13:10 / sld1mg/L22Magnesium E200.7
D 09/18/13 13:10 / sld0.003mg/L98.6Manganese E200.7
09/20/13 10:00 / dck0.005mg/L0.030Nickel E200.8
09/18/13 13:10 / sld1mg/LNDPotassium E200.7
09/27/13 21:37 / dck0.001mg/LNDSilver E200.8
09/18/13 13:10 / sld1mg/L5Sodium E200.7
09/20/13 10:00 / dck0.0005mg/LNDThallium E200.8
09/18/13 13:10 / sld0.01mg/L39.4Zinc E200.7
ReportDefinitions:
RL - Analyte reporting limit. MCL - Maximum contaminant level.
QCL - Quality control limit. ND - Not detected at the reporting limit.
D - RL increased due to sample matrix.
Page 9 of 42

LABORATORY ANALYTICAL REPORT
Client: CDM Federal Programs
Project: Barker Hughsville Pilot
Lab ID: H13090305-007
Client Sample ID 13BH-DT-PILOT-BCR3-091613
Collection Date: 09/16/13 13:50
Matrix: Aqueous
Report Date: 10/22/13
DateReceived: 09/17/13
Prepared by Helena, MT Branch
Analyses Result Units Analysis Date / ByRL Method
MCL/QCLQualifiers
PHYSICAL PROPERTIES
09/18/13 14:32 / cmm10mg/L2050Solids, Total Dissolved TDS @ 180 C A2540 C
INORGANICS
D 09/23/13 09:58 / cmm4.0mg/LNDAcidity, Total as CaCO3 A2310 B
09/18/13 16:42 / cmm1mg/L1300Alkalinity, Total as CaCO3 A2320 B
09/18/13 16:42 / cmm1mg/L1600Bicarbonate as HCO3 A2320 B
09/18/13 16:42 / cmm1mg/LNDCarbonate as CO3 A2320 B
09/18/13 16:42 / cmm1mg/LNDHydroxide as OH A2320 B
D 09/19/13 14:16 / cmm5mg/L8Chloride E300.0
D 09/19/13 14:16 / cmm2mg/L600Sulfate E300.0
D 10/10/13 11:12 / cmm0.2mg/L0.5Fluoride A4500-F C4
09/20/13 11:30 / eli-b221mg/L56Sulfide A4500-S F
NUTRIENTS
D 09/18/13 11:05 / jaw1mg/L26Phosphorus, Orthophosphate as P E365.1
METALS, DISSOLVED
09/20/13 10:04 / dck0.03mg/LNDAluminum E200.8
09/20/13 10:04 / dck0.001mg/L0.015Arsenic E200.8
09/20/13 10:04 / dck0.05mg/L0.09Barium E200.8
09/20/13 10:04 / dck0.001mg/LNDBeryllium E200.8
09/20/13 10:04 / dck0.001mg/LNDCadmium E200.8
09/18/13 13:14 / sld1mg/L435Calcium E200.7
09/20/13 10:04 / dck0.005mg/LNDChromium E200.8
09/20/13 10:04 / dck0.005mg/LNDCobalt E200.8
09/20/13 10:04 / dck0.005mg/LNDCopper E200.8
09/20/13 10:04 / dck0.03mg/L0.52Iron E200.8
09/20/13 10:04 / dck0.001mg/LNDLead E200.8
09/18/13 13:14 / sld1mg/L36Magnesium E200.7
D 09/18/13 13:14 / sld0.003mg/L61.3Manganese E200.7
09/20/13 10:04 / dck0.005mg/LNDNickel E200.8
09/20/13 10:04 / dck1mg/L6Potassium E200.8
09/27/13 21:44 / dck0.001mg/LNDSilver E200.8
09/18/13 13:14 / sld1mg/L24Sodium E200.7
09/20/13 10:04 / dck0.0005mg/LNDThallium E200.8
09/20/13 10:04 / dck0.01mg/L0.04Zinc E200.8
ReportDefinitions:
RL - Analyte reporting limit. MCL - Maximum contaminant level.
QCL - Quality control limit. ND - Not detected at the reporting limit.
D - RL increased due to sample matrix.
Page 10 of 42

LABORATORY ANALYTICAL REPORT
Client: CDM Federal Programs
Project: Barker Hughsville Pilot
Lab ID: H13090305-008
Client Sample ID 13BH-DT-PILOT-BDR3-091613
Collection Date: 09/16/13 13:55
Matrix: Aqueous
Report Date: 10/22/13
DateReceived: 09/17/13
Prepared by Helena, MT Branch
Analyses Result Units Analysis Date / ByRL Method
MCL/QCLQualifiers
PHYSICAL PROPERTIES
09/18/13 14:33 / cmm10mg/L2060Solids, Total Dissolved TDS @ 180 C A2540 C
INORGANICS
D 09/23/13 09:58 / cmm4.0mg/LNDAcidity, Total as CaCO3 A2310 B
09/18/13 16:53 / cmm1mg/L1300Alkalinity, Total as CaCO3 A2320 B
09/18/13 16:53 / cmm1mg/L1600Bicarbonate as HCO3 A2320 B
09/18/13 16:53 / cmm1mg/LNDCarbonate as CO3 A2320 B
09/18/13 16:53 / cmm1mg/LNDHydroxide as OH A2320 B
D 09/19/13 14:29 / cmm5mg/L9Chloride E300.0
09/30/13 17:04 / abb1mg/L450Sulfate E300.0
D 10/10/13 11:13 / cmm0.2mg/L0.5Fluoride A4500-F C4
09/20/13 11:30 / eli-b221mg/L52Sulfide A4500-S F
NUTRIENTS
D 09/18/13 11:06 / jaw1mg/L36Phosphorus, Orthophosphate as P E365.1
METALS, DISSOLVED
09/24/13 19:50 / dck0.03mg/LNDAluminum E200.8
09/20/13 10:09 / dck0.001mg/L0.016Arsenic E200.8
09/20/13 10:09 / dck0.05mg/L0.09Barium E200.8
09/20/13 10:09 / dck0.001mg/LNDBeryllium E200.8
09/20/13 10:09 / dck0.001mg/LNDCadmium E200.8
09/18/13 13:17 / sld1mg/L427Calcium E200.7
09/20/13 10:09 / dck0.005mg/LNDChromium E200.8
09/20/13 10:09 / dck0.005mg/LNDCobalt E200.8
09/20/13 10:09 / dck0.005mg/LNDCopper E200.8
09/20/13 10:09 / dck0.03mg/L0.10Iron E200.8
09/20/13 10:09 / dck0.001mg/LNDLead E200.8
09/18/13 13:17 / sld1mg/L36Magnesium E200.7
D 09/18/13 13:17 / sld0.003mg/L61.9Manganese E200.7
09/20/13 10:09 / dck0.005mg/LNDNickel E200.8
09/18/13 13:17 / sld1mg/L4Potassium E200.7
09/30/13 18:39 / dck0.001mg/LNDSilver E200.8
09/18/13 13:17 / sld1mg/L23Sodium E200.7
09/20/13 10:09 / dck0.0005mg/LNDThallium E200.8
09/20/13 10:09 / dck0.01mg/LNDZinc E200.8
ReportDefinitions:
RL - Analyte reporting limit. MCL - Maximum contaminant level.
QCL - Quality control limit. ND - Not detected at the reporting limit.
D - RL increased due to sample matrix.
Page 11 of 42

LABORATORY ANALYTICAL REPORT
Client: CDM Federal Programs
Project: Barker Hughsville Pilot
Lab ID: H13090305-009
Client Sample ID 13BH-DT-PILOT-BCR4-091613
Collection Date: 09/16/13 14:05
Matrix: Aqueous
Report Date: 10/22/13
DateReceived: 09/17/13
Prepared by Helena, MT Branch
Analyses Result Units Analysis Date / ByRL Method
MCL/QCLQualifiers
PHYSICAL PROPERTIES
09/18/13 14:33 / cmm10mg/L1460Solids, Total Dissolved TDS @ 180 C A2540 C
INORGANICS
D 09/23/13 09:58 / cmm4.0mg/L68Acidity, Total as CaCO3 A2310 B
09/18/13 17:10 / cmm1mg/L93Alkalinity, Total as CaCO3 A2320 B
09/18/13 17:10 / cmm1mg/L110Bicarbonate as HCO3 A2320 B
09/18/13 17:10 / cmm1mg/LNDCarbonate as CO3 A2320 B
09/18/13 17:10 / cmm1mg/LNDHydroxide as OH A2320 B
D 09/19/13 14:42 / cmm2mg/LNDChloride E300.0
09/19/13 14:42 / cmm1mg/L990Sulfate E300.0
D 10/10/13 11:14 / cmm0.2mg/L1.4Fluoride A4500-F C4
D 09/20/13 11:45 / eli-b220.2mg/LNDSulfide A4500-S D
NUTRIENTS
D 09/18/13 10:59 / jaw0.01mg/L0.04Phosphorus, Orthophosphate as P E365.1
METALS, DISSOLVED
09/20/13 10:32 / dck0.03mg/L0.06Aluminum E200.8
09/24/13 19:54 / dck0.001mg/L0.002Arsenic E200.8
09/20/13 10:32 / dck0.05mg/L0.07Barium E200.8
09/20/13 10:32 / dck0.001mg/LNDBeryllium E200.8
09/20/13 10:32 / dck0.001mg/LNDCadmium E200.8
09/18/13 13:21 / sld1mg/L191Calcium E200.7
09/20/13 10:32 / dck0.005mg/LNDChromium E200.8
09/24/13 19:54 / dck0.005mg/L0.019Cobalt E200.8
09/24/13 19:54 / dck0.005mg/LNDCopper E200.8
09/18/13 13:21 / sld0.03mg/L29.8Iron E200.7
09/20/13 10:32 / dck0.001mg/LNDLead E200.8
09/18/13 13:21 / sld1mg/L94Magnesium E200.7
D 09/18/13 13:21 / sld0.003mg/L86.4Manganese E200.7
09/20/13 10:32 / dck0.005mg/L0.013Nickel E200.8
09/18/13 13:21 / sld1mg/LNDPotassium E200.7
09/30/13 18:52 / dck0.001mg/LNDSilver E200.8
09/18/13 13:21 / sld1mg/L6Sodium E200.7
09/24/13 19:54 / dck0.0005mg/LNDThallium E200.8
09/18/13 13:21 / sld0.01mg/L3.29Zinc E200.7
ReportDefinitions:
RL - Analyte reporting limit. MCL - Maximum contaminant level.
QCL - Quality control limit. ND - Not detected at the reporting limit.
D - RL increased due to sample matrix.
Page 12 of 42
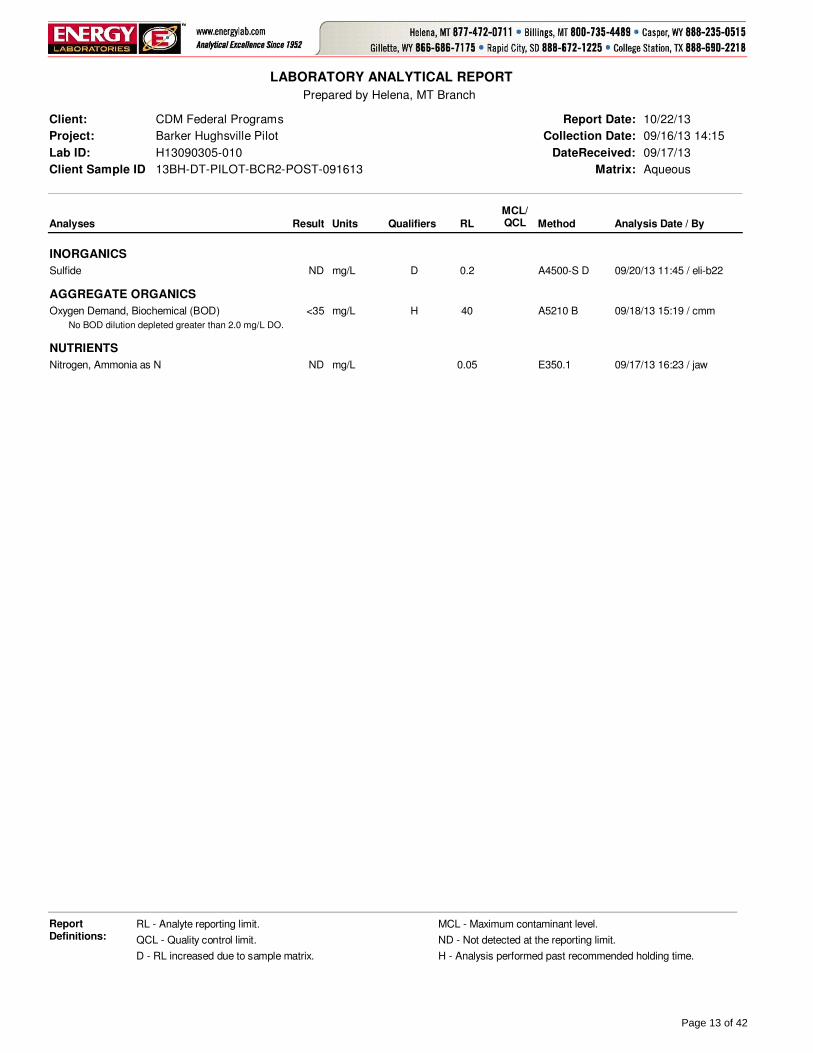
LABORATORY ANALYTICAL REPORT
Client: CDM Federal Programs
Project: Barker Hughsville Pilot
Lab ID: H13090305-010
Client Sample ID 13BH-DT-PILOT-BCR2-POST-091613
Collection Date: 09/16/13 14:15
Matrix: Aqueous
Report Date: 10/22/13
DateReceived: 09/17/13
Prepared by Helena, MT Branch
Analyses Result Units Analysis Date / ByRL Method
MCL/QCLQualifiers
INORGANICS
D 09/20/13 11:45 / eli-b220.2mg/LNDSulfide A4500-S D
AGGREGATE ORGANICS
H 09/18/13 15:19 / cmm40mg/L<35Oxygen Demand, Biochemical (BOD) A5210 B
No BOD dilution depleted greater than 2.0 mg/L DO.
NUTRIENTS
09/17/13 16:23 / jaw0.05mg/LNDNitrogen, Ammonia as N E350.1
ReportDefinitions:
RL - Analyte reporting limit. MCL - Maximum contaminant level.
QCL - Quality control limit. ND - Not detected at the reporting limit.
D - RL increased due to sample matrix. H - Analysis performed past recommended holding time.
Page 13 of 42

Project: Barker Hughsville Pilot
Client: CDM Federal Programs
Work Order: H13090305
QA/QC Summary Report
10/22/13Report Date:
Analyte Result %REC RPDLow Limit High Limit RPDLimitRLUnits QualCount
Prepared by Helena, MT Branch
Method: A2310 B Batch: H13090305-001A
Sample ID: H13090305-009ADUP 09/23/13 09:58Sample Duplicate Run: MISC WC_130923A
Acidity, Total as CaCO3 204.0 1680 mg/L
Sample ID: LCS1309230958 09/23/13 09:58Laboratory Control Sample Run: MISC WC_130923A
Acidity, Total as CaCO3 102 90 1104.0660 mg/L
Sample ID: MBLK1309230958 09/23/13 09:58Method Blank Run: MISC WC_130923A
Acidity, Total as CaCO3 3ND mg/L
Qualifiers:
RL - Analyte reporting limit. ND - Not detected at the reporting limit.
Page 14 of 42

Project: Barker Hughsville Pilot
Client: CDM Federal Programs
Work Order: H13090305
QA/QC Summary Report
10/22/13Report Date:
Analyte Result %REC RPDLow Limit High Limit RPDLimitRLUnits QualCount
Prepared by Helena, MT Branch
Method: A2320 B Batch: R91398
Sample ID: MBLK 09/18/13 15:42Method Blank Run: MAN-TECH_130918B
Alkalinity, Total as CaCO3 2ND mg/L
Sample ID: LCS-09182013 09/18/13 15:50Laboratory Control Sample Run: MAN-TECH_130918B
Alkalinity, Total as CaCO3 107 90 1104.0640 mg/L
Sample ID: H13090305-008ADUP 09/18/13 17:04Sample Duplicate Run: MAN-TECH_130918B3
Alkalinity, Total as CaCO3 104.0 0.71300 mg/L
Bicarbonate as HCO3 104.0 0.71600 mg/L
Carbonate as CO3 104.0ND mg/L
Sample ID: H13090305-009AMS 09/18/13 17:18Sample Matrix Spike Run: MAN-TECH_130918B
Alkalinity, Total as CaCO3 95 80 1204.0670 mg/L
Qualifiers:
RL - Analyte reporting limit. ND - Not detected at the reporting limit.
Page 15 of 42

Project: Barker Hughsville Pilot
Client: CDM Federal Programs
Work Order: H13090305
QA/QC Summary Report
10/22/13Report Date:
Analyte Result %REC RPDLow Limit High Limit RPDLimitRLUnits QualCount
Prepared by Helena, MT Branch
Method: A2540 C Batch: TDS130918A
Sample ID: MB-1_130918A 09/18/13 14:30Method Blank Run: ACCU-124 (14410200)_130918
Solids, Total Dissolved TDS @ 180 C 1ND mg/L
Sample ID: LCS-2_130918A 09/18/13 14:30Laboratory Control Sample Run: ACCU-124 (14410200)_130918
Solids, Total Dissolved TDS @ 180 C 94 90 110101880 mg/L
Sample ID: H13090288-001A DUP 09/18/13 14:31Sample Duplicate Run: ACCU-124 (14410200)_130918
Solids, Total Dissolved TDS @ 180 C 510 6.511600 mg/L R
Sample ID: H13090305-001A MS 09/18/13 14:31Sample Matrix Spike Run: ACCU-124 (14410200)_130918
Solids, Total Dissolved TDS @ 180 C 96 80 120103370 mg/L
Sample ID: H13090315-001A DUP 09/18/13 14:33Sample Duplicate Run: ACCU-124 (14410200)_130918
Solids, Total Dissolved TDS @ 180 C 510 0.41080 mg/L
Qualifiers:
RL - Analyte reporting limit. ND - Not detected at the reporting limit.
R - RPD exceeds advisory limit.
Page 16 of 42

Project: Barker Hughsville Pilot
Client: CDM Federal Programs
Work Order: H13090305
QA/QC Summary Report
10/22/13Report Date:
Analyte Result %REC RPDLow Limit High Limit RPDLimitRLUnits QualCount
Prepared by Helena, MT Branch
Method: A4500-F C Analytical Run: PH_131010A
Sample ID: ICV1_130923A 10/10/13 10:33Initial Calibration Verification Standard
Fluoride 98 90 1100.10.7 mg/L
Sample ID: CCV1_131009A 10/10/13 11:06Continuing Calibration Verification Standard
Fluoride 100 90 1100.10.2 mg/L
Method: A4500-F C Batch: 131009A-F-ISE-W
Sample ID: MBLK1_130923A 10/10/13 09:53Method Blank Run: PH_131010A
Fluoride 0.0050.009 mg/L
Sample ID: LFB1_130923A 10/10/13 10:34Laboratory Fortified Blank Run: PH_131010A
Fluoride 97 90 1100.10.5 mg/L
Sample ID: H13090305-004AMS 10/10/13 11:08Sample Matrix Spike Run: PH_131010A
Fluoride 95 85 1150.21.6 mg/L
Sample ID: H13090305-004AMSD 10/10/13 11:09Sample Matrix Spike Duplicate Run: PH_131010A
Fluoride 95 85 115 100.2 0.31.6 mg/L
Qualifiers:
RL - Analyte reporting limit. ND - Not detected at the reporting limit.
Page 17 of 42

Project: Barker Hughsville Pilot
Client: CDM Federal Programs
Work Order: H13090305
QA/QC Summary Report
10/22/13Report Date:
Analyte Result %REC RPDLow Limit High Limit RPDLimitRLUnits QualCount
Prepared by Helena, MT Branch
Method: A4500-S D Batch: B_R212014
Sample ID: MB-R212014 09/20/13 11:45Method Blank Run: SUB-B212014
Sulfide 0.002ND mg/L
Sample ID: LCS-R212014 09/20/13 11:45Laboratory Control Sample Run: SUB-B212014
Sulfide 122 70 1300.0400.310 mg/L
Sample ID: B13091569-001EMS 09/20/13 11:45Sample Matrix Spike Run: SUB-B212014
Sulfide 102 70 1300.0400.259 mg/L
Sample ID: B13091569-001EMSD 09/20/13 11:45Sample Matrix Spike Duplicate Run: SUB-B212014
Sulfide 110 70 130 200.040 7.60.279 mg/L
Sample ID: B13091670-001DMS 09/20/13 11:45Sample Matrix Spike Run: SUB-B212014
Sulfide 110 70 1300.0400.312 mg/L
Sample ID: B13091670-001DMSD 09/20/13 11:45Sample Matrix Spike Duplicate Run: SUB-B212014
Sulfide 110 70 130 200.040 0.40.313 mg/L
Qualifiers:
RL - Analyte reporting limit. ND - Not detected at the reporting limit.
Page 18 of 42

Project: Barker Hughsville Pilot
Client: CDM Federal Programs
Work Order: H13090305
QA/QC Summary Report
10/22/13Report Date:
Analyte Result %REC RPDLow Limit High Limit RPDLimitRLUnits QualCount
Prepared by Helena, MT Branch
Method: A4500-S F Batch: B_R212012
Sample ID: MB-R212012 09/20/13 11:30Method Blank Run: SUB-B212012
Sulfide 0.5ND mg/L
Sample ID: LCS-R212012 09/20/13 11:30Laboratory Control Sample Run: SUB-B212012
Sulfide 100 70 1301.018.2 mg/L
Sample ID: B13091603-002AMS 09/20/13 11:30Sample Matrix Spike Run: SUB-B212012
Sulfide 100 80 1201.0311 mg/L
Sample ID: B13091603-002AMSD 09/20/13 11:30Sample Matrix Spike Duplicate Run: SUB-B212012
Sulfide 99 80 120 201.0 0.4310 mg/L
Qualifiers:
RL - Analyte reporting limit. ND - Not detected at the reporting limit.
Page 19 of 42

Project: Barker Hughsville Pilot
Client: CDM Federal Programs
Work Order: H13090305
QA/QC Summary Report
10/22/13Report Date:
Analyte Result %REC RPDLow Limit High Limit RPDLimitRLUnits QualCount
Prepared by Helena, MT Branch
Method: A5210 B Batch: 130918_1_BOD5-W
Sample ID: Dil-H201_130918 09/18/13 15:09Dilution Water Blank Run: MISC WC_130918A
Oxygen Demand, Biochemical (BOD) 0 0.22.00.22 mg/L
Dilution water blank exceeds 0.2 mg/L.
Sample ID: GGA1_130918 09/18/13 15:14Laboratory Control Sample Run: MISC WC_130918A
Oxygen Demand, Biochemical (BOD) 104 85 11558210 mg/L
Sample ID: H13090338-001BDUP 09/18/13 15:27Sample Duplicate Run: MISC WC_130918A
Oxygen Demand, Biochemical (BOD) 90 110 10120ND mg/L
No BOD dilution depleted greater than 2.0 mg/L DO.
Qualifiers:
RL - Analyte reporting limit. ND - Not detected at the reporting limit.
Page 20 of 42

Project: Barker Hughsville Pilot
Client: CDM Federal Programs
Work Order: H13090305
QA/QC Summary Report
10/22/13Report Date:
Analyte Result %REC RPDLow Limit High Limit RPDLimitRLUnits QualCount
Prepared by Helena, MT Branch
Method: E200.7 Analytical Run: ICP2-HE_130918A
Sample ID: ICV 09/18/13 11:11Initial Calibration Verification Standard8
Aluminum 101 95 1050.104.04 mg/L
Calcium 100 95 1051.040.1 mg/L
Iron 99 95 1050.0303.97 mg/L
Magnesium 100 95 1051.039.8 mg/L
Manganese 99 95 1050.0103.98 mg/L
Potassium 102 95 1051.040.6 mg/L
Sodium 102 95 1051.040.7 mg/L
Zinc 102 95 1050.0100.816 mg/L
Sample ID: CCV-1 09/18/13 11:15Continuing Calibration Verification Standard8
Aluminum 101 95 1050.102.54 mg/L
Calcium 101 95 1051.025.2 mg/L
Iron 101 95 1050.0302.51 mg/L
Magnesium 99 95 1051.024.9 mg/L
Manganese 100 95 1050.0102.49 mg/L
Potassium 101 95 1051.025.2 mg/L
Sodium 101 95 1051.025.2 mg/L
Zinc 102 95 1050.0102.55 mg/L
Sample ID: ICSA 09/18/13 11:30Interference Check Sample A8
Aluminum 103 80 1200.10516 mg/L
Calcium 95 80 1201.0473 mg/L
Iron 94 80 1200.030188 mg/L
Magnesium 102 80 1201.0508 mg/L
Manganese 0 00.0100.00164 mg/L
Potassium 0 01.0-0.0799 mg/L
Sodium 0 01.00.0312 mg/L
Zinc 0 00.0100.0123 mg/L
Sample ID: ICSAB 09/18/13 11:34Interference Check Sample AB8
Aluminum 104 80 1200.10522 mg/L
Calcium 94 80 1201.0470 mg/L
Iron 94 80 1200.030187 mg/L
Magnesium 101 80 1201.0506 mg/L
Manganese 96 80 1200.0100.480 mg/L
Potassium 115 80 1201.023.0 mg/L
Sodium 115 80 1201.023.1 mg/L
Zinc 105 80 1200.0101.05 mg/L
Sample ID: CCV 09/18/13 12:04Continuing Calibration Verification Standard8
Aluminum 101 90 1100.102.53 mg/L
Calcium 101 90 1101.025.2 mg/L
Iron 101 90 1100.0302.52 mg/L
Magnesium 101 90 1101.025.4 mg/L
Manganese 99 90 1100.0102.48 mg/L
Qualifiers:
RL - Analyte reporting limit. ND - Not detected at the reporting limit.
Page 21 of 42

Project: Barker Hughsville Pilot
Client: CDM Federal Programs
Work Order: H13090305
QA/QC Summary Report
10/22/13Report Date:
Analyte Result %REC RPDLow Limit High Limit RPDLimitRLUnits QualCount
Prepared by Helena, MT Branch
Method: E200.7 Analytical Run: ICP2-HE_130918A
Sample ID: CCV 09/18/13 12:04Continuing Calibration Verification Standard8
Potassium 100 90 1101.024.9 mg/L
Sodium 99 90 1101.024.9 mg/L
Zinc 109 90 1100.0102.73 mg/L
Sample ID: CCV 09/18/13 12:48Continuing Calibration Verification Standard8
Aluminum 102 90 1100.102.55 mg/L
Calcium 102 90 1101.025.5 mg/L
Iron 101 90 1100.0302.53 mg/L
Magnesium 105 90 1101.026.2 mg/L
Manganese 100 90 1100.0102.50 mg/L
Potassium 99 90 1101.024.8 mg/L
Sodium 99 90 1101.024.9 mg/L
Zinc 107 90 1100.0102.67 mg/L
Method: E200.7 Batch: R91399
Sample ID: ICB 09/18/13 11:42Method Blank Run: ICP2-HE_130918A8
Aluminum 0.009ND mg/L
Calcium 0.030.04 mg/L
Iron 0.005ND mg/L
Magnesium 0.02ND mg/L
Manganese 0.0005ND mg/L
Potassium 0.03ND mg/L
Sodium 0.03ND mg/L
Zinc 0.001ND mg/L
Sample ID: LFB 09/18/13 11:46Laboratory Fortified Blank Run: ICP2-HE_130918A8
Aluminum 98 85 1150.104.92 mg/L
Calcium 97 85 1151.048.5 mg/L
Iron 97 85 1150.0304.84 mg/L
Magnesium 98 85 1151.049.2 mg/L
Manganese 96 85 1150.0104.81 mg/L
Potassium 98 85 1151.049.0 mg/L
Sodium 98 85 1151.049.2 mg/L
Zinc 102 85 1150.0101.02 mg/L
Sample ID: H13090305-004BMS2 09/18/13 12:59Sample Matrix Spike Run: ICP2-HE_130918A8
Aluminum 102 70 1300.04625.5 mg/L
Calcium 95 70 1301.0614 mg/L
Iron 94 70 1300.03062.9 mg/L
Magnesium 102 70 1301.0297 mg/L
Manganese 88 70 1300.0027116 mg/L
Potassium 101 70 1301.0258 mg/L
Sodium 101 70 1301.0283 mg/L
Zinc 110 70 1300.0105.51 mg/L
Qualifiers:
RL - Analyte reporting limit. ND - Not detected at the reporting limit.
Page 22 of 42

Project: Barker Hughsville Pilot
Client: CDM Federal Programs
Work Order: H13090305
QA/QC Summary Report
10/22/13Report Date:
Analyte Result %REC RPDLow Limit High Limit RPDLimitRLUnits QualCount
Prepared by Helena, MT Branch
Method: E200.7 Batch: R91399
Sample ID: H13090305-004BMSD2 09/18/13 13:03Sample Matrix Spike Duplicate Run: ICP2-HE_130918A8
Aluminum 102 70 130 200.046 0.425.6 mg/L
Calcium 93 70 130 201.0 0.8610 mg/L
Iron 93 70 130 200.030 0.262.7 mg/L
Magnesium 102 70 130 201.0 0.2297 mg/L
Manganese 84 70 130 200.0027 0.8115 mg/L
Potassium 101 70 130 201.0 0.3258 mg/L
Sodium 101 70 130 201.0 0.1282 mg/L
Zinc 107 70 130 200.010 2.45.38 mg/L
Sample ID: H13090286-001BMS2 09/18/13 13:43Sample Matrix Spike Run: ICP2-HE_130918A8
Aluminum 104 70 1300.0305.24 mg/L
Calcium 99 70 1301.0154 mg/L
Iron 100 70 1300.0305.18 mg/L
Magnesium 103 70 1301.078.5 mg/L
Manganese 99 70 1300.00105.91 mg/L
Potassium 104 70 1301.072.3 mg/L
Sodium 104 70 1301.063.0 mg/L
Zinc 103 70 1300.0101.17 mg/L
Sample ID: H13090286-001BMSD2 09/18/13 13:47Sample Matrix Spike Duplicate Run: ICP2-HE_130918A8
Aluminum 103 70 130 200.030 1.45.16 mg/L
Calcium 96 70 130 201.0 0.8152 mg/L
Iron 99 70 130 200.030 1.25.12 mg/L
Magnesium 103 70 130 201.0 0.278.4 mg/L
Manganese 98 70 130 200.0010 1.35.83 mg/L
Potassium 101 70 130 201.0 2.370.7 mg/L
Sodium 101 70 130 201.0 2.461.5 mg/L
Zinc 109 70 130 200.010 4.41.22 mg/L
Qualifiers:
RL - Analyte reporting limit. ND - Not detected at the reporting limit.
Page 23 of 42

Project: Barker Hughsville Pilot
Client: CDM Federal Programs
Work Order: H13090305
QA/QC Summary Report
10/22/13Report Date:
Analyte Result %REC RPDLow Limit High Limit RPDLimitRLUnits QualCount
Prepared by Helena, MT Branch
Method: E200.7 Analytical Run: ICP2-HE_130927A
Sample ID: ICV 09/27/13 11:59Initial Calibration Verification Standard
Aluminum 102 95 1050.104.06 mg/L
Sample ID: CCV-1 09/27/13 12:03Continuing Calibration Verification Standard
Aluminum 101 95 1050.102.53 mg/L
Sample ID: ICSA 09/27/13 12:14Interference Check Sample A
Aluminum 103 80 1200.10517 mg/L
Sample ID: ICSAB 09/27/13 12:18Interference Check Sample AB
Aluminum 102 80 1200.10509 mg/L
Sample ID: CCV 09/27/13 13:32Continuing Calibration Verification Standard
Aluminum 101 90 1100.102.52 mg/L
Method: E200.7 Batch: R91627
Sample ID: ICB 09/27/13 12:26Method Blank Run: ICP2-HE_130927A
Aluminum 0.0040.006 mg/L
Sample ID: LFB 09/27/13 12:30Laboratory Fortified Blank Run: ICP2-HE_130927A
Aluminum 98 85 1150.104.88 mg/L
Sample ID: H13090305-006CMS2 09/27/13 14:05Sample Matrix Spike Run: ICP2-HE_130927A
Aluminum 99 70 1300.04625.1 mg/L
Sample ID: H13090305-006CMSD2 09/27/13 14:09Sample Matrix Spike Duplicate Run: ICP2-HE_130927A
Aluminum 101 70 130 200.046 1.225.4 mg/L
Qualifiers:
RL - Analyte reporting limit. ND - Not detected at the reporting limit.
Page 24 of 42

Project: Barker Hughsville Pilot
Client: CDM Federal Programs
Work Order: H13090305
QA/QC Summary Report
10/22/13Report Date:
Analyte Result %REC RPDLow Limit High Limit RPDLimitRLUnits QualCount
Prepared by Helena, MT Branch
Method: E200.7 Analytical Run: ICP2-HE_131001A
Sample ID: ICV 10/01/13 15:07Initial Calibration Verification Standard
Aluminum 100 95 1050.104.02 mg/L
Sample ID: CCV-1 10/01/13 15:10Continuing Calibration Verification Standard
Aluminum 101 95 1050.102.52 mg/L
Sample ID: ICSA 10/01/13 15:22Interference Check Sample A
Aluminum 105 80 1200.10523 mg/L
Sample ID: ICSAB 10/01/13 15:26Interference Check Sample AB
Aluminum 104 80 1200.10520 mg/L
Sample ID: CCV 10/01/13 18:10Continuing Calibration Verification Standard
Aluminum 100 90 1100.102.50 mg/L
Sample ID: CCV 10/01/13 19:21Continuing Calibration Verification Standard
Aluminum 101 90 1100.102.54 mg/L
Method: E200.7 Batch: R91692
Sample ID: ICB 10/01/13 15:33Method Blank Run: ICP2-HE_131001A
Aluminum 0.009ND mg/L
Sample ID: LFB 10/01/13 15:37Laboratory Fortified Blank Run: ICP2-HE_131001A
Aluminum 97 85 1150.104.87 mg/L
Sample ID: H13090274-007DMS2 10/01/13 18:03Sample Matrix Spike Run: ICP2-HE_131001A
Aluminum 99 70 1300.0304.99 mg/L
Sample ID: H13090274-007DMSD2 10/01/13 18:06Sample Matrix Spike Duplicate Run: ICP2-HE_131001A
Aluminum 101 70 130 200.030 1.95.08 mg/L
Sample ID: H13090305-006CMS2 10/01/13 19:36Sample Matrix Spike Run: ICP2-HE_131001A
Aluminum 99 70 1300.04625.1 mg/L
Sample ID: H13090305-006CMSD2 10/01/13 19:39Sample Matrix Spike Duplicate Run: ICP2-HE_131001A
Aluminum 101 70 130 200.046 1.225.4 mg/L
Sample ID: H13090305-008DMS2 10/01/13 19:50Sample Matrix Spike Run: ICP2-HE_131001A
Aluminum 101 70 1300.04625.2 mg/L
Sample ID: H13090305-008DMSD2 10/01/13 19:53Sample Matrix Spike Duplicate Run: ICP2-HE_131001A
Aluminum 104 70 130 200.046 2.825.9 mg/L
Qualifiers:
RL - Analyte reporting limit. ND - Not detected at the reporting limit.
Page 25 of 42

Project: Barker Hughsville Pilot
Client: CDM Federal Programs
Work Order: H13090305
QA/QC Summary Report
10/22/13Report Date:
Analyte Result %REC RPDLow Limit High Limit RPDLimitRLUnits QualCount
Prepared by Helena, MT Branch
Method: E200.8 Analytical Run: ICPMS204-B_130918A
Sample ID: ICV STD 09/18/13 19:57Initial Calibration Verification Standard14
Aluminum 95 90 1100.100.284 mg/L
Arsenic 96 90 1100.00500.0578 mg/L
Barium 99 90 1100.100.0596 mg/L
Beryllium 100 90 1100.00100.0300 mg/L
Cadmium 99 90 1100.00100.0298 mg/L
Chromium 102 90 1100.0100.0610 mg/L
Cobalt 102 90 1100.0100.0610 mg/L
Copper 105 90 1100.0100.0627 mg/L
Iron 107 90 1100.0300.320 mg/L
Lead 103 90 1100.0100.0617 mg/L
Nickel 103 90 1100.0100.0616 mg/L
Potassium 97 90 1100.502.92 mg/L
Thallium 98 90 1100.100.0586 mg/L
Zinc 102 90 1100.0100.0613 mg/L
Sample ID: ICSA 09/19/13 06:12Interference Check Sample A14
Aluminum 93 70 1300.1037.1 mg/L
Arsenic 0.00500.000217 mg/L
Barium 0.100.000183 mg/L
Beryllium 0.00101.30E-05 mg/L
Cadmium 0.00100.00109 mg/L
Chromium 0.0100.00120 mg/L
Cobalt 0.0100.000270 mg/L
Copper 0.0100.000140 mg/L
Iron 98 70 1300.03097.6 mg/L
Lead 0.0100.000163 mg/L
Nickel 0.0100.000607 mg/L
Potassium 93 70 1300.5037.2 mg/L
Thallium 0.100.000165 mg/L
Zinc 0.0100.000910 mg/L
Sample ID: ICSAB 09/19/13 06:17Interference Check Sample AB14
Aluminum 93 70 1300.1037.1 mg/L
Arsenic 100 70 1300.00500.00995 mg/L
Barium 0 00.109.90E-05 mg/L
Beryllium 0 00.00101.00E-05 mg/L
Cadmium 103 70 1300.00100.0103 mg/L
Chromium 107 70 1300.0100.0214 mg/L
Cobalt 101 70 1300.0100.0202 mg/L
Copper 101 70 1300.0100.0203 mg/L
Iron 96 70 1300.03096.4 mg/L
Lead 0 00.0100.000150 mg/L
Nickel 103 70 1300.0100.0206 mg/L
Potassium 93 70 1300.5037.2 mg/L
Thallium 0 00.100.000115 mg/L
Qualifiers:
RL - Analyte reporting limit. ND - Not detected at the reporting limit.
Page 26 of 42

Project: Barker Hughsville Pilot
Client: CDM Federal Programs
Work Order: H13090305
QA/QC Summary Report
10/22/13Report Date:
Analyte Result %REC RPDLow Limit High Limit RPDLimitRLUnits QualCount
Prepared by Helena, MT Branch
Method: E200.8 Analytical Run: ICPMS204-B_130918A
Sample ID: ICSAB 09/19/13 06:17Interference Check Sample AB14
Zinc 111 70 1300.0100.0111 mg/L
Sample ID: ICV STD 09/19/13 14:22Initial Calibration Verification Standard14
Aluminum 96 90 1100.100.289 mg/L
Arsenic 98 90 1100.00500.0585 mg/L
Barium 100 90 1100.100.0601 mg/L
Beryllium 100 90 1100.00100.0300 mg/L
Cadmium 104 90 1100.00100.0313 mg/L
Chromium 100 90 1100.0100.0602 mg/L
Cobalt 109 90 1100.0100.0655 mg/L
Copper 101 90 1100.0100.0608 mg/L
Iron 106 90 1100.0300.317 mg/L
Lead 100 90 1100.0100.0601 mg/L
Nickel 100 90 1100.0100.0602 mg/L
Potassium 103 90 1100.503.09 mg/L
Thallium 105 90 1100.100.0629 mg/L
Zinc 100 90 1100.0100.0598 mg/L
Sample ID: ICSA 09/19/13 14:27Interference Check Sample A14
Aluminum 93 70 1300.1037.1 mg/L
Arsenic 0.00500.000208 mg/L
Barium 0.100.000172 mg/L
Beryllium 0.00101.70E-05 mg/L
Cadmium 0.00100.00110 mg/L
Chromium 0.0100.00112 mg/L
Cobalt 0.0100.000303 mg/L
Copper 0.0100.000224 mg/L
Iron 96 70 1300.03095.8 mg/L
Lead 0.0100.000183 mg/L
Nickel 0.0100.000551 mg/L
Potassium 97 70 1300.5039.0 mg/L
Thallium 0.100.000110 mg/L
Zinc 0.0100.00106 mg/L
Sample ID: ICSAB 09/19/13 14:31Interference Check Sample AB14
Aluminum 94 70 1300.1037.5 mg/L
Arsenic 105 70 1300.00500.0105 mg/L
Barium 0 00.100.000105 mg/L
Beryllium 0 00.00102.60E-05 mg/L
Cadmium 108 70 1300.00100.0108 mg/L
Chromium 107 70 1300.0100.0215 mg/L
Cobalt 109 70 1300.0100.0219 mg/L
Copper 103 70 1300.0100.0205 mg/L
Iron 101 70 1300.030101 mg/L
Lead 0 00.0100.000140 mg/L
Qualifiers:
RL - Analyte reporting limit. ND - Not detected at the reporting limit.
Page 27 of 42

Project: Barker Hughsville Pilot
Client: CDM Federal Programs
Work Order: H13090305
QA/QC Summary Report
10/22/13Report Date:
Analyte Result %REC RPDLow Limit High Limit RPDLimitRLUnits QualCount
Prepared by Helena, MT Branch
Method: E200.8 Analytical Run: ICPMS204-B_130918A
Sample ID: ICSAB 09/19/13 14:31Interference Check Sample AB14
Nickel 105 70 1300.0100.0210 mg/L
Potassium 104 70 1300.5041.5 mg/L
Thallium 0 00.106.10E-05 mg/L
Zinc 110 70 1300.0100.0110 mg/L
Sample ID: ICSA 09/20/13 06:41Interference Check Sample A14
Aluminum 92 70 1300.1036.9 mg/L
Arsenic 0.00500.000233 mg/L
Barium 0.100.000149 mg/L
Beryllium 0.00106.20E-05 mg/L
Cadmium 0.00100.00107 mg/L
Chromium 0.0100.00119 mg/L
Cobalt 0.0100.000298 mg/L
Copper 0.0100.000291 mg/L
Iron 103 70 1300.030103 mg/L
Lead 0.0100.000167 mg/L
Nickel 0.0100.000625 mg/L
Potassium 103 70 1300.5041.1 mg/L
Thallium 0.108.00E-05 mg/L
Zinc 0.0100.000951 mg/L
Sample ID: ICSAB 09/20/13 06:46Interference Check Sample AB14
Aluminum 92 70 1300.1036.9 mg/L
Arsenic 111 70 1300.00500.0111 mg/L
Barium 0 00.100.000124 mg/L
Beryllium 0 00.00103.30E-05 mg/L
Cadmium 107 70 1300.00100.0107 mg/L
Chromium 106 70 1300.0100.0211 mg/L
Cobalt 108 70 1300.0100.0216 mg/L
Copper 103 70 1300.0100.0205 mg/L
Iron 100 70 1300.030100 mg/L
Lead 0 00.0100.000145 mg/L
Nickel 106 70 1300.0100.0211 mg/L
Potassium 103 70 1300.5041.0 mg/L
Thallium 0 00.106.90E-05 mg/L
Zinc 117 70 1300.0100.0117 mg/L
Method: E200.8 Batch: R91408
Sample ID: ICB 09/19/13 15:14Method Blank Run: ICPMS204-B_130918A14
Aluminum 0.0001ND mg/L
Arsenic 7E-05ND mg/L
Barium 5E-05ND mg/L
Beryllium 2E-05ND mg/L
Cadmium 7E-06ND mg/L
Chromium 4E-05ND mg/L
Qualifiers:
RL - Analyte reporting limit. ND - Not detected at the reporting limit.
Page 28 of 42

Project: Barker Hughsville Pilot
Client: CDM Federal Programs
Work Order: H13090305
QA/QC Summary Report
10/22/13Report Date:
Analyte Result %REC RPDLow Limit High Limit RPDLimitRLUnits QualCount
Prepared by Helena, MT Branch
Method: E200.8 Batch: R91408
Sample ID: ICB 09/19/13 15:14Method Blank Run: ICPMS204-B_130918A14
Cobalt 2E-05ND mg/L
Copper 3E-05ND mg/L
Iron 0.00020.0007 mg/L
Lead 6E-06ND mg/L
Nickel 6E-05ND mg/L
Potassium 0.02ND mg/L
Thallium 1E-05ND mg/L
Zinc 0.0003ND mg/L
Sample ID: LFB 09/19/13 15:19Laboratory Fortified Blank Run: ICPMS204-B_130918A14
Aluminum 103 85 1150.100.0513 mg/L
Arsenic 98 85 1150.00500.0490 mg/L
Barium 99 85 1150.100.0493 mg/L
Beryllium 101 85 1150.00100.0504 mg/L
Cadmium 101 85 1150.00100.0507 mg/L
Chromium 99 85 1150.0100.0497 mg/L
Cobalt 109 85 1150.0100.0544 mg/L
Copper 100 85 1150.0100.0502 mg/L
Iron 106 85 1150.0300.159 mg/L
Lead 100 85 1150.0100.0501 mg/L
Nickel 102 85 1150.0100.0508 mg/L
Potassium 102 85 1150.501.02 mg/L
Thallium 103 85 1150.100.0517 mg/L
Zinc 100 85 1150.0100.0502 mg/L
Sample ID: H13090305-003BMS 09/20/13 09:37Sample Matrix Spike Run: ICPMS204-B_130918A14
Aluminum 70 1300.03010.3 mg/L A
Arsenic 99 70 1300.00100.102 mg/L
Barium 92 70 1300.0500.0677 mg/L
Beryllium 88 70 1300.00100.0503 mg/L
Cadmium 73 70 1300.00100.136 mg/L
Chromium 93 70 1300.00500.0529 mg/L
Cobalt 97 70 1300.00500.0877 mg/L
Copper 70 1300.00500.695 mg/L A
Iron 70 1300.030101 mg/L A
Lead 89 70 1300.00100.228 mg/L
Nickel 91 70 1300.00500.0719 mg/L
Potassium 96 70 1301.01.73 mg/L
Thallium 104 70 1300.000500.0542 mg/L
Zinc 70 1300.01042.3 mg/L A
Sample ID: H13090305-003BMSD 09/20/13 09:42Sample Matrix Spike Duplicate Run: ICPMS204-B_130918A14
Aluminum 70 130 200.030 1.510.4 mg/L A
Arsenic 102 70 130 200.0010 1.60.103 mg/L
Barium 93 70 130 200.050 0.80.0682 mg/L
Qualifiers:
RL - Analyte reporting limit. A - The analyte level was greater than four times the spike level. In accordance with the method % recovery is not calculated.
ND - Not detected at the reporting limit.
Page 29 of 42

Project: Barker Hughsville Pilot
Client: CDM Federal Programs
Work Order: H13090305
QA/QC Summary Report
10/22/13Report Date:
Analyte Result %REC RPDLow Limit High Limit RPDLimitRLUnits QualCount
Prepared by Helena, MT Branch
Method: E200.8 Batch: R91408
Sample ID: H13090305-003BMSD 09/20/13 09:42Sample Matrix Spike Duplicate Run: ICPMS204-B_130918A14
Beryllium 91 70 130 200.0010 3.60.0521 mg/L
Cadmium 75 70 130 200.0010 0.70.137 mg/L
Chromium 94 70 130 200.0050 1.10.0535 mg/L
Cobalt 102 70 130 200.0050 3.20.0905 mg/L
Copper 70 130 200.0050 2.90.715 mg/L A
Iron 70 130 200.030 0.0101 mg/L A
Lead 97 70 130 200.0010 1.90.233 mg/L
Nickel 95 70 130 200.0050 2.70.0739 mg/L
Potassium 100 70 130 201.0 2.31.77 mg/L
Thallium 107 70 130 200.00050 3.00.0558 mg/L
Zinc 70 130 200.010 0.842.7 mg/L A
Qualifiers:
RL - Analyte reporting limit. A - The analyte level was greater than four times the spike level. In accordance with the method % recovery is not calculated.
ND - Not detected at the reporting limit.
Page 30 of 42

Project: Barker Hughsville Pilot
Client: CDM Federal Programs
Work Order: H13090305
QA/QC Summary Report
10/22/13Report Date:
Analyte Result %REC RPDLow Limit High Limit RPDLimitRLUnits QualCount
Prepared by Helena, MT Branch
Method: E200.8 Analytical Run: ICPMS204-B_130924A
Sample ID: ICV STD 09/24/13 14:11Initial Calibration Verification Standard5
Aluminum 96 90 1100.100.287 mg/L
Arsenic 97 90 1100.00500.0580 mg/L
Cobalt 98 90 1100.0100.0589 mg/L
Copper 100 90 1100.0100.0600 mg/L
Thallium 97 90 1100.100.0579 mg/L
Sample ID: ICSA 09/24/13 14:15Interference Check Sample A5
Aluminum 87 70 1300.1034.8 mg/L
Arsenic 0.0050-7.90E-05 mg/L
Cobalt 0.0100.000225 mg/L
Copper 0.0100.000341 mg/L
Thallium 0.103.70E-05 mg/L
Sample ID: ICSAB 09/24/13 14:19Interference Check Sample AB5
Aluminum 87 70 1300.1035.0 mg/L
Arsenic 94 70 1300.00500.00944 mg/L
Cobalt 94 70 1300.0100.0187 mg/L
Copper 92 70 1300.0100.0184 mg/L
Thallium 0 00.101.90E-05 mg/L
Sample ID: ICV STD 09/24/13 17:44Initial Calibration Verification Standard5
Aluminum 96 90 1100.100.287 mg/L
Arsenic 97 90 1100.00500.0580 mg/L
Cobalt 102 90 1100.0100.0611 mg/L
Copper 101 90 1100.0100.0607 mg/L
Thallium 95 90 1100.100.0571 mg/L
Sample ID: ICSA 09/24/13 17:49Interference Check Sample A5
Aluminum 91 70 1300.1036.3 mg/L
Arsenic 0.00509.30E-05 mg/L
Cobalt 0.0100.000360 mg/L
Copper 0.0100.000267 mg/L
Thallium 0.103.40E-05 mg/L
Sample ID: ICSAB 09/24/13 17:53Interference Check Sample AB5
Aluminum 92 70 1300.1037.0 mg/L
Arsenic 102 70 1300.00500.0102 mg/L
Cobalt 102 70 1300.0100.0203 mg/L
Copper 99 70 1300.0100.0199 mg/L
Thallium 0 00.102.30E-05 mg/L
Sample ID: ICSA 09/25/13 08:36Interference Check Sample A5
Aluminum 101 70 1300.1040.4 mg/L
Arsenic 0.00500.000138 mg/L
Cobalt 0.0100.000360 mg/L
Copper 0.0100.000136 mg/L
Qualifiers:
RL - Analyte reporting limit. ND - Not detected at the reporting limit.
Page 31 of 42

Project: Barker Hughsville Pilot
Client: CDM Federal Programs
Work Order: H13090305
QA/QC Summary Report
10/22/13Report Date:
Analyte Result %REC RPDLow Limit High Limit RPDLimitRLUnits QualCount
Prepared by Helena, MT Branch
Method: E200.8 Analytical Run: ICPMS204-B_130924A
Sample ID: ICSA 09/25/13 08:36Interference Check Sample A5
Thallium 0.102.40E-05 mg/L
Sample ID: ICSAB 09/25/13 08:40Interference Check Sample AB5
Aluminum 100 70 1300.1040.0 mg/L
Arsenic 113 70 1300.00500.0112 mg/L
Cobalt 106 70 1300.0100.0212 mg/L
Copper 102 70 1300.0100.0203 mg/L
Thallium 0 00.102.30E-05 mg/L
Sample ID: ICV STD 09/25/13 09:31Initial Calibration Verification Standard5
Aluminum 105 90 1100.100.315 mg/L
Arsenic 101 90 1100.00500.0604 mg/L
Cobalt 102 90 1100.0100.0614 mg/L
Copper 105 90 1100.0100.0631 mg/L
Thallium 105 90 1100.100.0629 mg/L
Sample ID: ICSA 09/25/13 09:35Interference Check Sample A5
Aluminum 94 70 1300.1037.6 mg/L
Arsenic 0.00500.000103 mg/L
Cobalt 0.0100.000311 mg/L
Copper 0.0100.000250 mg/L
Thallium 0.103.80E-05 mg/L
Sample ID: ICSAB 09/25/13 09:40Interference Check Sample AB5
Aluminum 94 70 1300.1037.4 mg/L
Arsenic 109 70 1300.00500.0109 mg/L
Cobalt 101 70 1300.0100.0201 mg/L
Copper 104 70 1300.0100.0209 mg/L
Thallium 0 00.102.20E-05 mg/L
Method: E200.8 Batch: R91546
Sample ID: ICB 09/24/13 18:20Method Blank Run: ICPMS204-B_130924A5
Aluminum 0.00010.0002 mg/L
Arsenic 7E-05ND mg/L
Cobalt 2E-05ND mg/L
Copper 3E-058E-05 mg/L
Thallium 1E-05ND mg/L
Sample ID: LFB 09/24/13 18:25Laboratory Fortified Blank Run: ICPMS204-B_130924A5
Aluminum 100 85 1150.100.0501 mg/L
Arsenic 96 85 1150.00500.0482 mg/L
Cobalt 103 85 1150.0100.0517 mg/L
Copper 99 85 1150.0100.0494 mg/L
Thallium 101 85 1150.100.0505 mg/L
Qualifiers:
RL - Analyte reporting limit. ND - Not detected at the reporting limit.
Page 32 of 42

Project: Barker Hughsville Pilot
Client: CDM Federal Programs
Work Order: H13090305
QA/QC Summary Report
10/22/13Report Date:
Analyte Result %REC RPDLow Limit High Limit RPDLimitRLUnits QualCount
Prepared by Helena, MT Branch
Method: E200.8 Batch: R91546
Sample ID: H13090305-001BMS 09/24/13 18:52Sample Matrix Spike Run: ICPMS204-B_130924A5
Aluminum 95 70 1300.0300.302 mg/L
Arsenic 97 70 1300.00100.245 mg/L
Cobalt 97 70 1300.00500.276 mg/L
Copper 98 70 1300.00500.247 mg/L
Thallium 101 70 1300.000500.253 mg/L
Sample ID: H13090305-001BMSD 09/24/13 18:56Sample Matrix Spike Duplicate Run: ICPMS204-B_130924A5
Aluminum 90 70 130 200.030 4.00.290 mg/L
Arsenic 95 70 130 200.0010 2.60.238 mg/L
Cobalt 91 70 130 200.0050 5.60.261 mg/L
Copper 95 70 130 200.0050 3.10.239 mg/L
Thallium 98 70 130 200.00050 3.40.244 mg/L
Sample ID: H13090330-001AMS 09/24/13 20:03Sample Matrix Spike Run: ICPMS204-B_130924A5
Aluminum 100 70 1300.0300.0507 mg/L
Arsenic 100 70 1300.00100.0505 mg/L
Cobalt 99 70 1300.00500.0499 mg/L
Copper 90 70 1300.00500.0994 mg/L
Thallium 106 70 1300.000500.0532 mg/L
Sample ID: H13090330-001AMSD 09/24/13 20:07Sample Matrix Spike Duplicate Run: ICPMS204-B_130924A5
Aluminum 100 70 130 200.030 0.10.0508 mg/L
Arsenic 107 70 130 200.0010 6.70.0540 mg/L
Cobalt 102 70 130 200.0050 2.60.0512 mg/L
Copper 103 70 130 200.0050 6.30.106 mg/L
Thallium 108 70 130 200.00050 2.00.0542 mg/L
Sample ID: LFB 09/25/13 12:27Laboratory Fortified Blank Run: ICPMS204-B_130924A5
Aluminum 98 85 1150.100.0490 mg/L
Arsenic 98 85 1150.00500.0488 mg/L
Cobalt 100 85 1150.0100.0498 mg/L
Copper 100 85 1150.0100.0500 mg/L
Thallium 100 85 1150.100.0502 mg/L
Qualifiers:
RL - Analyte reporting limit. ND - Not detected at the reporting limit.
Page 33 of 42

Project: Barker Hughsville Pilot
Client: CDM Federal Programs
Work Order: H13090305
QA/QC Summary Report
10/22/13Report Date:
Analyte Result %REC RPDLow Limit High Limit RPDLimitRLUnits QualCount
Prepared by Helena, MT Branch
Method: E200.8 Analytical Run: ICPMS204-B_130927A
Sample ID: ICV STD 09/27/13 18:17Initial Calibration Verification Standard
Silver 99 90 1100.00500.0297 mg/L
Sample ID: ICSA 09/27/13 18:23Interference Check Sample A
Silver 0.00500.000120 mg/L
Sample ID: ICSAB 09/27/13 18:30Interference Check Sample AB
Silver 95 70 1300.00500.0190 mg/L
Sample ID: ICV STD 09/28/13 00:44Initial Calibration Verification Standard
Silver 97 90 1100.00500.0291 mg/L
Sample ID: ICSA 09/28/13 00:51Interference Check Sample A
Silver 0.00500.000181 mg/L
Sample ID: ICSAB 09/28/13 00:57Interference Check Sample AB
Silver 90 70 1300.00500.0180 mg/L
Sample ID: ICSA 09/28/13 14:24Interference Check Sample A
Silver 0.00507.90E-05 mg/L
Sample ID: ICSAB 09/28/13 14:31Interference Check Sample AB
Silver 91 70 1300.00500.0181 mg/L
Method: E200.8 Batch: R91637
Sample ID: ICB 09/27/13 19:09Method Blank Run: ICPMS204-B_130927A
Silver 4E-055E-05 mg/L
Sample ID: LFB 09/27/13 19:15Laboratory Fortified Blank Run: ICPMS204-B_130927A
Silver 95 85 1150.00500.0191 mg/L
Sample ID: H13090286-001BMS 09/27/13 20:46Sample Matrix Spike Run: ICPMS204-B_130927A
Silver 94 70 1300.00100.0377 mg/L
Sample ID: H13090286-001BMSD 09/27/13 20:53Sample Matrix Spike Duplicate Run: ICPMS204-B_130927A
Silver 95 70 130 200.0010 0.60.0379 mg/L
Sample ID: H13090384-008BMS 09/27/13 22:35Sample Matrix Spike Run: ICPMS204-B_130927A
Silver 75 70 1300.00100.0150 mg/L
Sample ID: H13090384-008BMSD 09/27/13 22:42Sample Matrix Spike Duplicate Run: ICPMS204-B_130927A
Silver 75 70 130 200.0010 0.40.0149 mg/L
Qualifiers:
RL - Analyte reporting limit. ND - Not detected at the reporting limit.
Page 34 of 42

Project: Barker Hughsville Pilot
Client: CDM Federal Programs
Work Order: H13090305
QA/QC Summary Report
10/22/13Report Date:
Analyte Result %REC RPDLow Limit High Limit RPDLimitRLUnits QualCount
Prepared by Helena, MT Branch
Method: E200.8 Analytical Run: ICPMS204-B_130930A
Sample ID: ICV STD 09/30/13 11:38Initial Calibration Verification Standard
Silver 99 90 1100.00500.0298 mg/L
Sample ID: ICSA 09/30/13 11:45Interference Check Sample A
Silver 0.00504.00E-05 mg/L
Sample ID: ICSAB 09/30/13 11:51Interference Check Sample AB
Silver 100 70 1300.00500.0200 mg/L
Sample ID: ICSA 09/30/13 15:57Interference Check Sample A
Silver 0.00500.000426 mg/L
Sample ID: ICSAB 09/30/13 16:04Interference Check Sample AB
Silver 94 70 1300.00500.0189 mg/L
Sample ID: ICV STD 09/30/13 16:23Initial Calibration Verification Standard
Silver 100 90 1100.00500.0299 mg/L
Sample ID: ICSA 10/01/13 11:58Interference Check Sample A
Silver 0.00500.000214 mg/L
Sample ID: ICSAB 10/01/13 12:04Interference Check Sample AB
Silver 95 70 1300.00500.0190 mg/L
Sample ID: ICV STD 10/01/13 16:37Initial Calibration Verification Standard
Silver 99 90 1100.00500.0297 mg/L
Sample ID: ICSA 10/01/13 16:43Interference Check Sample A
Silver 0.00500.000198 mg/L
Sample ID: ICSAB 10/01/13 16:50Interference Check Sample AB
Silver 96 70 1300.00500.0192 mg/L
Sample ID: ICV STD 10/02/13 12:01Initial Calibration Verification Standard
Silver 102 90 1100.00500.0305 mg/L
Sample ID: ICSA 10/02/13 12:07Interference Check Sample A
Silver 0.00500.000213 mg/L
Sample ID: ICSAB 10/02/13 12:14Interference Check Sample AB
Silver 96 70 1300.00500.0191 mg/L
Sample ID: ICSA 10/03/13 01:18Interference Check Sample A
Silver 0.00500.000457 mg/L
Sample ID: ICSAB 10/03/13 01:24Interference Check Sample AB
Silver 98 70 1300.00500.0196 mg/L
Sample ID: ICV STD 10/03/13 09:35Initial Calibration Verification Standard
Silver 102 90 1100.00500.0306 mg/L
Qualifiers:
RL - Analyte reporting limit. ND - Not detected at the reporting limit.
Page 35 of 42

Project: Barker Hughsville Pilot
Client: CDM Federal Programs
Work Order: H13090305
QA/QC Summary Report
10/22/13Report Date:
Analyte Result %REC RPDLow Limit High Limit RPDLimitRLUnits QualCount
Prepared by Helena, MT Branch
Method: E200.8 Analytical Run: ICPMS204-B_130930A
Sample ID: ICSA 10/03/13 09:42Interference Check Sample A
Silver 0.00500.000179 mg/L
Sample ID: ICSAB 10/03/13 09:48Interference Check Sample AB
Silver 97 70 1300.00500.0193 mg/L
Method: E200.8 Batch: R91671
Sample ID: ICB 09/30/13 12:31Method Blank Run: ICPMS204-B_130930A
Silver 4E-05ND mg/L
Sample ID: LFB 09/30/13 12:37Laboratory Fortified Blank Run: ICPMS204-B_130930A
Silver 98 85 1150.00500.0195 mg/L
Sample ID: H13090305-003CMS 09/30/13 17:41Sample Matrix Spike Run: ICPMS204-B_130930A
Silver 80 70 1300.00100.0801 mg/L
Sample ID: H13090305-003CMSD 09/30/13 17:47Sample Matrix Spike Duplicate Run: ICPMS204-B_130930A
Silver 80 70 130 200.0010 0.10.0800 mg/L
Sample ID: ICB 10/02/13 02:05Method Blank Run: ICPMS204-B_130930A
Silver 4E-05ND mg/L
Sample ID: LFB 10/02/13 02:12Laboratory Fortified Blank Run: ICPMS204-B_130930A
Silver 95 85 1150.00500.0191 mg/L
Sample ID: H13090283-006CMS 10/02/13 06:17Sample Matrix Spike Run: ICPMS204-B_130930A
Silver 91 70 1300.00100.0182 mg/L
Sample ID: H13090283-006CMSD 10/02/13 06:24Sample Matrix Spike Duplicate Run: ICPMS204-B_130930A
Silver 93 70 130 200.0010 2.40.0186 mg/L
Qualifiers:
RL - Analyte reporting limit. ND - Not detected at the reporting limit.
Page 36 of 42

Project: Barker Hughsville Pilot
Client: CDM Federal Programs
Work Order: H13090305
QA/QC Summary Report
10/22/13Report Date:
Analyte Result %REC RPDLow Limit High Limit RPDLimitRLUnits QualCount
Prepared by Helena, MT Branch
Method: E300.0 Analytical Run: IC102-H_130919A
Sample ID: ICV 09/19/13 10:26Initial Calibration Verification Standard2
Chloride 100 90 1101.0100 mg/L
Sulfate 102 90 1101.0410 mg/L
Sample ID: CCV091913-1 09/19/13 11:04Continuing Calibration Verification Standard2
Chloride 101 90 1101.0100 mg/L
Sulfate 104 90 1101.0410 mg/L
Method: E300.0 Batch: R91429
Sample ID: ICB 09/19/13 10:38Method Blank Run: IC102-H_130919A2
Chloride 0.008ND mg/L
Sulfate 0.08ND mg/L
Sample ID: LFB 09/19/13 10:51Laboratory Fortified Blank Run: IC102-H_130919A2
Chloride 98 90 1101.049 mg/L
Sulfate 101 90 1101.0200 mg/L
Sample ID: H13090315-001AMS 09/19/13 15:07Sample Matrix Spike Run: IC102-H_130919A2
Chloride 93 90 1101.061 mg/L
Sulfate 109 90 1101.0950 mg/L
Sample ID: H13090315-001AMSD 09/19/13 15:19Sample Matrix Spike Duplicate Run: IC102-H_130919A2
Chloride 94 90 110 201.0 0.761 mg/L
Sulfate 109 90 110 201.0 0.0950 mg/L
Qualifiers:
RL - Analyte reporting limit. ND - Not detected at the reporting limit.
Page 37 of 42

Project: Barker Hughsville Pilot
Client: CDM Federal Programs
Work Order: H13090305
QA/QC Summary Report
10/22/13Report Date:
Analyte Result %REC RPDLow Limit High Limit RPDLimitRLUnits QualCount
Prepared by Helena, MT Branch
Method: E300.0 Analytical Run: IC102-H_130930A
Sample ID: ICV 09/30/13 14:39Initial Calibration Verification Standard2
Chloride 103 90 1101.0100 mg/L
Sulfate 103 90 1101.0410 mg/L
Sample ID: CCV093013-1 09/30/13 15:17Continuing Calibration Verification Standard2
Chloride 104 90 1101.0100 mg/L
Sulfate 104 90 1101.0420 mg/L
Method: E300.0 Batch: R91749
Sample ID: ICB 09/30/13 14:51Method Blank Run: IC102-H_130930A2
Chloride 0.008ND mg/L
Sulfate 0.080.1 mg/L
Sample ID: LFB 09/30/13 15:49Laboratory Fortified Blank Run: IC102-H_130930A2
Chloride 101 90 1101.050 mg/L
Sulfate 101 90 1101.0200 mg/L
Sample ID: H13090381-012AMS 09/30/13 18:07Sample Matrix Spike Run: IC102-H_130930A2
Chloride 103 90 1101.058 mg/L
Sulfate 105 90 1101.0260 mg/L
Sample ID: H13090381-012AMSD 09/30/13 18:20Sample Matrix Spike Duplicate Run: IC102-H_130930A2
Chloride 104 90 110 201.0 1.259 mg/L
Sulfate 105 90 110 201.0 0.0260 mg/L
Qualifiers:
RL - Analyte reporting limit. ND - Not detected at the reporting limit.
Page 38 of 42

Project: Barker Hughsville Pilot
Client: CDM Federal Programs
Work Order: H13090305
QA/QC Summary Report
10/22/13Report Date:
Analyte Result %REC RPDLow Limit High Limit RPDLimitRLUnits QualCount
Prepared by Helena, MT Branch
Method: E350.1 Analytical Run: FIA203-HE_130917A
Sample ID: ICV 09/17/13 14:34Initial Calibration Verification Standard
Nitrogen, Ammonia as N 95 90 1100.255.38 mg/L
Sample ID: ICB 09/17/13 14:37Initial Calibration Blank, Instrument Blank
Nitrogen, Ammonia as N 0 00.050-0.0489 mg/L
Sample ID: CCV 09/17/13 16:08Continuing Calibration Verification Standard
Nitrogen, Ammonia as N 96 90 1100.0500.481 mg/L
Method: E350.1 Batch: R91359
Sample ID: LFB 09/17/13 14:35Laboratory Fortified Blank Run: FIA203-HE_130917A
Nitrogen, Ammonia as N 103 90 1100.0551.03 mg/L
Sample ID: H13090306-001CMS 09/17/13 16:10Sample Matrix Spike Run: FIA203-HE_130917A
Nitrogen, Ammonia as N 103 80 1200.0551.06 mg/L
Sample ID: H13090306-001CMSD 09/17/13 16:11Sample Matrix Spike Duplicate Run: FIA203-HE_130917A
Nitrogen, Ammonia as N 103 80 120 100.055 0.01.06 mg/L
Qualifiers:
RL - Analyte reporting limit. ND - Not detected at the reporting limit.
Page 39 of 42

Project: Barker Hughsville Pilot
Client: CDM Federal Programs
Work Order: H13090305
QA/QC Summary Report
10/22/13Report Date:
Analyte Result %REC RPDLow Limit High Limit RPDLimitRLUnits QualCount
Prepared by Helena, MT Branch
Method: E365.1 Analytical Run: FIA202-HE_130918D
Sample ID: ICV 09/18/13 10:51Initial Calibration Verification Standard
Phosphorus, Orthophosphate as P 96 90 1100.00500.239 mg/L
Sample ID: ICB 09/18/13 10:52Initial Calibration Blank, Instrument Blank
Phosphorus, Orthophosphate as P 0 00.0050-0.000750 mg/L
Sample ID: CCV 09/18/13 10:54Continuing Calibration Verification Standard
Phosphorus, Orthophosphate as P 105 90 1100.00500.105 mg/L
Method: E365.1 Batch: R91376
Sample ID: LFB 09/18/13 10:53Laboratory Fortified Blank Run: FIA202-HE_130918D
Phosphorus, Orthophosphate as P 93 90 1100.00500.187 mg/L
Sample ID: H13090305-006AMS 09/18/13 10:57Sample Matrix Spike Run: FIA202-HE_130918D
Phosphorus, Orthophosphate as P 83 90 1100.0101.71 mg/L S
Sample ID: H13090305-006AMSD 09/18/13 10:58Sample Matrix Spike Duplicate Run: FIA202-HE_130918D
Phosphorus, Orthophosphate as P 88 90 110 200.010 4.91.80 mg/L S
Qualifiers:
RL - Analyte reporting limit. ND - Not detected at the reporting limit.
S - Spike recovery outside of advisory limits.
Page 40 of 42

Shipping container/cooler in good condition?
Custody seals intact on all shipping container(s)/cooler(s)?
Custody seals intact on all sample bottles?
Chain of custody present?
Chain of custody signed when relinquished and received?
Chain of custody agrees with sample labels?
Samples in proper container/bottle?
Sample containers intact?
Sufficient sample volume for indicated test?
All samples received within holding time?(Exclude analyses that are considered field parameterssuch as pH, DO, Res Cl, Sulfite, Ferrous Iron, etc.)
Container/Temp Blank temperature:
Water - VOA vials have zero headspace?
Water - pH acceptable upon receipt?
Yes
Yes
Yes
Yes
Yes
Yes
Yes
Yes
Yes
Yes
Yes
Yes
No
No
No
No
No
No
No
No
No
No
No
No
� �
�
�
�
�
�
�
�
�
�
�
�
�
�
�
�
�
�
�
�
�
�
�
Not Present
Not Present
Not Present
�
�
�
No VOA vials submitted
Not Applicable �
�
4.4°C On Ice
9/17/2013Tracy L. Lorash
Hand Del
elm
Date Received:
Received by:
Login completed by:
Carrier name:
BL2000\jweidemoyer
9/19/2013
Reviewed by:
Reviewed Date:
Contact and Corrective Action Comments:
None
Temp Blank received in all shipping container(s)/cooler(s)? Yes No� � Not Applicable �
Workorder Receipt Checklist
CDM Federal Programs H13090305
Lab measurement of analytes considered field parameters that require analysis within 15 minutes of sampling such as pH, Dissolved Oxygen and Residual Chlorine, are qualified as being analyzed outside of recommended holding time.
Solid/soil samples are reported on a wet weight basis (as received) unless specifically indicated. If moisture corrected, data units are typically noted as –dry. For agricultural and mining soil parameters/characteristics, all samples are dried and ground prior to sample analysis.
Standard Reporting Procedures
Page 41 of 42

Page 42 of 42

ANALYTICAL SUMMARY REPORTANALYTICAL SUMMARY REPORTANALYTICAL SUMMARY REPORTANALYTICAL SUMMARY REPORT
The analyses presented in this report were performed by Energy Laboratories, Inc., 3161 E. Lyndale Ave., Helena, MT 59604, unless otherwise noted. Any exceptions or problems with the analyses are noted in the Laboratory Analytical Report, the QA/QC Summary Report, or the Case Narrative.
The results as reported relate only to the item(s) submitted for testing.
If you have any questions regarding these test results, please call.
Sample ID Client Sample ID Collect Date Receive Date Matrix Test
Report Approved By:
H13090479-001 13BH-DT-PILOT-COMP-SPLP
09/24/13 14:00 09/24/13 Solid Metals by ICP/ICPMS, TotalSPLP Extraction, Regular
H13090479-002 13BH-DT-PILOT-WOOD-SPLP
09/24/13 14:05 09/24/13 Solid Same As Above
H13090479-003 13BH-DT-PILOT-SDST-SPLP
09/24/13 14:10 09/24/13 Solid Same As Above
H13090479-004 13BH-DT-PILOT-CHIT-SPLP
09/24/13 14:15 09/24/13 Solid Same As Above
CDM Federal Programs
Project Name: Barker Hughsville Pilot
Workorder No.: H13090479
555 17th St Ste 1100
Denver, CO 80202
October 23, 2013
H823 - Baker-Hughsville Superfund SiteQuote ID:
Energy Laboratories Inc Helena MT received the following 4 samples for CDM Federal Programs on 9/24/2013 for analysis.
Page 1 of 15

Project: Barker Hughsville Pilot
CLIENT: CDM Federal Programs
Sample Delivery Group: H13090479 CASE NARRATIVE
10/23/13Report Date:
Tests associated with analyst identified as ELI-B were subcontracted to Energy Laboratories, 1120 S. 27th St., Billings, MT, EPA Number MT00005.
Page 2 of 15

LABORATORY ANALYTICAL REPORT
Client: CDM Federal Programs
Project: Barker Hughsville Pilot
Lab ID: H13090479-001
Client Sample ID 13BH-DT-PILOT-COMP-SPLP
Collection Date: 09/24/13 14:00
Matrix: Solid
Report Date: 10/23/13
DateReceived: 09/24/13
Prepared by Helena, MT Branch
Analyses Result Units Analysis Date / ByRL Method
MCL/QCLQualifiers
SPLP EXTRACTABLE CONSTITUENTS
10/09/13 11:28 / eli-b0.03mg/L4.5Aluminum SW6020
10/09/13 11:28 / eli-b0.001mg/LNDBeryllium SW6020
10/09/13 23:00 / eli-b221mg/L16Calcium SW6010B
10/09/13 11:28 / eli-b0.005mg/LNDCobalt SW6020
10/09/13 11:28 / eli-b0.005mg/L0.018Copper SW6020
10/09/13 23:00 / eli-b220.03mg/L3.7Iron SW6010B
10/09/13 23:00 / eli-b221mg/L5Magnesium SW6010B
10/09/13 11:28 / eli-b0.001mg/L0.30Manganese SW6020
10/09/13 11:28 / eli-b0.005mg/L0.007Nickel SW6020
10/09/13 23:00 / eli-b221mg/L25Potassium SW6010B
10/09/13 11:28 / eli-b0.0005mg/LNDThallium SW6020
10/09/13 11:28 / eli-b0.01mg/L0.10Zinc SW6020
D 10/09/13 11:28 / eli-b0.002mg/L0.027Arsenic SW6020
10/09/13 11:28 / eli-b0.05mg/L0.50Barium SW6020
10/09/13 11:28 / eli-b0.001mg/LNDCadmium SW6020
10/09/13 11:28 / eli-b0.005mg/L0.010Chromium SW6020
10/09/13 11:28 / eli-b0.001mg/L0.011Lead SW6020
10/09/13 11:28 / eli-b0.001mg/LNDSilver SW6020
D 10/09/13 23:00 / eli-b2210mg/L59Sodium SW6010B
ReportDefinitions:
RL - Analyte reporting limit. MCL - Maximum contaminant level.
QCL - Quality control limit. ND - Not detected at the reporting limit.
D - RL increased due to sample matrix.
Page 3 of 15

LABORATORY ANALYTICAL REPORT
Client: CDM Federal Programs
Project: Barker Hughsville Pilot
Lab ID: H13090479-002
Client Sample ID 13BH-DT-PILOT-WOOD-SPLP
Collection Date: 09/24/13 14:05
Matrix: Solid
Report Date: 10/23/13
DateReceived: 09/24/13
Prepared by Helena, MT Branch
Analyses Result Units Analysis Date / ByRL Method
MCL/QCLQualifiers
SPLP EXTRACTABLE CONSTITUENTS
10/09/13 11:31 / eli-b0.03mg/L0.23Aluminum SW6020
10/09/13 11:31 / eli-b0.001mg/LNDBeryllium SW6020
10/09/13 23:08 / eli-b221mg/L17Calcium SW6010B
10/09/13 11:31 / eli-b0.005mg/LNDCobalt SW6020
10/09/13 11:31 / eli-b0.005mg/L0.012Copper SW6020
10/09/13 23:08 / eli-b220.03mg/L0.25Iron SW6010B
10/09/13 23:08 / eli-b221mg/L5Magnesium SW6010B
10/09/13 11:31 / eli-b0.001mg/L0.54Manganese SW6020
10/09/13 11:31 / eli-b0.005mg/LNDNickel SW6020
10/09/13 23:08 / eli-b221mg/L32Potassium SW6010B
10/09/13 11:31 / eli-b0.0005mg/LNDThallium SW6020
10/09/13 11:31 / eli-b0.01mg/L0.08Zinc SW6020
D 10/09/13 11:31 / eli-b0.002mg/L0.006Arsenic SW6020
10/09/13 11:31 / eli-b0.05mg/L0.17Barium SW6020
10/09/13 11:31 / eli-b0.001mg/L0.001Cadmium SW6020
10/09/13 11:31 / eli-b0.005mg/L0.008Chromium SW6020
10/09/13 11:31 / eli-b0.001mg/L0.008Lead SW6020
10/09/13 11:31 / eli-b0.001mg/LNDSilver SW6020
D 10/09/13 23:08 / eli-b2210mg/L53Sodium SW6010B
ReportDefinitions:
RL - Analyte reporting limit. MCL - Maximum contaminant level.
QCL - Quality control limit. ND - Not detected at the reporting limit.
D - RL increased due to sample matrix.
Page 4 of 15

LABORATORY ANALYTICAL REPORT
Client: CDM Federal Programs
Project: Barker Hughsville Pilot
Lab ID: H13090479-003
Client Sample ID 13BH-DT-PILOT-SDST-SPLP
Collection Date: 09/24/13 14:10
Matrix: Solid
Report Date: 10/23/13
DateReceived: 09/24/13
Prepared by Helena, MT Branch
Analyses Result Units Analysis Date / ByRL Method
MCL/QCLQualifiers
SPLP EXTRACTABLE CONSTITUENTS
10/09/13 11:34 / eli-b0.03mg/L0.98Aluminum SW6020
10/09/13 11:34 / eli-b0.001mg/LNDBeryllium SW6020
10/09/13 23:15 / eli-b221mg/L6Calcium SW6010B
10/09/13 11:34 / eli-b0.005mg/LNDCobalt SW6020
10/09/13 11:34 / eli-b0.005mg/L0.009Copper SW6020
10/09/13 23:15 / eli-b220.03mg/L0.93Iron SW6010B
10/09/13 23:15 / eli-b221mg/L1Magnesium SW6010B
10/09/13 11:34 / eli-b0.001mg/L0.021Manganese SW6020
10/09/13 11:34 / eli-b0.005mg/LNDNickel SW6020
10/09/13 23:15 / eli-b221mg/L2Potassium SW6010B
10/09/13 11:34 / eli-b0.0005mg/LNDThallium SW6020
10/09/13 11:34 / eli-b0.01mg/L0.06Zinc SW6020
D 10/09/13 11:34 / eli-b0.002mg/L0.003Arsenic SW6020
10/09/13 11:34 / eli-b0.05mg/L0.18Barium SW6020
10/09/13 11:34 / eli-b0.001mg/LNDCadmium SW6020
10/09/13 11:34 / eli-b0.005mg/L0.008Chromium SW6020
10/09/13 11:34 / eli-b0.001mg/L0.002Lead SW6020
10/09/13 11:34 / eli-b0.001mg/LNDSilver SW6020
D 10/09/13 23:15 / eli-b2210mg/L63Sodium SW6010B
ReportDefinitions:
RL - Analyte reporting limit. MCL - Maximum contaminant level.
QCL - Quality control limit. ND - Not detected at the reporting limit.
D - RL increased due to sample matrix.
Page 5 of 15

LABORATORY ANALYTICAL REPORT
Client: CDM Federal Programs
Project: Barker Hughsville Pilot
Lab ID: H13090479-004
Client Sample ID 13BH-DT-PILOT-CHIT-SPLP
Collection Date: 09/24/13 14:15
Matrix: Solid
Report Date: 10/23/13
DateReceived: 09/24/13
Prepared by Helena, MT Branch
Analyses Result Units Analysis Date / ByRL Method
MCL/QCLQualifiers
SPLP EXTRACTABLE CONSTITUENTS
10/09/13 11:37 / eli-b0.03mg/L0.29Aluminum SW6020
10/09/13 11:37 / eli-b0.001mg/LNDBeryllium SW6020
10/09/13 23:31 / eli-b221mg/L890Calcium SW6010B
10/09/13 11:37 / eli-b0.005mg/L0.072Cobalt SW6020
10/09/13 11:37 / eli-b0.005mg/L0.84Copper SW6020
10/09/13 23:31 / eli-b220.03mg/L2.0Iron SW6010B
10/09/13 23:31 / eli-b221mg/L470Magnesium SW6010B
10/09/13 11:37 / eli-b0.001mg/L0.092Manganese SW6020
10/09/13 11:37 / eli-b0.005mg/L0.68Nickel SW6020
10/09/13 23:31 / eli-b221mg/L870Potassium SW6010B
10/09/13 11:37 / eli-b0.0005mg/LNDThallium SW6020
10/09/13 11:37 / eli-b0.01mg/L1.9Zinc SW6020
D 10/09/13 11:37 / eli-b0.004mg/L1.6Arsenic SW6020
10/09/13 11:37 / eli-b0.05mg/L2.0Barium SW6020
10/09/13 11:37 / eli-b0.001mg/L0.19Cadmium SW6020
10/09/13 11:37 / eli-b0.005mg/L0.054Chromium SW6020
10/09/13 11:37 / eli-b0.001mg/L0.003Lead SW6020
10/09/13 11:37 / eli-b0.001mg/L0.002Silver SW6020
D 10/09/13 23:31 / eli-b2220mg/L3700Sodium SW6010B
ReportDefinitions:
RL - Analyte reporting limit. MCL - Maximum contaminant level.
QCL - Quality control limit. ND - Not detected at the reporting limit.
D - RL increased due to sample matrix.
Page 6 of 15

Project: Barker Hughsville Pilot
Client: CDM Federal Programs
Work Order: H13090479
QA/QC Summary Report
10/23/13Report Date:
Analyte Result %REC RPDLow Limit High Limit RPDLimitRLUnits Qual
Prepared by Helena, MT Branch
Method: SW6010B Analytical Run: SUB-B213043
Sample ID: QCS 10/09/13 11:40Initial Calibration Verification Standard
Calcium 100 90 1101.040 mg/L
Iron 100 90 1100.0304.0 mg/L
Magnesium 99 90 1101.040 mg/L
Potassium 99 90 1101.040 mg/L
Sodium 100 90 1101.040 mg/L
Sample ID: ICSA 10/09/13 11:55Interference Check Sample A
Calcium 93 80 1201.0460 mg/L
Iron 90 80 1200.030180 mg/L
Magnesium 99 80 1201.0500 mg/L
Potassium 1.00.018 mg/L
Sodium 1.0-0.70 mg/L
Sample ID: ICSAB 10/09/13 12:00Interference Check Sample AB
Calcium 91 80 1201.0450 mg/L
Iron 88 80 1200.030180 mg/L
Magnesium 97 80 1201.0480 mg/L
Potassium 97 80 1201.019 mg/L
Sodium 94 80 1201.019 mg/L
Method: SW6010B Batch: B_75024
Sample ID: MB-75024 10/09/13 22:49Method Blank Run: SUB-B213043
Calcium 0.0100.6 mg/L
Iron 0.0020.009 mg/L
Magnesium 0.0020.05 mg/L
Potassium 0.020.07 mg/L
Sodium 0.019 mg/L
Sample ID: LCS-75024 10/09/13 22:52Laboratory Control Sample Run: SUB-B213043
Calcium 91 85 1151.023 mg/L
Iron 91 85 1150.0302.3 mg/L
Magnesium 89 85 1151.022 mg/L
Potassium 91 85 1151.023 mg/L
Sodium 92 85 1151.032 mg/L
Sample ID: LCSD-75024 10/09/13 22:56Laboratory Control Sample Duplicate Run: SUB-B213043
Calcium 90 85 115 201.0 1.323 mg/L
Iron 89 85 115 200.030 1.42.2 mg/L
Magnesium 88 85 115 201.0 1.122 mg/L
Potassium 90 85 115 201.0 1.222 mg/L
Sodium 90 85 115 201.0 1.132 mg/L
Sample ID: H13090479-001B 10/09/13 23:04Sample Matrix Spike Run: SUB-B213043
Calcium 88 75 1251.060 mg/L
Qualifiers:
RL - Analyte reporting limit. ND - Not detected at the reporting limit.
Page 7 of 15

Project: Barker Hughsville Pilot
Client: CDM Federal Programs
Work Order: H13090479
QA/QC Summary Report
10/23/13Report Date:
Analyte Result %REC RPDLow Limit High Limit RPDLimitRLUnits Qual
Prepared by Helena, MT Branch
Method: SW6010B Batch: B_75024
Sample ID: H13090479-001B 10/09/13 23:04Sample Matrix Spike Run: SUB-B213043
Iron 103 75 1250.0308.8 mg/L
Magnesium 86 75 1251.048 mg/L
Potassium 90 75 1251.070 mg/L
Sodium 95 75 1251.0110 mg/L
Sample ID: H13090479-002B 10/09/13 23:12Sample Matrix Spike Run: SUB-B213043
Calcium 94 75 1251.063 mg/L
Iron 94 75 1250.0304.9 mg/L
Magnesium 92 75 1251.051 mg/L
Potassium 94 75 1251.079 mg/L
Sodium 97 75 1251.0100 mg/L
Sample ID: H13090479-003B 10/09/13 23:27Sample Matrix Spike Run: SUB-B213043
Calcium 90 75 1251.050 mg/L
Iron 90 75 1250.0305.4 mg/L
Magnesium 88 75 1251.045 mg/L
Potassium 89 75 1251.046 mg/L
Sodium 88 75 1251.0110 mg/L
Sample ID: H13090479-004B 10/09/13 23:35Serial Dilution Run: SUB-B213043
Calcium 0 0 201.0 6.6950 mg/L
Iron 0 0 200.059 102.3 mg/L
Magnesium 0 0 201.0 5.8500 mg/L
Potassium 0 0 201.0 5.5920 mg/L
Sodium 0 04.93900 mg/L
Sample ID: H13090479-004B 10/09/13 23:38Sample Matrix Spike Run: SUB-B213043
Calcium 75 1251.0880 mg/L A
Iron 81 75 1250.03012 mg/L
Magnesium 37 75 1251.0520 mg/L S
Potassium 75 1251.0870 mg/L A
Sodium 75 1251.03300 mg/L A
Qualifiers:
RL - Analyte reporting limit. A - The analyte level was greater than four times the spike level. In accordance with the method % recovery is not calculated.
ND - Not detected at the reporting limit. S - Spike recovery outside of advisory limits.
Page 8 of 15

Project: Barker Hughsville Pilot
Client: CDM Federal Programs
Work Order: H13090479
QA/QC Summary Report
10/23/13Report Date:
Analyte Result %REC RPDLow Limit High Limit RPDLimitRLUnits Qual
Prepared by Helena, MT Branch
Method: SW6020 Analytical Run: SUB-B213031
Sample ID: QCS 10/09/13 10:22Initial Calibration Verification Standard
Aluminum 94 90 1100.00100.234 mg/L
Arsenic 96 90 1100.00100.0479 mg/L
Barium 97 90 1100.00100.0487 mg/L
Beryllium 98 90 1100.00100.0244 mg/L
Cadmium 101 90 1100.00100.0252 mg/L
Chromium 96 90 1100.00100.0479 mg/L
Cobalt 99 90 1100.00100.0496 mg/L
Copper 98 90 1100.00100.0491 mg/L
Lead 98 90 1100.00100.0489 mg/L
Manganese 95 90 1100.00100.237 mg/L
Nickel 98 90 1100.00100.0492 mg/L
Silver 100 90 1100.00100.0251 mg/L
Thallium 97 90 1100.00100.0487 mg/L
Zinc 102 90 1100.00100.0510 mg/L
Sample ID: ICSA 10/09/13 10:31Interference Check Sample A
Aluminum 94 70 1300.001037.7 mg/L
Arsenic 0.00100.000100 mg/L
Barium 0.00100.000480 mg/L
Beryllium 0.0010ND mg/L
Cadmium 0.00100.000470 mg/L
Chromium 0.00100.00125 mg/L
Cobalt 0.00100.000140 mg/L
Copper 0.00100.00151 mg/L
Lead 0.00100.000300 mg/L
Manganese 0.00100.000160 mg/L
Nickel 0.00100.00144 mg/L
Silver 0.00100.000280 mg/L
Thallium 0.00106.00E-05 mg/L
Zinc 0.00100.00225 mg/L
Sample ID: ICSAB 10/09/13 10:34Interference Check Sample AB
Aluminum 95 70 1300.001037.8 mg/L
Arsenic 102 70 1300.00100.0102 mg/L
Barium 0 00.00100.000570 mg/L
Beryllium 0 00.0010ND mg/L
Cadmium 102 70 1300.00100.0102 mg/L
Chromium 111 70 1300.00100.0222 mg/L
Cobalt 108 70 1300.00100.0216 mg/L
Copper 107 70 1300.00100.0215 mg/L
Lead 0 00.00100.000290 mg/L
Manganese 106 70 1300.00100.0213 mg/L
Nickel 108 70 1300.00100.0216 mg/L
Qualifiers:
RL - Analyte reporting limit. ND - Not detected at the reporting limit.
Page 9 of 15

Project: Barker Hughsville Pilot
Client: CDM Federal Programs
Work Order: H13090479
QA/QC Summary Report
10/23/13Report Date:
Analyte Result %REC RPDLow Limit High Limit RPDLimitRLUnits Qual
Prepared by Helena, MT Branch
Method: SW6020 Analytical Run: SUB-B213031
Sample ID: ICSAB 10/09/13 10:34Interference Check Sample AB
Silver 103 70 1300.00100.0205 mg/L
Thallium 0 00.0010ND mg/L
Zinc 116 70 1300.00100.0116 mg/L
Method: SW6020 Batch: B_75024
Sample ID: H13090479-004B 10/09/13 11:40Serial Dilution Run: SUB-B213031
Aluminum 0 0 200.030 320.21 mg/L R
Beryllium 0 0 200.0010ND mg/L
Cobalt 0 0 200.0050 130.081 mg/L
Copper 0 0 200.0072 211.0 mg/L R
Manganese 0 0 200.0010 150.11 mg/L
Nickel 0 0 200.0050 170.81 mg/L
Thallium 0 0 200.00062ND mg/L
Zinc 0 0 200.010 292.5 mg/L R
Arsenic 0 0 200.019 161.9 mg/L
Barium 0 0 200.050 152.3 mg/L
Cadmium 0 0 200.0024 250.25 mg/L R
Chromium 0 0 200.00640.065 mg/L N
Lead 0 0 200.00100.0045 mg/L N
Silver 0 0 200.0010ND mg/L
Sample ID: H13090479-001B 10/09/13 11:49Sample Matrix Spike Run: SUB-B213031
Aluminum 119 75 1250.03010 mg/L
Beryllium 83 75 1250.00100.42 mg/L
Cobalt 102 75 1250.00501.0 mg/L
Copper 97 75 1250.00500.99 mg/L
Manganese 85 75 1250.00104.6 mg/L
Nickel 95 75 1250.00500.96 mg/L
Thallium 94 75 1250.000500.94 mg/L
Zinc 83 75 1250.0100.92 mg/L
Arsenic 75 75 1250.00150.78 mg/L
Barium 88 75 1250.05010 mg/L
Cadmium 91 75 1250.00100.46 mg/L
Chromium 97 75 1250.00500.98 mg/L
Lead 95 75 1250.00100.96 mg/L
Silver 104 75 1250.00100.10 mg/L
Sample ID: H13090479-002B 10/09/13 11:52Sample Matrix Spike Run: SUB-B213031
Aluminum 87 75 1250.0304.6 mg/L
Beryllium 88 75 1250.00100.44 mg/L
Cobalt 106 75 1250.00501.1 mg/L
Copper 102 75 1250.00501.0 mg/L
Manganese 89 75 1250.00105.0 mg/L
Qualifiers:
RL - Analyte reporting limit. ND - Not detected at the reporting limit.
N - The analyte concentration was not sufficiently high to calculate a RPD for the serial dilution test.
R - RPD exceeds advisory limit.
Page 10 of 15

Project: Barker Hughsville Pilot
Client: CDM Federal Programs
Work Order: H13090479
QA/QC Summary Report
10/23/13Report Date:
Analyte Result %REC RPDLow Limit High Limit RPDLimitRLUnits Qual
Prepared by Helena, MT Branch
Method: SW6020 Batch: B_75024
Sample ID: H13090479-002B 10/09/13 11:52Sample Matrix Spike Run: SUB-B213031
Nickel 101 75 1250.00501.0 mg/L
Thallium 98 75 1250.000500.98 mg/L
Zinc 85 75 1250.0100.93 mg/L
Arsenic 79 75 1250.00150.79 mg/L
Barium 88 75 1250.0509.9 mg/L
Cadmium 96 75 1250.00100.48 mg/L
Chromium 100 75 1250.00501.0 mg/L
Lead 99 75 1250.00101.0 mg/L
Silver 109 75 1250.00100.11 mg/L
Sample ID: H13090479-003B 10/09/13 12:04Sample Matrix Spike Run: SUB-B213031
Aluminum 123 75 1250.0307.1 mg/L
Beryllium 96 75 1250.00100.48 mg/L
Cobalt 101 75 1250.00501.0 mg/L
Copper 98 75 1250.00500.99 mg/L
Manganese 94 75 1250.00104.7 mg/L
Nickel 98 75 1250.00500.98 mg/L
Thallium 96 75 1250.000500.96 mg/L
Zinc 90 75 1250.0100.96 mg/L
Arsenic 86 75 1250.00150.86 mg/L
Barium 95 75 1250.05011 mg/L
Cadmium 95 75 1250.00100.47 mg/L
Chromium 99 75 1250.00501.00 mg/L
Lead 99 75 1250.00100.99 mg/L
Silver 101 75 1250.00100.10 mg/L
Sample ID: H13090479-004B 10/09/13 12:07Sample Matrix Spike Run: SUB-B213031
Aluminum 106 75 1250.03014 mg/L
Beryllium 90 75 1250.00101.1 mg/L
Cobalt 98 75 1250.00502.5 mg/L
Copper 86 75 1250.00503.0 mg/L
Manganese 94 75 1250.001012 mg/L
Nickel 88 75 1250.00502.9 mg/L
Thallium 97 75 1250.000502.4 mg/L
Zinc 74 75 1250.0103.7 mg/L S
Arsenic 85 75 1250.00383.7 mg/L
Barium 95 75 1250.05028 mg/L
Cadmium 86 75 1250.00101.3 mg/L
Chromium 99 75 1250.00502.5 mg/L
Lead 99 75 1250.00102.5 mg/L
Silver 91 75 1250.00100.23 mg/L
Sample ID: MB-75024 10/09/13 13:17Method Blank Run: SUB-B213031
Aluminum 0.00020.01 mg/L
Qualifiers:
RL - Analyte reporting limit. ND - Not detected at the reporting limit.
S - Spike recovery outside of advisory limits.
Page 11 of 15

Project: Barker Hughsville Pilot
Client: CDM Federal Programs
Work Order: H13090479
QA/QC Summary Report
10/23/13Report Date:
Analyte Result %REC RPDLow Limit High Limit RPDLimitRLUnits Qual
Prepared by Helena, MT Branch
Method: SW6020 Batch: B_75024
Sample ID: MB-75024 10/09/13 13:17Method Blank Run: SUB-B213031
Beryllium 2E-05ND mg/L
Cobalt 1E-05ND mg/L
Copper 0.00010.004 mg/L
Manganese 2E-050.0004 mg/L
Nickel 5E-050.001 mg/L
Thallium 1E-05ND mg/L
Zinc 0.00010.005 mg/L
Arsenic 0.0004ND mg/L
Barium 3E-050.003 mg/L
Cadmium 5E-055E-05 mg/L
Chromium 0.00010.0006 mg/L
Lead 2E-050.0001 mg/L
Silver 1E-05ND mg/L
Sample ID: LCS-75024 10/09/13 14:27Laboratory Control Sample Run: SUB-B213031
Aluminum 110 85 1150.0302.8 mg/L
Beryllium 93 85 1150.00100.23 mg/L
Cobalt 102 85 1150.00500.51 mg/L
Copper 103 85 1150.00500.52 mg/L
Manganese 94 85 1150.00102.4 mg/L
Nickel 101 85 1150.00500.51 mg/L
Thallium 95 85 1150.000500.48 mg/L
Zinc 99 85 1150.0100.50 mg/L
Arsenic 95 85 1150.00380.47 mg/L
Barium 93 85 1150.0505.1 mg/L
Cadmium 99 85 1150.00100.25 mg/L
Chromium 99 85 1150.00500.50 mg/L
Lead 101 85 1150.00100.50 mg/L
Silver 98 85 1150.00100.049 mg/L
Sample ID: LCSD-75024 10/09/13 14:39Laboratory Control Sample Duplicate Run: SUB-B213031
Aluminum 109 85 115 200.030 0.02.7 mg/L
Beryllium 94 85 115 200.0010 0.00.24 mg/L
Cobalt 102 85 115 200.0050 0.00.51 mg/L
Copper 103 85 115 200.0050 0.00.52 mg/L
Manganese 96 85 115 200.0010 0.02.4 mg/L
Nickel 101 85 115 200.0050 0.00.51 mg/L
Thallium 96 85 115 200.00050 0.00.48 mg/L
Zinc 101 85 115 200.010 0.00.51 mg/L
Arsenic 95 85 115 200.0038 0.00.47 mg/L
Barium 95 85 115 200.050 0.05.2 mg/L
Cadmium 99 85 115 200.0010 0.00.25 mg/L
Chromium 99 85 115 200.0050 0.00.50 mg/L
Qualifiers:
RL - Analyte reporting limit. ND - Not detected at the reporting limit.
Page 12 of 15

Project: Barker Hughsville Pilot
Client: CDM Federal Programs
Work Order: H13090479
QA/QC Summary Report
10/23/13Report Date:
Analyte Result %REC RPDLow Limit High Limit RPDLimitRLUnits Qual
Prepared by Helena, MT Branch
Method: SW6020 Batch: B_75024
Sample ID: LCSD-75024 10/09/13 14:39Laboratory Control Sample Duplicate Run: SUB-B213031
Lead 102 85 115 200.0010 0.00.51 mg/L
Silver 103 85 115 200.0010 0.00.052 mg/L
Qualifiers:
RL - Analyte reporting limit. ND - Not detected at the reporting limit.
Page 13 of 15
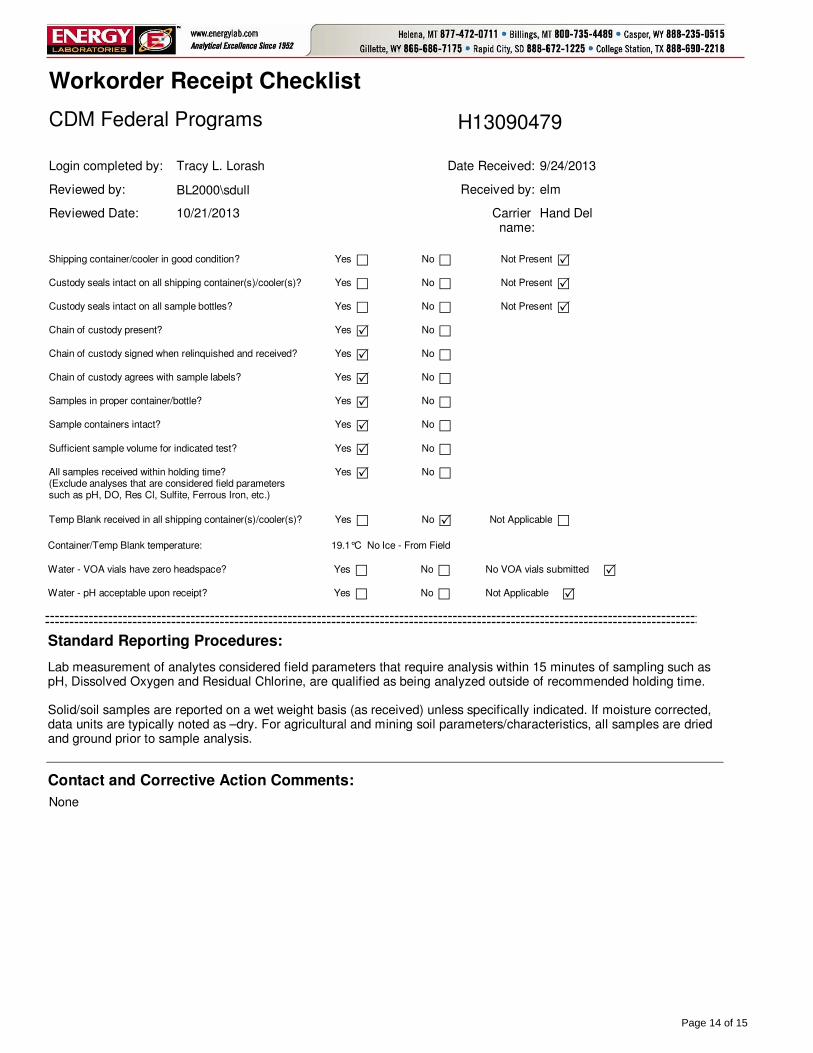
Shipping container/cooler in good condition?
Custody seals intact on all shipping container(s)/cooler(s)?
Custody seals intact on all sample bottles?
Chain of custody present?
Chain of custody signed when relinquished and received?
Chain of custody agrees with sample labels?
Samples in proper container/bottle?
Sample containers intact?
Sufficient sample volume for indicated test?
All samples received within holding time?(Exclude analyses that are considered field parameterssuch as pH, DO, Res Cl, Sulfite, Ferrous Iron, etc.)
Container/Temp Blank temperature:
Water - VOA vials have zero headspace?
Water - pH acceptable upon receipt?
Yes
Yes
Yes
Yes
Yes
Yes
Yes
Yes
Yes
Yes
Yes
Yes
No
No
No
No
No
No
No
No
No
No
No
No
� �
�
�
�
�
�
�
�
�
�
�
�
�
�
�
�
�
�
�
�
�
�
�
Not Present
Not Present
Not Present
�
�
�
No VOA vials submitted
Not Applicable �
�
19.1°C No Ice - From Field
9/24/2013Tracy L. Lorash
Hand Del
elm
Date Received:
Received by:
Login completed by:
Carrier name:
BL2000\sdull
10/21/2013
Reviewed by:
Reviewed Date:
Contact and Corrective Action Comments:
None
Temp Blank received in all shipping container(s)/cooler(s)? Yes No� � Not Applicable �
Lab measurement of analytes considered field parameters that require analysis within 15 minutes of sampling such as pH, Dissolved Oxygen and Residual Chlorine, are qualified as being analyzed outside of recommended holding time.
Solid/soil samples are reported on a wet weight basis (as received) unless specifically indicated. If moisture corrected, data units are typically noted as –dry. For agricultural and mining soil parameters/characteristics, all samples are dried and ground prior to sample analysis.
Standard Reporting Procedures:
Workorder Receipt Checklist
CDM Federal Programs H13090479
Page 14 of 15

Page 15 of 15

ANALYTICAL SUMMARY REPORTANALYTICAL SUMMARY REPORTANALYTICAL SUMMARY REPORTANALYTICAL SUMMARY REPORT
The analyses presented in this report were performed by Energy Laboratories, Inc., 3161 E. Lyndale Ave., Helena, MT 59604, unless otherwise noted. Any exceptions or problems with the analyses are noted in the Laboratory Analytical Report, the QA/QC Summary Report, or the Case Narrative.
The results as reported relate only to the item(s) submitted for testing.
If you have any questions regarding these test results, please call.
Sample ID Client Sample ID Collect Date Receive Date Matrix Test
Report Approved By:
H13100450-001 13BH-DT-PILOT-MGOH-102213
10/22/13 11:00 10/23/13 Aqueous Preparation for TSSSolids, Total Suspended
CDM Federal Programs
Project Name: Barker Hughsville Pilot
Workorder No.: H13100450
555 17th St Ste 1100
Denver, CO 80202
October 25, 2013
H823 - Baker-Hughsville Superfund SiteQuote ID:
Energy Laboratories Inc Helena MT received the following 1 sample for CDM Federal Programs on 10/23/2013 for analysis.
Page 1 of 5

LABORATORY ANALYTICAL REPORT
Client: CDM Federal Programs
Project: Barker Hughsville Pilot
Lab ID: H13100450-001
Client Sample ID 13BH-DT-PILOT-MGOH-102213
Collection Date: 10/22/13 11:00
Matrix: Aqueous
Report Date: 10/25/13
DateReceived: 10/23/13
Prepared by Helena, MT Branch
Analyses Result Units Analysis Date / ByRL Method
MCL/QCLQualifiers
PHYSICAL PROPERTIES
10/24/13 12:36 / cmm10mg/L12700Solids, Total Suspended TSS @ 105 C A2540 D
ReportDefinitions:
RL - Analyte reporting limit. MCL - Maximum contaminant level.
QCL - Quality control limit. ND - Not detected at the reporting limit.
Page 2 of 5

Project: Barker Hughsville Pilot
Client: CDM Federal Programs
Work Order: H13100450
QA/QC Summary Report
10/25/13Report Date:
Analyte Result %REC RPDLow Limit High Limit RPDLimitRLUnits QualCount
Prepared by Helena, MT Branch
Method: A2540 D Batch: 22220
Sample ID: MB-22220 10/24/13 12:35Method Blank Run: ACCU-124 (14410200)_131024
Solids, Total Suspended TSS @ 105 C 1ND mg/L
Sample ID: LCS-22220 10/24/13 12:35Laboratory Control Sample Run: ACCU-124 (14410200)_131024
Solids, Total Suspended TSS @ 105 C 92 70 130101850 mg/L
Sample ID: H13100451-001ADUP 10/24/13 12:37Sample Duplicate Run: ACCU-124 (14410200)_131024
Solids, Total Suspended TSS @ 105 C 510 8.774800 mg/L R
Qualifiers:
RL - Analyte reporting limit. ND - Not detected at the reporting limit.
R - RPD exceeds advisory limit.
Page 3 of 5
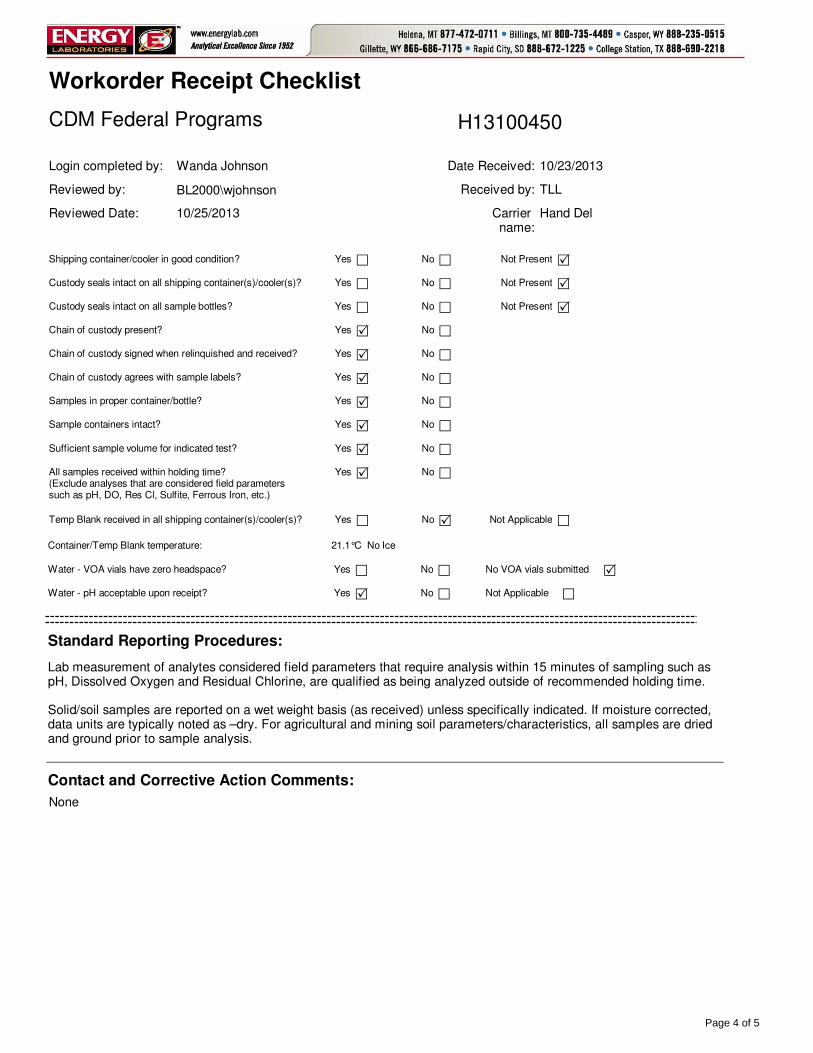
Shipping container/cooler in good condition?
Custody seals intact on all shipping container(s)/cooler(s)?
Custody seals intact on all sample bottles?
Chain of custody present?
Chain of custody signed when relinquished and received?
Chain of custody agrees with sample labels?
Samples in proper container/bottle?
Sample containers intact?
Sufficient sample volume for indicated test?
All samples received within holding time?(Exclude analyses that are considered field parameterssuch as pH, DO, Res Cl, Sulfite, Ferrous Iron, etc.)
Container/Temp Blank temperature:
Water - VOA vials have zero headspace?
Water - pH acceptable upon receipt?
Yes
Yes
Yes
Yes
Yes
Yes
Yes
Yes
Yes
Yes
Yes
Yes
No
No
No
No
No
No
No
No
No
No
No
No
� �
�
�
�
�
�
�
�
�
�
�
�
�
�
�
�
�
�
�
�
�
�
�
Not Present
Not Present
Not Present
�
�
�
No VOA vials submitted
Not Applicable �
�
21.1°C No Ice
10/23/2013Wanda Johnson
Hand Del
TLL
Date Received:
Received by:
Login completed by:
Carrier name:
BL2000\wjohnson
10/25/2013
Reviewed by:
Reviewed Date:
Contact and Corrective Action Comments:
None
Temp Blank received in all shipping container(s)/cooler(s)? Yes No� � Not Applicable �
Lab measurement of analytes considered field parameters that require analysis within 15 minutes of sampling such as pH, Dissolved Oxygen and Residual Chlorine, are qualified as being analyzed outside of recommended holding time.
Solid/soil samples are reported on a wet weight basis (as received) unless specifically indicated. If moisture corrected, data units are typically noted as –dry. For agricultural and mining soil parameters/characteristics, all samples are dried and ground prior to sample analysis.
Standard Reporting Procedures:
Workorder Receipt Checklist
CDM Federal Programs H13100450
Page 4 of 5

Page 5 of 5