Word Template - Report Document (Office 2010)€¦ · Web viewCafe/Coffee Lounge Seating. 1,842....
33
Oxford Street Village Summary Report 2012 City of Sydney Town Hall House 456 Kent Street Sydney NSW 2000
Transcript of Word Template - Report Document (Office 2010)€¦ · Web viewCafe/Coffee Lounge Seating. 1,842....
Oxford Street Village Summary Report 2012
City of SydneyTown Hall House456 Kent StreetSydney NSW 2000

Oxford Street Village
Introduction
The City of Sydney undertakes its comprehensive Floor Space and Employment Survey (FES) every five years to coincide with the Australian Bureau of Statistics’ Census of Population and Housing. The latest FES is the second to encompass those areas amalgamated into the City of Sydney from the former South Sydney and Leichhardt Councils in 2004, and allows the City of Sydney to investigate and report on changes in workforce, businesses and floor space across Surveys.
The FES collects data on all businesses, floor space uses and employment numbers for every building or property within the City of Sydney local government area (LGA). It provides a snapshot of the built form, land uses and economic activity of the City of Sydney every five years. The field data captured for the current Survey was undertaken during 2012.
The data collection phase of the FES involves field surveyors visiting every business in the City of Sydney to determine what industry the business is in, how many workers are in each business, and the floor space use of each business through visual inspection and the use of existing floor space. Information for various capacity measures such as quantity of seating, parking, rooms and units are also collected. Residential uses are only surveyed from the street and validated by checking existing floor plans. The data is entered into a Geographic Information System (GIS) database to allow 2- and 3-dimensional mapping, analysis and reporting.
The data is used by both internal and external stakeholders as a basis for strategic planning, policy formulation, business development and forecasting.
The Oxford Street Village is located in the eastern part of the LGA, with boundaries adjoining Woollahra Municipal Council and Randwick City Council. The area includes the suburbs of Darlinghurst and parts of Paddington, Moore Park, Centennial Park and Surry Hills. The Village has two distinct geographic areas; the northern section is triangular in shape and is bounded by William Street, Boundary Road, Campbell Street and College Street, whilst the southern section is bounded by Oxford Street, Centennial Park and Anzac Parade (see Figure 1). The two sections are joined at Taylor Square.
Oxford Street Village is made up of a unique and diverse number of land uses with a vibrant night-time economy and cultural and retail offerings centred on Oxford Street and Taylor Square. The southern area is dominated by large sporting stadiums, the Entertainment Quarter and Fox Studios, whilst the northern section contains one of Sydney’s major hospitals. Accordingly, the Village has a high number of workers from the Health and Creative industries, creating a dynamic mix of workers. Oxford Street Village is also home to a lively and engaging business precinct dominated by small to medium enterprises. The Village is also home to a large number of residents, with purely residential streets and enclaves found throughout the area, creating hubs of community activity.
The 2012 FES collected data from 3,303 sites in the Village, including 1,345 business premises. The total internal floor space surveyed was 2,371,563m², a slight decrease of 0.6% from the previous Survey, due to a
1 / Oxford Street Village FES Report
Figure 1: Oxford Street Village Location Map

number of buildings demolished for reconstruction at the time of the Survey. A further 1,262,047m² of external area (including parks, backyards, balconies, pools etc.) were also included in the data.
Figure 2 below shows the extent of the Oxford Street Village, looking east. Residential uses are shown in dark red, and are predominantly located in three distinct areas; terrace housing in Darlinghurst surrounding by increasing multi-unit developments, terrace housing west of Victoria Barracks (near Taylor Square) and terrace, multi-unit and single housing in Paddington and Centennial Park. Business uses are shown in light brown and are located across the Village.
Figure 2. The Oxford Street Village looking east.
In 2011 the population for Oxford Street Village was 18,328, an increase of 997 people or 5.8% since 2006, according to the Australian Bureau of Statistics’ (ABS) Estimated Resident Population (ERP) data. Although, given the high population growth experienced in other parts of the City of Sydney the proportion of the City of Sydney’s residents in Oxford Street Village fell from 10.5% in 2006 to 10.0% in 2011. This trend is expected to continue in the future: it is estimated that Oxford Street Village will accommodate approximately 9.3% of the City of Sydney’s residents by 2016, and scale down to 7.7% by 2031 as residential growth increases in other Villages.1
The Oxford Street Village resident population was housed in 10,716 dwellings at the time of the Survey. Nearly 70% of the dwelling stock was located in multi-storey apartment blocks, whilst a further 22.3% of the dwellings were terrace houses. There was a slight 1.6% increase in the net number of dwellings between the two Surveys. There are a number of multi-story apartment residential developments that are due to be completed in the near future.2
Employment in the Oxford Street Village increased by 14.5% between the Surveys, from 15,240 in 2007 to 17,455 in 2012. The proportion of full-time employment decreased slightly from 79.9% in 2007 to 77.1% in 2012. Over the same period, the average number of workers per business marginally decreased from 13.1 to 13.0. The percentage increase in businesses located in the
1 City of Sydney Population Forecasts, Research performed by .id Consulting Pty Ltd. Available at: http://forecast2.id.com.au/Default.aspx?id=148&pg=5000 2 City of Sydney, Residential Monitor December 2012. Available at: http://www.cityofsydney.nsw.gov.au/__data/assets/pdf_file/0017/142514/Issue-no.-49-December-2012.pdf
2 / Oxford Street Village FES Report

Village was very similar to the employment growth, with an additional 182 businesses counted, a growth of 15.6%.
The number of tenant parking spaces in the Village decreased marginally by 2.4% between 2007 and 2012. These losses are likely to be recouped in the current residential developments that are under construction in the Village.
When looking at Visitor Accommodation in the Village, there has been a slight decrease in the number of hotel rooms of 3.8%, and a 36.5% increase in the number of backpacker beds between the Surveys.
The key totals for the 2007 and 2012 Surveys are shown in Table 1 below.
Table 1. Key Totals for Oxford Street Village, 2007-2012Category 2007 2012 Chang
e%
ChangeGeneral
Sites Surveyed 3,306 3,303 -3 -0.1%Buildings Surveyed 3,238 3,233 -5 -0.2%Businesses Surveyed 1,163 1,345 182 15.6%
Areas
Internal Floor Area (m²) 2,384,892
2,371,563 -13,329 -0.6%
External Area (m²) 1,250,873
1,262,047 11,174 0.9%
Total Surveyed Area (m²) 3,635,765
3,633,611 -2,154 -0.1%
EmploymentFull-time Employment 12,183 13,462 1,279 10.5%Part-time Employment 3,057 3,993 936 30.6%Total Employment 15,240 17,455 2,215 14.5%
ResidentialNumber of Dwellings 10,545 10,716 171 1.6%Buildings with Dwellings 2,663 2,660 -3 -0.1%Population 17,331 18,299 968 5.6%Occupancy Rate 1.64 1.71 - -
Tenant ParkingInternal Parking Spaces 5,815 5,730 -85 -1.5%External Parking Spaces 4,053 3,897 -156 -3.8%Total Parking Spaces 9,868 9,627 -241 -2.4%
Visitor AccommodationHotel Accommodation (Rooms) 994 956 -38 -3.8%Serviced Apartments (Units) 0 0 0 NABackpacker Accommodation (Beds) 126 172 46 36.5%
3 / Oxford Street Village FES Report

Industry Classification
The FES codes each business establishment based on a modified Australian and New Zealand Standard Industrial Classification (ANZSIC) – 2006. ANZSIC classifies the primary activity of a business into 16 ‘Divisions’ and then into 506 4-digit ‘Industries’. The Survey has further sub-divided these into 644 unique business uses. This allows for more detailed analysis of business, employment and floor space uses.
The 644 business uses have been re-categorised into a ‘City-Based Industry Sector’ Classification based on the method used by the City of Greater London. This classification better reflects the mix of uses within the business community of city centres such as the City of Sydney. There are nineteen “business” related industry divisions, and a further five ‘non-business’ related industry divisions within the City-Based Industry Sector Classification. This allows the analysis of industry groups such as Creative Industries, ICT (Information, Communications and Technology) and Tourist, Cultural and Leisure.
Table 2 (following) shows the breakdown by City Based Industry of employment, businesses and (business) floor space for the Oxford Street Village in 2012. During the Survey, data was collected on 1,345 businesses; there were 17,455 workers counted; and businesses occupied 987,937m² of internal floor space.
The predominant Industry Sector in the Oxford Street Village is Health, with the highest proportion of employment and the second highest proportion of floor area. The Food and Drink sector has the highest number of businesses in Oxford Street Village. A number of Industry Sectors employ more than 1,500 workers within the Oxford Street Village, including Creative industries, Food and Drink, Health, Higher Education and Research and Tourist, Cultural and Leisure. This characterises a diversified industry mix in a location that is historically dominated by the Health sector, based around St Vincent’s Hospital. Tables 3, 5 and 6 (following) show the changes in the number of businesses, employment and business floor space use by each of the City Based Industry Sectors between 2007 and 2012.
Business Establishments
Between 2007 and 2012 the number of businesses in the Oxford Street Village increased by 15.6%, from 1,163 to 1,345 businesses. The largest sectoral increase occurred in the Food and Drink Industry, with an additional 44 business establishments compared to 2007. There were an additional 33 Higher Education and Research premises compared to 2007, most notably a campus of Notre Dame University. Thirteen of the seventeen City-Based Industry Sectors present in the Oxford Street Village grew in the number of business establishments. Although there were slight decreases in the number of Government, Life Science (Bio-tech) and Motor Vehicle businesses, while businesses in the Manufacturing sector decreased substantially within the Village.
Of the 1,163 business located in the Village in 2007, 865 were still operating in the same location in 2012. The Food and Drink sector had the largest number of new establishments with 105 businesses commencing between 2007 and 2012. Higher Education and Research experienced the largest growth rate of 73.3%, followed by Health and ICT which grew by 40.0% and 37.9%, respectively. There were a significant number of new businesses commencements in a number of additional industry sectors, including Creative Industries, Professional and Business Services and Retail and Personal Services. Along with Community and Tourist, Cultural and Leisure, these sectors had significant growth in the number of newly starting establishments. The area’s predominant industry in terms of business numbers, Food and Drink, had the largest business turnover number (61 ceasing or moving operation, with 105 commencing as mentioned previously), similar to Creative Industries with 46 establishments ceasing or moving, and 60 commencing.
4 / Oxford Street Village FES Report

Table 2. Overview of City-Based Industry Sectors, Oxford Street Village, 2012
City-Based Industry Sector Businesses % of Total Businesses Employment % of Total
EmploymentBusiness
Floor Area%
Business Floor Area
Community 35 2.6% 593 3.4% 61,326 6.2%Creative Industries 201 14.9% 2,710 15.5% 162,020 16.4%Finance and Financial Services 23 1.7% 454 2.6% 8,559 0.9%Food and Drink 270 20.1% 1,677 9.6% 48,097 4.9%Government 26 1.9% 922 5.3% 43,220 4.4%Health 70 5.2% 3,522 20.2% 165,005 16.7%Higher Education and Research 78 5.8% 1,768 10.1% 78,508 7.9%ICT 40 3.0% 845 4.8% 32,584 3.3%Life Science (Bio-tech) 7 0.5% 32 0.2% 1,322 0.1%Manufacturing 2 0.1% 13 0.1% 941 0.1%Motor Vehicle 18 1.3% 160 0.9% 15,710 1.6%Natural Resource-Based Industries 0 0.0% 0 0.0% 0 0.0%Other* 0 0.0% 55 0.3% 0 0.0%Professional and Business Services 122 9.1% 1,387 7.9% 34,840 3.5%Property Development and Operation 19 1.4% 268 1.5% 5,833 0.6%Retail and Personal Services 219 16.3% 864 4.9% 38,324 3.9%Social Capital 55 4.1% 395 2.3% 25,700 2.6%Tourist, Cultural and Leisure 129 9.6% 1,599 9.2% 184,117 18.6%Transport and Logistics 30 2.2% 181 1.0% 80,324 8.1%Utilities 1 0.1% 10 0.1% 1,510 0.2%Total 1,345 100.0% 17,455 100.0% 987,937 100.0%
Table 3. Business Mix By City-Based Industry Sectors, Oxford Street Village, 2007-2012
5 / Oxford Street Village FES Report
*’Other’ industry sector data may include nil businesses, nil employment and/or nil business floor area. This is explained by: the inclusion of non-private households which employ staff, such as student accommodation and aged care facilities; and, workers counted in common areas of multi-tenanted buildings who are not directly linked to a business establishment.
City-Based Industry Sector 2007 % of 2007 Businesses 2012 % of 2012
BusinessesChange
2007-2012% Change 2007-2012
Community 29 2.5% 35 2.6% 6 20.7%Creative Industries 187 16.1% 201 14.9% 14 7.5%Finance and Financial Services 22 1.9% 23 1.7% 1 4.5%Food and Drink 226 19.4% 270 20.1% 44 19.5%Government 30 2.6% 26 1.9% -4 -13.3%Health 50 4.3% 70 5.2% 20 40.0%Higher Education and Research 45 3.9% 78 5.8% 33 73.3%ICT 29 2.5% 40 3.0% 11 37.9%Life Science (Bio-tech) 8 0.7% 7 0.5% -1 -12.5%Manufacturing 5 0.4% 2 0.1% -3 -60.0%Motor Vehicle 20 1.7% 18 1.3% -2 -10.0%Natural Resource-Based Industries 0 0.0% 0 0.0% 0 NAOther 2 0.2% 0 0.0% -2 -100.0%Professional and Business Services 107 9.2% 122 9.1% 15 14.0%Property Development and Operation 19 1.6% 19 1.4% 0 0.0%Retail and Personal Services 205 17.6% 219 16.3% 14 6.8%Social Capital 49 4.2% 55 4.1% 6 12.2%Tourist, Cultural and Leisure 108 9.3% 129 9.6% 21 19.4%Transport and Logistics 22 1.9% 30 2.2% 8 36.4%Utilities 0 0.0% 1 0.1% 1 NA
Total 1,163 100.0% 1,345 100.0% 182 15.6%
6 / Oxford Street Village FES Report

Table 4. Recent and Established Businesses By City-Based Industry Sectors, Oxford Street Village, 2012
City-Based Industry Sector Established(Pre-2008)
Commenced2008-2012
% Established
Community 33 2 94.3%Creative Industries 141 60 70.1%Finance and Financial Services 13 10 56.5%Food and Drink 165 105 61.1%Government 25 1 96.2%Health 47 23 67.1%Higher Education and Research 28 50 35.9%ICT 20 20 50.0%Life Science (Bio-tech) 4 3 57.1%Manufacturing 1 1 50.0%Motor Vehicle 12 6 66.7%Natural Resource-Based Industries 0 0 NAOther 0 0 NAProfessional and Business Services 72 50 59.0%Property Development and Operation 17 2 89.5%Retail and Personal Services 149 70 68.0%Social Capital 40 15 72.7%Tourist, Cultural and Leisure 81 48 62.8%Transport and Logistics 17 13 56.7%Utilities 0 1 0.0%Total 865 480 64.3%
Figures 3a and 3b (following) show the percentage share of the top six City-Based Industry Sectors in 2007 and 2012. Food and Drink remains the predominant industry in terms of the number of businesses, increasing its percentage share from 19.4% to 20.1% between the Surveys. Retail and Personal Services maintained second place, although its establishment share fell from 17.6% to 16.3%, whilst Creative Industries fell from 16.1% to 14.8% despite a slight increase in establishment numbers. Notwithstanding an increase in the absolute number of establishments, Health has fallen out of the top six industries in terms of share of total businesses, its place taken by Higher Education and Research.
The changes in percentage
share of the various industry sectors in Oxford Street Village are relatively minor, with no sector rising or falling by more than 2% between the Surveys.
7 / Oxford Street Village FES Report
19.4%
17.6%
16.1%9.3%
9.2%
4.3%
24.1%
% of Total Businesses, 2007
Food and Drink
Retail and PersonalServices
Creative Industries
Tourist, Cultural andLeisure
Professional andBusiness Services
Health
Other Industries
20.1%
16.3%
14.8%9.6%
8.9%
5.8%
24.3%
% of Total Businesses, 2012
Food and Drink
Retail and PersonalServices
Creative Industries
Tourist, Cultural andLeisure
Professional andBusiness Services
Higher Education andResearch
Other Industries

Employment
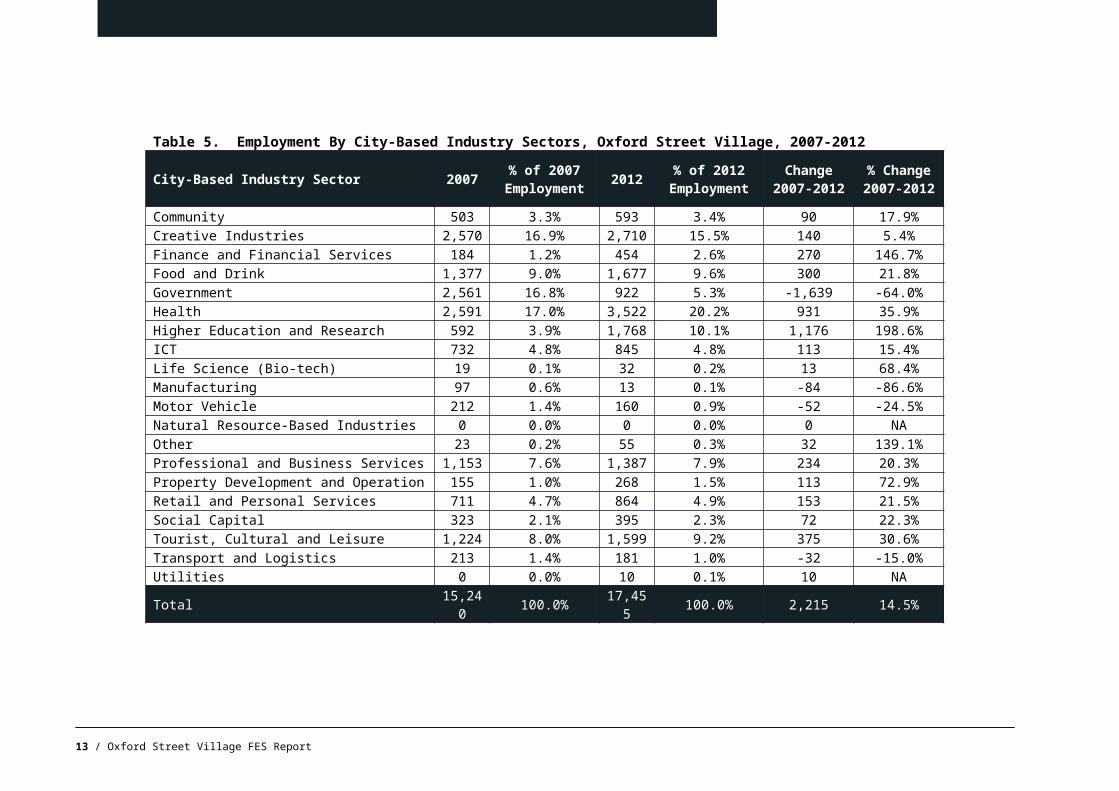
In the period between the Surveys, employment in the Oxford Street Village increased by 14.5% with an additional 2,215 jobs being created. There were 17,455 workers counted in 2012 across nineteen different industry sectors. Fifteen of the nineteen sectors experienced employment growth, with Higher Education and Research and Health recording the highest increases. Higher Education and Research increased their employment by 1,176, experiencing growth of 198.6% since 2007, while the Health sector employed an additional 931 workers. Both of these industry sectors had complementary growth in the net number of businesses. Health remains the predominant employer in the area with St Vincent’s Hospital and the Garvan Institute, amongst other Health establishments, employing over one fifth of workers in the Village. The Higher Education and Research Sector almost tripled its workforce over the period, whilst increasing the number of business premises by approximately 75%.
Table 5 following shows the breakdown of employment by City-Based industry Sector for 2007 and 2012, with the percentage share of each sector and the change between Surveys. The Finance and Financial Services sector more than doubled its employment numbers, albeit from a relatively low base, with another two sectors adding at least half their worker numbers again over a five year period.
The main employment loss occurred in the Government Industry Sector. This is due to a number of State Government departments relocating their offices from the Oxford Street Village to other areas, usually outside the City of Sydney LGA. Much of this space has been taken over by businesses with the Higher Education and Research sector. In areas such as Oxford Street Village, the loss of a single large employer can dramatically change the workforce numbers across the area. Fortunately, the employment loss in the Government sector over the period between the Surveys was more than replaced by growth in most other sectors.
In 2012, businesses in Oxford Street Village employed 13.0 workers on average across all sectors. For industry sectors employing more than 500 workers, the Health Sector had the highest average workers per establishment with 50.3, whilst the Retail and Personal Services sector had the fewest workers per business with 4.0. The average number of workers per establishment in 2007 was 13.1. The growth of businesses that employ relatively few workers in sectors such as Food and Drink and Retail and Personal Services was offset by growth in high employment per business generating sectors such as Higher Education and Research.
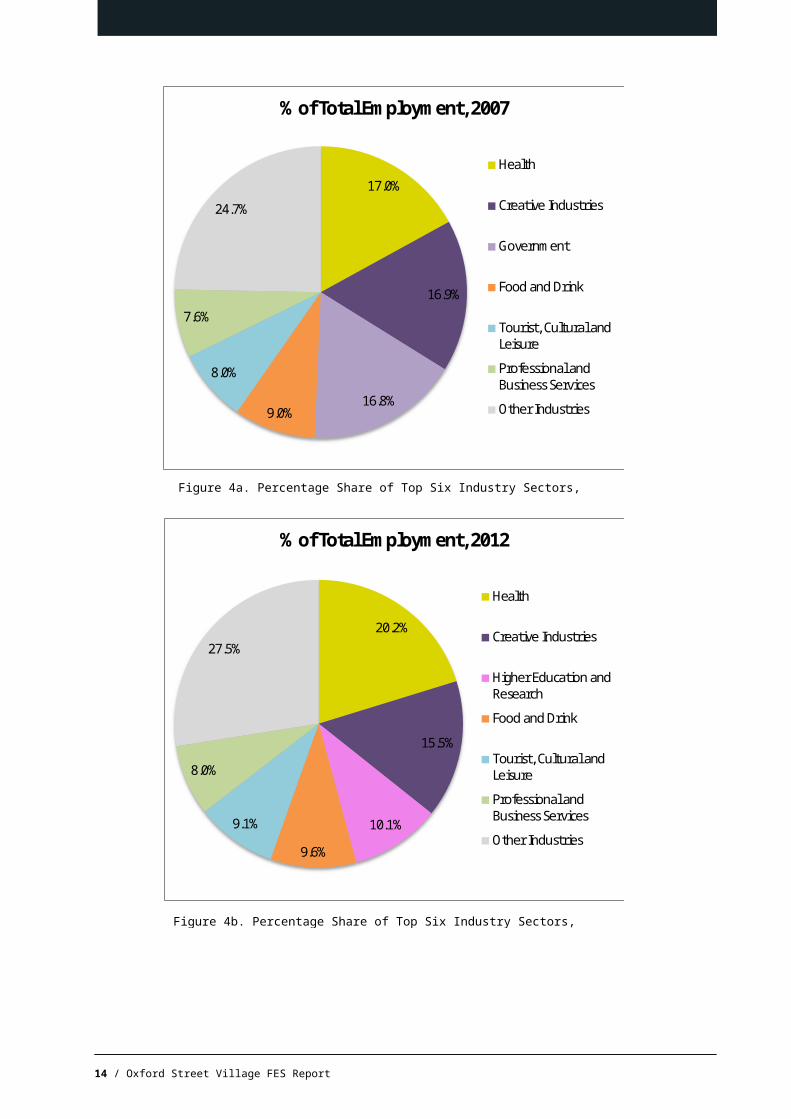
The following figures (4a and 4b) illustrate the proportion of employment across the top six industry sectors in 2007 and 2012 respectively. The Health industry sector had the highest proportion of employment in both 2007 and 2012, increasing its share of employment over the period, from 17.0% in 2007 up to 20.2% in 2012.
The Creative Industries sector was still the second highest employer in both Surveys, although its percentage share decreased by 1.4%.
The industries that gained the most in their percentage share of employment were Health, Higher Education and Research, increasing from 3.9% to 10.1%, and Tourist, Culture and Leisure, increasing from 8.0% to 9.1% of total employment.
Total employment in the Village was more evenly distributed across the industry sectors in 2012 than in 2007. The top six industries combined became less dominant in terms of employment share in comparison to the remaining industries, with Other Industries increasing their employment share by 2.8% over the period
8 / Oxford Street Village FES Report

Table 5. Employment By City-Based Industry Sectors, Oxford Street Village, 2007-2012
City-Based Industry Sector 2007 % of 2007 Employment 2012 % of 2012
EmploymentChange
2007-2012% Change 2007-2012
Community 503 3.3% 593 3.4% 90 17.9%Creative Industries 2,570 16.9% 2,710 15.5% 140 5.4%Finance and Financial Services 184 1.2% 454 2.6% 270 146.7%Food and Drink 1,377 9.0% 1,677 9.6% 300 21.8%Government 2,561 16.8% 922 5.3% -1,639 -64.0%Health 2,591 17.0% 3,522 20.2% 931 35.9%Higher Education and Research 592 3.9% 1,768 10.1% 1,176 198.6%ICT 732 4.8% 845 4.8% 113 15.4%Life Science (Bio-tech) 19 0.1% 32 0.2% 13 68.4%Manufacturing 97 0.6% 13 0.1% -84 -86.6%Motor Vehicle 212 1.4% 160 0.9% -52 -24.5%Natural Resource-Based Industries 0 0.0% 0 0.0% 0 NAOther 23 0.2% 55 0.3% 32 139.1%Professional and Business Services 1,153 7.6% 1,387 7.9% 234 20.3%Property Development and Operation 155 1.0% 268 1.5% 113 72.9%Retail and Personal Services 711 4.7% 864 4.9% 153 21.5%Social Capital 323 2.1% 395 2.3% 72 22.3%Tourist, Cultural and Leisure 1,224 8.0% 1,599 9.2% 375 30.6%Transport and Logistics 213 1.4% 181 1.0% -32 -15.0%Utilities 0 0.0% 10 0.1% 10 NA
Total 15,240 100.0% 17,45
5 100.0% 2,215 14.5%
9 / Oxford Street Village FES Report

10 / Oxford Street Village FES Report
Figure 4a. Percentage Share of Top Six Industry Sectors, 2007
Figure 4b. Percentage Share of Top Six Industry Sectors, 2012
17.0%
16.9%
16.8%9.0%
8.0%
7.6%
24.7%
% of Total Employment, 2007
Health
Creative Industries
Government
Food and Drink
Tourist, Cultural andLeisure
Professional andBusiness Services
Other Industries
20.2%
15.5%
10.1%
9.6%
9.1%
8.0%
27.5%
% of Total Employment, 2012
Health
Creative Industries
Higher Education andResearch
Food and Drink
Tourist, Cultural andLeisure
Professional andBusiness Services
Other Industries
The following figures (5 and 6) show the distribution of employment by block in 2012 and the change in employment numbers by block between 2007 and 2012 respectively. As can be seen in Figure 5 below, there are significant concentrations of employment on the western edge of Darlinghurst, around St Vincent’s Hospital and Moore Park (Fox Studios and the Entertainment Quarter).
11 / Oxford Street Village FES Report
Figure 5. Total Employment by Block, 2012

Figure 6 below shows that the significant employment growth has occurred around St Vincent’s Hospital, with small increases through the centre of Darlinghurst. The major employment loss has occurred in the western half of the Village around Whitlam Square, where a number of previously commercial buildings have been converted for residential use. Much of the total employment change by block across the Oxford Street Village is in the minor (positive or negative) categories.
12 / Oxford Street Village FES Report
Figure 6. Total Employment Change by Block, 2007 to 2012
Floor Area
The 2012 FES measured 2,371,563m² of internal floor space in the Oxford Street Village. Additionally, data was collected on 1,262,047m² metres of external space, including parks, car parks, terraces and balconies. The measurements for the floor space uses were collected by creating spatial entities for each non-contiguous space, and attributing relevant attribute data such as employment numbers, capacity and vacancy to each. Every individual space is held in a Geographic Information System (GIS) database, and is related to the business that uses it. The GIS calculates the areas automatically, and allows 2-D and 3-D rendering of the data.
In terms of internal business floor area, the Tourist, Culture and Leisure sector occupies the largest amount of floor space in the Village, with nearly 185,000m². This is approximately one-fifth of all internal area in Oxford Street Village, and is mostly located in the Moore Park Precinct, including Alliance Stadium (former Sydney Football Stadium) and the Sydney Cricket Ground. The Health and Creative Industries sectors are the next largest, both with approximately 165,000m².
The Higher Education and Research Sector had the highest increase in floor area used, with an additional 30,573m² (an increase of 63.8%). Between the two Surveys, there was 12,974m² of net additional business floor space across all sectors, compared to an additional 2,215 workers. This suggests that there has been a slight intensification of floor space per worker (work space ratio) across the Village. The industry sectors with significant floor area losses include Manufacturing (down 70.6%) Government (down 47.7%), Motor Vehicle (down 44.0%) and Social Capital (down 23.6%).
The amount of residential floor area increased by 1.7% between 2007 and 2012 (by approximately 20,000m² of stock) although a number of residential developments are currently under construction and due to finish shortly after the Survey. There was a net increase of 171 dwellings during this period.
13 / Oxford Street Village FES Report
14 / Oxford Street Village FES Report
Table 6. Internal Floor Area By City-Based Industry Sectors, Oxford Street Village, 2007-2012
City-Based Industry Sector 2007m²
% of 2007 Floor Space
2012m²
% of 2012 Floor Space
Change2007-2012
% Change 2007-2012
Community 44,280 4.5% 61,326 6.2% 17,045 38.5%Creative Industries 168,409 17.3% 162,020 16.4% -6,389 -3.8%Finance and Financial Services 4,780 0.5% 8,559 0.9% 3,779 79.1%Food and Drink 44,119 4.5% 48,097 4.9% 3,978 9.0%Government 82,600 8.5% 43,220 4.4% -39,380 -47.7%Health 161,110 16.5% 165,005 16.7% 3,895 2.4%Higher Education and Research 47,935 4.9% 78,508 7.9% 30,573 63.8%ICT 30,384 3.1% 32,584 3.3% 2,200 7.2%Life Science (Bio-tech) 1,157 0.1% 1,322 0.1% 164 14.2%Manufacturing 3,203 0.3% 941 0.1% -2,263 -70.6%Motor Vehicle 28,073 2.9% 15,710 1.6% -12,363 -44.0%Natural Resource-Based Industries 0 0.0% 0 0.0% 0 NAProfessional and Business Services 33,499 3.4% 34,840 3.5% 1,341 4.0%Property Development and Operation 3,211 0.3% 5,833 0.6% 2,622 81.7%Retail and Personal Services 37,037 3.8% 38,324 3.9% 1,287 3.5%Social Capital 33,641 3.5% 25,700 2.6% -7,941 -23.6%Tourist, Cultural and Leisure 167,474 17.2% 184,117 18.6% 16,642 9.9%Transport and Logistics 82,599 8.5% 80,324 8.1% -2,275 -2.8%Utilities 1,451 0.1% 1,510 0.2% 59 4.1%Total Business Floor Area 974,963 100.0% 987,937 100.0% 12,974 1.3%
Private Households 1,107,902 46.5% 1,126,460 47.5% 18,557 1.7%Non-Private Households 13,654 0.6% 14,745 0.6% 1,091 8.0%Other 166,984 7.0% 159,012 6.7% -7,972 -4.8%Redevelopment 11,762 0.5% 22,396 0.9% 10,633 90.4%Vacant 109,626 4.6% 61,014 2.6% -48,612 -44.3%Total Businesses Floor Area 974,963 40.9% 987,937 41.7% 12,974 1.3%Total Floor Area 2,384,892 100.0% 2,371,563 100.0% -13,328 -0.6%

15 / Oxford Street Village FES Report
Figure 7a. Percentage Share of Top Six Industry Sectors by Floor Area, 2007
Figure 7b. Percentage Share of Top Six Industry Sectors by Floor Area, 2012
17.3%
17.2%
16.5%8.5%
8.5%
4.9%
27.2%
% of Business Floor Area, 2007
Creative Industries
Tourist, Cultural andLeisureHealth
Government
Transport andLogisticsHigher Education andResearchOther Industries
19.1%
16.7%
16.3%8.1%
7.9%
6.2%
25.8%
% of Business Floor Area, 2012
Tourist, Cultural andLeisureHealth
Creative Industries
Transport andLogisticsHigher Education andResearchCommunity
Other Industries

Figures 7a and 7b show the percentage share of business floor area for the top six industries in 2007 and 2012 respectively. Tourist, Cultural and Leisure had the highest share of floor space usage in 2012 with 19.1%, up from 17.2% in 2007. Over the same period, Creative Industries decreased its percentage share of floor space from 17.3% to 16.3%, whilst Health marginally increased its floor space from 16.5% to 16.7%.
The five years between the Surveys has seen the top three industries continue to share just over 50% of business floor space, although they have changed their relative rankings. The Government sector has fallen out of the top six, to be replaced by the Community industry sector. Of the other two sectors in the top six, Transport and Logistics has marginally decreased its share of business floor space, whilst Higher Education and Research has increased its share by 3%.
The average business is approximately 735m² in size (for all space uses) across all sectors. This ranges from an average low space use of 175m² per establishment for Retail and Personal Services, up to an average of 2,677m² of floor space use per establishment for the Transport and Logistics sector.
Figure 8 below maps the distribution of internal floor area by block for the Oxford Street Village in 2012. The highest levels of floor space are located around St Vincent’s Hospital, the Entertainment Quarter, and those blocks with major high rise residential and commercial buildings, generally around the periphery of the Village.
At the time of the Survey, approximately 83,000m² of internal floor area was vacant or under redevelopment, comprising 3.7% of all internal floor space. This is down from 5.1% of floor space in the same category in 2007. There are a number of small redevelopments occurring in the Village, both residential and employment generating, however capacity for major development in Oxford Street Village is somewhat limited by the existing built form.
16 / Oxford Street Village FES Report
Figure 8. Total Internal Floor Space by Block, 2012

Space Use
The City of Sydney Floor Space and Employment Survey collects data in three levels, from individual ‘Space Units’ (space uses), which belong to ‘Establishments’, which are located in ‘Buildings’. The FES data classifies all floor area within the LGA according to the way in which the space is used. Each space use is assigned a code, which is categorised according to fourteen different space use divisions. Space use codes are also used to record employment, seating capacities, dwelling and room numbers and parking spaces. These space uses can then be related to the industry use of each establishment, and the location of each building. For the Oxford Street Village, there were 35,307 internal and 9,112 external individual space units recorded in 2012. This represents a 9.5% increase in the number of records collected compared to the 2007 Survey.
Table 7 following indicates the internal floor area by Space Use Division within the Oxford Street Village in 2007 and 2012. The Village has been historically dominated by the Health industry sector, with a large and well established Residential base. Overall, the amount of internal space has marginally decreased between the Surveys. This is due to buildings under construction at the time of the 2012 Survey. Residential space uses are currently the predominant type of space, rising from 40.7% in 2007 to 41.6% in 2012. Looking at residential construction currently approved and underway, the percentage share of Residential space is set to increase in the short term. The amount of space devoted to Parking has decreased by 4.1% (Parking includes parking spaces, driveways, loading zones and bicycle parking). There was approximately 15,000m² of Entertainment/Leisure space added between the Surveys, located predominantly at the Entertainment Quarter, Moore Park.
The Industrial Space Use Division had the greatest loss of space between 2007 and 2012, with approximately 31,000m² lost, largely through redevelopment into residential uses. Interestingly, the amount of employment in these spaces increased over the same period (Table 8), with a greater intensification of use of this space in 2012. There was also a minor decrease in the amount of Office space uses, due to the redevelopment of sites with small Office components.
Table 8 following shows the total employment by Space Use Division for the Oxford Street Village in both 2007 and 2012. Those Space Uses with no employment (or minor employment) have been aggregated into the Other category.
The majority of employment in Oxford Street Village is located in Office space uses, comprising 68.0% of all employment. The Restaurant/Eating Space Use Division holds the second highest number of workers with 2,159, or 12.4% of the total employment. For all but one of the Space Use Divisions, employment totals have risen; with an additional 1,012 workers in Office spaces and 542 in Restaurant/Eating spaces.
The FES collects a number of capacity measures that are related to different types of space uses. The capacities are recorded for each individual space record. Table 9 (following) shows the capacity of restaurant seating, café seating, and meeting room / boardroom seating aggregated across the Village for 2007 and 2012.
In the five year period from 2007 to 2012, there was a 33.2% increase in the number of restaurant seats, with the number of restaurant establishments rising from 77 to 102. There was a 31.2% increase in café seating, commensurate with an increase in the number of café establishments from 67 in 2007 to 84 in 2012. In terms of the number of seats in meeting rooms (or boardrooms), this rose by 12.3% in the same period.
17 / Oxford Street Village FES Report

Table 7. Internal Floor Area by Space Use Division, Oxford Street Village, 2007-2012
Space Use Division 2007m²
% Floor Area 2007
2012m²
% Floor Area 2012
Change 2007-2012
% Change 2007-2012
Office 348,532 14.6% 348,409 14.7% -123 0.0%Shop/Showroom 63,635 2.7% 57,602 2.4% -6,033 -9.5%Residential 970,062 40.7% 986,071 41.6% 16,008 1.7%Storage 59,973 2.5% 64,544 2.7% 4,571 7.6%Industrial 56,796 2.4% 25,958 1.1% -30,838 -54.3%Visitor Accommodation 43,429 1.8% 40,909 1.7% -2,520 -5.8%Entertainment/Leisure 115,611 4.8% 131,166 5.5% 15,555 13.5%Restaurant/Eating 52,538 2.2% 57,810 2.4% 5,273 10.0%Community 61,030 2.6% 60,070 2.5% -960 -1.6%Utilities 21,942 0.9% 23,768 1.0% 1,827 8.3%Parking 287,758 12.1% 275,894 11.6% -11,865 -4.1%Transport 2,934 0.1% 3,570 0.2% 636 21.7%Common Area 231,977 9.7% 231,411 9.8% -566 -0.2%Other 68,675 2.9% 64,381 2.7% -4,294 -6.3%Total 2,384,892 100.0% 2,371,563 100.0% -13,329 -0.6%
18 / Oxford Street Village FES Report

Table 8. Employment Mix by Space Use Division, Oxford Street Village, 2007-2012
Space Use Division 2007 % Employment 2007 2012 % Employment
2012Change
2007-2012% Change 2007-2012
Office 10,853 71.2% 11,865 68.0% 1,012 9.3%Shop/Showroom 1,155 7.6% 1,310 7.5% 155 13.4%Storage 99 0.6% 125 0.7% 26 26.3%Industrial 242 1.6% 399 2.3% 157 64.9%Entertainment/Leisure 244 1.6% 321 1.8% 77 31.6%Restaurant/Eating 1,617 10.6% 2,159 12.4% 542 33.5%Community 709 4.7% 844 4.8% 135 19.0%Utilities 290 1.9% 296 1.7% 6 2.1%Transport 19 0.1% 11 0.1% -8 -42.1%Other 12 0.1% 125 0.7% 113 941.7%Total 15,240 100.0% 17,455 100.0% 2,215 14.5%
Table 9. Selected Capacity Measures, Oxford Street Village, 2007-2012
Capacity Measure 2007 2012 Change 2007-2012
% Change 2007-2012
Restaurant Seating 4,385 5,839 1,454 33.2%Cafe/Coffee Lounge Seating 1,842 2,417 575 31.2%Meeting Room/Board Room Seating 2,663 2,990 327 12.3%
19 / Oxford Street Village FES Report

Work Space Ratios
Work Space Ratios (WSR) are an indication of the average number of square metres within which employees work for a particular industry. The ratio is determined by dividing the internal floor area (in square metres) of a categorised space grouping by the total number of employees recorded for that grouping. Ratios can be determined using the Industry Divisions, Space Use Divisions, Office Space uses and Occupied Office space uses, where the floor area is divided by total employees. The ratios for each category can be used for projecting the anticipated population of new developments, and to determine how space uses are managed over time.
Table 10 following shows the industry-wide WSRs for Oxford Street Village in 2007 and 2012. In any given industry division, where the WSR for 2012 is less than that of 2007, there has been an intensification of employment to space use for that industry. This means that a percentage of the growth of employment of any given area or industry may come from more intensive use of space, rather than solely from the take-up of new development space. This has been the case in twelve of the eighteen industries present in the Village.
Overall, the average WSR for the Village fell from 64.1 in 2007 to 56.8 in 2012. By comparison, the overall WSR for the LGA was 41.5 in 2007 and 37.9 in 2012. The most intensive use of work space occurs in the Finance and Financial Services, with 18.9m² for every worker. This is a slight decrease in space per employee when compared to 2007, where there was 26.0m² per worker. The industries with the lower WSRs tend to have higher concentrations of office spaces, in the case of the Health Division, doctor’s surgeries or waiting rooms. Those industries with higher WSRs tend to have very large areas with little or no employment, such as showrooms or storage areas (Transport and Logistics or Motor Vehicle) or public spaces (Community or Tourist, Culture and Leisure). The average WSR across all industry sectors for Oxford Street Village was 23m² greater than the LGA average in 2007 (64.1 compared to 41.5), falling to approximately 19m² greater than the LGA average in 2012 (56.8 compared to 37.9).
The following table (Table 11) shows the WSRs for the nine main employment generating space use divisions. Space Use Divisions with minor employment levels have not been included; hence the totals for the table do not match the corresponding Village totals (for floor space and employment in Tables 7 and 8).
Interestingly, the Restaurant/Eating Space Use Division has the lowest WSR (26.8), closely followed by the Office division (29.4). This is a reversal of the 2007 results, and is due to the increased average workers per business for new restaurants and cafes within the Village. All of the other Space Use Divisions are far less intensive in their use of floor area for employment, generally using space for ancillary purposes. There has been a dramatic fall in the WSR for Industrial spaces, suggesting that a fundamental change is occurring in the way this type of space remaining in this Village is used and that it is becoming far more intensive and employment oriented (rather than process oriented).
In general, the Office Space Use Division is the most intensive of the space uses, and is usually a good indicator of future employment projections for a known quantum of floor space. The two main types of Office space defined are partitioned offices (predominantly walled offices with single occupants) and open plan offices (with workstations and multiple workers). Table 12 shows that the average WSR for partitioned and open plan office spaces is 18.1 square metres per worker (as compared to 29.4 for all Office space uses combined, which also includes other spaces such as meeting rooms, reception areas, photocopy areas and breakout spaces). The 2012 Survey also collected the capacity of partitioned and open-plan offices and vacant office space to determine the maximum intensity of uses for these two office types. If all Office space was fully occupied at the current average work space ratio, there could be an additional 2,344 workers in Oxford Street Village (Table 13).
20 / Oxford Street Village FES Report

Table 10. Work Space Ratios by City-Based Industry Division, Oxford Street Village, 2007-20122007 2012
City Based Industry Sector Internal Area Employment WSR Internal
Area Employment WSR
Community 44,280 503 88.0 61,326 593 103.4Creative Industries 168,409 2,570 65.5 162,020 2,710 59.8Finance and Financial Services 4,780 184 26.0 8,559 454 18.9Food and Drink 44,119 1,377 32.0 48,097 1,677 28.7Government 82,600 2,561 32.3 43,220 922 46.9Health 161,110 2,591 62.2 165,005 3,522 46.8Higher Education and Research 47,935 592 81.0 78,508 1,768 44.4ICT 30,384 732 41.5 32,584 845 38.6Life Science (Bio-tech) 1,157 19 60.9 1,322 32 41.3Manufacturing 3,203 97 33.0 941 13 NAMotor Vehicle 28,073 212 132.4 15,710 160 98.2Natural Resource-Based Industries 0 0 NA 0 0 NAProfessional and Business Services 33,499 1,153 29.1 34,840 1,387 25.1Property Development and Operation 3,211 155 20.7 5,833 268 21.8Retail and Personal Services 37,037 711 52.1 38,324 864 44.4Social Capital 33,641 323 104.2 25,700 395 65.1Tourist, Cultural and Leisure 167,474 1,224 136.8 184,117 1,599 115.1Transport and Logistics 82,599 213 387.8 80,324 181 443.8Utilities* 1,451 0 NA 1,510 10 151.0Total 974,963 15,217 64.1 987,937 17,400 56.8
21 / Oxford Street Village FES Report
*’Utilities’ industry sector data may include nil businesses, nil employment and /or nil business floor area. This is explained by the presence of substations or pumping stations (business floor area data that has not been directly linked to a business establishment).

Table 11. Work Space Ratios by Space Use Division, Oxford Street Village, 2007-20122007 2012
Space Use Division Internal Area Employment WSR Internal
Area Employment WSR
Office 348,532 10,853 32.1 348,409 11,865 29.4Shop/Showroom 63,635 1,155 55.1 57,602 1,310 44.0Storage 59,973 99 605.8 64,544 125 516.4Industrial 56,796 242 234.7 25,958 399 65.1Entertainment/Leisure 115,611 244 473.8 131,166 321 408.6Restaurant/Eating 52,538 1,617 32.5 57,810 2,159 26.8Community 61,030 709 86.1 60,070 844 71.2Utilities 21,942 290 75.7 23,768 296 80.3Transport 2,934 7 419.1 3,570 11 324.6Total 782,990 15,216 51.5 772,898 17,330 44.6
Table 12. Work Space Ratios by Office Space Use, Oxford Street Village, 2007-20122007 2012
Office Type Internal Area Employment WSR Internal
Area Employment WSR
Partitioned Office 71,941 2,908 24.7 60,973 2,975 20.5Open Plan Office 104,906 6,110 17.2 111,596 6,543 17.1Total 176,846 9,018 19.6 172,569 9,518 18.1
22 / Oxford Street Village FES Report

Table 13. Potential Maximum Capacity Work Space Ratios by Office Space Use, Oxford Street Village, 2012
2012
Office Type Internal Area Employment Capacity WSR
Partitioned Office 60,973 3,272 18.6Open Plan Office 111,596 7,707 14.5Vacant Office 20,545 883 23.3Total 193,113 11,862 16.3
Occupied Office Employment (Actual) 9,518Additional Office Employment Capacity 2,344
Conclusion
Since the previous Survey in 2007 Oxford Street Village experienced strong growth in employment and business establishments, creating an additional 2,215 jobs with 182 more businesses. Resident population increased, although the proportion of City of Sydney residents living in the Village decreased slightly.
The Village economy has undergone minor sectoral changes due to the relocation of substantial parts of the Government sector outside the Village, which has been balanced by the exceptionally high growth rate of the Higher Education and Research sector. The Health sector maintained its position as the dominant industry by employment, increasing its share of total employment since 2007.
WSRs decreased during the five year period since the previous Survey, indicating a growing intensification of employment to space. This reflects the decline of sectors including Manufacturing, Motor Vehicle and Life Science (Bio-tech) coupled with the growth of sectors such as Finance and Financial Services which has the lowest WSR of all industries.
The top three sectors dominating the number of business establishments remains unchanged since 2007, they are: Food and Drink, Retail and Personal Services and Creative Industries. This is in keeping with the inherent structure of these sectors which tend to be made up of a large number of specialised small and medium enterprises.
Residential housing continues to dominate internal floor uses and minor growth in the Residential sector is expected to continue into the near future. The Tourist, Culture and Leisure sector occupies the largest amount of floor space in the Village in terms of the internal business floor area, overtaking the Creative Industries since 2007. This is largely concentrated in the southern portion of the Village where the two major stadiums and the Entertainment Quarter/Fox Studios complex are situated. The Community sector also entered the top six industries, based on internal floor area, demonstrating its growth over the period.
23 / Oxford Street Village FES Report