
Word on the Streets - claytonmo.gov
38
Word on the Streets Their Management, Condition, and Maintenance Board of Aldermen Discussion Session May 27, 2014 Steve Meyer, P.E. Civil Engineer
Transcript of Word on the Streets - claytonmo.gov

Word on the StreetsTheir Management, Condition, and Maintenance
Board of Aldermen Discussion SessionMay 27, 2014
Steve Meyer, P.E.Civil Engineer

Pavement Management Program
Asphalt Streets (entire subdivision)– Year 0-Asphalt Surface Installed– Year 7-Microsurfacing– Year 14-Microsurfacing– Year 20-Mill and Asphalt Overlay
Concrete Streets and Alleys– Replacement of Alleys every 25-30 years
Cracksealing every 2 years (east/west)
2

Mill & Overlay
Replace/upgrade curb ramps Remove 2”-3” of asphalt by
cold milling Repair underlying base Pave with 2”-3” of asphalt
– Aggregate (rock & sand)– Asphaltic concrete
Plan on every 20 years
3

Microsurfacing
Replace/upgrade curb ramps Thin layer, 1/4”- 3/8” thick
– Asphalt emulsion– Water– Aggregate (granite or slag)– Portland Cement– Polymer Binder
Wearing course, seals surface, extending asphalt life
Plan on every 7 years4

Novachip/UBAWS(Ultra-thin bonded asphalt wearing surface)
Replace/upgrade curb ramps Remove ¾” of asphalt by cold milling Pave with ¾” of Novachip (modified asphalt)
– Asphalt emulsion sprayed directly in front of paver– Aggregate (rock & sand)– Asphaltic Concrete (petroleum)– Polymer
New to Clayton, but used by County– Brentwood Boulevard (Galleria)– Hanley Road (Maplewood Commons)5

Alley Replacement
Full replacement of concrete 4” Aggregate base 8” Concrete Should last 30 years
6

Crack and Joint Sealing
Rubberized sealant Keeps out water and incompressibles (rocks) Prevents damage due to freeze-thaw Extends pavement life Less than $50,000 per year Each area every 2 years
– Even years: east of Hanley – Odd years: west of Hanley– Omit streets to be overlaid7

Curb Ramp Replacement
Compliance with ADA About 25 specific requirements
– Grades/Slopes– Widths– Level Landing– Detectable Warning– Color Contrast
MoDOT checklist is 19 pages Triggered by “alteration” to the street
8
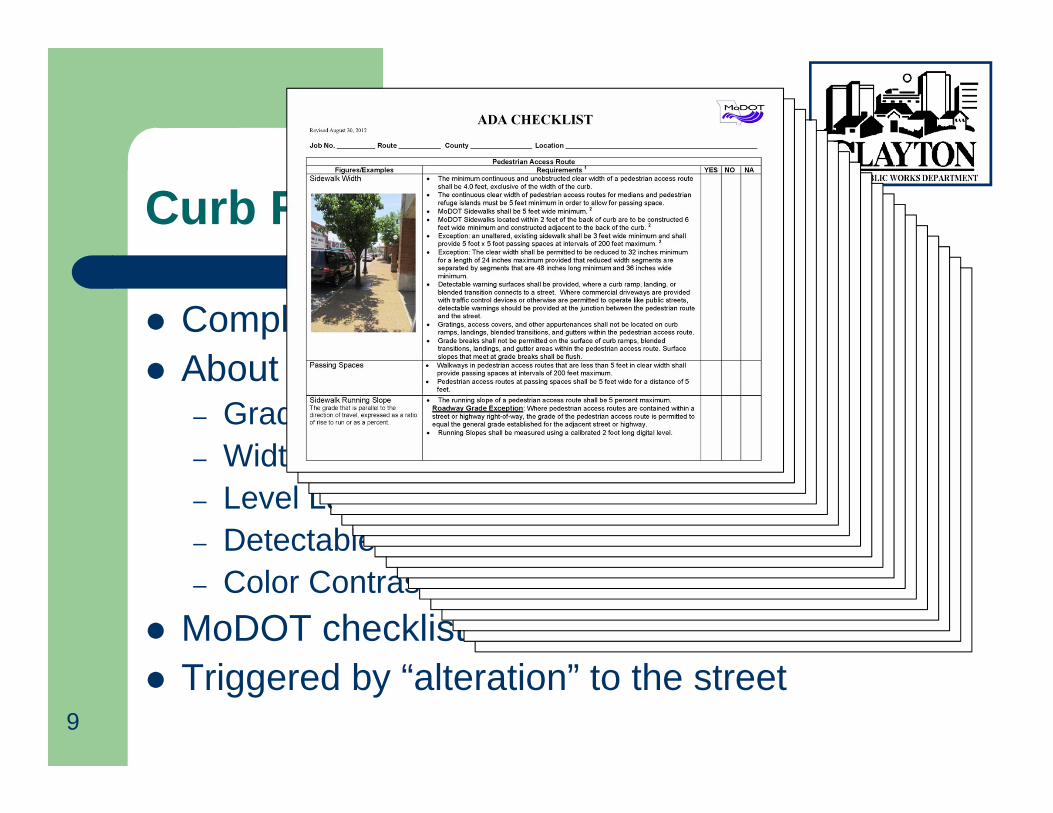
Curb Ramp Replacement
Compliance with ADA About 25 specific requirements
– Grades/Slopes– Widths– Level Landing– Detectable Warning– Color Contrast
MoDOT checklist is 19 pages Triggered by “alteration” to the street
9

FHWA/DOJ Clarification Maintenance
Crackfilling and Sealing Surface Sealing Chip Seals Slurry Seals Fog Seals Scrub Sealing Joint Crack Seals Joint Repairs Dowel Bar Retrofit Spot High-Friction Treatments Diamond Grinding Pavement Patching
Alterations
Open-graded Surface Course Cape Seals Mill & Overlay Hot In-Place Recycling Microsurfacing Asphalt Overlay Asphalt & Concrete Rehabilitation
and Reconstruction New Construction
10
Annual Pavement Evaluation
Performed in January each year Each street/alley evaluated Alley replacement prioritized based upon
condition and budget Streets follow predictable decline and
improvement due to our program
11

Pavement Rating Results
12

Street Ratings (2007-2014)
13
Resurf:Davis Place
Micro: Arterials
Micro: Downtown, Clayshire, Hillcrest,
Polos
Resurf:Forsyth,
N. Meramec

14
Current Street Ratings
2014
2014
2015
2015
2015
2015
20162016
2016
2017
2017
2017

Alley Ratings (2009-2014)
15
Concordia
Northwood-S. Rosebury,
64xx Clayton,Centene

16
2014
2015 2014
2014
2015
2016
2016
Current Alley Ratings
partial
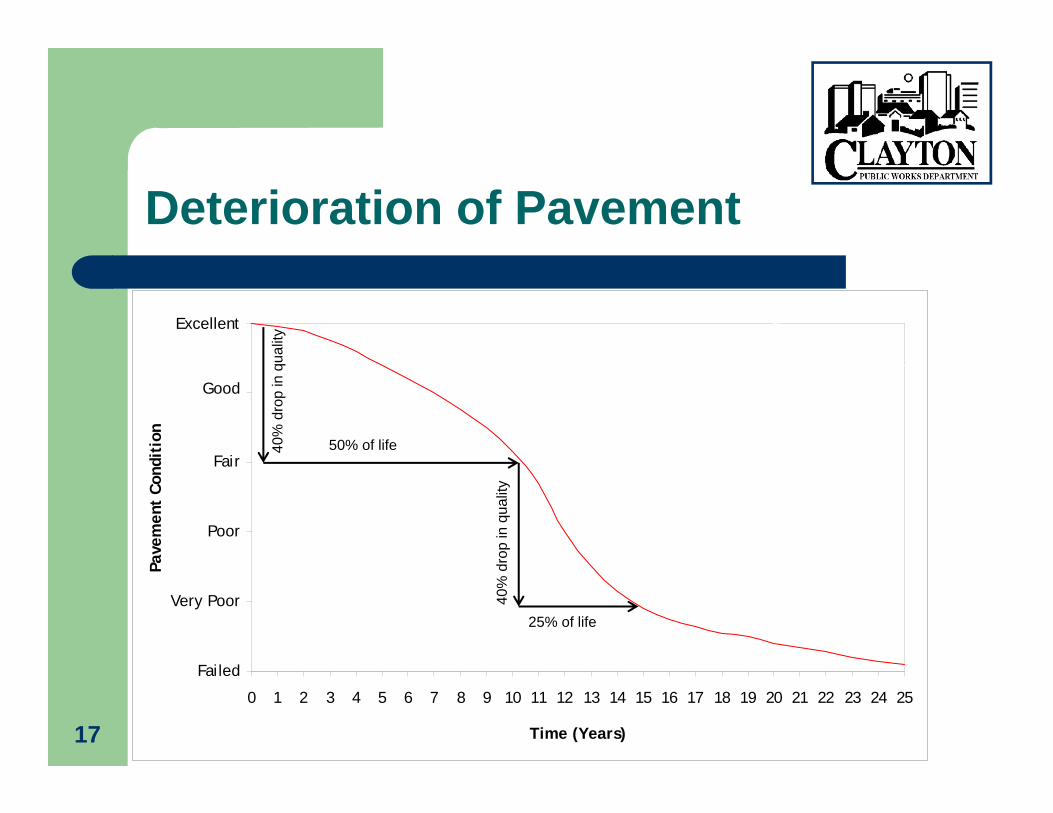
Deterioration of Pavement
0
0.000001
0.000002
0.000003
0.000004
0.000005
0 1 2 3 4 5 6 7 8 9 10 11 12 13 14 15 16 17 18 19 20 21 22 23 24 25
Time (Years)
Pave
men
t C
ondi
tion
Good
Fair
Excellent
Poor
Very Poor
Failed
17
50% of life40%
dro
p in
qua
lity
40%
dro
p in
qua
lity
25% of life

0
0.000001
0.000002
0.000003
0.000004
0.000005
0 1 2 3 4 5 6 7 8 9 10 11 12 13 14 15 16 17 18 19 20 21 22 23 24 25
Time (Years)
Pave
men
t C
ondi
tion
Good
Fair
Excellent
Poor
Very Poor
Failed
Reactive Pavement Strategy
Reconstruct
$95/SY
18

Reactive Pavement Strategy
0
0.000001
0.000002
0.000003
0.000004
0.000005
0 1 2 3 4 5 6 7 8 9 10 11 12 13 14 15 16 17 18 19 20 21 22 23 24 25
Time (Years)
Pave
men
t C
ondi
tion
Good
Fair
Excellent
Poor
Very Poor
Failed
Reconstruct
$95/SY
19

Proactive Maintenance StrategyYears 0-7
0
0.000001
0.000002
0.000003
0.000004
0.000005
0 1 2 3 4 5 6 7 8 9 10 11 12 13 14 15 16 17 18 19 20 21 22 23 24 25
Time (Years)
Pave
men
t C
ondi
tion
Good
Fair
Excellent
Poor
Very Poor
Failed
Microsurface
$5/SY
20
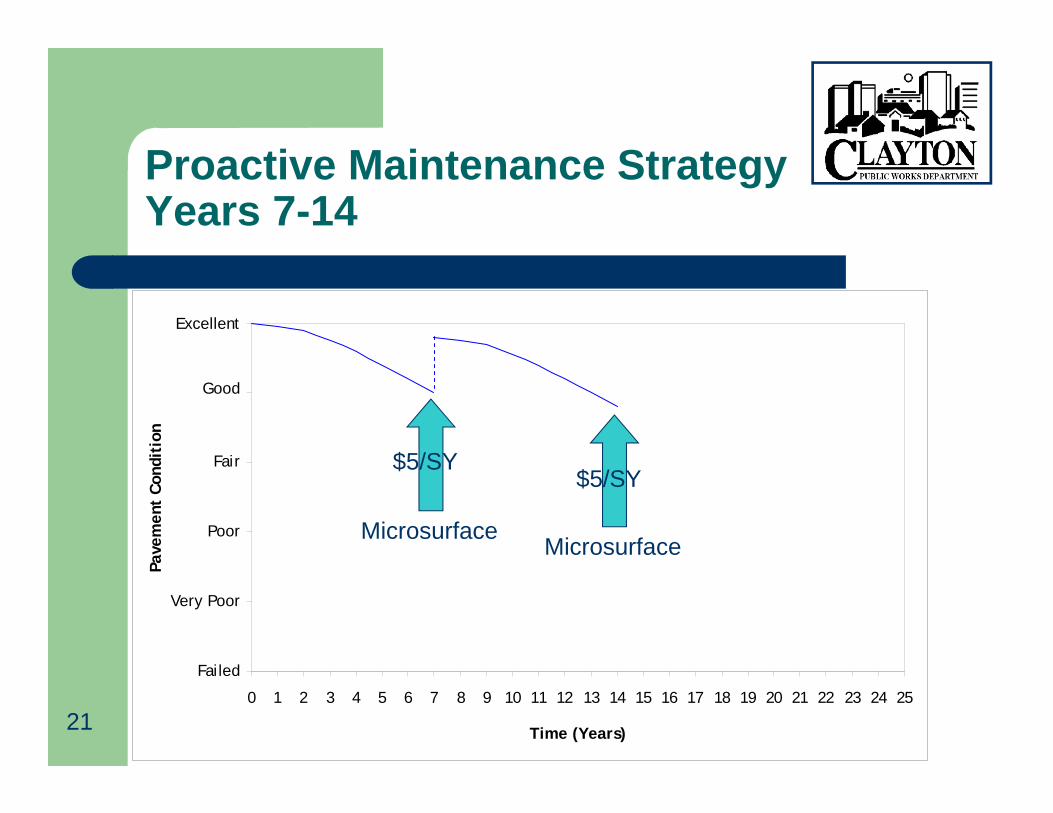
Proactive Maintenance StrategyYears 7-14
0
0.000001
0.000002
0.000003
0.000004
0.000005
0 1 2 3 4 5 6 7 8 9 10 11 12 13 14 15 16 17 18 19 20 21 22 23 24 25
Time (Years)
Pave
men
t C
ondi
tion
Good
Fair
Excellent
Poor
Very Poor
Failed
MicrosurfaceMicrosurface
$5/SY$5/SY
21

Proactive Maintenance StrategyYears 14-20
0
0.000001
0.000002
0.000003
0.000004
0.000005
0 1 2 3 4 5 6 7 8 9 10 11 12 13 14 15 16 17 18 19 20 21 22 23 24 25
Time (Years)
Pave
men
t C
ondi
tion
Good
Fair
Excellent
Poor
Very Poor
Failed
MicrosurfaceMicrosurface Mill &
Overlay
$5/SY$5/SY $30/SY
22
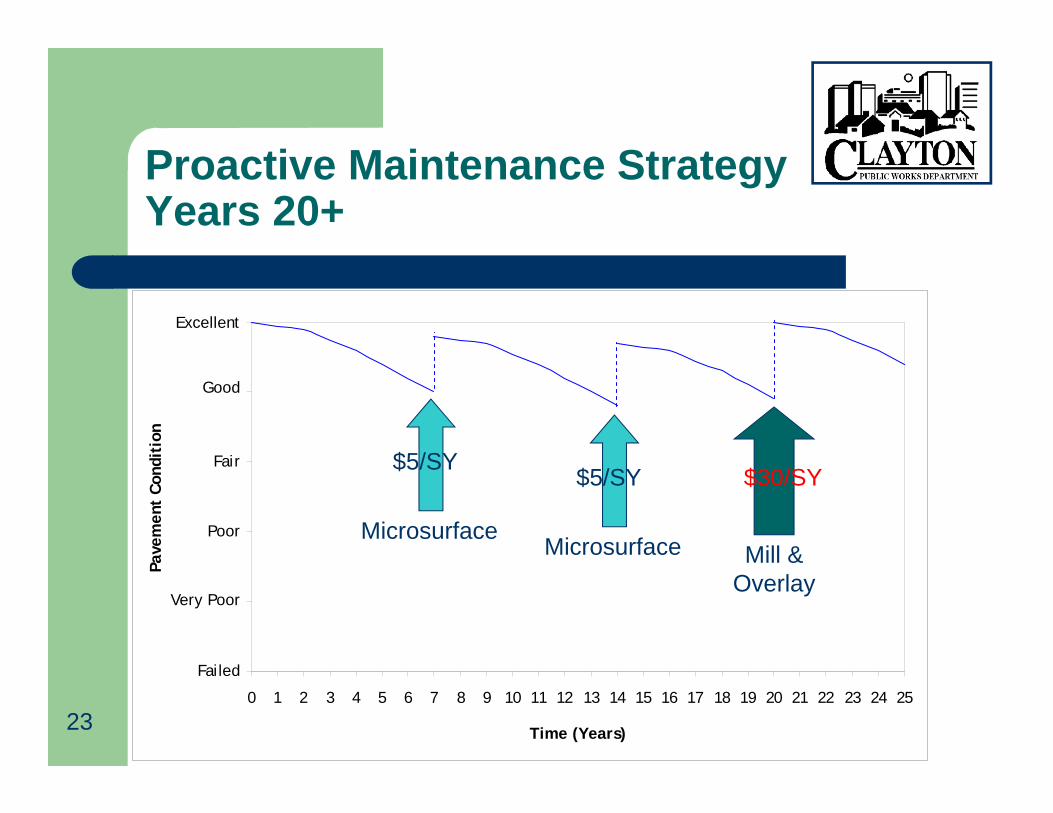
Proactive Maintenance StrategyYears 20+
0
0.000001
0.000002
0.000003
0.000004
0.000005
0 1 2 3 4 5 6 7 8 9 10 11 12 13 14 15 16 17 18 19 20 21 22 23 24 25
Time (Years)
Pave
men
t C
ondi
tion
Good
Fair
Excellent
Poor
Very Poor
Failed
MicrosurfaceMicrosurface Mill &
Overlay
$5/SY$5/SY $30/SY
23

Proactive vs. Reactive
0
0.000001
0.000002
0.000003
0.000004
0.000005
0 1 2 3 4 5 6 7 8 9 10 11 12 13 14 15 16 17 18 19 20 21 22 23 24 25
Time (Years)
Pave
men
t C
ondi
tion
Good
Fair
Excellent
Poor
Very Poor
Failed
$5/SY $30/SY$5/SY
$95/SY
24
50% of life40%
dro
p in
qua
lity
40%
dro
p in
qua
lity
25% of life

Benefits of a Proactive Program
Pavement maintained at higher level Significant cost savings Entire subdivisions treated at same time Establishment of sequence More predictable budget Extends life of pavement
25
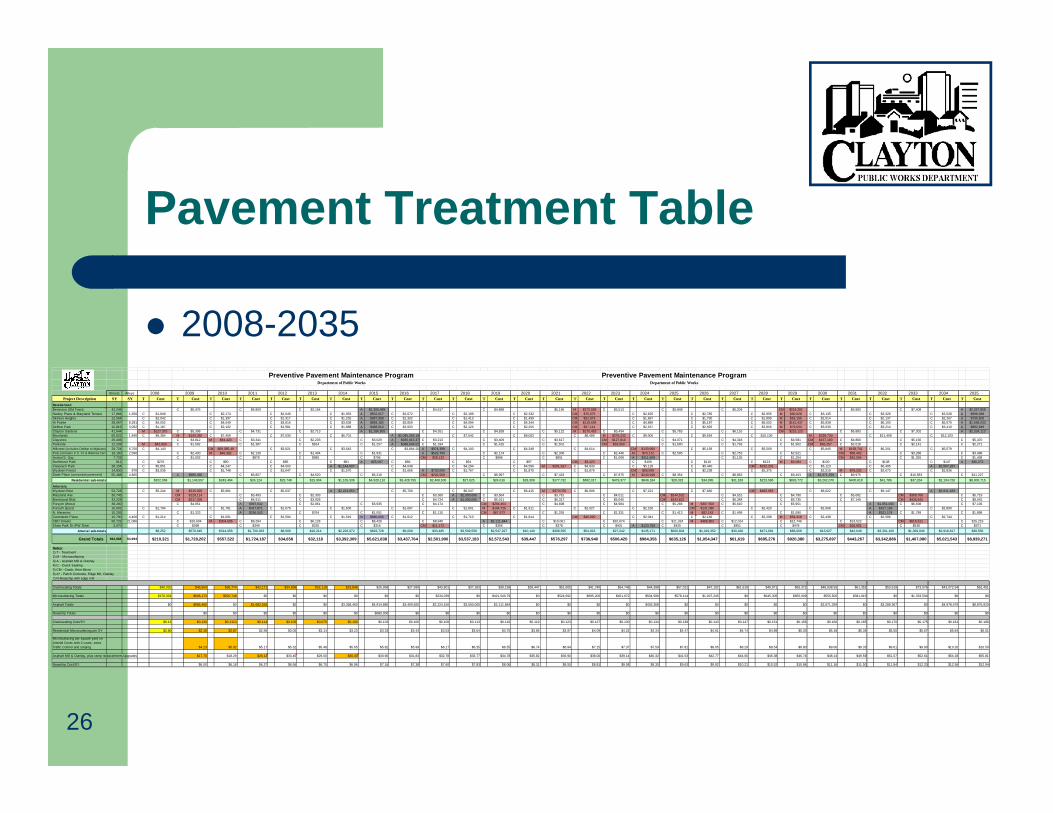
Pavement Treatment Table
2008-2035
26
Streets Alleys
Project Description SY SY T Cost T Cost T Cost T Cost T Cost T Cost T Cost T Cost T Cost T Cost T Cost T Cost T Cost T Cost T Cost T Cost T Cost T Cost T Cost T Cost T Cost T Cost T Cost T Cost T Cost T Cost T Cost T CostResidential:Bemiston (Old Town) 42,249 C $5,476 C $4,800 C $3,164 A $1,305,489 C $4,617 C $4,898 C $5,196 M $172,928 C $5,513 C $5,848 C $6,204 CM $219,261 C $6,983 C $7,408 A $2,357,858Hanley Place & Maryland Terrace 17,884 1,650 C $1,849 C $2,174 C $2,049 C $1,953 A $552,617 C $2,072 C $2,199 C $2,332 CM $75,675 C $2,625 C $2,785 C $2,955 M $90,028 C $3,135 C $3,326 C $3,528 A $998,088Skinker Heights 12,554 C $2,042 C $1,397 C $1,317 C $1,255 A $387,908 C $1,332 C $1,413 C $1,499 CM $52,973 C $1,687 C $1,790 C $1,899 M $63,195 C $2,014 C $2,137 C $2,267 A $700,606Hi Pointe 28,097 8,281 C $4,002 C $4,049 C $3,816 C $3,638 A $868,182 C $3,859 C $4,094 C $4,344 CM $119,609 C $4,889 C $5,187 C $5,502 M $141,437 C $5,838 C $6,193 C $6,570 A $1,568,033DeMun Park 15,819 3,062 C $1,187 C $2,102 C $1,981 C $1,888 A $488,812 C $2,003 C $2,125 C $2,255 CM $67,141 C $2,537 C $2,692 C $2,856 M $79,633 C $3,030 C $3,214 C $3,410 A $882,849Clayton Gardens 41,644 M $127,375 C $5,398 C $4,731 C $2,713 A $1,286,805 C $4,551 C $4,828 C $5,122 M $170,453 C $5,434 C $5,765 C $6,116 CM $216,123 C $6,883 C $7,302 A $2,324,113Moorlands 65,522 1,490 C $9,384 M $143,392 C $7,459 C $7,030 C $6,701 A $2,085,365.16 C $7,542 C $8,002 C $8,489 M $276,232 C $9,006 C $9,554 C $10,136 M $339,730 C $11,408 C $12,103Clayshire 29,406 C $3,812 M $84,420 C $3,341 C $2,203 C $3,029 A $935,915.37 C $3,213 C $3,409 C $3,617 CM $127,810 C $4,071 C $4,318 C $4,581 CM $157,190 C $4,860 C $5,156 C $5,470Parkside 12,208 M $42,926 C $1,582 C $1,387 C $914 C $1,257 A $388,544.02 C $1,334 C $1,415 C $1,501 CM $53,060 C $1,690 C $1,793 C $1,902 CM $65,257 C $2,018 C $2,141 C $2,271Hillcrest (includes DeMun to Wydown) 29,724 6,700 C $4,140 CM $89,385.49 C $3,821 C $3,642 C $3,864.20 A $974,399 C $4,100 C $4,349 C $4,614 CM $133,966 C $5,193 C $5,509 C $5,845 M $158,741 C $6,201 C $6,579Polo (includes C.C. Ct. & Walinca Terr. 16,160 2,590 C $2,430 M $46,392 C $2,130 C $1,404 C $1,931 A $529,750 C $2,174 C $2,306 C $2,446 M $70,172 C $2,595 C $2,753 C $2,921 CM $89,402 C $3,288 C $3,488Hunter/S. Gay 7,729 C $1,002 C $878 C $985 C $796 CM $28,133 C $896 C $951 C $1,008 A $311,609 C $1,135 C $1,204 CM $42,554 C $1,355 C $1,438Northmoor Park 811 C $276 C $90 C $85 C $81 A $25,067 C $86 C $91 C $97 CM $3,423 C $109 C $116 C $123 M $4,084 C $130 C $138 C $147 A $45,273Claverach Park 38,154 C $5,851 C $4,247 C $4,003 A $1,144,607 C $4,048 C $4,294 C $4,556 M $151,617 C $4,833 C $5,128 C $5,440 CM $192,241 C $6,123 C $6,495 A $2,067,287Wydown Forest 14,830 870 C $3,036 C $1,748 C $1,647 C $1,570 C $1,666 A $720,000 C $1,767 C $1,875 C $1,879 CM $66,508 C $2,238 C $2,375 C $2,519 M $79,202 C $2,673 C $2,836Davis Place (composite pavement) 55,488 4,865 A $985,465 C $6,857 C $4,520 C $6,216 CM $202,508 C $6,997 C $7,423 C $7,875 M $240,948 C $8,354 C $8,863 C $9,403 A $2,671,259 C $9,975 C $10,583 C $11,227
Residential sub-totals $202,069 $1,148,557 $243,464 $24,124 $25,749 $15,904 $1,165,336 $4,928,110 $3,428,755 $2,468,505 $27,625 $24,616 $29,308 $177,732 $682,017 $479,377 $849,184 $28,323 $34,995 $31,183 $223,596 $833,772 $3,262,070 $400,618 $41,786 $37,234 $2,104,726 $8,900,715
Arterials:Wydown Blvd. 53,728 C $5,244 M $216,920 C $5,981 C $5,637 A $2,223,853 C $5,700 C $6,047 C $6,415 M $373,076 C $6,806 C $7,221 C $7,660 CM $466,963 C $8,622 C $9,147 A $2,911,183Maryland Ave. 30,745 CM $128,114 C $3,493 C $2,303 C $3,360 A $2,000,000 C $3,564 C $3,781 C $4,011 CM $244,532 C $4,515 C $4,790 C $5,082 CM $309,766 C $5,719Brentwood Blvd. 43,228 CM $217,335 C $4,911 C $3,928 C $4,724 A $1,500,000 C $5,011 C $5,317 C $5,640 CM $343,822 C $6,348 C $6,735 C $7,145 CM $435,543 C $8,042Forsyth (West) 38,200 C $4,951 A $997,642 C $2,861 C $3,935 C $4,174 CM $254,454 C $4,698 C $4,984 C $5,288 M $307,500 C $5,610 C $5,951 A $1,951,000 C $6,698 C $7,106Forsyth (East) 16,001 C $1,794 C $1,781 A $417,871 C $1,679 C $1,600 C $1,697 C $1,801 M $104,725 C $1,911 C $2,027 C $2,150 CM $131,080 C $2,420 C $2,568 A $817,193 C $2,890N. Meramec 10,205 C $1,323 A $266,502 C $764 C $1,051 C $1,115 CM $67,973 C $1,255 C $1,331 C $1,413 M $82,143 C $1,499 C $1,590 A $521,174 C $1,789 C $1,898Carondelet Plaza 10,790 4,400 C $1,214 C $1,691 C $1,594 C $1,519 N $680,000 C $1,612 C $1,710 C $1,814 CM $46,090 C $2,041 C $2,166 C $2,298 M $54,318 C $2,438 C $2,586 C $2,744CBD Streets 60,723 21,086 C $10,604 M $304,606 C $9,294 C $6,128 C $8,426 C $8,940 A $2,111,844 C $10,061 C $10,674 C $11,324 M $488,803 C $12,014 C $12,746 C $13,522 CM $615,511 C $15,219Shaw Park Dr./PW Drive 3,070 C $398 C $349 C $230 C $316 CM $11,173 C $356 C $378 C $401 A $123,759 C $425 C $451 C $478 CM $16,901 C $538 C $571
Arterial sub-totals $8,252 $579,645 $314,058 $1,700,063 $8,909 $16,214 $2,226,972 $693,728 $9,009 $33,485 $3,509,558 $2,547,927 $10,140 $398,565 $54,923 $27,042 $135,171 $606,804 $1,019,352 $30,436 $471,681 $86,608 $13,627 $42,649 $3,301,100 $1,369,846 $2,916,817 $38,556
Grand Totals 694,968 54,994 $210,321 $1,728,202 $557,522 $1,724,187 $34,658 $32,118 $3,392,309 $5,621,838 $3,437,764 $2,501,990 $3,537,183 $2,572,543 $39,447 $576,297 $736,940 $506,420 $984,356 $635,126 $1,054,347 $61,619 $695,276 $920,380 $3,275,697 $443,267 $3,342,886 $1,407,080 $5,021,543 $8,939,271
Notes:1) T - Treatment2) M - Microsurfacing3) A - Asphalt Mill & Overlay4) C - Crack Sealing5) CM - Crack, then Micro6) A* - Patch Concrete, Edge Mil, Overlay7) N-Novachip with edge mill
Cracksealing Totals $40,020 $46,564 $36,774 $42,171 $34,658 $32,118 $23,848 $26,958 $27,939 $43,801 $37,183 $39,159 $39,447 $51,605 $41,740 $54,748 $44,398 $57,012 $47,102 $61,619 $49,971 $65,372 $48,938.55 $61,352 $53,519 $73,576 $43,072.94 $62,451
Microsurfacing Totals $170,301 $696,173 $520,748 $0 $0 $0 $0 $0 $0 $234,039 $0 $421,540.79 $0 $524,692 $695,200 $451,672 $504,589 $578,114 $1,007,245 $0 $645,305 $855,009 $555,500 $381,915 $0 $1,333,504 $0 $0
Asphalt Totals $0 $985,465 $0 $1,682,016 $0 $0 $3,368,460 $4,914,880 $3,409,825 $2,224,150 $3,500,000 $2,111,844 $0 $0 $0 $0 $435,368 $0 $0 $0 $0 $0 $2,671,259 $0 $3,289,367 $0 $4,978,470 $8,876,820
Novachip Totals $0 $0 $0 $0 $0 $0 $680,000 $0 $0 $0 $0 $0 $0 $0 $0 $0 $0 $0 $0 $0 $0 $0 $0 $0 $0 $0 $0
Cracksealing Cost/SY $0.13 $0.130 $0.1113 $0.114 $0.105 $0.075 $0.100 $0.103 $0.106 $0.109 $0.113 $0.116 $0.119 $0.123 $0.127 $0.130 $0.134 $0.138 $0.143 $0.147 $0.151 $0.156 $0.160 $0.165 $0.170 $0.175 $0.181 $0.186
Residential Microsurfacing per SY $2.80 $2.19 $2.87 $2.96 $3.05 $3.14 $3.23 $3.33 $3.43 $3.53 $3.64 $3.75 $3.86 $3.97 $4.09 $4.22 $4.34 $4.47 $4.61 $4.74 $4.89 $5.03 $5.18 $5.34 $5.50 $5.67 $5.84 $6.01
$4.23 $5.02 $5.17 $5.32 $5.48 $5.65 $5.82 $5.99 $6.17 $6.35 $6.55 $6.74 $6.94 $7.15 $7.37 $7.59 $7.82 $8.05 $8.29 $8.54 $8.80 $9.06 $9.33 $9.61 $9.90 $10.20 $10.50
Asphalt Mill & Overlay, plus ramp replacements/upgrades $17.76 $18.29 $26.12 $33.40 $29.00 $30.00 $30.90 $31.83 $32.78 $33.77 $34.78 $35.82 $36.90 $38.00 $39.14 $40.32 $41.53 $42.77 $44.06 $45.38 $46.74 $48.14 $49.59 $51.07 $52.61 $54.18 $55.81
Novachip Cost/SY $6.00 $6.18 $6.37 $6.56 $6.75 $6.96 $7.16 $7.38 $7.60 $7.83 $8.06 $8.31 $8.55 $8.81 $9.08 $9.35 $9.63 $9.92 $10.21 $10.52 $10.84 $11.16 $11.50 $11.84 $12.20 $12.56 $12.94
2031 2032 2033 2034 20352014 2018
Preventive Pavement Maintenance Program
2012 2016 2017
Preventive Pavement Maintenance ProgramDepartment of Public Works
2027 2028 20292025 20262020 2021 2022 2023 2024 2030
Microsurfacing per square yard on Arterial Costs with 2 coats, extra Traffic Control and striping
Department of Public Works
2008 2011 2019201520132009 2010

Upcoming Major Projects
Wydown Boulevard Resurfacing Project Brentwood/Carondelet Streetscape Project Claverach Park Resurfacing Project 2014 Alley Replacement Project 2015 Residential Resurfacing Project
27

Wydown Blvd. Resurfacing Project
Under contract with Krupp Construction 80% Federal Reimbursement Work to start June 16th
– Curb & Gutter Replacement– Ramp Replacement– Mill & Overlay– Crosswalk Construction– Striping
November completion www.claytonmo.gov/roadwork
28

Brentwood/Carondelet Streetscape Project
Bid opening May 28th, expect to bring contract to next BOA meeting for approval
80% Federal Reimbursement Work to start in mid-July
– Curb & Gutter Replacement– Sidewalk and Ramp Replacement– Street Trees with Irrigation– Electrical Conduits and Streetlights– Crosswalk Construction
October completion www.claytonmo.gov/streetscape29

Claverach Park Resurfacing Project
Advertised May 21st, open bids June 11th, expect to bring contract to BOA June 24th for approval
Work to start in late July– Ramp Replacement– Base Repair– Mill & Overlay
November completion www.claytonmo.gov/claverach
30

Alley Replacement Project
Advertised May 21st, open bids June 11th, expect to bring contract to BOA June 24th for approval
Work to start in late July– Remove existing alley– Install 4” aggregate base– Pour 8” concrete pavement
October completion www.claytonmo.gov/alleys
31

2015 Residential Resurfacing Project
Design contract in place Bid work in January, start construction in April/May
– Ramp Replacement– Base Repair– Mill & Overlay
Clayton Gardens, Old Town, Hanley Place, Maryland Terrace, Northmoor, Skinker Heights, Hi-Pointe, DeMun Park
Cooperating with University City where work straddles boundaries
32

Project Communications
Mailings City Website CityViews Electronic Message Panels Metro (bus re-routing) No Parking Signage Construction Signage
33

Why do projects take so long?
34

Construction Phase:Wydown Resurfacing Project & Brentwood/Carondelet Streetscape Project
35

Construction Phase:Claverach Park Resurfacing Project &Alley Replacement Project
36

All Four Major Projects
37