Word count: - Virginia Tech€¦ · Web viewGalea S, Vlahov D, Tracy M, Hoover DR, Resnick H,...
44
Exposure to hurricane-related stressors and mental illness after hurricane Katrina Sandro Galea, MD, DrPH Chris R. Brewin, PhD Michael Gruber, MA Russell T. Jones, PhD Daniel W. King, PhD Lynda A. King, PhD Richard J. McNally, PhD Robert J. Ursano, MD Maria Petukhova, PhD Ronald C. Kessler, PhD __________________________ The Hurricane Katrina Community Advisory Group (CAG) is supported by the US National Institute of Mental Health (R01 MH070884- 01A2), with supplemental support from the Federal Emergency Management Agency (FEMA) and the Assistant Secretary for Planning and Evaluation, Department of Health and Human Services. The funders had no role in the design or conduct of the study, nor in the collection, management, analysis, or interpretation of the data, or in the preparation, review, or approval of the manuscript. A publish use dataset of the baseline CAG survey is available through the Interuniversity Consortium for Political and Social Research (ICPSR) at the University of Michigan. For details on data acquisition, go to www.HurricaneKatrina.med.harvard.edu . From the Department of Epidemiology, University of Michigan School of Public Health (Galea); the Department of Psychology, University College London (Brewin); the Department of Psychology, Virginia Polytechnic and 1
Transcript of Word count: - Virginia Tech€¦ · Web viewGalea S, Vlahov D, Tracy M, Hoover DR, Resnick H,...

Exposure to hurricane-related stressors and mental illness after hurricane Katrina
Sandro Galea, MD, DrPHChris R. Brewin, PhDMichael Gruber, MARussell T. Jones, PhDDaniel W. King, PhDLynda A. King, PhD
Richard J. McNally, PhDRobert J. Ursano, MDMaria Petukhova, PhDRonald C. Kessler, PhD
__________________________The Hurricane Katrina Community Advisory Group (CAG) is supported by the US National Institute of Mental Health (R01 MH070884-01A2), with supplemental support from the Federal Emergency Management Agency (FEMA) and the Assistant Secretary for Planning and Evaluation, Department of Health and Human Services. The funders had no role in the design or conduct of the study, nor in the collection, management, analysis, or interpretation of the data, or in the preparation, review, or approval of the manuscript. A publish use dataset of the baseline CAG survey is available through the Interuniversity Consortium for Political and Social Research (ICPSR) at the University of Michigan. For details on data acquisition, go to www.HurricaneKatrina.med.harvard.edu. From the Department of Epidemiology, University of Michigan School of Public Health (Galea); the Department of Psychology, University College London (Brewin); the Department of Psychology, Virginia Polytechnic and State University (Jones); the Departments of Psychology and Psychiatry, Boston University (Daniel King, Lynda King); the Department of Psychology, Harvard University (McNally); the Department of Psychiatry and Center for the Study of Traumatic Stress, Uniformed Services University (Ursano); and the Department of Health Care Policy, Harvard Medical School (Gruber, Petukhova, Kessler). Send reprint requests to: Sandro Galea, MD, DrPH, Center for Social Epidemiology and Population Health, University of Michigan, 1214 South University, Room 243, Ann Arbor, Michigan 48104-2548 [email protected]
1

Exposure to hurricane-related stressors and mental illness after Hurricane Katrina
ABSTRACT
Context: Uncertainty exists about the prevalence, severity, and correlates of mental disorders
among people exposed to Hurricane Katrina.
Objective: To estimate the prevalence and associations between DSM-IV anxiety-mood
disorders and hurricane-related stressors separately among pre-hurricane residents of the New
Orleans Metropolitan Area and the remainder of the areas in Alabama, Louisiana, and
Mississippi affected by Katrina.
Design: Community survey
Setting/Participants: A probability sample of 1,043 English-speaking pre-hurricane residents of
the areas affected by Hurricane Katrina was administered a telephone survey between January 19
and March 31, 2006. The survey assessed hurricane-related stressors and screened for 30-day
DSM-IV anxiety-mood disorders.
Main Outcome Measures: The K6 screening scale of anxiety-mood disorders and the TSQ
screening scale of post-traumatic stress disorder (PTSD), both calibrated against blinded SCID
clinical reappraisal interviews to approximate the 30-day prevalence of DSM-IV disorders.
Results: Pre-hurricane residents of the New Orleans Metropolitan Area were estimated to have
a 49.1% 30-day prevalence of any DSM-IV anxiety-mood disorder (30.3% estimated prevalence
of PTSD) compared to 26.4% (12.5% PTSD) in the remainder of the sample. The vast majority
of respondents reported exposure to hurricane-related stressors. Extent of stressor exposure was
more strongly related to the outcomes in the New Orleans Metro sub-sample than the remainder
of the sample. The stressors most strongly related to these outcomes were physical illness-injury
and physical adversity in the New Orleans Metro sub-sample and property loss in the remainder
2

of the sample. Socio-demographic correlates were not explained either by differential exposure
or reactivity to hurricane-related stressors.
Conclusions: The high prevalence of DSM-IV anxiety-mood disorders, the strong associations
of hurricane-related stressors with these outcomes, and the independence of socio-demographics
from stressors, argue that the practical problems associated with ongoing stressors are
widespread and must be addressed in order to reduce the prevalence of mental disorders in this
population.
Key Words: Hurricane Katrina, post-traumatic stress disorder, natural disaster
3

It is well established that natural disasters lead to increased prevalence of mental illness
in the range 5-40%,1, 2 although most increases are in the lower half of this range.3-8 Much of the
between-disaster variation is likely due to differential disaster severity and exposure,9 as
indicated by the fact that studies of people who experienced devastating loss in major natural
disasters consistently document high prevalence of mental illness.1, 10 Assessment of individual
stressors in natural disasters is nonetheless challenging and our understanding of their effects on
post-disaster mental illness remains limited.
Hurricane Katrina was the worst natural disaster in the United States in the past 75 years,
creating a disaster region as large as Great Britain, killing over 1,000 people, uprooting 500,000
others, and causing over $100 billion in damage.11 This vast devastation would lead us to expect
a high prevalence of mental illness among people who lived through Katrina. Available evidence
is consistent with this expectation.12-14 However, no published research has yet considered the
scope or variety of stressors experienced or the role played by disaster-related stressors in the
mental illness of people who lived through Katrina. Such an investigation has the potential to be
important in targeting intervention efforts, especially as Katrina exposed people to a wide variety
of stressors, such as community disruption, job loss, and property loss,15 many of which still
persist two years after the hurricane.
We examined the prevalence of hurricane-related stressors and their associations with
screening measures of DSM-IV anxiety and mood disorders using data from the Hurricane
Katrina Community Advisory Group (CAG), a representative sample of 1,043 pre-hurricane
residents of the areas in Alabama, Louisiana, and Mississippi directly affected by Katrina who
agreed to participate in a series of tracking surveys over several years to assess need for services
and the pace of recovery efforts. Based on the much more devastating nature of the disaster in
4

the seven Parishes defined by the Census Bureau as the New Orleans Metropolitan Area
(henceforth New Orleans Metro) than the remainder of the hurricane area, we consider results
separately in each of these two sub-samples.
METHODS
The sample
The CAG target population was English-speaking adult (aged 18) pre-hurricane
residents of the counties (in Alabama and Mississippi) and parishes (in Louisiana) defined by the
Federal Emergency Management Agency (FEMA) as directly affected by Hurricane Katrina
(www.fema.gov/hazard/hurricane/2005katrina). Pre-hurricane residents of these areas were
eligible for the sample regardless of whether they were in these areas at the time of the hurricane
and regardless of the extent they or their property were affected by the hurricane. Census data
suggest that only about 1% of this population was unable to speak English (Bureau of the
Census, 2000), suggesting that the restriction of the sample to English-speakers did not introduce
major bias into the sample.
Respondents were selected from three sampling frames: the telephone numbers (land
lines and cell phones) of the roughly 1.4 million families that applied for assistance from the
American Red Cross (ARC); a random-digit dial (RDD) telephone frame of households in the
areas affected by the hurricane; and a supplemental sample of hotels that housed FEMA-
supported evacuees. Surveying was carried out between January 19 and March 31, 2006, five to
seven months after the hurricane. As noted above, pre-hurricane residents of New Orleans Metro
were over-sampled.
Although the use of RDD might seem impractical in a population where many people
evacuated, evacuation was much more common in New Orleans Metro than the remainder of the
5

affected areas. Furthermore, many evacuees had returned as of the time of the survey. RDD was
useful in contacting these non-evacuees and returned evacuees. The vast majority of evacuees, in
comparison, applied to the ARC for assistance and could be traced through contact information
provided in the ARC applications for assistance. Other evacuees could be traced in the RDD
sample through a call-forwarding service set up by Bell South in the wake of the hurricane that
forwarded calls to phone numbers anywhere in the country requested by the person in whose
name the pre-hurricane phone was registered. More details on sampling and adjustment for
overlap of the frames are reported at www.HurricaneKatrina.med.harvard.edu.
The sample of potential respondents we were able to contact and screen for eligibility
represented 64.9% of those we attempted to reach. This low contact-screening rate reflects the
special difficulties locating people after the massive disruption caused by Katrina. Screening
survey respondents were informed that joining the CAG required a commitment to participate in
a number of follow-up surveys over several years and to provide tracing information if they
moved. Screening survey respondents were asked to consider these requirements carefully before
agreeing, as we wanted all respondents to participate in subsequent surveys. The 1,043
respondents who agreed were administered the baseline CAG survey, the results of which are
presented here. These respondents represent 41.9% of those we attempted to reach. This could
have been increased up as much as 64.9% (i.e., all the screening survey respondents) if we had
not required a commitment for long-term involvement in the CAG, but we felt that this
commitment was needed because a central aim of the CAG was to track changes in adjustment
over time.
Screening questionnaires administered to the full screening sample showed that those
who did not join the CAG were similar to respondents on all socio-demographic variables, but
6

had a somewhat higher level of self-reported hurricane-related stress exposure than CAG
members (assessed by asking respondents to rate their hurricane-related stress exposure on a 0-
10 scale where 0 meant “no stress at all” and 10 meant “the most stress you can imagine a person
having”) and more psychological distress than CAG members (assessed with a short series of
questions about frequency of common anxiety-mood symptoms, responses to which were
summed and normed to a 0-10 theoretical range). The median and inter-quartile range (IQR: 25th-
75th percentiles) of reported hurricane-related stress exposure were 8.0 (6.0-10.0) among non-
respondents and 7.0 (5.0-9.0) among CAG members. The median and IQR of reported
psychological distress were 2.9 (1.2-4.4) among non-respondents and 1.7 (0.6-3.5) among CAG
members. A weight was applied to the CAG data to adjust for these response biases. A within-
household probability of selection weight was also used along with a post-stratification weight to
adjust for residual discrepancies between the CAG and the 2000 Census population on a range of
social, demographic, and pre-hurricane housing variables. The consolidated CAG sample weight,
finally, was trimmed to increase design efficiency based on evidence that trimming did not
significantly affect the estimated prevalence of anxiety-mood disorders.
Measures
Hurricane-related stressors: The survey included 29 structured questions developed
based on pilot interviews about hurricane-related stressors. In addition, we asked an open-ended
question -- "What would you say are currently your most serious practical problems caused by
Katrina?" – in an effort to discover any common stressors not covered in the structured
questions. It should be noted that some respondents, especially evacuees to South Texas, were
subsequently exposed to Hurricane Rita. In order to capture information about these experiences,
all respondents were asked if they were exposed to Rita and, if so, were asked about stressors
7

experienced in either hurricane. The full text of the interview schedule that includes the complete
set of stressor questions is available at www.HurricaneKatrina.med.harvard.edu.
Ten stressors emerged as sufficiently common to be considered in this analysis. Four
were traumatic stressors in the sense specified in DSM-IV for a diagnosis of post-traumatic
stress disorder (PTSD): experiences that involved serious risk of death, death of a loved one
(family member or close friend), victimization (burglary, robbery, physical assault, or sexual
assault) due to lawlessness after the storm, and victimization of a loved one. The other six were
for the most part non-traumatic stressors: physical illness or injury caused or exacerbated by the
storm, extreme physical adversity (e.g., sleeping in a church basement, difficulty obtaining
adequate food or clothing), extreme psychological adversity (e.g., living in circumstances where
the respondent had to use the toilet or change clothes without adequate privacy, exposure to
threats of violence), major property loss, income loss, and ongoing difficulties associated with
housing (multiple moves or living in substantially worse post- than pre-hurricane housing). Some
cases of the latter six stressors were described by respondents in ways that implied that the
stressors might have been traumatic (e.g., a life-threatening injury; a threat of fatal violence), but
no attempt was made to distinguish these cases from non-traumatic stressors due to the fact that
the open-ended reports of these events were often too imprecise to make this distinction clearly.
Mental illness: The K6 scale of non-specific psychological distress16 was used to screen
for DSM-IV anxiety disorders within 30 days of the interview.17 Scores range from 0 to 24. Two
independent validation studies found the K6 to have an area under the receiver operating
characteristic curve of between 0.8616 and 0.8918, 19 in predicting diagnoses of mental illness
based on comprehensive diagnostic interviews. Based on previous K6 validation and using the
SAMHSA definition of the terms, scores of 13–24 were classified probable serious mental illness
8

(SMI), while scores of 8–12 were classified probable mild–moderate mental illness (MMI) and
scores of 0–7 were classified probable non-cases. The designation of MMI represents
respondents who were estimated to meet criteria for a DSM-IV anxiety-mood disorder but not
SMI. Previous research has shown that MMI is of considerable public health importance because
of its high prevalence, burden, and risk of transition to SMI.20 A small clinical reappraisal study
of five respondents selected randomly from each of these three K6 categories (SMI, MMI, non-
case) with the Structured Clinical Interview for DSM-IV (SCID)21 confirmed K6 classifications
for 14 of 15 respondents. The exception was a respondent classified as having SMI by the K6 but
MMI by the SCID based on a global assessment of functioning (GAF) score of 65 (with GAF of
0-60 required to diagnose SMI). These results, although based on only a small sample, suggest
that the K6 has excellent psychometric properties (estimated in the SCID sample weighted to
adjust for the sample-wide K6 distribution), including sensitivity (1.0 for SMI, .90 for MMI, and
1.0 for either SMI to MMI) and specificity (1.0).
Given the special importance of PTSD in trauma situations, a separate PTSD screen was
included based on the 12-item Trauma Screening Questionnaire (TSQ),22 a validated screen for
PTSD.23 Our version differed from the original TSQ in using dimensional response options rather
than a simple yes-no response format to assess 30-day symptom frequency (never, less than once
a week, about once a week, two to four days a week, and most every day). A clinical reappraisal
study was carried out to calibrate TSQ responses to DSM-IV PTSD with 30 respondents judged
possible cases and 10 randomly selected others. A cut-point on the factor-based 0-42 scale of
TSQ responses (12 items, each scored 0-4) of 20+ was selected to approximate the SCID PTSD
prevalence in the weighted (to adjust for over-sampling of screened positives) clinical reappraisal
9

sample. Sensitivity (0.89), specificity (0.93), and area under the receiver operating characteristic
curve (0.91) were all excellent for this dichotomous screen.
Socio-demographic controls: We examined associations of K6 and TSQ approximations
of DSM-IV diagnoses with several socio-demographic variables: age, sex, race/ethnicity, family
income in the year before the hurricane, education, pre-hurricane marital status, and pre-
hurricane employment status. Age was coded 18-39, 40-59, 60+. Race/ethnicity was coded Non-
Hispanic Whites, Non-Hispanic Black, and other (largely Hispanics and Asians). Family income
was coded in quartiles, where low was defined as less than or equal to 0.5 of the population
median on the ratio of per-tax income to number of family members, while low-average was
defined 0.5+ through 1.0 on the same ratio, high-average 1.0+ through 3, and high 3+ on this
ratio. Years of education were coded in four categories: 0-11, 12 (high school graduate), 13-15,
and 16+ (college graduate). Marital status was coded married (including cohabiting, excluding
separated), never married, and previously married (separated, widowed, divorced). Employment
status, finally, was coded employed (including self-employed and full-time students),
homemaker, retired, and other (largely unemployed and disabled).
Analysis methods
Estimated prevalence of DSM-IV disorders and hurricane-related stressors were
examined with cross-tabulations that distinguished pre-hurricane residents of New Orleans Metro
from the remainder of the sample. The effects of socio-demographic variables, hurricane-related
stressors, and their interactions in predicting the estimates of DSM-IV disorders were examined
using logistic regression analysis.24 Logistic regression coefficients and their standard errors
were exponentiated to create odds-ratios (OR’s) and 95% confidence intervals (95% CI’s) for
ease of interpretation. Because the data were weighted, the Taylor series linearization method25
10

was used to calculate design-based significance tests. Multivariate significance was calculated
using Wald 2 tests based on design-corrected coefficient variance–covariance matrices.
Statistical significance was evaluated using two-sided .05-level tests.
RESULTS
Estimated prevalence of DSM-IV anxiety-mood disorders
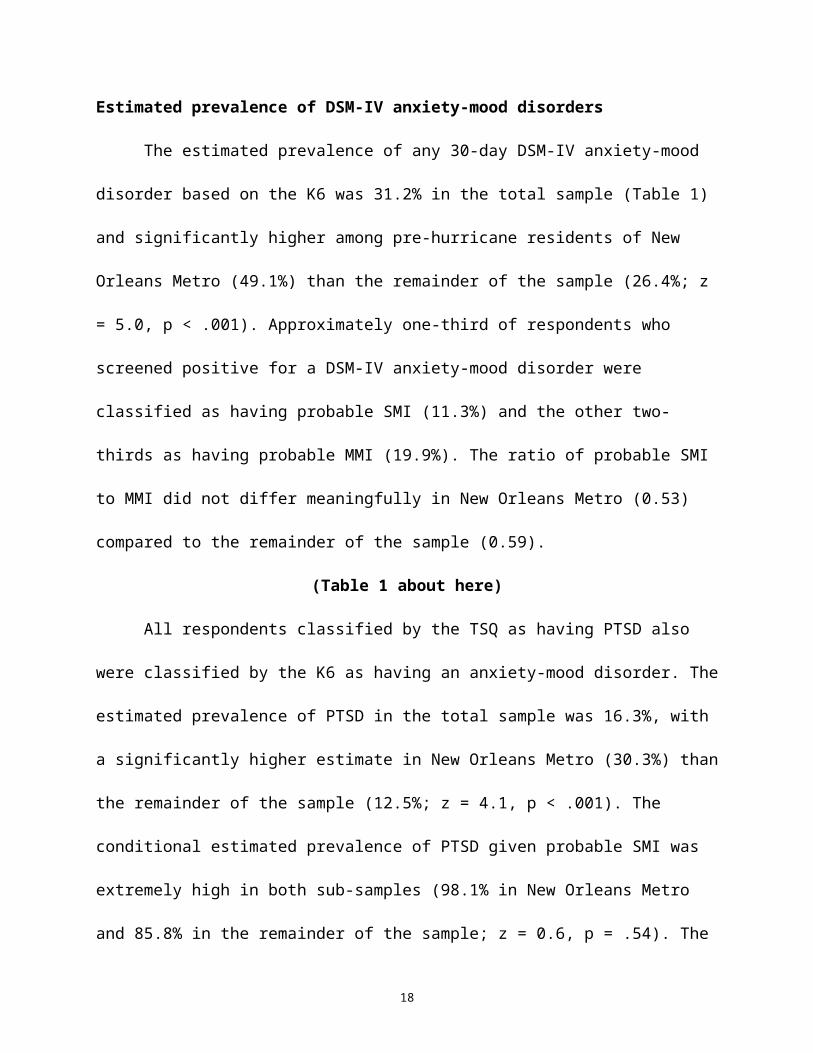
The estimated prevalence of any 30-day DSM-IV anxiety-mood disorder based on the K6
was 31.2% in the total sample (Table 1) and significantly higher among pre-hurricane residents
of New Orleans Metro (49.1%) than the remainder of the sample (26.4%; z = 5.0, p < .001).
Approximately one-third of respondents who screened positive for a DSM-IV anxiety-mood
disorder were classified as having probable SMI (11.3%) and the other two-thirds as having
probable MMI (19.9%). The ratio of probable SMI to MMI did not differ meaningfully in New
Orleans Metro (0.53) compared to the remainder of the sample (0.59).
(Table 1 about here)
All respondents classified by the TSQ as having PTSD also were classified by the K6 as
having an anxiety-mood disorder. The estimated prevalence of PTSD in the total sample was
16.3%, with a significantly higher estimate in New Orleans Metro (30.3%) than the remainder of
the sample (12.5%; z = 4.1, p < .001). The conditional estimated prevalence of PTSD given
probable SMI was extremely high in both sub-samples (98.1% in New Orleans Metro and 85.8%
in the remainder of the sample; z = 0.6, p = .54). The conditional estimated prevalence of PTSD
given probable MMI, in comparison, was considerably lower (42.5% in New Orleans Metro and
24.8% in the remainder of the sample; z = 1.6, p = .12).
Associations of socio-demographic variables with estimated anxiety-mood disorders
11

We examined socio-demographic correlates of estimated PTSD, of other estimated DSM-
IV anxiety-mood disorders exclusive of PTSD, and of probable SMI or MMI separately in the
New Orleans Metro sub-sample and the remainder of the sample. Estimated prevalence of any
DSM-IV anxiety-mood disorder was consistently associated with age less than 60, female
gender, education less than college graduation, low family income, “other” pre-hurricane
employment status (largely unemployed and disabled), and being unmarried. In addition,
Hispanics and other racial/ethnic minorities exclusive of Non-Hispanic Blacks had significantly
lower estimated prevalence of any disorder than Non-Hispanic Whites in New Orleans Metro as
well as a significantly lower estimated prevalence of PTSD in the remainder of the sample. The
strongest OR’s in New Orleans Metro were for low income and “other” employment status with
PTSD (4.0-5.3), whereas the strongest OR’s in the remainder of the sample were for low
education, low income, “other” employment status, and being unmarried with PTSD (4.7-17.7).
Although some of the significant socio-demographic predictors of estimated SMI or MMI had
different associations with estimated PTSD than with other estimated anxiety-mood disorders,
these associations were inconsistent across geographic sub-samples.
(Table 2 about here)
Prevalence of hurricane-related stressors.
The vast majority of respondents both in New Orleans Metro (91.9%) and in the
remainder of the sample (81.7%) reported experiencing at least one of the ten categories of
hurricane-related stressors (Table 3). New Orleans Metro respondents reported a higher
prevalence of each stressor than respondents in the remainder of the sample. The two most
frequently reported stressors were housing adversity (71.7% in New Orleans Metro; 34.1% in the
remainder of the sample; z = 8.6, p < .001) and property loss (70.2% vs. 47.8%; z = 4.9, p
12

< .001). Other stressors occurred to between 33.6-46.3% (physical adversity) and 0.9-1.1% (life-
threatening experience) of respondents.
(Table 3 about here)
Associations of hurricane-related stressors with estimated anxiety-mood disorders
As high inter-correlations among stressors made it difficult to assess the separate effects
of individual stressors in predicting estimated mental disorders, we evaluated a series of logistic
regression models that included additive and interactive effects of exposure to multiple stressors
(Table 4). Model 1 included only socio-demographic predictors. Model 2 then added information
about number of hurricane-related stressors, ignoring type of stressors. Information about
number of stressors was significantly related to the outcomes in all but one instance (other
probable anxiety-mood disorders in the sub-sample exclusive of New Orleans Metro; 27 = 13.7,
p = .06). We then evaluated a series of ten models, each adding one of the ten stressors to Model
2 to determine whether type of stressor predicted the outcomes net of number of stressors.
(Detailed results not reported, but available on request.) Three of these ten were significant:
physical illness-injury and physical adversity in New Orleans Metro and property loss in the
remainder of the sample. When these significant adversities were added to Model 2, the best-
fitting specification included a single predictor to distinguish respondents exposed to one or
more stressors versus none plus separate predictors for the two (in New Orleans Metro) or one
(in the remainder of the sample) specific types of stressors that had effects significantly higher
than the others. The latter model (Model 3) improved significantly on Model 2. We next
considered a model that allowed for interactions among pairs of stressors (Model 4). No
significant interactions of this type were found. We also examined the odds-ratios in Model 4 for
evidence of a consistently strong substantive pattern, as the 44 degree of freedom test (all
13

logically possible pairs among the ten stressors minus one degree of freedom for the global count
of stressors) might have failed to detect substantively important patterns in a small number of
pairs. No such evidence was found.
(Tables 4 and 5 about here)
The best-fitting Model 3 shows that physical illness-injury and physical adversity are
associated with increased odds of the outcomes in New Orleans Metro (2.8-7.9), while financial
loss is associated with increased odds in the remainder of the sample (2.8-5.6) (Table 5). The
OR’s for other stressors are 3.6-6.3 in New Orleans Metro and 1.5-1.8 in the remainder of the
sample. The OR’s are consistently higher in New Orleans Metro than the remainder of the
sample with the exception of a higher OR associated with property loss in predicting estimated
PTSD in the remainder of the sample.
Joint effects of socio-demographics and hurricane-related stressors
Analyses were conducted to determine whether the significant socio-demographic
associations documented in Table 2 could be explained by differential exposure to hurricane-
related stressors. They could not. (Detailed results not reported, but available on request.) Indeed,
22 of the 27 statistically significant OR’s in Table 2 remained significant at the 0.05 level after
introducing controls for the stressors. The other previously significant OR’s only changed
modestly in substantive terms.
We also evaluated the possibility that the adverse effects of the hurricane-related stressors
vary across socio-demographic sub-samples. To increase statistical power, we combined the
significant stressors from Table 5 into a single measure by generating individual-level predicted
probabilities of the outcomes based on the coefficients in Model 3. This summary measure was
14

used in interaction with the socio-demographic variables. No more interactions were found to be
statistically significant at the 0.05 level in these tests than would be expected by chance.
COMMENT
Five principal limitations need to be noted. First, mental disorders were estimated with
screening scales rather than clinical interviews. Despite the fact that the K6 screening scale has
been used in national surveys17, 26 and has been previously validated16, 18, 19 and the fact that the
modified TSQ was found to be valid in our clinical reappraisal study, screening scales are
inevitably less precise than clinical interviews. This imprecision will generate attenuated
associations, leading the results reported here on predictors to be conservative. Second, the
survey response rate was low and the sampling frame excluded people who were unreachable by
telephone, resulting in under-representation of the most marginalized and perhaps the most
seriously ill people in the population. These sample limitations are likely to make the estimates
of disorder and stressor prevalence conservative. Third, even though we interpreted the
associations between stressors and disorders in causal terms, it is possible that unmeasured
common causes (e.g., pre-hurricane history of psychopathology that influenced both stressor
exposure and post-hurricane mental illness) influenced the observed associations. Caution is
consequently needed in interpreting these associations. Fourth, the assessment of disaster-related
stressors was necessarily retrospective, raising concerns about recall bias related to current
mental illness. However, this concern is mitigated by evidence from longitudinal studies that
reports of acute stress exposure have good test-retest reliability and are relatively free from recall
bias.27 In addition, as our assessment was conducted only 5-7 months after the hurricane, many
of the hurricane-related stressors were still directly and immediately relevant to respondents at
the time of their interviews. Fifth, no attempt was made to tease apart the effects of exposure to
15

stressors related to Hurricane Katrina versus Hurricane Rita even though some of the
respondents were exposed to Rita in the wake of Katrina. As noted in the section on measures,
we asked respondents to include information about stressors related to Rita in their reports. The
effects of Rita are consequently included in the results reported here.
Within the context of these limitations, the estimated prevalence of DSM-IV anxiety and
mood disorders in New Orleans Metro was substantially higher than typically found in US
population-based surveys of mental illness after natural disasters, while the estimated prevalence
in the remainder of the sample was comparable to that in previous studies.9, 28 Previous reviews
have noted comparisons of prevalence estimates across disasters is challenging due to the wide
range of disaster experiences to which people in disasters are exposed. However, broadly
speaking, the high estimated prevalence of anxiety-mood disorders in New Orleans Metro is
consistent with the results of studies that considered persons in highly disaster affected areas,1, 10
while the lower estimated prevalence in the remainder of the sample is consistent with the results
of previous studies in areas with lower disaster impact.3, 5 We found that the vast majority of
respondents estimated to have SMI (98.1% in New Orleans Metro and 85.8% in the remainder of
the sample) also screened positive for PTSD, reinforcing the notion that PTSD is the central form
of psychopathology associated with natural disasters.29
Nearly one-fourth of New Orleans Metro respondents and one-sixth of other respondents
were exposed to traumatic hurricane-related stressors, while the vast majority of respondents
(79-90%) were exposed to other hurricane-related stressors. Comparing these estimates to other
post-disaster samples is challenging because few previous studies either attempted to sample
complete populations affected by large disasters or comprehensively assessed disaster-related
stressors. However, to the extent that comparisons allow, it appears that the proportion of people
16

experiencing hurricane-related stressors after Katrina was substantially higher than after other
recent hurricanes, such as Hurricane Andrew in 199330 and Hurricanes
Charley/Frances/Ivan/Jeanne in 2004.31
Although the hurricane-related stressors assessed here were significant predictors of
estimated anxiety-mood disorders, the stressors with the highest odds-ratios were different in
New Orleans Metro (physical illness-injury and physical adversity) than the remainder of the
sample (property loss). It is especially striking that the impact of property loss was less in New
Orleans Metro than the remainder of the hurricane area even though property loss was much
more commonly experienced in New Orleans Metro than the remainder of the hurricane area.
One possible explanation for this difference is that personal property loss might have been
experienced as less stressful in a situation where, as in New Orleans Metro, property loss was the
norm in the population. Or it might be that evacuation and physical displacement, which
occurred to the vast majority of pre-hurricane residents of New Orleans Metro, created a context
in which property loss had much less of an emotional effect than in the rest of the hurricane area.
It is also possible that the subjective stressfulness of property loss was lessened in the context of
the situation in New Orleans Metro, where many people were exposed to even worse stressors,
like death and injury and extreme physical adversity. But these are merely speculations. The only
certain conclusion that can be drawn from the results regarding variation in the relative effects of
specific stressors in New Orleans and the remainder of the hurricane area is that we have much
more to learn about the ways in which multiple exposures and disaster context influence the
effects of individual disaster-related stressors.
The findings that women, young people, and people with low socioeconomic status were
at comparatively high risk of anxiety-mood disorders are consistent with previously documented
17
correlates of mental illness after disasters9, 28 and other traumas.32 Importantly, though, these
same associations are found in community epidemiological surveys in the absence of disasters,
suggesting that these associations might be related to pre-existing mental disorders.14 Consistent
with this possibility, these socio-demographic associations were not explained by exposure to
hurricane-related stressors. Nor did we find evidence that the associations of hurricane-related
stressors with estimated anxiety-mood disorders differ meaningfully in sub-samples defined by
these socio-demographic factors.
The finding that Hispanics and other minorities exclusive of Non-Hispanic Blacks had
significantly lower estimated prevalence of anxiety-mood disorders than Non-Hispanic Whites is
difficult to interpret. Previous research has found elevated prevalence of post-disaster mental
illness among Hispanics,33 although this was largely Puerto Ricans and Dominicans, whereas the
pre-hurricane Hispanics in the Katrina area were largely Mexican-Americans. However, caution
is needed in interpreting this finding, as the number of respondents in our minority sub-sample is
quite small (35 respondents) and includes Asian as well as Hispanics. Future research will need
much larger samples to investigate ethnic differences in disaster response, noting that elevated
prevalence among Hispanics could well vary substantially among Mexican-Americans compared
to other segments of the Hispanic population.
The above results lead to four conclusions. First, the stressors considered here appear to
have played a critical role in the high prevalence of hurricane-related anxiety-mood disorders.
Second, the fact that the associations between hurricane-related stressors and estimated anxiety-
mood disorders were stronger in New Orleans Metro than the remainder of the hurricane area
suggests that undetermined vulnerability or contextual factors were present in New Orleans
Metro that remain understood. Third, the observation that hurricane-related stressor exposure
18

was widespread and comparable across socio-demographic sub-samples means that the impact of
the hurricane on mental health was widespread rather than concentrated in any one particular
segment of the population. This, in turn, suggests that efforts to address the problem of increased
mental illness in the wake of the hurricane must address the needs of persons in all segments of
society rather than target specific population segments. This may be particularly challenging for
pre-hurricane residents of New Orleans Metro, many of whom are now living throughout the
country. Fourth, evidence that avoidable stressors associated with the slow government response
to hurricane Katrina (e.g., physical adversity) had important implications for the mental health of
people who lived through Katrina argues strongly for the importance of efficient provision of
practical and logistical assistance in future disasters not only on humanitarian grounds but also as
a way to minimize the adverse mental health effects of disasters.
19

REFERENCES
1. Canino G, Bravo M, Rubio-Stipec M, Woodbury M. The impact of disaster on mental
health: Prospective and retrospective analyses. Int J Mental Health. 1990;19:51-69.
2. Madakasira S, O'Brien KF. Acute posttraumatic stress disorder in victims of a natural
disaster. J Nerv Ment Dis. 1987;175:286-290.
3. Caldera T, Palma L, Penayo U, Kullgren G. Psychological impact of the hurricane Mitch
in Nicaragua in a one-year perspective. Soc Psychiatry Psychiatr Epidemiol.
2001;36:108-114.
4. Cao H, McFarlane AC, Klimidis S. Prevalence of psychiatric disorder following the 1988
Yun Nan (China) earthquake--the first 5-month period. Soc Psychiatry Psychiatr
Epidemiol. 2003;38:204-212.
5. Kohn R, Levav I, Donaire I, Machuca M, Tamashiro R. Psychological and
psychopathological reactions in Honduras following Hurricane Mitch: implications for
service planning. Rev Panam Salud Publica. 2005;18:287-295.
6. Norris FH, Perilla JL, Riad JK, Kaniasty K, Lavizzo EA. Stability and change in stress,
resources, and psychological distress following natural disaster: Findings from Hurricane
Andrew. Anxiety, Stress, and Coping. 1999;12:363-396.
7. Shultz JM, Russell J, Espinel Z. Epidemiology of tropical cyclones: the dynamics of
disaster, disease, and development. Epidemiol Rev. 2005;27:21-35.
8. van Griensven F, Chakkraband ML, Thienkrua W, et al. Mental health problems among
adults in tsunami-affected areas in southern Thailand. JAMA. 2006;296:537-548.
9. Galea S, Nandi A, Vlahov D. The epidemiology of post-traumatic stress disorder after
disasters. Epidemiol Rev. 2005;27:78-91.
20

10. David D, Mellman TA, Mendoza LM, Kulick-Bell R, Ironson G, Schneiderman N.
Psychiatric morbidity following Hurricane Andrew. J Trauma Stress. 1996;9:607-612.
11. Rosenbaum S. US health policy in the aftermath of Hurricane Katrina. JAMA.
2006;295:437-440.
12. Centers for Disease Control and Prevention. Assessment of health-related needs after
Hurricanes Katrina and Rita—Orleans and Jefferson Parishes, New Orleans area,
Louisiana, October 17-22, 2005. MMWR Morb Mortal Wkly Rep. 2006;55:38-41.
13. Centers for Disease Control and Prevention. Surveillance in hurricane evacuation centers-
Louisiana, September-October 2005. MMWR Morb Mortal Wkly Rep. 2006;55:32-35.
14. Kessler RC, Galea S, Jones RT, Parker HA. Mental illness and suicidality after Hurricane
Katrina. Bull World Health Organ. 2006;84:930-939.
15. Gallup Poll News Service. At least 100,000 Katrina victims still separated from families,
October 14. http://poll.gallup.com/content/default.aspx?ci=19225&pg=1&VERSION=p.
16. Kessler RC, Barker PR, Colpe LJ, et al. Screening for serious mental illness in the
general population. Arch Gen Psychiatry. 2003;60:184-189.
17. Centers for Disease Control and Prevention. Serious psychological distress. Early release
of selected estimates based on data from the January - March 2004 National Health
Interview Survey. http://www.cdc.gov/nchs/data/nhis/earlyrelease/200409_13.pdf.
Accessed September 14, 2005.
18. Furukawa TA, Kessler RC, Slade T, Andrews G. The performance of the K6 and K10
screening scales for psychological distress in the Australian National Survey of Mental
Health and Well-Being. Psychol Med. 2003;33:357-362.
21

19. Kessler RC, Andrews G, Colpe LJ, et al. Short screening scales to monitor population
prevalences and trends in non-specific psychological distress. Psychol Med. 2002;32:959-
976.
20. Kessler RC, Merikangas KR, Berglund P, Eaton WW, Koretz DS, Walters EE. Mild
disorders should not be eliminated from the DSM-V. Arch Gen Psychiatry.
2003;60:1117-1122.
21. First MB, Spitzer RL, Gibbon M, Williams JBW. Structured Clinical Interview for DSM-
IV Axis I Disorders, Research Version, Non-patient Edition (SCID-I/NP). New York:
Biometrics Research, New York State Psychiatric Institute; 2002.
22. Brewin CR, Rose S, Andrews B, et al. Brief screening instrument for post-traumatic
stress disorder. Br J Psychiatry. 2002;181:158-162.
23. Brewin CR. Systematic review of screening instruments for adults at risk of PTSD. J
Trauma Stress. 2005;18:53-62.
24. Hosmer DW, Lemeshow S. Applied Logistic Regression, Second Edition. New York:
John Wiley and Sons; 2001.
25. Wolter KM. Introduction to Variance Estimation. New York, NY: Springer-Verlag;
1985.
26. Substance Abuse and Mental Health Services Administration. Results from the 2003
National Survey on Drug Use and Health: National Findings.
http://www.oas.samhsa.gov/NHSDA/2k3NSDUH/2k3results.htm#ch8. Accessed
September 28, 2006.
22

27. Norris FH, Kaniasty K. A longitudinal study of the effects of various crime prevention
strategies on criminal victimization, fear of crime, and psychological distress. Am J
Community Psychol. 1992;20:625-648.
28. Norris FH, Friedman MJ, Watson PJ, Byrne CM, Diaz E, Kaniasty K. 60,000 disaster
victims speak: Part I. An empirical review of the empirical literature, 1981-2001.
Psychiatry. 2002;65:207-239.
29. Breslau N, Chase GA, Anthony JC. The uniqueness of the DSM definition of post-
traumatic stress disorder: implications for research. Psychol Med. 2002;32:573-576.
30. Garrison CZ, Bryant ES, Addy CL, Spurrier PG, Freedy JR, Kilpatrick DG.
Posttraumatic stress disorder in adolescents after Hurricane Andrew. J Am Acad Child
Adolesc Psychiatry. 1995;34:1193-1201.
31. Acierno R, Ruggiero KJ, Galea S, et al. Psychological Sequelae of the 2004 Florida
Hurricanes: Implications for Post-Disaster Intervention. Am J Public Health. in press.
32. Brewin CR, Andrews B, Valentine JD. Meta-analysis of risk factors for posttraumatic
stress disorder in trauma-exposed adults. J Consult Clin Psychol. 2000;68:748-766.
33. Galea S, Vlahov D, Tracy M, Hoover DR, Resnick H, Kilpatrick D. Hispanic ethnicity
and post-traumatic stress disorder after a disaster: evidence from a general population
survey after September 11, 2001. Ann Epidemiol. 2004;14:520-531.
23

Table 1. The estimated 30-day prevalence of DSM-IV anxiety-mood disorders1
New Orleans Metro Remainder of sample Total% (se) % (se) % (se)
I. Any anxiety-mood disorder
MMI 32.0 (3.7) 16.6 (2.4) 19.9 (2.1)SMI 17.0 (2.6) 9.8 (2.1) 11.3 (1.8)Any (MMI or SMI) 49.1 (3.3) 26.4 (3.1) 31.2 (2.6) II. PTSD
PTSD given MMI 42.5 (8.9) 24.8 (7.0) 30.9 (5.8)PTSD given SMI 98.1 (1.0) 85.8 (7.6) 89.7 (5.4)PTSD total 30.3 (3.7) 12.5 (2.2) 16.3 (2.0)
(n) (594) (449) (1043)
1Estimates of anxiety-mood disorders were based on the K6 and TSQ screening scales. See text for details.
24
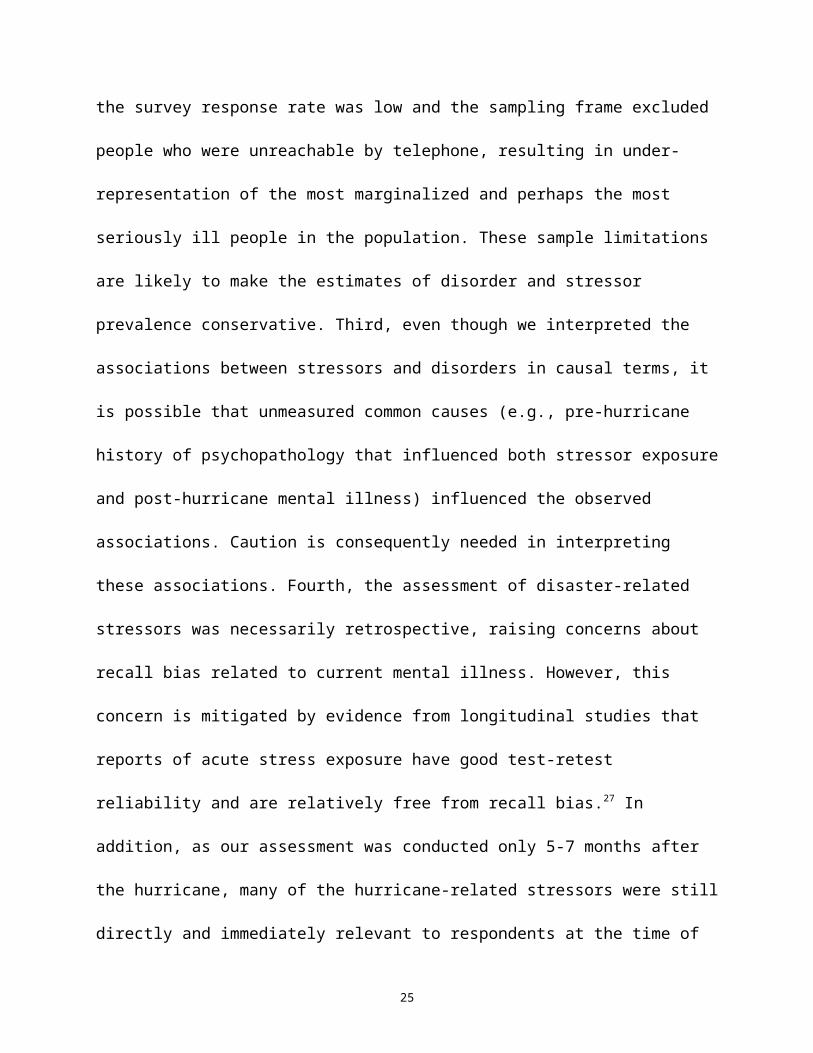
Table 2. Bivariate associations of socio-demographic variables with estimated 30-day DSM-IV anxiety-mood disorders
PTSD Other MMI or SMI Any MMI or SMI New Orleans Metro Remainder of sample New Orleans Metro Remainder of sample New Orleans Metro Remainder of sample
OR (95% CI) OR (95% CI) OR (95% CI) OR (95% CI) OR (95% CI) OR (95% CI)Age
18-39 2.9 (0.7-12.6) 1.8 (0.5-5.6) 1.3 (0.4-5.0) 2.0 (0.7-6.0) 2.2 (0.8-6.5) 2.0 (0.8-4.7)40-59 2.0 (0.6-6.9) 1.3 (0.4-4.3) 1.5 (0.7-3.6) 3.0* (1.1-8.4) 1.9 (0.8-4.2) 2.1 (0.9-5.1)60+ 1.0 -- 1.0 -- 1.0 -- 1.0 -- 1.0 -- 1.0 --
22 2.2 1.0 1.0 4.3 2.5 3.3
SexFemale 2.7* (1.3-5.9) 2.7* (1.1-6.3) 1.3 (0.6-2.9) 2.0 (0.9-4.2) 2.1* (1.1-3.9) 2.3* (1.2-4.5)Male 1.0 -- 1.0 -- 1.0 -- 1.0 -- 1.0 -- 1.0 --
21 6.4* 5.0* 0.4 2.9 4.9* 5.8*
Race/ethnicityNon-Hispanic White 1.0 -- 1.0 -- 1.0 -- 1.0 -- 1.0 -- 1.0 --Non-Hispanic Black 1.9 (0.8-4.8) 1.0 (0.4-2.3) 0.5 (0.2-1.2) 1.5 (0.7-3.3) 1.1 (0.5-2.3) 1.2 (0.6-2.3)Hispanic or other 0.5 (0.1-1.6) 0.0* (0.0-0.1) 0.3* (0.1-0.9) 3.5* (1.0-11.6) 0.3* (0.1-0.8) 1.3 (0.4-3.9)
22 4.0 15.7* 5.6 4.4 5.4 0.5
EducationLess than high school 3.9 (1.3-11.7) 7.9* (1.5-40.6) 0.7 (0.3-1.9) 1.3 (0.5-3.6) 2.1 (0.9-4.8) 2.8* (1.1-6.6)High school 1.8 (0.5-5.9) 3.2 (0.7-15.2) 0.8 (0.3-2.1) 1.7 (0.6-4.8) 1.2 (0.5-2.9) 2.1 (0.9-5.1)Some college 2.9 (1.0-8.3) 4.0 (0.8-18.7) 1.7 (0.8-3.9) 0.6 (0.2-1.5) 2.5 (1.2-5.2) 1.2 (0.5-2.9)College graduate 1.0 -- 1.0 -- 1.0 -- 1.0 -- 1.0 -- 1.0 --
23 7.3 6.8 2.8 5.6 7.8* 7.6
Family income (pre-hurricane)Low 4.1* (1.3-12.6) 17.7* (2.1-145.6) 0.8 (0.3-2.1) 3.8* (1.1-13.0) 1.7 (0.7-4.5) 7.1* (2.4-20.7)Low-average 4.0* (1.5-10.6) 6.2 (0.6-61.7) 0.7 (0.3-1.7) 2.3 (0.6-8.7) 1.7 (0.8-3.5) 3.2 (1.0-10.5)High-average 2.0 (0.8-5.5) 4.3 (0.4-43.8) 0.9 (0.3-2.5) 1.6 (0.4-6.2) 1.2 (0.6-2.7) 2.2 (0.7-7.2)High 1.0 -- 1.0 -- 1.0 -- 1.0 -- 1.0 -- 1.0 --
23 10.0* 12.8* 0.7 5.8 2.3 17.5*
Occupational status (pre-hurricane)
Employed 1.0 -- 1.0 -- 1.0 -- 1.0 -- 1.0 -- 1.0 --Housewife 1.1 (0.3-4.3) 1.0 (0.2-5.7) 0.2* (0.0-0.8) 4.5 (0.8-26.5) 0.4 (0.1-1.4) 2.9 (0.8-11.3)Retired 1.4 (0.3-7.9) 1.4 (0.4-5.1) 1.0 (0.4-2.7) 1.5 (0.5-4.7) 1.2 (0.4-3.5) 1.5 (0.6-3.6)Other 5.3* (2.3-12.4) 4.7* (1.8-12.0) 1.0 (0.4-2.5) 3.5* (1.4-8.7) 2.9 (1.3-6.6) 4.7* (2.2-9.9)
23 15.0* 12.2* 5.5 8.4* 10.4* 17.3*
Marital status (pre-hurricane)Married or cohabiting 1.0 -- 1.0 -- 1.0 -- 1.0 -- 1.0 -- 1.0 --Previously married 2.3* (1.0-5.0) 8.0* (3.2-20.0) 0.8 (0.3-1.9) 3.8* (1.7-8.9) 1.5 (0.8-3.0) 5.8 (3.0-11.3)
25

Never married 2.1 (0.7-6.5) 5.1* (1.8-15.0) 0.8 (0.3-2.2) 1.1 (0.3-4.7) 1.4 (0.5-3.7) 2.5* (1.1-5.5)2
2 4.9 21.1* 0.4 10.1* 1.5 27.8*
(n) (594) (449) (594) (449) (594) (449)
*Significant at the .05 level, two-sided test1Estimates of anxiety-mood disorders were based on the K6 and TSQ screening scales. See text for details.
26

Table 3. Prevalence of exposure to hurricane-related stressors
New Orleans Metro Remainder of Sample % (se) % (se)
I. Number of stressors One 12.8 (1.8) 31.7 (3.2)Two 19.5 (2.2) 22.5 (2.8)Three 16.4 (2.8) 9.9 (2.0)Four 15.4 (2.8) 7.6 (1.6)Five or more 27.8 (4.3) 10.1 (2.3)Any 91.9 (1.6) 81.7 (2.4)
II. Traumas Life-threatening experience 1.1 (0.4) 0.9 (0.6)Victimized 11.8 (3.6) 5.4 (1.5)Death of loved one 21.3 (3.1) 7.4 (1.7)Loved one victimized 19.3 (3.7) 9.3 (1.9)Any trauma 39.2 (4.3) 17.0 (2.5)
III. Other stressorsProperty loss 70.2 (3.1) 47.8 (3.4)Income loss 28.3 (2.9) 20.0 (2.5)Physical illness or injury 21.5 (3.2) 15.9 (2.4)Housing adversity 71.7 (3.2) 34.1 (3.0)Physical adversity 46.3 (3.6) 33.6 (3.3)Psychological adversity 29.2 (3.8) 21.1 (2.9)Any other stressor 90.0 (1.8) 79.0 (2.6)
(n) (594) (449)
27

Table 4. Model-fitting for associations of hurricane-related stressors with estimated 30-day DSM-IV anxiety-mood disorders1
New Orleans Metro (n = 594) Remainder of sample (n = 449)PTSD Other MMI or SMI Any MMI or SMI PTSD Other MMI or SMI Any MMI or SMI
Model1 2 p Df 2 p df 2 p df 2 p df 2 p df 2 P dfM1 59.5 <.001 17 21.8 .19 17 44.4 <.001 17 74.5 <.001 18 42.6 <.001 18 83.0 <.001 18M2-M1 31.2 <.001 7 45.8 <.001 7 59.0 <.001 7 36.6 <.001 7 13.7 .06 7 22.2 <.001 7M3-M1 35.6 <.001 3 35.0 <.001 3 57.8 <.001 3 10.8 <.001 2 7.8 .02 2 16.4 <.001 2M4-M3 47.7 .37 45 60.6 .06 45 34.8 .86 45 22.4 1.0 45 38.8 .73 45 31.8 .93 45
1Estimates of anxiety-mood disorders were based on the K6 and TSQ screening scales. See text for details2The predictors in M1 consist of the socio-demographic variables in Table 2. The predictors in M2 include those in M1 plus seven dummy variables for the number of stressors to which the respondent was exposed. The predictors in M3 include those in M1 plus a single dummy variable for exposure to one or more stressors and either dummy variables for physical illness-injury and physical adversity (in New Orleans Metro) or a dummy variable for property loss (in the remainder of the sample). The predictors in M4 include those in M3 plus a separate dummy variable for each of the 45 logically possible two-way interactions among the 10 stressors.
28

Table 5. Multivariate associations of hurricane-related stressors with estimated 30-day DSM-IV anxiety-mood disorders1
PTSD Other MMI or SMI Any MMI or SMIOR (95% CI) OR (95% CI) OR (95% CI)
I. New Orleans Metro2
Physical Injury/illness 2.8* (1.2-6.6) 7.4* (2.8-19.5) 6.5* (2.9-14.6)Physical adversity 7.9* (3.2-19.7) 3.2* (1.4-7.2) 6.0* (2.9-12.3)Any other stressor3 3.6 (0.7-20.2) 6.3 (1.8-21.4) 5.5* (2.0-15.0)
II. Remainder of sample2
Property loss 5.6* (1.8-17.8) 2.8* (1.3-6.3) 4.2* (2.0-8.9)Any other stressor3 1.8 (0.6-5.2) 1.5 (0.5-4.3) 1.7 (0.7-4.0)
*Significant at the .05 level, two-sided test.1Estimates of anxiety-mood disorders were based on the K6 and TSQ screening scales. See text for details. Coefficient estimates are based on M3 in Table 42Each predictor is a dichotomy coded 1 for respondents who experienced the stressor and 0 for respondents who did not experience the stressor. 3The dichotomy defining any other stressor includes all stressors other than physical illness/’injury and physical adversity in the New Orleans Metro sub-sample and all stressors other than property lost in the remainder of the sample.
29


![[Robert resnick, david_halliday]_physics](https://static.fdocuments.us/doc/165x107/58780bd41a28ab971e8b5e39/robert-resnick-davidhallidayphysics.jpg)