Woody Biomass Supply Chain Development in Eastern … · Funding for this project was provided by...
25
Woody Biomass Supply Chain Development in Eastern Canada: A Case Study in Québec Tasseda Boukherroub Luc LeBel Sébastien Lemieux May 2016 CIRRELT-2016-24
Transcript of Woody Biomass Supply Chain Development in Eastern … · Funding for this project was provided by...

Woody Biomass Supply Chain Development in Eastern Canada: A Case Study in Québec Tasseda Boukherroub Luc LeBel Sébastien Lemieux
May 2016
CIRRELT-2016-24

Woody Biomass Supply Chain Development in Eastern Canada: A Case Study in Québec
Tasseda Boukherroub1,2, Luc Lebel1,2, Sébastien Lemieux1
1. Interuniversity Research Centre on Enterprise Networks, Logistics and Transportation (CIRRELT)
2. Department of Wood and Forest Sciences, 2405, rue de la Terrasse, Université Laval, Québec, Canada G1V 0A6
Abstract. Despite the abundance of woody biomass sources in Eastern Canadian forests, the forest industry makes limited use of it. The relatively high supply cost is considered as the main hurdle. However, if biomass-based products (pellets, bio-coal, etc.) are appropriately integrated into the existing forest products supply chain, synergy effects could benefit the entire network and contribute to the regional forest industry diversification. This paper explores the possibility of implementing a wood pellet mill in Eastern Québec. Unlike most studies reported in the literature, this paper examines the entire wood pellet supply chain, from a “downstream to upstream” perspective. Low-value logs unsuitable for traditional forest products manufacturing, dead wood, insect-killed trees, and sawmill residues are considered as potential raw materials. Different supply and market scenarios are tested to derive the operational conditions under which the supply chain is profitable. Economies of scale are also considered to determine the optimal pellet mill production capacity. The experiments are performed on a spatially explicit optimization tool called LogiLab. The results show that the optimal production capacity of a pellet mill that uses low-value logs, dead wood, and insect-killed trees as the only raw materials is 100,000 tons/year. The associated ROI is 6%. To ensure profitability, harvesting costs must be shared between timber supply license owners and the pellet mill, while forest road costs must be subsidized by the government and cutting right fees must be equal to those applied to harvest residues (i.e., branches and tops). If these conditions cannot be met, the optimal production capacity would be 50,000 tons/year. In this case, sawmill residues must be used in the mix of raw materials. An ROI of 22% can be reached when the raw material contains 65% of sawmill residues. Keywords: Woody biomass, wood pellets, forest industry, integrated supply chain, economic feasibility.
Acknowledgement. Funding for this project was provided by Conférence régionale des élus de la Côte-Nord and BioFuelNet Canada. We would like to thank M. Charles Warren, M. Denis Villeneuve, M. Paul Labbé, Pr. Évelyne Thiffault, Dr. Nicolas Mansuy, and Pr. Mustapha Ouhimmou for their collaboration and constructive comments.
Results and views expressed in this publication are the sole responsibility of the authors and do not necessarily reflect those of CIRRELT.
Les résultats et opinions contenus dans cette publication ne reflètent pas nécessairement la position du CIRRELT et n'engagent pas sa responsabilité. _____________________________
* Corresponding author: [email protected]
Dépôt légal – Bibliothèque et Archives nationales du Québec Bibliothèque et Archives Canada, 2016
© Boukherroub, LeBel, Lemieux and CIRRELT, 2016

1. Industrial context The region under study is located in Eastern Québec with a surface area of more than 350,000 km2, equal to 21% of the province surface area. It encompasses close to 1,300 km of coastline, running along the north shore of the Maritime Estuary and the Gulf of St. Lawrence. The forest area covers more than 100,000 km2; 87% of which are production areas. 95% of these forest areas are managed by the provincial government (public forests) and the rest are privately owned (2%) or belong to the federal government (3%) (MFFP, 2004).
The local economy is strongly linked to the forest sector. At the beginning of the 2000s, 13 mills were operating. Since then, due to the recession, fiber quality issues and the Canada-U.S. lumber dispute, many mills struggled and several were forced to shut down. Presently, there are 8 mills in operation, including five sawmills, one oriented strand board mill, one wood pellet mill and one pulp and paper mill. The pulp and paper mill and four of the sawmills own a timber supply guarantee, which allows them to harvest from a specific forest management unit (FMU), a specific volume of wood of a given species and quality (i.e., cutting rights). These wood supply guarantees are based on agreements with the Québec government, the Ministère des Forêts, de la Faune et des Parcs du Québec (Ministry of forests, wildlife and parks), hereinafter referred to as MFFP.
A study carried out by a regional development agency revealed many unfavorable elements to the forest industry development in the region, such as cutting rights fees, access to market (absence of railway), and access to forest resources (rough terrain and water obstacles makes it difficult to build forest roads) (MFFP, 2004). Nonetheless, this region offers large quantities of forest biomass in various forms, such as harvest residues, deadwood and some hardwood species unsuitable for lumber and paper production, small diameter trees/natural defect trees, etc. In 2010, the MFFP and timber supply license owners (hereinafter referred to as license owners or LOs) made an agreement specific to the region on small diameter trees/natural defect trees: “good wood, good plant, good use,” which allows these mills to leave stems of 12 cm in diameter or less in cutting areas without penalty.
Moreover, the region is currently suffering from the effects of the spruce budworm, a defoliating insect that has ravaged several million hectares since 2006. In 2014, the total land surface in Québec hit by the spruce budworm was 4,275,065 hectares. The progression of the epidemic is particularly strong in the region under study, with close to 3 million infested hectares in 2014 (MFFP, 2014). Severely defoliated trees/dead trees from budworms are unfavorable for lumber and pulp producers due to their low profitability and quality, but they can however be used for bioenergy products such as wood pellets. To benefit from this opportunity, the regional authorities are seeking prospects to develop forest biomass hoping that it can contribute to job creation, and maintain a diversified forest industry. This study focuses on wood pellet production. It was carried out in partnership with local economic development agencies, and different experts from the MFFP and the forest industry.
2. Literature Review Various studies have been published in the literature on wood pellet production costs, conversion technologies, raw material sources, and wood pellet market analysis, along with many case studies in different parts of the world (Wolf et al., 2006; Blom, 2009; Peng et al., 2010; Uasuf and Becker, 2011, Mobini et al., 2013, etc.). As an example, Mani et al. (2006) estimated the cost of
Woody Biomass Supply Chain Development in Eastern Canada: A Case Study in Québec
CIRRELT-2016-24 1

producing pellets in North America. They analyzed the effect of feedstock cost, plant capacity, and dryer fuel options (wet biomass, dry biomass, fuel pellets, natural gas, and coal) on pellet production cost. Urbanowski (2005) studied the feasibility of building and operating a wood pellet mill in British Columbia with the aim of creating wealth and jobs for a First Nations population. A number of profitable options presenting different plant locations, production capacities, and ownership types were identified and discussed. In the same vein, Blom (2009) evaluated the feasibility of operating a wood pellet mill in British Columbia and estimated the costs of supplying alternative wood fiber sources (mill residues, dead pine trees and green standing timber). In another study in Western Canada, Peng et al. (2010) estimated the cost of producing torrefied wood pellets from different raw materials (mill residues, bark, harvest residues, and mountain pine beetle-infested trees). Mobini et al. (2013) developed a simulation model called Pellet Supply Chain (PSC) model to facilitate wood pellet supply chain design studies. It allows taking into account uncertainties and interdependencies between the supply chain stages. PSC model estimates the cost of delivering pellets to various customers and estimates the amount of energy consumed along the supply chain and associated CO2 emissions. The model was applied to an existing supply chain located in British Columbia. The results of scenario-based analysis showed that by changing the drying fuel from sawdust to bark, it was possible to achieve about 1.5% cost reduction. On the other hand, blending 10% bark in the whitewood feedstock reduced the estimated cost by 4.75%.
In Europe, Thek and Obernberger (2004) calculated the costs of producing wood pellets from sawdust and shavings in Austria and Sweden, and compared the results for the two countries. The production costs were found to be mainly influenced by the raw material costs and, in the case of using wet raw materials, the drying cost. Wolf et al. (2006) analyzed the obstacles and success factors of integrating wood pellet production with other forest products manufacturing (i.e., waste heat is used as a heat source for the drying phase in the pellet production process). The authors examined two European case studies; a sawmill with integrated pellet production and a pulp mill integrated with bark pellet production. Uasuf and Becker (2011) determined wood pellet production cost and energy consumption under different operating conditions in Northeast Argentina. The scenarios considered are based on raw material mix alternatives (wet sawdust and wood shavings) and different production capacities. The authors reported that the use of sawdust and wood shavings as raw materials was the most promising scenario for Northeast Argentina, in terms of cost effectiveness and energy consumption.
Despite the variety of the literature on wood pellet production worldwide, case studies in Eastern Canada reported in scientific literature are very scarce. So far, the study by Mansuy et al. (2015) is, to the best of our knowledge, the only published work that dealt with wood pellet production from woody biomass in Eastern Québec. Mansuy et al. (2015) estimated the potential quantities of different wood biomass sources such as harvest residues, burned stands, and spruce budworm-infested trees under various ecological and economic constraints. However, the authors focused only on the upstream stages of the wood pellet supply chain (i.e., procurement and inbound logistics). In fact, only a few studies in the literature analyze wood pellet production from the supply chain perspective (e.g. Mobini et al., 2013). In particular, Hughes et al. (2014) who analyzed 153 peer-reviewed papers on wood pellet supply chains reported that few Canadian-based published studies exist in regards to a supply chain analysis approach for wood pellet production. Moreover, Hughes et al. (2014) argue that most companies examine the wood pellet supply chain from an “upstream to downstream” perspective, i.e., the product is created based on capacity and then “pushed” out into the marketplace. Our study proposes to address the gaps identified
Woody Biomass Supply Chain Development in Eastern Canada: A Case Study in Québec
2 CIRRELT-2016-24

in the literature. It adopts both demand-driven and supply chain analysis approaches. The adopted methodology is presented in the next section.
4. Methodology We examine each stage of the wood pellet supply chain: raw material procurement, inbound logistics of raw materials, processing of raw materials into pellets, and outbound logistics to the end customer. However, in order to take into account customer demand in terms of wood pellet quantity, pellet characteristics (ash content, moisture, dimensions, etc.), and price, we adopt a downstream to upstream perspective. The proposed methodology is comprised of 5 phases as shown in Figure 1.
- Market analysis. This phase consists in identifying target markets, the quality of pellets required for each market and the selling price.
- Raw material analysis. Here we identify the types of biomass available in the forest and their compatibility with pellet qualities. We also estimate the available quantity for each biomass type and determine their locations.
- Supply chain design. This phase focuses on the potential pellet mill location, the production technologies to be put in place, supply and distribution strategies, and the possibility of integrating the pellet supply chain with the existing forest products supply chain, for example, at the wood harvesting stage, in the forest.
- Cost estimation. In this phase, we estimate the raw material cost and the transport cost to the mill, investment costs, production costs, and pellet distribution costs.
- Profitability analysis and supply chain optimization. Taking into account the structure of the supply chain network and associated costs, we analyze various supply and market scenarios by using LogiLab. The obtained results allow us to identify the best wood pellet mill production capacity and the associated operating conditions (i.e., operating framework) ensuring profitability.
The next sections describe more in detail each of the five phases.
Woody Biomass Supply Chain Development in Eastern Canada: A Case Study in Québec
CIRRELT-2016-24 3

Goals Phases
Market analysis
Raw material analysis
Supply chain design
Cost estimation
Profitability analysis and supply chain
optimization
- Markets - Pellet grades- Selling price
- Types of biomass - Location- Available quantities
- Pellet mill location- Manufacturing technologies - Transportation modes- Links with existing forest products mills
- Procurement cost- Production cost- Pellet delivery cost
- Optimal production capacity- Optimal operating framework
Wood pellet value chain analysis
Figure 1. A downstream to upstream perspective for wood pellet supply chain analysis
4.1 Market analysis The world wood pellet market is estimated at 51 million tons for 2020 and 54 million for 2025 (Murray, 2014). Although the North-American market should remain stable, the European and Asian (Japan and South Korea) markets are projected to show major increases.
There are generally two types of wood pellets on the market: premium quality pellets for the residential/institutional market (heating) and standard quality pellets for industrial use (energy). In North America (Canada and the U.S.), wood pellets are sold mainly for household heating while they are used in both industry and residential/institutional settings in Europe.
4.1.1 Local and North-American markets Since the last few years, the American market is saturated due to pellet manufacturing subventions (ÉcoRessources and EcoTec, 2012). Moreover, the Eastern Canada industry has relatively high transport costs, as transportation is mainly carried out by trucks over fairly long distances (Morency, 2012). On the other hand, the Québec market is small. It was estimated at 60,000 tons in 2010 (MRNF – CRIQ, 2011). Furthermore, there are already some mills in Québec which produce wood pellets for the local market, including one in the studied region. As a result, the local market and the North-American market in general is not attractive. Therefore, we don’t consider this market further in our analyses.
Woody Biomass Supply Chain Development in Eastern Canada: A Case Study in Québec
4 CIRRELT-2016-24

4.1.2 European market The European market has the biggest growth potential over the next 20 years. The average CIF (cost, insurance and freight) price for wood pellets (industrial quality) is around $200 CAD per ton. The price is slightly higher in Scandinavian countries (Sénéchal and Grassi, 2009), which gives Canada a competitive advantage. However, low exchange rates (EUR-CAD) may significantly lower the profit margin of Canadian manufacturers (Arsenault, 2010).
Western Canada exports much more to Europe than Eastern Canada. In fact, close to 65% of Canadian production is located in Western Canada in comparison to 35% in Eastern Canada (Morency, 2012). Whereas ships departing from Vancouver, British-Columbia travel almost 16,000 km via the Panama Canal to Rotterdam to reach the European market, the distance between Eastern Canadian ports and Rotterdam is less than 5,000 km. In the region under study, there are three ports which could be used for pellet exportation. In addition, the European market has a demand for both premium quality pellets and standard quality pellets. Therefore, Europe appears as a promising market to penetrate for wood pellet manufacturers in Eastern Canada. Thus, Europe is the targeted market in our study.
However, it is crucial to meet specific wood pellets characteristics, in terms of size, ash content, moisture, etc., in order to provide the right pellet quality, with the right raw material for the right customer. There exist various standards for the North-American and the European markets specifying the characteristics of different wood pellet qualities. The next section introduces the most popular wood pellet standards.
4.1.3 Wood pellet standards The Pellet Fuel Institute (PFI), which is in charge of establishing the wood pellet characteristics in North-America, identifies three pellet grades in its latest standard version (PFI, 2011): premium, standard, and utility. For instance, the amount of ash must be inferior or equal to 1%, 2% and 6%, respectively (PFI, 2011). In fact, ash content is a very important characteristic which clearly distinguishes the three grades. It is associated with the quantity of bark contained in the raw material used in wood pellet production. For example, harvest residues (branches and tops) have high bark content whereas roundwood has less.
In Europe, there are five known standards: NF Biocombustibles solides (France), DINplus (Germany), O NORM (Austria), SS 18 71 20 (Switzerland), and EN PLUS (Europe) which certifies all transport and logistics up to the final user. To illustrate, EN PLUS distinguishes three grades: ENplus-A1 and ENplus-A2 for residential/institutional use, and EN-B for industrial use. The EN PLUS standard also specifies the raw material sources and additives permitted for each grade. The ENplus-A1 grade is the most challenging as only stem wood and sawmill residue from industries that use non-chemically treated wood are acceptable. The ENplus-A2 grade can contain a more varied mix of biomass, from whole trees (excluding roots) to bark. Finally, the EN-B grade can also contain non-chemically treated, used wood (e.g., construction lumber). To meet standards’ requirements, the raw material sources should be carefully selected. The next section analyses biomass sources available in the studied region.
4.2 Raw material analysis We first determine different sources of woody biomass available and then we present the available quantity for each type and their location.
Woody Biomass Supply Chain Development in Eastern Canada: A Case Study in Québec
CIRRELT-2016-24 5

4.2.1 Wood biomass sources In Developing the Value of Forest Biomass: An Action Plan (February 2009) (AQPER, 2009), the MFFP defines forest biomass as “trees or portions of trees included in the allowable cut that are not subject to allocation or reservation [e.g. supply guarantee], in addition to the trees, low woody plants, crowns, branches, and leaves that are not part of the allowable cut. Stumps and roots are excluded from this definition within the scope of the forest biomass allocation plan.” This definition is important to consider because it legally specifies what can be used as raw material for manufacturing wood pellets or other bio-products and what is excluded. An interview with an expert from MFFP allowed us to identify five potential forest biomass sources consistent with the previous definition: - harvest residues (branches and tops left in cutting areas); - certain types of hardwood trees of low quality (i.e. birch and poplar), unsuitable for traditional
forest products such as lumber or some paper grades; - small diameter/natural defect stem wood unsuitable for lumber or paper production
(according to the agreement “good wood, good plant, good use” between the MFFP and license owners introduced in section 3);
- deadwood (dry but undamaged wood); - severely defoliated trees or dead trees from the spruce budworm.
We have also studied the possibility of using sawmill residue generated from sawmills operating in the region. We conducted a number of interviews with different managers and experts from the industry, local development agencies, and the MFFP. These interviews allowed us to identify one sawmill as a potential supplier of sawdust and shavings. The other sawmills already use or plan to use all of their by-products in the mid and long terms. This potential supplier currently sells and delivers by truck its sawdust and shavings to a company located over 500 km from the sawmill’s location. Due to high delivery costs, the potential supplier does not exclude the possibility of selling the sawmill residues locally, for a wood pellet mill for example, if the conditions are more favorable.
4.2.2 Available quantities of wood biomass sources The average quantity of sawdust/shavings generated by the sawmill identified previously as a potential supplier for the pellet mill is estimated, based on the industry trends, at about 32,500 anhydrous metric tons (AMT) per year. We used data from a study done by a consulting firm in 2014 to estimate the quantities of the other sources of biomass. The quantity of biomass is evaluated for each of the following types: small diameter trees/natural defect trees, dead wood, birch, poplar, and budworm-damaged wood. These values were later validated in their order of magnitude by MFFP experts.
We did not include the harvest residues as this type of feedstock contains too much bark. As the roundwood (small diameter/natural defect trees, deadwood, and budworm-damaged wood) also contains bark, using additional biomass with high percentage of bark would increase the ash content of the pellets further. Even if requirements are less stringent for industrial grade pellets, feedstock quality must be closely monitored.
The different types of biomass considered are located in two FMUs, from which two LOs (hereinafter referred to as LO1 and LO2) are currently harvesting their wood supply guarantees. One of these LOs (LO1) is the sawmill previously identified as a potential supplier of
Woody Biomass Supply Chain Development in Eastern Canada: A Case Study in Québec
6 CIRRELT-2016-24

sawdust/shavings. The other FMUs of the region have little biomass which could be harvested at a reasonable rate. The distance and absence of forest roads in these FMUs considerably limits access to biomass. Table 1 presents the quantities of biomass in each of the two FMUs (hereinafter referred to as FMU A and FMU B), by type and located in an under 100 km radius, and between 100-180 km from the closest town in the region to the two FMUs (hereinafter referred to as C-Bay).
Table 1. Estimation of wood biomass quantities in FMU A and FMU B (AECOM - CRIQ, 2014)
4.3 Supply chain design This section is divided into four parts. First, the potential wood pellet mill location is determined. Next, the production process and the associated manufacturing technologies are briefly described. The forest biomass transportation (inbound logistics) and wood pellet delivery (outbound logistics) are then described. Finally, the links with existing forest products supply chains are identified.
4.3.1 Pellet mill location The transport of raw materials is a determining factor in the wood pellet industry. It is not profitable to transport fiber over exceedingly long distances. As a result, a wood pellet mill must be located as close as possible to the raw material sources. As an example, in British Columbia, the transport distance of biomass (wood residues from dead wood) by truck from forest to mill is between 50-75 km (Sénéchal and Grassi, 2009).
Therefore, C-Bay town appears to be at an appropriate distance to FMU A and FMU B. However, further analyses are needed to determine the maximum distance between the pellet mill location and the forest biomass locations in the two FMUs at which the biomass can be harvested at efficient costs (section 5 discusses more in detail this issue).
Other factors lead us to select C-Bay town as the best location for the wood pellet mill. First, the sawmill selected as potential sawdust/shavings supplier for the pellet mill is located in C-Bay. Second, the sawmill owner has sufficient land close to the sawmill that can be used to build the pellet mill. Finally, there is a port C-Bay less than 20 km from the pellet mill potential location, and this is a major advantage for low-cost pellet exportation to Europe.
FMUs
Radius (km)
Biomass types (AMT/y)
Small diameter trees/natural defect
trees (softwood)
Dead wood
(softwood)
Birch (hardwood)
Poplar (hardwood)
Total (AMT/y)
FMU A 0-100 33,425 15,917 7,874 4,493 61,709
100-180 20,890 9,948 4,921 2,808 38,567
FMU B 0-100 14,524 6,916 8,861 6,270 36,571
100-180 0 0 0 0 0
budworm-damaged wood (FMU A & FMU B) (AMT/y)
0-100 6,709 3,195 3,787 2,808 16,499
Total (AMT/y) 0-180 75,548 35,976 25,443 16,379 153,346
Woody Biomass Supply Chain Development in Eastern Canada: A Case Study in Québec
CIRRELT-2016-24 7

After discussing these advantages with our industrial partners and experts from local development agencies and the MFFP, C-Bay town has been selected as the best location for the wood pellet mill.
4.3.2 Manufacturing technologies Generally, the wood biomass sent to a pellet mill is either in chip form (i.e., the forest biomass is usually shredded or grinded in the forest prior to delivery), or in fine particle form (sawdust and shavings). Fractionation is done by a machine equipped with rotating blades (shredding) and/or a hammer mill (grinding). The feedstock is generally stored in storage silos, on concrete slabs, or in a yard before processing. Next, the fiber goes through five main transformation phases: drying, grinding, conditioning, pelletization, and cooling.
Drying is done with a drum dryer that reduces the moisture content to about 12%, as pellets have a required moisture content of less than 10% (more moisture is evaporated during pelletization). To generate heat, natural gas or propane can be used. However, heat is usually generated by burning part of the feedstock (sawdust, bark, etc.) to reduce operation costs. When raw material is not used by the dryer, the material yield is close to 100% (Goyette, 2009). In this study, we assume a yield of 100% (i.e., no raw material is used for combustion). The feedstock then goes through a vibrating screen which separates the big particles from the small ones. The big particles are grinded in a hammer mill in order to reach the required size for the pelletization phase. Conditioning is done in a conditioning unit which softens the fiber for pelletization by releasing high temperature steam. During the pelletization phase, the fiber is pressed onto the surface of a pellet die by rollers (pellet mill) which force the material through the die holes. During compression, the fiber heats up and liberates lignin, which creates cohesion in the pellets. Once they leave the machine, the pellets are at a temperature of 100° to 150°C. A cooler lowers the pellet temperature to set the lignin and prevent pellet disintegration. Dust is then removed and the pellets are stocked into silos. A packaging process may be required if the pellets are intended for local consumption. In our case, as the wood pellets are to be delivered to the European market, no packaging is required (i.e., bulk transportation).
4.3.3 Forest biomass transportation and wood pellet delivery Forest biomass can be transported in two forms. Roundwood can be brought directly to pellet mills by truck (chipping is done at the mill). The wood can also be chipped in the forest, and then transported by truck. This method of operation is quite common in British Columbia. In this study, we assume that the biomass is chipped in the forest and transported by truck (the train is not available in FMUs A and B). In fact, the paper mill located in C-Bay town also uses this method for a portion of its wood supply in the region. Concerning sawdust/shavings, it can be directly delivered to the pellet mill on conveyors, since the supplying sawmill location is close to the pellet mill location. This is very common in integrated wood pellet production.
C-Bay’s port has storage silos which could store the pellets prior to delivery to Europe by boat. The characteristics of the port enable holding ships with a tonnage of 25,000 tons. On their route to Europe, the pellets would be trucked (bulk transportation) from the pellet mill to the port where they would be stocked in silos. The pellets would then be transported by ship (25,000 tons) to Rotterdam port (Europe).
4.3.4 Integrating the wood pellet supply chain to the existing forest products supply chain The objective is to identify synergy effects that might result from integrating a part of the wood pellet supply chain to the existing forest products supply chain. We have already identified LO1
Woody Biomass Supply Chain Development in Eastern Canada: A Case Study in Québec
8 CIRRELT-2016-24

as a potential supplier of sawdust/shavings for the pellet mill, and selected the land adjacent to LO1’s sawmill as the future location of the pellet mill. This form of integration, even though the wood pellet is a stand-alone plant (i.e., there are two distinct owners for the sawmill and the pellet mill) contributes to minimizing the raw material transportation (sawdust and shavings).
We identified additional integration and raw material cost minimization mechanisms in the forest. Indeed, since the forest biomass to be harvested is located in FMUs where two license owners (LO1 and LO2) are currently operating (LO1 in FMU A and LO2 in FMU B, see figure 3), harvesting cost sharing mechanisms could be established. In this regard, one manager from LO1 expressed the interest of the two license owners to collaborate with the future wood pellet mill owner on forest operations in the two FMUs. More precisely, the harvesting cost to be shared concerns the cost of forest road construction and maintenance. More details are presented in section 4.4. The resulting wood pellet supply chain network is illustrated in Figure 2.
FMU A
Wood pellets
Sawmill (LO 1)
Pellet mill
sawdust/shavings
FMU B
C-Bay port Rotterdam port
Sawmill (LO 2)
Chips
Chips
Roundwood
Roundwood
Wood pellets
Figure 2. The wood pellet supply chain design
4.4 Cost estimation In this section we evaluate the cost of each stage of the wood pellet supply chain as follows:
- Raw material cost. This includes costs of biomass harvesting in the forest (cutting right fees, forest road costs, chipping, etc.) and the purchase cost of sawdust/shavings.
- Raw material transportation cost (from the forest to the pellet mill). We assume that there is no cost for sawdust/shavings transportation (see section 3.3.2)
- Operating cost of the pellet mill (production, labor, maintenance, financing, etc.)
- Pellet delivery cost from the pellet mill up to Rotterdam port
All costs are estimated in Canadian dollars.
Woody Biomass Supply Chain Development in Eastern Canada: A Case Study in Québec
CIRRELT-2016-24 9

4.4.1 Raw material costs Table 2 presents the unit cost of forest biomass harvesting by type, excluding transport. We estimated the cost based on data provided by the industry (AECOM - CRIQ, 2014).
Table 2. Wood biomass harvesting cost in FMU A and FMU B (AECOM – CRIQ, 2014)
Biomass types
Cost items
Small diameter trees/natural defect
trees (softwood)
Dead wood (softwood)
Birch (hardwood)
Poplar (hardwood)
budworm-damaged
wood
Cutting rights ($/AMT) 11 11 2 2 11 Felling-limbing-hauling ($/AMT) * 50 42.5 32 42.5 45.5
Forest road construction and maintenance ($/AMT)
5.5 5.5 4.25 5.5 6.5
Other (supervision, planning, dining, etc.) ($/AMT)
15.5 15.5 11 15.5 15.5
Measuring ($/AMT) 1 1 1 1 1
Chipping ($/AMT) ** 18 18 18 18 18
Total cost ($/AMT) (without governmental subsidies)
101 93.5 68.25 84.5 96
*Tree length harvesting system (feller-buncher) (AECOM - CRIQ, 2014). **This cost is estimated based on (MRNF – CRIQ, 2011). Cutting right fees are paid by license owners for each cubic meter of wood harvested in the public forests, depending on the tarification zones where the wood is found. The tarification zones and thus cutting right fees are established based on the market value for standing timber sold on the free market of the State forests. As the biomass sources selected as raw material in our study is comprised of standing wood, it has a market value. According to data provided by the MFFP, the average is approximately $4/m3 in FMU A and $5/m3 in FMU B for small diameter trees/natural defect trees, dead wood, and budworm-damaged wood. For birch and poplar, the fees are $1/m3 and $0.80/ m3, respectively, in the two FMUs.
To obtain the harvestings cost per AMT, we adopted the conversion factors (m3 – AMT) used in in (AECOM - CRIQ, 2014): 0.376 AMT for 1 m3 for small diameter trees/natural defect trees and dead wood (softwood species), 0.505 AMT for 1 m3 for birch, 0.375 AMT for 1 m3 for poplar, and a weighted average of 0.400 AMT for 1 m3 for budworm-damaged wood (mix of infected softwood species and hardwood species harvested in the same stands as the infected softwood trees).
The cost of forest road construction and maintenance is estimated at $4.25/m3 (AECOM - CRIQ, 2014). The cost should nonetheless be shared by the potential pellet mill owner and the license owners since they operate in the same forest areas. The cost assigned to each partner should be proportional to the quantities of wood harvested by each one. However, as it is not possible to know in advance the precise quantities to be harvested by each of the license owners and the pellet mill owner in the harvesting areas, we assume the cost to be shared equally.
The cost of supervision, planning, dining, etc. (cost item “other” in Table 2) is estimated at $5.84/m3 (AECOM - CRIQ, 2014). This cost does not include fixed costs such as setting up forest camps. Such expenses are under the responsibility of the two LOs as they already exploit these
Woody Biomass Supply Chain Development in Eastern Canada: A Case Study in Québec
10 CIRRELT-2016-24

infrastructures (AECOM - CRIQ, 2014). For budworm-damaged wood, we assumed that the cost of felling-limbing-hauling and road construction and maintenance, by m3, is slightly higher than that of the other biomass sources due to the decrease in machine productivity (defoliated standing crops) (DGR, 2014). Based on a report from a consultant (DGR, 2014), we increased the two cost items by $1/m3 each. The purchase price for sawdust/shavings is estimated at $50/AMT according to the industrial trends in Eastern Canada.
The total cost of forest biomass harvesting does not include government subsidies. In fact, the Canadian and provincial governments have adopted financial support programs to promote bioenergy products manufacturing. The wood pellet mill owner would benefit from these programs. In particular, it would be eligible for a tax credit for its expenses on road construction and maintenance. The part of road construction and maintenance cost assigned to the pellet mill would be refunded 100%. This scenario will be analyzed along with other operating conditions in sections 4.5 and section 5.
4.4.2 Inbound and outbound logistics costs Raw material transportation cost is estimated based on Yemshanov et al. (2014) and Mansuy et al. (2015). The cost includes fuel, machine depreciation, staff salaries, trucking and idling time. Table 3 presents the transportation cost by distance travelled.
Table 3. Wood biomass transportation costs
Distance (km) Cost ($/AMT)
First 50 km 20
Each additional distance of 50 km 10
Wood pellet delivery from the mill to the European market requires three steps: transportation, storage, and cargo handling at the exportation port. We estimated the cost based on data provided by our industrial partners (Table 4).
Table 4. Wood pellet delivery costs
Distance from the pellet mill location to C-Bay port (km) 20
Transportation cost ($/AMT) 1
Storage cost ($/AMT) 4
Handling cost ($/AMT) 10
Distance from C-Bay port to Rotterdam port (km) ~ 5000
Transportation cost from C-Bay port to Rotterdam port ($/AMT) 12
4.4.3 Wood pellet operations costs Operation costs depend on the production capacity of the pellet mill due to economy of scale (Mani et al., 2006). Indeed, the cost decreases as the mill capacity increases. Based on (Mani et
Woody Biomass Supply Chain Development in Eastern Canada: A Case Study in Québec
CIRRELT-2016-24 11

al., 2006), we estimated that the production cost decreases by about 10% almost linearly between a production capacity of 45,000 tons and 75,000 tons. The production cost stays constant between 75,000 tons and 112,500 tons. Goyette (2009) argues that a new pellet mill, especially if it uses roundwood as raw material, should not have a production capacity below 50,000 tons/year, and should ideally reach 100,000 tons/year. The operating costs for a pellet mill with a capacity fixed at 100,000 tons/year are presented in Table 5. These costs are based on industrial data (Goyette, 2009). The investment is estimated at about $16M (Goyette, 2009).
Table 5. Operations costs of pellet mill with a production capacity of 100,000 tons/year (Goyette, 2009)
Items Cost ($/AMT)
Labor 13.02 Maintenance 4.57 Energy (electricity) 9.09 Heating 1.14 Mobile equipment (fuel) 3.15 Insurance and financial taxes 3.45 Selling fees (3%) 3.93 Other (telecommunication, office supplies, fees, bank charges) 1.95 Depreciation 11.09 Financial fees 5.42 Total 56.81
4.5 Profitability analysis and supply chain optimization To evaluate the economic feasibility and derive the operating framework ensuring the profitability of the wood pellet supply chain, we used LogiLab, a spatially explicit optimization tool developed by the FORAC Research Consortium. LogiLab allows, through a generic supply chain model based on mathematical programming, to model a forest products supply chain network (i.e., business units such a forests, sawmills, paper mills, wood pellet mills, clients, etc., transformation and storage processes as well as the transportation modes used within the supply chain). All constraints related to supply, production, storage and transport capacities are considered, as well as customer demand for finished products. LogiLab optimizes the supply chain and finds the best possible exploitation of resources, by minimizing total cost, or by maximizing the generated profit (the mathematical model is presented in the appendix). The supply chain network along with all the flows between business units are explicitly represented with a graphical interface.
As an example, Figure 3 shows the flow of products within the wood pellet supply chain network, from the forest up to the client (European market), generated by LogiLab. The various business units ZT-960-093-51, ZT-961-093-51, etc., represent different biomass locations in FMUs A and B. The green bar under each business unit represents the capacity usage rate (supply, storage, processing, etc.) while the flow of products is represented by blue arrows of which the thickness corresponds to the quantity of products which flow between business units.
Woody Biomass Supply Chain Development in Eastern Canada: A Case Study in Québec
12 CIRRELT-2016-24

Figure 3. Spatialized representation of the wood pellet supply chain by using LogiLab
For our case study, we maximized the profit generated by the wood pellet supply chain. We analyzed eight scenarios (Table 6). All prices and costs are in Canadian dollars.
Table 6. Supply chain scenarios analyzed through our methodology
Operating conditions
Selling price ($/AMT) 200 170 230
Raw material sources: mix of different wood biomass types harvested in the forest -
-
• Harvesting costs are not shared between the pellet mill and LOs • No governmental support is granted
Scenario 1
• Harvesting costs are equally shared between the pellet mill and LOs • No governmental support is granted
Scenario 2
• Harvesting costs are equally shared between the pellet mill and LOs • Two types of governmental supports are granted:
- Cutting right fees are set to $0.10/m3 - The portion of the road cost attributable to biomass harvesting is
100% reimbursed
Scenario 3
Raw material sources: mix of different wood biomass types harvested in the forest + sawdust/shavings
-
- • Harvesting costs are not shared between the pellet mill and LOs
• No governmental support is granted Scenario 4
• Harvesting costs are equally shared between the pellet mill and LOs • No governmental support is granted
Scenario 5 - -
Woody Biomass Supply Chain Development in Eastern Canada: A Case Study in Québec
CIRRELT-2016-24 13

• Harvesting costs are equally shared between the pellet mill and LOs • Two types of governmental supports are granted:
- Cutting right fees are set to $0.10/m3 - The portion of the road cost attributable to biomass harvesting is
100% reimbursed
Scenario 6 Scenario 7 Scenario 8
For the first six scenarios, we set the CIF price in Rotterdam at $200/AMT and we evaluated the impact of different raw material compositions (roundwood solely or a mix of roundwood and sawdust/shavings) and procurement costs (shared harvesting costs and governmental supports) on generated profit, the profit margin per metric ton of pellets, and the return on investment (ROI). For the last two scenarios, we selected the supply scenario with the best cost and we varied the pellet selling price. The goal is to evaluate the impact of selling price decreases and increases on the profitability.
For scenarios 1, 2, and 3, only the biomass harvested in the forest (FMU A and FMU B, i.e., roundwood) is considered a raw material.
• Scenario 1: harvesting costs are completely covered by the wood pellet owner. This instance presents a conservative scenario where forest areas from which biomass must be harvested are not being exploited by LOs. In other words, the road construction and maintenance cost, the fixed cost of camp set-up, and the variable cost of planning, supervision, etc. are completely covered by the pellet mill. We also assume that no financial support will be granted by the government. In fact, this is a fictive scenario since FMUs A and B are currently both exploited by LO1 and LO2, respectively. We use this scenario as a base case scenario to evaluate the impact of cost reduction applied in scenarios 2 and 3.
• Scenario 2: harvesting costs are equally shared between the LOs and the pellet mill owner (i.e., forest road construction and maintenance cost and supervision, planning, and dining costs) and that no government support is granted.
• Scenario 3: the harvesting costs are equally shared among the LOs and the pellet mill owner, and the government grants two types of financial support. The first one concerns cutting right fees. We assume that the price is the same as for harvest residues (branches and tops), that is, $0.10/m3. We also assume that the forest road construction and maintenance cost (portion of the road cost attributable to biomass harvesting) is 100% reimbursed.
For scenarios 4, 5, and 6, we considered the same hypotheses as for scenarios 1, 2, and 3 (respectively), but we add sawdust/shavings as an additional raw material source. Scenarios 7 and 8 have the same hypotheses as scenario 6, but we consider a lower ($170/AMT) and higher ($230/AMT) selling price, respectively, to mimic the fluctuating exchange rate (EUR-CAD) or the fluctuating price established in Rotterdam (EUR). Scenario 7 is rather conservative whereas scenario 8 is optimistic.
To determine the most appropriate production capacity of the wood pellet mill, for each scenario, we considered three potential capacities, 50,000 tons/year, 100,000 tons/year, and 150,000 tons/year. We adjusted the production cost for each capacity to respect economies of scale. Based on (Mani et al., 2006); it is estimated that production cost decreases by about 10% linearly
Woody Biomass Supply Chain Development in Eastern Canada: A Case Study in Québec
14 CIRRELT-2016-24
between a capacity of 50,000 tons and 75,000 tons, and stays constant between 75,000 tons and 100, 000 tons. Therefore, the unit production cost for a capacity of 50,000 tons/year is 10% higher than the unit production cost of a mill with a capacity of 100,000 tons/year ($56.81/TMA according to the industry) or 150,000 tons/year (we assume the same production cost for the capacities of 100,000 tons/year and 150,000 tons/year). We chose these capacities based on the industry practices: “a new pellet mill using roundwood as raw material, should not have a production capacity below 50,000 tons/year, and should ideally reach 100,000 tons/year.” (Goyette, 2009). Since there is a large quantity of raw material (185,846 AMT/year), we also analyze a capacity of 150,000 tons/year. The investments for each mill production capacity are according to the industry at $10M, $16M and $20M, respectively.
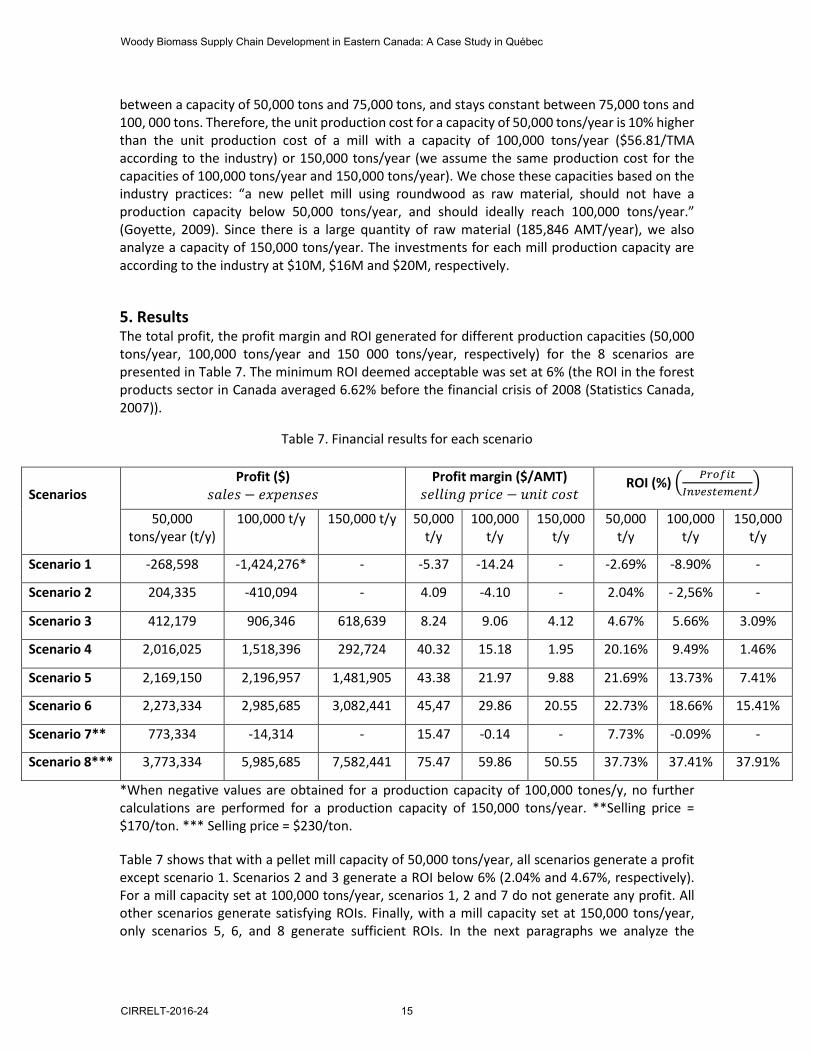
5. Results The total profit, the profit margin and ROI generated for different production capacities (50,000 tons/year, 100,000 tons/year and 150 000 tons/year, respectively) for the 8 scenarios are presented in Table 7. The minimum ROI deemed acceptable was set at 6% (the ROI in the forest products sector in Canada averaged 6.62% before the financial crisis of 2008 (Statistics Canada, 2007)).
Table 7. Financial results for each scenario
*When negative values are obtained for a production capacity of 100,000 tones/y, no further calculations are performed for a production capacity of 150,000 tons/year. **Selling price = $170/ton. *** Selling price = $230/ton.
Table 7 shows that with a pellet mill capacity of 50,000 tons/year, all scenarios generate a profit except scenario 1. Scenarios 2 and 3 generate a ROI below 6% (2.04% and 4.67%, respectively). For a mill capacity set at 100,000 tons/year, scenarios 1, 2 and 7 do not generate any profit. All other scenarios generate satisfying ROIs. Finally, with a mill capacity set at 150,000 tons/year, only scenarios 5, 6, and 8 generate sufficient ROIs. In the next paragraphs we analyze the
Scenarios
Profit ($) (𝑠𝑠𝑠𝑠𝑠𝑠𝑠𝑠𝑠𝑠 − 𝑠𝑠𝑒𝑒𝑒𝑒𝑠𝑠𝑒𝑒𝑠𝑠𝑠𝑠𝑠𝑠)
Profit margin ($/AMT) (𝑠𝑠𝑠𝑠𝑠𝑠𝑠𝑠𝑠𝑠𝑒𝑒𝑠𝑠 𝑒𝑒𝑝𝑝𝑠𝑠𝑝𝑝𝑠𝑠 − 𝑢𝑢𝑒𝑒𝑠𝑠𝑢𝑢 𝑝𝑝𝑐𝑐𝑠𝑠𝑢𝑢)
ROI (%) � 𝑃𝑃𝑃𝑃𝑃𝑃𝑃𝑃𝑃𝑃𝑃𝑃𝐼𝐼𝐼𝐼𝐼𝐼𝐼𝐼𝐼𝐼𝑃𝑃𝐼𝐼𝐼𝐼𝐼𝐼𝐼𝐼𝑃𝑃
�
50,000 tons/year (t/y)
100,000 t/y 150,000 t/y 50,000 t/y
100,000 t/y
150,000 t/y
50,000 t/y
100,000 t/y
150,000 t/y
Scenario 1 -268,598 -1,424,276* - -5.37 -14.24 - -2.69% -8.90% -
Scenario 2 204,335 -410,094 - 4.09 -4.10 - 2.04% - 2,56% -
Scenario 3 412,179 906,346 618,639 8.24 9.06 4.12 4.67% 5.66% 3.09%
Scenario 4 2,016,025 1,518,396 292,724 40.32 15.18 1.95 20.16% 9.49% 1.46%
Scenario 5 2,169,150 2,196,957 1,481,905 43.38 21.97 9.88 21.69% 13.73% 7.41%
Scenario 6 2,273,334 2,985,685 3,082,441 45,47 29.86 20.55 22.73% 18.66% 15.41%
Scenario 7** 773,334 -14,314 - 15.47 -0.14 - 7.73% -0.09% -
Scenario 8*** 3,773,334 5,985,685 7,582,441 75.47 59.86 50.55 37.73% 37.41% 37.91%
Woody Biomass Supply Chain Development in Eastern Canada: A Case Study in Québec
CIRRELT-2016-24 15

operating conditions which ensure profitability for the three production capacities (50,000 tons/year, 100,000 tons/year and 150,000 tons/year) and identify the best ROI obtained and the associated pellet mill production capacity.
• When the woody biomass harvested in the forest is used as the only source of raw material (i.e., sawdust and shavings are not used), and the pellet selling price is set to $200/ton, the best acceptable ROI (5.66%) is generated when the production capacity is set to 100,000 tons/year (the other production capacities don’t generate sufficient ROIs as shown in table 7). In this case, the following cost reduction mechanisms must be established (i.e., conditions under scenario 3): - Harvesting costs (i.e., forest road construction and maintenance cost and supervision,
planning, logging camp management) are shared among the LOs and the future pellet mill owner.
- Cutting right fees are $0.10/m3 for all biomass sources. - A 100% reimbursable tax credit is granted by the government for road construction and
maintenance (road cost portion attributable to biomass harvesting).
• For the same selling price of $200/AMT, the ROI could be increased by using conjointly sawdust/shavings and woody biomass harvested from the forest. While a production capacity of 150,000 tons/year does not generate a sufficient ROI (1.46% only), the production capacities of 50,000 tons/year and 100,000 tons/y generate, respectively, ROIs of 20.16% and 9.49%. A 50,000 ton capacity mill is therefore more profitable than one of 100,000 tons. Indeed, the available quantity of sawdust/shavings (32,500 AMT) at $50/AMT fulfills 65% of the need of the 50,000 tons/year mill compared to only 33% of the need for the 100,000 tons/year mill. The rest of the feedstock is harvested in the forest which costs more and significantly reduces the profit generated by the 100,000 ton mill compared to the 50,000 ton mill. This explains the high ROI obtained when the mill capacity is set at 50,000 tons. However, these ROIs are obtained without setting any cost reduction mechanism (i.e., conditions under scenario 4), which is unrealistic given that the two LOs already operate in the FMUs in which the biomass will be harvested. As mentioned before, harvesting costs would be shared between the LOs and the pellet mill owner. We use this scenario as a basis to assess the impact of introducing different cost reduction mechanism on the profitability of the wood pellet supply chain. - When harvesting costs are shared among the LOs and the future pellet mill owner (i.e.
condition under scenario 5), a 150,000 ton capacity mill becomes profitable, with a 7.41% ROI while both ROIs generated by the production capacities of 50,000 tons/y and 100,000 tons/y are improved (21.69% and 13.73%, respectively). Thus, 50,000 tons/year is the best production capacity.
- If in addition to harvesting cost sharing, financial support is granted by government (i.e., conditions under scenario 6; that is cutting right fees are the same as for harvest residues and the portion of forest road construction and maintenance cost attributable to biomass harvesting is 100% reimbursed), ROIs increase for all three production capacities (see table 7). The best ROI is generated by the production capacity of 50,000 (22.73%). However, in this case, because the government has to grant financial support, it could require from the promoter that a larger pellet mill size (100,000 or 150,000 tons) is built to promote job creation for example.
Woody Biomass Supply Chain Development in Eastern Canada: A Case Study in Québec
16 CIRRELT-2016-24
• When the selling price is set to $170/AMT (i.e. conditions under scenario 7), the wood pellet supply chain is profitable only if the production capacity is fixed at 50,000 tons. The ROI generated is 7.73%. The operating conditions are as follows (i.e., conditions under scenario 7): - The raw material is composed of a mix of sawdust/shavings and woody biomass harvested
form the forest. - The harvesting costs are shared with the LOs. - Financial support is granted by the government.
Finally, under the same conditions, but with a selling price set to $230/AMT (i.e., conditions under scenario 8), the wood pellet supply chain is profitable for all production capacities (see table 7). The best ROI is obtained for the production capacity of 50,000 tons/year (37.73% ROI).
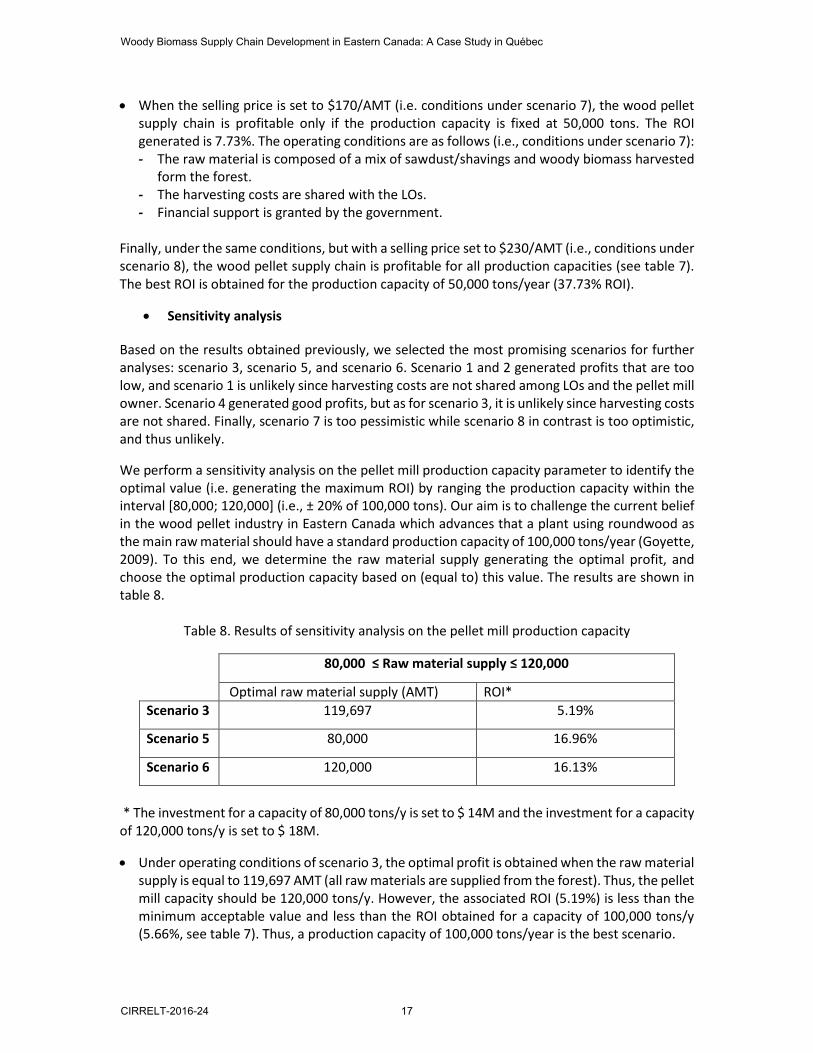
• Sensitivity analysis
Based on the results obtained previously, we selected the most promising scenarios for further analyses: scenario 3, scenario 5, and scenario 6. Scenario 1 and 2 generated profits that are too low, and scenario 1 is unlikely since harvesting costs are not shared among LOs and the pellet mill owner. Scenario 4 generated good profits, but as for scenario 3, it is unlikely since harvesting costs are not shared. Finally, scenario 7 is too pessimistic while scenario 8 in contrast is too optimistic, and thus unlikely.
We perform a sensitivity analysis on the pellet mill production capacity parameter to identify the optimal value (i.e. generating the maximum ROI) by ranging the production capacity within the interval [80,000; 120,000] (i.e., ± 20% of 100,000 tons). Our aim is to challenge the current belief in the wood pellet industry in Eastern Canada which advances that a plant using roundwood as the main raw material should have a standard production capacity of 100,000 tons/year (Goyette, 2009). To this end, we determine the raw material supply generating the optimal profit, and choose the optimal production capacity based on (equal to) this value. The results are shown in table 8.
Table 8. Results of sensitivity analysis on the pellet mill production capacity
* The investment for a capacity of 80,000 tons/y is set to $ 14M and the investment for a capacity of 120,000 tons/y is set to $ 18M.
• Under operating conditions of scenario 3, the optimal profit is obtained when the raw material supply is equal to 119,697 AMT (all raw materials are supplied from the forest). Thus, the pellet mill capacity should be 120,000 tons/y. However, the associated ROI (5.19%) is less than the minimum acceptable value and less than the ROI obtained for a capacity of 100,000 tons/y (5.66%, see table 7). Thus, a production capacity of 100,000 tons/year is the best scenario.
80,000 ≤ Raw material supply ≤ 120,000
Optimal raw material supply (AMT) ROI* Scenario 3 119,697 5.19%
Scenario 5 80,000 16.96%
Scenario 6 120,000 16.13%
Woody Biomass Supply Chain Development in Eastern Canada: A Case Study in Québec
CIRRELT-2016-24 17

• Under operating conditions of scenario 5, the optimal raw material supply is equal to 80,000 AMT. The quantity of raw material supplied from the forest is equal to 47,500 AMT and all available sawdust and shavings (32,400 AMT) is used. The production capacity should be 80,000 tons/y. The associated ROI (16.96%) is better than the ROI obtained for a capacity of 100,000 tons/y (13.73%, see table 7) but lesser that the ROI obtained for a production capacity of 50,000 tons/y (21.69%). Therefore, the best production capacity is 50,000 tons/year.
• Finally, under operating conditions of scenario 6, the optimal raw material supply is equal to 120,000 AMT. 87,500 AMT of it is supplied from the forest and the rest is supplied from the sawmill (sawdust/shavings). The pellet mill capacity should be 120,000 tons/y. The generated ROI is 16.13%, which is less than the ROIs obtained for both capacities of 100,000 tons/y and 50,000 tons/y (18.66% and 22.73%, respectively, see table 7). The best production capacity is 50,000 tons/year.
Table 9 summarizes the operating conditions under which wood pellet production is profitable, and specifies the associated production capacities and ROIs generated.
Table 9. Operating conditions ensuring the profitability of the wood pellet supply chain
6. Conclusion This article studies the potential of forest biomass development in Eastern Québec for wood pellet production. We adopted a downstream to upstream perspective and analyzed the entire wood pellet supply chain, integrated with the existing forest products supply chain in the region under study. Different biomass sources ranging from wood species unsuited for traditional forest
Operating conditions
Production capacity (t/y)
ROI
Selling price = $200/ton Raw material sources: mix of different wood biomass types harvested in the forest
• Harvesting costs are equally shared between the pellet mill and LOs
• Two types of governmental supports are granted: - Cutting right fees are set to $0.10/m3 - The portion of the road cost attributable to biomass
harvesting is 100% reimbursed
100,000 5.66%
Raw material sources: mix of different wood biomass types harvested in the forest + sawdust/shavings
• Harvesting costs are equally shared between the pellet mill and LOs
• No governmental support is granted
50,000 21.69%
• Harvesting costs are equally shared between the pellet mill and LOs
• Two types of governmental supports are granted: - Cutting right fees are set to $0.10/m3 - The portion of the road cost attributable to biomass
harvesting is 100% reimbursed
50,000 22.73%
Woody Biomass Supply Chain Development in Eastern Canada: A Case Study in Québec
18 CIRRELT-2016-24

products manufacturing to sawmill residue, were studied. We analyzed several supply strategies and market scenarios to derive the operating conditions ensuring the profitability of the wood pellet supply chain. Moreover, we considered the economies of scale to determine the optimal pellet mill production capacity. The experiments were performed by using LogiLab, a spatially explicit optimization tool. The supply strategies are based on potential harvesting cost sharing among the pellet mill and forest companies and the possibility of taking advantage on government support measures in Québec promoting bioenergy products development.
The results show that it is possible to implement a profitable wood pellet mill in the region by using biomass supplied from the forest as the unique raw material for manufacturing pellets. The ROI that could be generated is around 6%, which is the average value in the Canadian forest sector. The wood pellet mill capacity in this case is 100,000 tons/year. This result is consistent with industrial recommendations in Eastern Canada: a plant using roundwood as the main raw material should have a standard production capacity of 100,000 tons/year (Goyette, 2009). However, two main cost reduction mechanisms should be implemented; harvesting costs must be shared among the pellet mill and other forest companies operating in the same forest areas, and the government must offer a financial support to the pellet mill owner to lower harvesting costs and the raw material costs. If no governmental support is granted, a mix of forest biomass harvested in the forest and sawmill residues must be used as the raw material for manufacturing the wood pellets. An ROI of 22% can be generated, while the production capacity of the pellet mill should be 50,000 tons/year. In case financial support is granted by the government, the ROI increases to 23% while the production capacity should be equal to 50,000 tons/year. However, since the government offers a financial support, it could require a pellet mill of large size to promote local economic development and job creation. A production capacity of 100,000 tons/year would be the best choice in this case with an associated ROI of 19%.
This study excludes the use of harvesting residues (branches and tops) as raw material for manufacturing wood pellets. As mentioned earlier, using this type of biomass would increase the ash content in the wood pellets, which is not suitable. More accurate data on bark content in harvesting residues and other forest biomass sources would be useful to determine the optimal mix of wood biomass sources to use in the raw material. Another aspect to consider is related to spruce budworm-damaged wood availability and location over time, which are subject to uncertainties. Indeed, this wood biomass source results from a natural disturbance, which is difficult to predict over time as the infestation progress and level are very complex phenomena. This uncertainty aspect calls for stochastic approaches. Finally, including social and environmental aspects in the analyses and demonstrating the socio-economic and environmental benefits and challenges associated with establishing a bioenergy products supply chain in Eastern Québec is another interesting research avenue to explore.
Acknowledgements Funding for this project was provided by Conférence régionale des élus de la Côte-Nord and BioFuelNet Canada. We would like to thank M. Charles Warren, M. Denis Villeneuve, M. Paul Labbé, Pr. Évelyne Thiffault, Dr. Nicolas Mansuy, Pr. Mustapha Ouhimmou for their collaboration and constructive comments.
Woody Biomass Supply Chain Development in Eastern Canada: A Case Study in Québec
CIRRELT-2016-24 19

References AECOM - CRIQ (2014). Analyse de l’approvisionnement et du conditionnement de la matière ligneuse pour Gropo FerroAtlàntica. Technical report.
AQPER : Association Québécoise de la Production d’Énergie Renouvelable. http://www.aqper.com/fr/plan-daction-pour-la-valorisation-de-la-biomasse-forestiere-17. Last accessed March 2015.
Arsenault, J. (2010). Global and Canadian Wood Pellet Update. Wood Pellet Association of Canada.
Blom, G. (2009). The Feasibility of a Wood Pellet Plant Using Alternate Sources of Wood Fiber. Bachelor thesis. University of British Columbia, Canada.
BW McCloy & Associates Inc. (2009). NWT Wood Pellet Pre-feasibility Analysis. Pointe-Claire: FPInnovations. Technical report.
Consultants forestiers DGR inc. (2014). Évaluation de l’impact de la récupération d’un massif forestier affecté par la TBE sur les coûts d’approvisionnement forestier : Cas du secteur Pistuacanis, UA 093-51. Exécuté à la PRAN 2013-14 par PF-Résolu. Québec. Technical report.
ÉcoRessources Consultants and EcoTec Consultants (2012). Évaluation économique de la filière de la biomasse forestière destinée aux projets de chaufferies, Québec. Technical report.
Goyette, J. (2009). Établissement d’une usine type de production de granules ou de bûches. Colloque sur la biomasse de la MRC Portneuf. Rivière-à-Pierre; 21 octobre. Roche-Ingénieurs-conseils.
Hughes, N.M., Shahi, C., Pulkki, R. (2014). A Review of the Wood Pellet Supply chain, Modern Value/Supply Chain Management Approaches, and Value/Supply Chain Models. Journal of Renewable Energy. 14 pages.
Lemieux, S., D'Amours, S., Bouchard, M., Ouhimmou, M. (2011). LogiLab: A New Paradigm to Optimize Forest Supply Chains. Optimization days, HEC Montréal, Canada.
Mani, S., Sokhansanj S., Bi, X., Turhollow, A. (2006). Economics of producing fuel pellets from biomass. American Society of Agricultural and Biological Engineers, 22(3), p. 421-426
MFFP (2004). Portrait forestier régional de la Côte-Nord.
Mobini, M. Sowlati, T., Sokhansanj, S. (2013). A simulation model for the design and analysis of wood pellet supply chains. Applied Energy, 111, p. 1239-1249.
Morency, P.O. (2012). Portrait des marchés des granules de bois. Colloque à l’intention des acteurs de développement économique. Lévis, 28 novembre. Groupe granules, QWEB.
MFFP (2014). Aires infestées par la tordeuse des bourgeons de l’épinette au Québec en 2014. Version 1.1. www.mffp.gouv.qc.ca/forets/fimaq/insectes/fimaq-insectes-portrait-releves.jsp
MRNF – CRIQ (2008). Profil des produits forestiers première transformation (granules et bûches de bois densifié).
Woody Biomass Supply Chain Development in Eastern Canada: A Case Study in Québec
20 CIRRELT-2016-24

MRNF – CRIQ (2011). Profil des produits forestiers (technologies de bioénergies à base de biomasse forestière).
Murray, G. (2014). Status Update: Canadian Wood Pellet Industry. Wood Pellet Association of Canada. http://www.pellet.org/.
Mansuy, N., Thiffault, E., Lemieux, S., Manka, F., Paréa, D., Lebel, L. (2015). Sustainable biomass supply chains from salvage logging of fire-killed stands: A case study for wood pellet production in eastern Canada. Applied Energy, 154, p. 62 - 73.
Peng, J.H., Bi, H.T., Sokhansanjm, S., Lim, J.C., Melin, S. (2010). An Economicaland Market Analysis of Canadian Wood Pellets. International Journal of Green Energy, 7(2), p. 128-142.
PFI : Pellet Fuels Institute (2011). Pellet Fuels Institute Standard Specification for Residential/Commercial Densified Fuel - June 1st. http://www.pelletheat.org/. Last accessed March 2015.
Sénéchal, S., Grassi, G. (2009). Logistic management of wood pellets: Data collection on transportation, storage and delivery management. Brussels (Belgium): EUBIA – European Biomass Industry Association.
Statistics Canada (2007). http://www.ccfm.org/ci/rprt2005/English/pdf/5.3b.pdf
Thek, G., Obernberger, I. (2004). Wood pellet production costs under Austrian and in comparison to Swedish framework conditions. Biomass & Bioenergy, 27, p. 671-693.
Uasuf, A., Becker, G. (2011). Wood pellets production costs and energy consumption under different framework conditions in Northeast Argentina. Biomass & Bioenergy, 35(3), p. 1357-1366.
Urbanowski, E. (2005). Strategic Analysis of a Pellet Fuel Opportunity in Northwest British Columbia. Master’s thesis. Simon Fraser University, Canada.
WPAC: Wood Pellet Association of Canada. http://www.pellet.org/. Last accessed January 2016.
Wolf, A., Vidlund, A., Andersson, E. (2006). Energy-efficient pellet production in the forest industry - a study of obstacles and success factors. Biomass & Bioenergy, 30(1), p.38-45.
Yemshanov, D., McKenney, D.W., Fraleigh, S., McConkey, B., Huffman, T., Smith, S. (2014). Cost estimates of post harvest forest biomass supply for Canada. Biomass & Bioenergy, 69, p. 80-94.
Woody Biomass Supply Chain Development in Eastern Canada: A Case Study in Québec
CIRRELT-2016-24 21

Appendix Mathematical formulation of the optimization model implemented in LogiLab
• Sets and indices 𝑇𝑇 Set of time periods 𝑈𝑈 Set of business units 𝐾𝐾 Set of capacity types (production and storage) 𝑊𝑊 Set of processes (production and storage) 𝑊𝑊𝑃𝑃𝑡𝑡 ⊂ 𝑊𝑊 Set of processes available at business unit 𝑢𝑢 at period 𝑢𝑢 𝑃𝑃 Set of products 𝐸𝐸 Set of existing links (edges) between business units 𝛿𝛿𝑡𝑡+ ⊂ 𝐸𝐸 Set of edges incidents to 𝑢𝑢 𝛿𝛿𝑡𝑡− ⊂ 𝐸𝐸 Set of edges extending from 𝑢𝑢
• Decision variables
𝑌𝑌𝑤𝑤𝑡𝑡𝑃𝑃 Quantity of process 𝑤𝑤 used at business unit 𝑢𝑢 at period 𝑢𝑢 𝐷𝐷𝑝𝑝𝑡𝑡𝑃𝑃 Quantity of product 𝑒𝑒 sold at business unit 𝑢𝑢 at period 𝑢𝑢 𝐹𝐹𝑝𝑝𝐼𝐼𝑃𝑃 Flow of product 𝑒𝑒 on edge 𝑠𝑠 at period 𝑢𝑢
• Parameters 𝑞𝑞𝑘𝑘𝑡𝑡𝑃𝑃 Quantity of capacity type 𝑘𝑘 available at business unit 𝑢𝑢 at period 𝑢𝑢 𝑓𝑓𝑝𝑝𝐼𝐼𝑃𝑃𝑙𝑙 Minimum flow of product 𝑒𝑒 on edge 𝑠𝑠 at period 𝑢𝑢 𝑓𝑓𝑝𝑝𝐼𝐼𝑃𝑃𝑡𝑡 Maximum flow of product 𝑒𝑒 on edge 𝑠𝑠 at period 𝑢𝑢 𝑓𝑓𝐼𝐼𝑃𝑃𝑙𝑙 Minimum flow of all products on edge 𝑠𝑠 at period 𝑢𝑢 𝑓𝑓𝐼𝐼𝑃𝑃𝑡𝑡 Maximum flow of all products on edge 𝑠𝑠 at period 𝑢𝑢 𝑝𝑝𝑤𝑤 Cost of using process 𝑤𝑤 𝑝𝑝𝑝𝑝𝐼𝐼𝑃𝑃𝑃𝑃 Cost of transporting product 𝑒𝑒 on edge 𝑠𝑠 at period 𝑢𝑢 𝑠𝑠𝑝𝑝𝐼𝐼𝑃𝑃 Transportation time of product 𝑒𝑒 on edge 𝑠𝑠 at period 𝑢𝑢 𝑠𝑠𝑤𝑤 Time required for manufacturing product 𝑒𝑒 with process 𝑤𝑤 𝛼𝛼𝑝𝑝𝑤𝑤 Quantity of input product 𝑒𝑒 required by process 𝑤𝑤 𝛾𝛾𝑝𝑝𝑤𝑤 Quantity of output product 𝑒𝑒 manufactured by process 𝑤𝑤 𝜆𝜆𝑘𝑘𝑡𝑡𝑤𝑤 Quantity of capacity type 𝑘𝑘 at business unit 𝑢𝑢 consumed by process 𝑤𝑤 𝑑𝑑𝑝𝑝𝑡𝑡𝑃𝑃 Demand of product 𝑒𝑒 at business unit 𝑢𝑢 at period 𝑢𝑢 𝜌𝜌𝑝𝑝𝑡𝑡𝑃𝑃 Selling value of product 𝑒𝑒 at business unit 𝑢𝑢 at period 𝑢𝑢
• Objective function
𝑚𝑚𝑠𝑠𝑒𝑒 ∑ �∑ �∑ 𝜌𝜌𝑝𝑝𝑡𝑡𝑃𝑃𝐷𝐷𝑝𝑝𝑡𝑡𝑃𝑃𝑝𝑝∈𝑃𝑃│𝑑𝑑𝑝𝑝𝑝𝑝𝑝𝑝>0− ∑ 𝑝𝑝𝑤𝑤𝑤𝑤∈𝑊𝑊𝑝𝑝𝑝𝑝 𝑌𝑌𝑤𝑤𝑡𝑡𝑃𝑃�𝑤𝑤∈𝑊𝑊 − ∑ �∑ 𝑝𝑝𝑝𝑝𝐼𝐼𝑃𝑃
𝑃𝑃 𝐹𝐹𝑝𝑝𝐼𝐼𝑃𝑃𝑝𝑝∈𝑃𝑃 �𝐼𝐼∈𝐸𝐸 �𝑃𝑃∈𝑇𝑇 (1)
Woody Biomass Supply Chain Development in Eastern Canada: A Case Study in Québec
22 CIRRELT-2016-24

• Constraints
∑ �∑ 𝛾𝛾𝑝𝑝𝑤𝑤𝑤𝑤∈𝑊𝑊𝑝𝑝𝑝𝑝│𝑃𝑃1+𝐼𝐼𝑤𝑤=𝑃𝑃𝑌𝑌𝑤𝑤𝑡𝑡𝑃𝑃1�𝑃𝑃1∈𝑇𝑇 + ∑ �∑ 𝐹𝐹𝑝𝑝𝐼𝐼𝑃𝑃2𝑃𝑃2∈𝑇𝑇│𝑃𝑃2+𝑙𝑙𝑝𝑝𝑝𝑝𝑝𝑝2=𝑃𝑃
� − ∑ 𝛼𝛼𝑝𝑝𝑤𝑤𝑤𝑤∈𝑊𝑊𝑝𝑝𝑝𝑝 𝑌𝑌𝑤𝑤𝑡𝑡𝑃𝑃 −𝐼𝐼∈𝛿𝛿𝑝𝑝+
∑ 𝐹𝐹𝑝𝑝𝐼𝐼𝑃𝑃𝐼𝐼∈𝛿𝛿𝑝𝑝− − 𝐷𝐷𝑝𝑝𝑡𝑡𝑃𝑃 = 0 ∀ 𝑢𝑢 ∈ 𝑇𝑇, ∀ 𝑢𝑢 ∈ 𝑈𝑈, ∀ 𝑒𝑒 ∈ 𝑃𝑃 (2) 𝐷𝐷𝑝𝑝𝑡𝑡𝑃𝑃 ≤ 𝑑𝑑𝑝𝑝𝑡𝑡𝑃𝑃 ∀ 𝑢𝑢 ∈ 𝑇𝑇, ∀ 𝑢𝑢 ∈ 𝑈𝑈, ∀ 𝑒𝑒 ∈ 𝑃𝑃 (3) ∑ 𝜆𝜆𝑘𝑘𝑡𝑡𝑤𝑤𝑤𝑤∈𝑊𝑊𝑝𝑝𝑝𝑝 𝑌𝑌𝑤𝑤𝑡𝑡𝑃𝑃 ≤ 𝑞𝑞𝑘𝑘𝑡𝑡𝑃𝑃 ∀ 𝑢𝑢 ∈ 𝑇𝑇, ∀ 𝑢𝑢 ∈ 𝑈𝑈, ∀ 𝑘𝑘 ∈ 𝐾𝐾 (4) 𝑓𝑓𝐼𝐼𝑃𝑃𝑙𝑙 ≤ ∑ 𝐹𝐹𝑝𝑝𝐼𝐼𝑃𝑃 ≤𝑝𝑝∈𝑃𝑃 𝑓𝑓𝐼𝐼𝑃𝑃𝑡𝑡 ∀ 𝑢𝑢 ∈ 𝑇𝑇, ∀ 𝑠𝑠 ∈ 𝐸𝐸 (5) 𝑓𝑓𝑝𝑝𝐼𝐼𝑃𝑃𝑙𝑙 ≤ 𝐹𝐹𝑝𝑝𝐼𝐼𝑃𝑃 ≤ 𝑓𝑓𝑝𝑝𝐼𝐼𝑃𝑃𝑡𝑡 ∀ 𝑢𝑢 ∈ 𝑇𝑇, ∀ 𝑠𝑠 ∈ 𝐸𝐸, ∀ 𝑒𝑒 ∈ 𝑃𝑃 (6) 𝐹𝐹𝑝𝑝𝐼𝐼𝑃𝑃, 𝐷𝐷𝑝𝑝𝑡𝑡𝑃𝑃, 𝑌𝑌𝑤𝑤𝑡𝑡𝑃𝑃 ≥ 0 ∀ 𝑢𝑢 ∈ 𝑇𝑇, ∀ 𝑠𝑠 ∈ 𝐸𝐸, ∀ 𝑒𝑒 ∈ 𝑃𝑃, ∀ 𝑤𝑤 ∈ 𝑊𝑊 (7)
Woody Biomass Supply Chain Development in Eastern Canada: A Case Study in Québec
CIRRELT-2016-24 23