WOODSIDE FULL-YEAR PROFIT UP 28% TO … 1 of 2 Woodside Petroleum Ltd. ACN 004 898 962 Mia...
33
ASX Announcement Thursday, 14 February 2019 ASX: WPL OTC: WOPEY Page 1 of 2 Woodside Petroleum Ltd. ACN 004 898 962 Mia Yellagonga 11 Mount Street Perth WA 6000 Australia T +61 8 9348 4000 www.woodside.com.au WOODSIDE FULL-YEAR PROFIT UP 28% TO $1,364 MILLION Woodside has recorded a full-year net profit after tax (NPAT) of $1,364 million. Production was 91.4 MMboe and operating revenue was $5,240 million. The directors have declared a final dividend of US 91 cents per share (cps), bringing the full-year dividend to US 144 cps. Woodside CEO Peter Coleman said that in 2018 the company delivered strong financial results, solid production and significant progress on growth plans. “Our net profit after tax increased 28% year-on-year, driven by robust operational performance throughout 2018 and improved market conditions. “The company generated free cash flow of $1,524 million, up 83% on 2017. This has supported our strong financial liquidity throughout the year and positions us well to deliver our growth projects. “During the year we achieved a number of significant milestones in our plans to develop the Scarborough and Browse fields off Western Australia through our world-class facilities on the Burrup Peninsula. “Our plans for the Burrup Hub will more than double Woodside’s equity LNG production by 2027, providing long-term gas supplies for both domestic and export markets, and delivering significant benefits to shareholders and the community. “After increasing our equity in Scarborough to 75% in early 2018, we assumed operatorship and have awarded engineering contracts for the upstream development. We have selected an expansion concept for Pluto LNG and begun engineering work on the second production train. “At the same time, we have progressed our proposal to process the Browse resources through the North West Shelf Project’s Karratha Gas Plant, achieving a landmark preliminary tolling agreement between the two joint ventures. “In Senegal, we transitioned to operator of SNE, the country’s first offshore oil development. The SNE joint venture has now secured environmental approval and commenced FEED activities for the first phase of the development, targeted for first oil in 2022. “This year we’ve again demonstrated expertise in project delivery, with Greater Western Flank Phase 2 coming in $630 million under budget and six months ahead of schedule. Additional near-term growth was realised as Wheatstone train 2 started up, achieving better-than-expected production and positioning us to achieve our targeted output of approximately 100 million barrels of oil equivalent in 2020. “As we deliver our growth plans, we remain committed to excellence in our base business, which has achieved high reliability and globally competitive cost of production. “The past year has been a busy one for Woodside, but we are looking forward to achieving even more in 2019 when we plan to start production at Greater Enfield and take a final investment decision on SNE. At the same time, we will be preparing for final investment decisions in 2020 on Scarborough, Pluto LNG Train 2 and Browse,” he said. For personal use only
Transcript of WOODSIDE FULL-YEAR PROFIT UP 28% TO … 1 of 2 Woodside Petroleum Ltd. ACN 004 898 962 Mia...

ASX Announcement Thursday, 14 February 2019 ASX: WPL OTC: WOPEY
Page 1 of 2
Woodside Petroleum Ltd. ACN 004 898 962
Mia Yellagonga 11 Mount Street Perth WA 6000 Australia
T +61 8 9348 4000 www.woodside.com.au
WOODSIDE FULL-YEAR PROFIT UP 28% TO $1,364 MILLION
Woodside has recorded a full-year net profit after tax (NPAT) of $1,364 million. Production was 91.4 MMboe and operating revenue was $5,240 million. The directors have declared a final dividend of US 91 cents per share (cps), bringing the full-year dividend to US 144 cps. Woodside CEO Peter Coleman said that in 2018 the company delivered strong financial results, solid production and significant progress on growth plans. “Our net profit after tax increased 28% year-on-year, driven by robust operational performance throughout 2018 and improved market conditions. “The company generated free cash flow of $1,524 million, up 83% on 2017. This has supported our strong financial liquidity throughout the year and positions us well to deliver our growth projects. “During the year we achieved a number of significant milestones in our plans to develop the Scarborough and Browse fields off Western Australia through our world-class facilities on the Burrup Peninsula. “Our plans for the Burrup Hub will more than double Woodside’s equity LNG production by 2027, providing long-term gas supplies for both domestic and export markets, and delivering significant benefits to shareholders and the community. “After increasing our equity in Scarborough to 75% in early 2018, we assumed operatorship and have awarded engineering contracts for the upstream development. We have selected an expansion concept for Pluto LNG and begun engineering work on the second production train. “At the same time, we have progressed our proposal to process the Browse resources through the North West Shelf Project’s Karratha Gas Plant, achieving a landmark preliminary tolling agreement between the two joint ventures. “In Senegal, we transitioned to operator of SNE, the country’s first offshore oil development. The SNE joint venture has now secured environmental approval and commenced FEED activities for the first phase of the development, targeted for first oil in 2022. “This year we’ve again demonstrated expertise in project delivery, with Greater Western Flank Phase 2 coming in $630 million under budget and six months ahead of schedule. Additional near-term growth was realised as Wheatstone train 2 started up, achieving better-than-expected production and positioning us to achieve our targeted output of approximately 100 million barrels of oil equivalent in 2020. “As we deliver our growth plans, we remain committed to excellence in our base business, which has achieved high reliability and globally competitive cost of production. “The past year has been a busy one for Woodside, but we are looking forward to achieving even more in 2019 when we plan to start production at Greater Enfield and take a final investment decision on SNE. At the same time, we will be preparing for final investment decisions in 2020 on Scarborough, Pluto LNG Train 2 and Browse,” he said.
For
per
sona
l use
onl
y

Page 2 of 2
Financial headlines • Increased NPAT by 28% to $1,364 million • Increased operating revenue by 32% to $5,240 million • Increased free cash flow by 83% to $1,524 million • Reduced LNG unit production cost at Pluto LNG and NWS Project to $3.6/boe • Competitive cost of debt at 3.9% • Declared a final dividend of US 91 cps, bringing the full-year dividend to US 144 cps
Key business activities Base business
• Achieved record LNG production rates at Pluto LNG • Recorded second-lowest total recordable injury rate at 1.32 per million work hours • Commissioned the Pluto pipeline gas facility • Delivered the 5,000th LNG cargo from the NWS Project
Near-term growth • Commenced production from Greater Western Flank Phase 2, $630 million under budget (100%
project) and six months ahead of schedule • Commenced production at Wheatstone LNG train 2, with production from trains 1 and 2 exceeding
expectations Burrup Hub
• Acquired increased Scarborough equity and assumed operatorship • Subsequent to the period, awarded contracts for Scarborough front-end engineering design activities
in Woodside’s corporate capacity and funded by Woodside on a 100% basis • Entered FEED for Pluto LNG Train 2 • Commenced concept definition phase for Browse to NWS Project • Signed a non-binding, preliminary tolling agreement between the NWS Project and the Browse Joint
Venture for the processing of gas resources through NWS Project’s KGP • Finalised a long-term domestic gas sale and purchase agreement with Perdaman
Senegal • Assumed operatorship of the SNE development in Senegal and commenced FEED activities • Received approval of the SNE development Environmental and Social Impact Assessment
Full-year results teleconference A teleconference providing an overview of the full-year 2018 results and a question and answer session will be held at 7:30am AWST (10:30am ADST) on 14 February 2019. Investors are encouraged to participate in this event by dialling the numbers listed below and quoting passcode ID: 9369159. For locations within Australia dial toll-free 1800 123 296, or toll 02 8038 5221. International dial-in numbers (toll-free):
Canada 1855 5616 766 China 4001 203 085 Hong Kong 800 908 865 India 1800 2666 836 Japan 0120 994 669 New Zealand 0800 452 782 Singapore 800 616 2288 United Kingdom 0808 234 0757 United States 1855 293 1544
For all other countries or operator assistance, please dial + 61 2 8038 5221. The full-year results briefing pack follows this announcement and will be referred to during the conference call. Contacts: INVESTORS Damien Gare W: +61 8 9348 4421 M: +61 417 111 697 E: [email protected]
MEDIA Christine Forster M: +61 484 112 469 E: [email protected]
For
per
sona
l use
onl
y

14 FEBRUARY 2019
FULL-YEAR 2018RESULTS BRIEFING
For
per
sona
l use
onl
y

Disclaimer and important noticeThis presentation contains forward looking statements that are subject to risk factors associated with oil and gas businesses. It is believed that the expectations reflected in these statements are reasonable as at the date of this presentation but they may be affected by a variety of variables and changes in underlying assumptions which could cause actual results or trends to differ materially, including but not limited to: price fluctuations, actual demand, currency fluctuations, drilling and production results, reserve estimates, loss of market, industry competition, environmental risks, physical risks, legislative, fiscal and regulatory developments, changes in accounting standards, economic and financial market conditions in various countries and regions, political risks, project delay or advancement, approvals and cost estimates. Readers are cautioned not to place undue reliance on these forward looking statements. No representation is made or will be made that any forward looking statements will be achieved or will prove to be correct. We do not undertake to update or revise any forward looking statement, whether as a result of new information, future events or otherwise.
Woodside adopted AASB 15 as of 1 January 2018. Revenue and sales figures, and the resulting impact on other financials metrics, have been restated accordingly for all comparative periods within this presentation. Refer to Note E.10(b) on page 133 of the Annual Report 2018 for further information.
All references to dollars, cents or $ in this presentation are to US currency, unless otherwise stated.
References to “Woodside” may be references to Woodside Petroleum Ltd or its applicable subsidiaries.
Cover page image: Pluto LNG onshore processing facility, loading LNG for export. Expansion of Pluto LNG is a key component of Woodside’s plans to develop the Scarborough gas resource.
INTRODUCTION
2Full-Year 2018 Results Briefing | 14 February 2019
For
per
sona
l use
onl
y

Financial headlinesOVERVIEW
3Full-Year 2018 Results Briefing | 14 February 2019
$1,364 $3,296 $1,524Net profit after tax Operating cash flow Free cash flow
million million million
12%$3.9 144
Gearing Liquidity 2018 dividend
as at 31 December 2018 as at 31 December 2018
US
cent
spe
r sh
are
billi
on
47% INCREASEFor
per
sona
l use
onl
y

1. 100% project.
Outstanding base business performanceOVERVIEW
4Full-Year 2018 Results Briefing | 14 February 2019
5.0 1.32
PRODUCTION
TOTAL RECORDABLE INJURY RATE
8% INCREASE
PER MILLION WORK HOURS 88-94
$3.6/BOE$5.2LNG UNIT
PRODUCTION COSTOPERATING REVENUE
PLUTO LNG, NWS PROJECT
MMbo
e
PLUTO LNG2019 PRODUCTION
GUIDANCE
billion
32% INCREASE
MMbo
e
91.4
5% INCREASE
million
tonn
es1
For
per
sona
l use
onl
y

1. As at 31 December 2018.2. Targeted production is not guidance.
Based on current project schedules.
Near-term growth deliveredOVERVIEW
5Full-Year 2018 Results Briefing | 14 February 2019
✓ Production from LNG trains 1 and 2 exceeding expectations
✓ Construction of domestic gas plant completed Q4 2018
✓ Commenced production October 2018
✓ Delivered six months ahead of schedule and $630 million under budget (100% project)
+ 83% complete1
+ Targeting first oil mid-2019
+ Expected to contribute over 10 MMboe in 2020
WHEATSTONE GREATER WESTERN FLANK PHASE 2 GREATER ENFIELD
Targeting ~100 MMboe annual production in 20202
For
per
sona
l use
onl
y

+ Increased Scarborough equity to 75%
+ Assumed operatorship
+ Awarded contracts for Scarborough front-end engineering design activities1
+ Entered FEED for Pluto LNG Train 2
+ Commenced concept definition phase
+ Agreed preliminary tolling arrangement
+ Referred the project for State and Commonwealth environmental approvals
+ Assumed operatorship
+ Commenced FEED activities
+ Submitted field development and exploitation plan
1. Subsequent to the period. Contracts awarded by Woodside in its corporate capacity and funded by Woodside on a 100% basis.
Horizon II growthOVERVIEW
6Full-Year 2018 Results Briefing | 14 February 2019
SCARBOROUGH AND PLUTO LNG TRAIN 2 BROWSE TO NWS PROJECT SNE PHASE 1
For
per
sona
l use
onl
y

6
3
6
4
8
5
3.00
1.901.71 1.64
1.29
1.32
0.00
0.50
1.00
1.50
2.00
2.50
3.00
3.50
0
2
4
6
8
10
12
14
2013 2014 2015 2016 2017 2018
Inju
ries
(#)
TRIR
per
mill
ion
wor
k ho
urs
Woodside LTI (RHS)Woodside TRIR (LHS)IOGP top-quartile TRIR (LHS)²
Safety
+ Second-best result on record
+ Safety performance driven by:
+ ‘Perfect HSE day’
+ Strengthened safety culture
+ Ongoing process safety management
focus
+ APPEA Safety Excellence Award
Lost time injuries (LTI) and total recordable injury rate (TRIR)
1. Per million work hours. WA mining data provided by the Department of Mines, Industry Regulation and Safety. WA mining industry figure based on a12-month rolling average from November 2017 to October 2018.
2. International Association of Oil and Gas Producers. 2018 data not available.
OVERVIEW
7Full-Year 2018 Results Briefing | 14 February 2019
Lost time injury frequency1
0.29Woodside
2.08WA mining
For
per
sona
l use
onl
y

Increased demand for long-term contracts
+ Significant increase in long-term LNG
contracts signed
+ 53% of long-term sales signed from
unsanctioned projects2
+ 40% increase in Chinese LNG demand3
+ Market expectation of tightening supply
Global mid- to long-term LNG contracts1
1. LNG contracts with durations of six years or more.
2. Based on contracted volume. 3. Source: Wood Mackenzie, Q4 LNG.
OVERVIEW
8Full-Year 2018 Results Briefing | 14 February 2019
Source: IHS Markit
0
5
10
15
20
25
30
35
40
2015 2016 2017 2018
Mtp
a
Sale and purchase agreement Heads of agreement
For
per
sona
l use
onl
y

Conceptual image, not to scale. Developments are subject to joint venture approvals, regulatory approvals and relevant commercial arrangements.
Creating the Burrup HubGROWTH
9Full-Year 2018 Results Briefing | 14 February 2019
SCARBOROUGH
BROWSE
PLUTO LNG NWS PROJECT
PLUTO-NWS INTERCONNECTOR
Future development of the Jupiter and Thebe fields, and other gas resources
PLUTO ANORTH RANKIN
COMPLEX
For
per
sona
l use
onl
y

2019
Scarborough and Pluto LNG Train 2
FID and RFSU dates are targets.
2019 targets:
+ Scarborough FEED activities
+ Scarborough gas processing
agreements
+ Pluto LNG Train 2 FEED activities
+ Finalise the Scarborough Development
Agreement with WA Government
GROWTH
10Full-Year 2018 Results Briefing | 14 February 2019
Fully delineated resource
Increased Scarborough equity interest
Commenced LNG Pluto Train 2 FEED
Operatorship
Awarded contracts for Scarborough front-end
engineering design activities
ScarboroughRFSU 2023
Pluto LNG Train 2RFSU 2024
ACHI
EVED
Domestic gas portfolio sales
agreements
FID 2020
Progress environmental
approvalsScarborough FEED
For
per
sona
l use
onl
y

Browse to NWS Project
FID and RFSU dates are targets.
2019 targets:
+ Execute gas processing agreement
+ Reserve NWS capacity
+ Commence FEED activities
+ Finalise the Browse Development
Agreement with the WA Government
GROWTH
11Full-Year 2018 Results Briefing | 14 February 2019
Commenced concept definition
Non-binding preliminary tolling agreement
ACHI
EVED
Fully delineated resource
FID late 2020
Progress environmental
approvalsCommence FEED
Binding, fully-termed gas processing agreement
2019
Calliance and BrecknockFPSO RFSU 2026
Torosa FPSORFSU 2027
For
per
sona
l use
onl
y

SNE Field Development Phase 1
First oil date is a target.
2019 targets:
+ FEED activities
+ Project financing
+ Final investment decision
+ Commence project execution
GROWTH
12Full-Year 2018 Results Briefing | 14 February 2019
Well appraised resource
ESIA approved
FEED activities commenced
Exploitation plan submitted
OperatorshipACHI
EVED
Execute phase activities
Final investment decision
First oil 2022
2019
For
per
sona
l use
onl
y

FINANCIAL UPDATEFor
per
sona
l use
onl
y

Financial headlinesFINANCIAL UPDATE
14Full-Year 2018 Results Briefing | 14 February 2019
NPAT $1,364 m up 28%
Underlying NPAT $1,416 m up 32%
Free cash flow $1,524 m up 83%
Full-year dividend 144 cps up 47%
Gearing 12% down 50%For
per
sona
l use
onl
y

NPAT reconciliation
1,069
863
286 (263)
(99)(194)
(298)
1,364
0
500
1,000
1,500
2,000
2,500
2017
NPA
T
Sale
s re
venu
e: p
rice¹
Sale
s re
venu
e: v
olum
e
Dep
reci
atio
n²
Net
fina
nce
cost
s
Taxa
tion
Oth
er³
2018
NPA
T
$ m
illio
n
1. Includes foreign exchange impact. 2. Depreciation and amortisation for oil and
gas properties. 3. Other predominantly includes exploration
and evaluation, provision releases, and costs of production.
+ Increased sales revenue due to higher
realised prices and increased sales
volume
+ Higher costs and depreciation
associated with a full-year of
Wheatstone production
FINANCIAL UPDATE
15Full-Year 2018 Results Briefing | 14 February 2019
For
per
sona
l use
onl
y

Production cost
+ Pluto and NWS LNG unit production cost
of $3.6/boe
+ 8% reduction in Pluto LNG unit cost
+ Start up of Wheatstone
FINANCIAL UPDATE
16Full-Year 2018 Results Briefing | 14 February 2019
639
472 443
465
6.9
5.0 5.2 5.1
-
1.0
2.0
3.0
4.0
5.0
6.0
7.0
-
100
200
300
400
500
600
700
2015 2016 2017 2018
$/bo
e
$ m
illio
n
Total (LHS) Unit (RHS)
For
per
sona
l use
onl
y

Profitability
+ 21% increase in gross margin
+ Gross profit of $2.6 billion, up 31%
FINANCIAL UPDATE
17Full-Year 2018 Results Briefing | 14 February 2019
GROSS MARGIN
28.8$/boe
DEPRECIATION
15.7$/boe
22%
28%
50%
PRODUCTION AND OTHER COSTS
12.8$/boe
For
per
sona
l use
onl
y

4 4 7
28
5
8 3
4
2
5
35 51
49
41
44
-
10
20
30
40
50
60
70
80
NWS Gas(36%)¹
Pluto(49%)
Wheatstone(10%)
Aus Oil(5%)¹
Group(100%)
$/bo
e
Production costs Other cash costs Cash margin²
Sales volume:
Strong cash margins from portfolio
1. Other cash costs includes royalties and excise.
2. Gross profit net of other revenue, oil and gas properties depreciation and amortisation, inventory movement, trading costs and other hydrocarbon costs, divided by sales revenue.
+ Low cash costs across LNG portfolio
+ 82% cash margin for Wheatstone
+ Australia Oil unit cash costs impacted by:
+ Nganhurra FPSO cessation of
production
+ Greater Enfield project
FINANCIAL UPDATE
18Full-Year 2018 Results Briefing | 14 February 2019
For
per
sona
l use
onl
y

Debt maturity profile
0
300
600
900
1,200
2019 2020 2021 2022 2023 2024 2025 2026 2027 2028 2029
$ m
illio
n
Drawn debt Undrawn debt
+ Preparation of debt portfolio for growth
+ Gearing reduced to 12%:
+ Early redemption of a ten year
$600 million 144A unsecured bond
+ Cancellation of multiple bilateral
facilities totalling $700 million
+ Competitive portfolio cost of debt of
3.9%
+ Ongoing active management of debt
portfolio in 2019
FINANCIAL UPDATE
19Full-Year 2018 Results Briefing | 14 February 2019
For
per
sona
l use
onl
y

Dividend
1. Calculated as the full-year dividend (converted to AUD) divided by share price as at 31 December 2018.
+ Strong distributions to shareholders
+ Dividend yield of 6.4%1
FINANCIAL UPDATE
20Full-Year 2018 Results Briefing | 14 February 2019
109
83
98
14454
45
54
71
0
10
20
30
40
50
60
70
80
0
20
40
60
80
100
120
140
160
180
200
2015 2016 2017 2018
$/bb
l
cps
Full-year dividends (LHS) Annual average dated brent (RHS)
For
per
sona
l use
onl
y

1. Growth includes Scarborough, Pluto LNG Train 2, Browse to NWS Project, SNE Field Development (Senegal), Myanmar, Kitimat and other spend.
2. Base business includes Pluto LNG, Pluto-NWS Interconnector, NWS Project, Australia Oil and Corporate.
3. Liquids includes oil and condensate. Nganhurra FPSO production ceased November 2018.
4. Includes NWS, Pluto and Wheatstone.5. Other includes LPG and other pipeline
gas.
2019 guidanceFINANCIAL UPDATE
21Full-Year 2018 Results Briefing | 14 February 2019
0
1,000
2,000
2018 2019E
$ m
illio
n
ScarboroughacquisitionExploration
Growth¹
Wheatstone
Greater Enfield
Base business²
Investment expenditure
Production
Growth investment spend
2019 guidance
LNG MMboe 70 – 73
Liquids3MMboe 13 – 16
Australian pipeline gas4MMboe 4
Other5MMboe 1
Total MMboe 88 – 94
~28%
~26%~15%
~13%
~18%
Pluto Train 2
Scarborough
Senegal
Browse to NWS Project
Other
For
per
sona
l use
onl
y

SUMMARYFor
per
sona
l use
onl
y

2019+ LNG market
+ Long-term buyers returning
+ Asian growth driven by clean air policies
and urbanisation
+ European growth driven by rising carbon
prices and declining domestic supply
+ Additional ~230 Mtpa supply required by
2030 above 2018 levels
LNG forecast demand
SUMMARY
23Full-Year 2018 Results Briefing | 14 February 2019
Source: Wood Mackenzie, Q4 LNG
0
100
200
300
400
500
600
2015 2018 2021 2024 2027 2030
Mtp
a
Japan, Korea and Taiwan China Developing Asia Europe Other
For
per
sona
l use
onl
y

Pioneer of Australian LNG
0
20
40
60
80
2009 2012 2015 2018
MM
boe
Woodside equity LNG production
+ 235% increase in LNG production since
2009
+ Production from 8 LNG trains
+ Low cost, high margin producer
SUMMARY
24Full-Year 2018 Results Briefing | 14 February 2019
For
per
sona
l use
onl
y

2019 prioritiesSUMMARY
25Full-Year 2018 Results Briefing | 14 February 2019
+ FID
+ Commence project execution
SCARBOROUGH
+ Execute FEED activities
+ Prepare for 2020 FID
PLUTO TRAIN 2
+ Execute FEED activities
+ Prepare for 2020 FID
+ Execute binding, gas processing agreement
+ Commence FEED activities
+ Prepare for late 2020 FID
GREATER ENFIELD
+ First oil mid-2019
WHEATSTONE
+ Commence domestic gas production
+ Support reduction in operating costs
SNE PHASE 1 SCARBOROUGH AND PLUTO LNG TRAIN 2 BROWSE NEAR-TERM GROWTH
For
per
sona
l use
onl
y

ANNEXUREFor
per
sona
l use
onl
y

84.4
8.7
3.1 (2.5)
(2.7)
0.4 91.4
70
75
80
85
90
95
100
2017 production Wheatstone Assetperformance¹
Fulfilment ofDGJV²
Greater Enfield³ Other⁴ 2018production
MM
boe
Equity production reconciliation
1. Asset performance includes reliability, availability, utilisation, capacity and weather.
2. Woodside equity share of NWS domestic gas and associated condensate in the Domestic Gas Joint Venture (DGJV) was 50%. The DGJV production entitlement was fulfilled on 8 May 2017. Woodside’s share of NWS domestic gas and associated condensate following fulfillment of the DGJV production entitlement is 16.67%.
3. Ngujima-Yin FPSO offstation for modifications.
4. Other predominantly includes cessation of production and domestic gas accounting changes.
ANNEXURE
27Full-Year 2018 Results Briefing | 14 February 2019
For
per
sona
l use
onl
y

1. 2017 comparatives have been restated for the adoption of the sales method and impact of AASB 15.
Realised priceANNEXURE
28Full-Year 2018 Results Briefing | 14 February 2019
Products2018($/boe)
20171
($/boe)Variance
(%)
Revenue impact ($ million)
NWS LNG 48 38 26 225
Pluto LNG 57 47 21 372
Wheatstone LNG 59 45 31 99
Pipeline gas 15 20 (25) (24)
Condensate 71 55 29 126
Oil 71 56 27 62
LPG 69 60 15 3
Volume-weighted average 54 44 23 863
Average Dated Brent 71 54 31
Average 3-month lagged JCC 68 51 33For
per
sona
l use
onl
y
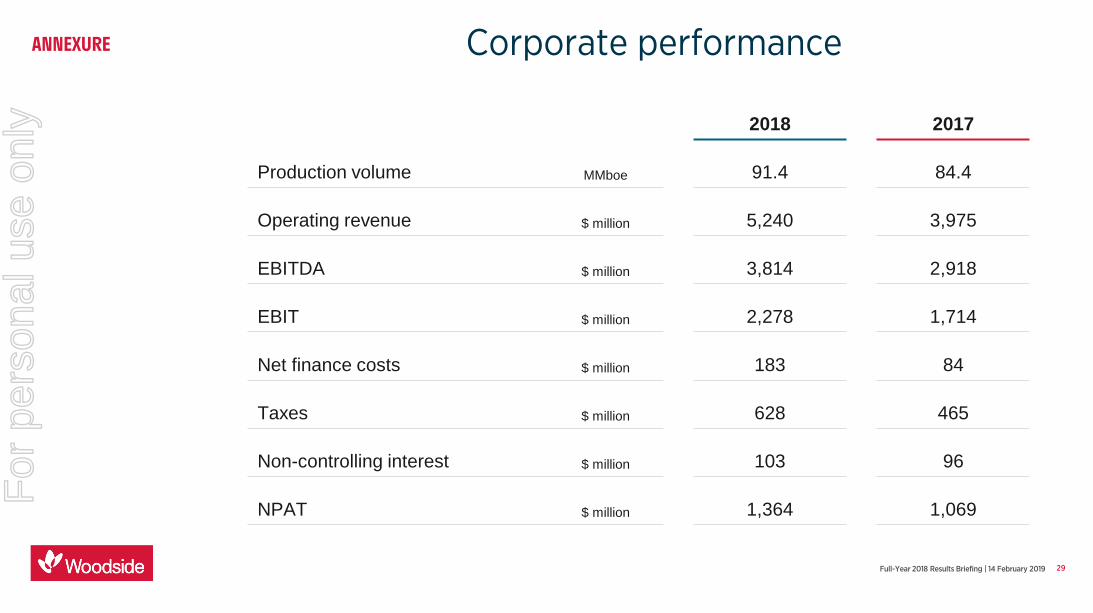
Corporate performanceANNEXURE
29Full-Year 2018 Results Briefing | 14 February 2019
2018 2017
Production volume MMboe 91.4 84.4
Operating revenue $ million 5,240 3,975
EBITDA $ million 3,814 2,918
EBIT $ million 2,278 1,714
Net finance costs $ million 183 84
Taxes $ million 628 465
Non-controlling interest $ million 103 96
NPAT $ million 1,364 1,069For
per
sona
l use
onl
y

Segment performanceANNEXURE
30Full-Year 2018 Results Briefing | 14 February 2019
NWS Pluto Aus Oil Wheatstone
Production volume MMboe 34.0 43.3 3.8 9.1
Operating revenue $ million 1,497 2,783 301 515
EBITDA $ million 1,111 2,403 171 426
EBIT $ million 800 1,532 117 192
Cash margin % 74 88 58 82
Gross margin % 55 56 36 35
For
per
sona
l use
onl
y

Woodside Petroleum Ltd11 Mount StreetPerth, WA 6000
GPO Box D188Perth, WA 6840 Australia
T: +61 8 9348 4000F: +61 8 9214 2777E: [email protected]
woodside.com.au
For
per
sona
l use
onl
y